electricity, gas and water supply industry, · pdf filestatistics south africa electricity,...
TRANSCRIPT

Electricity, gas and water supply industry, 2013
Statistics South Africa
Pali Lehohla Statistician-General Report No. 41-01-02 (2013)

Statistics South Africa
Electricity, gas and water supply industry, Report No. 41-01-02 (2013)
ii
Electricity, gas and water supply, 2013 / Statistics South Africa Published by Statistics South Africa, Private Bag X44, Pretoria 0001
© Statistics South Africa, 2015 Users may apply or process this data, provided Statistics South Africa (Stats SA) is acknowledged as the original source of the data; that it is specified that the application and/or analysis is the result of the user's independent processing of the data; and that neither the basic data nor any reprocessed version or application thereof may be sold or offered for sale in any form whatsoever without prior permission from Stats SA. Stats SA Library Cataloguing-in-Publication (CIP) Data Electricity, gas and water supply, 2013/ Statistics South Africa. Pretoria: Statistics South Africa, 2015 Report No. 41-01-02 (2013) 30 pp ISBN: 978-0-621-43952-6 A complete set of Stats SA publications is available at Stats SA Library and the following libraries:
National Library of South Africa, Pretoria Division National Library of South Africa, Cape Town Division Library of Parliament, Cape Town Bloemfontein Public Library Natal Society Library, Pietermaritzburg Johannesburg Public Library Eastern Cape Library Services, King William’s Town Central Regional Library, Polokwane Central Reference Library, Mbombela Central Reference Collection, Kimberley Central Reference Library, Mmabatho
This report is available on the Stats SA website: www.statssa.gov.za Copies are obtainable from: Printing and Distribution, Statistics South Africa
Tel: (012) 310 8093 (012) 310 8251 (012) 310 8358 (012) 310 8161 Fax: (012) 321 7381 Email: [email protected]

Statistics South Africa
Electricity, gas and water supply industry, Report No. 41-01-02 (2013)
iii
Table of contents 1. Introduction ................................................................................................................................................................................................................................................ 1
1.1 Scope and coverage .................................................................................................................................................................................................................................... 1 1.2 Data items .................................................................................................................................................................................................................................................... 1 1.3 Reference period.......................................................................................................................................................................................................................................... 2 1.4 Current prices ............................................................................................................................................................................................................................................... 2 1.5 Reliability of data .......................................................................................................................................................................................................................................... 2 1.6 Confidentiality ............................................................................................................................................................................................................................................... 2 1.7 Reporting unit ............................................................................................................................................................................................................................................... 2
2. Summary of findings for the year 2013 ................................................................................................................................................................................................... 3
Figure 1 – Income by type of service in the electricity, gas and water supply industry, 2013 ............................................................................................................................... 3 Figure 2 – Composition of expenditure in the electricity, gas and water supply industry, 2013 ............................................................................................................................ 3 Figure 3 – Employment by type of service in the electricity, gas and water supply industry, 2013 ...................................................................................................................... 4 Figure 4 – Gender ratios in the electricity, gas and water supply industry, 2013 .................................................................................................................................................. 4 Figure 5 – Electricity generated in the electricity, gas and water supply industry, 2013. ...................................................................................................................................... 5 Figure 6 – Sales of gas by customer type in the electricity, gas and water supply industry, 2013 ....................................................................................................................... 5 Figure 7 – Sales of water by customer type in the electricity, gas and water supply industry, 2010 and 2013 .................................................................................................... 6
Tables .................................................................................................................................................................................................................................................................. 7
Table 1 – Principal statistics in the electricity, gas and water supply industry, 2010 and 2013 ............................................................................................................................ 7 Table 2 – Principal statistics in the electricity, gas and water supply industry, 2013 ............................................................................................................................................ 8 Table 3 – Income in the electricity, gas and water supply industry, 2010 and 2013 ............................................................................................................................................. 8 Table 4 – Income in the electricity, gas and water supply industry, 2013 ............................................................................................................................................................. 9 Table 5 – Expenditure in the electricity, gas and water supply industry, 2010 and 2013...................................................................................................................................... 9 Table 6 – Expenditure in the electricity, gas and water supply industry, 2013 .................................................................................................................................................... 10 Table 7 – Employment in the electricity, gas and water supply industry as at the end of June 2010 and 2013 ................................................................................................. 11 Table 8 – Employment by type of service in the electricity, gas and water supply industry as at the end of June 2010 and 2013 .................................................................... 12 Table 9 – Employment by type of service in the electricity, gas and water supply industry as at the end of June 2013 .................................................................................... 12 Table 10 – Electricity available for sale locally in the electricity, gas and water supply industry, 2010 and 2013 .............................................................................................. 13 Table 11 – Sales of electricity in the electricity, gas and water supply industry, 2010 and 2013 ........................................................................................................................ 14 Table 12 – Purchases of inputs for electricity generation in the electricity, gas and water supply industry, 2010 and 2013.............................................................................. 15 Table 13 – Sales of gas in the electricity, gas and water supply industry, 2010 and 2013 ................................................................................................................................. 15 Table 14 – Sales of gas by customer type in the electricity, gas and water supply industry, 2010 and 2013 .................................................................................................... 16 Table 15 – Purchases of gas in the electricity, gas and water supply industry, 2010 and 2013 ......................................................................................................................... 16 Table 16 – Sales of water by customer type in the electricity, gas and water supply industry, 2010 and 2013 ................................................................................................. 17
Statistics South Africa
Electricity, gas and water supply industry, Report No. 41-01-02 (2013)
iv
Table 17 – Purchases of inputs for water distribution in the electricity, gas and water supply industry, 2013.................................................................................................... 18 Table 18 – Key statistics by province in the electricity, gas and water supply industry, 2013 ............................................................................................................................ 19 Table 19 – Information and communication technology (ICT) usage in the electricity, gas and water supply industry, 2010 and 2013 ............................................................ 20 Table 20 – Information and communication technology usage in the electricity, gas and water supply industry, 2013 ..................................................................................... 21
Explanatory notes .............................................................................................................................................................................................................................................. 22
Table 21 – Size groups for the electricity, gas and water supply industry .......................................................................................................................................................... 22
Glossary .............................................................................................................................................................................................................................................................. 24
General information ........................................................................................................................................................................................................................................... 26
Statistics South Africa
Electricity, gas and water supply industry, Report No. 41-01-02 (2013)
1
1. Introduction
This publication presents estimates in respect of the 2013 electricity, gas and water supply large sample survey (LSS). The reporting period was the financial year ended on any date between 1 July 2012 and 30 June 2013. The data for the number of employees were provided for the last pay period ended on or before 30 June 2013. The last electricity, gas and water supply LSS was conducted in 2010 (Report No. 41-01-02 (2010)).
1.1 Scope and coverage
The 2013 electricity, gas and water supply LSS covers enterprises registered for value-added tax (VAT) that are mainly engaged in the following activities classified according to the January 1993 edition of the Standard Industrial Classification of all Economic Activities (SIC), Fifth edition, Report No. 09-09-02:
o Generation, transmission and distribution of electricity (SIC 4111).
Generation (SIC 41111).
Distribution of purchased electric energy only (SIC 41112).
Generation and/ or distribution for own use (SIC 41113). o Manufacturing and distribution of gaseous fuels through mains (SIC 41200). o Steam and hot water supply (SIC 41300) [not included in the report due to non-response]. o Collection, purification and distribution of water (SIC 42000).
The following activities are excluded:
o Enterprises which generate electricity as a secondary activity or for own use (e.g. manufacturing companies). o Municipalities (included in SIC 91300). o Enterprises which manufacture and distribute liquefied petroleum gas (LPG) (included in SIC 33210, SIC 61410, SIC 62399 and SIC 63500). o Enterprises which are engaged in sanitation and other waste water treatment (included in SIC 94000). o Enterprises which are involved in the collection, purification and distribution of water as a secondary activity or for own use.
1.2 Data items
The following categories of data items were collected: industrial classification, information and communication technology (ICT), details of employment, trading income, expenditure, profit or loss, details of services rendered, details of sales of goods and purchases.

Statistics South Africa
Electricity, gas and water supply industry, Report No. 41-01-02 (2013)
2
1.3 Reference period
The questionnaires were completed for the financial year of the enterprise which ended on any date between 1 July 2012 and 30 June 2013, according to the usual reporting schedule of the enterprise. Example
o 1 October 2011 – 30 September 2012 o 1 January 2012 – 31 December 2012 o 1 February 2012 – 31 January 2013 o 1 March 2012 – 28 February 2013 o 1 April 2012 – 31 March 2013
1.4 Current prices
The rand values are at current prices.
1.5 Reliability of data
All estimates compiled for this industry are subject only to non-sampling errors because a census of the industry was conducted. The following are some of the likely sources of non-sampling errors: sampling frame not up to date, wrong definitions and classification, phrasing of questions, non-response, processing and estimation. Every effort is made to minimise non-sampling errors by the careful design of questionnaires, testing them in pilot studies, editing reported data and implementing efficient operating procedures. Non-sampling errors occur in both sample surveys and censuses.
1.6 Confidentiality
According to section 17 of the Statistics Act, 1999 (Act No. 6 of 1999), completed questionnaires remain confidential to Statistics South Africa (Stats SA). Individual business information is never disclosed. Results are presented in aggregated form only.
1.7 Reporting unit
The statistical unit for the collection of information is an enterprise. An enterprise is a legal unit (or a combination of legal units) that includes and directly controls all functions necessary to carry out its activities. Each industry is classified to an industry that reflects its predominant activity.

Statistics South Africa
Electricity, gas and water supply industry, Report No. 41-01-02 (2013)
3
2. Summary of findings for the year 2013
Figure 1 – Income by type of service in the electricity, gas and water supply industry, 2013
Figure 2 – Composition of expenditure in the electricity, gas and water supply industry, 2013
The total income for the electricity, gas and water supply industry in 2013 was R181 214 million. The largest contributor to the total income was ‘generation, transmission and distribution of electricity’ (R150 019 million or 82,8%), followed by ‘collection, purification and distribution of water’ (R22 052 million or 12,2%) and ‘manufacturing and distribution of gaseous fuels through mains’ (R9 143 million or 5,0%) (see Figure 1 and Table 1, page 7). The total income represents an increase of 19,1% per annum over the income reported in the corresponding survey of 2010 (R107 188 million).
Expenditure in the electricity, gas and water supply industry amounted to R168 773 million in 2013. The largest contributor to the total expenditure was ‘purchases’ (R77 572 million or 46,0%), followed by ‘salaries and wages’ (R22 092 million or 13,1%) (see Figure 2 and Table 5, page 9). The expenditure represents an increase of 19,4% per annum over the expenditure reported in the corresponding survey of 2010 (R99 093 million).
Revisions: revisions were made to 2010 results due to new information obtained after the publication.

Statistics South Africa
Electricity, gas and water supply industry, Report No. 41-01-02 (2013)
4
Figure 3 – Employment by type of service in the electricity, gas and water supply industry, 2013
Figure 4 – Gender ratios in the electricity, gas and water supply industry, 2013
The total number of persons employed in the electricity, gas and water supply industry at the end of June 2013 was 57 573. ‘Generation, transmission and distribution of electricity’ employed the largest number of persons (45 205 or 78,5%), followed by ‘collection, purification and distribution of water’ (11 936 or 20,7%) and ‘manufacturing and distribution of gaseous fuels through mains’ (432 or 0,8%) (see Figure 3 and Table 8, page 12). Employment in the electricity, gas and water supply industry increased by 4,0% per annum compared with the number of employees reported in the corresponding survey of 2010 (51 237).
The proportion of females out of the total persons employed was 30,4%. The sector with the highest proportion of females employed was ‘generation, transmission and distribution of electricity’ (31,7%), whilst ‘manufacturing and distribution of gaseous fuels through mains’ had the highest proportion of males employed (79,4%) (see Figure 4 and Table 9, page 12).

Statistics South Africa
Electricity, gas and water supply industry, Report No. 41-01-02 (2013)
5
Figure 5 – Electricity generated in the electricity, gas and water supply industry, 2013.
Figure 6 – Sales of gas by customer type in the electricity, gas and water
supply industry, 2013
Total electricity generated in the electricity, gas and water supply industry in 2013 was 236 760 gigawatt-hours (GWh). The largest source of electricity generation was ‘coal’ (215 154 GWh or 90,9%), followed by ‘nuclear’ (11 954 GWh or 5,0%) (see Figure 5 and Table 10, page 13). The total electricity generated decreased by 0,4% per annum compared with the corresponding survey of 2010 (239 474 GWh).
The total quantity of gas distributed in the electricity, gas and water supply industry in 2013 was 170 188 083 gigajoules (GJ). The largest quantity of gas was supplied to ‘industrial users’ (110 162 675 GJ or 64,7%), followed by ‘commercial users’ (49 649 902 GJ or 29,2%) and ‘redistributors’ (10 167 539 GJ or 6,0%) (see Figure 6 and Table 14, page 16). The total quantity of gas distributed represents an increase of 8,8% per annum over the total quantity of gas distributed as reported in the corresponding survey of 2010 (132 036 203 GJ).

Statistics South Africa
Electricity, gas and water supply industry, Report No. 41-01-02 (2013)
6
Figure 7 – Sales of water by customer type in the electricity, gas and water supply industry, 2010 and 2013
The total income received from sales of water in the electricity, gas and water supply industry in 2013 was R17 650 million. The largest income from sales of water was from ‘redistributors (mainly municipalities)’ (R11 285 million or 63,9%), followed by ‘households’ (R2 956 million 16,7%) and ‘commercial users’ (R1 410 million or 8,0%) (see Figure 7 and Table 16, page 17). The total income received from sales of water represents an increase of 11,4% per annum over the sales in the corresponding survey of 2010 (R12 768 million).
PJ Lehohla
Statistician-General

Statistics South Africa
Electricity, gas and water supply industry, Report No. 41-01-02 (2013)
7
Tables
Table 1 – Principal statistics in the electricity, gas and water supply industry, 2010 and 2013
Type of service
Total income
Total value of opening inventory
Total value of closing inventory
2010 2013 Annualised % change
2010 2013 Annualised % change
2010 2013 Annualised % change R million R million R million
Generation, transmission and distribution of electricity
86 332 150 019 20,2 6 619 10 025 14,8 7 471 12 211 17,8
Manufacturing and distribution of gaseous fuels through mains
6 009 9 143 15,0 104 63 -15,4 48 68 12,3
Collection, purification and distribution of water
14 847 22 052 14,1 130 291 30,8 137 362 38,2
Total 107 188 181 214 19,1 6 853 10 379 14,8 7 656 12 641 18,2
Table 1 – Principal statistics in the electricity, gas and water supply industry, 2010 and 2013 (concluded)
Type of service
Total expenditure
Net profit before tax
Total employees
2010 2013 Annualised % change
2010 2013 Annualised % change
2010 2013 Annualised % change R million R million Number
Generation, transmission and distribution of electricity
81 495 143 339 20,7 5 688 8 866 15,9 39 756 45 205 4,4
Manufacturing and distribution of gaseous fuels through mains
4 081 6 181 14,8 1 873 2 967 16,6 415 432 1,3
Collection, purification and distribution of water
13 517 19 253 12,5 1 338 2 870 29,0 11 066 11 936 2,6
Total 99 093 168 773 19,4 8 898 14 703 18,2 51 237 57 573 4,0
*Revisions: Revisions were made to 2010 results due to new information obtained after the publication.

Statistics South Africa
Electricity, gas and water supply industry, Report No. 41-01-02 (2013)
8
Table 2 – Principal statistics in the electricity, gas and water supply industry, 2013
Type of service
Total income
Total value of opening
inventory
Total value of closing
inventory
Total expenditure
Net profit before tax
Total employees
R million Number
Generation, transmission and distribution of electricity
150 019 10 025 12 211 143 339 8 866 45 205
Manufacturing and distribution of gaseous fuels through mains
9 143 63 68 6 181 2 967 432
Collection, purification and distribution of water
22 052 291 362 19 253 2 870 11 936
Total 181 214 10 379 12 641 168 773 14 703 57 573
Table 3 – Income in the electricity, gas and water supply industry, 2010 and 2013
Income item 2010 2013
Annualised % change R million
Sales and services 99 314 173 327 20,4
Other income 7 874 7 887 0,1
Total income 107 188 181 214 19,1

Statistics South Africa
Electricity, gas and water supply industry, Report No. 41-01-02 (2013)
9
Table 4 – Income in the electricity, gas and water supply industry, 2013
Type of service Sales and services Other income Total income
R million
Generation, transmission and distribution of electricity 143 356 6 663 150 019
Manufacturing and distribution of gaseous fuels through mains 9 006 137 9 143
Collection, purification and distribution of water 20 965 1 087 22 052
Total 173 327 7 887 181 214
Table 5 – Expenditure in the electricity, gas and water supply industry, 2010 and 2013
Expenditure item 2010 2013
Annualised % change R million
Purchases 43 640 77 572 21,1
Salaries and wages 17 404 22 092 8,3
Repair and maintenance 6 226 11 664 23,3
Other expenditure 31 823 57 445 21,8
Total expenditure 99 093 168 773 19,4

Statistics South Africa
Electricity, gas and water supply industry, Report No. 41-01-02 (2013)
10
Table 6 – Expenditure in the electricity, gas and water supply industry, 2013
Type of service Purchases Salaries and wages
Repair and maintenance
Excise and custom duty
Subcontractors
R million
Generation, transmission and distribution of electricity
63 312 18 577 11 137 8 052 5 031
Manufacturing and distribution of gaseous fuels through mains
5 242 244 70 1 0
Collection, purification and distribution of water 9 018 3 271 457 0 578
Total 77 572 22 092 11 664 8 053 5 609
Table 6 – Expenditure in the electricity, gas and water supply industry, 2013 (concluded)
Type of service
Motor vehicle running expenditure
Railage and transport-out
Telecommunication services
Other expenditure
Total expenditure
R million
Generation, transmission and distribution of electricity
750 184 391 35 905 143 339
Manufacturing and distribution of gaseous fuels through mains
4 0 5 615 6 181
Collection, purification and distribution of water 69 72 31 5 757 19 253
Total 823 256 427 42 277 168 773

Statistics South Africa
Electricity, gas and water supply industry, Report No. 41-01-02 (2013)
11
Table 7 – Employment in the electricity, gas and water supply industry as at the end of June 2010 and 2013
Item 2010 2013 Annualised change
Number %
Permanent
Female 14 524 16 872 5,1
Male 35 505 38 459 2,7
Total 50 029 55 331 3,4
Temporary
Female 460 530 4,8
Male 602 1 050 20,4
Total 1 062 1 580 14,2
Casual
Female 48 82 19,5
Male 98 580 80,9
Total 146 662 65,5
Total
Female 15 032 17 484 5,2
Male 36 205 40 089 3,5
Total 51 237 57 573 4,0

Statistics South Africa
Electricity, gas and water supply industry, Report No. 41-01-02 (2013)
12
Table 8 – Employment by type of service in the electricity, gas and water supply industry as at the end of June 2010 and 2013
Type of service Number of employees % contribution to total employees
Annualised % change 2010 2013 2010 2013
Generation, transmission and distribution of electricity
39 756 45 205 77,6 78,5 4,4
Manufacturing and distribution of gaseous fuels through mains
415 432 0,8 0,8 1,3
Collection, purification and distribution of water
11 066 11 936 21,6 20,7 2,6
Total 51 237 57 573 100,0 100,0 4,0
Table 9 – Employment by type of service in the electricity, gas and water supply industry as at the end of June 2013
Type of service
Permanent employees Temporary employees Casual employees
Total employees
Employees from
labour brokers Female Male Total Female Male Total Female Male Total
Number of employees
Generation, transmission and distribution of electricity
14 252 30 833 45 085 57 61 118 0 2 2 45 205 607
Manufacturing and distribution of gaseous fuels through mains
89 343 432 0 0 0 0 0 0 432 0
Collection, purification and distribution of water
2 531 7 283 9 814 473 989 1 462 82 578 660 11 936 175
Total 16 872 38 459 55 331 530 1 050 1 580 82 580 662 57 573 782

Statistics South Africa
Electricity, gas and water supply industry, Report No. 41-01-02 (2013)
13
Table 10 – Electricity available for sale locally in the electricity, gas and water supply industry, 2010 and 2013
Source of electricity
2010 2013
Annualised % change
Gigawatt-hours (GWh)
Coal 216 285 215 154 -0,2
Nuclear 12 807 11 954 -2,3
Diesel and natural gas 6 360 5 554 -4,4
Hydro electricity 1 274 1 077 -5,4
Wind 6 15 35,7
Pump storage 2 742 3 006 3,1
Total electricity generated 239 474 236 760 -0,4
Purchased from other South African entities 48 3 568 320,5
Imported electricity 10 048 10 645 1,9
Consumed in power stations and pump storage stations (3 789) (4 255) 3,9
Exported (13 228) (13 791) 1,4
Total electricity available for distribution 232 553 232 927 0,1

Statistics South Africa
Electricity, gas and water supply industry, Report No. 41-01-02 (2013)
14
Table 11 – Sales of electricity in the electricity, gas and water supply industry, 2010 and 2013
Type of customer1
2010 2013 Annualised % change
R million
Redistributors2 (mainly municipalities) 28 328 51 306 21,9
Residential 9 650 16 285 19,1
Commercial 8 458 13 779 17,7
Industrial 15 109 23 610 16,0
Mining 9 600 17 620 22,4
Agricultural 3 377 5 181 15,3
Rail transport 1 091 2 057 23,5
International (exported) 2 972 5 892 25,6
Total sales of electricity 78 585 135 730 20,0
1Eskom’s classification was used for the categories of customers.
2Electricity redistributors are enterprises that buy electricity from generators for re-sale and they are mainly municipalities.

Statistics South Africa
Electricity, gas and water supply industry, Report No. 41-01-02 (2013)
15
Table 12 – Purchases of inputs for electricity generation in the electricity, gas and water supply industry, 2010 and 2013
Input Unit 2010 2013
Annualised % change
2010 2013 Annualised % change
Quantity R million
Water Thousand m3 317 136 335 302 1,9 1 085 1 681 15,7
Coal Metric ton 122 951 867 154 143 607 7,8 20 949 35 657 19,4
Other inputs3 681 7 989 127,2
Other purchases4 12 019 17 985 14,4
Total purchases 34 734 63 312 22,2
3Other inputs include nuclear material, natural gas and liquid petroleum fuel products.
4Other purchases include chemicals, environmental levy and electricity purchases.
Table 13 – Sales of gas in the electricity, gas and water supply industry, 2010 and 2013
Type of gas5
2010 2013 Annualised % change
2010 2013 Annualised % change
Gigajoules R million
Natural gas 69 112 366 140 586 831 26,7 3 485 7 057 26,5
Methane-rich gas 28 106 002 28 632 386 0,6 1 165 1 879 17,3
Synthetic gas 34 817 835 968 866 -69,7 1 220 70 -61,4
Total sales of gas 132 036 203 170 188 083 8,8 5 870 9 006 15,3
5Gas refers to gaseous fuels distributed through mains or pipeline network and includes natural gas, methane-rich gas and synthetic gas.

Statistics South Africa
Electricity, gas and water supply industry, Report No. 41-01-02 (2013)
16
Table 14 – Sales of gas by customer type in the electricity, gas and water supply industry, 2010 and 2013
Type of customer 2010 2013
Annualised % change
2010 2013 Annualised % change
Gigajoules R million
Redistributors6 7 970 340 10 167 539 8,5 355 594 18,7
Households 169 043 207 967 7,2 20 26 9,1
Commercial users and farmers 51 209 137 49 649 902 -1,0 2 531 3 706 13,6
Industrial users 72 687 683 110 162 675 14,9 2 964 4 680 16,4
Total income from sales of gas 132 036 203 170 188 083 8,8 5 870 9 006 15,3
6Gas redistributors are enterprises that buy gas from gas producers for re-sale.
Table 15 – Purchases of gas in the electricity, gas and water supply industry, 2010 and 2013
Type of gas 2010 2013
Annualised % change
2010 2013 Annualised % change
Gigajoules R million
Natural gas 3 231 822 3 364 717 1,4 198 231 5,3
Methane-rich gas 29 029 978 29 277 619 0,3 728 1 724 33,3
Synthetic gas 28 199 942 973 051 -67,4 534 34 -60,1
Total 60 461 742 33 615 387 -17,8 1 460 1 989 10,9
Natural gas (imported) 79 180 848 137 933 986 20,3 2 031 3 253 17,0
Total purchases 139 642 590 171 549 373 7,1 3 491 5 242 14,5

Statistics South Africa
Electricity, gas and water supply industry, Report No. 41-01-02 (2013)
17
Table 16 – Sales of water by customer type in the electricity, gas and water supply industry, 2010 and 2013
Type of customer 2010 2013 Annualised
% change R million
Redistributors7 (mainly municipalities) 7 179 11 285 16,3
Households 2 973 2 956 -0,2
Commercial users 1 340 1 410 1,7
Industry 466 513 3,3
Mining 596 1 037 20,3
Agricultural users (farmers) 214 449 28,0
Total water distributed 12 768 17 650 11,4
7Water redistributors are water service providers, water boards which buy water from other water boards for redistribution when they cannot meet their own demand, and
companies contracted by municipalities to supply water on their behalf.

Statistics South Africa
Electricity, gas and water supply industry, Report No. 41-01-02 (2013)
18
Table 17 – Purchases of inputs for water distribution in the electricity, gas and water supply industry, 2013
Type of purchase 2013
R million
Fuel 80
Bulk/ raw water 7 667
Water treatment chemicals 394
Parts and spares 124
Other purchases 753
Total purchases 9 018

Statistics South Africa
Electricity, gas and water supply industry, Report No. 41-01-02 (2013)
19
Table 18 – Key statistics by province in the electricity, gas and water supply industry, 2013
Province Sales and services Salaries and wages Employees
R million Number
Western Cape 14 526 1 753 5 070
Eastern Cape 6 080 774 3 210
Northern Cape 4 098 262 1 427
Free State 7 816 1 103 3 698
Kwazulu-Natal 22 751 1 608 4 972
North West 11 771 462 1 943
Gauteng 79 143 9 510 21 627
Mpumalanga 15 532 5 349 11 911
Limpopo 11 610 1 271 3 715
Total 173 327 22 092 57 573

Statistics South Africa
Electricity, gas and water supply industry, Report No. 41-01-02 (2013)
20
Table 19 – Information and communication technology (ICT) usage in the electricity, gas and water supply industry, 2010 and 2013
ICT usage 2010 2013
%
Use computer 91,6 95,5
Use internet 70,5 95,5
Use internet banking 61,1 70,5
Have web page 30,5 39,8
Receive orders over the internet 2,1 6,8
Place orders over the internet 6,3 9,1
IT outsourced 24,2 34,1
Main uses of the internet
Email 66,3 95,5
Information services 33,7 53,4
Business promotions (Advertising) 8,4 10,2
E-commerce 12,6 6,8
Other 14,7 10,2
Main activity of the web
Advertising own business 18,9 31,8
Selling goods and services 1,1 5,7
Other 17,9 22,7
Internet connection speed
Narrow band 8,4 3,4
Broad band 66,3 92,0
No internet 25,3 4,5

Statistics South Africa
Electricity, gas and water supply industry, Report No. 41-01-02 (2013)
21
Table 20 – Information and communication technology usage in the electricity, gas and water supply industry, 2013
Type of service Use computer Use internet
Use internet banking
Have web page Receive orders
over the internet
Place orders over the internet
IT outsourced
%
Generation, transmission and distribution of electricity
100,0 100,0 78,6 64,3 14,3 21,4 42,9
Manufacturing and distribution of gaseous fuels through mains
100,0 100,0 100,0 100,0 0,0 0,0 66,7
Collection, purification and distribution of water
94,4 94,4 67,6 32,4 5,6 7,0 31,0
Total 95,5 95,5 70,5 39,8 6,8 9,1 34,1
Table 20 – Information and communication technology usage in the electricity, gas and water supply industry, 2013 (concluded)
Type of service
Main uses of the internet Main activity of web Internet connection speed
Email Information
services
Business promotions
(Advertising)
E-commerce
Other Advertising
own business
Selling goods and services
Other Narrow band
Broad band
No internet
%
Generation, transmission and distribution of electricity
100,0 78,6 21,4 28,6 14,3 42,9 14,3 42,9 0,0 100,0 0,0
Manufacturing and distribution of gaseous fuels through mains
100,0 100,0 33,3 0,0 33,3 100,0 33,3 33,3 0,0 100,0 0,0
Collection, purification and distribution of water
94,4 46,5 7,0 2,8 8,5 26,8 2,8 18,3 4,2 90,1 5,6
Total 95,5 53,4 10,2 6,8 10,2 31,8 5,7 22,7 3,4 92,0 4,5
Statistics South Africa
Electricity, gas and water supply industry, Report No. 41-01-02 (2013)
22
Explanatory notes
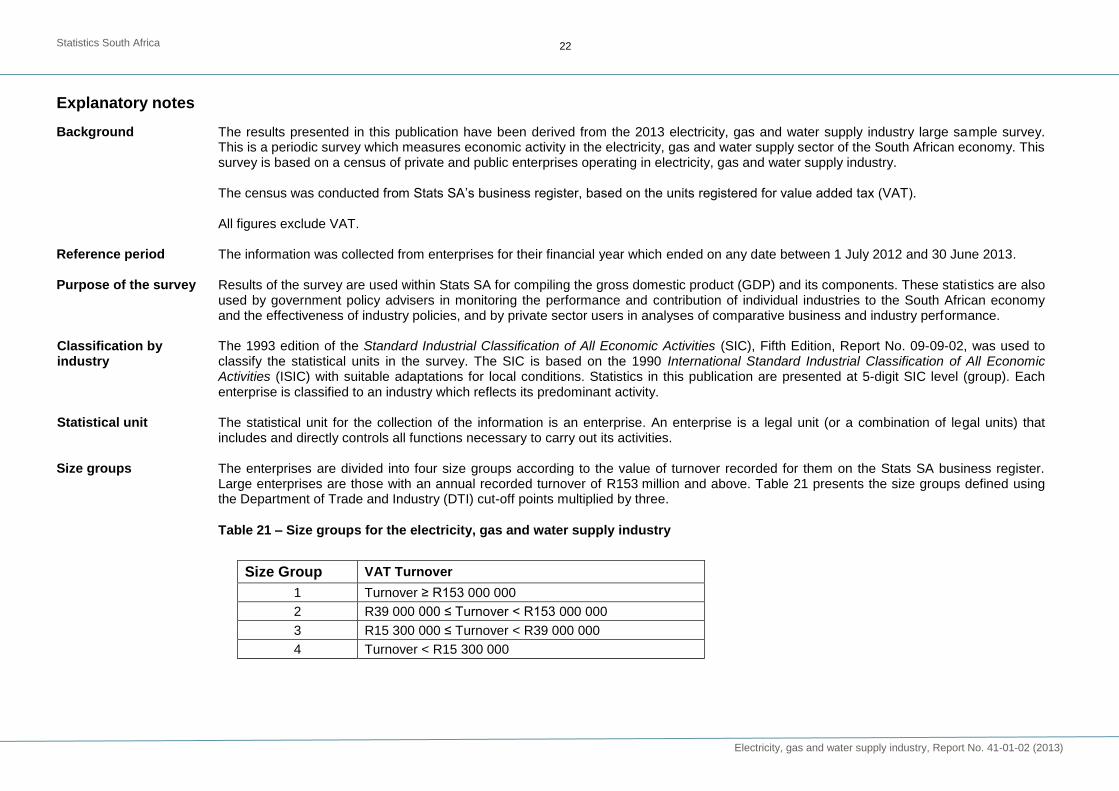
Background The results presented in this publication have been derived from the 2013 electricity, gas and water supply industry large sample survey. This is a periodic survey which measures economic activity in the electricity, gas and water supply sector of the South African economy. This survey is based on a census of private and public enterprises operating in electricity, gas and water supply industry. The census was conducted from Stats SA’s business register, based on the units registered for value added tax (VAT). All figures exclude VAT.
Reference period The information was collected from enterprises for their financial year which ended on any date between 1 July 2012 and 30 June 2013. Purpose of the survey Results of the survey are used within Stats SA for compiling the gross domestic product (GDP) and its components. These statistics are also
used by government policy advisers in monitoring the performance and contribution of individual industries to the South African economy and the effectiveness of industry policies, and by private sector users in analyses of comparative business and industry performance.
Classification by industry
The 1993 edition of the Standard Industrial Classification of All Economic Activities (SIC), Fifth Edition, Report No. 09-09-02, was used to classify the statistical units in the survey. The SIC is based on the 1990 International Standard Industrial Classification of All Economic Activities (ISIC) with suitable adaptations for local conditions. Statistics in this publication are presented at 5-digit SIC level (group). Each enterprise is classified to an industry which reflects its predominant activity.
Statistical unit The statistical unit for the collection of the information is an enterprise. An enterprise is a legal unit (or a combination of legal units) that
includes and directly controls all functions necessary to carry out its activities. Size groups The enterprises are divided into four size groups according to the value of turnover recorded for them on the Stats SA business register.
Large enterprises are those with an annual recorded turnover of R153 million and above. Table 21 presents the size groups defined using the Department of Trade and Industry (DTI) cut-off points multiplied by three.
Table 21 – Size groups for the electricity, gas and water supply industry
Size Group VAT Turnover
1 Turnover ≥ R153 000 000
2 R39 000 000 ≤ Turnover < R153 000 000
3 R15 300 000 ≤ Turnover < R39 000 000
4 Turnover < R15 300 000

Statistics South Africa
Electricity, gas and water supply industry, Report No. 41-01-02 (2013)
23
Survey methodology and design
The census of enterprises in electricity, gas and water supply industry was conducted by post, email, fax, telephone and personal visits. A census was conducted from a frame of approximately 600 enterprises. The enterprises were first stratified at 5-digit level according to the SIC and then by size of enterprise. Business register turnover was used as the measure of size for stratification.
Collection rate The collection rate was 90,2%. Collection rate = ((collected units + finalised investigations) / sample size) x 100 Weighting methodology All the enterprises were each assigned a weight of one because a census of the industry was conducted. Revisions to 2010 results
Revisions were made to 2010 results due to new information obtained after the publication.
Non-sampling errors Inaccuracies may occur because of imperfections in reporting by enterprises and errors made in the collection and processing of the data.
Inaccuracies of this kind are referred to as non-sampling errors. Every effort is made to minimise non-sampling errors by careful design of questionnaires, testing them in pilot studies, editing reported data and implementing efficient operating procedures. Non-sampling errors occur in both sample surveys and censuses.
Rounding-off of figures The figures in the tables have, where necessary, been rounded off to the nearest final digit shown. There may therefore be slight
discrepancies between the sums of the constituent items and the totals shown.
Symbols and abbreviations
DTI Department of Trade and Industry
GDP Gross domestic product
ISIC International Standard Industrial Classification of All Economic Activities
IT Income tax
RSE Relative standard error
SARS South African Revenue Service
SE Standard error
SIC Standard Industrial Classification of all Economic Activities
SNA System of National Accounts
Stats SA Statistics South Africa
VAT Value added tax
0 Nil or less than half the final digit shown

Statistics South Africa
Electricity, gas and water supply industry, Report No. 41-01-02 (2013)
24
Glossary
Casual employees Casual employees are employees who fall neither within the ‘permanent employees’ category nor the ‘temporary employees’ category. Such employees are typically working daily or hourly.
Commercial customers (users)
Include wholesale trade, retail trade, motor trade, repair of motor vehicles, motor cycles, personal and household goods, hotels and restaurants, transport, storage and communication and financial intermediation, insurance, real estate and business services.
Employees Employees are those people employed by the business or organisation who received payment (in salaries, wages, commission,
piece rates or payments in kind) for the last pay period ended on or before 30 June 2013. Gas Gas is gaseous fuels distributed through mains or pipeline network and includes natural gas, methane-rich gas and synthetic gas. Industrial customers (users)
Industrial customers or users are business enterprises which are involved in the manufacturing or production of goods as a predominant activity.
Other expenditure Other expenditure includes:
o accommodation; o advertising; o amortisation; o bank; o bursaries; o computers; o containers and packaging materials; o donations; o entertainment; o excise and customs duty; o insurance; o leasing and hiring of plant, machinery, equipment; o losses on liabilities; o losses on foreign exchange; o mineral rights leases; o motor vehicle running expenditure; o paper, printing and stationery; o railage and transport-out;
o road tolls; o subcontractors; o security services; o postal and courier services; o property tax; o provisions; o rental of land, buildings and other structures; o research and development; o royalties; o severance, termination and redundancy payments; o skills development levy; o staff training (payment to outside organisations); o subcontracting expenses; o subscriptions; o telecommunication services; o travelling; and o other.

Statistics South Africa
Electricity, gas and water supply industry, Report No. 41-01-02 (2013)
25
Other income Other income includes:
o profit for redemption, liquidation or revaluation of liabilities; o mineral rights; o provisions; o leasing income; o dividends; o subsidies; and o other.
Permanent employees Permanent employees are employees appointed on an open-ended contract with no stipulated termination date or a fixed-term
contract for periods of more than one year.
Statistical unit A statistical unit is a unit about which statistics are tabulated, compiled or published. The statistical units are derived from and linked to the South African Revenue Service (SARS) administrative data.
Stratum
A stratum is constructed by concatenating the SIC classification and size group variables.
Temporary employees Temporary employees are employees appointed on a short-term contract basis with a stipulated termination date for periods not
exceeding one year. Turnover Turnover includes:
o value of sales of goods; o amount received for services rendered;
Unit of electricity A gigawatt-hour (GWh) of electricity is equal to one million kilowatt-hours. A kilowatt-hour is the basic unit of electrical energy equal to
one kilowatt of power supplied to or taken from an electric circuit steadily for one hour. One kilowatt-hour equals one thousand watt-hours. A gigawatt-hour is also equal to one thousand megawatt hours.
Unit of gas A gigajoule (GJ) is the derived unit of energy in the International System of Units (SI) equal to one billion joules (10
9 J). A joule is the
basic unit of energy and it is the work done to produce one watt continuously for one second. Unit of water A cubic metre (m
3) is the SI derived unit of volume. It is the volume of a cube with edges of one metre in length. One cubic metre is
equal to exactly 1 000 litres. An alternative name, not widely used anymore, is the kilolitre. Water redistributors Water redistributors are water service providers including municipalities and water boards which buy water from other water boards
for redistribution when they cannot meet their own demand, and companies contracted by municipalities to supply water on their behalf.

Statistics South Africa
Electricity, gas and water supply industry, Report No. 41-01-02 (2013)
26
General information
Stats SA publishes approximately 300 different statistical releases each year. It is not economically viable to produce them in more than one of South Africa's eleven official languages. Since the releases are used extensively, not only locally but also by international economic and social-scientific communities, Stats SA releases are published in English only.
Stats SA has copyright on this publication. Users may apply the information as they wish, provided that they acknowledge Stats SA as the source of the basic data wherever they process, apply, utilise, publish or distribute the data; and also that they specify that the relevant application and analysis (where applicable) result from their own processing of the data.
Stats SA products
A complete set of Stats SA publications is available at the Stats SA Library and the following libraries: National Library of South Africa, Pretoria Division National Library of South Africa, Cape Town Division Natal Society Library, Pietermaritzburg Library of Parliament, Cape Town Bloemfontein Public Library Johannesburg Public Library Eastern Cape Library Services, King William’s Town Central Regional Library, Polokwane Central Reference Library, Mbombela Central Reference Collection, Kimberley Central Reference Library, Mmabatho Stats SA also provides a subscription service.
Electronic services
A large range of data are available via on-line services, diskette and computer printouts. You can visit us on the Internet at: www.statssa.gov.za Enquiries
Telephone number: (012) 310 8600/ 8390/ 8351/ 4892/ 8496/ 8095 (user information services) (012) 310 2971/310 8191 (technical enquiries) (012) 310 8161 (orders) (012) 310 4883/4885/8018 (library) Fax number: 086 528 9159/ (012) 310 2121 (technical enquiries) email address: [email protected]/ [email protected] (technical enquiries) [email protected] (user information services) [email protected] (orders) Postal address: Private Bag X44, Pretoria, 0001
Produced by Stats SA