the essential guide to aligned marketing...
TRANSCRIPT

The essential guide to aligned marketing measurement
2
Best practices for measuring results
When marketing, sales and product marketing are aligned around measurement, the organization can move from misleading reports and metrics to valuable ones that deliver accurate performance measures and insights. Read on to learn how to mea-sure the results of your efforts around lead nurturing through the SiriusDecisions Demand Waterfall®.
Today’s marketers face mounting pressure to prove the contribution of their activities and efforts. Unfortunately, most marketing reports confuse activity with impact, focusing on irrelevant metrics—such as blog comments and social media followers
—that ultimately undermine the value of marketing. This misguided reporting is further complicated by attempts to tie these marketing metrics to the metrics reported by other areas of the business, namely sales and product marketing.
The Aligned Measurement framework from SiriusDecisions allows you to cre-ate alignment around all three groups.
The aligned measurement framework
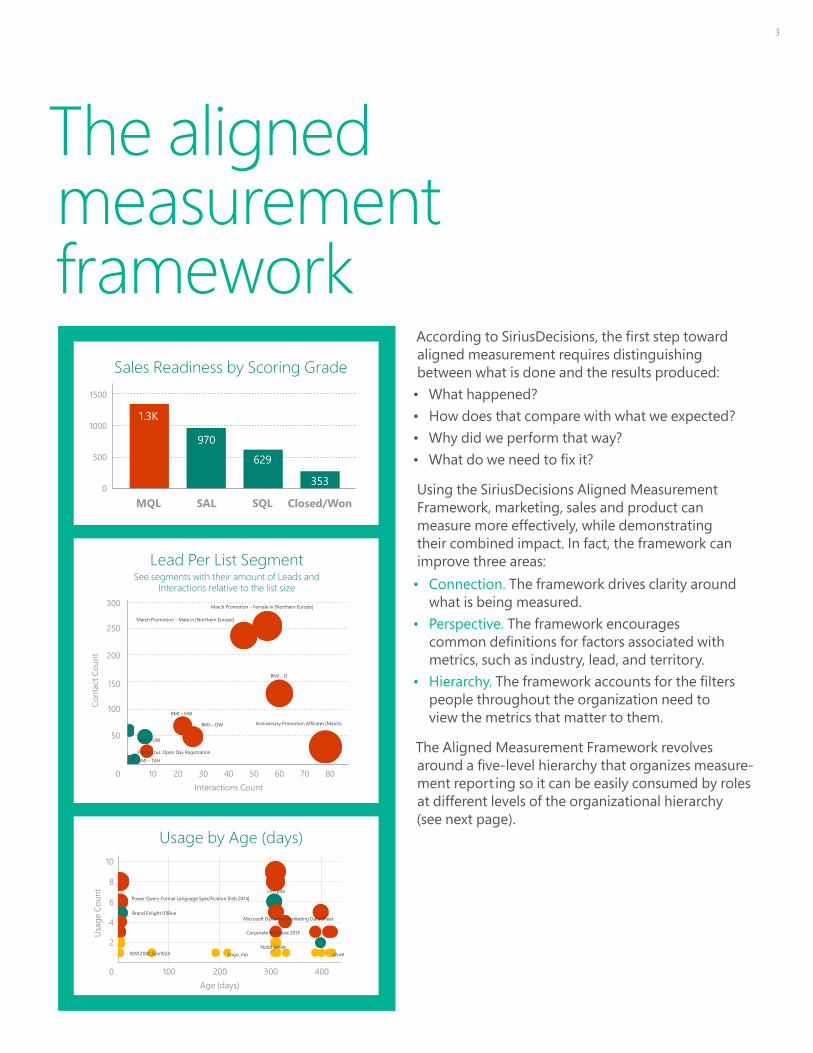
According to SiriusDecisions, the first step toward aligned measurement requires distinguishing between what is done and the results produced:
• What happened?• How does that compare with what we expected?• Why did we perform that way?• What do we need to fix it?
Using the SiriusDecisions Aligned Measurement Framework, marketing, sales and product can measure more effectively, while demonstrating their combined impact. In fact, the framework can improve three areas:
• Connection. The framework drives clarity around what is being measured.
• Perspective. The framework encourages common definitions for factors associated with metrics, such as industry, lead, and territory.
• Hierarchy. The framework accounts for the filters people throughout the organization need to view the metrics that matter to them.
The Aligned Measurement Framework revolves around a five-level hierarchy that organizes measure-ment report ing so it can be easily consumed by roles at different levels of the organizational hierarchy (see next page).
3
500
1000
1500
0
Sales Readiness by Scoring Grade
Closed/WonSQLSALMQL
629
970
1.3K
353
Usage by Age (days)
Power Query Formal Language Specification [Feb 2014]
Brand Enlight 01Blue
00912100_Size1024
crm pda
Microsoft Dynamics marketing Data Sheet
Corporate brochure 2013
Nolid tabletLogo_mp azure
2
0 100 400300200
4
6
8
10
Age (days)
Usa
ge C
ount
50
100
150
200
250
300
0 10 20 30 40Interactions Count
50 60 70 80
Lead Per List SegmentSee segments with their amount of Leads and
Interactions relative to the list size
March Promotion – Female in [Northern Europe]
March Promotion – Male in [Northern Europe]
BMI – O
BMI – HW
BMI – OW
BMI – T4H
Anniversary Promotion Affiliates (March)
Prospectus: Open Day Registration
BMI – UW
Cont
act C
ount
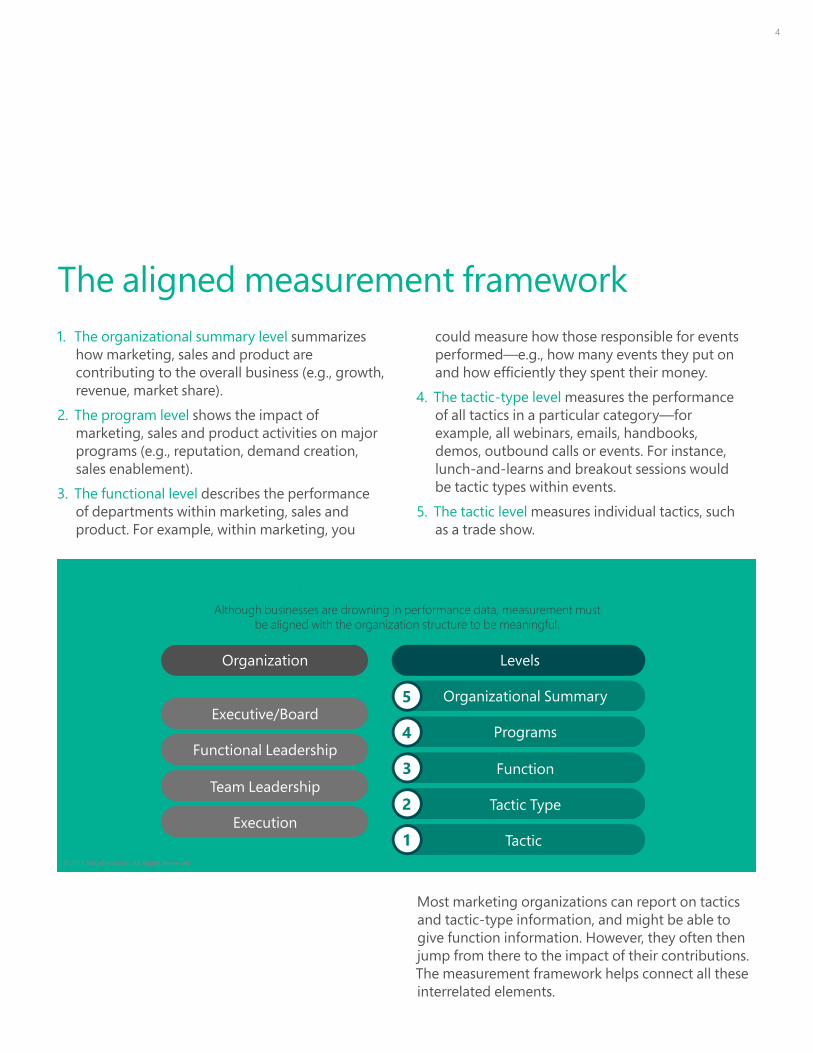
could measure how those responsible for events performed—e.g., how many events they put on and how efficiently they spent their money.
4. The tactic-type level measures the performance of all tactics in a particular category—for example, all webinars, emails, handbooks, demos, outbound calls or events. For instance, lunch-and-learns and breakout sessions would be tactic types within events.
5. The tactic level measures individual tactics, such as a trade show.
Most marketing organizations can report on tactics and tactic-type information, and might be able to give function information. However, they often then jump from there to the impact of their contributions. The measurement framework helps connect all these interrelated elements.
4
1. The organizational summary level summarizes how marketing, sales and product are contributing to the overall business (e.g., growth, revenue, market share).
2. The program level shows the impact of marketing, sales and product activities on major programs (e.g., reputation, demand creation, sales enablement).
3. The functional level describes the performance of departments within marketing, sales and product. For example, within marketing, you
The aligned measurement framework
Like Organizations, Measurement Requires HierarchyAlthough businesses are drowning in performance data, measurement must
be aligned with the organization structure to be meaningful.
Executive/Board
Functional Leadership
Team Leadership
Execution
Organizational Summary
Programs
Function
Tactic Type
Tactic
5
4
3
2
1
LevelsOrganization
© 2015 SiriusDecisions. All Rights Reserved

Which metrics matter?One of the biggest problems in measuring marketing’s contribution is to focus on activities or return on marketing investment (ROMI). Metrics help separate activities from output and impact. They also help marketing zero in on the areas that can be tweaked for maximum impact, namely, the following waterfall metrics:
Metrics that are actionable alternatives to ROMI: • Activity. Measurements around activities—such
as emails—intended to help you deliver an output.
• Output. This metric measures how well you are delivering outputs such as marketing qualified leads or sales qualified leads, and could be a conversion rate.
• Impact. Measures against specific business goals, such as revenues.
• Readiness. You must have a state of readiness in some cases in order to proceed to the next step, and this metric measures that readiness state. For example, if your database hasn’t been cleaned, de-duped, etc., then you won’t be ready to send your email campaign. Or, if you want to run a mobile marketing campaign but don’t have an SMS database, you’re not ready.
VolumeHow manyleads do I
currently have inthe waterfall?
Conversion RateHow efficiently
are leads convertingthrough the
waterfall stages?
VelocityHow fast areleads moving
throughthe waterfall?
6
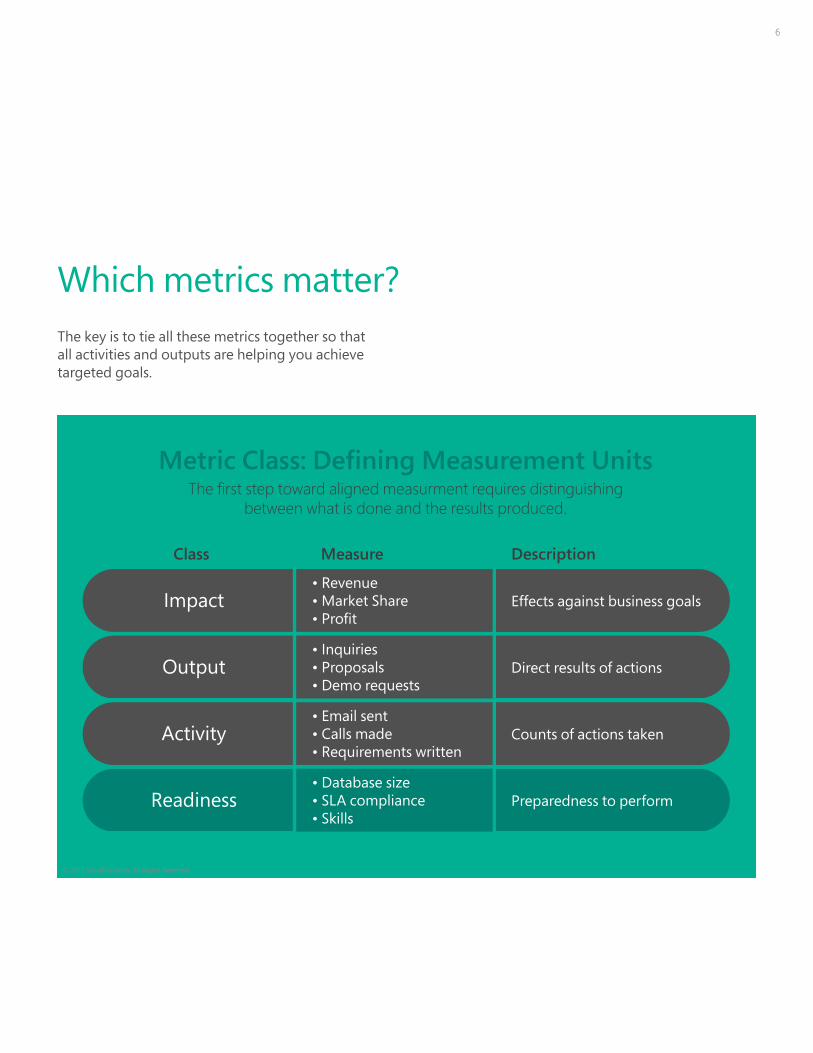
The key is to tie all these metrics together so that all activities and outputs are helping you achieve targeted goals.
Which metrics matter?
Metric Class: Defining Measurement UnitsThe first step toward aligned measurment requires distinguishing
between what is done and the results produced.
Class Measure Description
Impact• Revenue• Market Share• Profit
Effects against business goals
Output• Inquiries• Proposals• Demo requests
Direct results of actions
Activity• Email sent• Calls made• Requirements written
Counts of actions taken
Readiness• Database size• SLA compliance• Skills
Preparedness to perform
© 2015 SiriusDecisions. All Rights Reserved
Marketers should shift their focus from justifying individual tactics to exploring which combinations and sequences of marketing touchesare predictive of successful outcomes.

closes some of these deals (that’s an impact).
Or perhaps your marketing team is tasked with helping the organization increase revenues by 10% this year. Last year the company generated $100,000,000 at an average order value of $500,000. To hit the 10% increase, marketing will run a series of campaigns and programs intended to drive 20,000 inquiries, which it will nurture to deliver 5,000 marketing qualified leads (MQLs) to the sales team. It expects 3% of those to convert to sales qualified leads (SQLs) and will deliver sales enablement tools to help 1.5% of those convert to deals. That would yield 22 deals or $11,000,000 (impact).
It’s a value chain: activity, output, activity, output, activity, output, impact. This value chain helps stabilize what is being measured and recognize that the last two steps in the value chain (i.e., last-touch attribution) aren’t the only activities that took place to drive the impact of revenues. It also helps marketing connect the dots from first inquiry all the way to closed deal. In other words, it shows marketing’s contribution to pipeline and revenues.
8
Many organizations credit the sales team with driving all the business impact (i.e., revenues); but the reality is that marketing and product also contribute. And by tracking relevant metrics, you can measure the value of that contribution.
Assume your organization wants to develop personas in order to deliver more relevant information and better engage prospective buyers.
The product group is conducting the necessary research to develop the personas. Activity measures are the amount of research being conducted and the number of personas being researched. Once the product group develops a persona, that’s output. Once a certain number of personas are defined, you’ve hit the state of readiness where those per-sonas can be passed to marketing as the basis for running a series of tactics. If they result in marketing qualified leads (an output), that can trigger sales to write proposals and launch a telemarketing blitz (activities). That can then can trigger activities in sales to write proposals and launch a telemarketing blitz. Ultimately, sales qualifies these leads (an output) and
Examples of metrics in play
© 2015 SiriusDecisions. All Rights Reserved
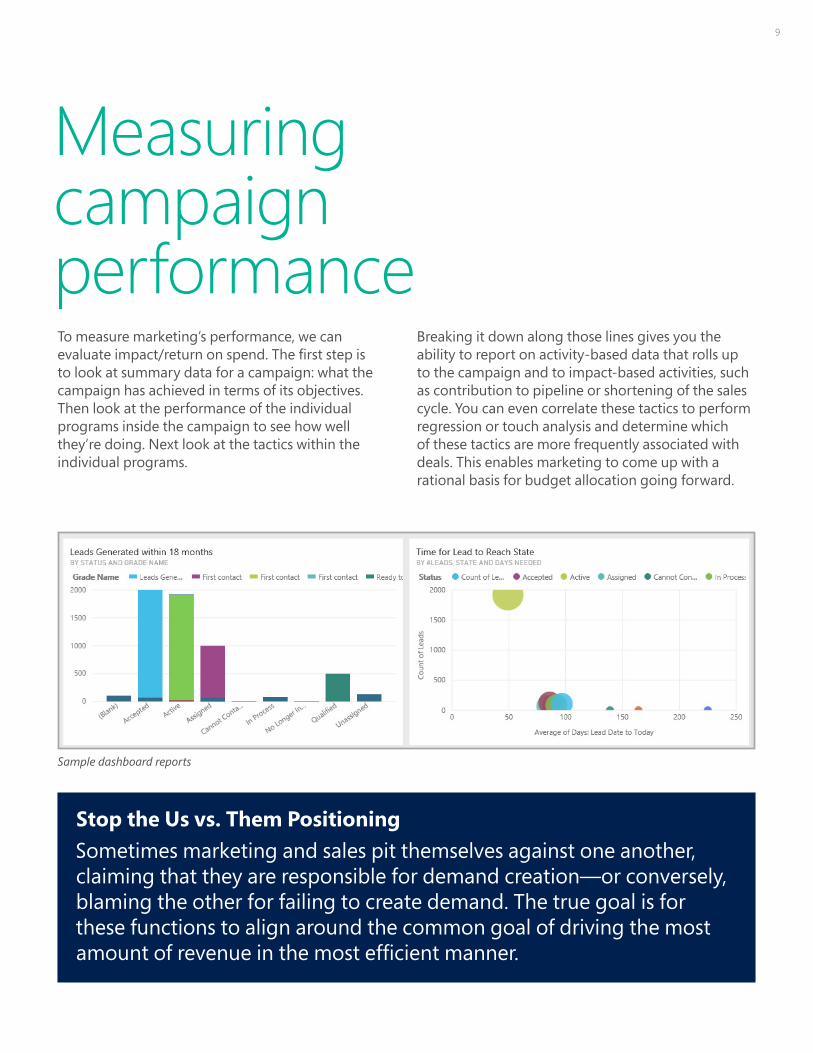
Breaking it down along those lines gives you the ability to report on activity-based data that rolls up to the campaign and to impact-based activities, such as contribution to pipeline or shortening of the sales cycle. You can even correlate these tactics to perform regression or touch analysis and determine which of these tactics are more frequently associated with deals. This enables marketing to come up with a rational basis for budget allocation going forward.
To measure marketing’s performance, we can evaluate impact/return on spend. The first step is to look at summary data for a campaign: what the campaign has achieved in terms of its objectives. Then look at the performance of the individual programs inside the campaign to see how well they’re doing. Next look at the tactics within the individual programs.
9
Measuring campaign performance
Stop the Us vs. Them PositioningSometimes marketing and sales pit themselves against one another, claiming that they are responsible for demand creation—or conversely, blaming the other for failing to create demand. The true goal is for these functions to align around the common goal of driving the most amount of revenue in the most efficient manner.
Sample dashboard reports
10
As mentioned earlier, marketing can make strategic plans to deliver impact. Here are some of the levers marketing can manipulate for better results.
• Increase inquiry velocity. Allocate greater budget to demand generation to drive more inquiries into the waterfall.
• Accelerate pipeline movement. Marketing can sequence tactics to move leads through the conversion stages faster.
• Lower the cost of leads. Optimize efficiency around generating inquiries for lower lead cost.
• Drive a higher order value. Marketing can run campaigns to boost brand perception and reputation, creating a vision of a bigger solution rather than separate products and services. It could also train the sales force to focus on solutions rather than individual products.
Driving higher impact

data modeled into a consumable format. Plus, a pre-configured role-based dashboard that you can customize for your own needs allows you to quickly ramp up your own marketing analytics and serve the needs of those throughout your organization.
Within the Power BI dashboard, you can click and drill-down on any of the visuals to view a more detailed report. And from there, you can further apply filters, drill into more information and gain many more insights and make your data actionable.
11
Using Microsoft Dynamics Marketing, you can measure the results of your marketing efforts and detect trends. In turn, you can adjust your marketing plans accordingly while converting your observations into actionable optimizations.
Combine Dynamics Marketing with Microsoft Power BI and you get the tools you need to analyze your data and make informed marketing decisions. Through Power BI, you’ll gain access to the right
Putting it all into play with Microsoft Dynamics Marketing

Easily query your dataYou can also use the Power BI Q&A to ask natural language questions as you further explore your data.
For example, if you want to understand the source of leads over a period of time, you might say:
“Show number of leads and interaction type between October 1, 2014 and March 1, 2015”
The answer will be given in the form of a chart as shown. You can then pin this visual to your dashboard if you want to keep monitoring it.
12
Putting it all into play with Microsoft Dynamics Marketing
Examples of natural language queries Power BI can answer for you
Marketing Database• Count of marketing companies• Number of Marketing Companies• Number of Client Companies• Count of contacts over update date• Count of marketing contacts over update date as line• Show Number of Marketing contacts by belongs to company• Number of Marketing contacts by Parent Company Name, • Show parent company and number of contacts• Show parent company and number of Marketing contacts• Show number of contacts per territory as column
Campaign management• Show campaigns and number of leads• Show number of campaigns and status• Show number of active campaigns• Show number of active campaigns by end date• Show number of interactions by program
Segmentation• Show name of marketing lists sorted by Contact count• Show name of active marketing lists sorted by Contact count• Show name of marketing lists sorted by number of lead interactions• show lead scoring model, grade name, number of leads as
clustered bar • show lead scoring model, grade name, number of leads as
stacked column
Lead creation over time• Show leads with date is in this week• Show leads with date is in last week• Show number of leads with date is last week• Show number of leads per date last week• Show number of leads per date this year• Show number of leads per date last year• Show leads with date is 10 days ago• Show number of leads with date is 10 days ago• Show number of leads with date since 10 days ago• Show leads with date is today • Show number of lead with date is today • Show leads with date is tomorrow -> Empty
Scoring• Show lead scoring models and their sales ready score• Show lead scoring model, grade name, number of leads• Show scoring model, count of leads, count of interactions,
score as scatter
Marketing Activities• Show landing page and number of leads • Show landing pages and number of leads and lead status• Show landing pages, number of lead status as treemap• Show landing pages, number of leads as treemap• Show count of lead interaction by interaction type• Show number of lead interaction and interaction type
over interaction date as line
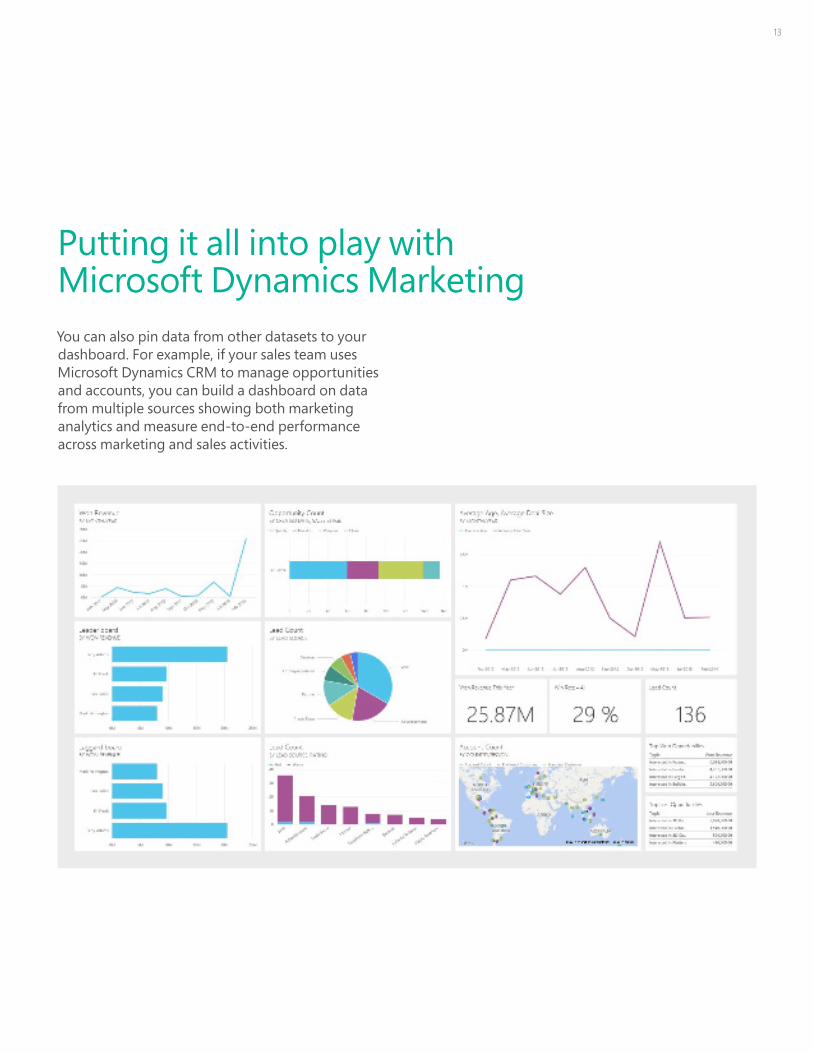
You can also pin data from other datasets to your dashboard. For example, if your sales team uses Microsoft Dynamics CRM to manage opportunities and accounts, you can build a dashboard on data from multiple sources showing both marketing analytics and measure end-to-end performance across marketing and sales activities.
13
Putting it all into play with Microsoft Dynamics Marketing
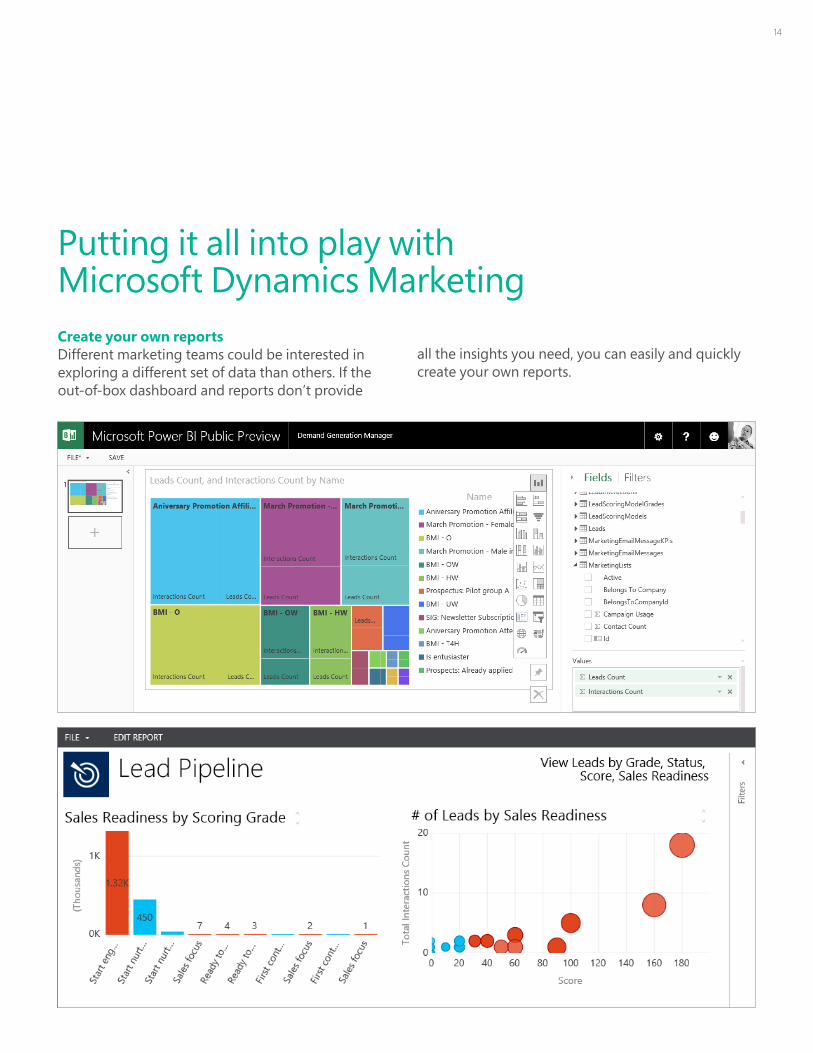
all the insights you need, you can easily and quickly create your own reports.
14
Putting it all into play with Microsoft Dynamics Marketing Create your own reportsDifferent marketing teams could be interested in exploring a different set of data than others. If the out-of-box dashboard and reports don’t provide

Reach out to learn more.
Talk to a Microsoft representative (United States and Canada).
Availability and hours of operation: Monday–Friday, 8:00 A.M.–5:30 P.M. Central Time (UTC-6) in the United States and Canada.
1-888-477-7989
www.microsoft.com/dynamics