the expansion of college education in the united …
TRANSCRIPT

THE EXPANSION OF COLLEGE EDUCATION IN THE UNITED STATES:IS THERE EVIDENCE OF DECLINING COHORT QUALITY?
CHINHUI JUHN, DAE IL KIM, and FRANCIS VELLA*
This article documents the expansion of college education in the United States andexamines to what extent the increase in the number of college graduates may have leadto a decline in the average quality of college graduates. Using the 1940–90 Census, wecompare across birth year cohorts with varying levels of college completion. We findsome weak evidence that college graduate men from highly educated cohorts earna relatively smaller wage premium even controlling for the relative supply effect.However, these cohort quality effects account for only a small fraction of the recentfluctuation in the college wage premium. (JEL I20, J24, J31)
I. INTRODUCTION
In 1940, approximately 5% of men aged 20–64 were college graduates. By 1990, the frac-tion with a college degree had more than qua-drupled to 22.6%. Conversely, more than 70%of men aged 20–64 had not finished highschool in 1940. By 1990, the fraction of themale population who were high school drop-outs had dipped below 20%. These changesimply that there has been an enormous in-crease in the supply of skilled workers in theU.S. economy over the past five decades.The magnitude of these changes also suggeststhat the composition of these groups, in termsof their underlying ability and talents, havealso changed, making it difficult to comparethese groups over time.
In this article we focus on the expansion ofcollege education. We ask whether the in-crease in the number of college graduates overtime lead to a decline in the average ability ofcollege graduates. Following Becker (1967),we introduce a simple model of human capitalaccumulation with individuals who differ in
ability and borrowing costs. Under the as-sumption that the ability distribution isfixed and the more able attend college, we ex-amine the conditions under which a risingshare of college graduates leads to a declinein the average ability of the college-educatedgroup.
The relationship between the expansion ofhigher education and the average ability ofcollege attendees was explored by Taubmanand Wales (1972) in their well-known study.Putting together evidence from a variety oftest score studies, they reported that the aver-age aptitude of those who attended college ac-tually rose relative to those who did not attendcollege. We take an alternative, more aggre-gate approach in examining the expansionof college education and average ability in thisarticle. Using the 1940–90 Census, we com-pare across cohorts with different levels of ed-ucational attainment. We ask whether collegegraduates from more educated cohorts receivea smaller college premium, even controllingfor the relative supply effect. Thus we donot observe changes in ability directly but inferchanges in ability through changes in relativewages.
There are several reasons why we view thisalternative approach as useful. First, the testscore studies are based on different tests ad-ministered in different states, which raises
*We thank two anonymous referees for comments andsuggestions on earlier drafts.
Juhn: Professor, Department of Economics, University ofHouston, Houston, TX 77204-5882. Phone 1-713-743-3823, Fax 1-713-743-3798, Email [email protected]
Kim: Associate Professor, School of Economics, SeoulNational University, Seoul 1510742, Korea. Phone82-2-880-6364, Fax 82-2-886-4231, Email [email protected]
Vella: Professor, Department of Economics, EuropeanUniversity Institute, Villa San Paolo, Via della Piaz-zuola 43, 50133, Florence, Italy. Phone 39-055-4685-952, Fax 39-055-4685-902, Email [email protected]
ABBREVIATIONS
PUMS: Public Use Micro Samples
CPS: Current Population Survey
Economic Inquiry
(ISSN 0095-2583) doi:10.1093/ei/cbi020
Vol. 43, No. 2, April 2005, 303–315 � Western Economic Association International
303

questions about the comparability of theresults over time. Second, the test scores areoften available only for those who finishedhigh school. Because the selection of highschool graduates is also changing, it is difficultto infer changes in ability of college graduates.Third, test scores typically have little explan-atory power in earnings regressions, suggest-ing that other dimensions of ability areimportant for earnings determination. Finally,many of these studies refer to the first half ofthe twentieth century, whereas we extend theanalysis to the more recent period.
A number of recent papers (Murphy andWelch 1992; Katz and Murphy 1992; Topel1997; Autor et al. 1998) have argued thatthe rapid increase in the share college gradu-ates depressed college premiums in the1970s. Welch (1979), Berger (1985) and Cardand Lemieux (2000) show that these declinesin college premiums were particularly associ-ated with the Baby Boom cohorts who enteredcollege in record numbers. In this article weexamine to what extent these cohort effectsmay reflect a decline in quality associated withan accelerated pace of college attendance.
To preview our results, we find a small andmarginally significant cohort quality effectthat suggests that a 10% increase in the co-hort-specific college share leads to a 0.6% de-cline in the college premium, holdingeverything else constant. These results suggestthat changes in cohort quality played a mini-mal role in the recent period, with relative sup-ply and demand shocks accounting for most(87%) of the variation in relative wages. Thesesmall relative wage effects related to changesin ability are in line with evidence from testscores reported in Murnane et al. (1995)).1
Section II begins by describing the aggre-gate changes in educational attainment overthe period 1940–90. Although we concentratemostly on prime-age men in this work, we alsoreport changes in educational attainment ofwomen. Section III presents our human capi-tal framework. Section IV presents the results
from our cohort-level regressions. Section Vpresents a summary of our main findings.
II. THE EXPANSION OF COLLEGE EDUCATIONIN THE UNITED STATES
One of the most notable changes in the U.S.labor market in the past several decades hasbeen the increase in educational attainmentof its labor force. In this section we documentthis change using the 1/100 sample of the1940–90 Public Use Micro Samples (PUMS).To describe changes in the education distribu-tion over time, we use an inclusive sample ofmen and women who were 20–64 years old.Our regressions results are based on menwho are older, 25–64 years old. We restrictour analysis to the older group because theyare more likely to have completed their educa-tion, and we examine men to ensure consistentlabor market attachment. To calculate laborquantities, we include men 25–64 years oldwho were employed during the survey weekbut did not work in agriculture. To calculatewages, we chose a more select sample of thesemen who were wage and salary workers,worked full-time, worked at least 40 weeks,and earned at least one-half the legal federalminimum weekly wage. Our wage measureis the weekly wage calculated as annualearnings divided by weeks worked. Annualearnings were deflated using the personal con-sumption expenditure deflator from the na-tional product and income accounts.
Table 1 reports shares of men and womenof prime working age (20–64 years old) in foureducation categories: less than high school,high school graduate, some college, and col-lege graduate. In 1940, as much as 74% ofworking-age men had less than a high schooldegree, and 5.4% had a college degree. By1990, less than 20% were high school dropoutsand 22.6% college graduates.2 Table 1 alsoreports the educational attainment of women.The table shows that there has been an equallydramatic increase in the educational attain-ment for women, although women are stillslightly less likely to be college graduates than
1. Our quality effects are smaller than those reportedby Rosenbaum (1999), who examines the rise in the collegepremium with and without ability controls. Both studiesuse cohort-specific educational attainments to proxy forability changes, but the difference in our results may bedue to the fact that we focus exclusively on changes in abil-ity composition while Rosenbaum also allows for changesin returns to ability over time.
2. The 1990 Census questionnaire changed emphasisfrom grades attended to degree obtained. To make the1990 data comparable to the earlier years, we imputedthe distribution of grades completed by reported educa-tion on the 1990 Census using the matched March samplesfor 1991–92. Details of this imputation procedure areavailable from the authors.
304 ECONOMIC INQUIRY
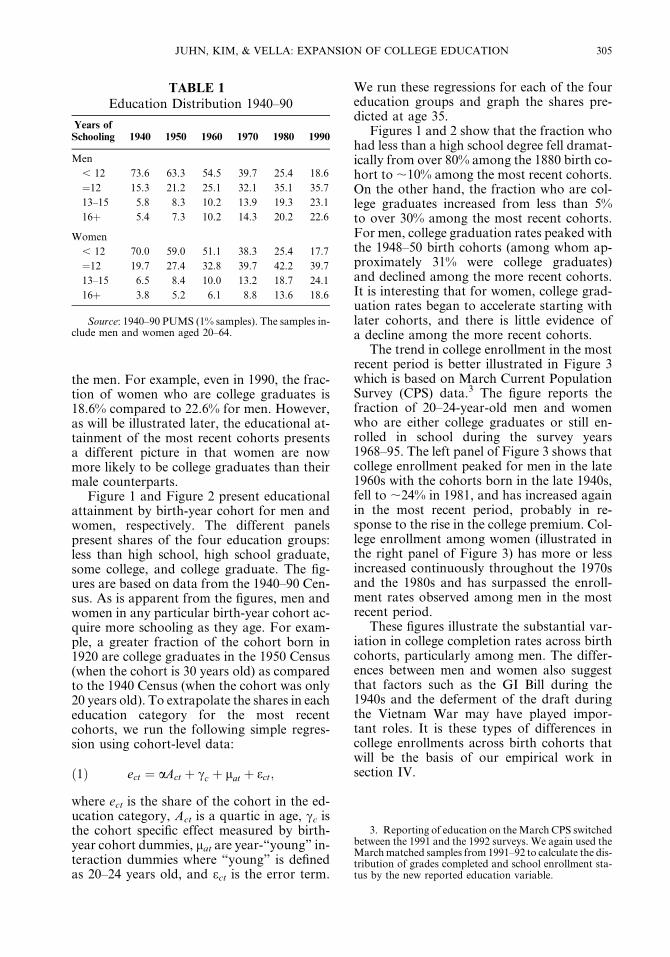
the men. For example, even in 1990, the frac-tion of women who are college graduates is18.6% compared to 22.6% for men. However,as will be illustrated later, the educational at-tainment of the most recent cohorts presentsa different picture in that women are nowmore likely to be college graduates than theirmale counterparts.
Figure 1 and Figure 2 present educationalattainment by birth-year cohort for men andwomen, respectively. The different panelspresent shares of the four education groups:less than high school, high school graduate,some college, and college graduate. The fig-ures are based on data from the 1940–90 Cen-sus. As is apparent from the figures, men andwomen in any particular birth-year cohort ac-quire more schooling as they age. For exam-ple, a greater fraction of the cohort born in1920 are college graduates in the 1950 Census(when the cohort is 30 years old) as comparedto the 1940 Census (when the cohort was only20 years old). To extrapolate the shares in eacheducation category for the most recentcohorts, we run the following simple regres-sion using cohort-level data:
ect ¼ aAct þ cc þ lat þ ect;ð1Þ
where ect is the share of the cohort in the ed-ucation category, Act is a quartic in age, cc isthe cohort specific effect measured by birth-year cohort dummies, lat are year-‘‘young’’ in-teraction dummies where ‘‘young’’ is definedas 20–24 years old, and ect is the error term.
We run these regressions for each of the foureducation groups and graph the shares pre-dicted at age 35.
Figures 1 and 2 show that the fraction whohad less than a high school degree fell dramat-ically from over 80% among the 1880 birth co-hort to ;10% among the most recent cohorts.On the other hand, the fraction who are col-lege graduates increased from less than 5%to over 30% among the most recent cohorts.For men, college graduation rates peaked withthe 1948–50 birth cohorts (among whom ap-proximately 31% were college graduates)and declined among the more recent cohorts.It is interesting that for women, college grad-uation rates began to accelerate starting withlater cohorts, and there is little evidence ofa decline among the more recent cohorts.
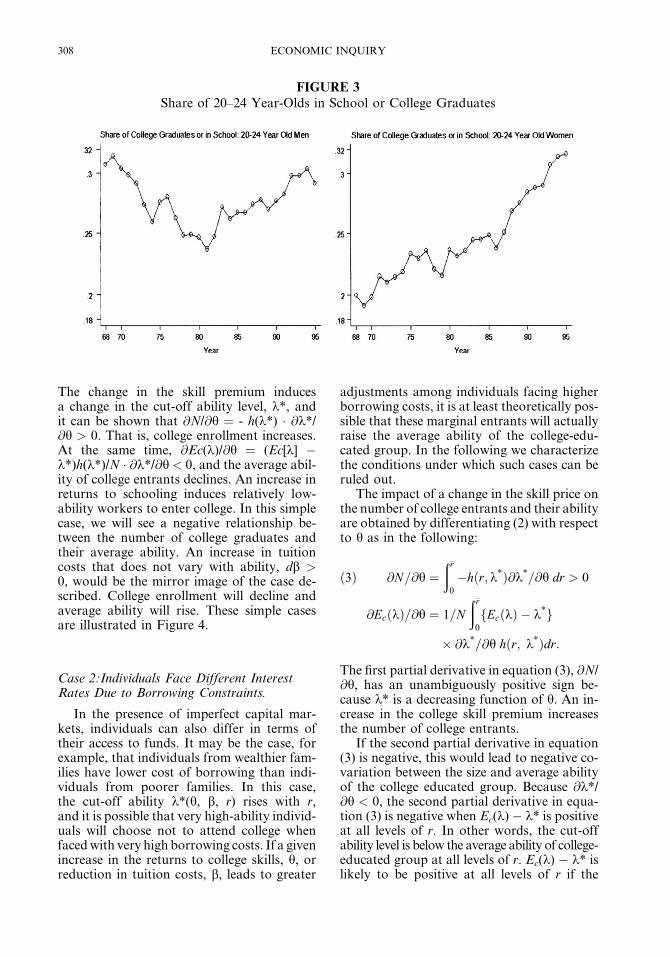
The trend in college enrollment in the mostrecent period is better illustrated in Figure 3which is based on March Current PopulationSurvey (CPS) data.3 The figure reports thefraction of 20–24-year-old men and womenwho are either college graduates or still en-rolled in school during the survey years1968–95. The left panel of Figure 3 shows thatcollege enrollment peaked for men in the late1960s with the cohorts born in the late 1940s,fell to ;24% in 1981, and has increased againin the most recent period, probably in re-sponse to the rise in the college premium. Col-lege enrollment among women (illustrated inthe right panel of Figure 3) has more or lessincreased continuously throughout the 1970sand the 1980s and has surpassed the enroll-ment rates observed among men in the mostrecent period.
These figures illustrate the substantial var-iation in college completion rates across birthcohorts, particularly among men. The differ-ences between men and women also suggestthat factors such as the GI Bill during the1940s and the deferment of the draft duringthe Vietnam War may have played impor-tant roles. It is these types of differences incollege enrollments across birth cohorts thatwill be the basis of our empirical work insection IV.
TABLE 1
Education Distribution 1940–90
Years ofSchooling 1940 1950 1960 1970 1980 1990
Men
, 12 73.6 63.3 54.5 39.7 25.4 18.6
¼12 15.3 21.2 25.1 32.1 35.1 35.7
13–15 5.8 8.3 10.2 13.9 19.3 23.1
16þ 5.4 7.3 10.2 14.3 20.2 22.6
Women
, 12 70.0 59.0 51.1 38.3 25.4 17.7
¼12 19.7 27.4 32.8 39.7 42.2 39.7
13–15 6.5 8.4 10.0 13.2 18.7 24.1
16þ 3.8 5.2 6.1 8.8 13.6 18.6
Source: 1940–90 PUMS (1% samples). The samples in-clude men and women aged 20–64.
3. Reporting of education on the March CPS switchedbetween the 1991 and the 1992 surveys. We again used theMarch matched samples from 1991–92 to calculate the dis-tribution of grades completed and school enrollment sta-tus by the new reported education variable.
JUHN, KIM, & VELLA: EXPANSION OF COLLEGE EDUCATION 305

III. MODEL OF HUMAN CAPITAL ACCUMULATIONAND COHORT QUALITY
To provide a framework for discussion andfor our empirical work, we examine a simpli-fied version of the Becker (1967) model of hu-man capital accumulation. This model hasbeen reformulated by Rosen (1977) and gener-alized to incorporate heterogeneous humancapital in Willis and Rosen (1979). Most re-cently it has been revived to discuss biasesin estimating returns to schooling fromcross-sectional data (Card 1994; Lang 1994).Our purpose here is to characterize, withinthe context of this well-known model, the con-ditions under which we can expect the size andaverage ability of the college educated groupto negatively covary. The share of college ed-ucated can increase for a variety of reasons,such as an increase in price of skills acquiredin college, decline in tuition costs, and declinein the cost of borrowing funds, which may be
affected by government loan or subsidy pro-grams. In our discussion we consider these dif-ferent cases.4
Individuals maximize the present value oflifetime earnings and compare the benefitsand costs in deciding whether to obtain a col-lege degree. The discounted benefit of collegeeducation net of forgone earnings, R(h, r, k),depends on the price of the skill acquired incollege, h, the interest (discount) rate, r, andthe ability of the individual, k. R(h, r, k) is in-creasing in h, decreasing in r, and increasing ink (Rh > 0, Rr < 0, and Rk > 0). We denote thedirect costs of college (such as tuition) as b,
FIGURE 1
Educational Attainment by Birth-YearCohort: Males
4. Although our theoretical model considers declinesin cohort quality arising from changing ability composi-tions, the decline in quality may also arise from suddenincreases in enrollment reducing the quality of college ed-ucation when resources are relatively fixed in the shortrun. Our empirical work can also address these types ofchanges in cohort quality.
306 ECONOMIC INQUIRY

and assume that it is positive and independentof ability.5
A worker of ability k will decide to entercollege if the benefit exceeds the cost, R(h, r,k) > b. At each interest rate, r, one can definea cut-off ability level k* such that R(h, r, k*) ¼b. k* is a function of h, r, and b. Further, @k*/@h¼�Rh/Rk< 0, @k*/@b¼ 1/Rk> 0, and @k*/@r ¼ �Rr/Rk > 0. In other words, the cut-offability declines as the price of college skillsincreases and rises with increases in tuitioncosts and the interest rate. Denoting the jointpopulation density of interest rate and abilityas h(r, k), the size of the college-going popu-lation (N) and their average ability (Ec[k])are obtained as in equation (2).
N ¼ð�r0
ð1k*hðr; kÞdkdr;
EcðkÞ ¼ 1=N
ð�r0
ð1k*khðr; kÞdkdr:
ð2Þ
In the equation the interest rate is assumed totake a value between zero and a finite upper-bound �r < N.
Case 1: Everybody Faces the Same InterestRate at r*
When everybody faces the same interestrate, the joint density can be denoted as themarginal density, h(k), and the number of col-lege entrants and their average ability may becalculated by integrating only over ability, k.Under this assumption, now consider an in-crease in the college skill premium, dh > 0.
FIGURE 2
Educational Attainment by Birth-YearCohort: Females
5. Of course, an alternative set-up would be to assumethat the return, R, does not vary with ability, but the costof going to college is negatively related to ability.
JUHN, KIM, & VELLA: EXPANSION OF COLLEGE EDUCATION 307
The change in the skill premium inducesa change in the cut-off ability level, k*, andit can be shown that @N/@h ¼ - h(k*) � @k*/@h > 0. That is, college enrollment increases.At the same time, @Ec(k)/@h ¼ (Ec[k] �k*)h(k*)/N � @k*/@h < 0, and the average abil-ity of college entrants declines. An increase inreturns to schooling induces relatively low-ability workers to enter college. In this simplecase, we will see a negative relationship be-tween the number of college graduates andtheir average ability. An increase in tuitioncosts that does not vary with ability, db >0, would be the mirror image of the case de-scribed. College enrollment will decline andaverage ability will rise. These simple casesare illustrated in Figure 4.
Case 2:Individuals Face Different InterestRates Due to Borrowing Constraints.
In the presence of imperfect capital mar-kets, individuals can also differ in terms oftheir access to funds. It may be the case, forexample, that individuals from wealthier fam-ilies have lower cost of borrowing than indi-viduals from poorer families. In this case,the cut-off ability k*(h, b, r) rises with r,and it is possible that very high-ability individ-uals will choose not to attend college whenfaced with very high borrowing costs. If a givenincrease in the returns to college skills, h, orreduction in tuition costs, b, leads to greater
adjustments among individuals facing higherborrowing costs, it is at least theoretically pos-sible that these marginal entrants will actuallyraise the average ability of the college-edu-cated group. In the following we characterizethe conditions under which such cases can beruled out.
The impact of a change in the skill price onthe number of college entrants and their abilityare obtained by differentiating (2) with respectto h as in the following:
@N=@h ¼ð�r0
�hðr;k*Þ@k*=@h dr > 0
@EcðkÞ=@h ¼ 1=N
ð�r0
fEcðkÞ � k*g
� @k*=@h hðr; k*Þdr:
ð3Þ
The first partial derivative in equation (3), @N/@h, has an unambiguously positive sign be-cause k* is a decreasing function of h. An in-crease in the college skill premium increasesthe number of college entrants.
If the second partial derivative in equation(3) is negative, this would lead to negative co-variation between the size and average abilityof the college educated group. Because @k*/@h < 0, the second partial derivative in equa-tion (3) is negative when Ec(k) � k* is positiveat all levels of r. In other words, the cut-offability level is below the average ability of college-educated group at all levels of r. Ec(k) � k* islikely to be positive at all levels of r if the
FIGURE 3
Share of 20–24 Year-Olds in School or College Graduates
308 ECONOMIC INQUIRY

cut-off ability does not vary much across inter-est rates, that is, @k*/@r is positive but small.Because @k*/@r ¼ �Rr/Rk, this condition issatisfied when the comparative advantage inreturns to higher ability individuals, Rk, islarge relative to the disincentive effect of thehigher interest rate. In other words, abilityplays a larger role in determining who acquireseducation, and large differences in r generateonly small differences in k*. This, in effect,gets us close to case 1, and an increase in h willmost likely lead to a decline in average ability.
Another component is the adjustment @k*/@h at high and low interest rates. If j@k*/@hjdecreases with r so that adjustments at highinterest rates are smaller than those at lowerinterest rates, this reduces the likelihood ofan increase in average ability.
Finally, the shape of the joint density,h(r,k), matters. The negative relation betweensize and average ability of the college group ismore likely if the joint density, h(r,k) has littlemass at high interest rates and high ability.This effectively reduces the importance ofthe adjustment at high ability–high interestrate margins. We have assumed so far inour discussion that the distribution of abilityand borrowing costs are uncorrelated in thepopulation. Recent papers by Cameron andHeckman (1998) and Cameron and Taber(2000) suggest that this correlation may benegative. To the extent that family incomeaffects ability directly rather than throughborrowing costs, this would strengthen thenegative relationship between size and averageability.
We have so far examined how college en-rollment and average ability changes in re-sponse to an increase in returns to college,
dh > 0, or its mirror image, reduction in tu-ition costs, db< 0. It is also interesting to con-sider whether size and ability would negativelycovary when borrowing costs, r, change due togovernment loans and subsidies. We examinethis case in the appendix and focus on two dif-ferent types of subsidies: a general subsidy thatlowers the cost of funds for everyone and a nar-rower subsidy that targets those individualswho would otherwise face very high interestrates. Our conclusions are intuitive and notvery surprising. A general subsidy that lowersr for everyone would lead to an increase in col-lege enrollments and an unambiguous declinein average ability. It is possible that a targetedsubsidy that only affects those who initiallyface very high interest rates may lead to an in-crease in average ability. This is due to the factthat these individuals at the margin are high-ability individuals, and inducing them to en-roll in college may actually increase theaverage ability of the college population.6
IV. THE EFFECT OF COHORT-SPECIFICCOLLEGE SHARE ON THE RELATIVEWAGE OF COLLEGE GRADUATES
In this section, we examine the relationshipbetween rising college share and averageability of the college educated group usingcohort-level data from the 1940–90 Census.Our analysis covers a long span of time usingcomparable data, which is an advantage. Adisadvantage is that we do not have directmeasures of ability and therefore must inferchanges in ability through changes in wages.More specifically, we examine whether collegegraduate men from highly educated co-horts earn a smaller college premium, holdingconstant other variables that also affect thecollege premium.
In what follows, we first aggregated the databy census year, single year of age, and by col-lege completion. We ran regressions in changesusing weighted least squares on this aggregate-level data. Our dependent variable is the de-
FIGURE 4
6. Cameron and Heckman (1998) and Cameron andTaber (2000) conclude that credit constraints are less im-portant than permanent income and family backgroundcharacteristics in explaining schooling attainment. Bothpapers find that borrowing constraints are not empiricallyimportant, at least for the recent cohorts. These studiessuggest that short-term tuition subsidies are unlikely to en-courage enrollment of high-ability students from lower-income families.
JUHN, KIM, & VELLA: EXPANSION OF COLLEGE EDUCATION 309

cade change in log relative wage of collegegraduates at different ages. In other words,we compare the college premium receivedby, for example, 40-year-old college graduatemen in year t with the college premium receivedby 40-year-old college graduate men 10 yearsearlier, thereby utilizing between-cohort varia-tion in the data. Our main regressor of interestis the between cohort log differences in theshare who went to college, Dlog(Nac/Na). Weuse predicted college share of each cohort atage 35 as specified in equation (1) rather thanactual observed shares at time t, so as to notconfound the effects of cohort quality and rel-ative supply. The variation in the data that weexploit is illustrated in Figure 5, which graphsdecade log changes in relative wage and collegeshare at different age levels over the period1979–89. The picture illustrates the strong neg-ative correlation between changes in relativewage and college share during this latter pe-riod. Although they are less pronounced, neg-ative correlations also exist in other periods, asillustrated in Figure 6.
To the extent that workers in different ed-ucation groups are imperfect substitutes foreach other, the increase in college share willnegatively impact the relative wage of collegegraduates regardless of the quality effect. Wecontrol for relative supply in three alternativeways. In the first specification, we includeyear dummies to control for aggregate supply
and demand shocks and run the followingregression
DlogðWact=WatÞ ¼ b1DlogðNac=NaÞþ b2DlogðNact=NctÞþ st þ da þ eat;
ð4Þ
where a indexes age and c indexes college grad-uate. This assumes that workers in differentage groups are perfect substitutes for eachother so that an influx of new college gradu-ates will have an equally adverse impact onall college graduates, and the year dummiescontrol for this effect. As indicated in equation(4), we also include a control for overall cohortsize, Dlog(Nact/Nct), and dummies for young(25–35) and middle age (35–50).
In the second specification, we control forchanges in the relative supply of workers withdifferent education levels, high school drop-outs Dlog(Ndt/Nt), high school graduates,Dlog(Nht/Nt), and college graduates,Dlog(Nct/Nt). The relative supply of collegegraduates is the actual share observed in yeart, rather than the predicted share at age 35,which is our main cohort quality variable.However, the two variables are highly collin-ear, making it difficult to separately identifythe two effects. We follow the strategy sug-gested in Welch (1979), where we define rela-tive supply as the weighted average around
FIGURE 5
Log Change in Relative Wage and College Share
310 ECONOMIC INQUIRY

a given age group. The supply of college grad-uates, for example, is defined as Nact* ¼ 1/9*(Na�2,ct þ 2*Na�1,ct þ 3*Nact þ 2*Naþ1,ct þNaþ2,ct). This assumes that workers in nearbyage groups are closer substitutes. More specif-ically, we run the following regression for thisspecification:
DlogðWact=WatÞ ¼ b1DlogðNac=NaÞþ b2DlogðNact=NctÞþ b3DlogðN*
adt=NatÞþ b4DlogðN*
aht=NatÞþ b5DlogðN*
act=NatÞþ st þ da þ eat*
ð5Þ
Finally, we include a relative supply vari-able based on years of potential experiencerather than age. In other words, in this spec-ification, we assume that college graduatescompete with high school graduates, whoare typically about four years younger and en-
ter the labor market in the same calendar year.We run the following regression in the lastspecification:
DlogðWact=WatÞ ¼ b1DlogðNac=NaÞþ b2DlogðNact=NctÞþ b3DlogðNxdt=NxtÞþ b4DlogðNxht=NxtÞþ b5DlogðNxct=NxtÞþ st þ da þ eat;
ð6Þ
where Nxt refers to the number of workers ata given year of potential experience.
The regression results are reported in Table2. Column (1), which corresponds to our firstspecification, shows that the coefficient on thecohort college share variable is negative andstatistically significant when only year dum-mies are included to control for relative sup-ply. However, the relationship betweencohort college share and the relative wage of
FIGURE 6
Log Change in Relative Wage and College Share
JUHN, KIM, & VELLA: EXPANSION OF COLLEGE EDUCATION 311

college graduates becomes much weaker inour alternative specifications shown in col-umns (2) and (3). When we use the relativesupply measure defined around age (column[2]), the cohort college share variable is mar-ginally significant (at the 10% significancelevel). The coefficient �0.063 implies thatthe average premium is about 0.6% lowerfor a cohort that is 10% larger than average.When we use our alternative relative supplymeasure, which is based on experience (col-umn [3]), the size of the coefficient on cohortcollege share variable is similar (�0.060), al-though it is no longer significant.
A large body of literature on the effects ofcohort size on earnings suggests that the wagepenalty associated with being in a large cohortis especially pronounced on labor market en-try as suggested by Welch (1979) and Berger(1985). In the following section we examinewhether our cohort quality effect also variesby age. We ran regressions as specified in(5) separately for young workers (betweenthe ages 25 and 34) and for older workers(35 and older). The coefficients are reportedin Table 3. When we examine young workersonly, our sample is reduced to 50 observations,and we find that the cohort quality variable isno longer significant. In the specificationwhere we control for relative supply (column[2] of Table 3), the cohort quality variable ac-
tually turns positive and is marginally signifi-cant. The cohort quality variable is much morerobust and stable when we look at older work-ers (columns [3] and [4] of Table 3). Aside fromthe fact that we have more observations for theolder group, our assumption that workers atdifferent ages are equally good substitutesfor each other may be more valid for olderworkers, thus allowing us to more cleanly sep-arate the quality and quantity effects.
What is the economic significance of a coef-ficient such as (�0.063)? What does this implyabout the possible role of declining cohortquality in the 1970s and the 1980s? To answerthis question, we use the coefficients from ourcohort-level regressions (column [2]) to de-compose total decade log changes in therelative wage of college graduates into compo-nents due to cohort quality, relative supply,and year effects. Overall, the relative wageof college graduates declined 5.3% duringthe 1970s and increased 9.3% during the1980s. Of the 5.3% decline over the 1970s, rel-ative supply changes contributed a decline of6.6%, whereas an additional 2% decline waspredicted by changes in the share of college.Aggregate time effects contributed an increaseof 3.3% over this period. During the 1980s, theimpact of cohort quality was smaller. Aggre-gate time effects contributed an increaseof 13.6% in the relative wage of college
TABLE 2
Effects of Cohort-Specific College Share on Wages of College Graduate Men
(DependentVariable ¼ Dlog[Wact/Wat])
(1) (2) (3)
Cohort college share �0.101* (0.027) �0.063þ (0.038) �0.060 (0.039)
Relative supply
, 12 years — 0.056þ (0.030) 0.026 (0.030)
12–15 years — �0.027 (0.040) 0.031 (0.037)
16þ years — �0.075þ (0.040) �0.037 (0.032)
Cohort size �0.042* (0.019) �0.000 (0.025) �0.025 (0.022)
Year dummies included yes yes yes
Age-group dummies included yes yes yes
Relative supply (age) no yes no
Relative supply (experience) no no yes
Number of observations 200 200 200
Notes: Wage regressions also include control for cohort size, five year dummy variables, and two age dummyvariables foryoung and middle age workers. Cohort college share ¼ Dlog(Nac/Na). Cohort size ¼ Dlog(Nact/Nct). Relative supply in col-umn (2) is defined as Naet* ¼f1/9*(Na-2,etþ2*Na-1,etþ3*Naetþ2*Naþ1,etþNaþ2,et)g/Nat where e refers to the education grouphigh school dropouts, high school graduates, or college graduates. Relative supply in column (3) is Nxet/Nxt where x refers toyears of potential experience rather than age. (*) denotes significance at 5% level. (þ) denotes significance at 10% level.Source: 1940–1990 Census PUMS (1% sample).The sample includes 25–64 year-old men who were working during thesurvey week.
312 ECONOMIC INQUIRY

graduates. Relative supply changes contrib-uted a decline of 3.3% and changes in collegeshare contributed a decline of 1%. We concludefrom Table 2 that the cohort college share vari-able (our measure of cohort quality) is onlyweakly related to relative wages of collegegraduates once we control for relative supply.Overall, relative supply and time effects, whichmay reflect aggregate demand changes in favorof college graduates, account for most of thevariation (87%) in college wages.7
It may be useful to compare our re-sults based on aggregate data to microlevelevidence from test score results. Recently,Murnane et al. (1995) reported test resultsfrom two successive cohorts using theNational Longitudinal Survey 1972 and theHigh School and Beyond. They report averageitem-response theory-scaled math scores forcollege graduates and for the entire samplewho finished high school. They find that be-tween those two cohorts the college versusoverall test score differential increased 1.39points, implying an increase in the average
ability of college graduates between thesetwo cohorts. Because the share of the cohortwho attended college fell during this period,this is consistent with a negative relationshipbetween size and average ability. Accordingto their estimates, a 1-point increase in themath score results in a 0.013 increase in loghourly wages six years after the test. Thisresults in a small predicted increase in the rel-ative wage of college graduates between thesetwo cohorts, generally in line with the smallquality effects we find herein.
Finally, we end with the question we beganwith. What do we think of the enormous in-crease in the share of college graduates overtime? Despite the fact that the cohort qualityeffect we estimate is small, nevertheless thiswould imply a large impact of declining cohortquality on college wage premium over 1940–90 as the share of college graduates increasedfrom 5% in 1940 to 23% in 1990. We believethat this exercise would overstate the impor-tance of cohort quality effects because thekey assumption is that the distribution of abil-ity is fixed over time. If we adopt a more broaddefinition of ability, as accumulated knowl-edge of potential college entrants, it seems veryreasonable that ability would respond tochanges in the demand for college graduatesover the long run. Thus, our theoretical andempirical work may be more appropriatefor examining short-run changes where thedistribution of ability can be described asfixed.
TABLE 3
Effects of Cohort-Specific College Share on Wages of College Graduate Men
(Dependent Variable ¼ Dlog[Wact/Wat])
Workers Aged , 35 Workers # 35
(1) (2) (3) (4)
Cohort college share �0.039 (0.057) 0.188þ (0.098) �0.068þ (0.036) �0.075 (0.048)
Relative Supply
, 12 years — 0.222 (0.161) — 0.014 (0.056)
12–15 years — 0.542 — �0.068 (0.040)
16þ years — �0.243 (0.271) — �0.043 (0.048)
Cohort size 0.025 (0.054) 0.094 (0.069) �0.052þ (0.029) �0.037 (0.035)
Year dummies yes yes yes yes
Age dummies no no no no
Relative supply (age) no yes no yes
Number of observations 50 50 150 150
Source: 1940–90 Census PUMS (1% sample). The sample includes 25–64-year-old men who were working during thesurvey week.
7. Recently, a number of papers have examinedwhether the recent increase in the college premium wasdue to rising returns to raw ability rather than skillsacquired in college. See, for example, Blackburn andNeumark (1993), Chay and Lee (1997), Cawley et al.(1998). Although this is an important question in itsown right, our focus in this article is on wage effectsdue to changes in ability composition rather than changingreturns. In our empirical work, both increases in returns toability and college skills are captured by the aggregate timeeffects reported.
JUHN, KIM, & VELLA: EXPANSION OF COLLEGE EDUCATION 313

V. SUMMARY
Using Census data, this article documentsthe enormous increase in educational attain-ment of men and women in the United Statesduring the 1940–90 period. The article exam-ines whether the increase in number of collegegraduates lead to a decline in the average qual-ity of college graduates and consequently af-fected their relative wages. We find someweak evidence that college graduates frommore educated cohorts receive a smaller col-lege premium, holding constant other factorsthat also affect relative wages.8 These qualityeffects, however, appear to be small relative tothe effects of demand and supply shocks andappear to have played only a minor in therecent fluctuations in the college premium.
APPENDIX
In this section, we consider changes in the distributionof borrowing costs, r. For simplicity of presentation, weassume that the distributions of r and k are orthogonal.Under that assumption, the joint density h(r, k) can bewritten as a product of marginal densities, g(rjd)f(k). Hered is the shift parameter specific to the density of interestrate, g(.). A change in d induces changes in the numberof college entrants and their average ability as thefollowing:
@N=@d ¼ð�r0
ð1k*f ðkÞdk
� �@g=@d dr
¼ð�r0
NðrÞ @g=@d dr
@EcðkÞ=@d ¼ 1=N
ð�r0
ð1k*ðk� Ec½k�Þf ðkÞdk
� �
� @g=@d dr:
ðA� 1Þ
In this expression, N(r) is the number of college entrantsfacing the interest rate r and decreases with r. The impacton the number of college entrants depends on the corre-lation between N(r) and @g/@d. Relaxation of borrowingconstraints will tend to make @g/@d positive at low r andnegative at high r, and thus the number of college entrantswill increase given such change in the distribution of r.
The impact on average ability depends on the correla-tion between
Ðk* (k � Ec[k])f(k)dk and @g/@d. As Ec(k) is
the weighted average ofÐk* kf(k)dk where the weights are
g(rjd), the integral must have a negative value at low r anda positive value at high r. As a result, the integral mustincrease with r initially. But at high r, it may start to de-
cline as k* may exceed Ec(k). Consequently,Ðk* (k �
Ec[k])f(k)dk has an inverted U shape and the impact onaverage ability may vary with the extent of relaxationin borrowing constraints.
A general relaxation in borrowing constraints may beparameterized as positive values of @g/@d at low r and neg-ative values of @g/@d at high r. This is described in the leftpanel of Figure A-1. In this case,
Ðk* (k� Ec[k])f(k)dk � @g/
@d tends to have a negative value, and as a result, the av-erage ability tends to decline.
When the relaxation is of a very limited scope, the av-erage ability may increase. This case is described in theright panel of Figure A-1. Suppose the borrowing con-straints are relaxed only for those with extremely high in-terest rates. Then @g/@d will be negative at such highinterest rates, and it will be positive at slightly lower inter-est rates. If this change in the density g(rjd) occurs whereÐk* (k � Ec[k])f(k)dk decreases, a higher value of
Ðk* (k �
Ec[k])f(k)dk is multiplied with positive @g/@d and a lowervalue of
Ðk* (k � Ec[k])f(k)dk is multiplied with negative
@g/@d. Consequently, the average ability may increase.The intuition behind these results is quite simple. The
change in average ability depends on those newly enteringcollege. In the first case, the change in density is assumedto induce more college enrollment among those who havefaced relatively low interest rates. At the margin thoseindividuals at low interest rates are less able individualsand their entry decreases average ability. In the secondcase, the change in density induces actions only at highinterest rates.
REFERENCES
Autor, D., L. Katz, and A. Krueger. ‘‘Computing Inequal-ity: Have Computers Changed the Labor Market?’’Quarterly Journal of Economics, 113(4), 1998, 1169–214.
Becker, G. Human Capital and the Personal Distribution ofIncome. Ann Arbor: University of Michigan Press,1967.
Berger, M. ‘‘The Effect of Cohort Size on EarningsGrowth: A Re-Examination of the Evidence.’’ Jour-nal of Political Economy, 93(3), 1985, 561–73.
Blackburn, M., and D. Neumark. ‘‘Omitted-Ability Biasand the Increase in the Return to Schooling.’’ Journalof Labor Economics, 11(3), 1993, 521–44.
Cameron, S., and J. Heckman. ‘‘Life Cycle Schooling andDynamic Selection Bias: Models and Evidence for
FIGURE A1
8. In earlier versions, we also examined the occupationdistribution of college graduates from different birthcohorts. We found some evidence, particularly in the morerecent data, that college graduates from more educatedcohorts were less likely to be working in the most skilledoccupations, where occupations are ranked based on theaverage wage in the occupation. These results are availableon request from the authors.
314 ECONOMIC INQUIRY

Five Cohorts of American Males.’’ Journal of Polit-ical Economy, 106(2), 1998, 262–333.
Cameron, S., and C. Taber. ‘‘Borrowing Constraints andthe Returns to Schooling.’’ Manuscript, Northwest-ern University, 2000.
Card, D. ‘‘Earnings, Schooling, and Ability Revisited.’’National Bureau of Economic Research WorkingPaper No. 4832, 1994.
Card, D., and T. Lemieux. ‘‘Can Falling Supply Explainthe Rising Return to College for Younger Men? ACohort-Based Analysis.’’ National Bureau of Eco-nomic Research Working Paper No. 7655, 2000.
Cawley, J., J. Heckman, and E. Vytlacil. ‘‘Cognitive Abil-ity and the Rising Return to Education.’’ NationalBureau of Economic Research Working Paper No.6388, 1998.
Chay, K., and D. Lee. ‘‘Changes in Relative Wages in the1980s: Returns to the Observed and UnobservedSkills and Black-White Wage Differentials.’’ Manu-script,University of California–Berkeley, 1997.
Katz, L., and K. M. Murphy. ‘‘Changes in RelativeWages:1963–1987: Supply and Demand Factors.’’Quarterly Journal of Economics, 107(1), 1992, 35–78.
Lang, K. ‘‘Ability Bias, Discount Rate Bias, and theReturn to Education.’’ Manuscript, Boston Univer-sity, 1994.
Murnane, R., J. Willett, and F. Levy. ‘‘The Growing Im-portance of Cognitive Skills in Wage Determina-tion.’’ Review of Economics and Statistics, 77(2),1995, 251–66.
Murphy, K. M., and F. Welch. ‘‘The Structure of Wages.’’Quarterly Journal of Economics, 107(1), 1992, 285–326.
Rosen, S. ‘‘Human Capital: Relations between Educationand Earnings,’’ in Frontiers of Quantitative Econom-ics, edited by M. Intriligator. Amsterdam: NorthHolland, 1977.
Rosenbaum, D. ‘‘Ability, Educational Ranks, and LaborMarket Trends: The Effect of Shifts in the Skill Com-position of Educational Groups.’’ Manuscript, Uni-versity of North Carolina–Greensboro, 1999.
Taubman, P., and T. Wales. Mental Ability and Higher Ed-ucational Attainment in the Twentieth Century. Ber-keley: National Bureau of Economic Research andCarnegie Commission on Higher Education, 1972.
Topel, R. ‘‘Factor Proportions and Relative Wages: TheSupply-Side Determinants of Wage Inequality.’’Journal of Economic Perspectives, 11(2), 1997, 55–74.
Welch, F. ‘‘Effects of Cohort Size on Earnings: the BabyBoom Babies’ Financial Bust.’’ Journal of PoliticalEconomy, 87(5), 1979, S65–S97.
Willis, R., and S. Rosen. ‘‘Education and Self-Selection.’’Journal of Political Economy, 87(5), 1979, S7–S36.
JUHN, KIM, & VELLA: EXPANSION OF COLLEGE EDUCATION 315