the family - whoapps.who.int/iris/bitstream/10665/40336/1/16937_eng.pdf · relations with the...
TRANSCRIPT

"
HEALTH ,~~
AND
THE FAMILY
STUDIES ON THE DEMOGRAPHY
OF FAMILY LIFE CYCLES AND
THEIR HEALTH IMPLICATIONS
WORLD HEALTH ORGANIZATION GENEVA
1978

HEALTH AND THE FAMILY
STUDIES ON THE DEMOGRAPHY OF FAMILY LIFE CYCLES AND
THEIR HEALTH IMPLICATIONS
(.) ~
~iP'I . ,,-
WORLD HEALTH ORGANIZATION
GENEVA, 1978

- 2 -
The designation employed and the presentation of the material in this pUblication do not imply the expression of any opinion whatsoever on the part of the Secretariat of the WOrld Health Organization concerning the legal status of any country, territory, city or area or of its authorities, or concerning the delimjtation of its frontiers or boundaries.
The statistics which relate to the Federal Republic of Germany and the German Democratic Republic include the relevant statistics regarding Berlin for which separate data have not been supplied. This is without prejudice to any question of status which may be involved.
Where the designation "country or area" appears in the headings of tables, it covers countries, territories, cities or areas.
Signed articles express the op1n10ns of the authors and do not necessarily represent the findings or policy of the WOrld Health Organization.
- 3 -
HEALTH AND THE FAMTI.Y: STUDIES ON THE
DEl'ilOGRAPHY OF FAMTI.Y LIFE CYCLES
AND THEIR HEALTH IMPLICATIONS
Contt!!nts
I Introduction, by H. Hansluwka •.•................•..•...•....... 5
II The Family as a Unit in Health Studies, by L. Herberger, P. J. M. McEwan •.....•...•.....•.•..........••..•..•..•..•...•• 7
III The Normative Life Cycle of the Nuclear Family, by H. Browning, L. Herberger •..........................•...............•...•• 13
IV Contemporary Demographic Patterns, by L. Herberger •...... .....• 21
V Variations and Exceptions, by P.J.M. McEwan ••.....•......•..•.• 72
VI The Historical Dimension, by H. Browning •.. ...... ...........••• 97
VII Conclusions, by H. Hansluwka •........•.....•.........•.......•• 118
Annex I. Quality of demographic data for the countries included in the Study •. . . . . . . . . . . . . . . . . . . . . . . . . . . . . . . . . • . . . . . . • • 124
Annex II. Tables with basic calculations •...............•.........•• 126
Annex III. Selected bibliography •..........•............•..........•• 151


- 5 -
CHAPTER I
INTRODUCTION
Throughout human history, the family has assumed a key role as the basic socio-biological institution. Despite a distinct loss of functions in developed countries, as a result of industrialization, modernization and the social changes associated with these processes, the family has displayed a remarkable resilience and ability to adjust. It is still, and universally, in the context of the family that reproduction, socialization patterns and the organization of roles and relations with the community are, to a greater or lesser extent, determined.
Recently, the family has received increasing attention as a focal point for administrative decisions and behavioural research. Many disciplines (e.g., history, anthropology, SOCiology, and economics) have become involved in the study of the interrelationships between the family and SOCiety, and particular emphasis has been placed on examining the effects of social change on the family as well as the contribution and responsiveness of the family to social transformation.
Despite awareness of the importance of the family unit for personal health conditions and the health care system, the family has, until recently, been infrequently studied from the public health point of view. The complex interrelationships between health and the family constitute an area where the gaps in knowledge are sUbstantial and where the integration of research findings into a coherent family-based theory is only just ?eginning. To a certain extent, the lack of information is due to inadequacies in existing data collection systems, exacerbated by ambiguities in terminology and methodological problems. The data collected often tell next to nothing about family settings.
As family patterns and changes play a determining part in the health of the individual members and their utilization of health services, so health contributes Significantly to changes in family organization, attitudes and responses to change. In the present era of rapid transition from traditional societal patterns and organizational forms to modernization, there is an almost universal tendency towards the nuclear, small family. This has important implications for the reorientation and adaptation of the health care system.
The effects of modern mortality patterns on the indiVidual, the family, and society as a whole have been too little explored. Changes in mortality rates have affected the various stages of the family life cycle as well as altering attitudes and behavioural patterns. It is the adaptation within the family to new mortality patterns which has, without doubt, contributed significantly to the lowering of fertility. Both lowered mortality and lowered fertility have led to changes in family size and in the timing and duration of the various phases of the family life cycle, with ensuing social (including public health) implications.
The family is now a focus of research interest as a precipitating, predisposing and contributory factor in the etiology, care and treatment of both physical and mental illness.

- 6 -
This development has been reflected within WHO by the setting up of the Division of Family Health, and the gradual development - largely supported by generous contributions from UNFPA - of a programme of action, as well as theoryoriented research, on the dynamics of the interrelationship between health and the family. Areas of family functioning have been identified and the concept of the family life cycle, its implications for health, and a health service strategy have been developed as part of an all out effort to describe more precisely the links between family functions and health service requirements.
The publication of Health and the Family - Studies on the Demography of Family Life Cycles and their Health Implications constitutes the first step in an on-going research programme on the family, family size and structure, the life cycle of the family and its relevance for health policy and strategy.
Changes in mortality affect to some degree the timing and length of all stages in the development of the family, from marriage and childbearing, through adulthood of children, to widowhood and eventual death of the surviving spouse. In some developing countries, mortality is experiencing a rapid decline; others are about to enter this phase. A systematic analysis of the specific effects of mortality trends on the family, making full use of available national data and recent progress in the application of models for furthering the understapding of basic processes, would contribute information essential for planning national strategy in the field of family planning as well as with regard to health planning specific to the needs of families. In these studies, an attempt is made to relate mortality rates to other factors (e.g. nuptiality and divorce) which affect families in order to assess the influence of changing mortality on the family.
The studies published in this volume are the result of a collaborative effort in which Professor H. Browning, Director, Population Research Center, The University of Texas at Austin, Professor P.J.M. McEwan, Editor-in-Chief, Social Science and Medicine, Ballater, Aberdeenshire, UK, and Professor L. Herberger, Chief of SubDivision of Population Censuses and Household and Family StatistiCS, Federal Statistics Office, Wiesbaden, Federal Republic of Germany, participated and which was coordinated by Dr H. Hansluwka, Chief Statistician, Dissemination of Statistical Information, World Health Organization, Geneva.
- 7 -
CHAPTER II
THE FAMILY AS A UNIT IN HEALTH STUDIES
Man is a social being whose formative development occupies the first twenty years of his life. The most important as well as the earliest social groupinE to which man belongs is tre family. It is in tie family environment that young men and women, from infancy through childhood and adolescence to adulthood, develop physically, psychologically and socially. The richness of the harvest of life largely depends upon the quality of the sowing in the broad acres of family life. Just as the individual passes through phases of growth from passive receptivity through active independence to ultimate decay so the family demonstrates variations in structure and function through time. Together these constitute tre family life cycle.
The concept of family health invokes the recognition that the well-being of an individual even in his physical, organic part is profoundly affected by the primary social group which is the family.
Life within a family is an inter-active, dynamic process, the individual and the group constantly reacting in covert and in overt ways. The significance of family health for medical practice and services has two levels; the first is the simple aggregation of the physical and mental well-being of the family members. This is the most obvious way to consider the concept but it represents only one part. One conceptual step further lies the recognition not only that the physical and mental health states of individual members interact - important and neglected though this may be - but that the quality of the relationship determine and is itself in part determined by the health status of each unit. Thus, in a real sense, the group has a life of its own, with the individuals within it acting as its agents. This complex web of inter-connections influences health and disease just as much as more abstract notions such as happiness and misery.
The physical and mental health of members of a family may be related to that of other members either directly or indirectly. Directly, it may be a characteristic mode of behaviour such as, for example, certain child rearing practises which protect against or facilitate disease; or it may be genetiC, the family providing the necessary link in the causal chain. An example of the indirect relationship would be illness that reduces the efficiency of an individual leading to loss of employment or the closure of a business. This may start a chain reaction within the family which can affect the health of other individuals. Another common example of the indirect relationship is severe emotional strain within the family reverberating with traumatic consequences among all the members.
The recognition that in health as in social life the family operates as a system and that physical causes can produce mental effects (as well as vice versa) lies at the heart of the concept. But to have practical significance it must be acted upon; it is not enough to give verbal acquiescence and to continue, for example, to organise primary health care services or to conduct all general practice as if the individual patient lives and has his being in isolation. There is the need to

- 8 -
translate the awareness into action through the training of medical and para-medical personnel~ the education of the public~ the modification of many existing medical services and the collection of statistical and demographic data to provide the information necessary for practice and research.
For demographic purposes and because the concept of family varies among cultures~ the notion of household is sometimes substituted for that of family. From the health point of view the implications of this substitution are minimal but since socially there is a difference between family and household it is necessary to make this difference explicit. The United Nations describes the family as "Those members of the household who are related~ to a specific degree, through blood~ adoption or marriage ", adding that the degree of relationship used in determining the limits of the family is dependent upon the uses to Which the data are to be put. 1
The United Nations definition of household is as follows: "The concept of household is based upon the arrangements made by persons~ individually or in groups~ for providing themselves with food or other essentials for living. A household may be either: (a) a one person household, that is, a person who makes provision for his own food or other essentials for living without combining with any other person to form part of a multi-person household, or (b) a multi-person household, that is~ a group of two or more persons who make common provision for food or other essentials for living. The persons in the group may pool their incomes and have a common budget to a greater or lesser extent; they may be related or unrelated persons or a combination of both."! When the term household is used in family health studies this is intended to refer only to multi-person households.
It should be noted that whereas a family cannot comprise more than one household~ a household can comprise more than one family. It will be noticed that the family's scope and influence, and its implications are far greater than those of the household. Behavioural scientists emphasize the interactional~ constitutional~ functional and social psychological aspects of the family.' The family is the prinCiple mediating agent between the individual and his society. By its teachings the young are socialized into the customs, habits, manners~ values and beliefs of their culture.
An encapsulated description of family health might be~ "family health includes, but means more than, the total or sum of the health status of individual members for it takes into account the inter-relations and inter-dependence of the states of physical and mental health of the individuals who live together~ determining and being in part determined by the.effective functioning of the family (household or group) as a biological and social unit within a cultural setting."4
The family varies in form but in industrialized societies particularly it is the nuclear family which is the most common~ comprising husband, wife and children. The functions of the family relate to five main areas of activity, though not all activities necessarily apply to all families and their respective salience for any given family will vary according to the stages of the life cycle. These five basic areas are the biological, economic, educational, psychological and sociocultural. In common with most aspects of family life~ these functions are interdependent, not only one upon the other but also upon the mental and physical health of the individual units. For the effective and healthy functioning of the family each of these functional areas carries a number of requirements. The biological functions include the reproduction of the species, the rearing of children~ nutrition~ the maintenance of good health and recreation. The requirements to enable each of these functions to be performed adequately include sound genetiC inheritance~ fertility control~ pre-natal~ post-natal and maternal care~ the

- 9 -
availability of food and knowledge about its uses (good dietary behaviour), sound preventive and primary medical behaviour by family members, companionship, and the care of the elderly.
The economic functions of the family include the provision of the financial resources necessary for the fulfilment of all other functions, the appropriate distribution of these resources and the provision of a measure of financial security for family members. For all these purposes there is the implied need for the necessary skills, opportunities and knowledge and the preparedness of family members to support and assist each other.
Functions of an educational character comprise the inculcation of skills, attitudes and knowledge relating to other functions, the preparation of the young for adult life and the fulfilment of the adult role. For these to be performed satisfactorily, a level of intelligence is necessary as well as the necessary knowledge, skills and experience to develop these attributes in others.
The areas of psychological and socio-cultural functioning are those most commonly associated with the family. With regard to the forme~ the family should provide emotional security, facilitate self-identity, promote the natural development of personality, offer optimal psychological protection and develop the ability to form relationships with people outside the family circle. It will be readily seen that these activities require stable emotional health, common bonds of affection between family members, the ability to tolerate stress and to adapt in situations of crisis. The family units should also be mutually supportive and demonstrate a healthy relationship beyond the immediate family.
The socio-cultural area of family functioning encompasses the socialisation of children, the transfer of values relating to behaviour, tradition, language and the prevailing social mores and the inculcation of a variety of behavioural norms appropriate to all the stages of adult life. These imply the existence within the family of accepted standards, a sensitivity for the varying social needs of children according to their ages, and the acceptance and exemplification of behavioural norms as well as a willingness to explain, defend and understandingly promote them.
The next stage in the analysis of the relationships between the family and health is a consideration of the services needed to care for and promote the functions and requirements that we have identified. The point to be emphasized is less the identification of these services than an appreciation of the way in which they should be designed or modified in relation to family health requirements. With limited financial and human resources modifications have to be achieved gradually, involving a choice of priorities and the selection of goals to be tackled. It is known, for example, that in the poorer countries one half of all deaths are of children below the age of five, and that nutritional problems are greatest among the same age group. In the words of a recent WHO report "under conditions of emerging health services, high birth rate and high death rate provision towards family health care is likely to produce the best returns if it is first directed towards improvement of the environmental conditions and at the same time bring personal services to the care of women of reproductive years and their children to the age of five years. At the same time as the first personal services are being offered an equal priority should be given to measures designed to change environmental health risks by measures suited to local conditions." The priority requirements and the most urgent needs are concerned with maternal and child health including the regulation of fertility, optimum utilization of available food, the promotion of

- 10 -
environmental health, immunization and the control of infectious diseases, and throughout and beyond all of these activities constant health education and the involvement of family members in family care.
We have so far been referring to the general functions and requirements and their related medical services shared by all nuclear families in varying degrees. Subsequent chapters will discuss the relevance of the phases of the family life cycle for health and medical services. Each of these phases or identifiable stages of development produces characteristic crises, events which are liable to create problems of a severity that may affect the health of one or more family member. These are transitional crises and relate to the potentially traumatic role changes involved by, for example, marriage, the birth of the first child, retirement (loss of occupation because of age) and bereavement. There are also non-transitional crises, those life events which, though not directly related to periods in the family life cycle, usually cause such strain on the family group as to constitute a health hazard. The list is a long one and recent studies have attempted to assess their relative importance as contributary factors in specific diseases. The most common (in arbitrary order) are death, unwanted pregnancies, divorce, armed service separation, alcoholism and other addictions, bankruptcies and the enforced institutionalization of a family member. In all crises the family plays a critical role in the alleviation of distress, successful adaptation and healthy rehabilitation.
Our examination of the family variables related to medical care have so far considered family structure and family function but family health connotes more than the aggregate health states of the individual members for it also takes account of the effectiveness of family functioning. This is a characteristic for which no satisfactory, valid and reliable measure has so far been developed so that its assessment is dependent upon observation. There are, however, five sets of factors which contribute to the quality of family functioning. First, there is
. the type and extent of cultural patterning, illustrated by the pattern of child rearing employed, dietary behaviour and the social pressures acting upon the group. Second, there is the family type the patterns of role-playing including such matters as how tasks are allocated within the family, whether, for example, they are sex-linked or neutral, the co-ordination of intra-familial roles, whether, for example, they tend to be specific and solitary or joint, that is, the extent to which given tasks and responsibilities are matters for a given individual's attention or are inter-changeable among family members; the distribution of power within the family, whether autocratically deployed or democratically, and the process of decision making, whether hierarchical or balanced across boundaries of sex and generation. The third set of factors are the dynamics of interaction within the family, including patterns of coping behaviour and the quality of personal interaction and mutual concern. The fourth is social class, important in cultures with sharp class distinctions where expectations, obligations and rewards vary greatly. In such cultures it is not only the social class of the family which is important but also such questions as whether or not the group's perceived class corresponds to its externally (real) class, and whether or not there exist perceived or real class differences within the family group and if there are, the form and quality of reconciliation.
,Finally, there are the economic characteristics of the group, bearing in mind the size of the family (itself an important structural variable). There is evidence that the family size is relevant to the capacity to provide internal support in a positive as well as a negative direction. The per capita demand for

- 11 -
services appears to decline with increasing family size up to about six. It should be remembered that families are the primary economic units within which incomes may be pooled. expenditure decisions taken jointly and non-market services rendered internally. As Deeble has written "any assessment of the economic consequences of illness to individuals. particularly income losses. must take account of family and household size and the extent to which incomes and other resources are pooled." More important. household (or family) production may include (a) preventive measures embodied in living standards and practices (housing and sanitary conditions. expenditure on food. clothing. etc.) and (b) curative and supportive services which either complement or substitute for specialized external care. depending on perceptions of need. the relative cost of internal and external care and the household's purchasing power". 5
As with most aspects of the family. there is an inter-dependence between epidemiological. social and economic influences relating to demand for health services. Deeble has tabulated the relationship between predisposing. precipitating and enabling factors (Table II.I).The economic factors are the enabling variables since they determine whether family members are able to use medical services.
Table ILl
The Relationship between Predisposing. Precipitating and Enabling Factors in Health Care
Predisposing
Family size and composition
Culture and ethnic background
Health Beliefs
*
Precipitating
Illness/Accident*
Perception of illness
Missing from original Table but surely relevant.
Enabling
Incomes
Prices
Availabili ty (e.g. supply)
One of the advantages in considering the family as a unit in health studies is that it focuses attention on the significance of demographic statistics for the promotion and maintenance of health. This involves not only a new examination of what is. but also of what should be available. by government censuses and sample surveys. by non-governmental enquiry and by research involving refinements in methodology as well as extensions of data.
Two kinds of demographic variables in health studies may be distinguished according to whether they are primarily concerned with analysis or are to be regarded as health indicators. When used for purposes of analyses. demographic data can be used as baseline data. for deriving data such as mortality and as the so-called "hard" data for studies of family health. Herberger has identified four kinds of variables relevant to family studies.' Individual characteristics such as age and sex. individual characteristics for which a familial context is preconditional such as marital status. family characteristics such as type and size and environmental factors such as geographical region.

- 12 -
It is important to note that for analytical purposes the family does not have to be classified necessarily by its own structural characteristics (e.g. size, type) but may be examined according to the characteristics of its members. The latter use will generally involve cross-classification between individual and familial characteristics so that the unit of tabulation is another important consideration. When any of these kinds of data are available over a period of time equal to at least a normal generation then they may also be used as indicators of change, directionally as well as quantitatively.
The demographic data generally used as indicators of health are mortality rates by age, preferably classified by family characteristics, aspects of reproduction including pregnancy wastage and childlessness, and morbidity rates. All these measures become more useful and have greater meaning when analysed in conjunction with family data. Thus, for example, evidence of morbidity should be related to family structure, whether or not other family members are ill and the extent to which others in the group are specifically affected by the incapacity.
Other indicators of health sometimes used include absenteeism and the premature retirement of both sexes from occupational employment and of women from housework.
It has been shown that when questions of health are seen within the context of the family the approach involves medical, social, economic and demographic variables which will together lead to new insights and a revision in our thinking with regard to all aspects of medical care, from the aetiology of disease and accident to the utilisation of services and health behaviour.

- 13 -
CHAPTER III
THE NORMATIVE LIFE CYCLE OF '!HE NUCLEAR FAMILY
The family within the framework of demographic statistics
Population problems, and social and welfare policies are the main causes for the growing attention the family as a unit has received in recent years in demography and related sciences. This has led to the further development of family statistics at national and international levels; for example, concepts and typologies of families have been developed for use in population censuses and population sample surveys. Household and fertility statistics have also been augmented. In this context, the terms "family", "household" or "family household" cover a wide range of conditions. Short descriptions of these three groups of statistics are given below, to indicate the context in which family statistics are now generally regarded. Together they serve as the basis for developing a basic model of the life cycle of the family.
Family statistics relate to the socio-biological institution of the family. They cover the family in the most restricted sense, namely the group of persons living together and consisting of married couples without children, parents and children, and divorced or widowed persons with or without children. The indication "widowed" or "divorced" is regarded as a constitutive criterion for a special family type as well as never married Single persons living together with a child.
Household statistics cover the socio-economic institution of the private household. They relate to the group of persons who both live together in one household and have a common budget. This group may include persons related to one another, families in the most restricted and in the broadest sense, housemaid, etc. Single persons, who have a dwelling of their own, are also considered as a household. Persons living in institutions in larger groups subject to common rules set b.Y the institution are not covered by the household statistic.
Fertility statistics are calculated on the basis of a question asked to all women, to all women ever married, or to all married women, about the number of children born to them. Fertility statistics do not relate to a group of persons living together as they include, for instance, children not living together with their parents. The concept of the reproductive unit is, therefore, broader than that of family statistics. This is an important feature of fertility statistics.
Household and family statistics usually give information about the structure of the households and families in a country at a given date. Fertility statistics, however, give information about the fertility history of women or the process of family formation up to a given date. Fertility statistics, therefore, cover certain aspects of the family life cycle.
In elaborating a family concept for use in studies of family health, the following conditions should be fulfilled: the concept of family should be clearly distinguished from the concept of the household; it should serve as a basis on which
- 14 -
other concepts of family could be based; and it should be practicable for statistical applications.
These conditions are best met Qy the following United Nations definition: "Family is defined in the narrow sense of a family nucleus, i.e. the persons within a household who are related as husband and wife or as parent and never married child Qy blood or adoption. So a family nucleus comprises a married couple without children or a married couple with one or more never married children of any age or one parent with one or more never married children of any age. A woman (or man) who is living in a household with her own never married child{ren) should be regarded as being in the same family nucleus as the child(ren) even if she is never married and even if she is living in the same household as her parents."l
On the basis of this definition several types of families can be derived. For demographic statistics the following are generally distinguished: 2
- Married couples living together without children; - Married couples living together with children; - Widowed persons living together with children; - Divorced persons living together with children; and - Never married persons living together with children.
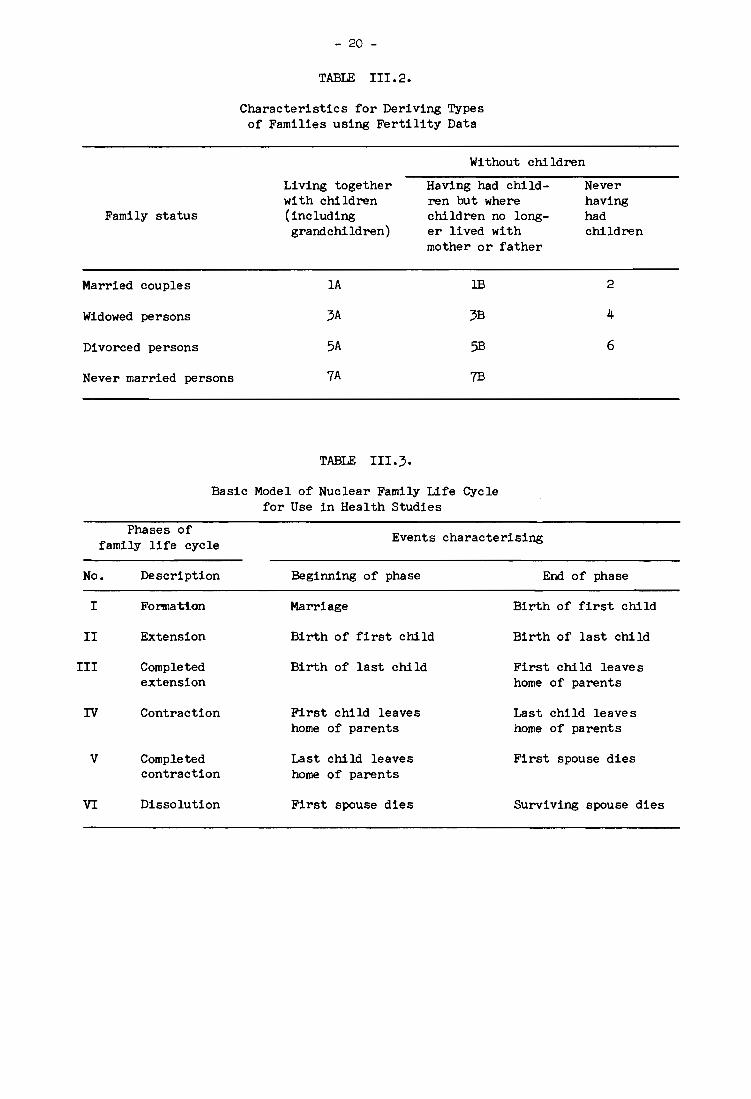
In addition to the family group, it is advisable to take account of "individuals", such as widowers or divorcees, many of whom have been members of a family but who are now living alone. These persons are also of interest in general health and social considerations, in questions and problems of the aged, and in analysis of the family life cycle. The above classification of families can be refined by using fertility data (the family fertility approach). Married couples without children can then be classified by whether or not they have ever had children. The same can be done for individuals who have been members of a family. Where fertility data are available, a distinction can be made between families living with all their Children, with only some, or without children where the children have already left the parents. Further subdivisions of these family types are possible where information about the number of children ever born is available. These subdivisions are of importance in the development of a basic model of the family life cycle. In fact, the collection of the total number of children born alive to ever married women was recommended as a basic topic in the format of 1970 censuses.'
Using fertility data, the family types given in Table 111.2. can be derived. The numbers in the table are an example of a numbering system for these family types.
Family types lA and lB are of predominant importance in forming a basic model of the family life cycle. As Table III.l. shows, in eight selected countries between 7~ and 95~ of families are married couples with and without children. Data for couples who had had children but whose children had left home are not yet available for international comparison. Assuming that at least half of the couples "without Children" belong to this category, it seems that well over 8~ of all couples had had children. It should be remembered that the data in Table III.!. reflect family structures before fertility began to decline.
Using the United Nations definition as the starting point for defining the
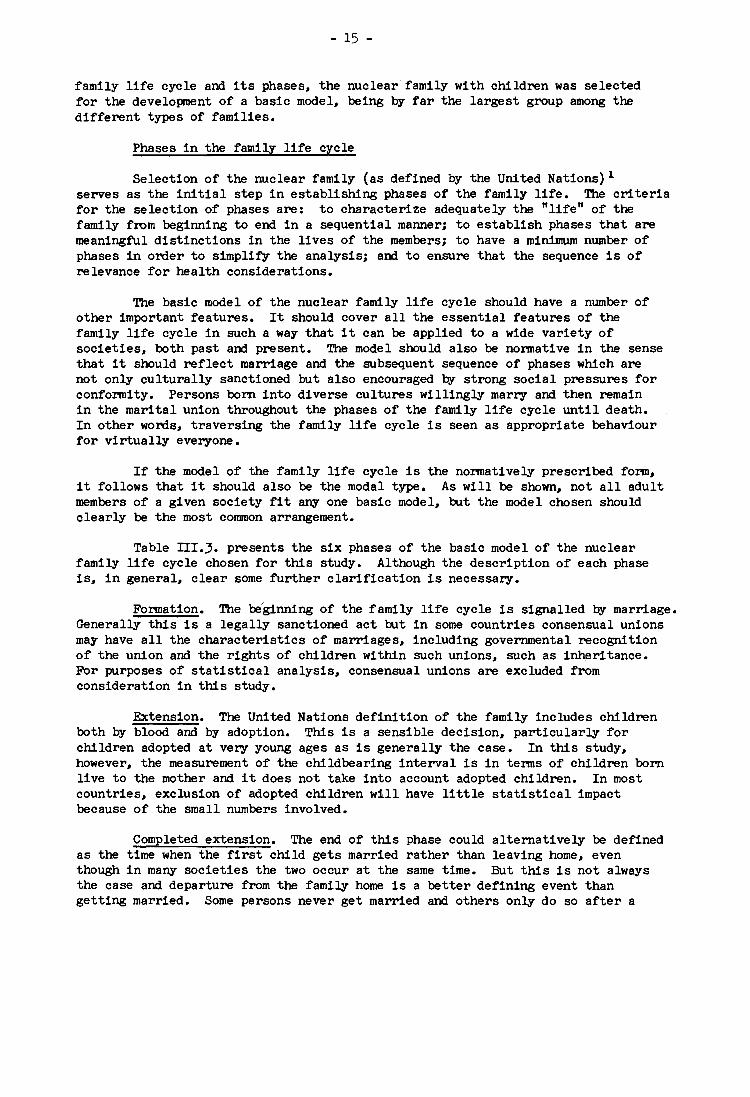
- 15 -
family life cycle and its phases, the nuclear· family with children was selected for the development of a basic model, being by far the largest group among the different types of families.
Phases in the family life cycle
Selection of the nuclear family (as defined Qy the United Nations) 1
serves as the initial step in establishing phases of the family life. The criteria for the selection of phases are: to characterize adequately the "life"' of the family from beginning to end in a sequential manner; to establish phases that are meaningful distinctions in the lives of the members; to have a minimum number of phases in order to simplifY the analysis; and to ensure that the sequence is of relevance for health considerations.
The basic model of the nuclear family life cycle should have a number of other important features. It should cover all the essential features of the family life cycle in such a way that it can be applied to a wide variety of SOCieties, both past and present. The model should also be normative in the sense that it should reflect marriage and the subsequent sequence of phases which are not only culturally sanctioned but also encouraged Qy strong social pressures for conformity. Persons born into diverse cultures willingly marry and then remain in the marital union throughout the phases of the family life cycle until death. In other words, traversing the family life cycle is seen as appropriate behaviour for virtually everyone.
If the model of the family life cycle is the normatively prescribed form, it follows that it should also be the modal type. As will be shown, not all adult members of a given SOCiety fit any one basic model, but the model chosen should clearly be the most common arrangement.
Table III.3. presents the six phases of the basic model of the nuclear family life cycle chosen for this study. Although the description of each phase is, in general, clear some further clarification is necessary.
Formation. The bElginning of the family life cycle is signalled Qy marriage. Generally this is a legally sanctioned act but in some countries consensual unions may have all the characteristics of marriages, including governmental recognition of the union and the rights of children wi thin such unions, such as i~ri tance. For purposes of statistical analysis, consensual unions are excluded from consideration in this study.
Extension. The United Nations definition of the family includes children both Qy blood and by adoption. This is a sensible deCision, particularly for children adopted at very young ages as is generally the case. In this study, however, the measurement of the childbearing interval is in terms of children born live to the mother and it does not take into account adopted children. In most countries, exclusion of adopted children will have little statistical impact because of the small numbers involved.
Completed extension. The end of this phase could alternatively be defined as the time when the first child gets married rather than leaving home, even though in many societies the two occur at the same time. But this is not always the case and departure from the family home is a better defining event than getting married. Some persons never get married and others only do so after a

- 16 -
considerable delay.
The approach to the family life cycle taken in this report is based on the nuclear family, that is, the father and mother and the children born to them. What are the implications of this decision? Many authorities on the family, anthropologists in particular, immediately will call into question the decision to limit the analysis to the nuclear family. They correctly will point out the existence and importance of extended families and the dangers of ignoring them, espeCially in many developing countries. To devote exclusive attention to the nuclear family will introduce an unnecessary parochialism and a "Western" bias to the analysis.
There are a number of considerations that can be brought to bear on this matter. First of all, there is the practical aspect. Even the elaboration of the phases of the nuclear family life cycle is not a Simple matter, since as many as 24 distinct phases have been suggested. Imagine the complexity of trying to do justice to the many age and kinship role relationships that would have to be taken into account in establishing phases appropriate to the extended family. It would be difficult, if not impOSSible, to reach agreement on a sequence of phases to be used for comparative purposes due to the variety of extended family types. Perhaps more important is the basic premise behind the family life cycle approach which is that real families have beginnings and ends. The extended family system often does not have this restriction; in principl~, such families are immortal and, in practice, many do have an existence extending over many generations. Consequently. the mapping of changes in the duration of phases of the family life cycle, a concern of this study, would be difficult to manage with extended families of quite different durations.
There is considerable controversy among authorities in deciding whether nuclear or extended families can even be identified in particular societies (see Zelditch4 for a review of the issues). Much of the debate turns on identifying family type in terms of the various functions it performs for its members. The interest of this report is not in identifying such comprehensive features of family systems but in concentrating on those aspects that are most pertinent to health. From this point of view, the choice of the nuclear family is valid.
There is a further major consideration that justifies the selection of the nuclear family. While there can be no doubt that, in a number of societies, the extended family is very important and indeed is the ideal type, this does not necessarily mean that many actual families in these societies take this form. Burch 5 empirically examined the size of family structures in 64 countries, using census data. His findings indicate that in no SOCiety was the very large residential family the modal form. The United Nations analysis 6 for 114 countries in the period around 1960 found only four countries with an average household size of more than six persons. It was concluded that much of the variation in household size between countries was due to differences in fertility; the average household size for 72 less developed countries was 5.22 persons while for the 42 more developed countries it was 3.54. Thus, however interesting from an ethnographic point of view, exceptions to the universality of the nuclear family are few and they have a negligible demographic impact on global or major regional patterns.
Possibly of more importance than the restriction to nuclear rather than extended families in affecting the number of families excluded from consideration, is the deCision to limit the nuclear family to marriages unbroken by divorce.

- 17 -
In a number of countries, divorce has become a major source of marital dissolution. In other countries, where divorce is not permitted~ separations often effectively end marriage. This outcome of marriage is important~ although it does vary from society to society, a~ does the propensity of the divorced to re-enter marital unions.
The basic model of the nuclear family life cycle (shown in Table III.3.) was elaborated with health considerations in mind. It is of interest to compare this model with other schemes made up for different purposes. Foote, et al.7
constructed a model for a study of family and the housing cycle; a comparison of the two schemes shows that they are virtually the same:
Phases of family life cycle in the basic model and Foote et ale
Phase no.
I
II
III
IV
V
VI
Basic model (Table III.~.)
Formation
Extension
Completed extension
Contraction
Completed contraction
Dissolution
Foote, et a1. 7
Pre-child (constant size)
Child-bearing (expanding size)
Child-rearing (constant size)
Child-launching (declining size)
Postchi1d (constant size)
Widowed
Duva1 8 gives a somewhat more elaborate eight-phase sequence based on the time when the oldest child is found in a particular age category:
- Beginning families (married couples without children) - Child-bearing families (oldest child under 30 months) - Families with preschool children (oldest child 30 months to
6 years) - Families with school children (oldest child 6 to 13 years) - Families with teen-agers (oldest child 13 to 20 years) - Families as "launching centres" (from the time first child
leaves until the last is gone) - Families in the middle years ("empty nest" to retirement) - Aging families (retirement to death of both spouses).
Rodgers 9 elaborated on the changes in status of children by creating new phases when the youngest as well as the oldest child moved into a different category. His scheme includes 24 stages, rather a large number to manage easily in analysis.
other family life cycle schemes could be cited; for a good comprehensive survey see Hill and Rodgers.10 It seems clear that the basic model of the family life cycle for use in health work proposed in this study is fundamentally compatible with other models, often elaborated for different purposes.

TABLE III.l.
Distribution of Family Types in Selected Countries
Family status
Married couples total with ) Without)children
Widowed persons total wi th ) children without)
Divorced persons total with ) children without)
Families/households together total
a
with ) without)children
Austria 1971
1 000
l705d
1 088 617
225e
225
1 930 1 312
617
%
88.4 82.9
11.6 17.1
100 100
b Private households Families with children under 18 years of age
c d Families with children under 16 years of age
Including "consensually married"
Be1guim 1970
1000 %
2 428 75.1
514 15.9
71 2.2
3 233j
100j
Country Finland
1970
1 000
983 722 261
142e
142
1 125 864 261
%
87.4 83.6
12.6 16.4
100 100
e f Single parent with children Man or woman single, widowed or divorced
g Other male or female head of h family
Including "separated"
Gennany, Fed. Rep. of 1961 1970
1 000
13493 8 871 4 622
4 725 1 430 3 295
1 444h 43~
1 OOSh
19 845k
10 92lk 8 924
%
68.0 81.2 51.8
23.8 13.1 36.9
7.3 4.0
11.3
lOOk lOOk 100
1000
14 632 9 376 5 256
5 044 933
4 111
1464h
549h
9l4h
21 2l9~ 10 938 10 282
%
69.0 85.7 51.1
23.8 8.5
40.0
6.9 5.0 8.9
lOOk lOOk 100
i Including 17 700 (0.9%) married persons not living together with their spouse.
j Including 220 000 (6.8%) households of k single persons.
Including unmarried persons with illegit-1 imate children in the family
Including 41 000 (2.1%) unmarried persons with children. m Family nuclei = 17 049 100 persons; the rest are relatives' households.
...... OJ
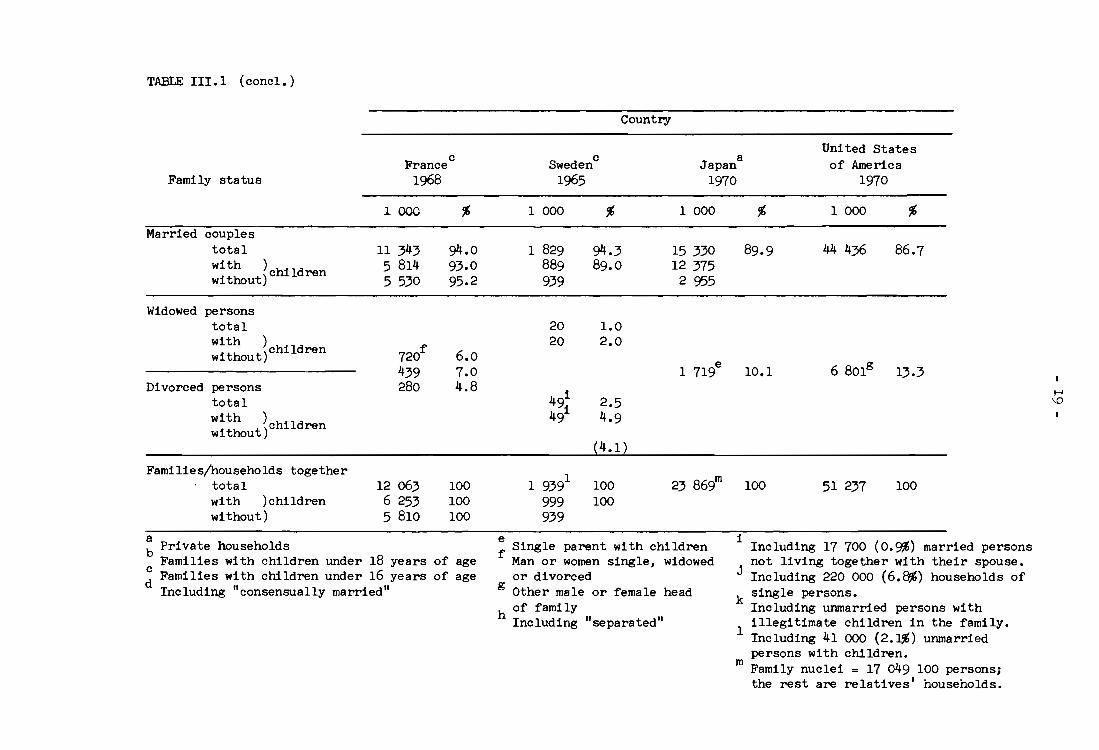
TABLE III.l (concl.)
Family status
Married couples total with ) without) children
Widowed persons total with ) without) children
Divorced persons total with ) without)children
Families/households together total
a
with ) children without)
Francec
1968
1 000
11 343 5 814 5 530
720f 439 280
12 063 6 253 5 810
%
94.0 93.0 95.2
6.0 7.0 4.8
100 100 100
b Private households Families with children under 18 years of age
c d Families with children under 16 years of age
Including "consensually married"
Country
Swedenc
1965
1 000
1 829 889 939
20 20
49i
49i
%
94.3 89.0
1.0 2.0
2.5 4.9
(4.1)
1 9391
100 999 100 939
a Japan 1970
1 000
15 330 12 375
2 955
1 71ge
%
89.9
10.1
23 869m
100
United States of America
1970
1 000 %
44 436 86.7
6 80lg
13.3
51 237 100
e f Single parent with children
Man or women Single, widowed or divorced
i Including 17 700 (0.9,%) married persons
J not living together with their spouse.
g Other male or female head h of family
Including "separated"
Including 220 000 (6.8,%) households of k single persons.
Including unmarried persons with 1 illegitimate children in the family.
Including 41 000 (2.1%) unmarried persons with children.
m Family nuclei = 17 049 100 persons; the rest are relatives' households.
t-' '-D
Family status
Married couples
Widowed persons
Divorced persons
Never married persons
- 20 -
TABlE III. 2.
Characteristics for Deriving Types of Families using Fertility Data
Without children
Living together with children (including grandchildren)
lA
3A
5A
7A
TABlE III.3.
Having had children but where children no longer lived with mother or father
lB
3B
5B
Never having had children
2
4
6
Basic Model of Nuclear Family Life Cycle for Use in Health Studies
Phases of family life cycle
No. Description
I
II
III
IV
v
VI
Formation
Extension
Completed extension
Contraction
Completed contraction
Dissolution
Events characterising
Beginning of phase
Marriage
Birth of first child
Birth of last child
First child leaves home of parents
Last child leaves home of parents
First spouse dies
End of phase
Birth of first child
Birth of last child
First child leaves home of parents
Last child leaves home of parents
First spouse dies
Surviving spouse dies

- 21 -
CHAPTER IV
CONTF)UlORARY DEMOGRAPHIC PA'l'l'ERNS
Selection and quality of data
For the purpose of this study, demographic variables had to be selected which were not only relevant to the different phases of the family life cycle but also for which data were available for a reasonable wide range of countries.
To begin with nineteen variables were selected as follows:
Life expectancy at specified ages for each sex
Infant mortality rates by age and sex
Number of deaths under one year of age by age and sex
Crude marriage rates
Marriages Qy age of bride and by age of groom
Marriages by age of bride classified by age of groom
Marriages by previous marital status of bride classified by previous marital status of groom
Marriages by age and previous marital status of bride and by age and previous marital status of groom
Number of live births by a~e of mother
Number of live births bl a~e of mother and live birth order
Birth rates specific for age of mother
Birth rates by live birth order
Birth rates by live birth order specific for age of mother
Number of still births by age of mother and total birth order
Still birth ratios specific for age of mother and total birth order
Crude divorce rates
Divorces by number of child~n involved
Divorces by duration of marriage
Divorces by duration of marriage classified by age of wife and by age of husband.
Data on the four underlined variables were consequently used to estimate the various phases in the family life cycle. The other demographic variables include information not directly needed for the estimation of the length of the different phases of the family life cycle but may be of some value for a further
- 22 -
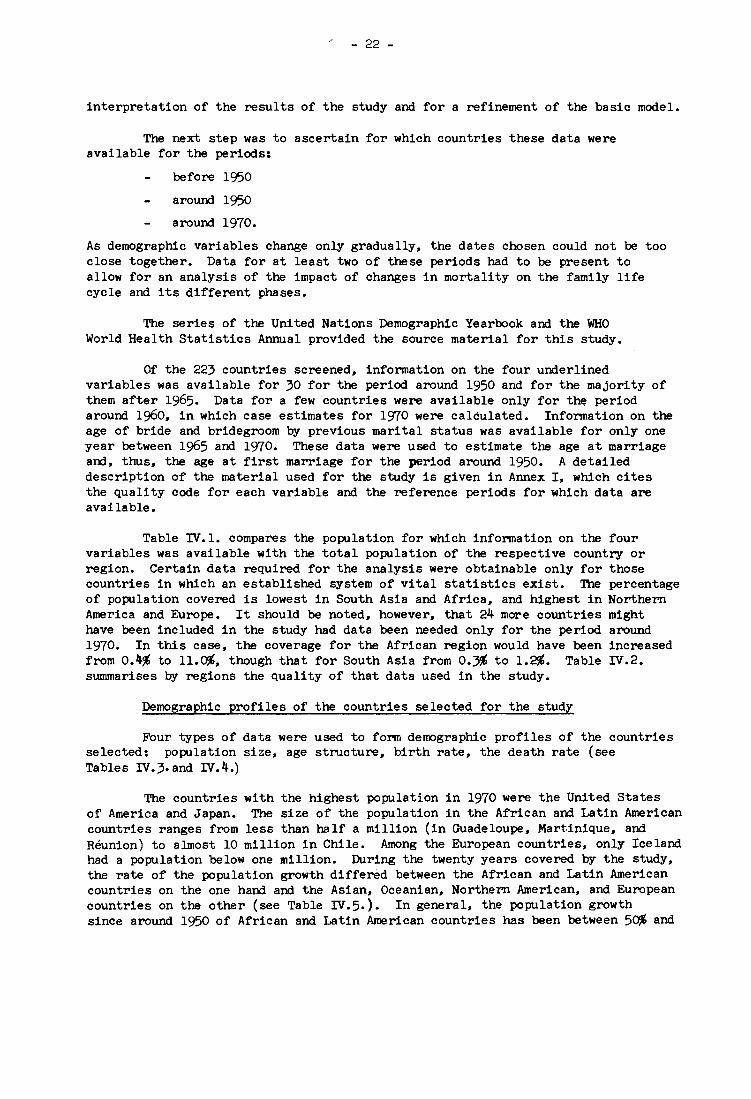
interpretation of the results of the study and for a refinement of the basic model.
The next step was to ascertain for which countries these data were available for the periods:
before 1950
around 1950
around 1970.
As demographic variables change only gradually, the dates chosen could not be too close together. Data for at least two of these periods had to be present to allow for an analysis of the impact of changes in mortality on the family life cycle and its different phases.
The series of the United Nations Demographic Yearbook and the WHO World Health Statistics Annual provided the source material for this study.
Of the 223 countries screened, information on the four underlined variables was available for 30 for the period around 1950 and for the majority of them after 1965. Data for a few countries were available only for the period around 1960, in which case estimates for 1970 were calculated. Information on the age of bride and bridegroom by previous marital status was available for only one year between 1965 and 1970. These data were used to estimate the age at marriage and, thus, the age at first marriage for the period around 1950. A detailed description of the material used for the study is given in Annex I, which cites the quality code for each variable and the reference periods for which data are available.
Table IV.l. compares the population for which information on the four variables was available with the total population of the respective country or region. Certain data required for the analysis were obtainable only for those countries in which an established system of vital statistics exist. The percentage of population covered is lowest in South Asia and Africa, and highest in Northern America and Europe. It should be noted, however, that 24 more countries might have been inCluded in the study had data been needed only for the period around 1970. In this case, the coverage for the African region would have been increased from 0.4% to 11.0%, though that for South Asia from O.~ to 1.2%. Table IV.2. summarises Oy regions the quality of that data used in the study.
Demographic profiles of the countries selected for the study
Four types of data were used to form demographic profiles of the countries selected: population size, age structure, birth rate, the death rate (see Tables IV.3.and IV.4.)
The countries with the highest population in 1970 were the United States of America and Japan. The size of the population in the African and Latin American countries ranges from less than half a million (in Guadeloupe, Martinique, and Reunion) to almost 10 million in Chile. Among the European countries, only Iceland had a population below one million. During the twenty years covered Oy the study, the rate of the population growth differed between the African and Latin American countries on the one hand and the Asian, Oceanian, Northern American, and European countries on the other (see Table IV.5.). In general, the population growth since around 1950 of African and Latin American countries has been between 50% and

- 23 -
10~ whereas that of Asian, Oceanian, Northern American and European countries has been between ~ and 5~. The differences in growth rates may be taken to indicate the stage of demographic evolution of the countries. There are two exceptions to the general pattern: the German Democratic Republic and Israel. The decline in population in the German Democratic Republic and the large rate of population increase in Israel were caused by unusually high emigration and immigration, respectively.
Another important characteristic is the age structure of a population. There are some distinct differences between the countries selected for the study. The proportion of the population under 15 years of age in the Northern American, ASian, European, and Oceanian countries is about two thirds of that of the African and Latin American countries. Furthermore, the proportion is decreasing in most Northern American and European countries, but increasing in most African and Latin American countries. The proportion of the population under 15 years of age should be considered in conjunction with the proportion of the population of over 65 years of age. In the Northern American and European countries, around l~ of the population is over 65 years of age, and this percentage is tending to increase. The proportion in the older age group in the African and Latin American countries is about half of that in Northern America and Europe and it appears to be stable for the period under observation.
In most of the countries, the birth rate and the death rate tend to decrease. Panama is an exception in regard to the birth rate, and seven European countries show a small increase in death rates. It should be noted, however, that the death rates around 1950 in many of the African and Latin American countries were higher than the corresponding rates for countries in the other regions. Around 1950, the highest birth rate in the African and Latin American group of countries was 50.9 (Guatemala), the lowest was 33.3 (Panama); among the Northern American and European countries, the highest was 30.7 (Poland) and the lowest 15.6 (Austria). The few Asian and Oceanian countries included in the study form a more or less intermediate group as compared with the two other groups of countries.
The change of the birth rate in the twenty years under observation was absolutely and relatively greater in the African and Latin American countries than in the other groups of countries. Although the differences in the death rates were not as great as for the birth rates (in all the countries included in the study, the death rate was lower than the birth rate), the relative decrease in some countries was of the same magnitude as for the birth rates.
Around 1950, death rates in the African and Latin American countries ranged between 22.9 (Reunion) and 9.6 (Panama); for the other groups of countries they ranged between 12.8 (France) and 7.5 (Netherlands). Both in absolute and in relative terms, the decrease in death rates among the African and Latin American countries was larger than for countries in the other regions. In general, the trends in death rates were similar to those in birth rates.
Population growth, age structure and its change, birth rate, death rate and the change in these two rates are important demographic variables in describing in general the demographic conditions in a country, as well as the basic changes. The crude birth and death rates used here should be interpreted with caution as their values, ceteris paribus, are influenced b.r other demographic variables. For example, the age structure of the respective population obviously influences both

- 24 -
birth and death rates; information on age structure has, therefore, been included. For the purpose of the study, however, it is not necessary to hold the other variables constant (using the method of standardization) as the purpose is not to analyse the impact of changes of other demographic variables on these rates, but the impact of changes in these rates on the normative life cycle of the family.
The countries included in the study reflect the variety of worldwide demographic conditions and the basic contemporary demographic changes. The study includes countries with population growth as well as those with little or no growth, with low proportions of people under 15 years of age and higher proportions, with high birth and death rates and with low rates. In fact, between the extreme values for each variable, the countries form a continuum of demographic conditions. This has several important implications. It appears that changes in the demographic profiles in the African and Latin American countries go in the direction of the conditions observed in the Northern American and European countries. This means that observations made on the changes of the length of the life cycle of the family and of its different phases for Northern American and European countries may, in the long run, be generally applicable to African and Latin American countries. In addition, it seems probable that changes observed in the last twenty years in the African and Latin American countries would have been observed in Northern America and Europe 50 to 100 years ago.
On the basis of the analysis of the demographic profiles and the above assumptions, it is reasonable to assert that the results of the study reflect basic universal trends caused by the impact of changing mortality on the family life cycle and on its different phases. Hence, it is important to include in the study countries with varying demographic characteristics so that the whole continuum of demographic conditions is covered, rather than to have merely a large number of countries. Demographic history and analysis shows in which direction along the continuum changes are likely to take place. The concept of a continuum of demographic evolution or development is a reflexion of reality; changes do take place gradually over a more or less long period of time. For example, basic trends caused by the impact of changing mortality on the life cycle of the family can be revealed by consideration of countries from different parts of the continuum rather than by examining a cross-section of stages in one country. Similarly, for the analysis of changing mortality, it is necessary to study countries in which mortality has different levels at the beginning and at the end of the period under analysis.
Obviously, the selection of countries was subject to bias. One example of bias is that only countries which have an adequate statistical service could be included in the study, for self-evident reasons. But this bias should not be unduly important as long as the countries chosen are at different stages of demographic development and thus form an unbroken continuum of demographic conditions along which changes can be charted.
Method of estimation
Changing mortality has both direct and an indirect influences on the family life cycle. The direct influences are on the total length of the family life cycle and on the length of its different phases; these will be analysed in the study. One indirect influence is that of survivorship of children on the family structure and, consequently, on the family life cycle and its phases. These

- 25 -
influences could be analysed using different models of family structure and survivorship rates of children. The purpose of the study, however, is to analyse the influence of changes in mortality observed over the last twenty years, using empirical data. Changes in mortality also affect divorce rates (divorces occur not only in younger marriages but also in older ones), and decreasing mortality has increased the duration of marriages. It is not possible to assess accurately the extent to which changes in mortality contribute to changes in other demographic variables, since in general it is difficult to collect the necessary data.
Before discussing details of the method of estimation, a general remark as to the use of the basic model should be made. The basic model could serve two purposes: either as a basis for the estimation of the length of the different phases of the family life cycle in different countries or as a basis for the estimation of the number of families per phase in different countries.
The following analysis will deal with only the first aspect, for countries as a whole. No differentiation by regions of countries, by urban and rural dwelling, or other conditions will be made. The characteristics of the basic model and of the other types of families described above suggest that deviations from the basic model exist. The most important, as can be seen from the typology of families, are:
divorce, which leads to an earlier dissolution of the marriage than in the basic model;
early death of one spouse, which leads to an earlier dissolution of the marriage than in the basic model;
childlessness of a family, which would reduce the number of phases in its life cycle; and
remarriage, which usually does not follow the pattern of the basic model.
The study is based on national averages for the average family. This approach raises some methodological problems but takes account of the availability and quality of the respective data. It should be kept in mind that the purpose of the study is to analyse the changes in the family life cycle caused by changes in mortality for as many countries as possible for a period as long as possible. Shortcomings of the method due to the availability of data and the conditions for the study are of less importance for the estimation of changes in the length of the different phases of the family life cycle, than for the family life cycle as a whole.
As described above, the basic model of the family life cycle starts with marriage and ends with the death of the survivor. The age at first marriage and the life expectancy are therefore the two factors to be used in estimating the total length of the family life cycle, as defined above. As the average age at first marriage of women is usually somewhat lower and the life expectancy usually higher than of men, the life expectancy for women at age of first marriage may be used as an approximation for the total length of the life cycle of the family. Another possibility, where data are available, is to calculate a joint life expectancy for the spouses on the basis of their age at marriage.
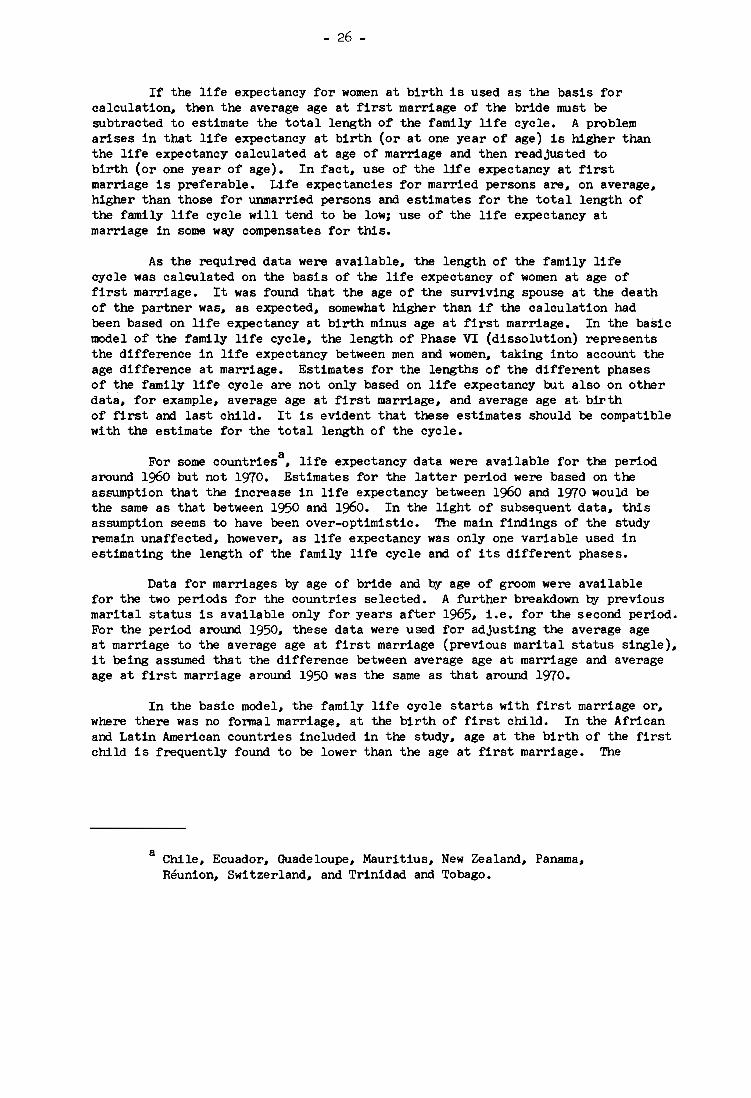
- 26 -
If the life expectancy for women at birth is used as the basis for calculation# then the average age at first marriage of the bride must be subtracted to estimate the total length of the family life cycle. A problem arises in that life expectancy at birth (or at one year of age) is higher than the life expectancy calculated at age of marriage and then readjusted to birth (or one year of age). In fact# use of the life expectancy at first marriage is preferable. Life expectancies for married persons are# on average# higher than those for unmarried persons and estimates for the total length of the family life cycle will tend to be low; use of the life expectancy at marriage in some way compensates for this.
As the required data were available# the length of the family life cycle was calculated on the basis of the life expectancy of women at age of first marriage. It was found that the age of the surviving spouse at the death of the partner was# as expected# somewhat higher than if the calculation had been based on life expectancy at birth minus age at first marriage. In the basic model of the family life cycle# the length of Phase VI (dissolution) represents the difference in life expectancy between men and women# taking into account the age difference at marriage. Estimates for the lengths of the different phases of the family life cycle are not only based on life expectancy but also on other data# for example# average age at first marriage, and average age at· birth of first and last child. It is evident that these estimates should be compatible with the estimate for the total length of the cycle.
a For some countries # life expectancy data were available for the period around 1960 but not 1970. Estimates for the latter period were based on the assumption that the increase in life expectancy between 1960 and 1970 would be the same as that between 1950 and 1960. In the light of subsequent data# this assumption seems to have been over-optimistic. The main findings of the study remain unaffected# however, as life expectancy was only one variable used in estimating the length of the family life cycle and of its different phases.
Data for marriages by age of bride and b.1 age of groom were available for the two periods for the countries selected. A further breakdown b.1 previous marital status is available only for years after 1965, i.e. for the second period. For the period around 1950, these data were used for adjusting the average age at marriage to the average age at first marriage (previous marital status single), it being assumed that the difference between average age at marriage and average age at first marriage around 1950 was the same as that around 1970.
In the basic model, the family life cycle starts with first marriage or, where there was no formal marriage, at the birth of first child. In the African and Latin American countries included in the study, age at the birth of the first child is frequently found to be lower than the age at first marriage. The
a Chile, Ecuador, Guadeloupe, Mauritius, New Zealand, Panama, Reunion, Switzerland, and Trinidad and Tobago.
- 27 -
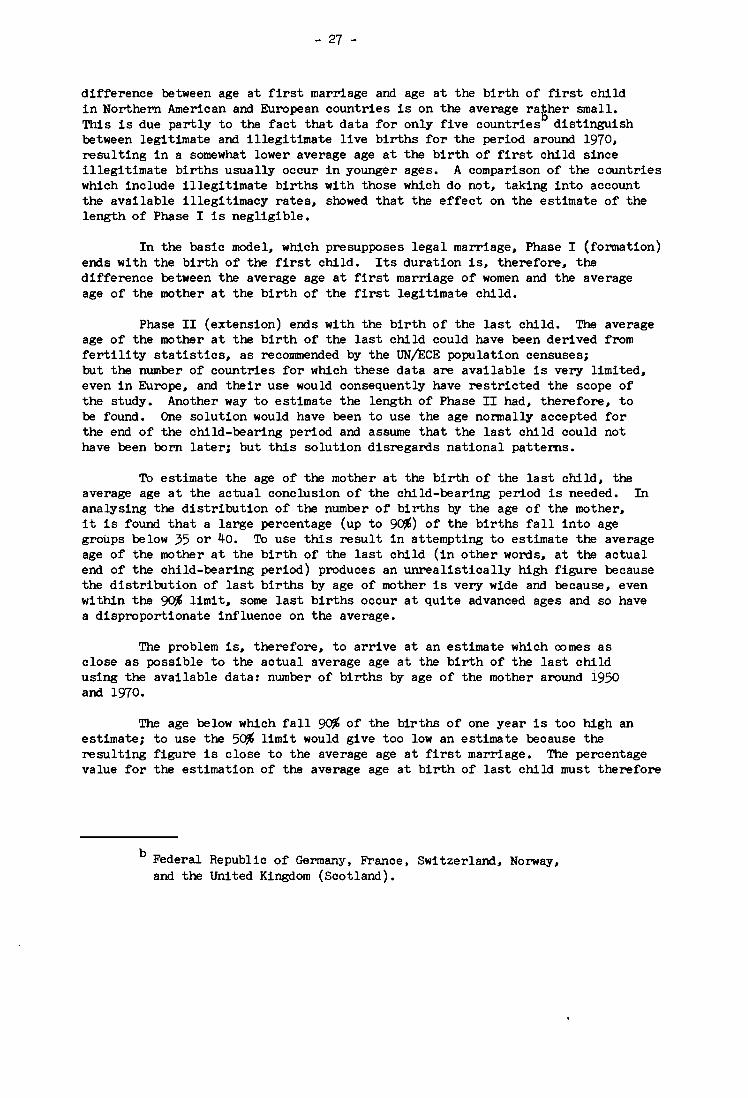
difference between age at first marriage and age at the birth of first child in Northern American and European countries is on the average ra6her small. This is due partly to the fact that data for only five countries distinguish between legitimate and illegitimate live births for the period around 1970, resulting in a somewhat lower average age at the birth of first child since illegitimate births usually occur in younger ages. A comparison of the countries which include illegitimate births with those which do not, taking into account the available illegitimacy rates, showed that the effect on the estimate of the length of Phase I is negligible.
In the basic model, which presupposes legal marriage, Phase I (formation) ends with the birth of the first child. Its duration is, therefore, the difference between the average age at first marriage of women and the average age of the mother at the birth of the first legitimate child.
Phase II (extension) ends with the birth of the last child. The average age of the mother at the birth of the last child could have been derived from fertility statistics, as recommended by the UN/ECE population censuses; but the number of countries for which these data are available is very limited, even in Europe, and their use would consequently have restricted the scope of the study. Another way to estimate the length of Phase II had, therefore, to be found. One solution would have been to use the age normally accepted for the end of the child-bearing period and assume that the last child could not have been born later; but this solution disregards national patterns.
To estimate the age of the mother at the birth of the last child, the average age at the actual conclusion of the child-bearing period is needed. In analysing the distribution of the number of births by the age of the mother, it is found that a large percentage (up to 9~) of the births fall into age groups below 35 or 40. To use this result in attempting to estimate the average age of the mother at the birth of the last child (in other words, at the actual end of the child-bearing period) produces an unrealistically high figure because the distribution of last births by age of mother is very wide and because, even within the 90% limit, some last births occur at quite advanced ages and so have a disproportionate influence on the average.
The problem is, therefore, to arrive at an estimate which comes as close as possible to the actual average age at the birth of the last child using the available data: number of births by age of the mother around i950 and 1970.
The age below which fall 90% of the births of one year is too high an estimate; to use the 5~ limit would give too Iowan estimate because the resulting figure is close to the average age at first marriage. The percentage value for the estimation of the average age at birth of last child must therefore
b Federal Republic of Germany, France, Switzerland, Norway, and the United Kingdom (Scotland).

- 28 -
be below 90% and above 50%. Analysing national studies in which the actual average age at last birth is calculated, and comparing this average with the estimate which would be derived using a value of 75%, it was seen that the use of this limit would give an estimate approximating the actual average age. The relationships between the mean and the median of the distributions of age at birth, and age at first birth also suggest a limit of approximately 75%.
The end of Phase III (completed extension) was estimated to be 18 years after the birth of the first child, since this was considered to be approximately the age from which a child can support itself. Similarly, the end of Phase IV (contraction) was estimated to be 18 years af.ter the birth of the last child.
The data described above are used to estimate the length of the different phases and the age of the spouses at the beginning of the different phases (see Table IV.6.)
The study is based on data for two points in time, with an interval of about twenty years. This raises the basic methodological question of interpretation of the data. The life expectancy tables serve to illustrate this problem: usually they are based on key data statistics but these cross-sectional data are interpreted as longitudinal data because it is assumed that persons, say, thirty years of age will have, five years after the calculation of the life table, the same mortality rate as persons thirty years of age at the time of its calculation. For this study, statistics for two specific periods are used to estimate the length of the family life cycle and its phases, and these crosssectional data.are interpreted as longitudinal ones. As in fertility studies, cohort analysis, the longitudinal approach, is another method of studying the family life cycle and has been used in the United States by Whelpton 1 in relation to fertility aspects of the early phases.
The above-mentioned demographic variables could be influenced by a broad spectrum of social variables (and vice versa), since families live in a given environment or society. Although the aim of the study is not to analyse ways in which social and demographic variables influence each other, brief mention of some of them will be made. The general distinction between the sphere of individuals, families and households, and the sphere of politics, administration and society, and the many interdependences of the two spheres, should be noted.
One group of variables of the sphere of politics etc. might arise from legal provisions, such as laws on divorce arid abortion, retirement regulations, and compulsory school attendance. Other such variables are the degree of urbanization and the housing standards in a country: urbanization implies a certain way of life, and as housing conditions are not uniform in a country, they can be better for some population groups than for others. Variables of the individual sphere are the social characteristics of indiViduals, families or other population groups, e.g., socio-economic class, income level, educational attainment of husband and wife, and employment status of wife. Decisions by individuals about marriage and, if married, about family matters are influenced by the sphere of politics etc. On the other hand, the needs of families can influence this sphere also.
Finally, it should again be stressed that all considerations and computations are based on averages. To keep this in mind is important for the

- 29 -
interpretation of the results of the study.
Possibility of uSing the lOngitudinal approach 2,3
The oldest longitudinal analysis - in the widest sense - in the field of population statistics is the calculation of life tables on the basis of crosssectional surveys in connection with the registration of deaths in vital statistics. A genuine longitudinal approach for the construction of life tables would be the generation approach. The problems and disadvantages of this approach are obvious. The time needed for the calculation of a generation-life-table is that of the life-span of a generation. The method used for the estimation of the length of the family life cycle and its phases is, methodologically, basically the same as for the calculation of life tables. It is the attempt to derive longitudinal data from cross-sectional observations.
The question arises of whether other methods could be applied to analyse the impact of changing mortality on the family life cycle. It is not only a question of the availability of methods but also of the possibility of their application. Cohort analysis is a special form of longitudinal analysis and has been used since the Second World War for fertility studies~,4 The problems and possibilities of the use of cohort analysis in the study of the family life cycle are as follows.
A cohort is, in general, a group of persons or families which is homogeneous in one or more characteristics, such as year of birth, year of marriage, etc. Four types of cohort methodologies can be distinguished, as shown in Table IV.7.
For the purposes of the study of the family life cycle, a genuine cohort would be a group of families, which would be observed over a certain period. The same families remain within the group throughout the period of observation, the number of cases only decreasing by death of all family members or Qy emigration, where such emigration is not followed up.
Non-genuine cohorts are those where a group of families is chosen because of one or more identical characteristics, for example, same year of first marriage in addition to same year of birth of the husband and age difference between husband and wife. In the case of a non-genuine cohort, it is not necessary to investigate the same families, but it is essential to survey families which have the defining characteristics of the cohort.
Using the ex ante approach, a defined group of families is observed from a fixed time onwards, for example, from marriage and through the subsequent life cycle. Normally, ex ante cohorts are genuine cohorts. The variables included in the study can only be changed when the process has come to an end.
Using the ex post approach, a defined group of families is studied after the process to be studied has ended, i.e., the process is analysed retrospectively. The latest possible point for a retrospective study of the life cycle of the family would be the beginning of Phase VI. The length of Phase VI can only be ascertained using the ex ante approach, in that it is necessary to register the death of the surviving spouse.
Ex post cohorts are not subject to changes, for instance, by emigration.

- 30 -
Results using the ex post approach are available much earlier than with the ex ante approach, especially if the process to be studied is long. On the other hand, the ex post approach has its shortcomings, the main problem arising if events to be analysed are not easily remembered.
Considerations of the possibilities and limitations of the cohort approach leads to the conclusion that, under present conditions, a study of the impact of changing mortality on the family life cycle can only be based on an analysis of cross-sectional data. The main reason is that the study should include as many countries as possible from the different regions of the world and from the different phases of demographic evolution. The necessary data, gathered within the framework of official statistics, are unavailable for either the ex ante or the ex post approach; it would thus be necessary to initiate special surveys in many countries. It should be noted that the World Fertility Survey indicated the problems which have to be solved in such large scale international survey operations. In relation to the analysis of the impact of changing mortality on the family life cycle, the question arises as to whether the additional information gained from large-scale ex post or ex ante surveys would justify the costs involved. For the purposes of this study, the crosssectional approach was felt to be adequate.
c Changes in demographic variables
In most of the countries studied, an increase in life expectancy by two years or more was observed in the period between 1950 and 1970 (see Table IV.8.). Although the figures are given separately for the African and Latin American countries, the results for these countries show the same tendency as for the others. Life expectancy is the only variable for which an increase was observed; an increase in this variable means an increase in the total length of the family life cycle. The increase in life expectancy corresponds to the decrease of the crude mortality rate discussed above.
In the same period, the age at first marriage decreased, also contributing to an increase in the total length of the family life cycle. The average age at first marriage decreased by about the same amount for women as well as for men, but from different levels. Details of the changes in these variables are given in Table IV.9. This table gives the increase or decrease in the average age at first marriage for women and men by country. The decrease in the average age at first marriage in most of the African and Latin American countries was from a higher level than in the Northern American and European countries. For the former group of countries, in general, the average age at first marriage for women is higher than the average age at the birth of the first child.
Correlating with this observation was a decrease in the average age at the birth of the first child. In most of the Northern American and European countries, the decrease was of one year or more. To a certain extent, results for the African and Latin American countries were different; the decrease in both the average age at first marriage and the average age at first birth was less than for countries in the other regions, and in some countries there was an increase.
There were no major changes in the length of Phase I, as the time between
cFor the following analysiS calculations were based on years with one decimal point. In the following tables only full years are given on the basis of years of age which had begun, e.g. 25.1 years means the 26th year had begun.

- 31 -
marriage - in countries where a formal marriage exists - and the birth of the first child remained almost constant. The changes in the average age at the birth of the first child are shown in Table IV.IO. A small increase or decrease or no change was observed in most of the African and Latin American countries. In this group of countries, the average age of the mother at the birth of the first child is, in general, lower than in countries of the other regions.
The magnitude of the changes in the average age at birth of the last child was, in general, similar to that observed for the changes in the average age at the birth of the first child (see Table IV.ll). In most of the North American and European countries the decrease was of more than one year. In general, the average age declined from the mid-thirties to the early thirties. The changes in the Latin American and African countries were of less than one year; in about half there was an increase and in the other half a decrease. The estimated average age of the mother at the birth of the last child was, in general, lower in the African and Latin American countries than elsewhere, and no change or a small increase between 1950 and 1970 was observed in all those countries, except Chile. Larger decreases occurred only in the other groups of countries. The observed changes in the average age at the birth of the first and the last child tend to shorten the first four phases of the family life cycle. This, in turn, has the consequence of lengthening Phases VandTI.
d Changes in the total length of the family life cycle
In 1950, the total length of the family life cycle in the thirty countries ranged from 42 to 52 years, and in 1970 from 48 to 56 years (see Table IV.12). On average, the increase in the total length of the family life cycle for most countries was between 3 and 6 years. At this point, the question arises as to what extent the change in the average age at first marriage or at the birth of the first child (where no legal marriage exists) contributed to this increase. Table IV.13 shows both the change in the total length of the family life cycle and the changes in the average age at first marriage. Of four countries, in which the total length of the family life cycle increased by one to three years, two experienced a decrease of one year in the average age at first marriage. Of four countries where there was an increase in the total length of the family life cycle of four years, two experienced a decrease of one year in the average age at first marriage. The increase of five years in the total length of the family life cycle in fifteen countries is coupled with a decrease, in nine of the countries, in average age at first marriage of between three and four years. Disregarding the methodological problems involved in an exact calculation it can be estimated that the decrease in the age at first marriage contributes between one-third and four-fifths to the total increase. In North American and European countries the decrease in the average age at the beginning of the family life cycle contributes more to the increase in the total length of the cycle than the increase in life expectancy.
This result should be considered in the light of the general demographic evolution as described above. The demographic profiles showed that the North American and European countries are in a later demographic phase than the
dFor the following analysis defined as the sum of the length of the different phases. For methodological reasons there are for some countries minor differences to the total length of the family life cycle estimated only on the basis of the life expectancy at the age of first marriage.

- 32 -
African and Latin American countries. This implies that the impact of decreasing mortality on the length of the family life cycle is greater in earlier phases of demographic evolution. About three-quarters of the world population live in countries which are in these earlier phases. Later but overlapping with this influence, the decrease in the average age at first marriage lengthens the family life cycle. As long as mortality is relatively high, a decrease in mortality is the most important factor in lengthening the family life cycle. When mortality is relatively low, a further decrease in mortality is less important to the length of the family life cycle than a decrease or increase in the age at first marriage.
Changes in the different phases of the family life cycle
The increase in life expectancy and the decrease in the average age at first marriage (or at birth of the first child) has led to an increase in the total length of the family life cycle. But changes in one demographic variable seldom occur alone. In general, they lead to changes in other demographic variables, in some cases over a period of time, so that the changing mortality directly and indirectly affects the life cycle of the family in its different phases. In this connection it should be mentioned. that the decrease in infant mortality leads to fewer births per family for a given number of children. This has an influence on the length of Phases II to IV and for Phase V.
In most countries, a decrease was observed in Phase 1/11, from marriage or birth of first child to birth of last child (see Table IV.14). This development can partly be attributed to the decrease in the birth rate. An increase in Phase III (completed extension) of less than two years corresponds to a similar decrease in Phase IV (contraction). In most countries, Phases V (completed contraction) and VI (dissolution) have increased by more than two years.
The magnitude of the changes in the different phases is shown in Table IV.15. The increase in Phase V, for most countries is between 2 and 5 years or more, and in Phase VI up to 3 years. The lengths of the different phases around 1950 and 1970 for the countries included in the study is shown graphically in Figure 1. Phase V is the longest phase, followed by Phase III. In general, the changes between 1950 and 1970 have not altered the relative lengths of the phases.
The changes in the total length of the family life cycle and in the lengths of the different phases are shown graphically in Figure 2. Increase in total length, in general, leads to increases in Phase V and VI, although the increase in Phase VI is not usually as large as that in Phase V. Exceptions to this are Scotland, Finland, German Democratic Republic, Federal Republic of Germany, New Zealand, Netherlands, and Norway, where the increase in Phase VI is somewhat larger than in Phase V. A decrease in Phase VI is observed in El Salvador, Guatemala, Costa Rica, and Panama and in Israel. Table IV.16 gives the increase in years for the total length of the family life cycle and for its different phases.
The changes in the length of Phase 1/11 range from an increase of three to a decrease of four years (see Table IV~7 ). For most of the countries

- 33 -
there was an increase or a decrease of less than one year. The increases occurred mainly in Japan and the African and Latin American countries. As shown in Table IV.lS the age of the women at the beginning of Phase 1/11 in 1950 ranged from 21 years in Trinidad and Tobago to 27 years in the Netherlands, New Zealand, Norway, Scotland and Switzerland. In 1970, the range was from 21 years to 25 years. It is interesting to note that the average age of women at the beginning of Phase 1/11, in general, was lower in the African and Latin American countries than elsewhere. A further decrease is therefore unlikely. Indeed, in some African and Latin American countries, a small increase in the age at the beginning of Phase 1/11 was observed. This is not incompatible with the finding that the length of Phase 1/11 increased in most of the countries in this group b,y about one year; it should be considered in connection with the age at the beginning of Phase III.
The changes in the average age of men at the beginning of Phase 1/11 are also given in Table IV.lS In 1950, the average age ranged from 24 years (Hungary) to 31 years (Reunion). ~ 1970, the average age had decreased. Reunion was still the highest, 30 years, whereas the lowest age (24 years) was found in the United States of America.
Phase III is the completed extension of the family. This phase starts with the birth of the last child and ends when the first child leaves home. It is assumed that, on average, children leave home at IS years of age. As for Phase 1/11, in the majority of countries the changes in the length of Phase III are small and lie between plus and minus one year. Whereas in Northern American and European countries there tends to be an increase in the length of this phase, in the African and Latin American countries the opposite occurs (see Table IV.19). In 1950, the average age of women at the beginning of Phase III ranged from 35 to 30 years as shown in Table IV.20. In some countries, there was a decrease in the length of Phase III but an increase in the average age of the women at the beginning of Phase III. This is explained b,y the fact that the length of Phase III is determined not only by the average age at the birth of the last child but also Qy the average age at the birth of the first child plus 18 years. Two basic demographic developments influence the length of Phase III. One is the decreasing birth rate and the other is the spacing of children. An increase in the age differences between children can compensate for the influence of the decrease of the birth rate on the length of Phase III. The changes in the average age of men at the beginning of Phase III is also shown in Table IV.20.
Phase IV is the phase of contraction in the life cycle of the family. It starts when the first child leaves home and ends when all the children have left home. It was assumed that, on average, Phase IV ends 18 years after the birth of the last child. The length of this phase is, therefore, mainly dependent on the average number of children per family and the average age difference between the children. The average ages of the spouses at the beginning of this phase depend primarily on the average age of the spouses when the first child is born. The average age at first marriage and the length of Phase I (formation) can be disregarded in this context as Phase I is, in general, short. The average ages of the spouses at the end of Phase IV is primarily dependent on the patterns of family extension which determine the length of Phase III. Changes in the basic demographic variables between 1950

- 34 -
and 1970 have, in general, not basically changed the relationship between the length of Phases III and IV combined and the length of Phase V (see Figure 1). In 1950, there were only seven exceptions to this generalization, all among the African and Latin American countries, and, b.r 1970, most of these seven countries had tended towards the norm.
Changes in the length of Phase IV lie mainly between plus and minus one year. In most of the African and Latin American countries, the length of the phase increased b.r one year or remained stable (see Table IV.21 ). For about one third of the countries, there was no change in the length of the phase.
In about two thirds of the countries studied, there was a shift to a lower average age at the beginning of Phase IV (see Table IV.22 ). In 1950, the lowest average age observed for. women was 39 years, the highest, 45 years. Around 1970, the lowest average was still 39 years, and the highest was 44 years. The averages for the men were a few years higher but the direction of changes was the same as for women.
Phase V is the phase of completed contraction. In the basic model it is the phase in which the spouses are alone and all children have left home; the phase starts when the last child has left .home. The length of Phase V is, therefore, determined b.r two factors: the average ages of the spouses at the beginning of the phase, which are influenced b.r patterns of family extensions; and the average age at the end of the phase, which depends primarily on the life expectancy. Changing mortality patterns, therefore, have a direct impact on the length of this phase.
The changes in the length of this phase range from an increase of one year to more than six years (see Table IV.23). No decrease was observed. In about two thirds of the African and Latin American countries, there was an increase of five or more years. About half the other countries experienced an increase of more than four years.
The average ages for women at the beginning of this phase (see Table IV.24 ) ranged, in 1950, from 53 to 48 years and, in 1970, from 54 to 48 years. It should be kept in mind that the average age at the beginning of this phase is primarily dependent on the patterns of family formation and extension. Changes in the previous phases influence the average ages at the beginning of this phase. It is interesting to note that in the majority of the African and Latin American countries there was an increase in the average age for women at the beginning of the phase, whereas for most of the other countries there was a decrease. This was mainly caused by the decreasing birth rate, which leads to an earlier end of Phase II (extension). The changes in the average age for men at the beginning of Phase V tended to differ from those for women. No change was found in most of the African and Latin American countries and most of the other countries experienced a decrease of between one and five years.
Phase VI is the last phase in the life cycle of the family, the phase of dissolution, in which the surviving spouse lives alone. Two factors influence this phase: the age difference between the spouses at the beginning of Phase 1/11 (formation/extension); and the difference in the life expectancy between men and women.
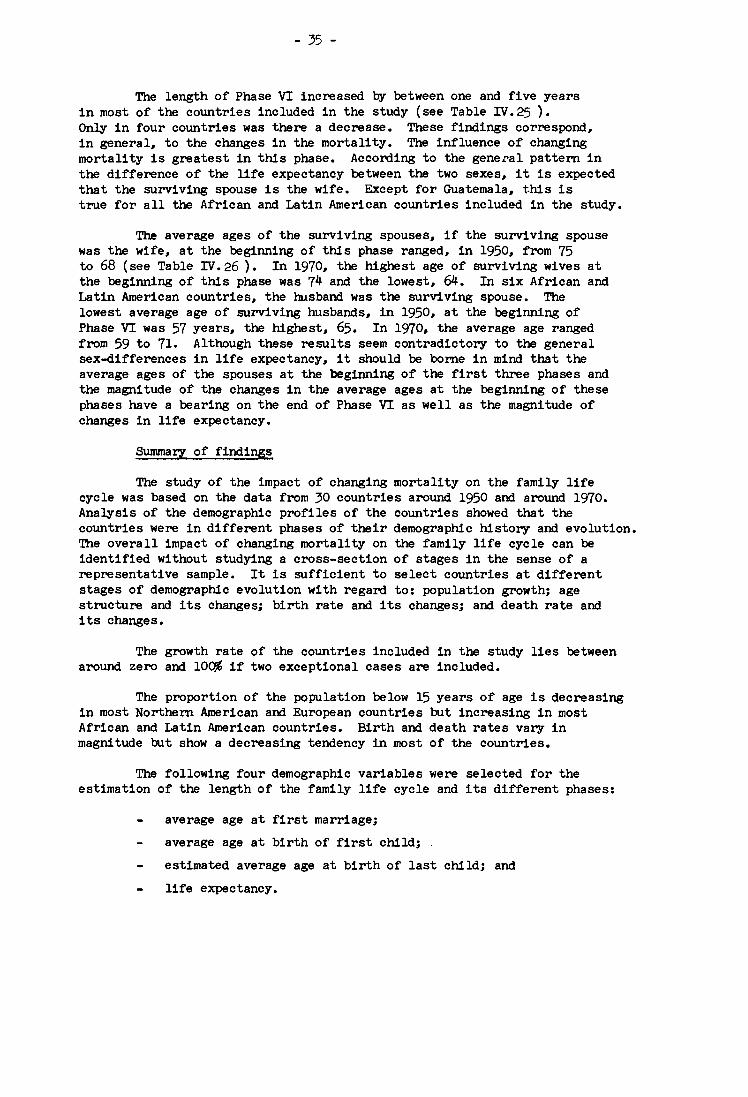
- 35 -
The length of Phase VI increased b,y between one and five years in most of the countries included in the study (see Table IV.25 ). Only in four countries was there a decrease. These findings correspond, in general, to the changes in the mortality. The influence of changing mortality is greatest in this phase. According to the general pattern in the difference of the life expectancy between the two sexes, it is expected that the surviving spouse is the wife. Except for Guatemala, this is true for all the African and Latin American countries included in the study.
The average ages of the surviving spouses, if the surviving spouse was the wife, at the beginning of this phase ranged, in 1950, from 75 to 68 (see Table IV. 26 ). In 1970, the highest age of surviving wives at the beginning of this phase was 74 and the lowest, 64. In six African and Latin American countries, the lUlsband was the surviving spouse. The lowest average age of surviving lUlsbands, in 1950, at the beginning of Phase VI was 57 years, the highest, 65. In 1970, the average age ranged from 59 to 71. Although these results seem contradictory to the general sex-differences in life expectancy, it should be borne in mind that the average ages of the spouses at the beginning of the first three phases and the magnitude of the changes in the average ages at the beginning of these phases have a bearing on the end of Phase VI as well as the magnitude of changes in life expectancy.
Summary of findings
The study of the impact of changing mortality on the family life cycle was based on the data from 30 countries around 1950 and around 1970. Analysis of the demographic profiles of the countries showed that the countries were in different phases of their demographic history and evolution. The overall impact of changing mortality on the family life cycle can be identified without studying a cross-section of stages in the sense of a representative sample. It is sufficient to select countries at different stages of demographic eVolution with regard to: population growth; age structure and its changes; birth rate and its changes; and death rate and its changes.
The growth rate of the countries included in the study lies between around zero and 10~ if two exceptional cases are included.
The proportion of the population below 15 years of age is decreasing in most Northern American and European countries but increasing in most African and Latin American countries. Birth and death rates vary in magnitude but show a decreaSing tendency in most of the countries.
The following four demographic variables were selected for the estimation of the length of the family life cycle and its different phases:
average age at first marriage;
average age at birth of first child;
estimated average age at birth of last child; and
life expectancy.

- 36 -
An increase in the life expectancy was observed for all countries, resulting in an increase in the length of the family life cycle. Parallel to this increase, there was a decrease in the average age at first marriage. also tending to lengthen the family life cycle. The decrease in the average age at first marriage contributed more in Northern American and European countries to the increase in the total length of the family life cycle than the increase in the life expectancy. This result should be seen in the light of the general demographic evolution. The Northern American and European countries are in a later demographic phase than the African and Latin American countries. This leads to the conclusion that the impact of decreasing mortality on the length of the family life cycle is greater in earlier phases of the demographic evolution. Later. but overlapping with the influence of an increasing life expectancy. is the decrease in the average age at first marriage which also tends to lengthen the family life cycle. When mortality is relatively low. a further decrease in mortality is less important for the total length of the family life cycle than a decrease or increase in the age at first marriage.
An analysis of the structure of the family life cycle shows that. in general, Phase V (which begins when the last child leaves home) is the longest phase, followed, for most of the countries studied, by Phase III (completed extension). The changes in the total length of the family life cycle and in the length of its different phases show. in general, that the increase in the total length leads to a relative increase in Phase V and VI but that the increase in Phase VI is not as large as the increase in Phase V.
ay definition, a relationship exists between Phase I/II (formation and extension) and Phase IV (contraction). The fewer children per family, the shorter are Phases I/II and IV and vice versa.

- 37 -
FIG. 1 THE LENGTH OF THE DIFFERENT PHASES OF THE FAMILY LIFE CYCLE 1950/1970
50 50 CANADA ICELAND
70 70
UNITED STATES 50 50
OF AMERICA 70 NORWAY
70
JAPAN 50 U.K.: ENGLAND 50
70 & WALES 70
50 50 ISRAEL
70 U.K.: SCOTLAN 0 70
50 50 AUSTRIA NEW ZEALAND
70 70
50 50 FRANCE
70 MAURITIUS
70
GERMANY, 50 50 FED. REP. OF REUNION
70 70
50 50 NETHERLANDS ECUADOR
70 70
50 50 SWITZERLAND
70 COSTA RICA
70
50 50 PORTUGAL
70 ELSALVADOR
70
GERMAN 50 50 OEM. REP. 70
GUATEMALA 70
50 50 HUNGARY PANAMA
70 70
50 50 POLAND CHILE
70 70
50 GUADELOUPE 50 DENMARK
70 & MARTINIQUE 70
50 TRINIDAD 50 FINLAND & TOBAGO 70 70
I
Years 0 60 Years 0 20 30 40 50 60
WHO 78271

MAURITIUS
GUADELOUPE & MARTINIQUE
TRINIDAD & TOBAGO
SWITZERLAND
JAPAN
CHILE
+
+
+
10
5
o 10
5
o
5
0
<! 5
+ 0
- 38 -
FIG.2a
CHANGES IN TOTAL LENGTH AND THE LENGTHS OF THE DIFFERENT PHASES OF THE FAMILY LIFE CYCLE
DENMARK
ELSALVADDRl
FRANCE
GUATEMALA r
POLAND
PORTUGAL
AUSTRIA
WHO 78273

FINLAND ::f GERMAN +:[ DEM. REP.
GERMANY ::r FED. REP. OF
HUNGARY +:r
NEW ZEALAND +: [
U.K.: ENGLAND + :f & WALES
5
+ NETHERLANDS 0
5
+ NORWAY 0
- 39 -
FIG.2b
CHANGES IN TOTAL LENGTH AND THE LENGTHS OF THE DIFFERENT PHASES OF THE FAMILY LIFE CYCLE
ECUADOR
ICELAND
CANADA
UNITED STATEsf OF AMERICA
COSTA RICA
REUNION
ISRAEL f~"9 PANAMA f-~b~ ... >:«.J»:~~M..~~@9~-
WHO 78272

Region
Africa
Northern America
Latin America
East Asia
South Asia
Europe
Oceania
USSR
TABLE IV.1. a
Availability of Data by Region
a Population (millions)
Number of countries (Estimates of mid-year population in 1971)
In countries In countries For which for which for which
Total data Total data are data are are available available available
for 1950 and 1970 only for 1970
Millions % Millions
58 2 354 1.3 0.4 38.9
5 2 230 228.8 99.5
46 8 291 28.3 9.7 80.2
7 1 946 104.7 11.1 1.0
39 1 1158 3.0 0.3 13.6
39 15 466 273.3 58.6 147.2
28 1 20 2.9 14.5 13.3
1 245
a Source: United Nations Demographic Yearbook, 1971, Tables 1 and 2. (El Salvador is included in the total for Latin America)
%
11.0 +::-0
27.6
0.1
1.2
31.6
66.5

- 41 -
TABLE IV.2.
Quality of the Demographic Data for the Countries or Areas Included in the Study, by Regions
Reference Population Data a Natalityb Nuptialityb
Region Period A B C D A C U C a
around Number of Countries
1950 2 Africa
1970 2
Northern 1950 2
America 1970 2
Latin 1950 7 1
America 1970 7
1950 1
East ~s1a 1970 1
South 1950 1
Asia 1970 1
1950 8 2 Europe
1970 14
1950 1 Oceania
1970 1
apopulation data A Complete census of individuals B Sample survey
2
2
2
2
7 1
1 7 1
1
1
1
1
5 14 1
1 15
1
1
C Partial census or partial registration of individuals D Conjecture A Adjustment by continuous population register
a
2
1
2
2
7
7
1
1
1
1
14
15
1
1
b Quality code used as described in the UN Demographic Yearbook C Civil registration data said to be relatively complete U Civil registration data said to be unreliable (incomplete) The code does not apply to estimated data
U
1
1
1
1
Mortalityb
C U
1 1
2
2
2
3 5
6 2
1
1
1
1
14 1
15
1
1

- 42 -
TABLE IV.3.
Population Size, Age Structure, Birth Rate and Death Rate in Selected Countries, around 1950 and around 1970
Country Age structure (%) or y a Population
ear i Birth Death s ze rate rate area ( thousand s) under 15 15 - 65 over 65
African and Latin American countries
Chile 1950;:;2 6 060 37 59 4 34.0 15.0 1970 9 720 39 56 5 29.6 9.4
Costa Rica 1950 860 43 54 3 46.8 12.2 1960/63 1 737 48 49 3 33.2 6.6
Ecuador 1950 3 231 42 54 4 46.8 17.5 1970 6 093 48 50 3 44.9 11.4
El Salvador 1950 1 859 41 56 3 48.7 14.7 1970/71 3 534 46 50 3 40.0 9.9
Guadeloupe 1950;:;4 206 39 56 5 37.3 14.1 1960/67 327 43 52 5 28.8 7.7
Guatemala 1950 2 805 42 55 3 50.9 21.8 1970 5 189 46 51 3 40.9 14.9
Martinique 1950;:;4 222 38 56 5 38.0 13.5 1960/67 338 43 52 5 27.5 7.6
Mauritius 1950;52 490 40 57 3 49.7 13.9 b 1970/71 836 40 56 4 26.0 7.8
Panama 1950 795 41 55 3 33.3 9.6 1970 1434 44 53 4 37.1 8.8
Reunion 1950;:;4 244 41 56 3 48.1 22.9 1960/67 447 46 51 3 30.2 8.2
Trinidad & 1950 632 40 56 4 40.0 12.1 Tobago 1970 1 026 41 55 4 24.5 6.8
Asian and Oceanian countries
Israel 1950 1 258 30 67 4 34.7 6.9 1970/71 2 910 33 61 7 26.7 11.4
Japan 1950 82 900 35 60 5 28.2 10.9 1970 104 330 24 69 7 18.8 6.9
New Zealand 1950 1 908 28 63 9 25.9 9.5 1970 2 811 32 60 9 22.1 8.8
a If two years are given the first year indicates the year for which the population size is given and the second year indicates the date for which the age structure was available.
b Excluding Panama canal zone

- 43 -
TABLE IV.3. (conc1'd)
Country a Population Age structure (~) Birth Death
or Year size rate rate area (thousands) under 15 15 - 65 over 65
Northern American and European countries
Austria 1950 6 935 23 67 11 15.6 12.4 1970 7 391 24 62 14 15.2 13.4
Canada 1950 13 737 30 63 8 27.1 9.1
c 1970 21320 30 62 8 17.4 7.3 Denmark 19501.51 4 271 26 65 9 18.7 9.2
1970 4 930 23 65 12 14.4 9.8 Finland 1950 4 009 30 63 7 24.5 10.1
1970 4 610 24 67 9 13.8 9.6 France 1950 41 736 22 66 12 20.7 12.8
1970/r1 50 777 25 63 13 16.7 10.7 German
1950 18 388 21 68 11 16.5 11.9 Democratic Republic 1970 17 058 23 61 16 13.9 14.1
Germany. 1950 50 173 24 67 9 16.2 10.5 Fed. Rep. of 1970 60 651 23 64 13 13.4 11.9
Hungary 19501.53 9 338 25 67 8 20.9 11.4 1970 10340 21 68 11 14.7 11.6
Iceland 1950 143 30 62 8 28.7 7.9 1970 204 32 59 9 19.7 7.1
Netherlands 19501.51 10 114 29 63 8 22.7 7.5 1970/rl 13 030 27 63 10 18.3 8.4
Norway 1950 3 265 25 65 10 19.1 9.1 1970 3 879 24 63 13 16.6 10.0
Poland 1950 24 824 30 65 5 30.7 11.6 1970 32 530 26 65 9 16.8 8.2
Portugal 1950 4 694 29 64 7 24.4 12.2 1970 6 190 29 62 9 20.0 10.8
Switzerland 1950;?1 9 338 23 67 10 18.1 10.1 1970 10340 23 65 12 15.8 9.1
United Kingdom England Be 19501.51 43 830 22 67 11 15.9 11.7 Wales 1970 48 988 24 63 13 16.0 11.7 Scotland 1950/51 5 130 25 65 10 18.0 12.5
1970 5 214 26 62 12 16.8 12.2 United States 1950 152 271 28 65 8 32.4 9.6 of America 1970 204 880 28 62 10 18.2 9.4
c Excluding Faroe

- 44 -
TABIE IV.4.
Population Growth and Changes in Age Structure, Birth Rate and Death Rate between around 1950 and 1970.
Change in age structure a Change Country Population
growth in birth
or area under 15 15 - 65 over 65 rate (thousands)
African and Latin American countries
Chile +3 660 +2 -3 +1 -4.4 Costa Rica + 877 +5 -5 0 -13.6 Ecuador +2 862 +6 -4 -1 -1.9 El Salvador +1 675 +5 -6 0 -8.7 Guadeloupe + 121 +4 -4 0 -8.5 Guatemala +2 384 +4 -4 0 -10.0 Martinique + 116 +5 -4 0 -10.5 Mauritius + 346 0 -1 +1 -23.7
Panama b + 639 +3 -2 +1 +3.8
Reunion + 203 +5 -5 0 -17~9 Trinidad &: + 394 +1 -1 0 -15.5
Tobago
Asian and Oceanian countries Israel +1 652 +3 -6 +3 -8.0 Japan +21 430 -11 +9 +2 -9.4 New Zealand + 903 +4 -3 0 -3.8
Northern American and European countries Austria + 456 +1 -5 +3 -0.4 Canada +7 583 0 -1 0 -9.7
Denmarkc + 659 -3 0 +3 -4.3 Finland + 601 -6 +4 +2 -10.7 France +9 041 +3 -3 +1 -4.0 Gennan Demo- -1 330 +2 -7 +5 -2.6 cratic Rep. Gennany, Fed. +10 478 -1 -3 +4 -2.8 Rep. of Hungary +1 002 -4 +1 +3 -6.2 Iceland + 61 +2 -3 +1 -9.0 Netherlands +2 916 -2 0 +2 -4.4 Norway + 614 -1 -2 +3 -2.5 Poland +7 706 -4 0 +4 -13.9 Portugal +1 496 0 -2 +2 -4.4 Switzerland +1 002 0 -2 +2 -2.3 United Kingdom
England &: Wales +5 158 +2 -4 +2 +0.1 Scotland + 84 +1 -3 +2 -1.2
United States +52 609 0 -3 +2 -14.2 of America
Change in death
rate
-5.6 -5.6 -6.1 -4.8 -9.4 -6.9 -6.2 -6.1
-0.8 -14.7 -5.3
+4.5 -4.0 -0.7
+1.0 -1.8
+0.6 -0.5 -2.1 +2.2
+1.4
+0.2 -0.8 +0.9 +0.9 -3.4 -1.4 -1.0
0.0 -0.3 -0.2
a Change in the age structure over the periods given in Table IV.3. expressed in percentage points.
b Excluding Panama canal zone.
c Excluding Faroe

- 45 -
Countries Ranked Qy Rate of Population Growth between around 1950 and around 1970.
Percentage rate of Country populat1Qn growth or area (aI'OUnd 1950 - 1~)
Israel + 131.3 Costa Rica + 102.0 El Salvador + 90.1 Ecuador + 88.6 Guatemala + 85.0 Reunion + 83.2
Panama a 80.4 +
Mauritius + 70.6 Trinidad and + 62.3
Tobago Chile + 60.4 Guadeloupe + 58.7 Canada + 55.2 Martinique + 52.3 New Zealand + 47.3 Iceland + 42.7 United States + 34.5
of America Portugal + 31.9 Poland + 31.0 Netherlands + 28.8 France + 21.7 Germany, Federal + 20.9
Republic of Norway + 18.8
b 15.4 Denmark +
Finland + 15.0 United Kingdom:
England &: Wales + 1l.0 Hungary + lO.7 Switzerland + 10.7 Austria + 6.6 United Kingdom:
Scotland + 1.6 German Democratic 7.2
Republic
a Excluding Panama canal zone
b Excluding Faroe

No.
I
II
III
IV
v
VI
P B U a w a m
TABLE IV.6.
Length of the Phases of the Family Life Cycle
Phases of family life cycle
Description
Fonnation
Extension
Completed extension
Contraction
Completed contraction
Dissolution
Length of Phase
Length
PI B - a = w
PII = U - B
PIlI = (B + 18) - u
PIV u - B
Pv = 1 - (a - a ) - (U + 18) m m w
PVI = (1 - 1 ) + (a - 8 ) W m m w
Average age at birth of first child Average age at birth of last child Average age at first marriage of women
Average age at first marriage of men
Age at
Beginning of phase End of phase
A bI(w/m)
Abllw
AblIm
AblIIw
AbIIIm
AbIVw
AbIVm
AbVw
AbVm
AbVIw
(irxteJiC bl_ ___ _ (imex e)
1 w
=
=
=
=
a(w/m)
B
B + (a - a ) m w
U
U + (a - a ) m w
(B + 18)
(B + 18 + a - a ) m w
(u + 18)
(u + 18 + a - a ) m w
1 - (8 - a ) m m w
AeI AbI(w/m) + PI
AeII{w/m) AbII{w/m) + PII
A = A + P eIII(w/m) bIll (w/m) II
AeIV(w/m) = AbIV + PIV
A eV(w/m)
AeVI{w/m) =
AbV( w/M) + P V
A P bII(w/m) + II
Life expectancy of women
1 = Life expectancy of men m b beginning of respective phase
e = em of respective phase
~ 0\

Cohorts formed as
Genuine cohorts
Non-genuine cohorts
- 47 -
TABIE IV.7.
Methodologies Applied to Cohorts
Time of formation
Beginning of observation period
(ex ante)
A fixed group of families with the same (invariable) characteristics which are important to the study objective are observed over a long period.
For families with same (invariable) characteristics which are important to the study objective, the changes of characteristics are determined within long or short intervals. There is only equality of the invariable characteristics, not of the families. Evaluations are planned at the time of formation of the cohort to take place at the end of the interval.
End of observation period
(ex post)
A fixed group of families with the same characteristics which are important to the study objective are investigated at the end of a period to determine the changes (e.g., family composition) which are to be analyzed. The development to be analyzed has been completed.
For families with the same (invariable) characteristics which are important to the study objective (e.g., year of marriage) changes of characteristics are determined within long or short intervals. There is only equality of invariable characteristics, not of families. Evaluations are made at the end of the. observation period for the time of the observation period.

- 48 -
TABLE IV.8
Number of Countries by Change in the Demographic Variables between 1950 and 1970.
Number of countries or areas
Demographic Quality Increase No Decrease Variable Codea change
two years less than two years less than or more two years or more two years
First marriage C lb 1+3b ll+lb 6+3
b
(age of wife) U/C 2b 1 1
Birth of first C 1+2b 3+6b 12 3+l
b
child (age of wife) U/C lb 1
Birth of last C lb 2b 2+5b
13 4+lb child (age of wife) U/C lb 1
Life expectancy C 20+3b
(wife) U/C 1+3b lb 2b
a See UN Demographic Yearbook, technical notes on statistical tables
b African and Latin American countries

- 49 -TABLE IV.9.
Number of Countries by Average Age at First Marriage
a Average age at first marriage
(years)
o
-1
-2
-3
-4
+1
o
a Average age at first marriage
1950 1970
23
25
23
24
25
31
23
24
25
29 25
26
27
26
27
27
24
25
27
29
27
31
32
34
25
26
23
24
25
31 22
23
24
28
23
24
25
23
24
23
25
26
28
30
27
31 32
34
Men
Number of
countries
1
3
1
2
2
2
Country
Japan
Trinidad & Tobago
Canada, Ecuador, Panama
Guatemala
Portugal, Reunion
Mauritius
Hungary, Israel, United States of America
Costa Rica, Denmark, Iceland
El Salvador, Poland
Guadeloupe & MartiniqueC
France, UK: England & Wales
Austria, Chile, Germany, Federal Republic of
Switzerland
Finland, German Democratic Republic
Netherlands, New Zealand
Norway, UK: Scotland
Hungary
Costa Rica
Japan
Trinidad & Tobago
Ecuador, Panama
Reunion
Guadeloupe & Martinique C
Mauritius
a Average age refers to the upper limit of the appropriate interval.
bAfrican and Latin American countries
cData for Guadeloupe and Martinique combined
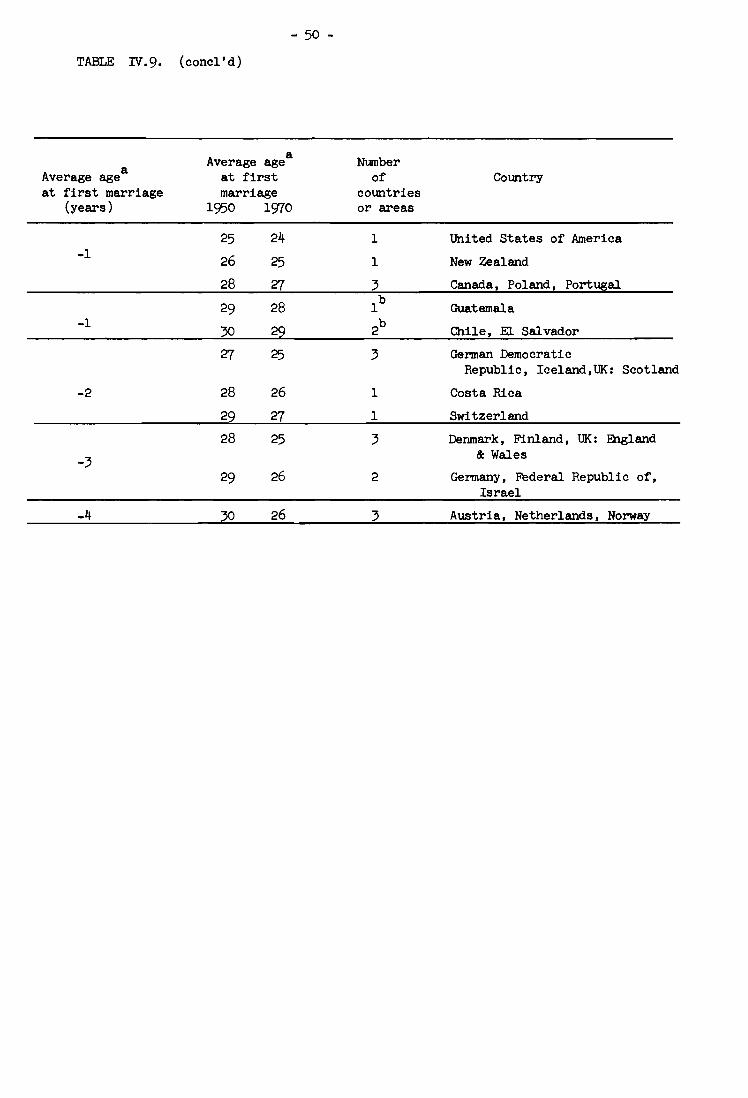
- 50 -
TABLE IV.9. (conc1'd)
Average age a Number Average age a at first of Country at first marriage marriage countries
(years) 1950 1970 or areas
25 24 1 United States of America ... 1 26 25 1 New Zealand
28 27 3 Canada, Poland, Portugal
29 28 1b Guatemala -1
30 22 2b Chile, El Salvador
27 25 3 German Democratic Republic, Ice1and,UK: Scotland
-2 28 26 1 Costa Rica
22 27 1 Switzerland
28 25 3 Denmark, Finland, UK: England
-3 & Wales
29 26 2 Germany, Federal Republic of, Israel
-4 30 26 3 Austria, Netherlands, Norway

- 51 -TABLE IV.IO
Number of Countries b.1 Average Age of Mother at Birth of First Child
Change in a average age
at first birth (years)
+1
o
-1
-2
-3
a Average age Number at first of birth countries
1950 1970 or areas
21
22
25
22
23
24
25
23
24
27
24
25 26
27
27
22
23
26
22
23
24
25
22
23
26
22
23
24
25
24
2
1
3
5
1
2
Country or area
Trinidad & Tobago
Costa Rica
Japan
Mauritius, Panama
Ecuador
Chile, Israel, Poland, Reunion
c Guadeloupe & Martinique , Portugal
El Salvador, Guatemala
German Democratic Republic, United States of America
Germany, Federal Republic of, Switzerland
Iceland
Canada, Denmark, Hungary
Finland, France, New Zealand, UK: England & Wales UK: Scotland
Netherlands
Austria, Norway
a Average age refers to the upper limit of the appropriate interval.
b African and Latin American countries
c Data for Guadeloupe and Martinique combined
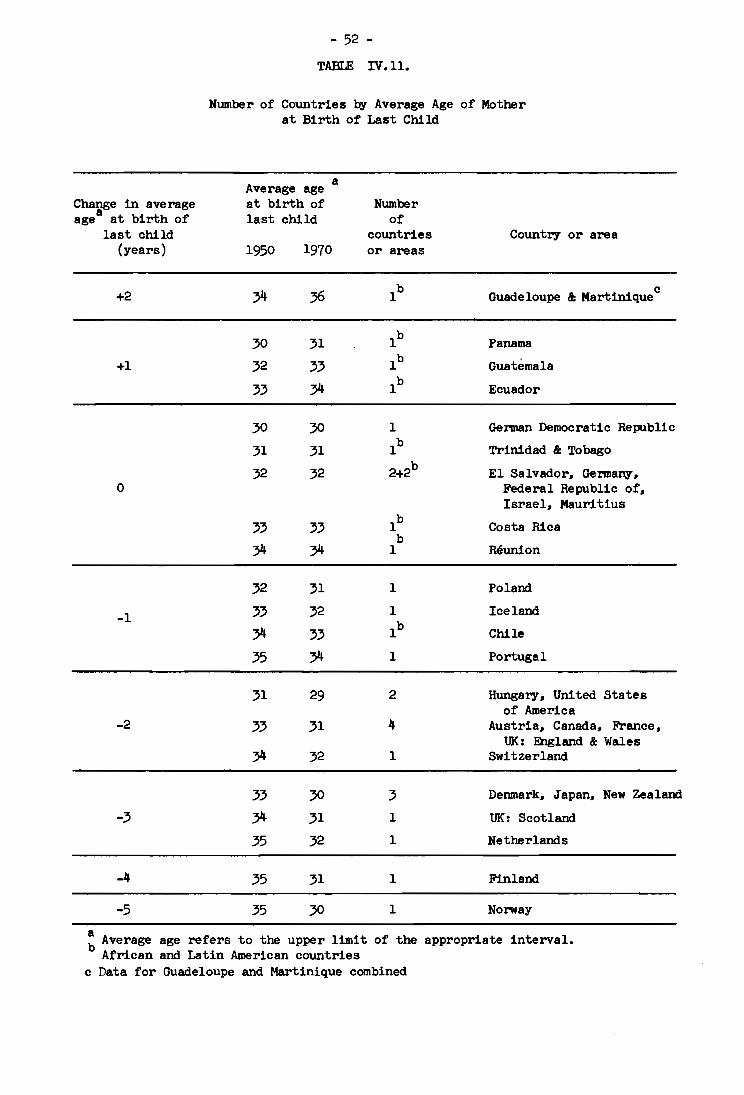
- 52 -
TABLE IV. 11.
Number of Countries by Average Age of Mother at Birth of Last Child
Chagge in average a age at birth of last child
(years)
+2
+1
o
-1
-2
-3
-4
-5
a Average age at birth of last child
1950 1970
30 32
33
30
31
32
33
34
32
33
34 35
31
33
34
33
34 35
35
35
31
33
34
30
31
32
33
34
31
32
33
34
29
31
32
30
31
32
31
30
Number of
countries or areas
2
4
1
3 1
1
1
1
Country or area
c Guadeloupe & Martinique
Panama
Guatemala
Ecuador
German Democratic Republic
Trinidad & Tobago
El Salvador, German;r, Federal Republic of, Israel, Mauritius
Costa Rica
Reunion
Poland
Iceland
Chile
Portugal
Hungary, United States of America
Austria, Canada, France, UK: England & Wales
Switzerland
Denmark, Japan, New Zealand
UK: Scotland
Netherlands
Finland
Norway
a b Average age refers to the upper limit of the appropriate interval. African and Latin American countries
c Data for Guadeloupe and Martinique combined
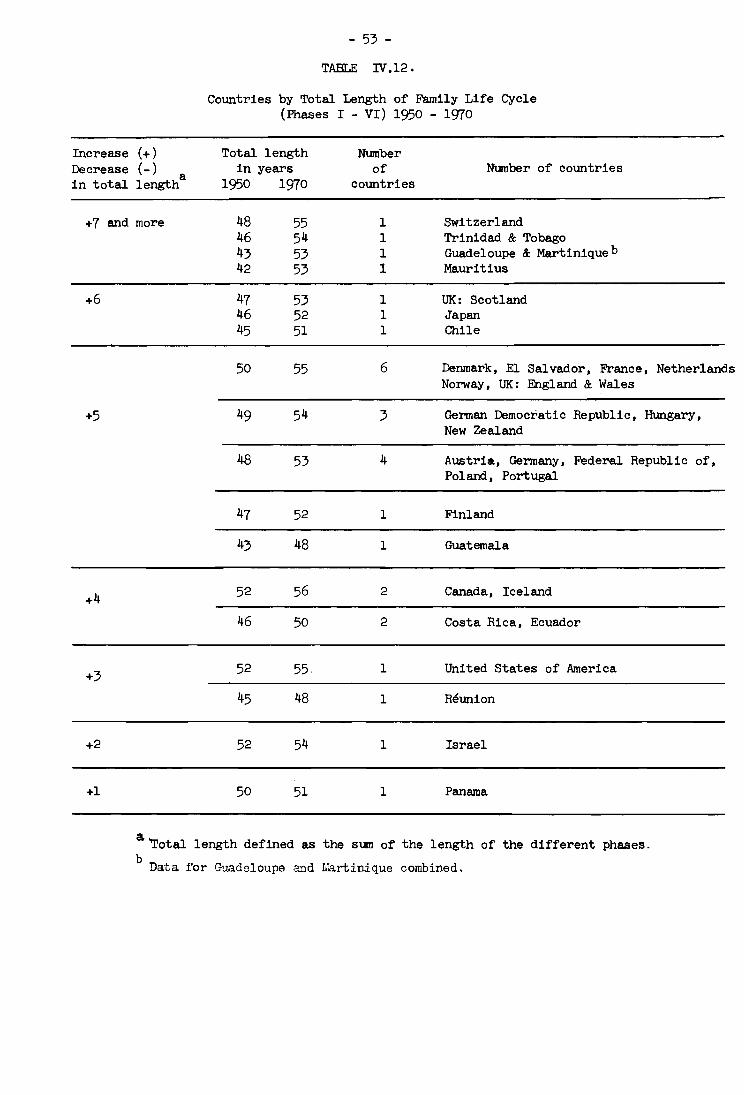
- 53 -
TABLE IV .12.
Countries by Total Length of Family Life Cycle (Phases I - VI) 1950 - 19rO
Increase (+ ) Total length Number Decrease (- ) in years of Number of countries in total
a 1950 1970 countries length
+7 and more 48 55 1 Switzerland 46 54 1 Trinidad & Tobago 43 53 1 Guadeloupe & Martinique b 42 53 1 Mauritius
+6 47 53 1 UK: Scotland 46 52 1 Japan 45 51 1 Chile
50 55 6 Denmark, E1 Salvador, France, Netherlands Norway, UK: England & Wales
+5 49 54 3 German Democratic Republic, Hungary, New Zealand
48 53 4 Austria, Germany, Federal Republic of, Poland. Portugal
47 52 1 Finland
43 48 1 Guatemala
+4 52 56 2 Canada, Iceland
46 50 2 Costa Rica, Ecuador
+3 52 55. 1 United States of America
45 48 1 Reunion
+2 52 54 1 Israel
+1 50 51 1 Panama
a. ~otal length defined as the sum of the length of the different phases.
b Data for Guadeloupe and I)la.rtinique combined._

- 54 -
TABLE IV.l3
Number of Countries by Change in Average Age of Wife at First Marriage and Change in Total Length of Family Life Cycle
Change in average age of wife
Change in Number of at first marriage
a total length countries -3 years (years) and more -2 -1 0 +1
+1 to +3 2+2b 2 2b
+4 2+2b l+lb l+lb
+5 13+2b 1 4 4 3+1b l+lb
+6 and more 3+4b 1 2+lb b b lb 1 1
~otal length defined as the sum of the length of the different phases
bAfrican and Latin American countries

- 55 -
TABLE IV.14
Number of Countries by Magnitude of Change in the Length of the Different Phases of the Family Life Cycle Between 1950 and 1970
Phases of Number of countries for which was observed 1950/1970
Life Cycle Increase by No Decrease by change
2 years less than 2 years less than or more 2 years or more 2 years
Length of Phase 3 2+5b
3+3b 1+2b 11+1b
IIII
b 6+1
b B+3
b +lb 1+5b
Length of Phase 4+1 III
Length of Phase 2+5b
B+3b 4+1b 6+1b
rv
Length of Phase 16+8b 5+1b
V
Length of Phase 9+4b B+2b 2+1b 1b 1+2b VI
b African and Latin American countries

- 56 -
TABLE IV.15
Number of Cbuntries by lliange in the Length of the Different Phases of the Family Life Cycle Between 1950 and 19rO
Phase
Change in years IIII III IV V VI
-2 and more l+lb 1b 4+1b 1b
-1 ll+lb 2+4b 6+1b 1+2b
0 3+3b 7+4b 8+3
b 2+1b
+1 2+5b 6+1b 2+5
b 4+2b 8+2b
+2 2 3+1b 3+1 b 4+2b
+3 1 5 2+2b
+4 1 l+lb 2
+5 and more 7+6b 1b
b African and Latin American countries

)
- 57 -
TABLE IV.16
Changes in the Length of the Family Life Cycle and its Different Phases, by Countries
Change in the length of the different phases (years, rounded figures) . Country
Mauritius
Guadeloupe & Martinique C
Trinidad & Tobago
Switzerland
Japan
Chile
UK: Scotland
Denmark
El Salvador
France
Guatemala
Poland
Portugal
Austria
Finland
German Dem. Rep.
Germany. Federal Republic of
Hungary
New Zealand
UK: England & Wales
Netherlands
Norway
Ecuador
Iceland
Canada
United States of America
Costa Rica
Reunion
Israel
Panama
Phase IIII
- 1
+ 1
- 2
- 1
- 4
+ 1
- 1
+ 1
- 1
+ 1
+ 1
- 1
+ 2
+ 3
- 1
- 1
- 1
- 1
+ 1
- 1
- 1
- 1
+ 2
+ 1
Phase III
+ 1
- 1
+ 2
+ 1
+ 4
+ 1
+ 2
- 1
- 2
+ 2
- 1
+ 1
+ 2
+ 1
- 1
+ 1
+ 1
- 1
- 1
Phase IV
- 1
+ 1
- 2
- 1
- 4
- 1
- 2
+ 1
+ 1
- 1
- 2
+ 1
- 1
- 2
- 1
+ 1
- 1
+ 1
+ 1
aSum of phases b Based on life expectancy at age of first marriage c Data for Guadeloupe & Martinique combined
Phase V
+ 9 + 8
+ 7
+ 5
+ 9 + 5
+ 2
+ 5
+ 1
+ 3
+ 4
+ 5
+ 5
+ 3
+ 2
+ 1
+ 1
+ 2
+ 1
+ 4
+ 3
+ 5 + 5
+ 5
+ 3
+ 3
+ 5
+ 2
+ 1
+ 1
Phase VI
+ 3
+ 2
+ 3
+ 2
+ 1
+ 1
+ 4
+ 2
+ 2
+ 2
+ 1
+ 2
+ 5
+ 1
+ 1
+ 4
+ 3
+ 1
+ 2
+ 1
- 3
+ 1
+ 3
- 1
+ 1
- 1
- 1
Total a length
+11
+ 10
+ 8
+ 7
+ 6
+ 6
+ 6
+ 5
+ 5
+ 5
+ 5
+ 5
+ 5
+ 5
+ 5
+ 5
+ 5
+ 5
+ 5
+ 5
+ 5
+ 5
+ 4
+ 4
+ 4
+ 3
+ 4
+ 3
+ 2
+ 1
Totalb length
+11
+11
+ 10
+ 4
+ 8
+ 5
+ 2
+ 9
+ 9 + 4
+ 4
+ 4
+ 4
+ 3
+ 3
+ 3
+ 3
+ 3
+ 3
+ 2
+ 2
+ 2
+ 4
+ 4
+ 3
+ 3
+ 1
+ 4
+ 1

Change (years)
+ 3
+ 2
+ 1
o
1
2
- 4
- 58 -
TABLE IV.!'7-
Changes in the Length of Phase III!
a
b
Number of countries
or areas
1
2
1
Country or areas
Gennany ~ Federal Republic of
Gennan Democratic Republic Israel
Austria~ Ecuador, El SaSvador~ Guadeloupe & Martinique , Guatemala, Panama~ UK: Scotland
Ch1le~ Costa Rica, Poland, Portugal,
Netherlands, Reunion
Canada, Denmark~ Finland, France, Htmgary, Iceland, Mauri ti us. New Zealand, Norway, Switzerland, UK: England & Wales, United States of America
Trinidad & Tobago
Japan
African and Latin American countries
Data for Guadeloupe and Martinique combined

- 59 -
TABLE IV .18.
Number of Countries by Average Age of Spouse at the Beginning of Phase I/II
Change in average age at beginning
of Phase I/I! (years)
+2
+ 1
o
- 1
- 2
- 3
- 4
Average age at beginning
of Phase III!
1950 1970
23
21
22
22
23
24
25
22
23
24
25
25
26
27
27
27
25
22
23
22
23
24
25
21
22
23
24
23
24
25
23
24
23
Women
Number of countries or areas
1
2
1
2
2
1
2
2
2
Country or area
Japan
Trinidad & Tobago
Costa Rica
Mauritius
Canada, Ecuador
Chile, Reunion b Guadeloupe & Martinique,
Portugal
Panama
El Salvador, Guatemala, Hungary, Israel, United States of America
Denmark, Iceland
Poland
France, UK: England & Wales
Austria, Germany, Federal Republic of
Switzerland
Finland, Gennan Democratic Republic
Netherlands, New Zealand
Norway, UK: Scotland
a African and Latin American countries
b Data for Guadeloupe and Martinique combined

- 60 -
TABLE IV.18. (concl'd)
Men
Change in average Average age Number of age at beginning at beginning countries
of Phase III! of Phase III! or areas Country or area (years)
1950 1970
+ 2 27 29 la Guadeloupe & Martinique b
+ 1 24 25 1 Hungary
27 28 1 Japan
25 25 la Mauritius
0 26 26 la Trinidad & Tobago
27 27 la Costa Rica
25 24 1 United States of America
26 25 1 New Zealand
- 1 27 26 2a Ecuador, Guatemala
28 27 3 Canada, Poland, Portugal
29 28 la Chile
31 30 la Reunion
27 25 3+ld German Democratic Republic,
- 2 Iceland, Panama, UK: Scotl~d
28 26 l+la El Salvador, France
29 27 1 Switzerland
28 25 3 Denmark, Finland,
- 3 UK: England & Wales
29 26 2 Germany, Federal Republic of, Israel
- 4 30 26 3 Austria, Netherlands, Norway
a African and Latin American countries
b Data for Guadeloupe and Martinique combined

Change (years)
+ 4
+2
+ 1
o
- 1
- 2
- 61 -
TABLE IV .19.
Changes in the Length of Phase III
Number of countries
or areas
1
Country or areas
Japan
Denmark. Finland. Netherlands. Trinidad & Tobago
Canada. Hungary. Mauri tius. Norway. Switzerland. UK: Scotland United States of America
Austria. Chile. Costa Rica. France. German Democratic Republic. Iceland. New Zealand. Poland. Portugal. Reunion.
Ecuador. El Salvador. Germany. Federal Republic of. Guadeloupe & Martinique b, Israe 1. Panama, UK: England & Wales
Guatemala
a African and Latin American countries
b Data for Guadeloupe and Martinique combined
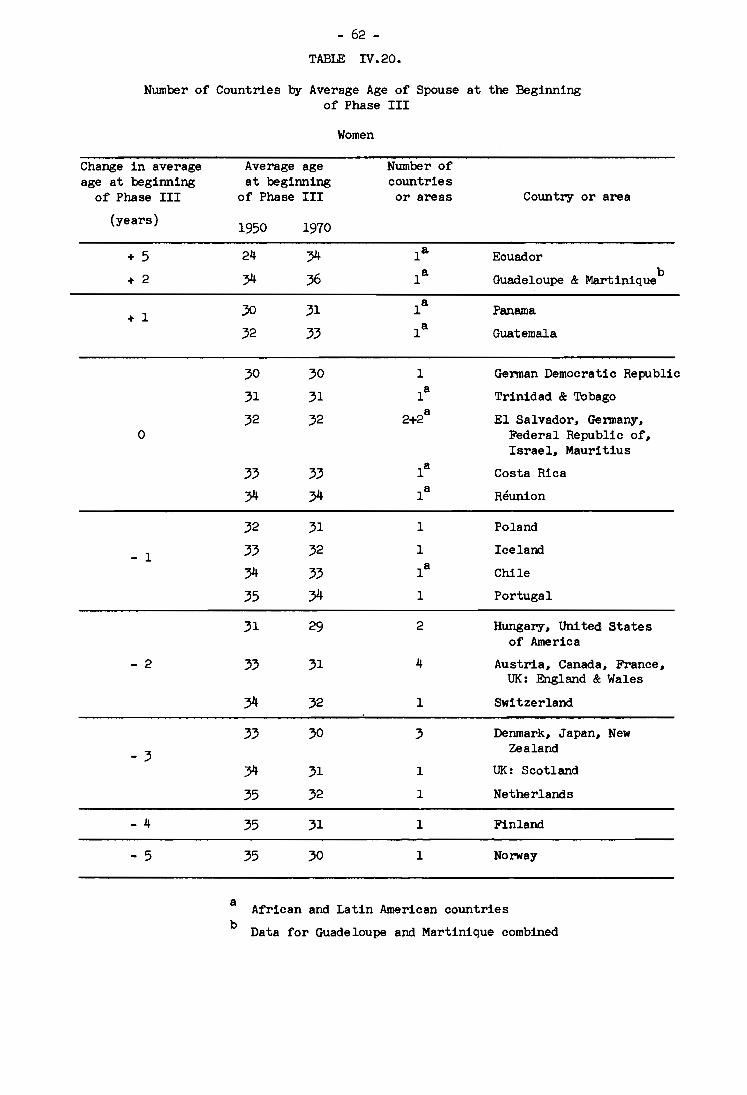
- 62 -
TABLE IV.20.
Number of Countries b,y Average Age of Spouse at the Beginning of Phase III
Change in average age at beginning
of Phase III
(years)
+ 5
+ 2
+ 1
o
- 1
- 2
- 3
- 4
- 5
Average age at beginning
of Phase III
1950 1970
24
34
30
32
30
31
32
33
34
32
33
34 35
31
33
33
34 35
35
35
31
33
30
31
32
33
34
31
32
33
34
29
31
32
30
31
32
31
30
Women
Number of countries or areas
1
2
4
1
3
1
1
1
1
Country or area
Ecuador b
Guadeloupe & Martinique
Panama
Guatemala
German Democratic Republic
Trinidad & TObago
El Salvador, Germany, Federal Republic of, Israel, Mauritius
Costa Rica
Reunion
Poland
Iceland
Chile
Portugal
Hungary, United States of America
Austria, Canada, France, UK: England & Wales
Switzerland
Denmark, Japan, New Zealand
UK: Scotland
Netherlands
Finland
Norway
a African and Latin American countries b Data for Guadeloupe and Martinique combined
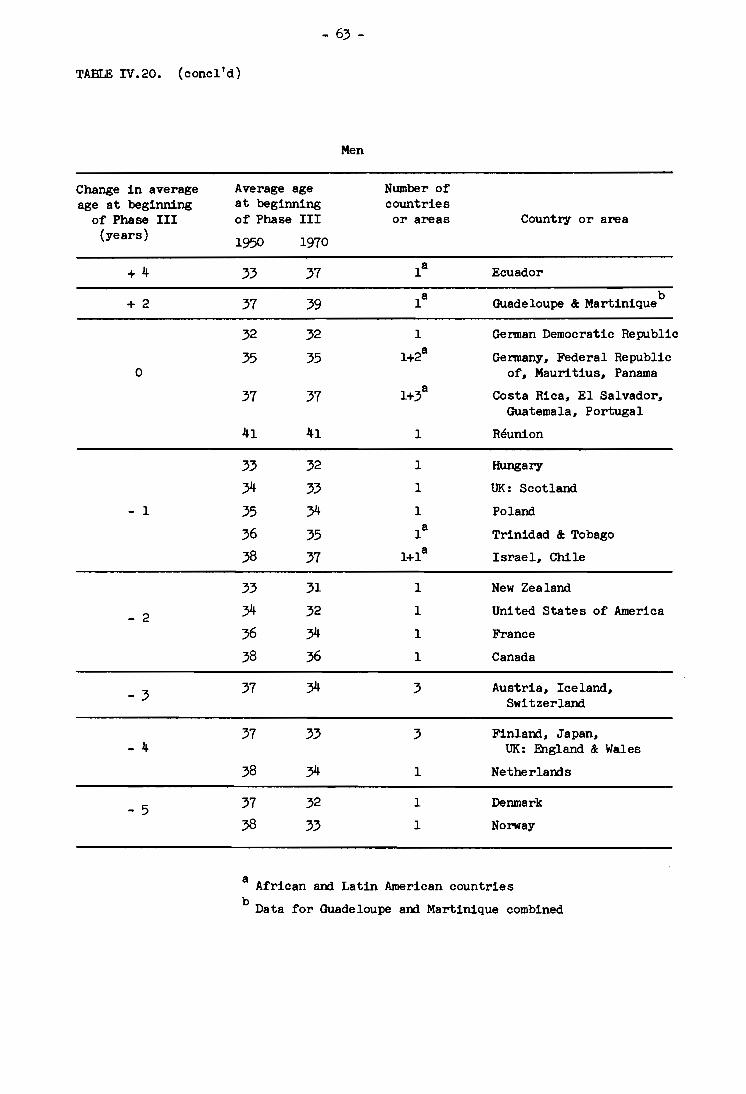
- 63 -
TABLE IV.20. (concl'd)
Change in average age at beginning
of Phase III (years)
+4
+ 2
0
- 1
- 2
- 3
- 4
- 5
Men
Average age Number of at beginning countries of Phase III or areas Country or area
1950 1970
33 37 la Ecuador
37 39 la Guadeloupe & Martinique b
32 32 1 German Democratic Republic
35 35 1+2a Germany. Federal Republic of. Mauritius. Panama
37 37 1+3a Costa Rica. El Salvador.
Guatemala. Portugal
41 41 1 Reunion
33 32 1 Hungary
34 33 1 UK: Scotland
35 34 1 Poland
36 35 la Trinidad & Tobago
38 37 l+la Israel. Chile
33 31 1 New Zealand
34 32 1 United States of America
36 34 1 France
38 36 1 Canada
37 34 3 Austria. Iceland. Switzerland
37 33 3 Finland. Japan. UK: England & Wales
38 34 1 Netherlands
37 32 1 Denmark
38 33 1 Norway
a African and Latin American countries b Data for Guadeloupe and Martinique combined

- 64 -
TABLE IV. 21.
Changes in the Length of Phase IV.
Number Change of countries Country or areas (years) or areas
+ 1 2+5a Ecuador. El Salvador. Germany.
Federal Republic of. Guadeloupe & Martiniqueb,Guatemala. Israel, Panama
0 8+3a
Austria, Canada. Chile, Costa Rica, France. German Democratic Republic. Iceland. New Zealand. Poland. Reunion. UK: England & Wales
- 1 6+1a Hungary. Mauritius. Norway.
Portugal. UK: Scotland, Switzerland Un~ted States of America
- 2 3+1a
Denmark, Finland. Netherlands. Trinidad & Tobago
- 4 1 Japan
a African and Latin American countries
b Data for Guadeloupe and Martinique combined

- 65 -
TABIE IV. 22.
Number of Countries b.Y Average Age of Spouse at the Beginning of Phase IV.
Women
Change in average Average age Number of age at beginning at beginning countries
of Phase IV of Phase IV or areas Country or area (years)
1950 1970
39 40 la Trinidad & Tobago
+ 1 40 41 la Costa Rica
43 44 1 Japan
40 40 la Mauritius
41 41 la Ecuador
0 42 42 2+2a Chile .. Israel .. Poland .. Reunion
43 43 l+la b Guadeloupe & Martinique .. Portugal
40 39 la Panama
41 40 2a El Salvador .. Guatemala
- 1 42 41 2 German Democratic Republic .. United States of America
45 44 2 Germany.. Federal Republic of .. Switzerland
42 40 1 Iceland
43 41 3 Canada, Denmark .. Hungary
- 2 44 42 5 Finland. France .. New Zealand, UK: England & Wales, UK: Scotland
45 43 1 Netherlands
- 3 45 42 2 Austria. Norway
a African and Latin American countries
b Data for Guadeloupe and Martinique combined

- 66 -
TABLE IV.22 (concl'd)
Men
Change in average Average age Number of age at beginning at beginning countries
of Phase IV of Phase IV or areas Country or area (years) 1950 1970
+ 2 45 47 la Guadeloupe & Martinique b
+ 1 46 47 1 Japan
43 43 la Mauritius
0 44 44 l+la Hungary, Trinidad & Tobago
45 45 la Costa Rica
46 46 1 Portugal
44 43 2 German Democratic Republic, New Zealand
45 44 1+2a Ecuador, Guatemala,
- 1 UK: Scotland
46 45 1 Finland
47 46 la Chile
49 48 la Reunion
45 43 l+la Panama, United States of America
- 2 46 44 2+la Denmark, El Salvador, Poland
48 46 4 Canada, Germany, Federal Republic of, Israel, Switzerland
45 42 1 Iceland
- 3 47 44 1 France
48 45 3 Austria, Netherlands, UK: England & Wales
- 4 49 45 1 Norway
a African and Latin American countries b Data for Guadeloupe and Martinique combined

Change (years)
+ 6 or
more
+ 5
+4
+3
+ 2
+ 1
- 67 -
TABLE IV.23.
Changes in the Length of Phase V
Number of countries
or areas
5
Country or areas
Guadeloupe & Martinique b, Japanl Mauritiusl Trinidad & Tobago
Chilel Costa Rical Ecuadorl Icelandl Polandl Portugall Switzerland
Denmark l
NorwaYI
Guatemalal UK: England & Wales
Austria l Canadal France I Netherlandsl United States of America
Finland I Hungary I Reunionl UK: Scotland
El Salvador, German Democratic Republic l Germanyl Federal Republic ofl IsraelI New Zealandl Panama
a African and Latin American countries
b Data for Guadeloupe and Martinique combined

- 68 -
TABLE IV.24.
Number of Countries by Average Age of Spouse at the Beginning of Phase V.
Women Change in average Average age Number of age at beginning at beginning countries
of Phase V of Phase IV or areas Country or area (years)
1950 1970
+ 2 52 54 la Guadeloupe & Martinique b
48 49 la Panama
+ 1 50 51 la Guatemala
51 52 la Ecuador
48 48 1 German Democratic Republic
49 49 la Trinidad & Tobago
0 50 50 2+2a El Salvador, Germany, Federal Republic of, Israel, Mauritius
51 51 la Costa Rica
52 52 la Reunion
50 49 1 Poland
- 1 51 50 1 Iceland
52 51 la Chile
53 52 1 Portugal
49 47 2 Hungary, United States of America
- 2 51 49 4 Austria, Canada, France, UK: England & Wales
52 50 J. Switzerland
51 48 3 Denmark, Japan,
- 3 New Zealand
52 49 1 UK: Scotland
53 50 1 Netherlands
- 4 53 49 1 Finland
- 5 53 48 1 Norway
a African and Latin American countries
b Data for Guadeloupe and Martinique combined
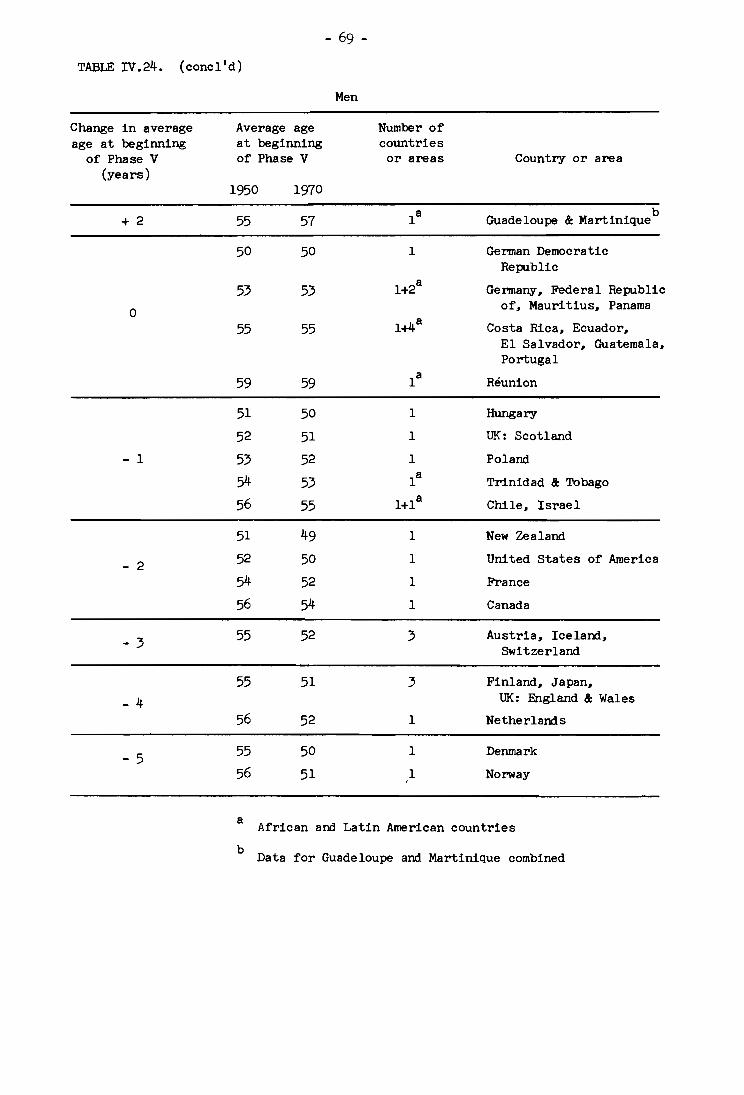
- 69 -
TABLE IV.24. (concl'd)
Change in average age at beginning
of Phase V (years)
+ 2
o
- 1
- 2
- 3
- 4
- 5
Average age at beginning of Phase V
1950 1970
55
50
53
55
59
51
52
53 54
56
51
52
54
56
55
55
56
55 56
57
50
53
55
59
50
51
52
53
55
49
50
52
54
52
51
52
50
51
Men
Number of countries or areas
1
1
1
1
1
3
3
1
1
1
Country or area
b Guadeloupe & Martinique
German Democratic Republic
Germany, Federal Republic of, Mauritius, Panama
Costa Rica, Ecuador, El Salvador, Guatemala, Portugal
Reunion
Hungary
UK: Scotland
Poland
Trinidad & Tobago
Chile, Israel
New Zealand
United States of America
France
Canada
Austria, Iceland, Switzerland
Finland, Japan, UK: England & Wales
Netherlands
Denmark
Norway
a African and Latin American countries
b Data for Guadeloupe and Martinique combined

- 70 -
TABLE IV. 25.
Changes in the Length of Phase VI.
Number Change of countries Country or areas (years) or areas
+ 5 1 Finland
+ 4 2 Hungary, UK: Scotland
+3 2+2a Mauritius, New Zealand, Trinidad &: Tobago, United States of America
+ 2 4+la
Austria, Denmark, El Salvador, Netherlands, Switzerland
+ 1 8+3a
Canada, Chile, France, German Demo ... cratic Republic, Germany, Federal Repuglic of, Guadeloupe &: Martin-ique • Japan, Norway, Portugal, Reunion, UK: England &: Wales
0 2+la Guatemala, Iceland, Poland
- 1 1+2a Costa Rica, Israel, Panama
- 3 la Ecuador
a African and Latin American countries
b Data for Guadeloupe and Martinique combined.

- 71 -
TABLE IV. 26.
Number of Countries by Average Age of Spouse at the Beginning of Phase VI.
Change in average age at beginning
of Phase VI (years)
+ 9
+ 8
+ 6
+ 5
+ 2
+ 4 or more
+3
+ 2
+ 1
o
- 1
- 2
Women: surviving spouse is the husbanda
Average age at beginning of Phase VI
1950 1970
62
61
61
61
57
65
71
69
67
66
59 67
Number of countries or areas
Men: surviving spouse is the wifea
66
68
71
64
69
72
70
71
72
73
70
72
73
75
66
75
72
72
74
66
71
74
71
72
73
74
70
72
73
74
64
73
1
2
1
1
1
2
1
2
2
1
1
1
1
Country or area
c Guadeloupe & Martinique
Mauritius
Trinidad & Tobago
Chile
Reunion
Panama
Japan
Poland, Portugal
Switzerland
Guatemala
France, Hungary
Iceland
United States of America
UK: England & Wales
German Democratic Republic, Germany, Federal Republic of
Denmark
Austria, UK: Scotlarrl
Canada, New Zealand
Israel
Norway
Finland
Netherlands a
The countries for which the surviving spouse is different for the two periods (Ecuador, Costa Rica, and El Salvador) do not appear in this table.
b c African and Latin American countries Data for Guadeloupe & Martinique combined

- 72 -
CHAPTER V
VARIATIONS AND EXCEPTIONS
The development of health studies, the practice of medicine and the organization of medical services within a familial context are none of them relevant exclusively to the model nuclear family. In countries where the nuclear family is the norm there are variations and exceptions which are j~st as relevant for understanding health problems irrespective of whether or not the aberration lies within the conceptual framework of the family life cycle. Although they are equally relevant, they are generally more difficult to analyse because in most cases less is known of their dynamics or their incidence either as trends over time or as the current situation. The fact that they are aberrant draws the attention of society and proclaims the need for social explanation. This is either sympathetiC, as in the case of a premature death, or critical, as often in the case of a homosexual union.
The terms variation and extension distinguish typical events in the model life cycle (e.g. childless marriages) from alternative group structures (e.g. one-parent families). The former may be voluntary or involuntary, the latter are always voluntary.
In discussing these aberrants an attempt will be made to identify their frequency and changing rates over time wherever available data permits. This is important not only to indicate the extent of the characteristic as a proportion of the population in a given culture and its probable impact upon society but also to indicate the degree and speed of social change.
The first variation to be considered is the loss of a spouse from causes other than death. This may be permanent or prolonged, voluntarily accomplished or involuntarily experienced. The most common causes of permanent loss are divorce, separation and terminal institutionalization.
In most industrialised oountries, the crude divorce rate has steadily increased since 1920. Although the latest figure for the United States of America is not totally reliable, all countries shown in Table V.I. reached a new peak in 1971.
Further evidence that the trend toward an increase in divorce rates applies throughout the industrialized world is available from Poland, with the details given in Table V.2.
The proportion of marriages ended by divorce after selected years since marriage by dates of marriage in the United Kingdom is shown in Table V.3.
It will be seen that the proportion of marriages ending in divorce tended to increase the more recent the marriage. This trend is clear throughout the period excepting only among wartime and early post-war marriages. Only 2% of the 1921 marriage cohort had divorced twenty five years later compared with 9% for 1946 marriages after the same length of time; and over 2% of the 1966 marriages

- 73 -
have ended in divorce within five years~ that is as much as the 1921 marriages showed in twenty-five years.
The United Kingdom pattern is repeated in the United States of America. as Table V.4.shows. although in the latter country the recent trend toward divorce has been more marked. In 1964 twice as many couples married less than a year were divorced than in 1958, while the number divorced after 15 - 19 years of marriage increased about fourfold between 1958 and 1964.
In contrast. Japan has had a much more gradual increase. and apart from an upsurge of divorce among those married between 15 - 19 years. the increase has been more noticeable among the young. The figures for Denmark suggest comparative stability in rates of marital breakdown but they probably mask a trend towards consensual unions. in which comparative stability is not thought to be characteristic.
Divorce and its impact becomes clearer to understand if it can be related to the age of the partners and to the number of dependent children. Table V.5. shows that the number of divorces and annulment in the United Kingdom continues to be most frequent among men in their early 30s and among women in their late twenties. In general. wives tend to be younger than husbands at the time of divorce. Relative frequencies can be plotted against phases in the life cycle and their associated ages to indicate periods of greater risk and patterns of probable affect upon the family. It will be noted. for example. that in many industrialised cultures the most likely time for a woman to get divorced is after the birth of her last child.
Although the highest number of divorces occur in families without children. the number of dependent children who face divorce between their parents is large and continues to grow. Table V.5.shows that in the United States of America in 1966 there were 37 900 only children whose parents were divorced and 183 800 other children. a total of just over two hundred thousand children. The pattern is repeated in Japan and in the United Kingdom. The total number of children experiencing the divorce of their parents in the United States of America increased almost fourfold between 1958 and 1966 (the last period for which reliable figures are available). from 52 800 to 221 700.
In the United Kingdom over the same period~ the total increased from 28 500 to 58 700. The rate by which divorce in childless marriages increased was parallel to the rise of families ~ children for all countries. except in Denmark where the number of divorces in childless marriages slightly declined.
Finally on the question of divorce. and again using United Kingdom data. an analysis of marriages ended by divorce after selected years since marriage tabulated against age of wife and year of marriage shows that the couples at greatest risk are those in which the wife's age at marriage was under twenty. This applies even when divorce occurs after twenty years of marriage.
Permanent separation, whether or not legalised, is less documented than divorce but the impact upon the family is similar except that (i) economic settlement between the parties and (ii) the position of dependent children are more arbitrarily and less stably arranged.

- 74 -
Permanent institutionalization refers to hospital care occurring at any age and reckoned to be permanent at the time of entry. In cases of intractable mental illness there may eventually be a divorce but in the majority of cases the consequence is that of a family permanently without one of its members who may be suffering as well as absent. The economic and emotional strain is liable to lead to a breakdown (an example of a non-transitional crisis), especially when the member has been the main breadwinner and family head. Occasionally, however, distress creates internal cohesiveness and a strong network of support, which in its most extreme form may find a nuclear family assuming the characteristics of an extended family. The number of long-term patients among industrialised nations appears stable; certainly there is no socially significant trend toward either an increase or a decrease in the numbers involved nor in the age patterns of those concerned.
Prolonged (as against permanent) loss of a spouse can be caused by such a variety of factors, most of them not recorded in official data, that analysis of any trend is impossible. The most common causes are prolonged absence in hospital, prison, the armed forces or for other occupational reasons.
By definition these absences must extend over a prolonged period affecting the normal family life cycle before they can be regarded as a variation. The qualifying duration, as it were, varies according to the phase in the cycle in which they occur. Thus the absence of a spouse for six months during a first pregnancy is likely to be more stressful than a similar absence when the youngest child is ten or for a childless pair in middle-age. It is important to recognise that factors such as uncertainty over the duration of the absence and its outcome can produce more strain on the family than the length of time itself.
The second variation to be considered is the premature death of a spouse, when a husband or wife dies before the period of contraction is complete, that is before the last child has left home. Now, although national variations will vary as discussed in Chapter IV, we are referring in general and in the industrialized world to deaths before the age of fifty. As with most of the variables examined in this chapter the two most important questions for family health are: (1) the qualitative question: what is the likely impact of this event on the life of the family and (2) the quantitative question: is there an observable trend? There is a universal trend toward a reduction in the number of premature deaths. Tables v.8. and V~9. show that in both the developed and the developing world the percentage decline of the mortality rate during the period 1940-1965 occurred at all ages and in all countries for the lower age groups most especially.
It will be observed that the decline has been more marked in women than in men but the difference between the sexes is smaller at the younger ages. In terms of the family life cycle this means that the length of phase V is lengthening and pari passu the comparative extent of the variation due to the premature death of a spouse continues to diminish.
, As would be expected from recent mortality tables, widowhood rates are higher for women than for men. In the United Kingdom, for example, among those married in 1925 who have died leaving a surviving partner of between 40 and 45, the rate for male deaths is 49.5 per 10 000 compared with only 16.8 per 10 000 for female deaths. Since men tend to remarry more quickly than women, the majority of children involved in the premature death of a spouse live with their mother and of these a larger proportion continue as a one-parent family than of those children who live with their surviving father. One curious fact to notice in the United

- 75 -
Kingdom rates, reproduced in Table V. 10., is that the rates in the surviving widower's table do not increase with age for the earliest cohorts, as would be anticipated, but follows a U-shaped distribution. Although the rates shown exclude non-civilian mortality, factors associated with the war and its aftermath afford the most likely explanation. But comparable statistics for other countries and for the United Kingdom in later years would be interesting.
The reduction in widowhood rates, especially during the middle years, will partially offset the increase in divorce, particularly marked among those marrying early, as affecting dependent children.
One can take this analysis a step along another dimension by comparing death rates by marital status by age.
The figures in Table V.ll. demonstrate that for both men and women in the United States of America, the mortality rates in adulthood are lower for those who are married than for the Single, widowed or divorced and highest for the divorced men and widowed women. This illustrates the benefits, and the health risks, of marriage.
Another variation to the normal phaSing of the family life cycle is caused by the death of an early child still resident at home." Two trends affect the frequency of this tragedy. On the one hand there is, as Tables V.12. and V.13. illustrate, declining infant and ohildhood mortality, excepting only in disaster regions, and since the majority of deaths below the age of adulthood occur in the first year, it is the infant mortality rates which are significant.
In the case of Sweden, for example, one is able to trace the urban records from 1811 and the trend is remarkable.
On the other hand there is a tendency in industrialised societies toward a reduction in family size so that although the risk of losing a child is diminishing, the proportion of families at risk is increasing. On balance, however, one may presume there are fewer deaths of only children now than in the past. In the United Kingdom, for example, approximately 95% of children born alive will survive to complete their reproductive lives. This figure is similar to that pertaining in all countries having an expectation of life between 70 and 75 years. Of the ~ who die, about one-third will be only-children. There is no reason to believe that there is a trend anywhere in the world toward an increase in either the absolute or proportionate number of families suffering the death of an only-child. The important aspects of this variation, therefore, are a) efforts to ensure the diminution of the infant and childhood mortality rates still further and b) an understanding of the trauma upon families who lose an only child through premature death.
One variation that should be mentioned for the sake of completeness is the small number of cases in which children are lost to their family of procreation by adoption, that is the transference of a child from one family to another, voluntarily achieved on both sides. Thus, for the parents giving up their only Child, the family reverts voluntarily to the status of a childless family - an event seldom taking place without unusual concomitant circumstances such as prolonged institutionalization of one parent - while the family of adoption, when otherwise childless, immediately embarks upon a new phase. The social and psychological impact of this variation are insufficiently documented and there is growing concern in some countries that the position of the child may be an extremely difficult one

especially in those parents. There are procreation without family of adoption.
- 76 -
cases where an adopted adolescent seeks to discover his real cases of adopted children re-entering their family of necessarily abandoning, physically or psychologically, their While such cases are rare their number may be growing.
Another variation for which virtually no quantitative data is available is variation of phasing. Two criteria are possible: (i) the voluntary beginning or ending of a phase beyond the normal age range other than through loss of spouse or child or (ii) an event in the life-cycle, or its absence other than through loss of spouse or child, whose voluntary timing is so atypical as to create its own problems for the family. The latter is the more useful criterion, partly because it is the sociopsychological significance of this class of phenomenon that is the most important and partly because for many countries the normal age-range of every stage in the family life cycle cannot be given precisely. Possibly, the most common example of this variation is when a child remains at home (other than as a bona fide student) after taking full employment and/or beyond the age of legal adulthood. In such cases it is often difficult to distinguish symptoms from causes; a young adult may remain homebound because he feels too insecure to embark on an independent life, or the need to remain at home (for example, to tend a sick parent) may itself lead to diminishing confidence in coping with the pressures of the world outside. In the former type of case the need is for a system of family care sensitive enough to detect the problem when it arises while for the latter it is the provision of more specialised domiciliary help that is needed.
The next variation to note is that of the childless married couple. This may be of two kinds, depending on whether childlessness is voluntary or involuntary. In either case there are no mid-term phases, no periods of extension, completed extension, contraction or completed contraction. The family passes directly from phase I to phase VI and. by definition, the family biological function is unmet. The psychological problems associated with this state may vary according to whether it is voluntary or involuntary. In former cases the problems tend to arise later, the family may grow into them, with, for example, divorce rates higher for childless couples than for others (see Table v.6.). In latter cases problems (if any) generally arise when the couple are younger and more psychologically flexible. If they want children - and medical science is making this possible for an increasing number - they can adopt a child in which case they cease (in our terms) to be variant. Those who do not adopt seem likely to come to terms with the situation earlier than those who are in a similar situation by choice.
Glass and Grebenik have anal~sed the trends in the number of childless families during the period 1870-1944. An examination of the number of childless families in Britain between 1890 and 1925 shows that although there was a proportionate increase throughout this period, the tendency was more marked among the higher occupational classes (see Table V.15.) and within them childlessness was more prevalent among salaried employees than among professional staff.
The continuing trend until 1944, collapsing social class categories, is seen in Table v.16. The sharpest rise coincided with the second World War when spouses were either separated for long periods or unwilling to have children.
Among women married in 1951, and married once only for fifteen years, only 14% were childless. Although the fact that these figures refer to women with only one husband must produce a low figure, it seems clear that the trend in recent years in Britain has been away from childlessness and it is reasonable to conclude that this has been due largely to improved economic conditions. The most recent

- 77 -
figures, however, suggest the trend may be swinging back again toward childlessness, or at least to the postponed birth of the first born.
According to the most recent comparative international data available, the percentages of the total married female population between the ages of 16 and 49 having no children in 1950/51 ranged from 12.% (2 514 000) in Japan to 22.% (1 546 000) in the United Kingdom. The comparable figure for the United States of America in 1954 was 19% (9 073 000) and for Portugal 13.% (250 359).
The final variation to be considered is that of remarriage. In North America this has received close attention from Schlesinger.' Simpson3 listed the following eight types of remarriage:
divorced man divorced man divorced man single man single man widowed man widowed man widowed man
single woman widowed woman divorced woman divorced woman widowed woman single woman widowed woman divorced woman
with three types of children involved in the new family a) father and children and new mother, b) mother and children and new father, and c) father and children and mother and children. There may also, of course, be a new childless family.
A high remarriage rate seems correlated to a high divorce rate.
In 1944 in the United States of America one of every eight brides had been married at least once before and according to the Metropolitan Life Insurance Statistical Bulletin (May, 1945), after 1940 for a divorcee aged 30. the chances of eventual remarriage were 94%, for a 30 year old widow. 60%. and for a 30 year old spinster, 4S%.
In 1959. in the United States of America the median age for those entering a second marriage was. for men 38.3 and for women 34 years of age~
Other studies have found that the rate of remarriage is higher amon~ the poorly educated than among those receiving sixth form and higher education; that (in the United States of America) one-third of divorced wome~ remarry within one year. 50% remarry within two years and 66% within five years; 6 aecond marriages ending in divor~e last a shorter time than first marriages 1 and are more likely to end in divorce. 8 The most common category of remarriage in the United States is that of a single man to a divorced woman, followed by two divorced people and a divorced man to a single woman. 9 Jessie Bernard in her book Remarriage, published in 1956, rep~ted (using over 2 000 cases) that 75% of remarried mothers were given custody of the children and she did not find any generally harmful effects upon the children. A different conclusion was reached some years later by Bowerman and Irish who found a feeling of rejection by children.10
Table V.1S. shows some interesting trends in the remarriage habits of Canadians over the last fifteen years. The figures for bachelors remains steady. they marry spinsters. divorcees and widows in the ratio of 95:3:2. But widowers have been showing a small but persistent trend away from single women and more toward remarrying widows than divorcees, although the increased percentage of the latter has also continued over the period under review.

- 78 -
Male divorcees also tended to marry proportionately fewer single women although in their case this was still the majority pattern. Male divorcees continued to prefer other divorcees to widows. Indeed while the percentage remarrying widows did not materially alter over the fifteen years. the percentage remarrying other divorcees rose from 21.9 to 33.5. If data is examined for the United Kingdom over the period 1958-1966. one finds the same overall pattern repeated (Table V.19.). Table V.20. shows the same trends apply to women as to men. In terms of remarriage and previous marital status. like tend to marry like; this is especially marked in the case of the widowed. but exceptions are divorced men who still prefer single women and divorced women who still prefer single men. As would be expected. the highest proportion of re-marriages when one party is single is in the under-30 age group. When one or both parties are divorced. the highest proportion of remarriages is in the 30s and early 40s and among widows and widowers. the late 40s and early 50s (see Table V.21.). The phasing of the new family life cycle. including its duration as a family. is therefore likely to vary according to the nine types mentioned above and. of course. according to the existence of children and the age of the bride.
One final point. In Great Britain. as in most industrial nations. the proportion of the widowed and divorced population who remarry continues to rise for all ages and especially among men. Table V.22. shows the trend since 1901; over the last seventy years the proportion of the widowed and divorced who remarry has increased by almost 300% for young men and by 250% for young women. While the proportion of successful marriages diminishes. the condition of marriage. at least among those experienCing it. increases in popularity. Remarriage is an expanding variation. It should be noted. however. that it is related to the economic situation. Thus. during the depression of the early thirties the rate of remarriage among the under 40s fell for both sexes but rose sharply thereafter; there are signs that it may now be falling again among the younger age groups. For Britain "it is not possible to apportion the exact distribution of divorce and widowhood to the extent to which marriages end before the child bearing period is completed. but it might be interesting to note that of those marriages contracted in 1951 where the wife's age was 20/24 years and which had ended by 1971. approximately 60% could be attributed to divorce and 40% to widowhood ••• a larger proportion of divorced than of widowed persons re-marry" - Social Trends. 1973. pp 11 - 12.
The final section of this chapter examines the four most common exceptions. cases for which the framework of the conventional family life cycle do not apply. These are: (I) the never-marrieds who live in no family nor in any alternative form of union. though they may be members of a household. (II) illegitimate children and one parent living together as a one-parent family (III) two homosexuals living together in a stable union and (IV) stable consensual unions. with or without children. Unfortunately there is no adequate data for any of these classifications although there is reason to believe some may be increasing and. if only because they contravene the mores of most industrial societies. they are all associated with certain characteristic social problems.
There are probably a larger proportion of single women living without the bonds of a family or union than there are men. Although there is no established means of estimating the number of spinsters who share a consensual union or remain at home with one or more parent. Table V.23. indicates the proportion of single women in seven European countries by age group. If we suppose that onethird of each category fulfils our criteria for exception (I) this means a total of ~ of the total adult female population between the ages of 35 and 55. Here

- 79 -
it is interesting to observe that whereas in France and the Federal Republic of West Germany the proportion of spinsters tended to decrease by age grouPI in the two Scandinavian countries observed I the proportion increased by age grouPI while in the two Eastern European countries there was no clear association between proportions and age; New Zealand followed the Scandinavian pattern. Whatever the explanation for these marginal differences the important fact is that this class of exception represents a significant group in the total population I both numerically and socially.
Although it is impossible to estimate the proportion of one-person households over time who fall into our category I. it should be noted that in the developed world the trend in household size has been downward. Thus the average household size in the United Kingdom has fallen from 4.6 in 1801 to 3.0 in 1967, and in the United States of America {over the same period)1 from 5.7 to 3.3. SimilarlYI the Canadian figure has fallen from 5.9 in 1870 to 3.86 in 1966 and (over the same period), in the Federal Republic of Germany from 4.6 to 2.69}1 More significantly for our purpose l the percentage of one-person households in the United States has risen from 3.7 in 1790, 5.1 in 1900, 9.3 in 1958 to 14.7 in 1960. 12
The second group of exceptions comprise illegitimate children living with one parent outside a marital or consensual union l that is a single-parent family living alone.
The number of one-parent unmarried families in a country is related to the number of illegitimate births in that country. Although there are more demographic statistics about illegitimacy than any of the other exceptions we have noted, the details are not always reliable and we cannot accurately predict what proportion of illegitimate children continues to live only with one parent. With regard to illegitimacy rates in general, the United Nations Demographic Yearbook (1959) comments that a wide range of illegitimacy ratio is consistent with the corresponding marriage rates in these areas and with the proportion of the female population remaining single. Central and South America show marriage rates of less than 5 per 1 000 population I while in Europe and other areas the rates rose to 10 and over. Up to 50% of the female population aged 45-54 is reportedly 'single' in the West Indies and in some parts of Latin America l
while in Europe corresponding proportions range from 10% to 14%.
From Table V.24. it will be seen that the percentage of illegitimate births of all live births ranges from less than 5% to over 70%1 an enormous variation, although in countries where the nuclear family predominates the range is much less l from 5% to about 24% (in Iceland).
If illegitimacy rates for the industrialized nations are examined over the last period for which comparative data are available (1951-1964) one finds a diminution during the fifties, followed in .most cases by an increase that in the case of Great Britain has continued into the seventies so that the percentage has exactly doubled since 1901. This is illustrated in Table v.26. The slight fall during the depression will be noted l also the sharp rise over the past ten years.
In Denmark, the patterns over a longer period of time, from the 1815 generation of females to 19441 can be traced, showing a continuing increase of births out of wedlock among the under 20s but a decline for all other ages. Closer inspection l however l reveals that the trend toward a decrease ended between 1905 and 19101 and that rates have again begun to increase for female generations

- 80 -
since that of 1905/91 except for the 20-25 year age group for which the rate remains comparatively stable. Stated slightly differentlYI these figures indicate the care with which any set of national data requires analysis l especially when (as in the case of Denmark) the most recent evidence for a trend is ambiguous. SociallYI the critical fact may be the contrasting behaviour patterns of different age groups. Thus the 15-20 year age group have steadily increased their rate, except for the generations between 1895 and 1924 year age.
The variation of behaviour among age groups is not the only factor which makes an analysis of the causes (as well as the patterns) so difficult. Regional differences I which may mask climatic, sociai and economic characteristics, can vary remarkably. This is ex.emplified in the classic studies of Eilert Sundt 13 in Norway. If the rate of illegitimate births for each of the fifteen deaneries (districts) during the period 1845-1855 is examined, the range is found to have varied from 2% to over 20%1 a variation greater than the current British figure or for any contemporary European country. The variations are illustrated in Table v.28.
Whilst in the Norwegian case the social composition of the districts was probably more responsible for the differences than variations in age composition or any other factors, it is age which has continued to interest demographers more and it is age which probably most deCides whether or not the mother will live as a single-parent family. It is important, therefore l to note that in Great Britain the percentage of pre-marital conceptions of legitimate live births is much higher (56.1% in 1972) for the youngest age group than for others l the corresponding figure in 1972 for the 20-24 year age group being 10%.
The next issue (Exception II) is the proportion of illegitimate children who continue to live as a one-parent family with their mother. In the United States of America it has been estimated by Adams and Gallagher 14 that in 1960 of about 2.5 million children under 18 who had been born illegitimate I 1)% were receiving aid to dependent children, 10% were in foster carel and 31% had been adopted. The authors surmised that of the remaining 55%1 the majority of unmarried mothers who kept their children continued to manage in some way through subsequent marriage l employment I or support by relatives and friends. The greatest problem facing the parent of single-parent families is their children's fear of being different or of being isolated.
At any single time the size of exceptiQn II in all industrialized nations is considerable, although for many their existence outside the framework of any conventional family will be only temporary. It is estimated that about 10 000 000 American children under the age of 18 live in one-parent homes. In this connection it is important to remember that at the current rate about 1 500 000 legal separations occur in the United States each year, the majority having at least one child l and that the children are generally living with their mother. This l together with divorce and widowhood (there are about one million widowed mothers living in the United States with one or more Children), accounts for the fact that one out of every ten American families has a female head.
The third group of exceptions comprise homosexuals living stably together in union. The numbers and the respective proportion for each sex cannot be assessed accurately. Kinsey has argued that in the United States 50% of men who remain unmarried at the age of 36 are homosexual, but there is no means of knowing what proportion of these may be living together as a diadic "family". All that it is safe to say is that the trend towards greater liberalization in the laws
- 81 -
in many countries governing homosexual practices performed in private suggests that the number of such unions may be increasing. This may be a factor in the increased percentage of no-family households reported in Great Britain and elsewhere. In Britain this figure rose from 16.8 in 1961 to 19.4 in 1966 and to 22.0 in 1971.
FinallYI exception IV: these are consensual unions, single men and women living together as a family, with or without children. In those countries, such as the United States of America and Great Britain, where households are becoming smaller and illegitimacy rates are rising, the increased number of consensual unions which some observers predicate may be among the reasons. But this is an area where much more demographic investigation is required. It is possible that the extent of social change governing the relationship between the sexes and therefore involving the family as it is presently understood, is greater than is generally realised. But the so-called permissive society is largely undocumented.
A discussion of the exceptions and variations to the model nuclear family life cycle cannot end without a word on its most clearll defined cultural alternative, the extended family. According to Taeube~5 , the nuclear family covers 92.4% of white and 83.5% of non-white families in the United States of America. She submits, on the basis of sample surveys, that about 6)% of families amongst Chinese farmers are of the nuclear type. Other interesting estimates are produced in Table V.29.
If these figures are even approximate to the truth, the areas of the world where the nuclear family is the predominant type are large and may be growing. But this chapter will have illustrated that exceptions and variations, even in cultures where the nuclear family is dominant, account for a very important proportion of both the adult and child populations. In terms of the social problems primarily generated by familial circumstances the exceptions and variations are at least equal in importance to those generated within the nuclear family life cycle itself.

- 82 -
TABLE V.1.
Crude Divorce Rates (Divorce per thousand population)
Country 1920-24 19~-34 1940-44 1950-54 1960 1967 1971
United Kingdom .07 .10 .20 .68 .51. .88 1.50
United States of America
1.48 1.47 2.46 3.35 2.18 2.64 4.03
Japan .92 .75 .66 .93 .74 .83 1.00
Germany I Fed. .59 .67 .75 1.13 .83 1.00 1 • .31
Republic of
* unreliable
Source: UN Demographic Yearbook (1968)1 table 33 and (1972) table ~.
TABIE V.2.
Final Divorce Decrees in Poland 1955-19641 per ten thousand of total adult population.
Year Rate
1955 4.9
1956 5.0
1957 5.5
1958 5.5
1959 5.3
1960 5.0
1961 5.5
1962 6.0
1963 6.3
1964 6.7
Source: J. GORECKI I Divorce in Po1and l Mouton, 1970. Table 11 p. 10.
*

United States of America
1958
1964
Japan 1958
1964
Denmark 1958
1966
Uni ted Kingdom 1958
1966
- 83 -
TABLE V.3.
Proportion of Marriages Ended by Divorce after Selected Years since Marriage by Rates of Marriage,
United Kingdom. (Proportion per 1000 marriages)
Duration of marriage (years)
Year of Marriage 5 10 15 20 25
1921 1 5 9 14 20
1926 1 5 12 19 32
1931 2 8 16 36 49
1936 1 10 42 57 69
?;()
28
40
61
82
1941 3 41 63 76 88 103
1946 10 37 55 72 90
1951 8 ?;() 52 74
1956 8 39 70
1961 12 59
1966 21 Source: Social Trends, 1973. Table VI.
TABLE v.4. Divorce by Duration of Marriage (hundreds of marriages)
Duration in years Less than one year 1 2 3 4 5 6 7 8 9 10/14
40 50 53 43 35 32 27 25 22 19 80
82 137 1?;() 114 104 96 81 77 72 59 226
117 94 75 58 48 42 37 35 33 32 95
127 101 81 68 55 48 41 34 ?;() 26 92
0.8 3 4 5 5 - - - - - 20- 11
0.8 2 5 6 6 - - - - - 19- - - - - - 10
- - -3- - - - 7 14 14 14 13 12 13 51
- - 3.5 - - - 12 ?;() 29 27 26 23 22 83
Source: UN Demographic Yearbook (1972) Table 40.
15/19 20+
45 58
176 194
39 33
55 35
7 10
8 11
36 49
58 77

- 84 -
TABLE V.5.
Divorce and Annulment by Age. United KingOom. (hundreds of marriages)
Calendar Age in years
Year 20-24 25-29 30-34 35-39 40-44 45-49 50-54 55-59 60+
Husbands 1958 5 3~ 45 43 33 29 - - -30- - - 7 1962 8 46 58 50 43 33 - - -36- - - 10
1966 15 75 83 66 55 38 - - -45- - - 14
Wives 1958 17 45 44 40 29 23 - - -20- - - 4
1962 27 61 55 47 38 26 - - -25- - - 6
1966 44 94 76 58 48 32 - - -31- - - 8
Source: UN Demographic Yearbook (1972). Table ;;5.
TABLE V.6.
Trends in Divorce by Number of Dependent Children (hundreds of marriages)
Number of Ohildren
0 1 2 3 4 5 b+ United States of America
1958 222 122 83 39 17 6 4
1962 542 327 257 139 62 - - 45 - -1966 658 379 303 173 87 34 32.5
Japan 1958 300 223 127 60 22 6 2
1962 298 221 122 51 17 4 1
1965 322 244 141 47 14 3 1
Denmark 1958 27 20 13 4 1 0.3 0.2
1962 26 20 12 4 1 - - 0.5- - -1966 25 22 14 4 1 0.3 0.1
United KingOom 1958 77 69 47 20 8 - - -6- - -1962 90 86 64 29 12 - - -9- - -1966 110 107 93 46 19 - - 15- - -
Source: UN Demographic Yearbook (1972). Table 39.

- 85 -
TABLE V.7.
Proportion of Marriages Ended by Divorce after Selected Years since Marriage by Age of Wife and Year of Marriage, United Kingdom. (Per thousand marriages)
Age of wife at marriage Duration of marriage
and year of marriage 5 10 15 20
Under 20
1951 20 62 100 141
1956 14 70 127
1961 20 106
1966 33
20 - 24
1951 8 28 47 67
1956 6 33 62
1961 10 49
1966 18
2:2 - 22
1951 6 22 34 46
1956 6 24 42
1961 7 32
1966 14
Source: Social Trends, 1973. Table VIII.
TABLE V.8.
Percentage Decline of Mortality Rates by Age Group, Both Sexes, 1940-65
Age (in Ceylon Chile Taiwan Jamaica Mauritius Puerto Rico Trinidad + years) 1946-63 1940-60 1940-65 1943-60 1944-62 1940-60 Tobago
1946-60
Under 1 70 38 84 49 68 78 47
1-4 70 69 86 47 73 78 47
5-14 69 52 82 72 76 84 68
15-24 72 71 73 70 83 81 73
25-34 72 56 75 67 84 82 64
35-44 66 45 73 59 78 73 56
45-54 58 36 64 45 67 62 45
55-64 48 27 50 30 54 55 36 65 & over 22 24 27 25 39 38 12
Source: UN Determinants & Consequences of Population Trends, Vol. 1.(1973) Table V.9

- 86 -TABLE V.9.
Percentage Decline of MOrtality Rates by Age Group, by Sex, 1940-1965
United France Netherlands Norway Kingdom
m f m f m f m f
0-4 90 91 94 94 92 94 95 96 5-14 85 89 85 91 85 91 85 89
15-24 79 84 80 88 79 86 76 81
25-34 74 81 82 83 77 84 80 82
35-44 64 73 77 82 68 78 78 79
45-54 42 59 64 65 55 64 56 65
55-64 25 52 51 53 42 50 34 56 65 & over 26 44 43 43 18 27 24 43
Source: ibid, Table v.8.
TABLE V.10.
Widowhood Rates (excluding non-civilian mortality) in the United Kingdom
Age of surviving partner
Under 25 25-29 30-34 35-39 40-44
Deaths of husbands per 10 000 married women
born around: 1925 10.8 12.5 15.3 25.9 49.5
1930 8.7 10.2 14.9 25.0
1935 8.4 9.8 13.7 1940 7.6 9.1
1945 7.3
Deaths of wives per 10 000 married men
born around: 1925 14.9 8.7 7.6 10.9 16.8
1930 6.6 5.6 6.5 9.3
1935 4.3 4.6 6.0
1940 3.8 4.2
1945 3.4
Source: Social Trends, (1973), Table VIII.

- 87 -
TABLE V.ll.
Death Rates by Marital Status and Sex for Selected Age Groups# United States of America# 1960.(Deaths per 1 000 population in specified group)
(male-female)
Age group 'foUi.l Single Married Widowed Divorced
25-34
45-54
60-64
70-74
m f m f m f m f m
1.9 1.1 3.4 2.0 1.5 0.9 6.8 3.0 5.3
9·9 5.3 15.7 6.4 8.4 4.6 21.0 8.5 25.9
28.6 15.0 38.0 14.6 25.3 13.1 44.0 18.7 57.0
59.5 36.7 76.3 35.1 53.4 32.9 77.0 40.2 96.6
Source: GROVE & HETZEL# Vital Statistics Rates in the United States# 1940 - 1960. (1968)# p. 334.
TABLE V.12.
Infant Mortality Rates for Selected Developed Countries# 1906-10 # and 1960-64
f
2.2
7.2
17.3
41.6
Average Average Percentage Country Annual Rates Annual Rates decline
1906-10 1960-64
Australia 76a 20 74
Austria 202b 33 84
Belgium 141 28 80
Bulgaria 161 38 76
Denmark 108 20 81
Finland 117 20 83
France 126 26 79
Hungary 204b 44 78
Italy 152 40 74
Japan 159 26 84
Netherlands 114 16 86
New Zealand 70 18 74
Norway 70 18 74
Portugal 149 77 48
Spain 159 42 74
Sweden 78 15 81
Switzerland 115 20 82
United Kingdom 117 21 82 a
1907-1910 b
Territory before 1913.
Source: Data for 1906-10 from BUNLE# Le l\buvement natural de la population ••• (1954)# pp 134-134: date for 1960-64 from UN Demographic Yearbook# 1966# Table 14.

- 88 -
TABLE V.13.
Infant Mortality Rates for Selected Developing Countries, 1935-39 and 1960-64
Country or Average Annual Rates % age decline
area 1935-39 1960-64
Ceylon 182 54~ 70 China: Prov.of Taiwan 144 28 81
Jamaica 127 48 62
Malaysia 149 58 61
Singapore 152 31 80
Trinidad & Tobago 104 41 60
a Four year average
Source: UN Determinants and Consequences of Population Trends, Table VII.
TABLE V.14.
Infant Mortality Trends in Urban SWeden, 1811-1964
Deaths under one year Year per 1 000 live births
181l-20 243 1831-40 229 1851-60 219 1871-80 193 1891-1900 130 1911-20 76 1921-30 58 1931-40 40
1941-50 25 1951-60 17 1964 14
Source: UN Determinants and Consequences of Population Trends, Table v16.

- 89 -
TABIE V.15.
Number of Childless Families in Specified Social Status Categories. Great Britain. (Marriages of women under 45 only)
Social Class
Professional
Salaried Employees
Manual Wage Earners
Labourers
Period
1890-99
1900-09
1925
1890-99
1900-09
1925
1890-99
1900-09
1925
1890-99
1900-09
1925
Number of women per thousand
109
135
181
97
128
220
70
87
134
89
93
133
(12.8% of marriages)
(22.0% of marriages)
( 8.7% of marriages)
(13.4% of marriages)
Source: GLASS & GREBENIK# Trends and Patterns of Fertility in Great Britain# 1954# Table 42# p. 113; also p. 112.
TABLE v.16.
Childlessness by Date of Marriage and Social Status Group. Great Britain. (Percentage of marriages)
Date of Marriage
1910-14
1915-19
1920-24
1925-29
1930-34
1935-39
1940-44
Estimated true childlessness
Social Group I Social Group II
14.8 10.8
17.7 12.7
18.3 12.7
21.5 15.0
22.1 15.8
25.4 19.9
44.3 37.7
Source: GLASS & GREBENIK# Trends and Patterns of Fertility in Great Britain# 1954# Table 43# p. 114.

- 90 -
TABLE V.17
Childless Women Married Once Only Under Age 45, in Great Britain, (Percentages)
Duration of Marriage (exact ~ears)
2 5 10 15 20 Year of Marriage 1951 1956 1961 1966 1969 1951 1956 1961 1966 1951 1956 1961 1951 1956 1951
Percentage Childless 50 46 42 45 51 26 22 19 20 16 12 11 14 10
Year
1950
1954
1958
1960
1964
Year
1958
1962
1966
Source: Social Trends, 1973. Table V.
TABLE v.18
Marital Status of Bridegrooms and by Marital Status of Brides, Canada, 1950-1964. (Percentage of class)
Marriages Between:
Bachelors Widowers Divorcees
Spinsters Widowed Divorced S W D S W
95.1 2.5 2.4 44.6 47.8 7.5 67.0 11.1
95.2 2.2 2.6 40.2 51.1 8.7 62.5 12.8
95.3 2.1 2.6 37.1 53.8 9.1 60.9 12.8
95.3 2.1 2.6 35.0 55.8 9.2 58.7 12.9
95.5 1.9 2.6 32.0 58.1 9.9 55.7 10.8
Source: Adapted from Nuptia1ity, Statistics Canada Ottawa, Cat. 84-523, May 1967.
TABLE V.19.
Mari tal Status of Bridegrooms and by Marital Status of Brides, United Kingdom, 1958-1966. (Percentage of class)
Marriages Between:
Bachelors Widowers Divorcees
Spinsters Widowed Divorced S W D S W
95.1 1.7 3.2 41.0 44.1 14.9 60.0 12.8
95.0 1.6 3.4 36.2 47.9 15.9 58.5 12.8
94.7 1.4 3.9 33.0 48.9 17.7 57.1 11.2
Source: Adapted from UN Demographic Yearbook. 1968. Table 30.
13
D
21.9
24.7
25.3
28.4
33.5
D
27.2
28.7
31.7

- 91 -
TABLE V.20.
Marr.iage Cross-Classified by Previous Marital Status. United Kingdom. (Thousands)
Men
Year Single Widowed Divorced
Single
1958 2882 77 108
1962 2941 68 114 W 1966 3212 62 153
0 Widowed
m 1958 50 83 23
1962 49 90 25 e 1966 47 91 30
n Divorced
1958 98 28 49
1962 104 30 56 1966 133 33 85
Source: UN Demographic Yearbook I 1968. Table 30
TABLE V.2l.
Marriages Cross-Classified by Age & Previous Marital Status. United Kingdom. (Thousands)
Age Groom Bride
Group N S W D N S W D
16-19 334 334 1115 1115
20-24 1930 1922 2 7 1799 1773 3 23
25-29 789 7;13 5 46 ;130 314 6 60
30-34 268 206 5 56 150 94 7 49
35-39 143 88 7 47 100 50 11 39 40-44 99 46 13 40 78 28 17 32
45-49 67 24 16 28 66 19 24 23
50-54 59 15 23 21 52 13 25 14
55-59 51 9 30 13 39 9 22 7 60-64 42 5 31 6 32 6 23 3
65+ 62 4 55 3 34 5 23 1
Source: UN Demographic Yearbook I 1968. Table 31.

- 92 -
TABLE V.22.
Remarriages. Great Britain. 1901-197l. (Per thousand widowed and divorced population)
Age in Years 1901 1911 1921 1931 1951 1961 1966 1970 1971
Men 16-29 175 165 208 160 313 464 517 500 472
30-34 174 165 217 151 366 314 348 342 375
35-44 131 114 150 127 226 167 198 202 223
45-54 65 56 70 63 114 92 97 100 113
Women 16-29 140 142 159 126 294 333 358 379 351
30-34 96 96 102 88 180 227 203 193 207
35-44 48 46 50 35 83 72 96 99 100
45-54 15 14 17 13 26 28 31 35 39
Source: Social Trends (1973). Table 6.
TABlE V.23.
Percentages of Single Women in Specified Age Groups
Age groups
Country & Year 35-39 40-44 45-49 50-54
France. 1962 10.4 9.1 9.2 9.1 Germany. Federal
12.7 10.8 9.3 9.6 Republic of. 1961
Sweden. 1960 9.8 9.4 10.9 13.8 Denmark, 1960 8.3 7.8 9.1 11.4 Czechoslovakia, 1961 6.5 6.1 6.0 6.9 Hungary, 1960 7.6 7.5 7.1 7.4 New Zealand. 1961 7.7 6.8 8.6 9.7
Source: E.A. WRIGLEY. Population and History. World Univ. Library, 1969, Table 1.1, p.16.
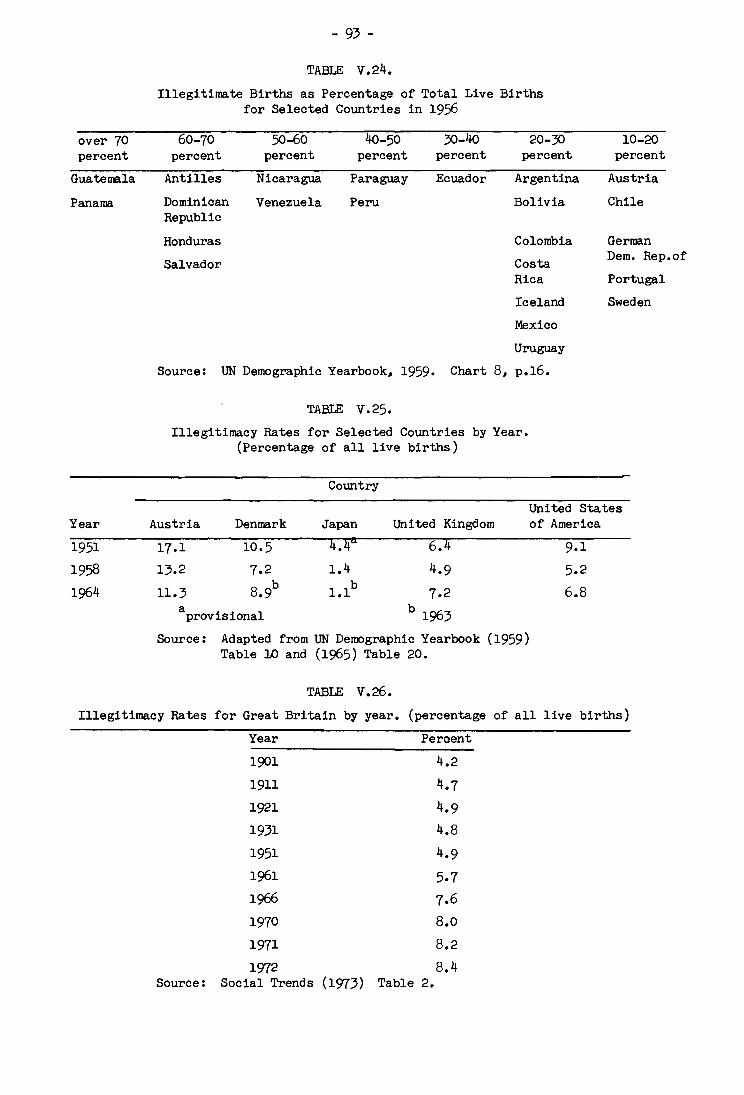
over 70 percent
Guatemala
Panama
Year
1951
1958
1964
- 93 -
TABLE v.24.
Illegitimate Births as Percentage of Total Live Births for Selected Countries in 1956
60-70 50-60 percent percent
Antilles Nicaragua
Dominican Venezuela Republic
Honduras
Salvador
40-50 percent
Paraguay
Peru
30-40 percent
Ecuador
20-30 percent
Argentina
Bolivia
Colombia
Costa Rica
Iceland
Mexico
Uruguay
Source: UN Demographic Yearbook, 1959. Chart 8, p.16.
TABLE V.25.
Illegitimacy Rates for Selected Countries by Year. (Percentage of all live births)
Country
10-20 percent
Austria
Chile
German Dem. Rep.of
Portugal
Sweden
United States Austria Denmark Japan Uni ted Kingdom
17.1 10.5 4.4a 6.4
13.2 7.2 1.4 4.9
11.3 8.9b l.lb
7.2 a provisional b 1963
Source: Adapted from UN Demographic Yearbook (1959) Table 10 and (1965) Table 20.
TABLE V.26.
of America
9.1
5.2
6.8
Illegitimacy Rates for Great Britain by year. (percentage of all live births)
Year Percent
1901 4.2
1911 4.7
1921 4.9
1931 4.8
1951 4.9
1961 5.7
1966 7.6
1970 8.0
1971 8.2
1972 8.4 Source: Social Trends (1973) Table 2.

- 94 -
TABLE V.27.
Age-8pecific Fertility Rates Out of Wedlock for Generations of Females, . 1815-1819 to 1940-1944 in Denmark. (Per 1 000 females)
Age-Group
Generation 15-20 20-25 25-30 30-35 35-40 40-45
1815-19
1820-24 13.4
1825-29 31.4 12.4
1830-34 47.5 30.7 11.7
1835-39 58.6 45.3 29.8 11.4
1840-44 5.0 40.8 56.8 43.8 27.8 10.6
1845-49 5.6 41.2 54.0 42.6 27.0 9.8
1850-54 6.1 40.6 52.5 40.8 26.5 9.2
1855-59 6.6 40.1 51.1 37.4 25.8 8.9
1860-64 6.3 40.0 46.5 35.0 23.8 8.2
1865 .. 69 7.6 38.0 42.4 33.1 21.8 7.3
1870-74 8.1 37.7 41.2 31.2 21.0 7.0
1875-79 8.6 39.0 40.3 28.3 19.0 6.2
1880-84 10.0 41.1 37.5 24.8 15.4 4.7
1885-89 12.2 42.0 33.0 21.4 11.9 3.4
1890-94 14.1 39.4 28.4 17.5 9.7 2.7
1895-99 13.7 35.6 23.6 14.2 8.2 2.6
1900-04 13.3 31.2 19.9 12.3 8.4 3.1
1905-09 13.6 27.3 18.7 14.2 10.6 3.4
1910-14 12.7 24.7 21.0 18.7 11.1 3.2
1915-19 11.7 27.1 26.8 19.4 10.2 3.3
1920-24 12.1 33.4 27.0 18.4 11.4 3.-ji
1925-29 13.7 30.7 23.9 21.6
1930-34 14.3 25.0 29.4
1935-39 13.1 26.6
1940-44 14.5
a extrapolated
Source: P • C. MATTHIESSEN, Some Aspects of the Demographic Transition in Denmark. Copenhagen (1970) Table X1.2. p. 179.
45-50
1.1
1.2
1.1
1.0
0.9
0.8
0.8
0.8
0.7
0.6
0.5 0.4
0.4
0.3 0.2
0.2
0.2
0.2
0.2
0.1
O.la
O.la

- 95 -
TABLE V.28.
Number of Illegitimate Births per 100 Legitimate Births and for Every 100 Marriages, 1846-55. (Norway by deanery)
Deanery Groups Illegitimate births per 100 legitimate births.
Illegitimate births per 100 marriages
1
2
3
4
5
6
7
8
9
10
11
12
13
14
15
15.9
6.0
2.2
4.3
4.1
14.2
4.6
20.1
12.4
14.1
10.6
33.9
61.8
32.5
23.1
10.4
19.6
15.6
57.9
16.8
70.2
65.0
42.3
51.7
40.0
Source: EILERT SUNDT, Fortsatte bidrag angaaende Soedeligheds-tilstanded i Norge, Christiania 1864, p. 27.
For a further discussion of this Table see DRAKE, Population and Society in Norway. C.U.P. 1969. p. 146.

- 96 -
TABLE V.29
Estimated Percentage of Nuclear and Extended Family Types in Selected Regions
Country or area
Japan (1965 census)
Republic of Korea (1966 census)
Phi11ipines (1968~ sample survey)
Thailand (1968~ sample survey)
rural
provincial urban
Bangkok - Thonburi
Singapore (1966~ sample survey)
Chinese Village (Yangtze plain)
Village in North India
Jats & Brahmins
Other castes
Desert village in Pakistan
Modjukta District~ Java, Indonesia
467 towns
153 villages
% nuclear family type
68.1
66.8
79.1
63.8
63.6
56.1
80.0
53.3
32.2
64.8
41.0
57.8
74.5
% extended family type
31.9
33.2
19.6
33.9
25.3
28.3
20.0
39.2
66.7
33.7
49.0
32.4
19.9
Source: MERCEDES B. CONCEPCION & FELIPE L. JOCANS, Demographic Factors influencing the family cycle. E./Conf/.60/SYM.II/7. Reproduced as Conference E/Conf. 60/6. p. 37 footnote 42 in UN Population.

- gr -
CHAPTER VI
THE HISTORICAL DIMENSION
The objectives of this chapter are to consider. for a variety of countries. changes in the length of phases of the life cycle over time and to document the increasing probability that. in all countries. individuals will experience all six phases of the basic model.
These objectives are only partially attained. A systematic and thorough analysis of changes in the family life cycle is hampered by formidable data limitations. especially where comparisons between countries are concerned. If a longitudinal analysis of the family life cycle is to be satisfactory. it must cover many decades; significant changes cannot be expected in less than 50 years. No statistical office in the world anticipated the need for data on the family life cycle. particularly on those phases dealing with the spacing of children. Consequently. the discussion that follows is less than satisfactory. being based on restricted and fragmentary evidence.
One problem for long-term international demographiC analysis is the lack of an adequate statistical data basis. Data are available since the beginning of the last century only for a few European countries. As demographic processes are long-term. this is a general handicap. espeCially for countries in the early stages of their demographic evolution.
Thanks to the impressive recent work of European historical demographers. more is known about the family life cycle in 16th rnd 17th century Europe than for 20th century developing countries (see Wrigley for a valuable review of this literature). Although only partially covering the six phases. this historical work does cast light on the family life cycle as a whole.
Entry into marital unions in Europe was subject fO considerable variation but on the whole it tended to occur rather late. Hajnal has called attention to the "unique" European patterns that "existed for at least two centuries up to 1940" and which have not been encountered elsewhere in the world. The European pattern had two characteristics: a rather high proportion of the population who never married; and a delay in age at first marriage. Both these characteristics were quite sensitive to changing economic conditions. In good times. more people were able to marry and at earlier ages. The forms of labour common at that time for young people - apprenticeship for males and domestic service for females -tended to delay marriage for both sexes. Depending upon the circumstances. first marriage was delayed until the middle twenties or even later. This effectively meant the control of fertility long before contraceptive devices came into general use.
Once in marital unions. little control was practiced and the number of live births per wife was quite high. as shown in Table VI.l. which presents data for several French parishes in the 17th and 18th centuries. All parishes
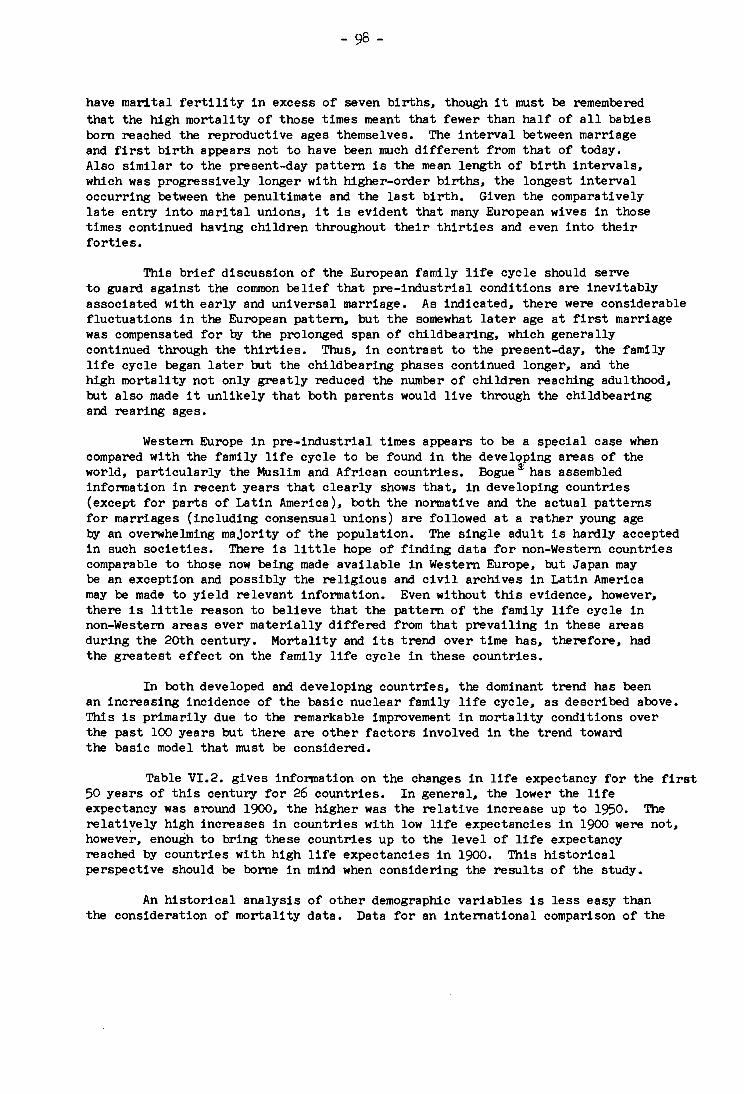
- ~ -
have marital fertility in exoess of seven births~ though it must be remembered that the high mortality of those times meant that fewer than half of all babies born reaohed the reproduotive ages themselves. The interval between marriage and first birth appears not to have been muoh different from that of today. Also similar to the present-day pattern is the mean length of birth intervals, whioh was progressively longer with higher-order births, the longest interval oocurring between the penultimate and the last birth. Given the oomparatively late entry into marital unions, it is evident that many European wives in those times continued having children throughout their thirties and even into their forties.
This brief discussion of the European family life cycle should serve to guard against the common belief that pre-industrial conditions are inevitably associated with early and universal marriage. As indicated, there were oonsiderable fluotuations in the European pattern, but the somewhat later age at first marriage was compensated for b.1 the prolonged span of Childbearing, whioh generally continued through the thirties. Thus, in contrast to the present-day, the family life oycle began later but the childbearing phases oontinued longer, and the high mortality not only greatly reduced the number of children reaching adulthood, but also made it unlikely that both parents would live through the childbearing and rearing ages.
Western Europe in pre-industrial times appears to be a special case when compared with the family life oycle to be found in the develQping areas of the world, particularly the Muslim and African countries. Bogue $ has assembled information in reoent years that olearly shows that, in developing countries (exoept for parts of Latin America), both the normative and the actual patterns for marriages (including consensual unions) are followed at a rather young age by an overwhelming majority of the population. The single adult is hardly accepted in such societies. There is little hope of finding data for non-Western countries oomparable to those now being made available in Western Europe, but Japan may be an exception and possibly the religious and oivil archives in Latin America may be made to yield relevant information. Even without this evidence, however, there is little reason to believe that the pattern of the family life oycle in non-Western areas ever materially differed from that prevailing in these areas during the 20th century. Mortality and its trend over time has, therefore, had the greatest effect on the family life cycle in these oountries.
In both developed and developing countries, the dominant trend has been an increasing inoidence of the basic nuolear family life cycle, as desoribed above. This is primarily due to the remarkable improvement in mortality conditions over the past 100 years but there are other factors involved in the trend toward the basio model that must be considered.
Table VI.2. gives information on the changes in life expeotancy for the first 50 years of this century for 26 countries. In general, the lower the life expectancy was around 1900, the higher was the relative increase up to 1950. The relatively high increases in oountries with low life expectancies in 1900 were not, however, enough to bring these countries up to the level of life expeotancy reached by countries with high life expectancies in 1900. This historical perspeotive should be borne in mind when considering the results of the study.
An historical analysis of other demographic variables is less easy than the consideration of mortality data. Data for an international oomparison of the

- 99 -
changes in the average age at first marriage prior to 1950 are rare. The average age at first marriage for eight countries is given in Table VI.3. for a ten-year period. A decrease in the average age at first marriage for both sexes can be observed for most of the selected countries. For Italy and for men in the United Kingdom, however, an opposite trend appears. Given the paucity of longitudinal data on the subject, two recent articles by Uhlenberg 4 ,5 are very helpful in charting the major changes. In his earlier article, he sets for himself a task somewhat different than the one addressed here, for his concern is with the "typical" life cycle. But even though he follows cohorts of women through their life cycle from birth rather than age at entry into union, his concern principally is with the family life cycle. In order to provide a sufficiently long time series of actual data he relied on records from the state of Massachusetts, United States of America. He further restricted himself to the native-born, because in Massachusetts the variation in number of foreign born during the period of the study, 1830-1920, is so great as to distort any temporal comparison. He limits himself to females because of the lack of data on couples.
Uhlenberg begins with the plausible, if undocumented, assertion that the "normatively sanctioned life cycle that a baby born into American society is expected to follow as he moves from birth to death has remained remarkably stable during the past century".4 Specifically, a woman is expected to get married and have children, to rear them and eventually see them leave home. She and her husband then live alone together for a time, with the likelihood that her husband will die first, leaving her a widow. Uhlenberg's problem is to determine for successive birth cohorts how many females will experience this "normatively sanctioned" sequence.
His strategy in answering this question is straightforward. For females born in each of five time periods (1830, 1850, 1870, 1890, and 1920), he shows the percentage following each of the six types of life cycle. The types of life cycle are identified as follows:
Type 1. Abbreviated. All females who die before reaching age 20 (an arbitrary age designating the age of marriage).
Type 2. Spinster. Females who do not marry before age 50, including both those who die between ages 20 and 50 and those who are still alive at the latter age.
Type 3. Barren. Females who marry but never become mothers, including those who are childless at age 50 and those who die childless before that age.
Type 4. Dying mother. Married mothers who die before reaching age 55 (an arbitrary designation of the age of the mother when the youngest child leaves home).
Type 5. Widowed mother. A wife and mother surviving to age 55 whose first husband dies before she reaches this age.
Type 6. TYpical. Women who survive to age 20, marry, have children, survive with husband alive to age 55.

- 100 -
Uhlenberg's figures for the five time periods are shown in Table VI.4. They strikingly reveal how unlikely it was that a baby girl born in any of the four time periods of the 19th century would have experienced a Type 6 life cycle, the "normatively sanctioned" life cycle. For the 1830 cohort, only one out of every five females foilowed a Type 6 life cycle. What is at first surprising is the fact that in the sixty years between 1830 and 1890, the percentage of women in Type 6 increased only from 20.9 to 27.4. This becomes more understandable if the counter currents for the period are examined. Types 1, 4 and 5 (down from 56.6 per cent in 1830 to 42.6 per cent in 1890) which reflect the improvement in mortality are offset to an extent by the increase of women who are spinsters or are childless (up from 22.4 per cent in 1830 to 30.0 per cent in 1890). In the thirty year interval between 1890 and 1920, Types 1 to 4 decreased and Type 5 remained stable, with the result that the number of women following the typical life cycle (Type 6) more than doubled; for the first time, more than half fell into this category. No figures are available for more recent birth cohorts but it is. almost certain that, for the 1940 cohort, two out of every three women will follow the typical life cycle pattern.
In his 1974 article, Uhlenberg took a somewhat different approach, concentrating on changes in the family life cycle change for females between the ages of 15 and 50, for five birth cohorts from 1890-1894 to 1930-1934. The five types were as follows:
Early death. Female dies between ages 15 and 50.
Spinster. Female survives, does not marry before age 50.
Childless. Female survives and marries, but has no live birth.
Unstable marriage, with children. First marriage is broken by age 50.
Preferred. Female reaches age 50 living with first husband and having produced at least one child.
Table VI.5. provides the distribution for each of the five birth cohorts who experienced the five types of family life cycle. The "preferred" type (analagous to the "typical" type of the earlier article) rises from 425 of the original 1 000 in the earliest cohort to 645 in the latest cohort. The results of the two articles are not comparable, since th~ latter does not include mortality up to the age of 15 years but includes marriages broken by divorce or separation. Uhlenberg notes that women can still apprOXimate the preferred pattern by remarriage and adoption. He estimates that by taking these "adaptations" into account, the number of women surviving from the initial 1 000 under either the "preferred" or "modified preferred" life cycle rises to 780 for the 1930-1934 cohort.
In a similar analysis of life cycle patterns for a 1930-1934 cohort of nonwhite females, Uhlenberg finds that the nonwhite women have higher representation in all types except "preferred", the number out of a 1 000 having the "preferred" life cycle being only 350 compared with 645 for white females. The major contribution to the large difference comes from the unstable marriage pattern. For another ethnic group, for example, Mexican Americans, this would be a lesser factor because of the Catholic restraints on divorce. Most countries will have some

- 101 -
ethnic groups whose patterns differ significantly from that of the population as a whole.
The two articles by Uhlenberg provide an important confirmation of the utility of examining changes in the family life cycle. He clearly demonstrates that from 1830 to 1930, but principally since 1890, there has been a remarkable increase in the proportion who experience the basic model of the family life cycle; in rough terms, from one-third to two-thirds. Most of the gain in adherence to the basic model has been because of "involuntary" factors, particularly the decline in mortality. But for the developed countries this factor can no longer be of much significance because the indices of mortality have dropped to levels so low that little further decline is foreseeable.
The long-term trend in the reduction of proportions of women who are spinsters or childless appears to be stabilizing in the United States of America and possibly in other industrialized countries as well. Indeed, there is some likelihood that the trends may be reversed in the coming years, as more women conclude that there are viable roles open to them other than marrying and having children. Nonetheless, these optional roles may not pose a significant alternative to the predominance of the normative life cycle pattern. At present, the unstable marriage pattern type has the most potential for altering the degree of conformity to the preferred family cycle. But unstable marriages resulting from divorce or separation vary considerably from country to country. There are heavy sanctions against dissolving unions in some countries, while there are few barriers in others. Consequently, this factor is bound to account for an increasing share of the variation from country to country.
One aspect of the unstable marriage type should be mentioned, where it is difficult to break unions, those who do so have a stigma attached to them that makes it difficult to re-enter unions. In countries where divorce has become common, however, there is much less of a problem in re-establishing a union (depending, of course, upon many factors such as age, number of children, attractiveness, etc.), so that the meaning of a broken marriage is changed over time and people are able to establish more readily patterns of serial monogamy that continue the basic functions of the family.
Uhlenberg points out, in paSSing, that the trend toward the normative model he is able to demonstrate with the United States of America data has not received much acknowledgement in the literature of family sociologists, who still largely see the period he describes as one of an increaSing "breakdown" of the family. In this instance, the demographic approach is not incorporated into the other ways of viewing the family.
Paul Glick has also contributed to the understanding of the United States family life cycle. Over a number of lears, he has refined the concept and the measurement of the family life cycle •• 7 The article written in collaboration with Parke 8 is a major advance in that actual birth cohorts are used and estimates for the timing of events in family life cycle are based on survey data rather than on indirect methods.
In Table VI.6. the figures for six birth cohorts of women, beginning in 1880 and ending in 1939, are presented. Age at first marriage, except for the depression cohort of 1910-1919, declined nearly two years, from 21.6 to 19.9 years.

- 102 -
In addition, the bunching of first marriages around the median increased markedly, for the interquartile range declines from 6.3 years in the oldest cohort to 4.0 years in the youngest one.
The interval from marriage to first birth showed less fluctuation, rising from 1.3 years in the oldest cohort to 2.2 years in the 1920-1929 cohort. It then fell to 1.6 years in the youngest cohort 1930-1939, reflecting the higher fertility of this "Baby Boom" cohort. It seems safe to conclude that the interval between marriage and first birth is not subject to great variation. People are more likely to delay marriage for a greater time than they are the first birth within marriage, even though in recent years the improvement in contraceptive techniques and their greater dissemination has made the timing of births more subject to control.
The childbearing interval, from birth of the first child to that of the last child is, of course, governed both by the number of children and their spacing.
e Glick and Parke present data showing that the oldest cohort had nearly one child more than the depression cohort, 1910-1919, (3.4 children as against 2.5). This in itself would largely account for the decline in the length of the interval between first and last child from 10.0 years in the oldest cohort to 7.8 years in the 1910 to 1919 cohort. In recent years, in the United States of America, most women have somewhat shortened the spacing between children, with the consequence that more than half of them have completed their childbearing before the age of 30.
This introduces one of the difficulties in using measures of central tendency in the study of the family life cycle. The age at which a woman has her last child is subject to three factors: age at marriage, number of children, and timing of births. In the United States birth cohort of 1880-1889, a quarter of the women completed their childbearing before 27.4 years of age. In contrast, another quarter had their last child after 35.2 years of age. The interquartile range (in this case 10.8 years) must always be kept in mind when discussing the "average" age at birth of last child. In the United States of America, this interval has declined in recent years; indeed, if the most recent information on completed birth intentions is valid, the 'interquartile range may be expected to decline even further, perhaps to as low as 6 to 7 years.
A substantial decline (approximately 5 years) in the age of the mother when the last child marries is observable between the oldest and youngest age cohorts, due to the decline in age of first marriage and the decline in number of children.
Finally, there is the "empty nest" period, when the couple have seen their last child leave and before the death of one spouse. The effect of mortality is quite striking. In the 1880-1889 cohort, less than a year separated the departure of the last child and the death of one spouse. This interval widened greatly over the subsequent two decades and. by 1930-1939, it may have been as much as 14 years. It should be noted, however, that for those couples in which both spouses lived till the first marriage of last child, there was very little change from earlier to later cohorts (see Table VI.6.). In other words, no great improvement in life expectancy occurred for those couples who had survived well into their fifties.
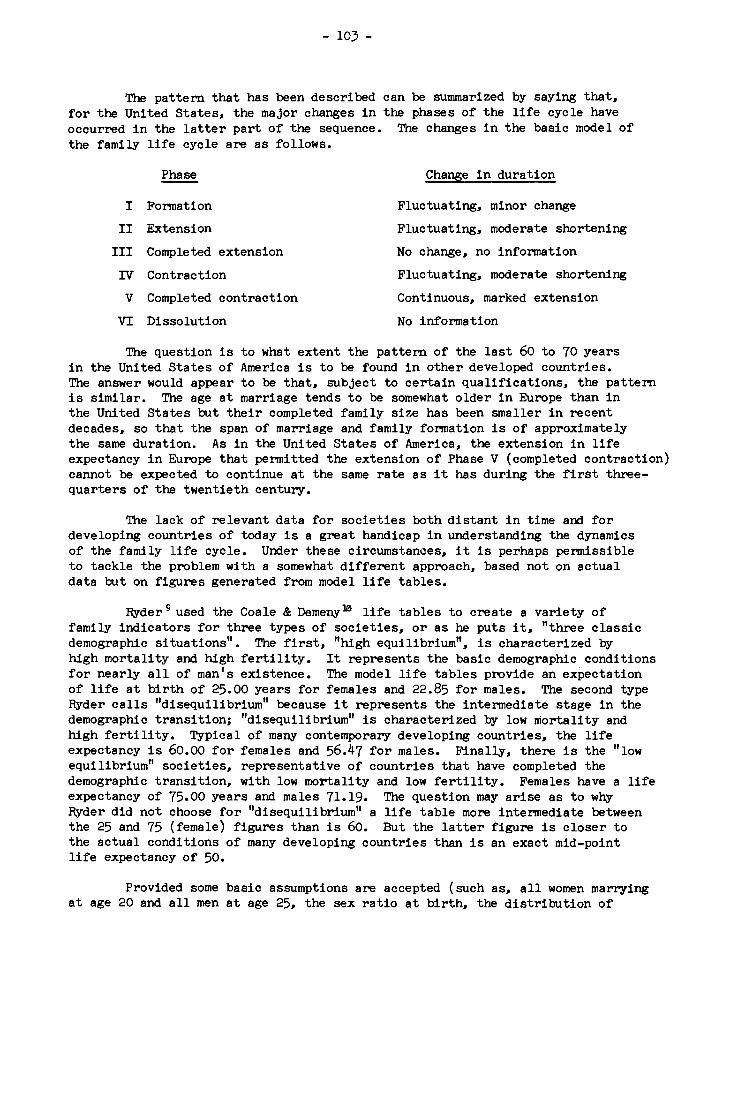
- 103 -
The pattern that has been described can be summarized by saying that, for the United States, the major changes in the phases of the life cycle have occurred in the latter part of the sequence. The changes in the basic model of the family life cycle are as follows.
Phase Change in duration
I Formation Fluctuating, minor change
II Extension Fluctuating, moderate shortening
III Completed extension No change, no information
IV Contraction Fluctuating, moderate shortening
V Completed contraction Continuous, marked extension
VI Dissolution No information
The question is to what extent the pattern of the last 60 to 70 years in the United States of America is to be found in other developed countries. The answer would appear to be that, subject to certain qualifications, the pattern is similar. The age at marriage tends to be somewhat older in Europe than in the United States but their completed family size has been smaller in recent decades, so that the span of marriage and family formation is of approximately the same duration. As in the United States of America, the extension in life expectancy in Europe that permitted the extension of Phase V (completed contraction) cannot be expected to continue at the same rate as it has during the first threequarters of the twentieth century.
The lack of relevant data for societies both distant in time and for developing countries of today is a great handicap in understanding the dynamics of the family life cycle. Under these circumstances, it is perhaps permissible to tackle the problem with a somewhat different approach, based not on actual data but on figures generated from model life tables.
Ryder 9 used the Coale & Demeny10 life tables to create a variety of family indicators for three types of SOCieties, or as he puts it, "three classic demographic situations". The first, "high equilibrium", is characterized by high mortality and high fertility. It represents the basic demographic conditions for nearly all of man's existence. The model life tables provide an expectation of life at birth of 25.00 years for females and 22.85 for males. The second type Ryder calls "disequilibrium" because it represents the intermediate stage in the demographic tranSition; "disequilibrium" is characterized by low mortality and high fertility. Typical of many contemporary developing countries, the life expectancy is 60.00 for females and 56.47 for males. Finally, there is the "low equilibrium" SOCieties, representative of countries that have completed the demographic tranSition, with low mortality and low fertility. Females have a life expectancy of 75.00 years and males 71.19. The question may arise as to why Ryder did not choose for "disequilibrium" a life table more intermediate between the 25 and 75 (female) figures than is 60. But the latter figure is closer to the actual conditions of many developing countries than is an exact mid-point life expectancy of 50.
Provided some basic assumptions are accepted (such as, all women marrying at age 20 and all men at age 25, the sex ratio at birth, the distribution of

- 104 -
completed fertility Qy duration and parity, and no re-marriage) a great deal of valuable information can be generated from these six life tables. Ryder's interest is not in the phases in the family life cycle as such, but in exploring the various facets of family size, particularly its temporal dimension. It is this aspect that is of interest here.
To begin with average family size, taking into account the parental non-survival probabilities: in the high equilibrium case it is 6.5 persons, compared to 7.9 for disequilibrium and 4.1 for low equilibrium. A more meaningful measure of size of family, in many ways, is the number of years lived Qy each type of family member within the "life" of the family. Here Ryder introduces further assumptions: the maximum span of membership for parents is 35 years (an arbitrary interval between age at marriage and the marriage of last child), 25 years for a son and 20 years for a daughter (the ages are arbitrarily fixed at their respective age at first marriage). Table VI.7. gives the years of life spent in the family Qy the various members, along with a weighted total that takes into account all members. The last column shows that the disequilibrium model has nearly twice the total number of family years as either the high or low equilibrium cases. Even though the low equilibrium family has fewer members, they are together longer than those in the high equilibrium family, espeCially the sons and daughters. It should also be noted that the high equilibrium condition has the largest standard deviations. As Ryder points out, this means that, in high equilibrium societies, there are very large and very small families when compared to the mean family size. In fact, the variation is due to the influence of mortality. In low equilibrium societies, families tend to be more similar.
It is possible to go more deeply into the specific relationships between different members of the family, and to designate the years of contact for the various role pairs. The husband-wife relationship is the one best known to us (Table VI.B.), through the individual and joint expectations of life at the time of first marriage. In high equilibrium societies, the couple can count on less than twenty years together, while couples in disequilibrium societies have nearly twice that length of time. More unusual are the figures that Ryder has provided for other family pair relationships, as shown in Table VI.9. The parent-child pairs are mother/daughter, father/daughter, mother/son, and father/son. Again, the weighted sum column shows how different the disequilibrium model is from the other two; it provides nearly three times the exposure of parent-child contacts. The second part of the table, which is devoted to sibling contacts, is even more striking. It shows that the total amount of years of sibling interaction within the disequilibrium model is five times that of the high equilibrium model and eleven times that of the low equilibrium model. Not all the findings of Table VI.9. are expected. In particular, there is a generally close correspondence in "outcomes" between the high and low equilibrium models, despite the fact that their fertility and mortality performances are very different.
Finally, Ryder's figures on the difference in years between the length of married life and the length of family life are germane to the consideration of the phases of the family life cycle. In high equilibrium societies, family life (i.e., single parent and child or children) continues 9.47 years after the death of one of the spouses. In disequilibrium societies, this difference is only 4.19 years and the marriage extends 13.47 years beyond the

- 105 -
time the last child leaves home. The disequilibrium case l the refore I is characterized by the "empty nest" pattern.
Ryder draws an important conclusion from his data:
"Comparison of the disequilibrium family with its precursor l the high equilibrium family, is very much to the advantage of the former. The proportion of fathers without a male heir is reduced by one-half, the length of joint married life increases from 19 to 36 years, each child lives almost twice as long within the family setting, the variability of each dimension of family life is reduced substantially, and with it the pernicious role of chance, there is three times as much opportunity for parent/Child interaction and four times as much opportunity for sibling interaction, and the proportion of family life in which there is only one surviving parent is cut from one-third to one-tenth. Truly the high equilibrium situation is "nasty, brutish and Short", and its disequilibrium successor must seem like a boon by comparison."
The implications of the above for family health, both physical and mental, are apparent.
Of course, Ryder's approach and his "constructed" data are, as he concedes, "crude over-simplifications". He is at pains to point out that, empirically, any of the three models may be more or less divergent from reality. This is not only because of the crudeness of the assumptions (such as, age at marriage and duration of marriage) but, less obviously, the variation is due to fluctuations in the types themselves from one time period to another, mainly be'cause of fluctuations in mortality. This is particularly true for the high equilibrium model. Ryder correctly indicates that it may quite easily become the disequilibrium model and then revert.
In spite of the necessary arbitrariness of his assumptions l Ryder derives much meaningful data from the set of six model life tables. As was noted earlier, there are tremendous data restrictions on the empirical elaboration of family life cycles for virtually all historical periods. Consequently, "exercises" such as Ryder's are important, for they provide at least the parameters of family existence under very different demographic conditions.
Data for developing countries are virtually non-existent. It is again necessary, therefore, to use existing studies that, while not providing information on the family life cycle and all of its phases, are relevant to the problem.
An illuminating way of observing the effect of mortality on social institutions is provided by the study of Collver. 11 He compared India and the United States of America l two countries that differ greatly in the organization of their family life cycles. Drawing upon 1956 survey data for villages in the state of Banaras, he constructed the family life cycle for this part of rural India, and he then contrasted it with data for the United States of America (see Table VI.lO.).
India is famed for early marriage. The marriages are usually, if not
- 106 -
invariably, arranged by the parents, with the first ritual union (~) occurring prior to sexual maturity. In rural Banaras, the median age was 10.9 years for the girl and 13.6 for the boy. The actual consummation of the marriage (~) occurs nearly four years later (14.6 years for the wife and 17.3 years for the husband). It is not known why the birth of the first child occurs on the average some three and a half years after the ~ (at 18.2 and 20.9 years, respectively, for wife and husband) but the delay may be linked to immaturity and to the fact that the young bride spends part of the time in her parent's household. In any case, the median age of wife at first birth is still very young when viewed in international comparative perspective. Collver provides no data on birth intervals but since the medium number of births is about 7 and the childbearing interval is almost 19 years from first to last child for the wife (from 18.2 to 37.0), it is evident that the birth intervals are wide and doubtless they increase with birth order.
Because of the long interval of childbearing in Banaras, the departure from home of the last child by marriage according to the age of the parents (53.0 for wives and 55.7 years for husbands) is considerably later than for couples in the United States of America, even though the latter enter marriages appreciably later. The greatest differences between Banaras and United States couples are in the last stages of the family life cycle. Because the life expectancies in Banaras are much shorter, nearly half of all of their marital unions are disrupted by the death of either spouse prior to the wife reaching the age of 45, not long after the end of her childbearing period. In Collver's words, "If the seventh and last child is born in the twenty-second year of the family life cycle, his marriage will occur well after the expected time of dissolution of the parental couple. He is expected to marry at the age of 16, in the thirty-eighth year of the family life cycle, a year to which only 34 per cent of all couples survive II • Although the figure cannot be calculated from the data provided, it is obvious that the complete family life cycle, covering all six stages, is experienced by only a small fraction of all couples in Banaras.
Collver concludes his comparison by remarking on the fragility of continuity of the nuclear family in India and emphasizing the crucial role that the kinship system must play in such circumstances:
" ••• the nuclear family is too precarious for it to be entrusted entirely with these important functions (rearing children and old age security). The joint household alone has a good prospect for continuity. When two or more couples pool their resources and their labour they are better able to supply their minimum needs than they could separately. When one adult dies others remain to care for the orphaned children. Again parents deprived of their sons may still be adequately assisted by grandchildren or nephews living with them. Certainly the degree of independence enjoyed by the nuclear family in America would be out of the question in rural India".
What differentiates many developing countries from the experience of the United States of America and other western countries in terms of the declining impact of mortality upon the probability of completing successive phases of the family life cycle is the unprecedented rapidity of the decline.

- 107 -
Mexico may be taken as representative of countries in which, within the span of little more than two generations, the life expectancy has been radically altered and with it the circumstances of the family life cycle. Table VI.ll. gives the life expectancy for males and females from 1930 to 1960 with projections up to 1995-2000. In the 70 years between 1930 and 2000, it is anticipated that the life expectancies will have doubled; females from 37.49 to 74.50 and males from 36.08 to 71.13. Note, however, that by far the greatest change occurred in the two decades from 1940 to 1960 when the life expectancy for females, for example, increased by 18 years. In the 40 years projected from 1960 to 2000, the increase is only 14 years.
Ortega & Lerda 12 recently constructed a generation life table for Mexican males born in 1960. It takes into account anticipated improvement in mortality during the lifetime of the men. Life expectancy at birth is estimated at 63.28 years, compared to the period life table for the same period (1959-1961) which gives 57.61 years. Considering the survivors from 100 000 men born in 1960: 83 148 will survive through the 20.24 age interval, the end of which will see more than half of the men married. Even assuming, very liberally, that the childbearing span is 15 to 20 years, 82 188 men still will be alive in the age interval 40.44. Again assuming rather liberally that the last son leaves home and marries 25 years after birth, 64 602 men will survive through the 64-69 age interval. There are no comparable figures for the wife, but since the median age at first marriage of the wife is more than three years younger than that of the husband, and because the life expectancy of women is several years greater than of males, it is likely that about three-quarters of the wives will survive until their husbands reach the 64-69 age group.

TABlE VI.l.
Mean Length of Intervals between Birthsl by Birth Order: Selected French Parish Record Data for Couples Married between 1674 and 1799
Mean Le!!f!th of Birth Intervals ~in monthS) Number Mean Marriage First to Second Third to Ante-of number to first second to third fourth penulti- Penulti-
Parishes families of birth birth birth birth mate mate Last studied births interval interval interval interval interval interval Interval
Bl1heres (marriages 54 7.31 20.2 23.7 27.2 30.0 31.1 31.5 38.1 of 1740-1799)
Thezel-Saint-Sernin 90 25.4 30.0 32.2 32.6 33.7 38.2 (marriagEts of l700-1792)
Crulai (marriages 106 7.6 16.6 22.4 25.3 27.2 28.7 30.9 33.0 of 1674 ... 1742)
Three I1e-de-France 82 8.8 19.8 villages (marriages
23.4 23.3 27.0 29.1 35.2
I-' of 1740-1799) 0 co
Sainghin-en-Melantois 39 8.75 21.1 21.8 25.0 26.8 30.0 38.0 (marriages before 1770)
Sottevil1e-les-Rouen 7 19.2 21.9 23.7 27.3 30.0 (marriages of 1760-1792)
Canada (marriages of 22.5 21.0 22.6 22.9 1700-1730)
Source. JUDAH MATRAS 1 Population and Societies. New JerseYI Prentice-Hall; 1973, Table 1.7.

- 109 -
TABLE VI.2.
Life Expectancy at Birth and its Changes between 1900 and 1950 for Selected Countries.
Life expectancy Change (1900 = 100) Country Sex
1900 1930 1950 up to 1930 up to 1950
Europe and Northern America
Austria Male 39.1 54.5 61.9 139 158 Female 41.1 58.5 67.0 142 163
Belgium Male 45.4 56.0 62.0 123 137 Female 48.8 59.8 67.3 123 138
Male 40.0 45.9 64.2 115 161 Bulgaria Female 40.3 46.6 67.7 116 168
Czechoslovakia Male 38.9 51.9 60.9 133 157 Female 41.7 55.2 65.5 132 157
Denmark a Male 52.9 60.9 67.8 115 128 Female 56.2 62.6 70.1 III 125
b b 64.6c 134 144 Germany~ Federal Male 44.8b 59.9b Republic of Female 48.3 62.8 68.5c 130 142
Finland Male 45.3 54.5 62.9 120 139 Female 48.1 59.6 69.1 124 144
France Male 45.3 54.3 63.6 120 140 Female 48.7 59.0 69.3 121 142
Hungary Male 37.1 48.3 58.8 130 158 Female 37.9 51.3 63.2 135 167
Iceland Male 48.3 60.9 70.7 126 146 Female 53.1 65.6 75.0 124 141
Ireland Male 49.3 58.2 64.5 118 131 Female 49.6 59.6 67.1 120 135
Italy Male 44.2 53.8 63.8 122 144 Female 44.8 56.0 67.3 125 150
Netherlands Male 51.0 65.7 70.6 129 138 Female 53.4 67.2 72.9 126 137
Norway Male 54.8 64.1 71.1 117 130 Female 57.7 67.6 74.7 117 129
Spain Male 33.9 48.4 59.8 143 176 Female 35.7 51.6 64.3 145 180
a Excluding Faeroe Islands and Greenland b Data for the German Reich c Excluding Saar and West Berlin d England and Wales e ~xcluding full-blooded Aborigines f Data are for European population only
g Data are for Japanese nationals only
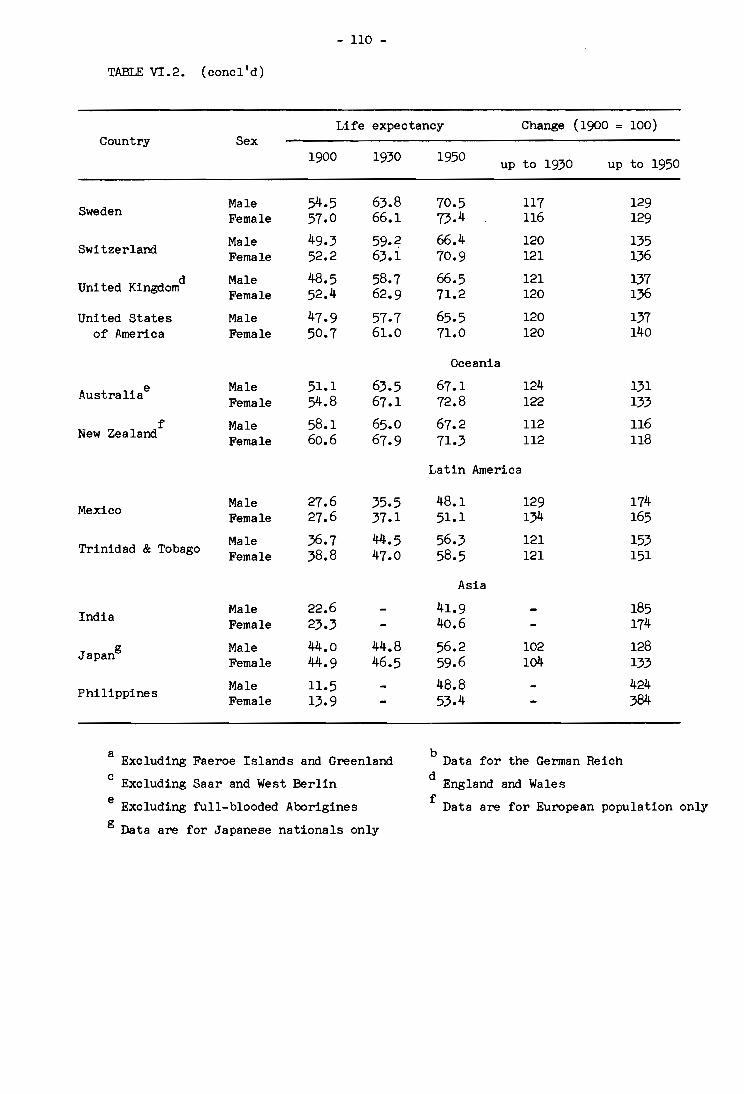
- 110 -
TABLE VI.2. (concl'd)
Life expectancy Change (1900 = 100) Country Sex
1900 1930 1950 up to 1930 up to 1950
Sweden Male 54.5 63.8 70.5 117 129 Female 57.0 66.1 73.4 u6 129 Male 49.3 59.2 66.4 120 135 Switzerland Female 52.2 63.1 70.9 121 136
d Male 48.5 58.7 66.5 121 137 United Kingdom Female 52.4 62.9 71.2 120 136
United States Male 47.9 57.7 65.5 120 137 of America Female 50.7 61.0 71.0 120 140
Oceania
Australiae Male 51.1 63.5 67.1 124 131 Female 54.8 67.1 72.8 122 133
f Male 58.1 65.0 67.2 112 116 New Zealand Female 60.6 67.9 71.3 U2 u8
Latin America
Mexico Male 27.6 35.5 48.1 129 174 Female 27.6 37.1 51.1 134 165 Male 36.7 44.5 56.3 121 153 Trinidad & Tobago Female 38.8 47.0 58.5 121 151
Asia
India Male 22.6 41.9 185 Female 23.3 40.6 174
Japang Male 44.0 44.8 56.2 102 128
Female 44.9 46.5 59.6 104 133
Philippines Male 11.5 48.8 424 Female 13.9 53.4 384
a Excluding Faeroe Islands and Greenland b
Data for the German Reich c
Excluding Saar and West Berlin d England and Wales
e Excluding full-blooded Aborigines f
Data are for European population only
g Data are for Japanese nationals only

- 111 -
TABIE VI.3.
Average Age at First Marriage in Selected Countries, 1937-1950.
Country 1937 1938 1940 1950
Austria Male 28.3 27.1 Female 25.5 24.5
Canada Male 29.3 29.3 28.oa 26.7
Female 25.2 25.3 24.7a 2).8
Gennany, Federal Republic of Male 28.8 28.1 Female 26.2 25.4
b 28.2c 28.6 28.8 Italy Male 28.1b Female 24.9 24.9c 24.9 25.0
29.3 29.4 d 29.0 Norway Male 29. 2d Female 26.5 26.5 26.4 26.0
Sweden Male 29.5 29.5 29.2 28.3 Female 26.6 26.5 26.3 25.6
United Kingdome Male 27.6 27.7 27.3 27.8 Female 25.6 25.6 25.0 25.2
United States of America Male 24.3 22.8 Female 21.5 20.3
a 1940-1942 b 1936-1938 c 1937-1939 d 1941-1945 e England and Wales
Type 1.
Type 2.
Type 3.
Type 4.
Type 5.
Type 6.
TABIE VI.4.
Life Cycle Types of Native-Born Massachusetts# USA, Women, 1830-1920. (~ercentage)
1830 1850 1870 1890
Abbreviated 35.6 31.4 30.9 26.3
Spinster 12.9 14.2 17.8 ·17.8
Barren 9~5 10.0 11.4 12.2
Dying mother 11.9 11.7 8.7 7.8
Widowed mother 9.1 9.8 8.6 8.5
Typical 20.9 23.0 22.6 27.4
Total 100.0 100.0 100.0 100.0
Source. Adapted from PillER R. UHLENBERG, A Study of Cohort Life Cycles: Cohorts of Native Born Massachusetts Women, 1830-1920. Population Studies, Vol. XXIII# No. 3# 1969.
1920
10.8
10.6
9.0
4.0
8.5
57.1
100.0
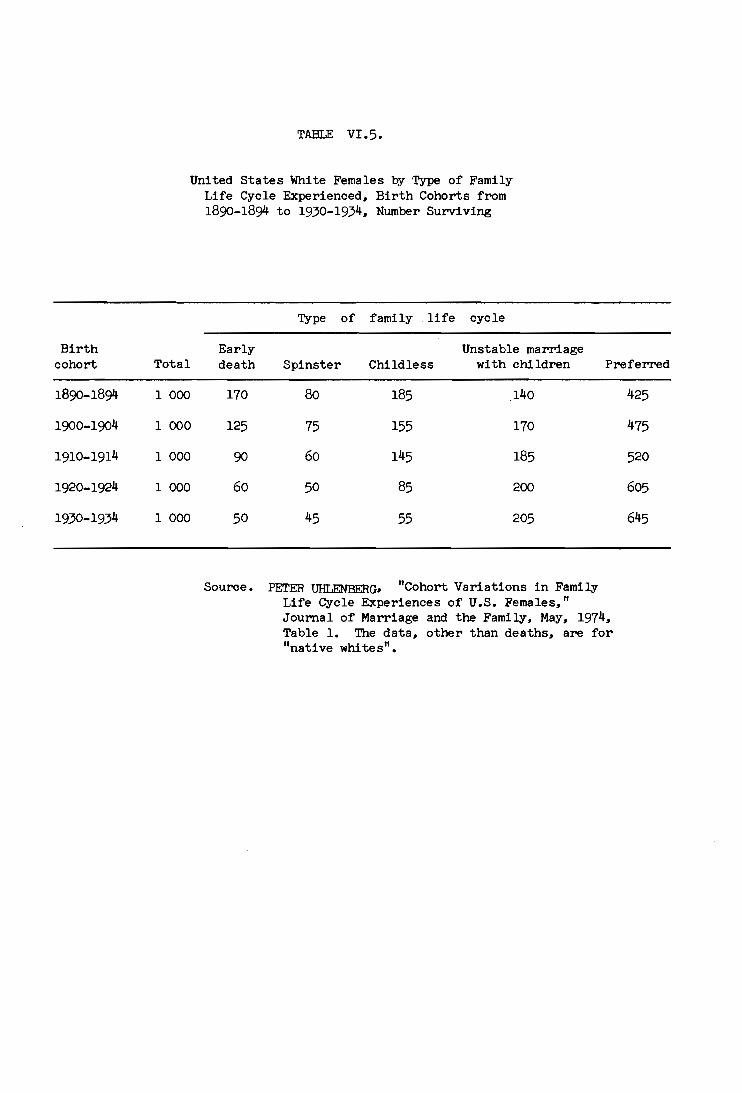
Birth cohort Total
1890-1894 1 000
1900-1904 1 000
1910-1914 1 000
1920-1924 1 000
1930-1934 1000
TABLE VI.5.
United States White Females Qy Type of Family Life Cycle Experienced, Birth Cohorts from 1890-1894 to 1930-1934, Number Surviving
Type of family life cycle
Early Unstable marriage death Spinster Childless with children Preferred
170 80 185 140
125 75 155 170
90 60 145 185
60 50 85 200
50 45 55 205
Source. PETER UHLENBERG, "Cohort Variations in Family Life Cycle Experiences of U.S. Females," Journal of Marriage and the Family, May, 1974, Table 1. The data, other than deaths, are for "native Whites".
425
475
520
605
645
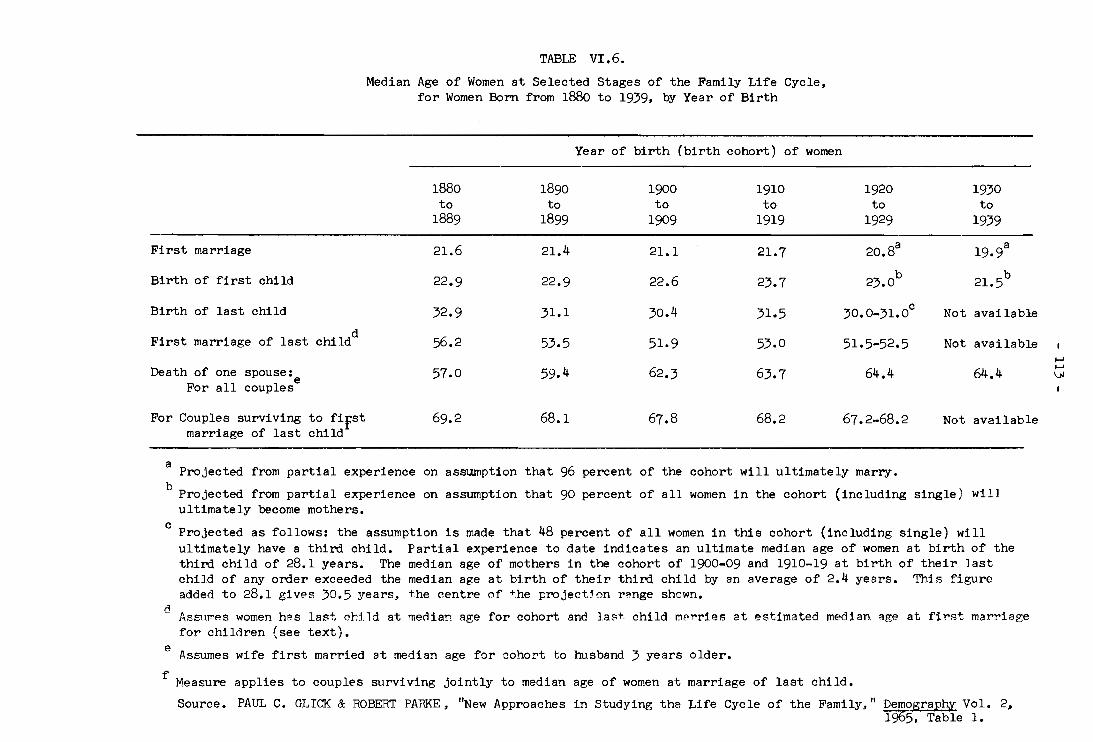
First marriage
Birth of first child
Birth of last child
First marriage of last child d
Death of one spouse: e For all couples
For Couples surviving to fifst marriage of last child
TABLE vr.6. Median Age of Women at Selected Stages of the Family Life Cycle,
for Women Born from 1880 to 1939, by Year of Birth
Year of birth (birth cohort) of women
1880 1890 1900 1910 to to to to
1889 1899 1909 1919
21.6 21.4 21.1 21.7
22.9 22.9 22.6 23.7
32.9 31.1 30.4 31.5
56.2 53.5 51.9 53.0
57.0 59.4 62.3 63.7
69.2 68.1 67.8 68.2
1920 to
1929
20.8a
23.0b
30.0-31.0
51.5-52.5
64.4
67.2-68.2
a Projected from partial experience on assumption that 96 percent of the cohort will ultimately marry.
1930 to
1939
19.9a
21.5b
c Not available
Not available
64.4
Not available
b Projected from partial experience on assumption that 90 percent of all women in the cohort (including single) will
c ultimately become mothers.
Projected as follows: the assumption is made that 48 percent of all women in this cohort (including single) will ultimately have a third child. Partial experience to date indicates an ultimate median age of women at birth of the third child of 28.1 years. The median age of mothers in the cohort of 1900-09 and 1910-19 at birth of their last chiJd of any order exceeded the median. age at birth of their third child by an average of 2.4 years. This figure added to 28.1 gives 30.5 years, the centre of the rroject:lon range shewn.
d Asslll"p.s women has last chi.1d at median age for cohort and 1a(':+. child r.1?"'ries at estimated median 'lge at fi'!"st marriage for children (see text).
e Assumes wife first married at median age for cohort to husband 3 years older.
f l"ieasure applies to couples surviving jointly to median age of women at marriage of last child.
Source. PAUL C. GLICK & ROBERT PARKE" "New Approaches in Studying the Life Cycle of the Family," ~~"'~o~~e"" 1-> - -
2.
I-' I-' VJ

- 114 -
TABLE VI. 7.
Years of Life in Family for Members and Total, with Standard Deviations
High equilibrium
Disequilibrium
Low equilibrium
High equilibrium
Disequilibrium
Low equilibrium
Father Mother
23.47 25.40
31.25 32.34
33.70 34.37
Standard Deviations
Father Mother {35L (35L
11.56 11.55
7.87 7.04
4.55 3.32
Son Daughter
12.16 10.69
21.74 17.86
24.29 19.63
Son Daughter (25) (20} -11.62 9.26
8.03 5.88
4.07 2.62
Weighted total
100.12
180.85
114.20
Source. NORMAN RYDER, "Reproducti;ve Behavior and the Family Life Cycle". Paper presented at United Nations Economic and Social Council, Symposium on Population and the Family. Honolulu, 6-15 August, 1973. Adapted from Tables 3 & 4.
High equilibrium
Disequili brium
Low equilibrium
TABLE VI.8.
Individual and Joint Expectations of Life at Marriage
Husband Wife
26.55 31.25
41.59 48.44
48.72 56.59
Source. Ibid., Table 6.
Joint
19.20
35.84
45.22

High equilibrium
Disequilibrium
Low equilibrium
High equilibrium
Disequilibrium
Low equilibrium
TABIE VI.9.
Years of Parent-Child and Sibling Experience.
Mother/daughter Father/daughter Mother/son
9.54
17.14
19.47
Brother/ brother
9.92
17.31
19.42
Brother/ sister
10.38
17.71
19.56
9.21
16.72
19.28
Sister/ brother
8.02
13.22
14.64
10.47
20.52
23.98
Sister/ sister
8.38
13.43
14.74
Source. Ibid •• Tables 7 and 8
Father/son
9.86
19.76
23.62
Weighted total
67.23
339.64
30.20
Weighted sum
21.89
63.34
22.67
Mean years ;eer child
I-' 15.02 I-'
V1
57.48
14.41

Stage
- n6 -
TABLE VI.IO.
Median Ages of Husband and Wife at Each Stage of the Family Cycle, Banaras and the United States
Median age of husband Median age of wife
Banaras United States Banaras United States 1956 1890 1940 1950 1956 1890 1940 1950
First marriage Shadi 13.6 10.9
Guana 17.3 26.1 24.3 22.8 14.6 22.0 21.6 20.1
Birth of first 20.9 27.1 25.3 24.5 18.2 23.0 22.6 21.8 child
Birth of last 39.7 36.0 29.9 28.8 37.0 31.9 27.2 26.1
child
Marriage of first 36.9 51.1 48.3 46.0 34.2 47.0 45.6 43.3 child
Marriage of last 55.7 59.4 52.8 50.3 53.0 55.3 50.1 47.6
child
Death of one a 47.2
spouse 57.4 63.6 64.1 44.5 53.3 60.9 61.4
Age at death 54.4 66.4 69.7 71.6 54.5 67.7 73.5 77.2 of surviving b spouse
a The couple survives jointly to the age shown. The figures for Banaras and the United States are not exactly comparable, for Glick assumed that that the deaths of husband and wife are independent events. The Banaras figures are computed on the assumption that they are correlated. If they are independent, the jOint survival of a couple would be shortened Qy
b
5 years, to ages 42.2 and 39.5.
Spouse survives separately from marriage.
Sources. United States data: PAUL C. GLICK, "The Family Cycle", American Sociological Review, 12 (April, 1947), pp. 164-174; and American Families, New York: John Wiley & Sons, 1957, pp. 53-70.
Banaras data: ANDREW COILVER, "The Family Life Cycle in India and the United States", American Sociological Review, Vol. 28, No. 1 (February, 1963), Table 1.

Year
1930
1940
1950
1960
1965-1970
- 117 -
TABIE VI.ll.
Life Expectancy at Birth in Mexico Qy Sex, 1930-2000
Males
36.08
40.39
48.09
57.61
60.94
Females
37.49
42.50
51.04
60.32
63.88
1975-1980 65.06 68.25
1985-1990
1995-2000
68.59 71.91
71.13 74.50
Sources. For 1930-1960: RAUL BENITEZ & GUSTAVO CABRERA, Tablas abreviadas de mortalidad de la poblacion de Mexico, El Cole~io de Mexico: Mexico City, 1968.
For 1965-2000: RICARDO ALVARAOO, "Mexico: Proyecciones de la poblacion total (1960-2000) y de la poblacion economicamente active (1960-1985)," Revista Mexicana de Sociologia, Vol. XXXII, No. 5 (September-October, 1970).

- 118 -
CHAPTER VII
CONCLUSIONS
Contemporary demographic patterns and the changes that have occurred in these patterns over the past two decades are the result of a multiplicity of intricately interwoven factors. Health has played, and continues to play, an essential role in shaping demographic patterns as well as in influencing the direction and pace of change. But the relationship between health and the family has not been one way; family structure and size impinge on the health of individual members as well as on family life and have important consequences for the organization of health services.
The descriptive statistics elaborated in the preceding chapters are part of a comprehensive investigation of health and the family, combining both theoretical and applied research. Mortality has been singled out as the subject matter of the first phase of this study because it is " despite severe limitations in the quantity and quality of available statistics - relatively the best documented health factor. There are, of course, various ways in which health influences the family. Mortality is, however, the one with the most serious and, at the same time, irreversible effects on family structure and the quality of family life. The family setting exerts substantial influence on disease incidence and prevalence among its members as well as on disease outcome. Mortality, in its turn, bears on the family not only directly through its effects on its size and structure, but also more subtly through its interaction with the demographic processes of family formation and family building and its effects on attitudinal patterns, a factor less prone to measurement and quantification.
It is still too early to set forth, with any great specifiCity, the implications of the changing demography of the family for health policy and research. Some tentative conclusions do, however, emerge which may serve as convenient points of departure for further studies.
Implications for the family
Some of the salient features of the contemporary demographic pattern as related to the family in a low mortality society may be conveniently illustrated b.1 reference to a simple model. The model (shown in Table VII.l.) describes the family experience of a woman who fits closely to the current experience in a number of developed countries (e.g., Hungary, and the United States). It is based on the assumption that the woman is exposed during her lifetime to the demographic experience of the reference period (i.e., parameters such as age at first marriage, interval between marriage and birth of first child etc. do not change; for convenience, it is also assumed that the first child is female). These simplifying assumptions hardly affect the validity of the argument and its relevance for highlighting the consequences for the family of modern demographic patterns.
The multi-generation family is now an average phenomenon; never in human history have so many generations lived at the same time. A woman may expect not

- 119 -
only to witness the formation of a new family by her daughter but also the formation of a family of the next generation, living until the great granddaughter enters school. The factors accounting for this pattern are: reduction of mortality (i.e., increase in expectation of life); and a significant concentration of the childbearing experience into the first 7 to 10 years of marriage together with a relatively low age at marriage (at least as judged from European experience). The main factor is undoubtedly the low mortality. The far-reaching consequences of this pattern for the individual, the family and society are a matter of speculation: on one hand, the passing on of experience from one generation to another is now greatly facilitated; on the other hand, inter-generational tensions may increase, as illustrated by a certain rejection of the aged in society and the generation gap.
Death is increasingly becoming a rare event in the nuclear family during its formative period, a result of dramatic improvements in the survival chances of the newborn up to the age they leave home and set up their own families. As a result, complete as well as partial orphanhood are greatly reduced. The parent generation now can look after their children; however, the support of the parental generation in old age by their children assumes increasing importance, particularly in the absence of a well established social insurance system.
An example of the impact of demographic trends on the family is given in Table VII.2. which shows the change that took place in Austria between 1930 and 1970 in age at first marriage, and age and duration of widowhood. The average potential duration of marriage rose from 32 (around 1930) to 42 years (around 1970). Around 1970, the wife survived the husband in about 7~ of the marriages, compared to 6~ around 1930. The average age at death for widowers and widows alike is now approximately 80 years, as compared to 76 years four decades ago. It might seem surprising that there exist hardly any differences with regard to age at death of the surviving spouse. The mortality of widowers exceeds that of widows, but widowers are already older than widows at the onset of widowhood. The decrease in the average duration of widowhood is a result of the decline in mortality in the younger and middle age groups; less young persons become widowed.
Another striking change with profound effects in the individual, family and society is the unequal distribution of mortality improvements among the members of the nuclear family. An example Showing the survival relationship between the husband and wife, based on Austrian experience, is given in Table VII.3. To highlight the impact of decreasing mortality, age at marriage was held constant, i.e. 24 for husbands and 22 for wives. The computations assume independence of events (i.e. the death of one spouse is independent of the fate of the other), and marital dissolution by divorce - which now outranks death as an agent for marital dissolution during the formative life cycle period - is not taken into account, as the focus here is on mortality.
In most families the father is currently likely to be the first to die; some forty years ago, this differential was far less marked. Whereas today the relationship between marriages dissolved by death of husband and those dissolved by death of wife is 3 to 1, it was only 1.2 to 1 in the early 1930s. Chances of marital dissolution by death of husband have decreased in the period under study by about 50-6~ as compared to an 8~ decline in the chances of wives dying while their husbands are alive. According to the 1970/72 experience, about 3.5% of the marriages may be expected to terminate within 15 years due to the death of the husband, while 1% will be dissolved as a result of the death of the wife (the

- 120 -
corresponding percentages for 1930/33 are 7 and 5.5, respectively).
The age-old traumatic experience of marital dissolution b.y death of either husband or wife (or both), coupled with high infant and child loss cannot but have had its effect on family life, especially on its economic position and its responses to the threat imposed by high mortality conditions. The nuclear family, to be viable and acceptable, pre-supposes a low mortality level; in a high mortality setting, the nuclear family cannot provide sufficient protection for its members, thus making an extended family system an absolute necessity. It is clear that the revolutionary changes resulting from the decline in mortality will need some time to filter through; a time lag in the awareness of this new pattern and in the realization of its meaning and impact must be anticipated. Mortality has been instrumental in shaping mankind's destiny throughout the ages; a sweeping departure from this historical experience cannot be absorbed abruptly. The evolution of appropriate mechanisms of adaptation (such as fertility regulation within marriage) is a time-consuming process. Despite the receding importance of death as an intervening factor in the life cycle of the family, however, it would be premature to disregard its importance completely. For example, the danger that the father may not survive until the oldest child has completed compulsory schooling has not yet been completely eliminated (as indicated in Table VII.3. b.y the chances of the husband dying within 15 years).
The drastic reduction of mortality has not only directly measureable consequences for the family and the family life cycle. Probably more important, in the long term, will be its impact on behavioural patterns and societal responses.
Implications for health policy
Family health services are either non-existent or at a rudimentary stage allover the world. In many countries, family health care has traditionally been provided by family doctors; however, during the modernization process, this intimate relationship between the family and its doctor has gradually given way to a more abstract, impersonal contact. It is, unfortunately, not known how far this family-doctor relationship extended in different societies and at different times, and whether it covered all social groups or was - as might be suspected - restricted to selected strata.
A well-organized family health service should cut across traditional organizational boundaries. It should start with family formation (marriage) by medical counselling, and then extend over the whole of the family life, providing, inter alia, maternal and child health care, mental health care and geriatric care. The question of organization of an effective family health service is, therefore, intimately linked to the more complex problem of a reorganization and adaptation of the organizational structure of health services to current and, to a certain extent, prospective needs. It is evident that a more efficient linking up of the various health departments concerned (general practitioner, midwife, maternal and child health, health visiting, etc.) is a sine qua non to effective family health care" just as it is indispensable to make family health services available to all socioeconomic groups.
One consequence of the receding importance of mortality for family life in a low mortality setting should be a growing emphasis on promoting positive health. In this context, health policy should pay increased attention to reproductive behaviour. Reproduction has not only its own peculiar health
- 121 -
hazards but exercises considerable influence on the mental health state of the nuclear family. Viewed from a broader context, it is a reflexion of the family's response to prevailing conditions in the demographic and socioeconomic sphere. To advise and assist families in obtaining the number of offspring desired becomes, therefore, an important element of a dynamic health policy.
Without denying the strategic importance of an efficient health service organization, it is obvious that no administrative measure can work in the long run without concomitant active support of the population. In particular, decisions on the number and timing of pregnancies are made in the family setting on the basis of communication between husband and wife, even if the views of wives are only too often not given their dues (especially in male-dominated cultures). To create a health awareness among the population in general and enlist the active participation of individuals and families must, therefore, be considered a priority task.
The health sector, in contrast to other public sectors, has rarely employed the survey technique. This is regrettable because opinion polls not only constitute a convenient means for identifying health goals but, even more important, can be used to check on the efficiency and effectiveness of the health care provided. Surveys are now being carried out in the narrow field of family planning. If care is taken to avoid abuse of such methods (for example, the use of polls to give spurious legitimacy to a policy that is being promoted for reasons other than health reasons), they may usefully be applied in a wide variety of health fields. The public sector in general can make significant contributions not only in promoting awareness of health problems but also in setting forth the implications of improvements in health status for the family as well as for society.
All health workers should receive instruction during their basic training on the importance of paying due attention to the family setting, as a means of ensuring family health care. A health service, in general, and a family health service, in particular, should be viewed as integral parts of a social services network. Every health worker should be familiar with the customs and beliefs of the people for whom he works. This approach should be supplemented by a dynamic appeal to families for self-help; health education of the general public can make a significant contribution in helping families realize their own role in promoting individual as well as family health. The family doctor should act as a health adviser and link between members of the family and the specialist services they may need.

- 122 -
TABLE VI!.l.
Life Experience of Women in a Low Mortality Society. (Based on data around 1970.)
Event Years of age
Age at first marriage 22
Birth of first child 23
Birth of last child 29
Marriage of daughter 45
Birth of first grandchild 46
Marriage of granddaughter 68
Birth of first great 69 grandchild
Death 75
TABLE VI!. 2.
Age at First Marriage. and Age and Duration of Widowhood in Austria. around 1930 and 1970.
Males Females
1930 1970 Change. 1930 1970 (in years) (in years)
Average age at 28 24 -4 26 22 first marriage
Average age at 61 67 59 64 widowhood
Average duration 15 12 -3 18 17 of widowhood
Change
-4
+5
-1

Husband. wife surviving
Wife l husband surviving
- 123 -
TABLE VII.3.
The Survival Relationship between Husband and Wife in Austria l around 1930 and 1970.
Chances per 1 000 of dying wi thin
5 years 10 years 15 years
1930-33 1970-72 1930-33 1970-72 1930-33 1970-72
21 9 43 19 69 33
17 3 36 6 55 11

- 124 -ANNEX I A. QUALITYa OF DEMOGRAPHIC DATA FOR THE COUNTRIES INCUJDED IN THE STUDY
POPUIATION POPUIATION DATA NATALITY NUPTIALI'IY IDRTALITY ESTIMATE Around 1960 Around 1960 Around 1960 Around 1960 MID-YEAR
1971 1950 /70 1950 /70 1950 /70 1950 /70
per 1000 CODE FOR QUALI'IY
AFRICA Mauritius 822 A A C C C C C C Reunion 4:22 A A C C U C NORTHERN AMERICA Canada 21 786 A A C C C C C C United States of America 20Z 006 A A C C U C C C TROPICAL SOUTH AMERICA Ecuador 6 22Z B A U U U U U U MIDDIE AMERICA Costa Rica 1 786 A A C C C C U C El Salvador 2 721 b A C C C C U C Guatemala 5 348 A A C C C C C C Panama 1 4Z8 A A C C C C U U TEMPERATE SOUTH AMERICA & CARIBBEAN Chile 8 992 A A C C C C C C Guadeloupe & Martinique 673 A A C C C C U C Trinidad & Toba~o 1 O~ A A C C C C C C EAST ASIA JaEan 104 661 A A C C C C C C WESTERN SOUTH AS IA Israel 3·013 A A C C C C C C S~rian Arab ReE. Z 456 A A C C C C C C WESTERN EUROPE France 51 260 A A C C C C C C Germany, Fed. Republic of 59 175 B A C C C C C C Netherlands 13 194 Aa A C C C C C C Switzerland 6 242 A A C C C C C C SOUTHERN EUROPE
2 027: b Portugal A C C C C C C EASTERN EUROPE German Dem. Rep. 15 954 B A U C C U C Hungary 10 364 A A C C C C C C Poland :22 Z42 A A C C C C C C NORTHERN EUROPE Denmark 4 966 Aa A C C C C C C Finland 4 684 Aa A C C C C C C Iceland 214 Aa A C C C C C C Norway 3 905 Aa A C C C C C C Uni ted Kingdom: England & Wales 48 815 A A C C C C C C Scotland 2 2lZ A A C C C C C C OCEANIA New Zealand 2 822 A A C C C C C C a Quality of data described on the basis of the code of the UN Demographic Yearbook
b1963
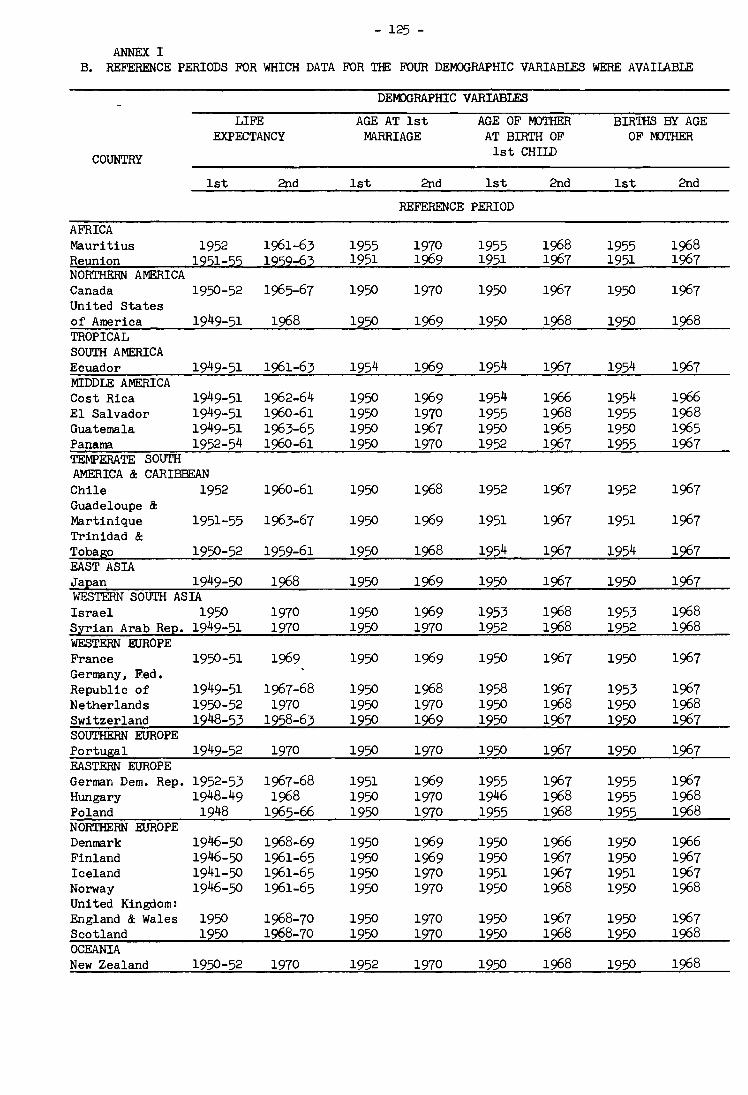
- 125 -
ANNEX I B. REFERENCE PERIODS FOR WHICH DATA FOR THE FOUR DEMOGRAPHIC VARIABLES WERE AVAIIABLE
DEMXl:RAPHIC VARIABLES
LIFE AGE AT 1st AGE OF mTHER BIRTHS BY AGE EXPECTANCY MARRIAGE AT BIRTH OF OF mTHER
COUNTRY 1st CHILD
1st 2nd 1st 2nd 1st 2nd 1st 2nd
REFERENCE PERIOD
AFRICA Mauritius 1952 1961-63 1955 1970 1955 1968 1955 1968 Reunion 1951-55 1959-63 1951 1969 1951 1967 1951 1967 NORTHERN AMERICA Canada 1950-52 1965-67 1950 1970 1950 1967 1950 1967 United States of America 1949-51 1968 1950 1969 1950 1968 1950 1968 TROPICAL SOUTH AMERICA Ecuador 1949-51 1961-63 1954 1969 1954 1967 1954 1967 MIDDLE AMERICA Cost Rica 1949-51 1962-64 1950 1969 1954 1966 1954 1966 El Salvador 1949-51 1960-61 1950 1970 1955 1968 1955 1968 Guatemala 1949-51 1963-65 1950 1967 1950 1965 1950 1965 Panama 1952-54 1960-61 1950 1970 1952 1967 1955 1967 TEMPERATE SOUTH AMERICA & CARIBBEAN Chile 1952 1960-61 1950 1968 1952 1967 1952 1967 Guadeloupe & Martinique 1951-55 1963-67 1950 1969 1951 1967 1951 1967 Trinidad & Tobago 1950-52 1959-61 1950 1968 1954 1967 1954 1967 EAST ASIA Japan 1949-50 1968 1950 1969 1950 1967 1950 1967 WESTERN SOUTH ASIA Israel 1950 1970 1950 1969 1953 1968 1953 1968 Syrian Arab Rep. 1949-51 1970 1950 1970 1952 1968 1952 1968 WESTERN EUROPE France 1950-51 1969 1950 1969 1950 1967 1950 1967 Germany, Fed. Republic of 1949-51 1967-68 1950 1968 1958 1967 1953 1967 Netherlands 1950-52 1970 1950 1970 1950 1968 1950 1968 Switzerland 1948-53 1958-63 1950 1969 1950 1967 1950 1967 SOUTHERN EUROPE Portugal 1949-52 1970 1950 1970 1950 1967 1950 1967 EASTERN EUROPE German Dem. Rep. 1952-53 1967-68 1951 1969 1955 1967 1955 1967 Hungary 1948-49 1968 1950 1970 1946 1968 1955 1968 Poland 1948 1965-66 1950 1970 1955 1968 1955 1968 NORTHERN EUROPE Denmark 1946-50 1968-69 1950 1969 1950 1966 1950 1966 Finland 1946-50 1961-65 1950 1969 1950 1967 1950 1967 Iceland 1941-50 1961-65 1950 1970 1951 1967 1951 1967 Norway 1946-50 1961-65 1950 1970 1950 1968 1950 1968 United Kingdom: England & Wales 1950 1968-70 1950 1970 1950 1967 1950 1967 Scotland 1950 1968-70 1950 1970 1950 1968 1950 1968 OCEANIA New Zealand 1950-52 1970 1952 1970 1950 1968 1950 1968

COUNTRY OR AREA
NORTHERN AMERICA
Canada
ANNEX II. DEf'.DGRAPHIC DATA RELEVANT TO THE FAMILY LIFE CYCLE a
A. NORTH AMERICAN, ASIAN, EUROPEAN and OCEANIAN COUNTRIES
TABIE A.1. AGE AT MARRIAGE AND WHEN GIVING BIRTH, AND LIFE EXPECTANCY
AVERAGE AGE AT LIFE EXPECTANCY YEAR
1st marria ge
M F
1950 27.9 22.7
birth of
first child
24.5
. last child
32.5
at age in years
M F M F
25 20 46.2 54.4
1970 26.7 22.2 23.0 30.7 25 20 47.0 57.4
Uni te:i States 1950 24.8 22.1 23.6 30.7 25 20 44.4 53.7
of America 1970 23.9 21.4 22.2 29.0 30 20 40.2 56.8
EAST ASIA
Japan 1950 26.6 23.0 24.4 32.8 25 25 40.4 43.7
1970 27.2 24.4 25.8 30.0 25 25 46.5 51.1
WESTERN SOUTH ASIA
Israel 1950 28.3 22.6 23.6 31.5 30 20 42.7 54.2
1970 25.6 21.4 23.1 32.0 25 20 48.0 55.3
WESTERN EUROPE
Austria 1950 29.6 26.0 26.2 33.0 30 25 39.7 48.0 1970 26.0 23.3 24.0 30.5 25 25 44.8 51.0
France 1950 27.3 24.2 25.1 32.3 25 25 43.8 48.7 1970 25.3 23.0 23.7 30.8 25 25 45.1 52.1
Germany, Fed. 1950 28.7 25.9 26.1 31.9 30 25 41.3 48.6 Republic of 1970 26.0 23.5 25.3 :21.7 25 __ 25 47.1 J:)LJ:)
a Beginning of family life cycle: With first marriage in European and Northern American countries.
f-' I\) 0\

TABLE A.1 (cont'd)
AVERAGE AGE AT LIFE EXPECTANCY
COUNTRY YEAR 1st marriage birth of at age in years OR AREA first last
m f child child m f m f
1950 29.1 26.2 26.4 34.9 30 25 44.3 50.5 Netherlands
1970 25.2 23.1 24.5 31.3 25 25 48.0 53.0
1950 29.0 26.2 26.5 33.7 30 25 41.0 49.1 Switzerland
121:0 26.7 24.5 25.2 31.4 25 25 48.2 53.7 I--'
SOUTHERN EUROPE ~ 1950 27.3 25.0 25.0 34.6 25 25 42.8 47.5
Portugal 12'70 26.9 24.5 24.8 33.8 25 25 46.7 51.6
EASTERN EUROPE 1950 26.9 25.4 23.7 30.0 25 25 46.1 48.9
German Dem. Rep. 1970 24.5 22.7 22.7 29.3 25 25 47.1 51.3
1950 24.0 22.6 24.4 30.9 25 20 43.8 51.3 Hungary
1970 24.7 21.6 22.8 28.7 25 20 45.6 54.9
Poland 1950 27.8 24.6 24.0 31.8 25 25 42.7 47.2
1270 26.2 23.6 23.1 30.8 25 25 46.3 51.3
NORTHERN EUROPE
Denmark 1950 27.6 23.9 24.1 32.4 25 25 47.6 48.9
1970 24.8 22.3 22.8 29.4 25 20 48.1 57.1

TABLE A.I (concl'd)
AVERAGE AGE AT LIFE EXPECTANCY
COUNTRY YEAR 1st marriage birth of at age in years OR AREA
first last m f child child m f m f
1950 27.8 25.5 25.6 34.2 25 25 40.4 46.7 Finland 1970 25.0 22.8 23.8 30.6 25 25 38.5 49.5
1950 26.8 23.3 23.3 32.6 25 25 46.4 49.6 Iceland t--'
1970 24,8 22.5 21.5 31.2 25 25 48.7 53.1 I\) OJ
1950 29.7 26.3 27.0 34.6 30 25 44.2 51.0 Norway 1970 25.4 22.8 23.6 30.0 25 25 48.7 52.8
Uni ted Kingdom: 1950 27.7 24.3 25.8 32.7 25 25 45.2 49.3 England and Wales 1970 24.9 22.5 23.9 30.1 25 25 46.0 51.7
1950 26.8 26.1 25.9 33.1 25 25 44.0 47.2 Scotland
1970 24.5 22.6 24.0 30.5 25 25 44.6 50.0
OCEANIA 1950 26.0 26.1 25.7 32.6 25 25 46.6 49.8
New Zealand 1970 24.8 23.8 23.5 29.6 25 25 46.6 52.2 -_ ... _--- ----

TABLE A. 2. a • LENGTH OF DIFFERENT PHASES (IN YEARS )
COUNTRY PERIOD TOTAL b Length of Phase No. Cunrulative Length AROUND LENGTH OR AREA I+II+ I+II+III c
I+II III IV V VI I+II+III III+IV +IV+V I to VI
NORTHERN AMERICA 1950 54.4 9.8 10.0 8.0 15.5 8.4 19.8 27.8 43.3 51.7
Canada 1970 57.4 8.5 10.3 7.7 18.8 9.9 18.8 26.5 45.3 55.2
United States 1950 53.7 8.6 10.9 7.1 18.0 7.0 19.5 26.6 44.6 51.6 of America 1970 56.8 7.6 11.2 6.2 20.7 9.1 18.8 25.0 45.7 54.8
I-' EAST ASIA f\)
\0 1950 43.7 9.8 9.6 8.4 11.1 6.9 19.4 27.8 38.9 45.8
Japan 1970 51.1 5.6 13.8 4.1 20.7 7.5 19.4 23.5 44.2 51.7
WESTERN SOUTH ASIA 1950 54.2 8.9 10.1 7.9 17.5 7.2 19.0 26.9 44.4 51.6
Israel 1970 55.3 10.6 9.1 8.9 18.9 6.5 19.7 28.6 47.5 54.0
WESTERN EUROPE 1950 48.0 7.0 11.2 6.8 15.2 6.9 18.2 25.0 40.2 47.1
Austria 1970 51.0 7.2 11.5 6.5 18.5 9.0 18.7 25.2 43.7 52.7
1950 48.7 8.1 10.8 7.2 15.4 8.0 18.9 26.1 41.5 49.5 France
1970 52.1 7.8 10.9 7.1 19.0 9.3 18.7 25.8 44.8 54.1
Germany, Fed. 1950 48.6 6.0 12.5 5.5 18.6 5.1 18.5 24.0 42.6 47.7 Republic of
12Z0 51.5 8.2 11.6 6.4 19.9 6.9 19.8 26.2 46.1 53.0
b Based on life expectancy at age at first marriage c Sum of the lengths of the different phases.

TABLE A.2.a. (cont'd)

A.2.a. (conc1'd)
COUNTRY PERIOD TOTAL Length of Phase No. Cutml1ative Length OR AREA AROUND LENGTH I+II+ I +II +III
I+II III IV V VI I +II +III III+IV +IV+V I to VI
1950 46.7 8.7 9.4 8.6 10.9 8.6 18.1 26.7 37.6 46.2 Finland
1970 49.5 7.8 11.2 6.8 12.6 13.3 19.0 25.8 38.4 51.7
1950 49.6 9.3 8.7 9.3 17.3 6.7 18.0 27.3 44.6 51.3 Iceland 1970 53.1 8.7 8.3 9.7 22.2 6.7 17.0 26.7 48.9 55.6 I-'
'vi I-'
1950 51.0 8.3 10.4 7.6 18.2 5.2 18.7 26.3 44.5 49.7 Norway
1970 52.8 7.2 11.6 6.4 23.1 6.7 18.8 25.2 48.3 55.0
United Kingdom: 1950 49.3 8.4 11.1 6.9 16.1 7.5 19.5 26.4 42.5 50.0
England and Wales 1970 51.7 7.6 11.8 6.2 20.5 8.1 19.4 25.6 46.1 54.2
1950 47.2 7.0 10.8 7.2 17.2 3.9 17.8 25.0 42.2 46.1 Scotland
1970 50.0 7.9 11.5 6.5 19.1 7.4 19.4 25.9 45.0 52.4
OCEANIA 1950 49.8 6.5 11.1 6.9 21.1 3.1 17.6 24.5 45.6 48.7
New Zealand 1970 52.2 5.8 11.9 6.1 23.0 6.6 17.7 23.8 46.8 53.4
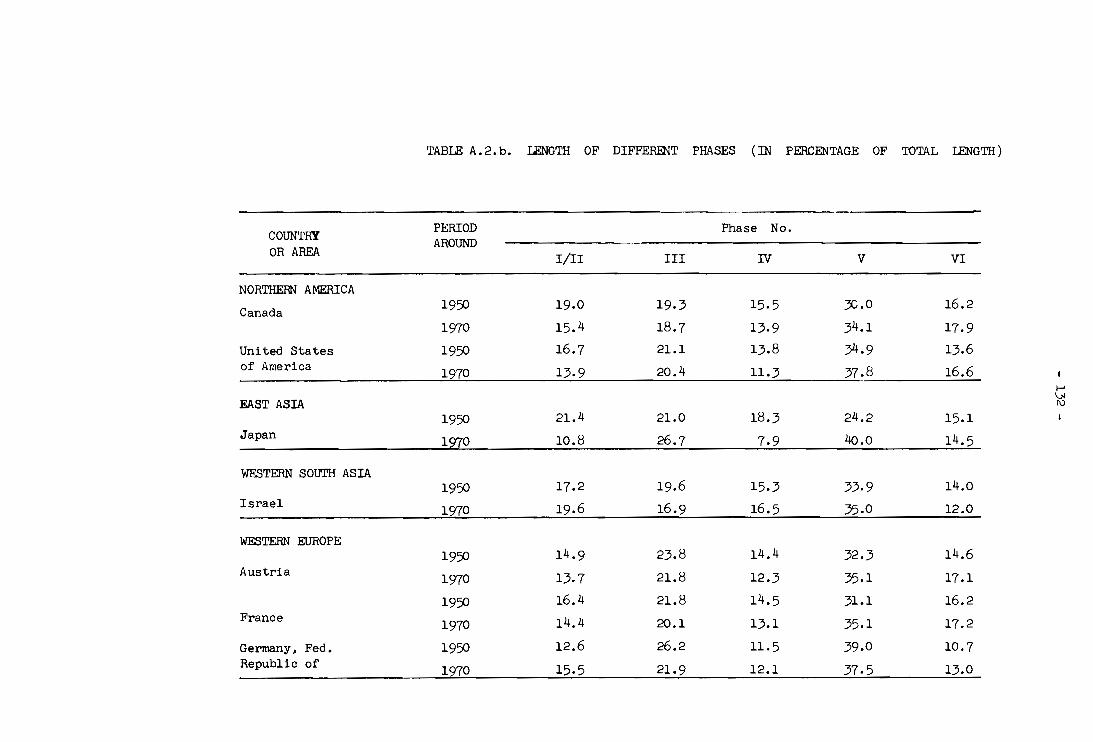
TABLE A. 2. b. LENGTH OF DIFFERENT PHASES ( IN PERCENTAGE OF TOTAL LENGTH)
COUNTRY PERIOD Phase No. AROUND
OR AREA IIII III IV V VI
NORTHERN AMERICA
Canada 1950 19.0 19.3 15.5 :,c.0 16.2 1970 15.4 18.7 13.9 34.1 17.9
Uni ted States 1950 16.7 21.1 13.8 )4.9 13.6 of America
1970 13.9 20.4 11.3 37.8 16.6 I-' \.)J EAST ASIA I\)
1950 21.4 21.0 18.3 24.2 15.1 Japan
1970 10.8 26.7 7.9 40.0 14.5
WESTERN sourn AS IA
1950 17.2 19.6 15.3 33.9 14.0 Israel
1970 19.6 16.9 16.5 35.0 12.0
WESTERN EUROPE
1950 14.9 23.8 14.4 32.3 14.6 Austria
1970 13.7 21.8 12.3 35.1 17.1 1950 16.4 21.8 14.5 31.1 16.2
France 1970 14.4 20.1 13.1 35.1 17.2
Germany, Fed. 1950 12.6 26.2 11.5 39.0 10.7 Republic of
1970 15.5 21.9 12.1 37.5 13.0

TABLE A.2.b. (cont'd)
PERIOD Phase No. COUNTRY AROUND OR AREA III! III IV V VI
1950 17.6 19.3 17.2 37.5 8.3 Netherlands
1970 14.9 20.4 12.4 39.5 12.8
Switzerland 1950 15.6 22.5 15.0 34.6 12.3
1970 12.7 21.8 11.4 39.7 14.4
SOUTHERN EUROPE 1950 20.2 17.7 20.2 27.2 14.7 I-'
\>I Portugal 17.9 17.3 17.3 33.6 14.0 \>I 1970
EASTERN EUROPE 1950 9.5 24.1 13.0 44.5 8.9
German Dem. Rep. 1970 12.3 21.3 12.3 42.9 11.2
1950 17.0 23.6 13.3 38.0 8.0 Hungary
1970 13.3 22.7 11.1 39.0 13.9
1950 15.1 21.4 16.4 30.9 16.2 Poland
1970 13.7 19.5 14.6 37.8 14.4
NORTHERN EUROPE 1950 17.0 19.4 16.6 37.0 10.0
Denmark 1970 13.0 20.8 12.0 42.3 11.9

TABLE A.2.b. (conc1'd)
PERIOD Phase No. COUNTRY AROUND OR AREA
IIII III TV V VI
1950 Finland
18.8 20.3 18.6 23.6 18.6 1970 15.1 21.7 13.2 24.4 25.7 1950 18.1 17.0 18.1 33.7 13.1 Iceland
15.6 14.9 17.4 39.9 12.1 ..... 1970 \>I .f:='
1950 16.7 20.9 15.3 36.6 10.5 Norway 1970 13.1 21.1 11.6 42.0 12.2
Uni ted Kingdom: 16.8 22.2 13.8 32.2 15.0 1950
England and Wales 1970 14.0 21.8 11.4 37.8 14.9 1950 15.2 23.4 15.6 37.3 8.5 Scotland 1970 15.1 21.9 12.4 36.5 14.1
OCEANIA 14.2 43.3 6.4 1950 13.3 22.8
New Zealand 1970 10.9 22.3 11.4 43.1 12.4

TABLE A. 3. AGE AT THE BEGINNING OF THE DIFFERENT PHASES

TABLE A.3. (cont'd)
AGE AT THE BEGINNING OF THE DIFFERENT PHASES
COUNTRY PERIOD TOTAL IIII III N V VI AROUND LENGTH OR AREA
f f m f m f m f m m
1950 49.3 29.1 26.2 37.8 34.9 47.3 44.4 55.8 52.9 (74.3) 71.4 Netherlands 1970 54.9 25.2 23.1 33.3 31.3 44.5 42.5 51.3 49.3 (73.0 ) 71.0
1950 48.0 29.0 26.2 ;6.5 33.7 47.3 44.5 54.5 51.7 (71.0 ) 68.2 Switzerland 1970 ~._2~ __ 26.1 ~ 23.1 H~l~ _45.5 __ ~3.2 51.7 49.4 (73.2 ~ 70.9
I-' SOUTHERN EUROPE \)I
0\ 1950 47.5 27.3 25.0 ;6.9 34.6 45.3 43.0 54.9 52.6 (67.8) 65.5
Portugal 1970 52.1 26.9 24.5 ;6.2 33.8 45.2 42.8 54.2 51.8 (71.7) 69.3
EASTERN EUROPE 1950 48.5 26.9 25.4 31.5 30.0 43.5 41.7 49.5 48.0 (71.1 ) 69.6
German Dem. Rep. 1970 53.6 24.5 22.7 31.1 29.3 42.5 40.7 49.1 47.3 (72.1) 70.3
1950 48.7 24.0 22.6 32.3 30.9 43.8 42.4 50.3 48.9 (68.8) 67. 4 Hungary 1970 53.3 24.7 21.6 31.8 28.7 43.9 40.8 49.8 46.7 (70.6 ) 67.5
1950 47.6 27.8 24.6 35.0 31.8 45.2 42.0 53.0 49.8 (67.7) 64.5 Poland 1970 52.7 26.2 23.6 33.4 30.8 43.7 41.1 51.4 48.8 (71.3) 68.7
NORTHERN EUROPE 1950 50.0 27.6 23.9 ;6.1 32.4 45.8 42.1 54.1 50.4 (72.6 ) 68.9
Denmark 1970 54.8 24.8 22.3 31.9 29.4 43.3 40.8 49.9 47.4 (73.1) 70.6
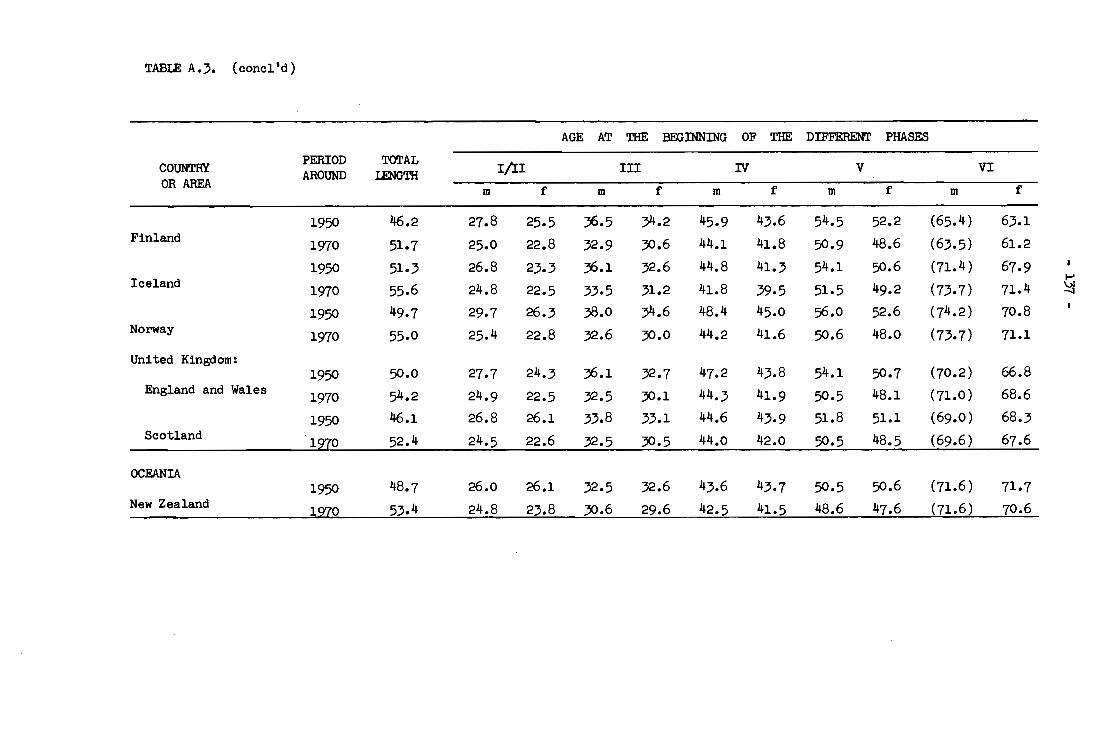
TABLE A.3. (concl'd)
AGE AT THE BEGINNING OF THE DIFFERENT PHASES
COUNTRY PERIOD TOTAL I/II III IV V VI AROUND LENGTH OR AREA
f f f f f m m m m m
1950 46.2 27.8 25.5 36.5 34.2 45.9 43.6 54.5 52.2 (65.4) 63.1 Finland 1970 51.7 25.0 22.8 32.9 30.6 44.1 41.8 50.9 48.6 (63.5) 61.2
1950 51.3 26.8 23.3 36.1 32.6 44.8 41.3 54.1 50.6 (71.4) 67.9 Iceland f-'
1970 55.6 24.8 22.5 33.5 31.2 41.8 39.5 51.5 49.2 (73.7) 71.4 ~
1950 49.7 29.7 26.3 38.0 34.6 48.4 45.0 56.0 52.6 (74.2) 70.8 Norway
1970 55.0 25.4 22.8 32.6 30.0 44.2 41.6 50.6 48.0 (73.7) 71.1
United Kingdom: 1950 50.0 27.7 24.3 36.1 32.7 47.2 43.8 54.1 50.7 (70.2) 66.8
England and Wales 1970 54.2 24.9 22.5 32.5 30.1 44.3 41.9 50.5 48.1 (71.0 ) 68.6
1950 46.1 26.8 26.1 33.8 33.1 44.6 43.9 51.8 51.1 (69.0 ) 68.3 Scotland
1970 52.4 24.5 22.6 32.5 30.5 44.0 42.0 50.5 48.5 (69.6 ) 67.6
OCEANIA 1950 48.7 26.0 26.1 32.5 32.6 43.6 43.7 50.5 50.6 (71.6 ) 71.7
New Zealand 1970 53.4 24.8 23.8 30.6 29.6 42.5 41.5 48.6 47.6 (71.6) 70.6

TABLE A. 4. CHANGES IN THE LENGTH OF THE DIFFERENT PHASES
Change
a = in years CHANGE IN THE LENGTH OF THE DIFFERENT PHASES in
COUNTRY OR AREA b = in %
c IIII
total d I - VI III IV V VI length
NORTHERN AMERICA a 3.5 - 1.3 0.3 - 0.3 3.3 1.5 3.0
Canada b 6.8 -13.3 3.0 - 3.8 21.3 17.9 5.5 United States a 3.2 - 1.0 0.3 - 0.9 2.7 2.1 3.1 of America b 6.2 -11.6 2.8 -12.7 15.0 30.0 5.8 f-'
\.J.I en EAST ASIA
a 5.9 - 4.2 4.2 - 4.3 9.6 0.6 7.4 Japan b 12.9 -42·2 4~.8 -21•2 86.2 8.1 16.9 WESTERN SOUTH ASIA
a 2.4 1.7 - 1.0 1.0 1.4 - 0.7 1.1 Israel b 4.7 12.1 - 2·2 12.7 8.0 - 9·1 2.0
WESTERN EUROPE a 5.6 0.2 0.3 - 0.3 3.3 2.1 3.0
Austria b 11.9 2.9 2.7 - 4.4 21.7 30.4 6.3 a 4.6 - 0.3 0.1 - 0.1 3.6 1.3 3.4
France b 9.3 - 3.7 0.9 - 1.4 23.4 16.3 7.0 a 5.3 2.2 - 0.9 0.9 1.3 1.8 2.9
Germany, Fed. b 11.1 36.7 - 7.2 16.4 7.0 35.3 6.0 Republic of c. d
Sum of the lengths of the different phases. Based on life expectancy at first marriage.

TABLE A.4. (cont'd)
Change CHANGE TIl THE IENGTH OF THE DIFFERENT PHASES in
COUNTRY OR AREA a = in years total d c
b=% I - VI IIII III IV V VI length
a 5.6 - 0.5 1.7 - 1.7 3.2 2.9 2.5 Netherlands b 11.4 - 5.7 17.9 -20.0 17.3 70.7 5.0
a 6.2 - 0.6 1.0 - 1.0 4.9 1.9 4.6 Switzerland b 12.9 - 8.0 9.3 -13.9 29.5 32.2 9.4
SOUTHERN EUROPE .... a 4.6 - 0.3 0.6 - 0.6 4.6 0.3 4.1 ~
Portugal b 9.7 - 3.1 7.1 - 6.3 36.0 4.3 8.6
EASTERN EUROPE a 5.1 2.0 - 0.3 0.3 1.4 1.7 2.4
German Dem. Rep. b 10.5 43.5 - 2.6 4.8 6.5 39.5 4.9
a 4.5 - 1.2 0.6 - 0.6 2.3 3.5 4.6 Hungary
b 9.2 -14.5 5.2 - 9.2 12.4 89.7 9.4
a 5.1 0.1 - 0.1 5.2 - 0.1 4.1 Poland b 10.7 0.9 - 1.3 35~_4 __ - 1.3 8.7
NORTHERN EUROPE a 4.8 - 1.4 1.7 - 1.7 4.7 1.5 8.2
Denmark b 9.6 -16.5 17.5 -20~_ 25.4 30.0 16.8

TABLE A.4. (concltd)
Change CHANGE IN THE LENGTH OF THE DIFFERENT PHASES in
COUNTRY OR AREA a = in years total d
b = in % I _ VIc I/II III IV V VI length
a 5.5 - 0.9 1.8 - 1.8 1.7 4.7 2.8 Finland b 11.9 10.3 19.1 -20.9 15.6 54.7 6.0
a 4.3 - 0.6 - 0.4 0.4 4.9 3.5 I-' Iceland 8.4 - 6.5 - 4.6 4.3 28.3 7.1 ~ b 0
a 5.3 - 1.1 1.2 - 1.2 4.9 1.5 1.8 Norway
b 10.7 -13.3 11.5 -15.8 26.9 28.8 3.5
Uni ted Kingdom: a 4.2 - 0.8 0.7 - 0.7 4.4 0.6 2.4
England and Wales b 8.4 - 9.5 6.3 -10.1 27.3 8.0 4.9
a 6.3 0.9 0.7 - 0.7 1.9 3.5 2.8 Scotland b 13.7 12.9 6.5 - 9.7 11.0 89.7 5.9
OCEANIA a 4.7 - 0.7 0.8 - 0.8 1.9 3.5 2.4
New Zealand b 9.7 -10.8 7.2 -11.6 9.0 112.9 4.8

ANNEX II. DEmGRAPHIC DATA RELEVANT TO THE FAMILY LIFE CYCLE a
B. AFRICAN AND IATIN AMERICAN COUNTRIES
TABLE B.1. AGE AT MARRIAGE AND WHEN GIVING BIRTH, AND LlFE EXPECTANCY
AVERAGE AGE AT LIFE EXPECTANCY
COUNTRY YEAR 1st marriage birth of in years OR AREA
at age
first last m f child child m f m f
AFRICA 1950 33.2 30.9 21.8 31.9 35 20 27.5 43.1
Mauritius 1970 33.3 ?JJ.7 21.9 31.7 35 20 ;.6.5 54.1
I-'
1950 31.0 24.4 23.6 34.0 ?JJ 25 32.7 43.0 ~ I-'
Reunion 1970 ?JJ.5 24.2 23.7 34.0 ?JJ 25 35.3 46.6
TROPICAL SOUTH AMERICA
1950 26.7 22.8 22.6 32.5 25 20 41.0 48.6 Ecuador
1970 26.1 22.6 22.4 33.1 25 20 43.6 48.1
MIDDLE AMERICA (MAINIAND)
1950 24.3 23.1 22.0 32.1 25 20 42.3 48.0 Costa Rica
1970 26.0 22.2 22.7 32.8 25 20 46.7 48.3
a Beginning of family life cycle: At birth of first child in African and Latin American countries.

TABLEB.1. (concl'd)
AVERAGE AGE AT LIFE EXPECTANCY
COUNTRY YEAR 1st marriage birth of at age in years OR AREA first last
m f child child m f m f
1950 29.7 24.6 22.1 31.3 30 20 37.4 46.5 El Salvador
1970 28.1 23.9 21.4 31.9 30 20 42.8 55.9
1950 28.2 23.6 22.1 31.8 30 20 33.9 40.3 Guatemala
1970 27.6 23.3 21.4 32.4 30 20 35.5 44.6
1950 27.0 22.1 21.4 29.8 25 20 44.7 51.3 ..... ~
Panama I\)
1970 26.1 22.2 21.0 30.1 25 20 44.7 51.3
TEMPERATE SOUTH AMERICA
1950 29.6 25.1 24.0 33.2 30 25 34.8 43.2 Chile
1970 28.1 24.0 23.3 32.5 30 25 39.2 48.8
CARIBBEAN
Guadeloupe & 1950 31.6 29.0 24.3 34.0 30 25 34.2 41.9
Martinique 1970 31.2 27.7 25.0 35.1 30 25 44.2 52.5
Trinidad & 1950 29.0 24.3 20.8 31.0 30 20 35.4 45.9
Tobago 1970 29.7 25.4 21.2 30.1 30 20 40.6 55.1
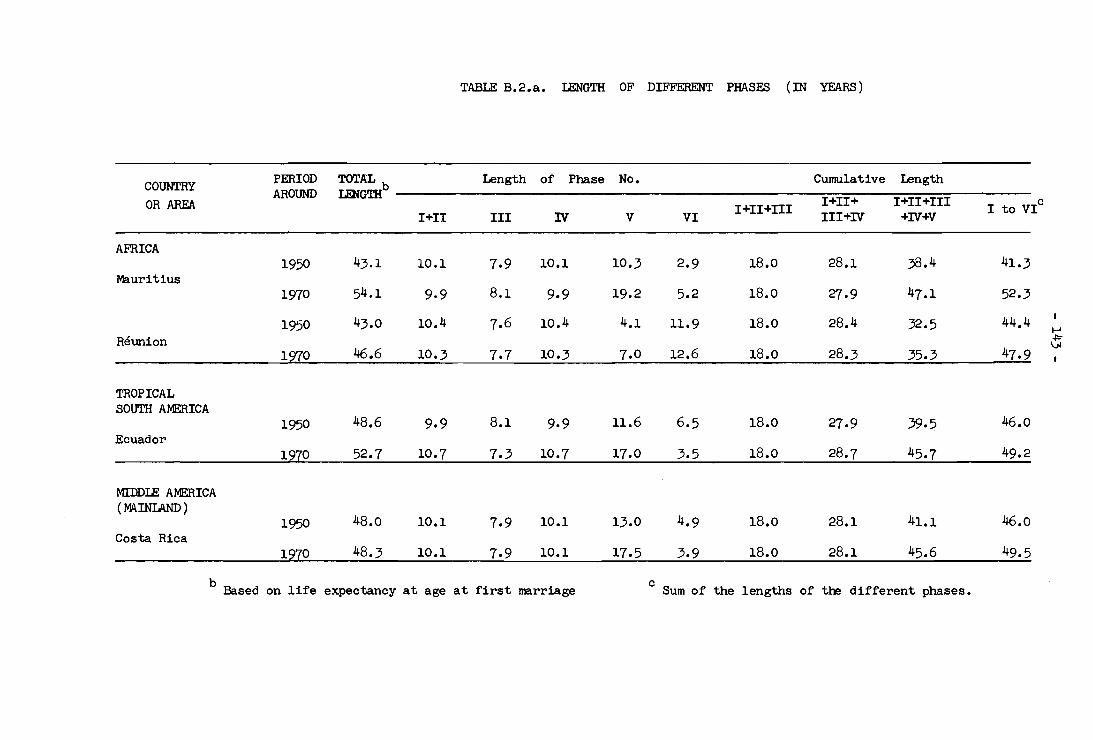
TABLE B.2.a. IENGTH OF DIFFERENT PHASES (IN YEARS)
COUNTRY PERIOD TOTA:L Length of Phase No. Cumulative Length AROUND LmGTHb
I+II+ I+II+III OR AREA I+II+III I to VIC I+II III IV V VI III+IV +IV+V
AFRICA 1950 43.1 10.1 7.9 10.1 10.3 2.9 IB.O 2B.l 38.4 41.3
Mauritius 1970 54.1 9.9 B.l 9.9 19.2 5.2 IB.O 27.9 47.1 52.3
1950 43.0 10.4 7.6 10.4 4.1 11.9 IB.O 2B.4 32.5 44.4 I-'
Reunion ~ \.>I
1970 46.6 10.3 7.7 10.3 7.0 12.6 IB.o 2B.3 35.3 47.9
TROPICAL SOUTH AMERICA
1950 4B.6 9.9 B.l 9.9 11.6 6.5 IB.o 27.9 39.5 46.0 Ecuador
1970 52.7 10.7 7.3 10.7 17.0 3.5 IB.O 2B.7 45.7 49.2
MIDDLE AMERICA (MAINLAND)
1950 4B.0 10.1 7.9 10.1 13.0 4.9 IB.o 2B.l 41.1 46.0 Costa Rica
1970 4B.3 10.1 7.9 10.1 17.5 3.9 IB.o 2B.l 45.6 49.5
b Based on life expectancy at age at first marriage c Sum of the lengths of the different phases.

TABLE B.2.a. (concl'd)
COUNTRY PERIOD TOTAL b Length of Phase No. Cumulative Length
OR AREA AROUND LENGTH I+II+ I+II+III I +II +III I to VIc I+II III IV V VI III+IV +IV+v
1950 46.5 9.2 8.8 9.2 17.2 5.1 18.0 27.2 44.4 49.5 El Salvador
1970 55.9 10.5 7.5 10.5 18.7 7.3 18.0 28.5 47.2 54.5
1950 40.3 9.7 8.3 9.7 10.5 4.6 18.0 27.7 38.2 42.8 Guatemala
1970 44.6 11.0 7.0 11.0 14.2 4.3 18.0 29.0 43.2 47.5
1950 51.3 8.4 9.6 8.4 17.0 6.5 18.0 26.4 43.4 49.9 I-' Panama ~
8.9 17.6 5.6 18.0 27.1 44.7 .po-
1970 51.3 9.1 9.1 50.3
TEMPERATE SOUTH AMERICA
1950 43.2 9.2 8.8 9.2 9.1 7.9 18.0 27.2 36.3 44.2 Chile
1970 48.8 9.2 8.8 9.2 14.6 8.7 18.0 27.2 41.8 50.5
CARIBBEAN
Guadeloupe & 1950 41.9 9.7 8.3 9.7 9.6 5.3 18.0 27.7 37.3 42.6
Martinique 1970 52.5 10.1 7.9 10.1 17.6 6.8 18.0 28.1 45.7 52.5
Trinidad & 1950 45.9 10.2 7.8 10.2 11.7 5.2 18.0 28.2 39.9 45.1
Tobago 1970 55.1 8.9 9.1 8.9 18.1 8.9 18.0 26.9 45.0 53.9

TABLE B.2.b. LENGTH OF DIFIiW\ENT PHASES (IN PERCENTAGE OF TOTAL LENGTH)
PERIOD Phase No. COUNTRY OR AREA AROUND Illl III IV V VI
AFRICA 1950 24.5 19.1 24.5 24.9 7.0
Mauritius 1970 18.9 15.5 18.9 ;£).7 9.9
1950 23.4 17.1 23.4 9.2 26.8 Reunion .....
1970 21.5 16.1 21.5 14.6 26.3 ~ \J1
TROPICAL SOUTH AMERICA
1950 21.5 17.6 21.5 25.2 14.1
Ecuador 1970 21.7 14.8 21.7 34.6 7.1
MIDDLE AMERICA (MAINLAND)
1950 22.0 17.2 22.0 28.3 10.6 Costa Rica
1970 20.4 16.0 20.4 35.4 7.9

-----
TABLE B.2.b. (concl'd)
PERIOD Phase No. COUNTRY AROUND OR AREA IIII III IV V VI
1950 18.6 17.8 18.6 34.7 10.3 El Salvador
1970 19.3 13.8 19.3 34.3 13.4
1950 22.7 19.4 22.7 24.5 10.7 Guatemala
1970 23.1 14.7 23.1 29.9 9.1
1950 16.8 19.2 16.8 34.1 13.0 I-'
Panama -l=" 0\
1970 18.1 17.7 18.1 35.0 11.1
TEMPERATE SOUTH AMERICA
1950 20.8 19.9 20.8 20.6 17.9 Chile
1970 18.2 17.4 18.2 28.9 17.2
CARIBBEAN 1950 22.8 19.5 22.8 22.5 12.4
Guadeloupe & Martinique 1970 19.2 15.0 19.2 33.5 13.0
Trinidad & 1950 22.6 17.3 22.6 25.9 11.5
Tobago 1970 16.5 16.9 16.5 33.6 16.5

TABLE B.,3. AGE AT THE BEGINNING OF THE DIFFERENT PHASES
AGE AT THE BEGINNING OF THE DIFFERENT PHASES
COUNTRY PERIOD TOTAL I/II III IV V VI AROUND LENGTH OR AREA m f m f m f m f m f
AFRICA 1950 41.3 24.1 21.8 34.2 31.9 42.1 39.8 52.2 49.9 62.5 (60.2)
Mauritius 1970 52.3 24.5 21.9 34.3 31.7 42.4 39.8 52.3 49.7 71.5 (68.9)
1950 44.4 30.2 23.6 40.6 34.0 48.2 41.6 58.6 52.0 62.7 (56.1) Reunion I-'
-I='
1970 47.9 30.0 23.7 40.3 34.0 48.0 41.7 58.3 52.0 65.3 (59.0 ) -.J
TROPICAL SOUTH AMERICA
1950 46.0 26.5 22.6 32.9 29.0 44.5 40.6 54.4 50.5 66.0 (62.1 ) Ecuador
1970 49.2 25.9 22.4 36.6 33.1 43.9 40.4 54.6 51.1 (68.6 ) 65.1
MIDDLE AMERICA (MAINLAND)
1950 46.0 26.2 22.0 36.3 32.1 44.2 40.0 54.3 50.1 67.3 (63.1 ) Costa Rica
1970 49.5 26.6 22.7 36.7 32.8 44.6 40.7 54.7 50.8 (71. 7) 67.8

TABLE B.3. (conc1 I d)
AGE AT THE BEDINNrnG OF THE DIFFERENT PHASES
COUNTRY PERIOD TOTAL IIII III IV V VI AROUND LENGTH
OR AREA m f m f m f m f m f
1950 49.5 27.2 22.1 ;x5.4 31.3 45.2 40.1 54.4 49.3 (67.2 ) 62.3 E1 Salvador
1970 54.5 25.6 21.4 ;x5.1 31.9 43.6 39.4 54.1 49.9 72.8 (68.6)
1950 42.8 26.7 22.1 36.4 31.8 44.7 40.1 54.4 49.8 (63.9) 59.3 Guatemala
1970 47.5 25.7 21.4 ;x5.7 32.4 43.7 39.4 54.7 50.4 (65.5) 61.2 ..... ~
1950 49.9 26.3 21.4 34.7 29.8 44.3 39.4 52.7 47.8 en
69.7 (64.8) Panama
1970 50.3 25.0 21.0 34.1 30.1 43.0 39.0 52.1 48.1 69.7 (66.3)
TEMPERATE SOUTH AMERICA
1950 44.2 28.5 24.0 37.7 33.2 46.5 42.0 55.7 51.2 64.8 (60.3) Chile
1970 _ 5Q_.5 __ 27.4 __ 23.3 ~~9 __ 32.5 45.~1.~ ~~39~ _6~ __ (~
CARIBBEAN
Guadeloupe & 1950 42.6 26.9 24.3 ;x5.6 34.0 44.9 42.3 54.6 52.0 64.2 (61.6 )
Martinique 1970 52.5 28.5 25.0 38.6 35.1 46.5 43.0 56.6 53.1 74.2 (70.7)
Trinidad & 1950 45.1 25.5 20.8 35.7 31.0 43.5 38.8 53.7 49.0 65.4 (60.7)
Tobago 1970 53.9 g5~6 __ ~1. 2 __ 24 ~ 5~. ~3-"-~21.2 52~ __ 48~L_ 70.6_ (66~
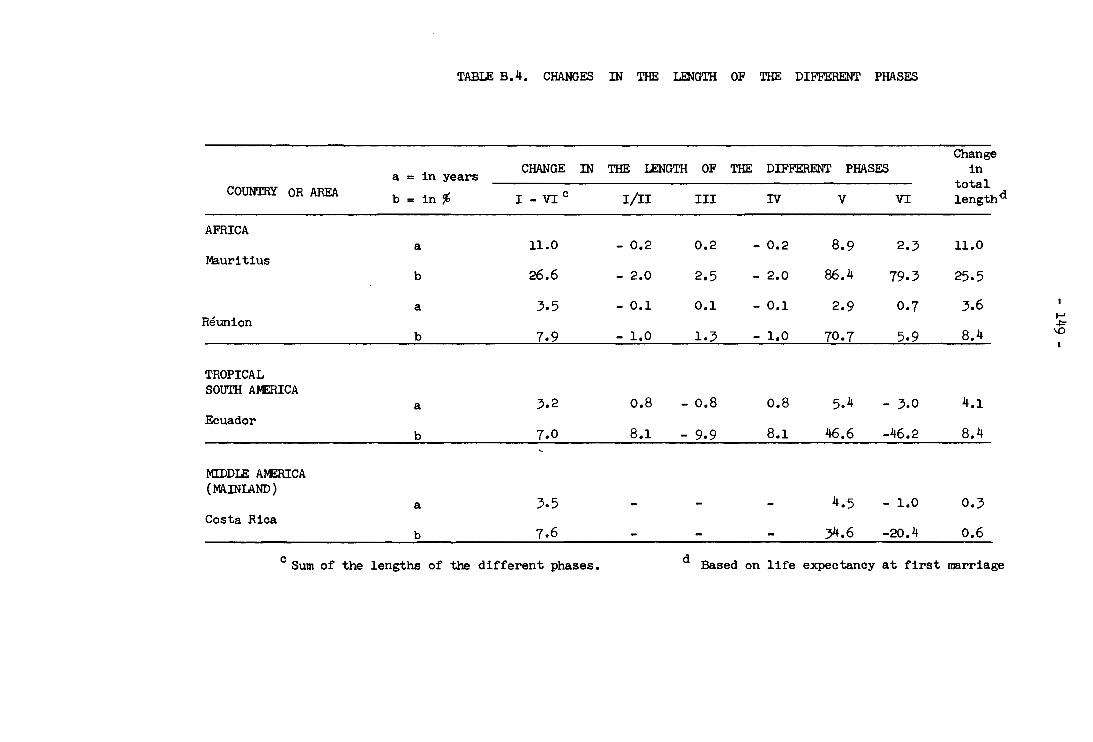
TABLE B. 4. CHANGES IN THE LENGTH OF THE DIFFERENT PHASES
Change
a = in years CHANGE IN THE IENGTH OF THE DIFFERENT PHASES in
COUNTRY OR AREA total
b = in % I _ VI c III! III IV V VI lengthd
AFRICA a 11.0 - 0.2 0.2 - 0.2 8.9 2.3 11.0
Mauritius b 26.6 - 2.0 2.5 - 2.0 86.4 79.3 25.5
a 3.5 - 0.1 0.1 - 0.1 2.9 0.7 3.6 Reunion I-'
~
b 7.9 - 1.0 1.3 - 1.0 70.7 5.9 8.4 \0
TROPICAL SOUTH AMERICA
a 3.2 0.8 - 0.8 0.8 5.4 - 3.0 4.1 Ecuador
b 7.0 8.1 - 9.9 8.1 46.6 -46.2 8.4
MIDDIE AMERICA (MAINIAND)
a 3.5 4.5 - 1.0 0.3 Costa Rica
b 7.6 34.6 -20.4 0.6
c Sum of the lengths of the different phases. d Based on life expectancy at first marriage
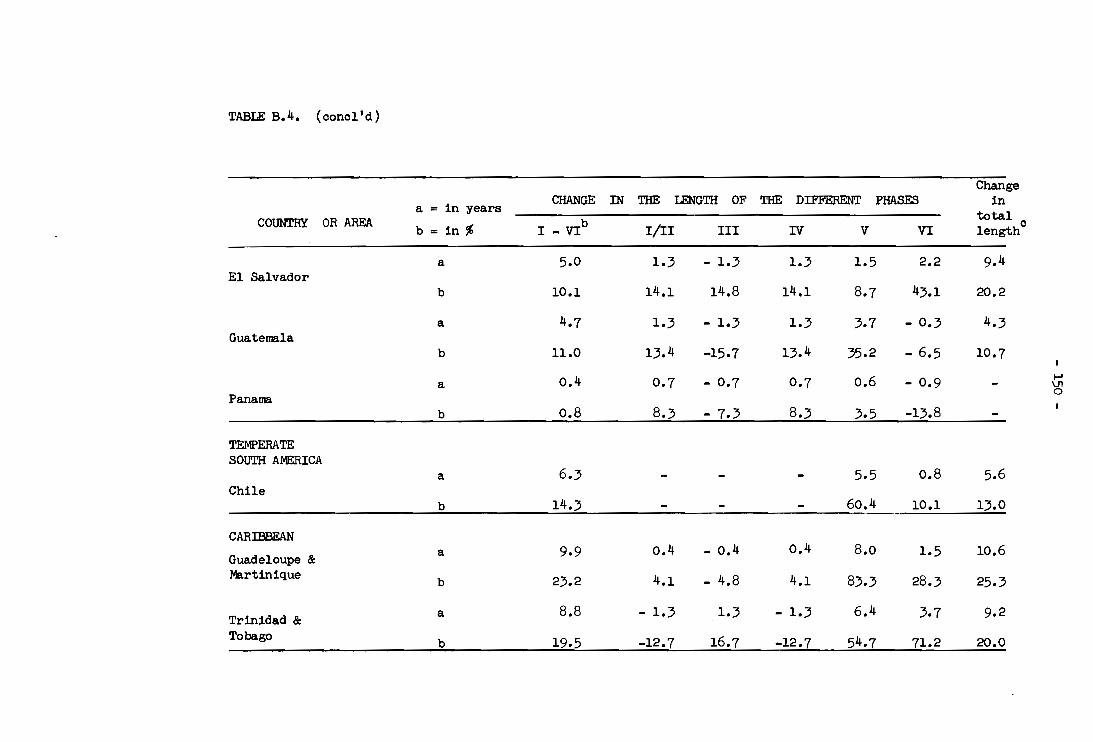
TABLE B.4. (concl'd)
Change a = in years CHANGE IN THE LENGTH OF THE DIFFERENT PHASES in
total COUNTRY OR AREA b = in % I _ VIb
III! III IV VI c V length
a 5.0 1.3 - 1.3 El Salvador
1.3 1.5 2.2 9.4
b 10.1 14.1 14.8 14.1 8.7 43.1 20.2
a 4.7 1.3 - 1.3 1.3 3.7 - 0.3 4.3 Guatemala
b 11.0 13.4 -15.7 13.4 35.2 - 6.5 10.7
0.4 0.7 - 0.7 0.7 0.6 - 0.9 .... a \.J1 0 Panama
b 0.8 8.3 - 7.3 8.3 3.5 -13.8
TEMPERATE SOUTH AMERICA
a 6.3 Chile
5.5 0.8 5.6
b 14.3 60.4 10.1 13.0
CARIBBEAN
Guadeloupe & a 9.9 0.4 - 0.4 0.4 8.0 1.5 10.6 Martinique
b 23.2 4.1 - 4.8 4.1 83.3 28.3 25.3
Trinidad & a 8.8 - 1.3 1.3 - 1.3 6.4 3.7 9.2 Tobago
b 19.5 -12.7 16.7 -12.7 54.7 71.2 20.0

- 151 -
ANNEX III
SELECTED BIBLIOGRAPHY
CHAPTER II - The Family as a Unit in Health Studies
1. UNITED NATIONS. Principles and Recommendations for the 1970 Population Censuses (1969) p. 20. (See also SCHUBNELL H. ET AL. Allgemeines Statistisches Archiv. (1959) - ditto II.)
2. Ibid l p. 14.
3. UNITED NATIONS. The Determinants and Consequences of Population Trends l
Vol. II 1973, p. 337 footnote 13.
4. WHO.Report on consultation on Family Health. 5 - 12 November 1973. FHE 75.4
5. DEEBLEI J.S. The economic approach to family health studies. Social Science and Medicine, ~: 529-533 (1974).
6. HERBERGER, L. The demographic approach to family health studies. Social Science and Medicine, ~: 535-544 (1974 ).
CHAPTER III - The Normative Life Cycle of the Nuclear Family
1. UN/ECE. European Recommendations for the 1970 Population Censuses. In: 69. II. E/Mim. 17-ST/CES 13, p. 40, para. 107.
2. Ibid., pp. 44/45, para. 121-123.
3. Ibid., pp. 35/36, para. 91-93.
4. ZELDITCH. Cross-cultural analysis of family structure. In: Christensen, Harold T~, ed. Handbook of marriage and the family, Chicago, Rand McNally, 1964.
5. BURCH, T.K. The size and structure of families: a comparative analysis of census data. American Sociological Review l 32 (3): (1967).
6. UN.Department of Economic and Social Affairs l The Determinants and Consequences of Population Trends l Vol. II New York: United Nations l 1973.
7. FOOTEI N.N. ET AL. Housing choices and housing restraints I New York, McGraw Hill, 1960.
8. DUVA~ E.M. Family development (revised edition)1 Philadelphia I Lippincott I 1962.

- 152 -
9. RODGERS, R.H. Improvements in the construction and analysis of family family life cycle categories, Kalamazoo, Western Michigan University, 1962.
10. HILL, R. & RODGERS, R.H. The developmental approach. In: Christensen, H.T. ed. Handbook of marriage and the family, Chicago, Rand MCNally, 1964.
CHAPTER IV - Contemporary Demographic Patterns
1. WHELPTON, P.K. Cohort fertility, 1954.
2. HERBERGER, L. Labour force projections and cohort analYSis illustrated by the labour force partiCipation of women. In: Proceedings of the 37th session of the International Statistical-rnstitute, 1959.
3. SCHUENELL, H. & HERBERGER, L. The statistical problem of longitudinal analysis in demography. In: Proceedings of the 39th session of the International Statistical Institute, 1973.
4. GRABILL, W.H., KISER, C.V., WHELPTON, E.K. The fertility of American women, 1958.
CHAPTER V - Variations and Exceptions
1. GLASS & GREBENIK. Trends and patterns of fertility in Great Britain, 1954, pp. 112-114, Tables 42, 43.
2. SCHLESINGER, B. The one parent family, University of Toronto Press, 1970. See espeCially the Review in Appendix IV, pp. 120-125.
3. SIMPSON, G. People in families, John Wiley & Sons, 1960, p. 386.
4. Vital statistics of the United States, Marriage and divorce statistics, 1959.
5. GLICK, P. & CARTER, H. Marriage patterns and educational level. Arner Soc. Rev., ~: 294-300 (1958).
6. JACOBSON, P. American marriage and divorce, Rinehart & Winston, 1959, pp. 69-70.
7. MONAHAN, T.P. The duration of marriage to divorce: second marriages and migratory types. Marriage and Family Living, 21 (May): 134-138 (1959).
8. MONAHAN, T.P. How stable are remarriages? A. J. Soc., ~ (November): 280-288 (1952).
9. BOWER~, C.E. Assortative mating by previous marital status: Seattle 1939-1946. A. J. S.a., 18 (April): 171 (1953).

- 153 -
10. BOWERMAN, C.E. & IRISH, D. Some relationships of stepchildren to their parents. Marriage and Family Living, 24 (May): 113-121 (1962)
11. UN. Determinants and consequences of population trends, Table X.3, pp. 341-2. UN population studies, ST/SOA/SER.A;50 (1973).
12. Ibid., Table x.4, p. 343.
13. SUNDT, E. Fortsatte bidrag angaaende Soedeligheds-tilstanded i Norge, Christiania 1864, p. 27.
14. ADAMS, H.M. & GALLACHER, U.M. Some facts and observations about illegitimacy. Children, Mar-April: 43-49 (1963).
15. TAUEBER, I. Change and transition in family structures (E/Conf.60/SYM.~I!5).
CHAPTER VI - The Historical Dimension
1. WRIGLEY, E.A. Population and history, New York, MCGraw-Hill, 1969.
2. HAJNAL, J. European marriage patterns in perspective. 1&: Glass, D.V. & Eversley, D.E.C., eds. Population in history, Chicago, Aldine, 1965.
3. BOGUE, D. Principles of Demography, New York, John Wiley, 1969.
4. UHLENBERG, P.R. A study of cohort life cycles: cohorts of native born Massachusetts women. 1830-1920. Population Studies, ~(3): (1969).
5. UHLENBERG, P.R. Cohort variations in family life cycle experiences of U.S. females. Journal of Marriage and the Family, ~ (2): (1974).
6. GLICK, P. The family cycle. American Sociological Review, 12(2): (1947).
7. GLICK, P. American families, New York, John Wiley, 1957.
8. GLICK, P. & PARKE, R., Jr. New approaches in studying the life cycle of the family. Demography, ~ (1965).
9. RYDER, N. Reproductive behaviour and the family life cycle. Paper presented at the United Nations Economic and Social Council, Symposium on Population and the Family, Honolulu, 1973.
10. COALE, A. & DEMENY, P. Regional model life tables and stable populations. Princeton, Princeton University Press, 1966.
11. COLLVER, A. The family life cycle in India and the United States. American SOCiological Review, 28(1): (1963).
12. ORTEGA, M. & LERDA, J. Tablas de vida de generaciones para MeXiCO, 1960. Demografia y Economia, 16: (1972).