the future of digital retail by deborah weinswig at rise 2016. jan. 16, 2016
TRANSCRIPT

1
THE FUTURE OF DIGITAL RETAIL
Deborah Weinswig Fung Business Intelligence Centre Global Retail & Technology
Cell: 917-655-6790
@debweinswig

2
AGENDA
• About Fung Business Intelligent Centre (FBIC)
• Holiday 2015 Wrap-Up
• Top 16 Disruptors for 2016
• Top Five Retail Technology Trends in Asia

3
Fung Business Intelligence Centre (FBIC)
• Established in 2000 and headquartered in Hong Kong
• FBIC serves as the knowledge bank and think tank for the Fung Group
– Collects and analyzes market data on sourcing, supply chains, distribution and retail
– Provides thought leadership on technology and other key issues
• New York–based Global Retail & Technology team
– Follows broader retail and technology trends
– Provides advice and consultancy services to colleagues and business partners of the Fung Group
– Builds collaborative knowledge communities

4
Futureproofing
• Anticipating future trends and developments
• Plan for future value and avoid obsolescence
– What problem are you trying to solve?
– How will the solution be used?
– How robust does it need to be?
• Ensure flexibility to manage changing formats and deployment patterns

5
OUR PARTNERSHIP WITH ACCELERATORS
Alchemist Accelerator is an accelerator exclusively for startups whose revenue comes from enterprises, not consumers. CoCoon is a coworking space where entrepreneurs, creative talent, successful leaders and investors meet, collaborate and deliver results together. Member companies get access to networking opportunities, work space, a photography studio and mentors. Entrepreneurs Roundtable Accelerator (ERA) provides participant companies with an intensive four-month program, with the goal of helping early-stage companies progress rapidly into exciting, viable businesses. New York Fashion Tech Lab is an accelerator that is a result of a collaboration between the Partnership Fund for New York City, Springboard Enterprises and major fashion retailers. It focuses on early- and growth-stage companies.
Plug and Play is a global innovation platform. It connects startups to corporations, and invests in over 100 companies every year. Its 360° ecosystem allows for remarkable innovation to take shape on an international scale.
Techstars is a global ecosystem that empowers entrepreneurs to bring new technologies to market wherever they choose to build their business.

6
Fung Capital/FBIC Commerce Technology Landscape

7
HOLIDAY 2015 WRAP-UP

8
HOLIDAY THEMES
• Highly promotional holiday was expected – Women’s apparel bounced back, up 10%+, while men’s lagged
– Double-digit growth in furniture sales suggests consumers are willing to spend on big-ticket items (MasterCard Advisors)
• Earlier and later shopping – In 2015, 1 in 4 shoppers bought a Christmas gift before Halloween
– Almost half did the majority of their shopping before Cyber Monday
– There was a surge in foot traffic in the final week of 2015
• Bifurcation of spending – Luxury slowed with the strong US dollar and fewer tourists spending
Neiman Marcus Saks
Nordstrom Bloomingdale’s Ann Taylor Costco Macy’s Dillard’s Supervalu JCPenney Kohl’s Kroger Safeway
Drugstores (CVS/Walgreens) BJ’s/Sam’s Club
Target Kmart/Sears Walmart Primark
Dollar Stores Aldi/Lidl

9
NRF Reported a Solid 3% For Holiday 2015
$529
$554 $569
$584
$608
$626
5.2%
4.6%
2.7% 2.7%
4.1%
3.0%
0%
2%
4%
6%
8%
10%
$480
$520
$560
$600
$640
2010 2011 2012 2013 2014 2015
Grow
th Rate Ho
liday Retail Sales (U
SD Bil.)
Holiday Retail Sales Growth Rate
10
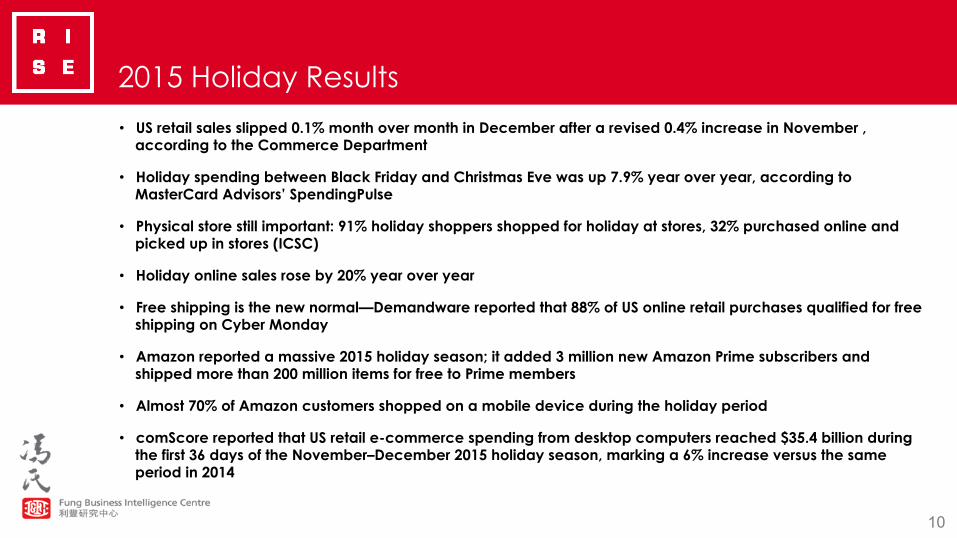
2015 Holiday Results
• US retail sales slipped 0.1% month over month in December after a revised 0.4% increase in November , according to the Commerce Department
• Holiday spending between Black Friday and Christmas Eve was up 7.9% year over year, according to MasterCard Advisors’ SpendingPulse
• Physical store still important: 91% holiday shoppers shopped for holiday at stores, 32% purchased online and picked up in stores (ICSC)
• Holiday online sales rose by 20% year over year
• Free shipping is the new normal—Demandware reported that 88% of US online retail purchases qualified for free shipping on Cyber Monday
• Amazon reported a massive 2015 holiday season; it added 3 million new Amazon Prime subscribers and shipped more than 200 million items for free to Prime members
• Almost 70% of Amazon customers shopped on a mobile device during the holiday period
• comScore reported that US retail e-commerce spending from desktop computers reached $35.4 billion during the first 36 days of the November–December 2015 holiday season, marking a 6% increase versus the same period in 2014

11
MIXED DECEMBER COMPS
Macy’s: (4.7)% combined November–December comps, though digital sales rose by about 25%
“About 80% of our year-over-year declines in comparable sales can be attributed to shortfalls in cold-weather goods such as coats, sweaters, boots, hats, gloves and scarves.” – CEO Terry Lundgren
JCPenney: November–December comps +3.9%, lapping +3.7% last year “Despite unprecedented warm weather that significantly affected apparel sales, our focus of private brands, omni-channel execution and a compelling gift-giving selection resulted in strong holiday sales.”
– CEO Marvin Ellison
L Brands: December comps +8%
“Best December ever.” – CEO Les Wexner
Ascena Retail Group: December comps (4)% “The holiday period for specialty retail was marked by soft traffic and unseasonably warm conditions, and was highly competitive. Excluding the planned decline at Justice, consolidated comparable sales were flat to last year.” – CEO David Jaffe

12
Mixed Holiday Results—Final Tally Still to Come
• US retail sales were up 2.9% for the week ended January 2 and up 2.2% for December, according to Johnson Redbook
• RetailNext reported that December US traffic dropped by 5.8%, and that it dropped by 6.4% in the November–December holiday shopping period
Sales Traffic Conversion Average
Transac\on Value
Sales Per Shopper Transac\ons % Returns
December -‐0.4% -‐5.8% 0.4% 3.6% 5.7% -‐3.8% -‐0.3%
Nov/Dec -‐2.0% -‐6.4% 0.3% 3.3% 4.8% -‐5.0% -‐0.2%
Thanksgiving -‐4.7% -‐5.1% -‐0.5% 3.1% 0.3% -‐7.0% -‐0.1%
November -‐5.6% -‐7.6% 0.0% 3.2% 2.3% -‐8.3% 0.1%
October -‐12.2% -‐10.7% -‐0.7% 3.8% -‐1.1% -‐15.1% 0.2%
September -‐8.7% -‐8.1% -‐0.1% 1.1% -‐0.5% -‐9.6% 0.1%
August -‐7.3% -‐9.9% 0.2% 1.6% 2.9% -‐8.7% 0.2%
Source: RetailNext

13
Favorable Macro Backdrop
• Lower gas prices continue to provide a silver lining for US consumers
• Inflation/Deflation
– Apparel prices remain deflationary
– Food prices fell into deflationary range in November
Indicator Period 2015 2014 YoY % Chg.
Gas Price (USD/Gallon) Avg. (Nov./Dec.) $2.10 $2.70 -‐22%
Per Capita Disposable Personal Income Nov. $42,274 $40,996 3.1%
Savings Rate Nov. 5.5% 4.6% 90 bps
S&P/Case-‐Shiller 20-‐City Composite Home Price Index Oct. 182.8 173.2 5.6%
Unemployment Rate 4Q 5.0% 5.7% (70) bps
University of Michigan Consumer SenYment
Avg. (Nov./Dec.) 92.0 91.2 0.8%
Source: Haver Analy5cs

14
Warm Weather in Key US Markets Affects Sales of Winter Categories
• Warmest winter in over 55 years
• Increased traffic to retailers and restaurants
• Left manufacturers with extra inventory
• Demand for winter goods decreased, but consumers still spent on alternate goods over the holidays
• Unprecedented spending on springtime products
Source: Planaly5cs

15
E-Commerce Sales Delivered Strong Results
• First Data recorded a 9.4% total spending increase for Thanksgiving and Black Friday
• ShopperTrak reported a 10% decline in in-store sales during Thanksgiving weekend
• MasterCard SpendingPulse said e-commerce sales were up 20% this holiday
• RetailNext reported that US store sales were down 4.7% on a 5.1% decline in store traffic
Source: comScore and ShopperTrak
Brick and Mortar
Total Digital
Desktop
Mobile
% of Total Consumer
DiscreYonary
85%
15%
12.6%
2.4%
Growth Forecast
2.5%
14.3%
9.4%
47.2%
Growth Points
2.1%
2.2%
1.2%
1.1%
Holiday 2015 Sales Growth by Channel

16
Sales and Traffic from Mobile Devices Showed Robust Growth This Holiday
• Mobile traffic grew by 40% year over year on Thanksgiving, Black Friday and Cyber Monday
• Sales from mobile devices grew by 47.2% and contributed to a quarter of total consumer discretionary spending growth for holiday 2015
0%# 2%#9%#
54%# 52%#
40%#
Thanksgiving###### Black#Friday#### Cyber#Monday#
Retail'Category'Visita/on'by'Pla3orm'
Desktop# Mobile#
Source: comScore

17
Home and Apparel Were the Top-Performing E-Commerce Categories This Holiday
Absolute Dollar Rank Product Category
Season to Date* YoY Growth Rate
8
7
1
4
9
14
3
18
Home & Garden
Furniture, Appliances & Equipment
Apparel & Accessories
Consumer Packaged Goods
Event & Movie Tickets
Sports & Fitness
Consumer Electronics
Video Games
Very Strong
Strong
Strong
Strong
Strong
Moderate
Moderate
Moderate
*Based on corresponding shopping days in 2014 Source: comScore

18
Top 16 DISRUPTORS in 2016
1. IoT-DrivenPartnerships
2. E-Commerce Players Go Offline
3. Ready-to-Cook/Eat Economy
4. Online Grocery Shopping
5. Online Fashion Resale Marketplaces Show Explosive Growth
6. Samsung Pay Accelerates Contactless Payment Adoption
7. Sharing Economy
8. A Subset of the Sharing Economy Is the Rental Economy
9. Subscription Economy Is Nibbling Away at Traditional Retailers’ Sales
10. Caring Economy Promotes Startups for Social Good
11. Experience Economy Is Taking Away Retail Spending
12. Home Furnishings Market Disrupted by E-Commerce Pure Plays
13. Jet.com
14. Athletic Brands Investing in Fitness Apps
15. Facial Recognition
16. Lack of Disruptors: Victoria’s Secret

19
1. IoT-Driven Partnerships
• Unprecedented cross-industry partnerships being formed
• Samsung and Microsoft developing IoT devices based on Windows 10
• Panasonic is partnering with Denver to transform it into the first smart city
– Create an energy-efficient hub
– Solar technology, tele-medicine tech, traffic management and security
• Audi and Qualcomm are partnering to integrate Qualcomm’s Snapdragon 602A to provide cutting-edge connectivity technology
– Infotainment, advanced smartphone connectivity, navigation, voice quality and control features

20
1. IoT-Driven Partnerships
• Ford is partnering with Amazon to integrate vehicles with Echo, Amazon’s smart-home device
• Intel is working with New Balance on an Android Wear fitness watch that is due out next holiday season
• IBM and Under Armour are integrating the Watson supercomputer with the Connected Fitness network to analyze data and provide real-time coaching on health and fitness
• Volvo pursued a partnership with Microsoft to enhance connected-car strategies
– The Microsoft Band can be pressed and told to start the car heater, for example
21
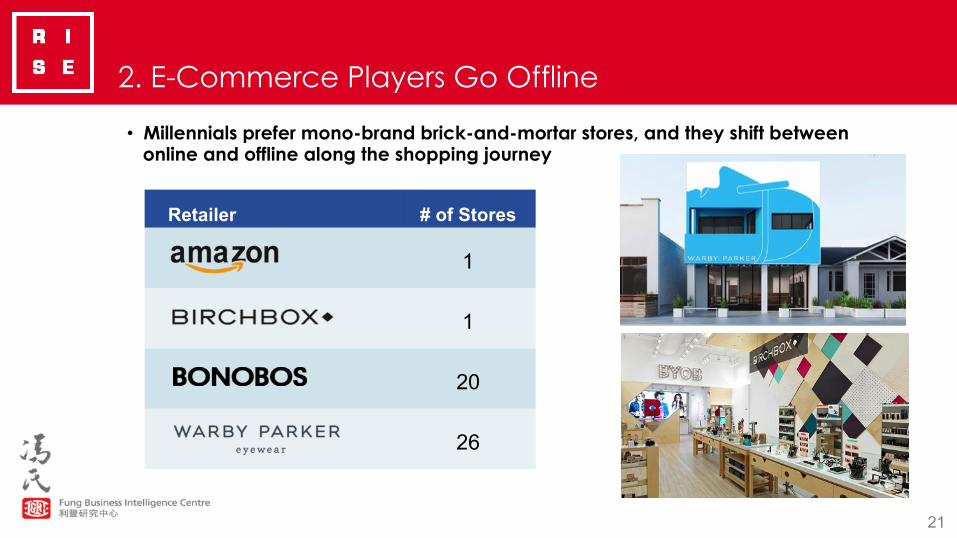
2. E-Commerce Players Go Offline
• Millennials prefer mono-brand brick-and-mortar stores, and they shift between online and offline along the shopping journey
Retailer # of Stores
1
1
20
26

22
2. E-Commerce Players Go Offline
Case Study: Warby Parker
– Targeting millennials
– Started exploring offline with pop-ups and a showroom in its NYC office; now expanding to over 20 cities in the US
– Warby Parker’s stores make more than $3,000 per sq. ft., putting the retailer in an elite category with companies such as Tiffany and Apple
– More than 85% of store shoppers will later visit the website, increasing the chances for further orders

23
3. Ready-to-Cook/Eat Economy
Disruptors: Blue Apron, Munchery, Plated, HelloFresh
• Blue Apron was the fastest-growing US e-tailer in 2014, with sales growing 550%, to $65 million
• Healthier and cheaper than eating out and takeout
• Convenience: ready-to-cook boxes and curated grocery according to menus, delivered to your doorstep
• US food market
– $1.2 trillion, with $600 billion in restaurants
– Millennial focused
550% in 2014

24
4. Online Grocery Shopping
Disruptors: Instacart, AmazonFresh • Walmart Grocery Pickup
– Order online – Pick up at the store
• Amazon Prime Pantry, $5.99 – Order everyday items online, filling the box – Ship to your home – Gamified promotion, slower shipping options in
exchange for free Pantry
• Instacart: Personal Grocery Shopper/Multiple Stores

25
5. Online Fashion Resale Marketplaces Show Explosive Growth
Disruptors: thredUP, Tradesy, The RealReal, Poshmark, Vestiaire Collective
• Online resale industry is worth $34 billion in the US
• SnobSwap estimates the market is growing at a 10% compound annual rate
• Mobile is hot in resale; over 45% of thredUP’s sales come from mobile devices
• Patagonia, Eileen Fisher and H&M launched resale programs
2011
2012
2013
Source: thredUP

26
5. Online Fashion Resale Marketplaces Show Explosive Growth
Disruptors: thredUP, Tradesy, The RealReal, Poshmark, Vestiaire Collective
• Why Online Resale Marketplaces Took Off
– Heavy venture capital investment in online consignment industry (over $450 million)
– Retail brands’ resale programs encouraged consumers’ sustainable consumption habits
– Consumers are convinced by great quality of secondhand apparel bought via online platforms
– Societal shift toward less ownership—the art of decluttering

27
6. Samsung Pay Accelerates Contactless Payment Adoption
Disruptor: Samsung Pay
• Samsung Pay will accelerate the current slow adoption of contactless payment because it uses magnetic stripe capability (MST) chips
– MST works with new and older credit card terminals—no additional investment required
– Most widely accepted mobile wallet in the US
– Consumers can incorporate loyalty cards into Samsung Pay
– In 2016: expanding to China, lower-priced handsets and online transactions
Digital Payment Method Acceptance by North American Retailers
As of July 2015 Source: Boston Retail Partners

28
7. Sharing Economy
Disruptors: Uber, Airbnb, Lending Club, WeWork
• Valuations of sharing economy companies have skyrocketed
• Revenues are projected to catch up to aggressive valuations:
Startup Industry Valua\on
Uber Car Sharing $50.0 B
Airbnb Peer-‐to-‐Peer AccommodaYon $25.0 B
Didi Kuaidi Car Sharing $16.5 B
WeWork Office Sharing $10.0 B
Lending Club Peer-‐to-‐Peer Lending $7.4 B
OLA Car Sharing $5.0 B
Etsy Maker Online Marketplace $3.5 B
HomeAway Peer-‐to-‐Peer AccommodaYon $3.0 B
Lyc Car Sharing $2.5 B
Instacart LogisYcs/Delivery $2.0 B
Prosper Peer-‐to-‐Peer Lending $1.9 B
TransferWise Finance $1.0 B
Funding Circle Finance $1.0 B
$15 Billion 2013
$335 Billion 2025
CAGR: 29.5%
Source: PwC
Source: Company reports/analysts’ es5mates

29
8. A Subset of the Sharing Economy Is the Rental Economy
Disruptors: Airbnb, Zipcar, Netflix
• Renting goods, services and space is becoming more popular than owning
• Renting saves consumers money and the hassle of maintenance
• Suitable for urban living and limited space
• More environmentally friendly
• Airbnb, Zipcar, Rent the Runway and Le Tote are major disruptors
Leaders in The New Sharing Economy (and Year Launched)

30
9. Subscription Economy Is Nibbling Away at Traditional Retailers’ Sales
Disruptors: Le Tote, Birchbox, BarkBox, Pijon, Stitch Fix
• Convenience and curated products for consumers
• Recurring revenue model for retailers
• Element of self-gifting
• Beauty is the biggest category
• Fashion styling subscriptions are becoming popular

31
10. Caring Economy Promotes Startups for Social Good
Disruptors: TOMS, Reformation, Warby Parker, NOURI, SoapBox Soaps, Zady, GoodXChange
• Social activism over self-indulgence
– Consumers, especially Gen Z, are increasingly demanding integrity from brands and retailers
• Startups for social good apply market-based strategies to achieve a social goal
– TOMS, the shoe company, has a “one for one” business model
– Reformation designs and manufactures sustainable apparel, sourcing sustainable fabrics and vintage garments

32
11. Experience Economy Is Taking Away Retail Spending
Disruptors: Gigzolo, Zaptravel, OpenTable, Beautified • Consumers are spending less on apparel and more on experiences • 78% of millennials prefer to spend money on an experience rather than buying
something desirable • Gigzolo: curated network of musicians and DJs available for hire for events • Zaptravel:
– Digital travel agent – Uses a semantic search engine to scroll through its database

33
12. Home Furnishings Market Disrupted by E-Commerce Pure Plays
Disruptors: Wayfair, Hayneedle, Art.com, Houzz
• E-commerce pure plays are gaining significant market share from omni-channel home retailers
• They offer more curated products and good customer service
• Houzz is an online home-remodeling community of 35 million users worldwide that connects homeowners with design inspirations and home professionals
US Furniture E-‐Commerce Outlook
Source: eMarketer/Forrester Research
$15 $18
$20 $23
$26 $29
$32
2012 2013 2014 2015 2016 2017 2018F
Sales Forecast (USD Bil.)

34
12. Home Furnishings Market Disruptor: Houzz
• Founded in 2009, Houzz is aiming to disrupt the home furnishings space
• Houzz is an online home-remodeling community that connects homeowners with design inspirations and home professionals
• Its business model is driven by community, content and commerce
• Houzz has already attracted 35 million users across 200 countries

35
13. Jet.com (Pricing Model and Smart Cart Technology)
Disruptor: Jet.com
• Smart Cart technology: savings increase with each item added, based on the location of the sellers and the buyer
• Pulls costs out of the supply chain and bumps them back to customers
• A win-win situation for retailers and consumers
• On average, 9% cheaper than Amazon and 6% cheaper than Walmart (Profitero)
+10% +10%
+6% +7%
+11%
+7%
+12%
+8% +7%
+4%
-‐2%
+7% +6%
+10%
Baby Beauty Electronics Grocery Household Office Supplies
Pet Supplies
Price Comparison of Jet, Amazon and Walmart
Amazon vs. Jet Walmart vs. Jet More
Expensive than Jet
Less Expensive than Jet

36
13. Jet.com (Customers Can Feel Smart) • Website offers constant comparison and savings versus
Amazon.com
• Also tracks cumulative savings on Jet.com
• Customers can “see” savings by waiving return privileges or through shipping synergies (Smart Cart)
• Clean, simple website and mobile app

37
14. Athletic Brands Investing in Fitness Apps
Disruptor: Under Armour • Under Armour’s Connected Fitness Platform
– Company launched its own fitness app, UA Record – Introduced UA HealthBox: set includes wristband, heart rate
monitor and scale, priced at $400 – Under Armour owns the world’s largest digital health and fitness
community, with 130 million users – One of eight people purchasing a fitness device will be synced on
UA’s platform—Apple Watch and Google are not competing
2013
2015
2015
2015
$475 million (cash) Feb. 2015
$85 million (cash) Jan. 2015
Jul. 2015 (terms undisclosed)
$150 million (cash) Dec. 2013

38
15. Facial Recognition
Disruptor: Intel
• The global advanced Facial Recognition market expected growth: $2.77 Bil. in 2015 to $6.19 Bil. in 2020 (CAGR 17.4%)
• 30% of retailers are using facial recognition technology to track customers in stores (CSC)
• Applications are increasing: health, wellness, beauty and advertising
– Determine the thickness and application of makeup
– Analyze in-store shopper data
• In 2015, Walmart tested with FaceFirst:
– Cameras check you in at location
– Smartphone receives customized deals based on demographic
• Intel released RealSense facial recognition technology in 2015
– Consumer grade 3D cameras
– Home usage: camera recognizes face to unlock front door
• Challenges: Consumers are not especially comfortable with technology use in retail

39
16. Lack of Disruptors: Victoria’s Secret
Disruptor: Who will it be?
• Victoria’s Secret’s Success Formula
– Marketing via $12 million annual fashion show
– A brand that creates celebrities
– Benefits from athleisure/loungewear trend
– Close attention to in-store experience
– Wise international expansion strategy
– 20% e-commerce penetration
– L Brands reported 8% holiday comps
Victoria’s Secret Store and Beauty Comparable Store Sales
14% 13%
6% 4%
3% 4%
8%
Q3 2010 Q3 2011 Q3 2012 Q3 2013 Q3 2014 Q3 2015 Q4 2015

40
TOP FIVE RETAIL TECHNOLOGY TRENDS IN ASIA
1. Uberification in Asia
2. Streaming Media
3. Fast Adoption of 3D Printing
4. Inconsistent Mobile Payment Growth
5. End of One-Child Policy in China Driving Retail

41
1. Uberification in Asia
• On-demand services are available for everything from accommodation to personal chefs in Asia
• Home Cooked is the most successful uberified service in China
• Uberified services faced legal and regulatory challenges
• Not expected to replace established industries
Service Company (Location)
Accommodation Hanintel (S. Korea), Kozaza (S. Korea)
Babysitting Caregiver Asia (Singapore)
Food and Drink Delivery Grain (Singapore), Home Cooked (China)
Home Cleaning Whome365 (China)
Home Finder AnAnZu (China)
Logistics (Pickup and Delivery) GogoVan (Hong Kong), EasyVan (Hong Kong)
Taxi Service Kuaidi ONE (China), Ola (India)
Selected Asian Startups that Provide Uber-‐Like Services

42
2. Streaming Media
• Netflix will expand into Hong Kong, Singapore, South Korea and Taiwan in early 2016
• HOOQ, a joint venture of Singtel, Sony Pictures and Warner Bros., is competing directly with Netflix
• Alibaba recently acquired streaming media company Youku Tudou for $4.4 billion
• Growth driven by the rising affluence of consumers, growing Internet penetration and increasing smartphone ownership
Rank Country Minutes per Day 2-‐Year Growth Rate
1 China 67 5%
2 Vietnam 61 84%
3 Thailand 60 14%
4 UAE 54 43%
5 Hong Kong 51 16%
6 Philippines 51 74%
Figure 2. Time Spent Watching Online Video Top Six Countries (4Q 2014)
Source: GlobalWebIndex

43
3. Fast Adoption of 3D Printing
• The Asia-Pacific region accounted for 27% of global 3D printer shipments in 2014
• Key region for fast adoption due to government support and extensive industrial funding in important markets
• China plans to invest $300 million in 3D printing over three years
3D Product Shipments: Market Share by Region, 2014
Source: Canalys/FBIC Global Retail & Technology
AMERICAS 42%
ASIA-‐PACIFIC 27%
ASIA-‐PACIFIC 27%

44
4. Inconsistent Mobile Payment Growth
• China is experiencing fast adoption of mobile payment via Alipay and WeChat Wallet
• South Korea, Japan, Hong Kong, Taiwan and Singapore have the infrastructure, but are not yet seeing substantial growth
• Several banks in Singapore have launched mobile payment services and new services using NFC on USIM cards
Mobile Payments Readiness Index: Selected Countries in Asia
Source: MasterCard
Global Ranking COUNTRY
1 Singapore
5 South Korea
6 Japan
10 China
11 Taiwan
12 Philippines
13 Malaysia
14 Hong Kong
20 Thailand
21 India

45
5. End of One-Child Policy in China Driving Retail
• Starting in 2016, couples in China will be allowed to have two children without risk of fine
• Huatai Financial estimates that the relaxation of the one-child policy could create a $15 billion market
• The second-child boom will benefit several categories, including food and dairy, healthcare, garments, automotive and education
• The first wave of the second-child boom is expected in 2017
Source: MasterCard

46
THANK YOU! [email protected]
Cell: 917-655-6790 HK: 852.6119.1779
CHN: 86.186.1420.3016 @debweinswig