the future of the world car fleet the road ahead bbva research · the future of world car fleet:...
TRANSCRIPT

The Future of World Car Fleet: The Road Ahead(A BBVA Research model for long-term automobile projections)
November, 2012
Cross-Country Emerging Markets Unit
A BBVA Research model for long-term automobile projections
2
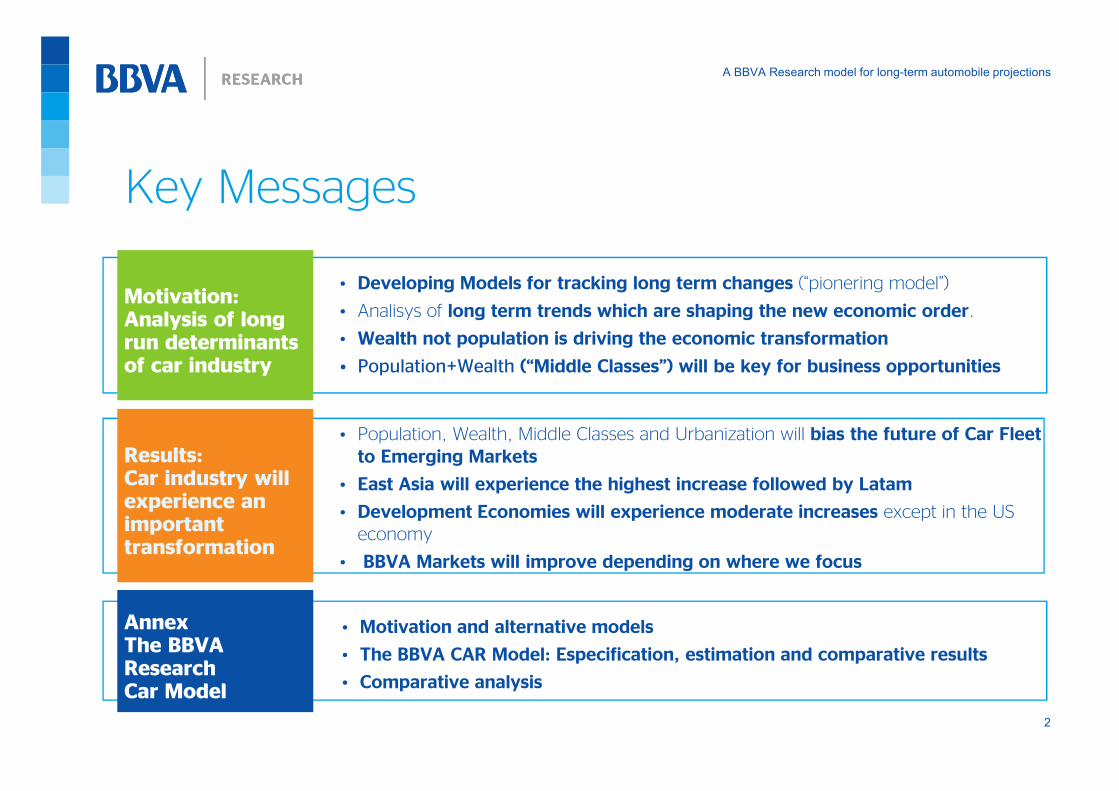
• Population, Wealth, Middle Classes and Urbanization will bias the future of Car Fleet
to Emerging Markets
• East Asia will experience the highest increase followed by Latam
• Development Economies will experience moderate increases except in the US
economy
• BBVA Markets will improve depending on where we focus
Key Messages
• Motivation and alternative models
• The BBVA CAR Model: Especification, estimation and comparative results
• Comparative analysis
Results:Car industry willexperience animportanttransformation
AnnexThe BBVA ResearchCar Model
• Developing Models for tracking long term changes (“pionering model”)
• Analisys of long term trends which are shaping the new economic order.
• Wealth not population is driving the economic transformation
• Population+Wealth (“Middle Classes”) will be key for business opportunities
Motivation:Analysis of longrun determinantsof car industry
A BBVA Research model for long-term automobile projections
3
Contents
Analysis of long run determinants of Car Industry
Global results
Annex: The BBVA Research CAR Model
A BBVA Research model for long-term automobile projections
4
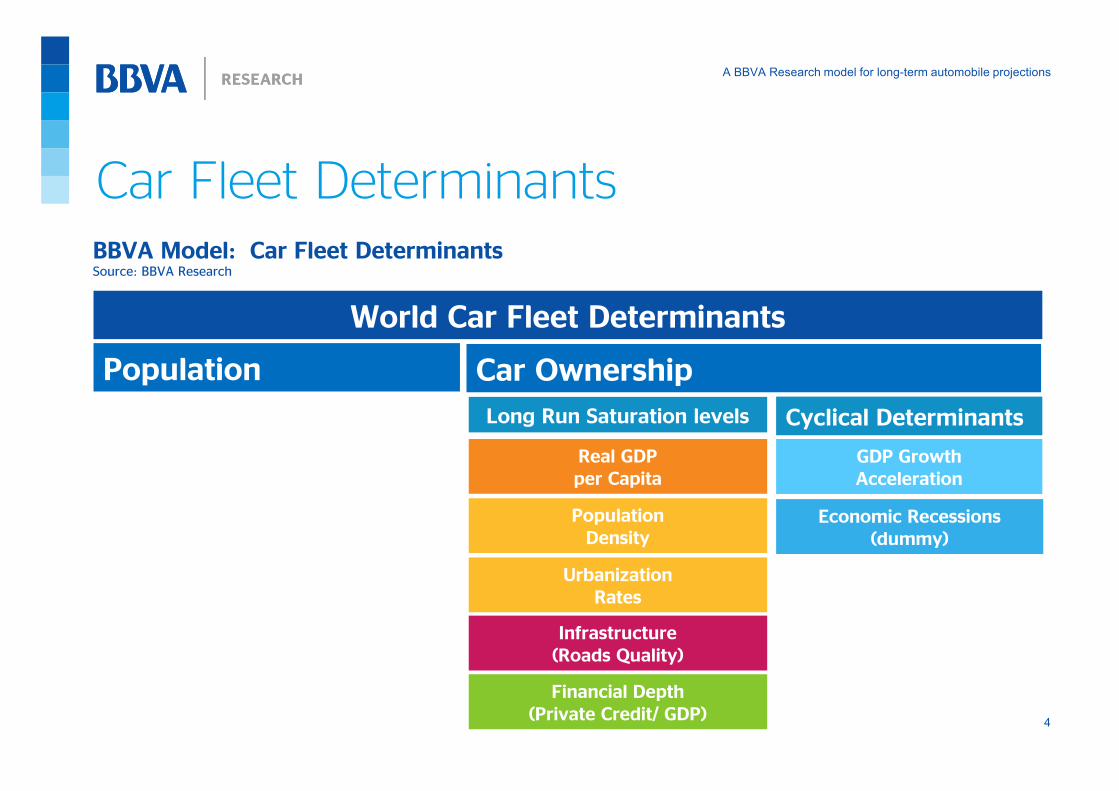
Car Fleet Determinants
Car Ownership
Long Run Saturation levels Cyclical Determinants
Real GDP
per Capita
Population
Density
Urbanization
Rates
Infrastructure
(Roads Quality)
Financial Depth
(Private Credit/ GDP)
GDP Growth
Acceleration
Economic Recessions
(dummy)
Population
World Car Fleet Determinants
BBVA Model: Car Fleet DeterminantsSource: BBVA Research
A BBVA Research model for long-term automobile projections
5
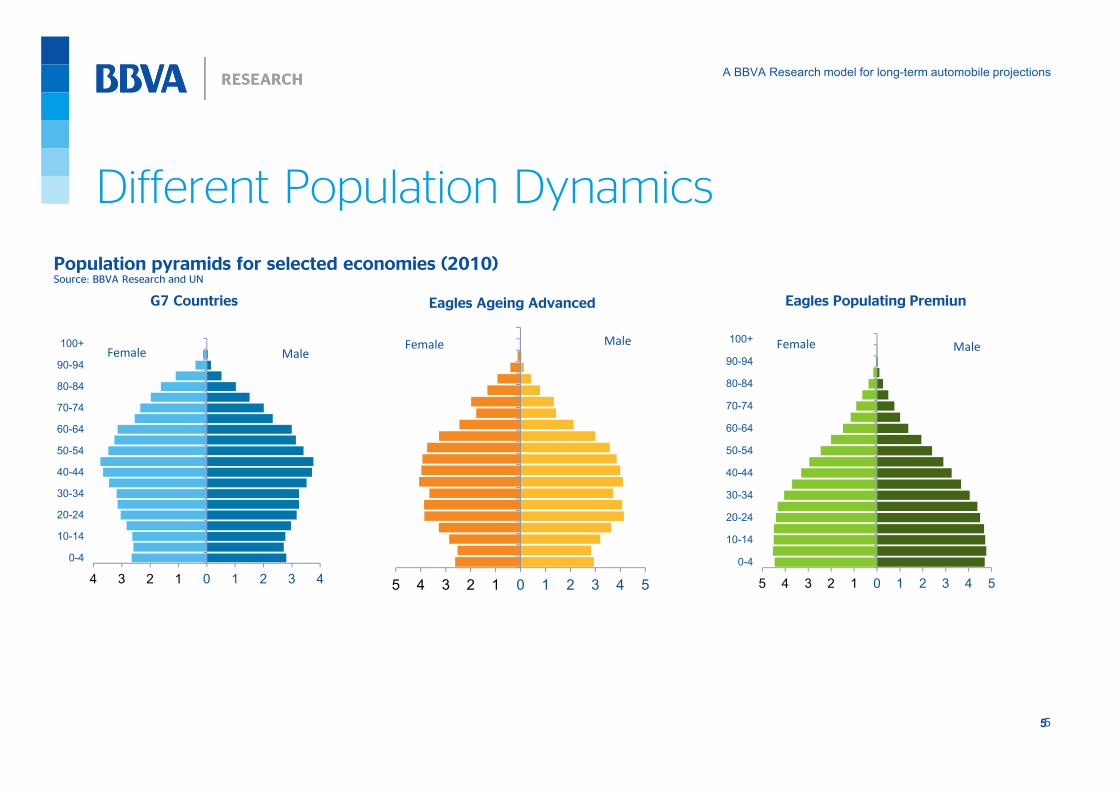
Different Population Dynamics
5
Population pyramids for selected economies (2010)Source: BBVA Research and UN
G7 Countries
4 3 2 1 0 1 2 3 4
0-4
10-14
20-24
30-34
40-44
50-54
60-64
70-74
80-84
90-94
100+Female Male
5 4 3 2 1 0 1 2 3 4 5
Female Male
Eagles Ageing Advanced Eagles Populating Premiun
5 4 3 2 1 0 1 2 3 4 5
0-4
10-14
20-24
30-34
40-44
50-54
60-64
70-74
80-84
90-94
100+Female Male
A BBVA Research model for long-term automobile projections
6
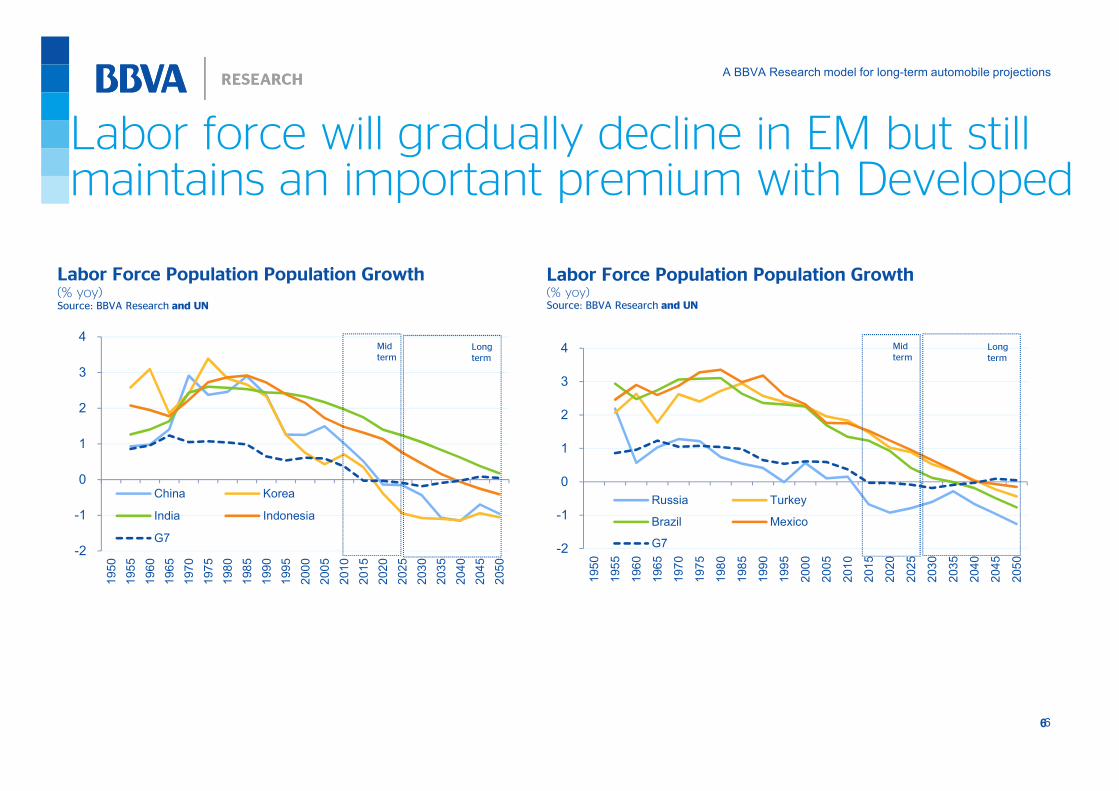
Labor force will gradually decline in EM but stillmaintains an important premium with Developed
6
-2
-1
0
1
2
3
4
1950
1955
1960
1965
1970
1975
1980
1985
1990
1995
2000
2005
2010
2015
2020
2025
2030
2035
2040
2045
2050
China Korea
India Indonesia
G7-2
-1
0
1
2
3
4
1950
1955
1960
1965
1970
1975
1980
1985
1990
1995
2000
2005
2010
2015
2020
2025
2030
2035
2040
2045
2050
Russia Turkey
Brazil Mexico
G7
Labor Force Population Population Growth(% yoy)Source: BBVA Research and UN
Labor Force Population Population Growth(% yoy)Source: BBVA Research and UN
Mid
term
Long
term
Mid
term
Long
term
A BBVA Research model for long-term automobile projections
7
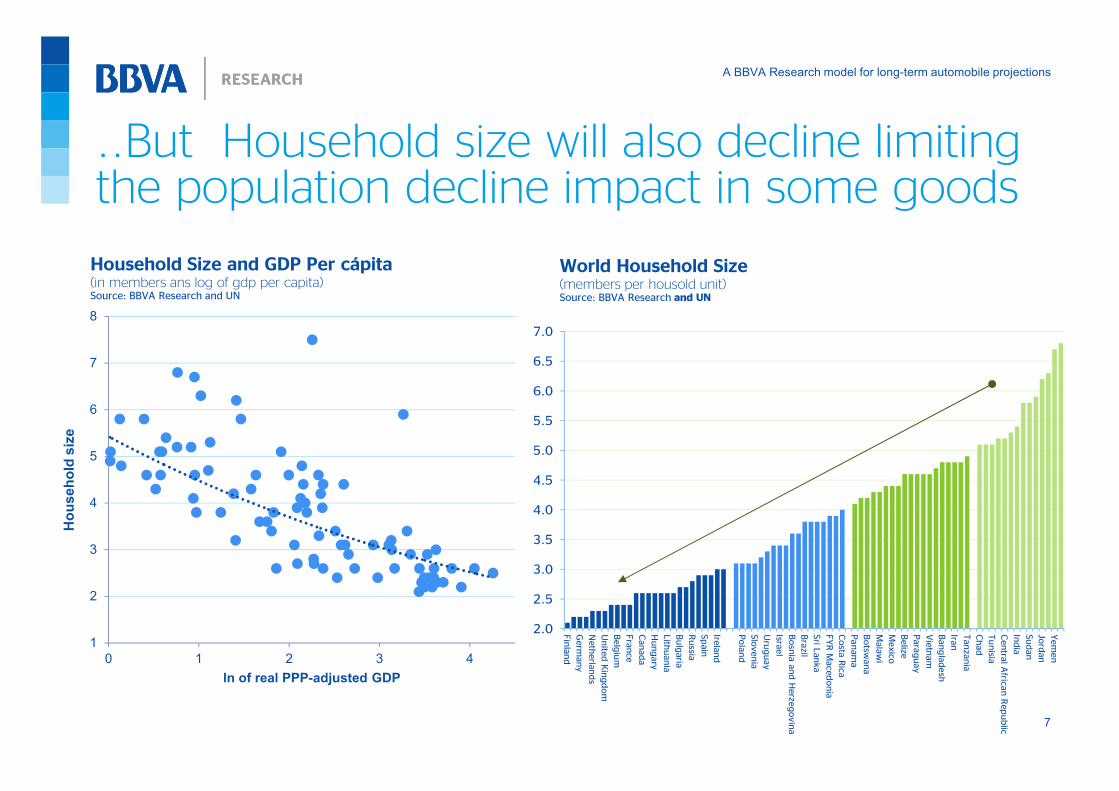
..But Household size will also decline limitingthe population decline impact in some goods
1
2
3
4
5
6
7
8
0 1 2 3 4
Household size
ln of real PPP-adjusted GDP
Household Size and GDP Per cápita(in members ans log of gdp per capita)Source: BBVA Research and UN
World Household Size(members per housold unit)Source: BBVA Research and UN
2.0
2.5
3.0
3.5
4.0
4.5
5.0
5.5
6.0
6.5
7.0
Finland
Germ
any
Netherlands
United Kingdom
Belgium
France
Canada
Hungary
Lithuania
Bulgaria
Russia
Spain
Ireland
Poland
Slovenia
Uruguay
Israel
Bosnia and Herzegovina
Brazil
Sri L
anka
FYR Macedonia
Costa
Rica
Panama
Botsw
ana
Malawi
Mexico
Belize
Paraguay
Vietnam
Bangladesh
Iran
Tanzania
Chad
Tunisia
Centra
l Afric
an Republic
India
Sudan
Jordan
Yemen
A BBVA Research model for long-term automobile projections
8
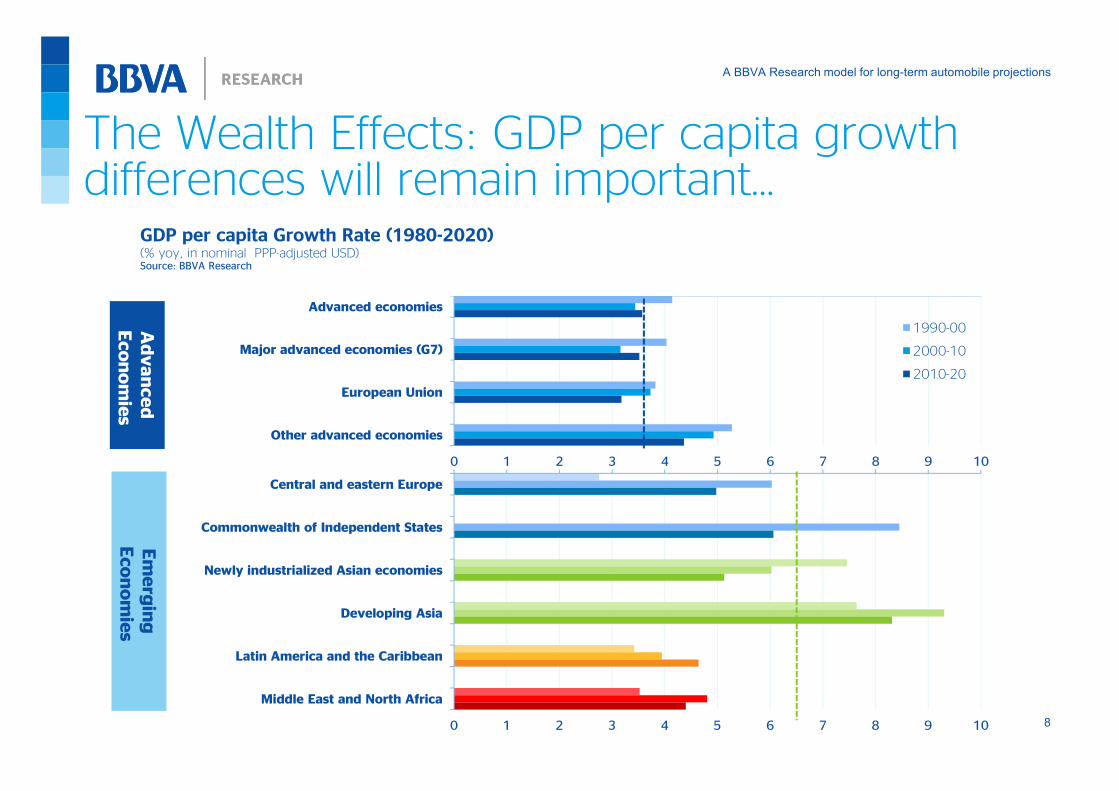
The Wealth Effects: GDP per capita growthdifferences will remain important…
0 1 2 3 4 5 6 7 8 9 10
Central and eastern Europe
Commonwealth of Independent States
Newly industrialized Asian economies
Developing Asia
Latin America and the Caribbean
Middle East and North Africa
0 1 2 3 4 5 6 7 8 9 10
Advanced economies
Major advanced economies (G7)
European Union
Other advanced economies
1990-00
2000-10
2010-20
GDP per capita Growth Rate (1980-2020)(% yoy, in nominal PPP-adjusted USD)Source: BBVA Research
Advanced
Economies
Emerging
Economies
A BBVA Research model for long-term automobile projections
9
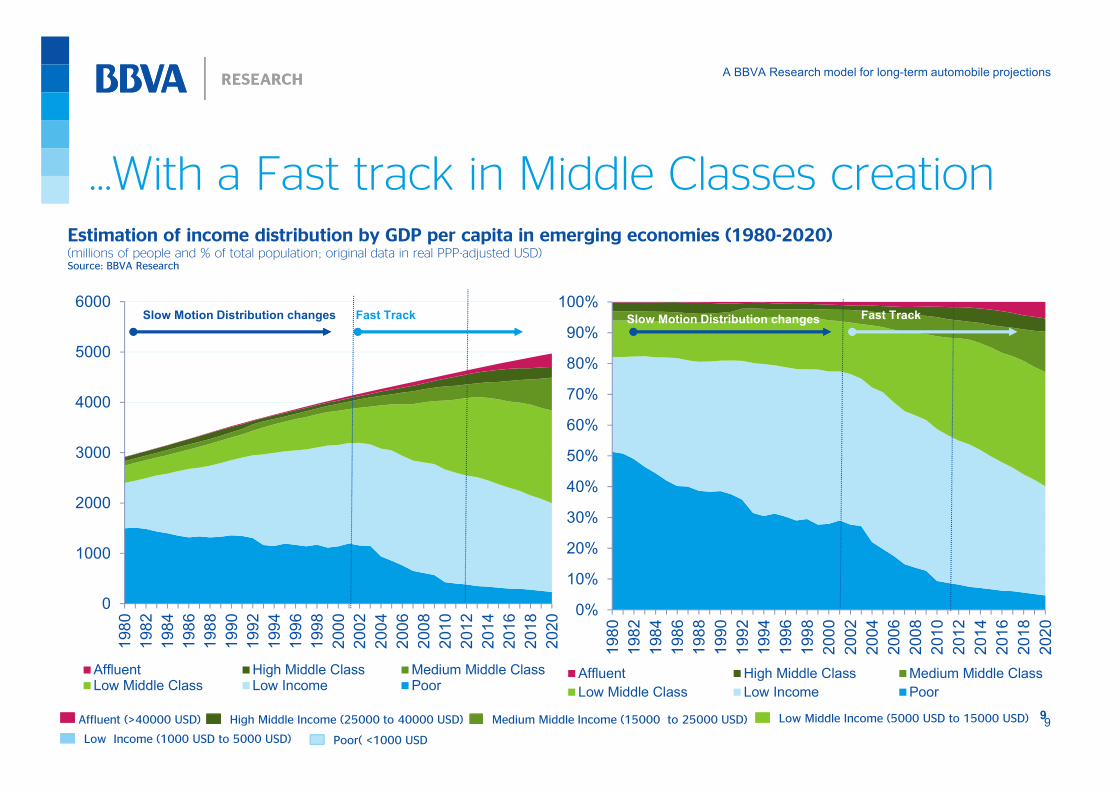
…With a Fast track in Middle Classes creation
0
1000
2000
3000
4000
5000
6000
1980
1982
1984
1986
1988
1990
1992
1994
1996
1998
2000
2002
2004
2006
2008
2010
2012
2014
2016
2018
2020
Affluent High Middle Class Medium Middle ClassLow Middle Class Low Income Poor
0%
10%
20%
30%
40%
50%
60%
70%
80%
90%
100%
1980
1982
1984
1986
1988
1990
1992
1994
1996
1998
2000
2002
2004
2006
2008
2010
2012
2014
2016
2018
2020
Affluent High Middle Class Medium Middle Class
Low Middle Class Low Income Poor
9
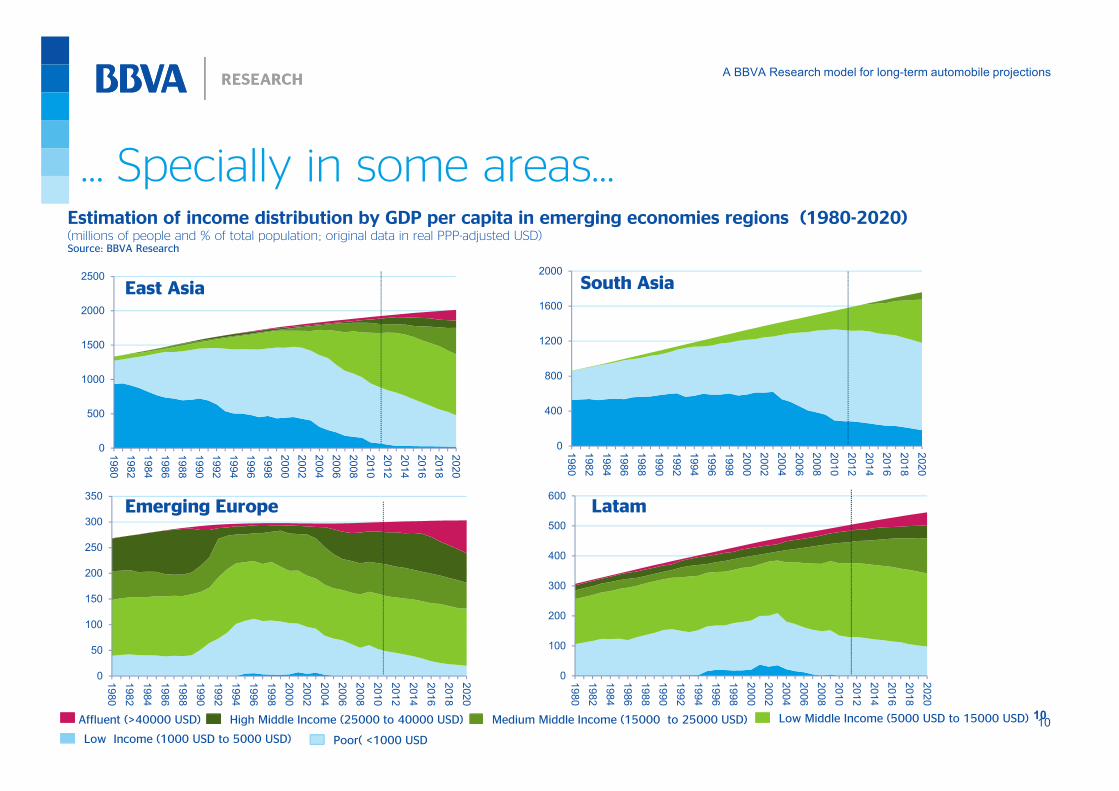
Estimation of income distribution by GDP per capita in emerging economies (1980-2020)(millions of people and % of total population; original data in real PPP-adjusted USD)Source: BBVA Research
Slow Motion Distribution changes Fast Track Slow Motion Distribution changes Fast Track
Affluent (>40000 USD) High Middle Income (25000 to 40000 USD) Medium Middle Income (15000 to 25000 USD) Low Middle Income (5000 USD to 15000 USD)
Low Income (1000 USD to 5000 USD) Poor( <1000 USD
A BBVA Research model for long-term automobile projections
10
… Specially in some areas…
0
500
1000
1500
2000
2500
1980
1982
1984
1986
1988
1990
1992
1994
1996
1998
2000
2002
2004
2006
2008
2010
2012
2014
2016
2018
2020
0
100
200
300
400
500
600
1980
1982
1984
1986
1988
1990
1992
1994
1996
1998
2000
2002
2004
2006
2008
2010
2012
2014
2016
2018
2020
Estimation of income distribution by GDP per capita in emerging economies regions (1980-2020)(millions of people and % of total population; original data in real PPP-adjusted USD)Source: BBVA Research
0
50
100
150
200
250
300
350
1980
1982
1984
1986
1988
1990
1992
1994
1996
1998
2000
2002
2004
2006
2008
2010
2012
2014
2016
2018
2020
0
400
800
1200
1600
2000
1980
1982
1984
1986
1988
1990
1992
1994
1996
1998
2000
2002
2004
2006
2008
2010
2012
2014
2016
2018
2020
10Affluent (>40000 USD) High Middle Income (25000 to 40000 USD) Medium Middle Income (15000 to 25000 USD) Low Middle Income (5000 USD to 15000 USD)
Low Income (1000 USD to 5000 USD) Poor( <1000 USD
East Asia South Asia
Emerging Europe Latam
A BBVA Research model for long-term automobile projections
11
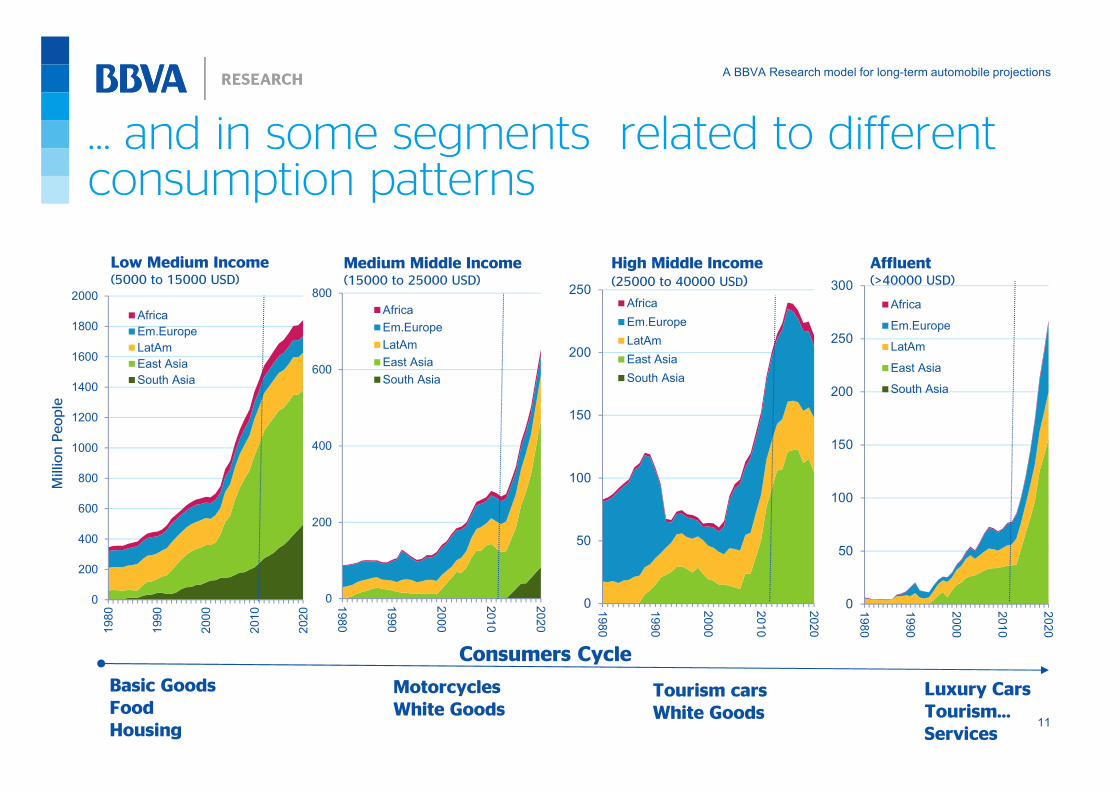
… and in some segments related to differentconsumption patterns
0
200
400
600
800
1000
1200
1400
1600
1800
2000
1980
1990
2000
2010
2020
Africa
Em.Europe
LatAm
East Asia
South Asia
0
200
400
600
800
1980
1990
2000
2010
2020
Africa
Em.Europe
LatAm
East Asia
South Asia
0
50
100
150
200
250
1980
1990
2000
2010
2020Africa
Em.Europe
LatAm
East Asia
South Asia
0
50
100
150
200
250
300
1980
1990
2000
2010
2020
Africa
Em.Europe
LatAm
East Asia
South Asia
Low Medium Income(5000 to 15000 USD)
Medium Middle Income(15000 to 25000 USD)
High Middle Income(25000 to 40000 USD)
Affluent(>40000 USD)
MillionPeople
Basic Goods
Food
Housing
Luxury Cars
Tourism…
Services
Motorcycles
White Goods
Consumers Cycle
Tourism cars
White Goods
A BBVA Research model for long-term automobile projections
12
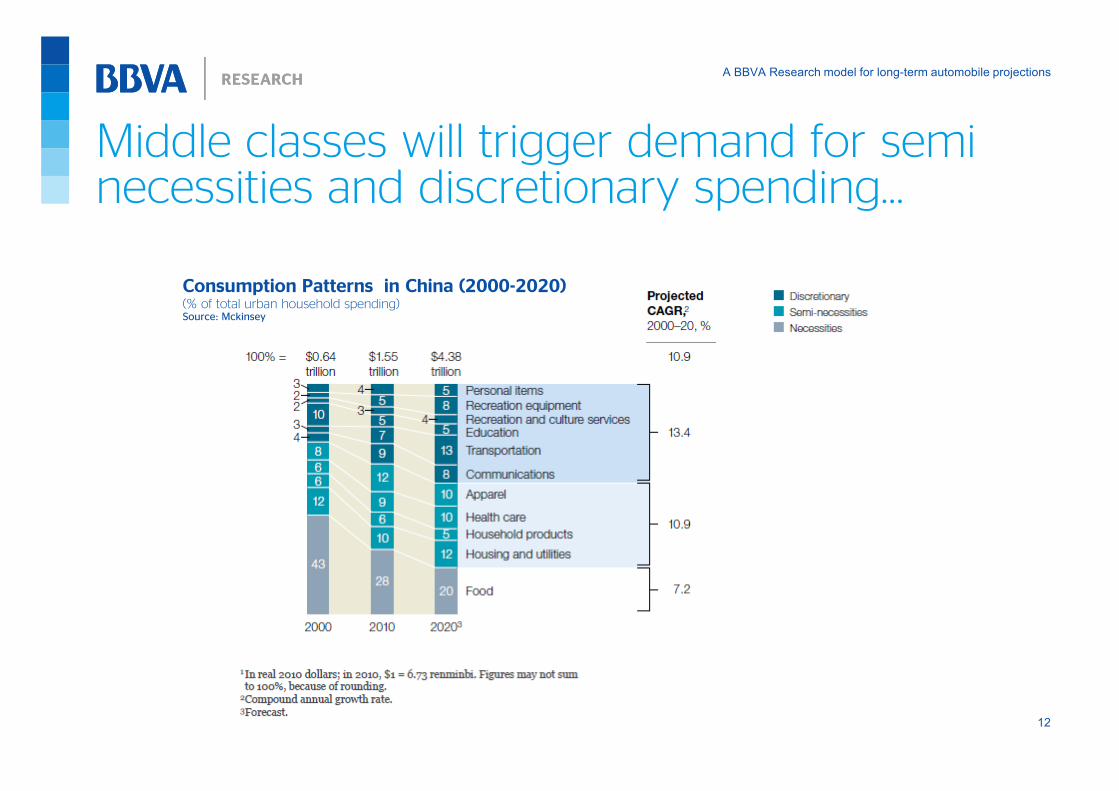
Middle classes will trigger demand for seminecessities and discretionary spending…
Consumption Patterns in China (2000-2020)(% of total urban household spending)Source: Mckinsey

A BBVA Research model for long-term automobile projections
13
…Urbanization will increase very fast in some of the regions…
0
10
20
30
40
50
60
70
80
90
West Europe N.América
East Europe Asia
Latam Africa-0.1
0
0.1
0.2
0.3
0.4
0.5
0.6
0.7
0.8
1970 1975 1980 1985 1990 1995 2000 2005 2010 2015 2020 2025
West Europe N.América East Europe
Asia Latam Africa
World Urbanization Rates(1980-2020)(Urban population as a % of total)Source: United Nations
World Urbanization Rates(1980-2020)(Annual Change in Urbanization Rates)Source: United Nations
A BBVA Research model for long-term automobile projections
14
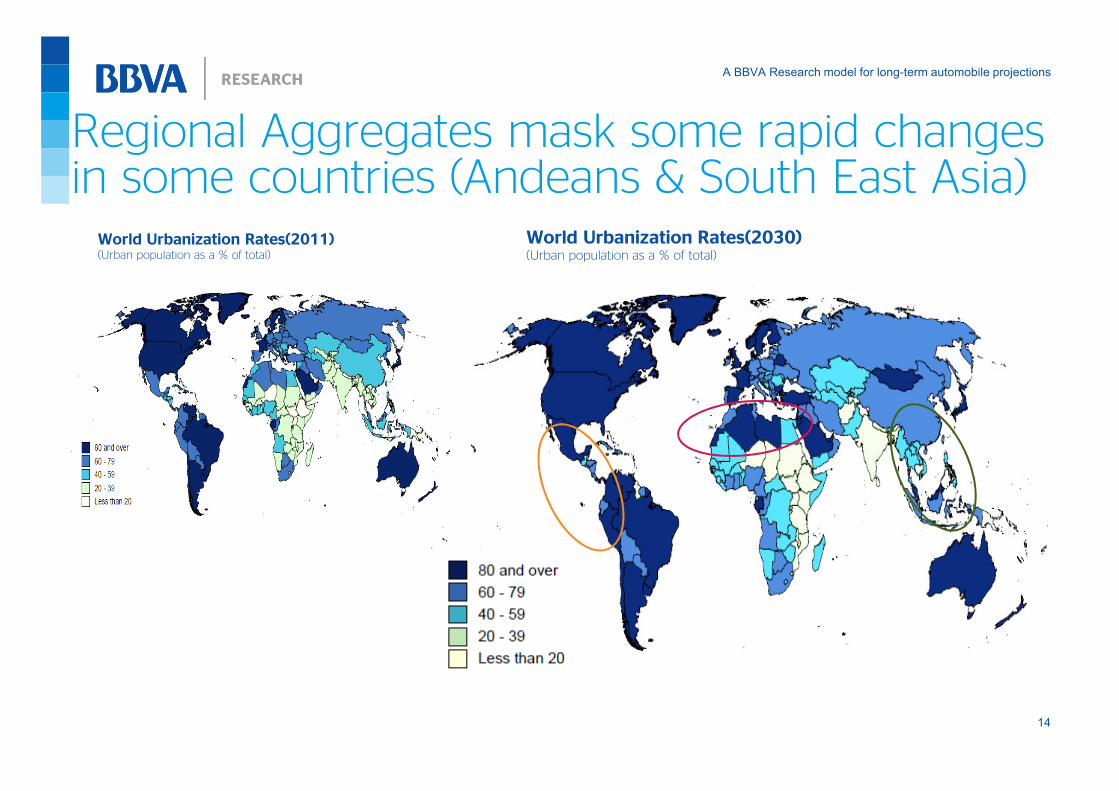
Regional Aggregates mask some rapid changesin some countries (Andeans & South East Asia)
World Urbanization Rates(2011)(Urban population as a % of total)Source: United Nations
World Urbanization Rates(2030)(Urban population as a % of total)Source: United Nations
A BBVA Research model for long-term automobile projections
15
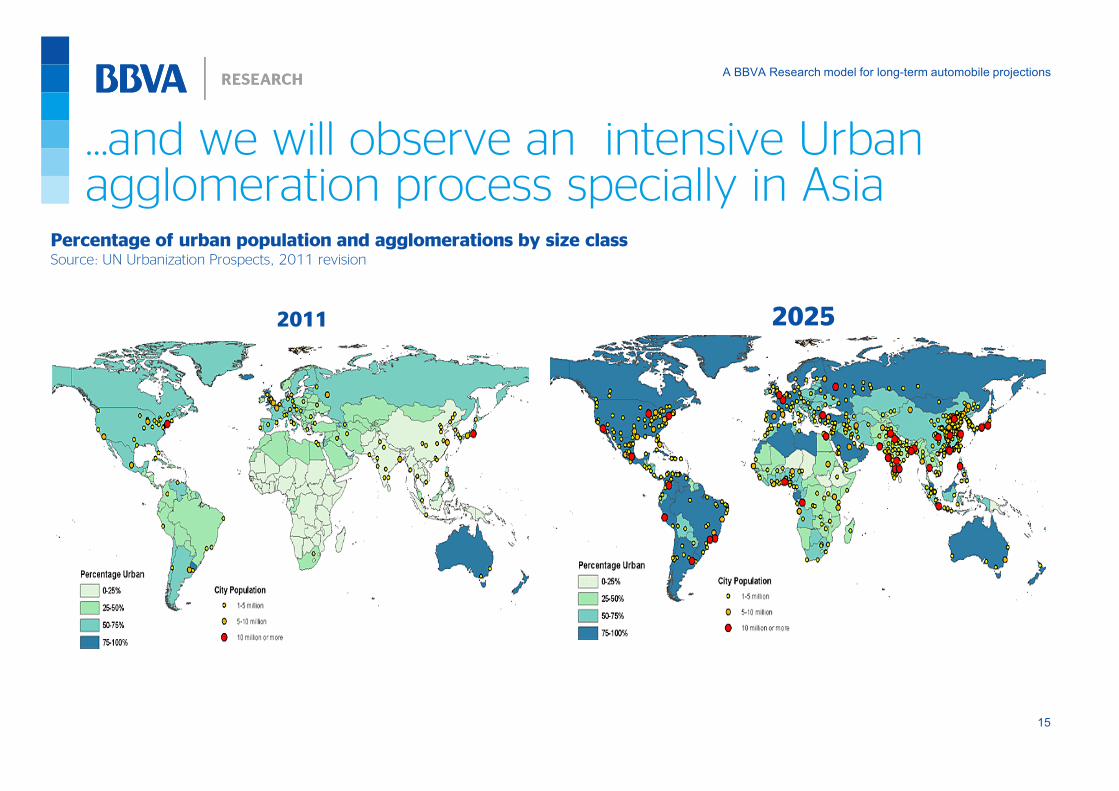
…and we will observe an intensive Urbanagglomeration process specially in Asia
Percentage of urban population and agglomerations by size classSource: UN Urbanization Prospects, 2011 revision
2011 2025

A BBVA Research model for long-term automobile projections
16
… But Emerging Markets still lags in transportinfrastructure …
Paved Road World Map(% of total roads, from 0=lighter to 100= Darker)Source:World Bank Development Indicators
Road Density World Map(Sinthetic indicator, from -1=lighter to 1= Darker)Source:World Bankand BBVA Research
A BBVA Research model for long-term automobile projections
17
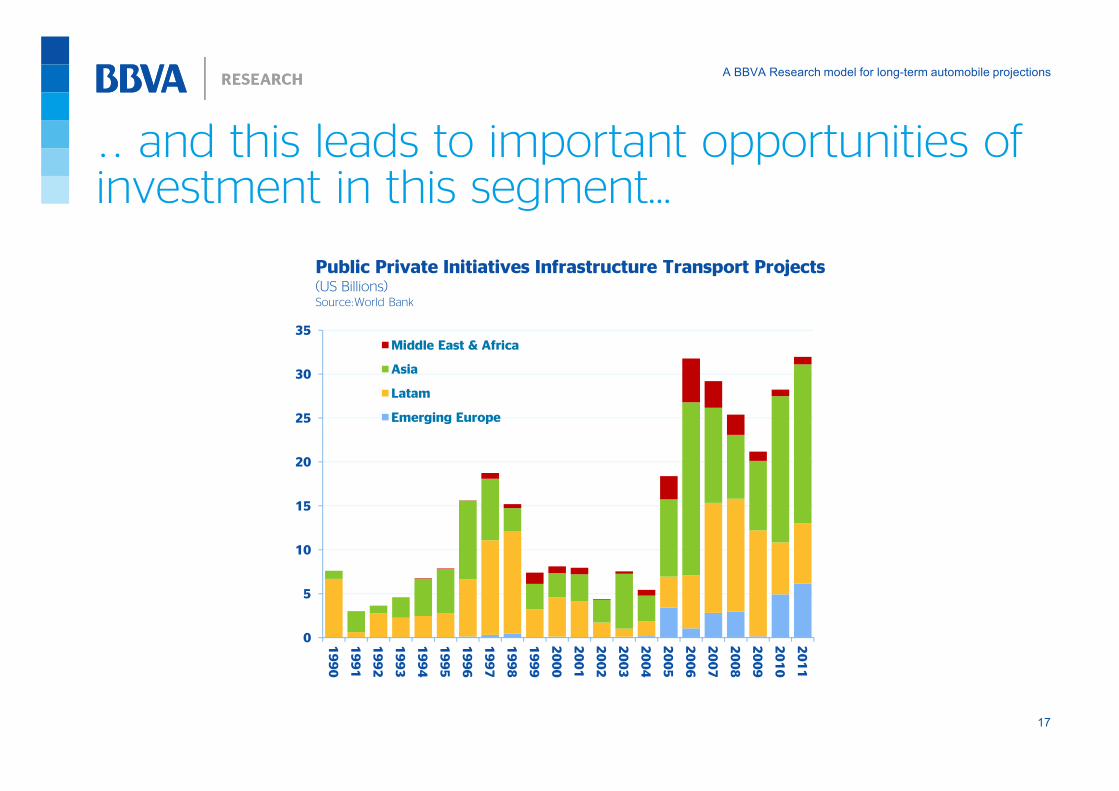
.. and this leads to important opportunities of investment in this segment…
0
5
10
15
20
25
30
35
1990
1991
1992
1993
1994
1995
1996
1997
1998
1999
2000
2001
2002
2003
2004
2005
2006
2007
2008
2009
2010
2011
Middle East & Africa
Asia
Latam
Emerging Europe
Public Private Initiatives Infrastructure Transport Projects(US Billions)Source:World Bank

A BBVA Research model for long-term automobile projections
18
Contents
Analysis of long run determinants of Car Industry
Global results
Annex: The BBVA Research CAR Model
A BBVA Research model for long-term automobile projections
19
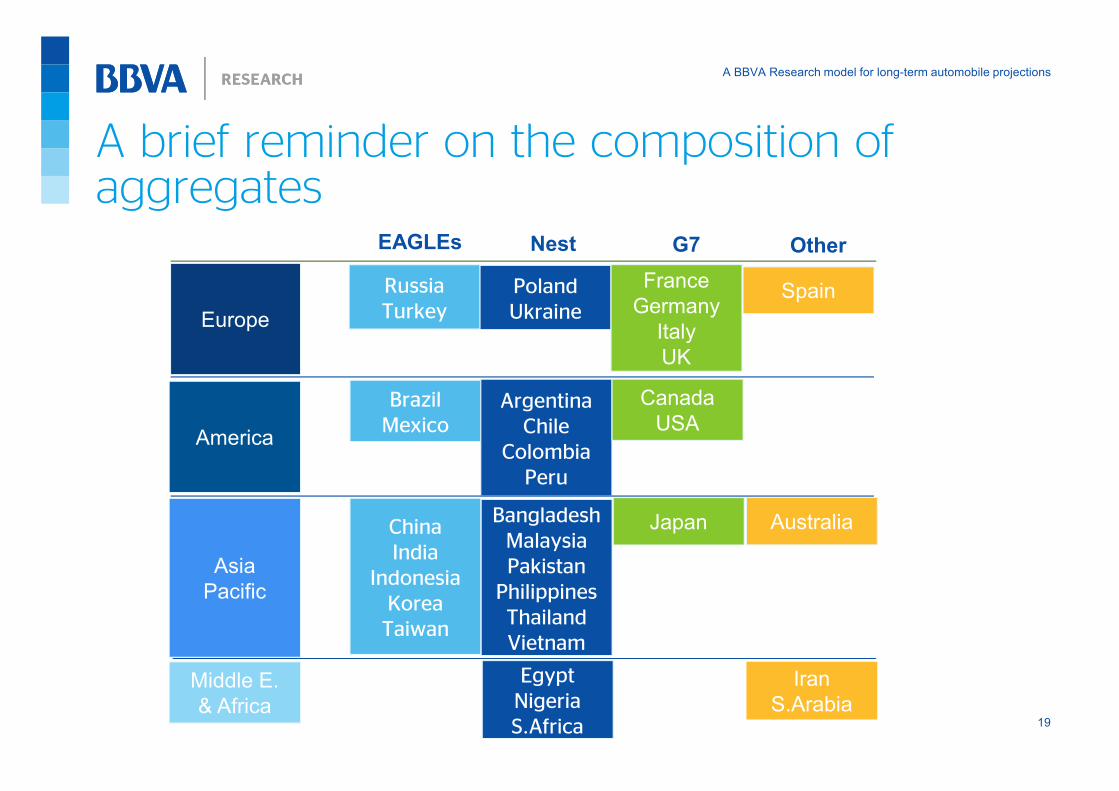
A brief reminder on the composition of aggregates
EAGLEs
China
India
Indonesia
Korea
Taiwan
Brazil
Mexico
Russia
Turkey
Nest
Bangladesh
Malaysia
Pakistan
Philippines
Thailand
Vietnam
Argentina
Chile
Colombia
Peru
Poland
Ukraine
Egypt
Nigeria
S.Africa
Asia
Pacific
America
Europe
Middle E.
& Africa
G7
Japan
Canada
USA
France
Germany
Italy
UK
Other
Australia
Spain
Iran
S.Arabia
A BBVA Research model for long-term automobile projections
20
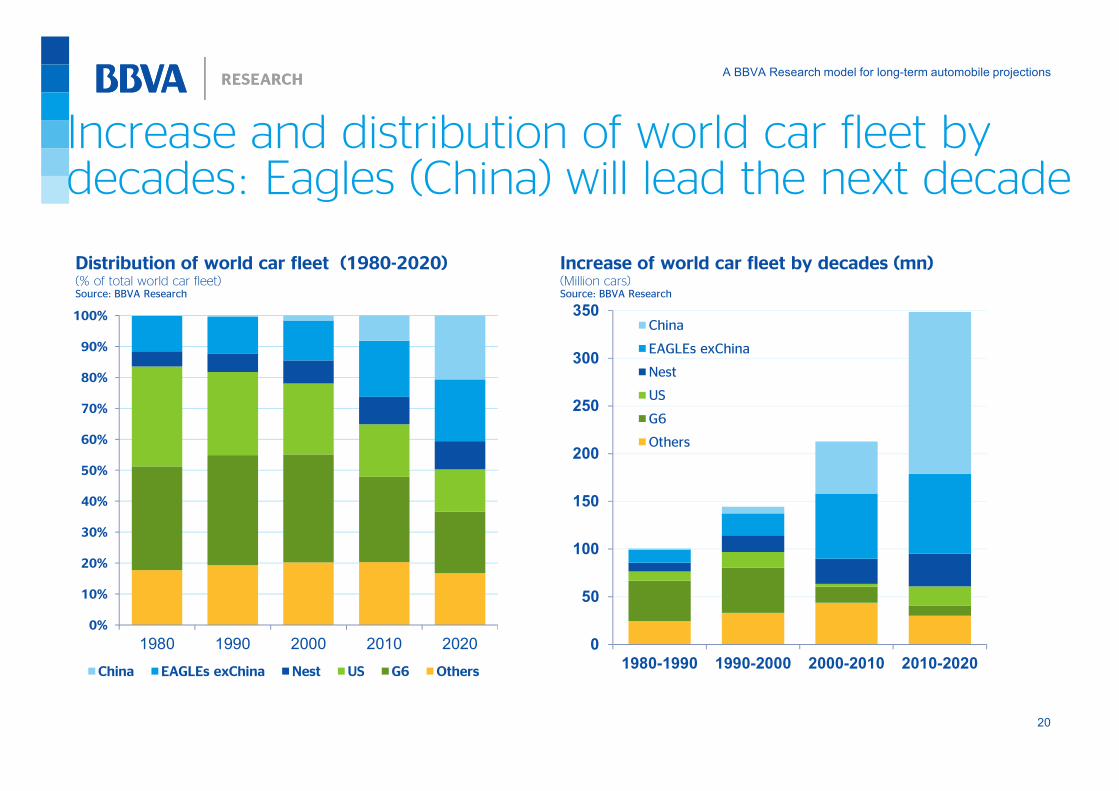
Increase and distribution of world car fleet by decades: Eagles (China) will lead the next decade
0%
10%
20%
30%
40%
50%
60%
70%
80%
90%
100%
1980 1990 2000 2010 2020
China EAGLEs exChina Nest US G6 Others
0
50
100
150
200
250
300
350
1980-1990 1990-2000 2000-2010 2010-2020
China
EAGLEs exChina
Nest
US
G6
Others
Distribution of world car fleet (1980-2020)(% of total world car fleet)Source: BBVA Research
Increase of world car fleet by decades (mn) (Million cars)Source: BBVA Research
A BBVA Research model for long-term automobile projections
21
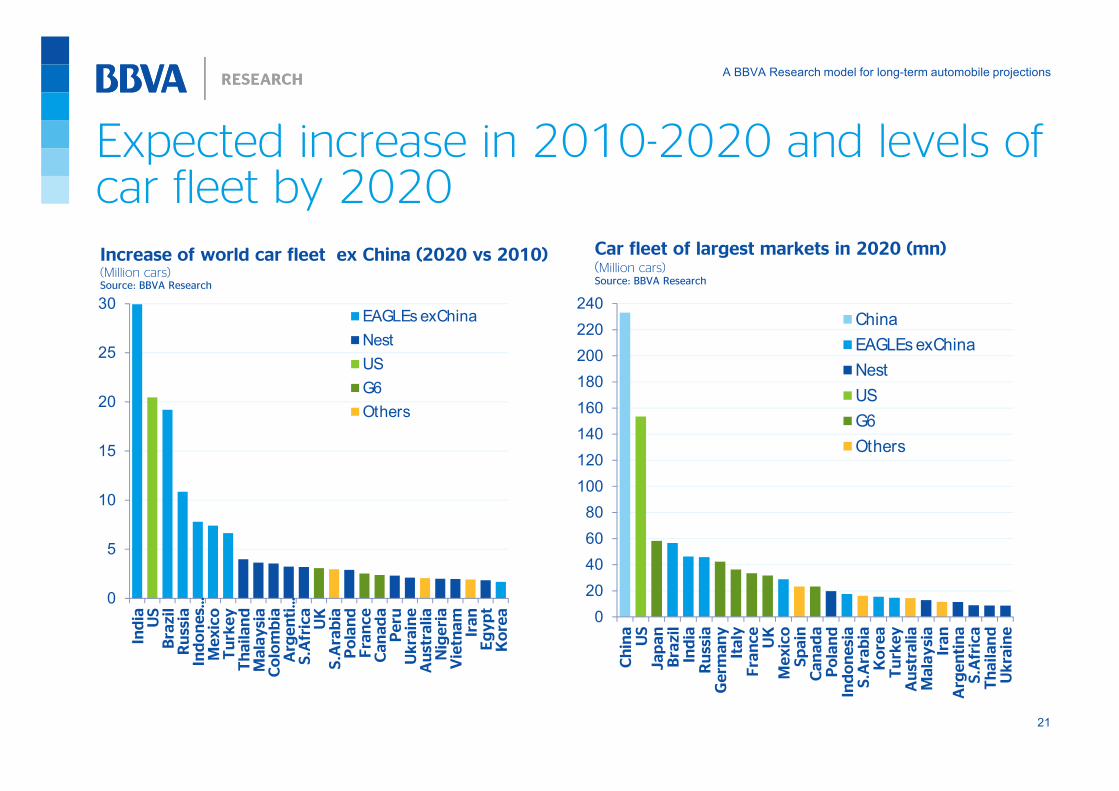
Expected increase in 2010-2020 and levels of car fleet by 2020
0
5
10
15
20
25
30
India US
Brazil
Russia
Indones…
Mexico
Turkey
Thailand
Malaysia
Colombia
Argenti…
S.Africa
UK
S.Arabia
Poland
France
Canada
Peru
Ukraine
Australia
Nigeria
Vietnam
Iran
Egypt
Korea
China
EAGLEs exChina
Nest
US
G6
Others
0
20
40
60
80
100
120
140
160
180
200
220
240
China
US
Japan
Brazil
India
Russia
Germ
any
Italy
France
UK
Mexico
Spain
Canada
Poland
Indonesia
S.Arabia
Korea
Turkey
Australia
Malaysia
Iran
Argentina
S.Africa
Thailand
Ukraine
China
EAGLEs exChina
Nest
US
G6
Others
Car fleet of largest markets in 2020 (mn)(Million cars)Source: BBVA Research
Increase of world car fleet ex China (2020 vs 2010)(Million cars)Source: BBVA Research
A BBVA Research model for long-term automobile projections
22
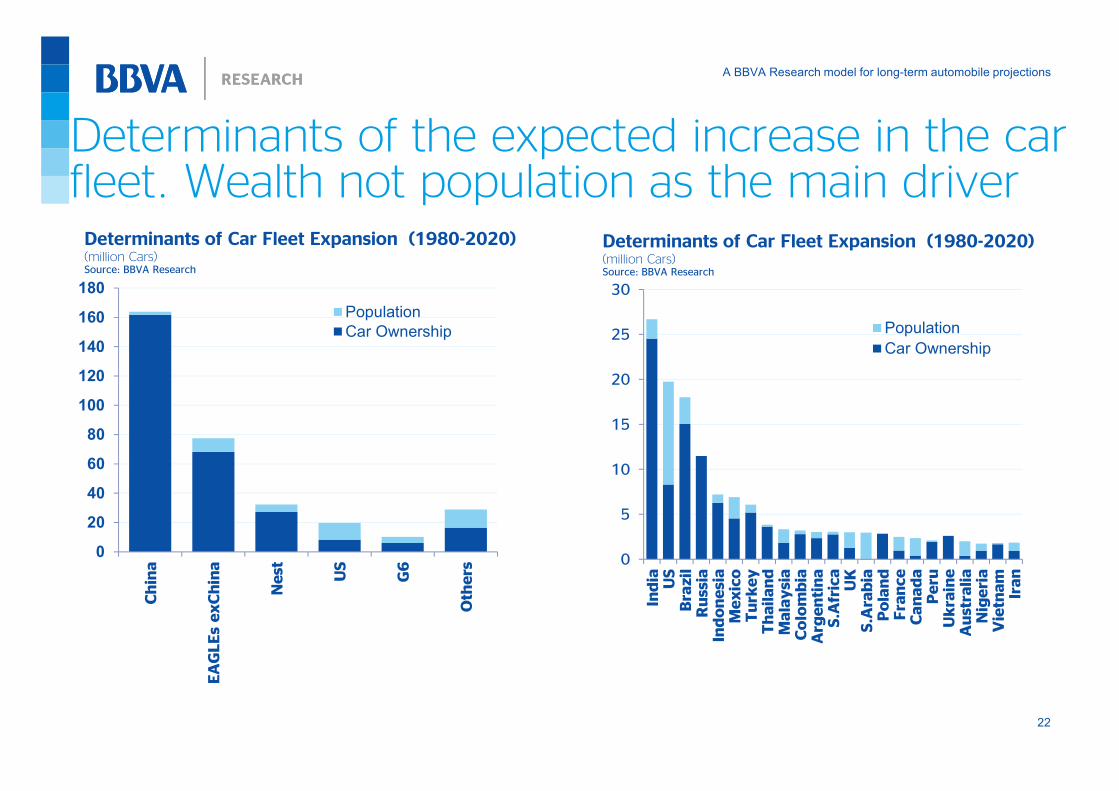
Determinants of the expected increase in the car fleet. Wealth not population as the main driver
0
20
40
60
80
100
120
140
160
180
China
EAGLEs exChina
Nest
US
G6
Others
Population
Car Ownership
0
5
10
15
20
25
30
India US
Brazil
Russia
Indonesia
Mexico
Turkey
Thailand
Malaysia
Colombia
Argentina
S.Africa
UK
S.Arabia
Poland
France
Canada
Peru
Ukraine
Australia
Nigeria
Vietnam
Iran
Population
Car Ownership
Determinants of Car Fleet Expansion (1980-2020)(million Cars)Source: BBVA Research
Determinants of Car Fleet Expansion (1980-2020)(million Cars)Source: BBVA Research
A BBVA Research model for long-term automobile projections
23
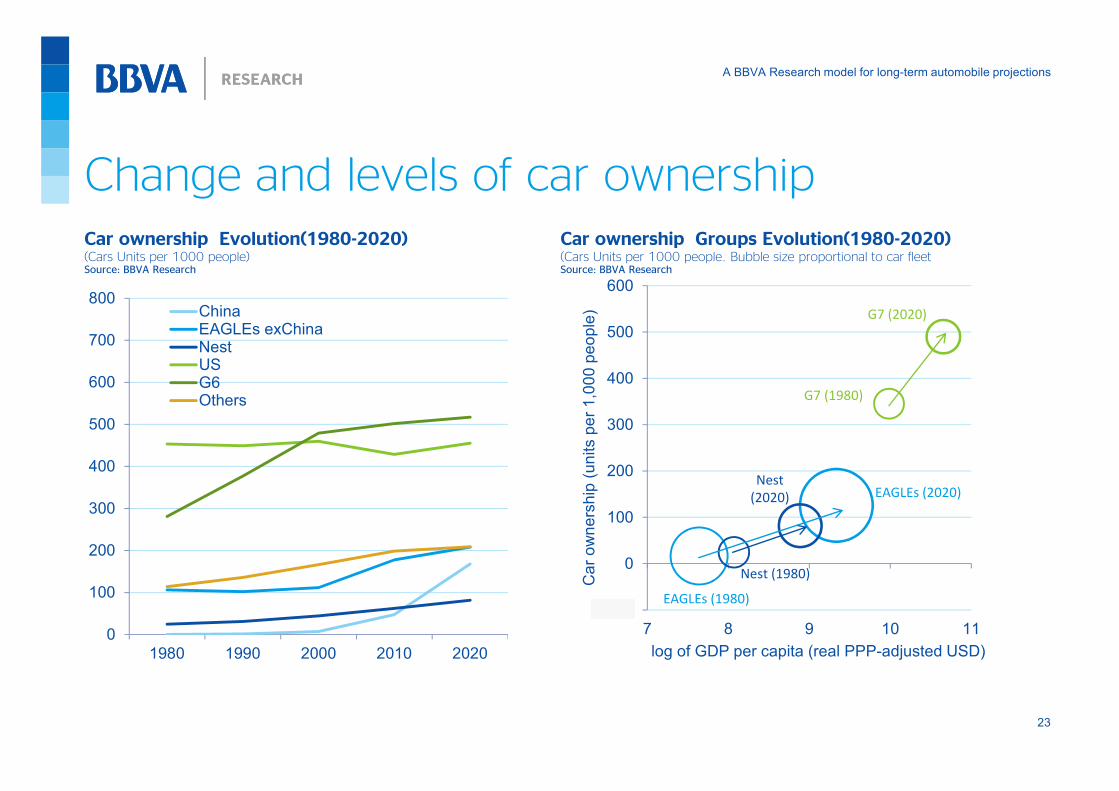
Change and levels of car ownership
0
100
200
300
400
500
600
700
800
1980 1990 2000 2010 2020
ChinaEAGLEs exChinaNestUSG6Others
-100
0
100
200
300
400
500
600
7 8 9 10 11
Car ownership (units per 1,000 people)
log of GDP per capita (real PPP-adjusted USD)
G7 (2020)
G7 (1980)
EAGLEs (2020)
EAGLEs (1980)
Nest (1980)
Nest
(2020)
Car ownership Evolution(1980-2020)(Cars Units per 1000 people)Source: BBVA Research
Car ownership Groups Evolution(1980-2020)(Cars Units per 1000 people. Bubble size proportional to car fleet Source: BBVA Research
A BBVA Research model for long-term automobile projections
24
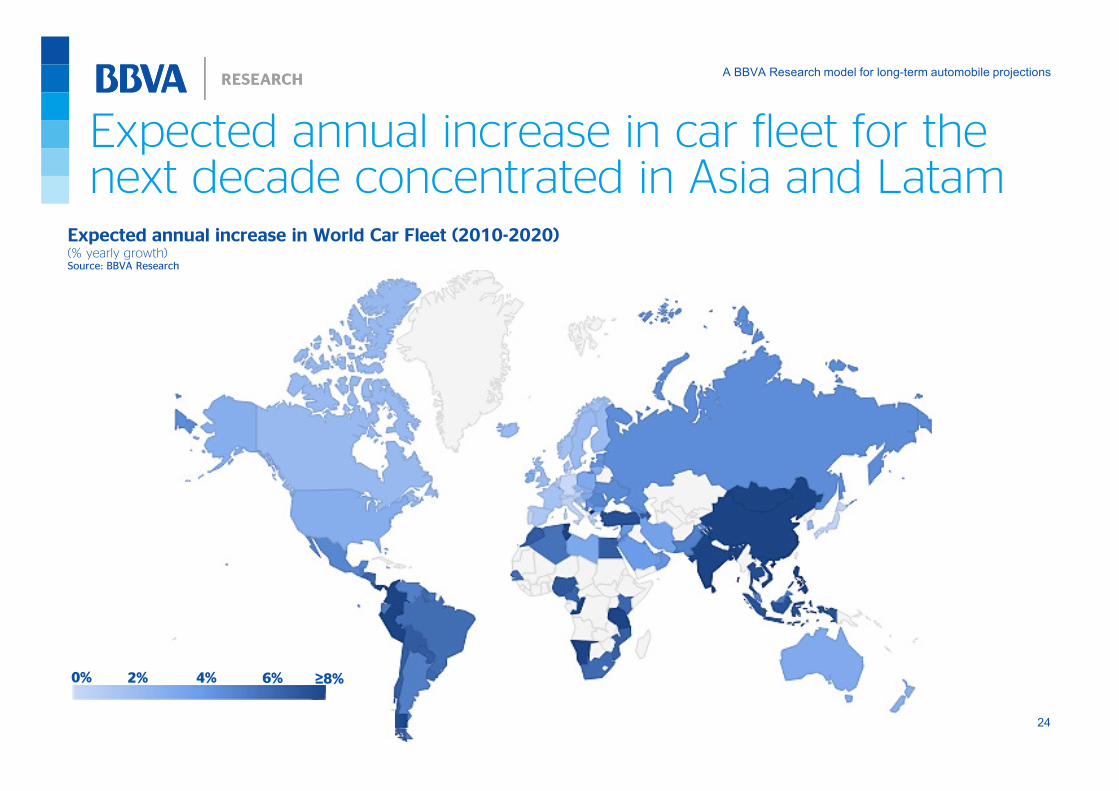
Expected annual increase in car fleet for the next decade concentrated in Asia and Latam
0% ≥8%4%2% 6%
Expected annual increase in World Car Fleet (2010-2020)(% yearly growth)Source: BBVA Research
A BBVA Research model for long-term automobile projections
25
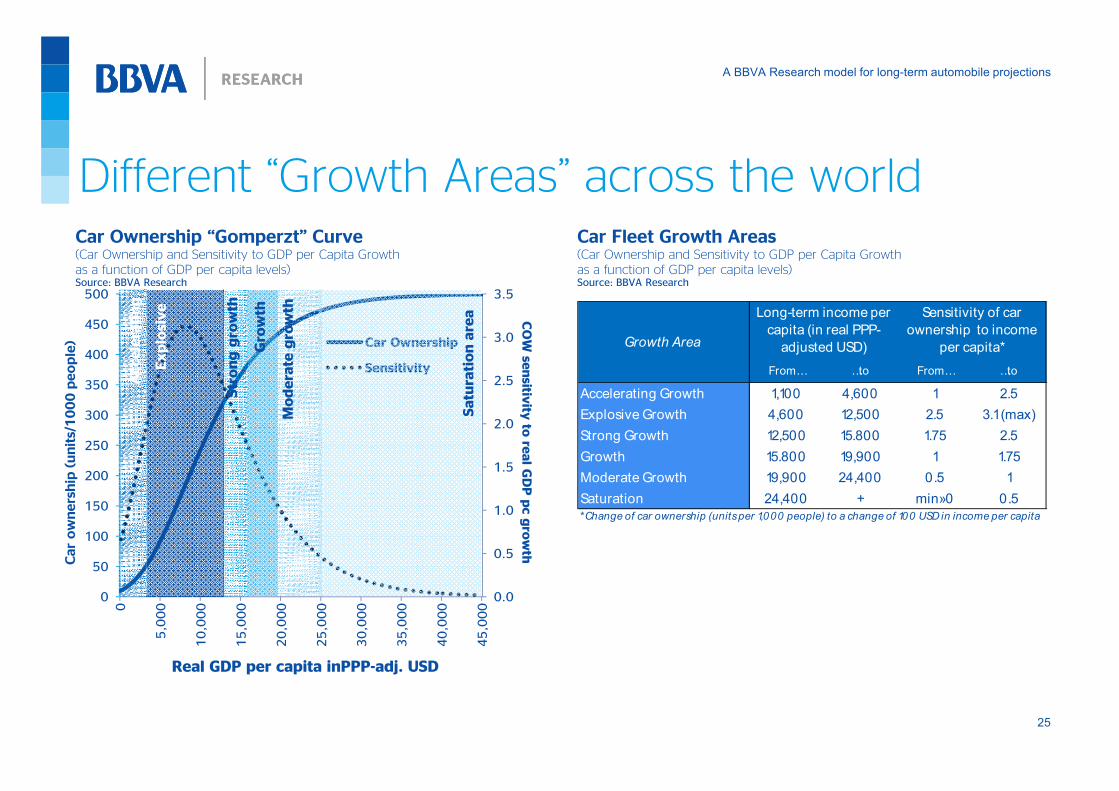
Different “Growth Areas” across the world
From… …to From… …to
Accelerating Growth 1,100 4,600 1 2.5
Explosive Growth 4,600 12,500 2.5 3.1 (max)
Strong Growth 12,500 15.800 1.75 2.5
Growth 15.800 19,900 1 1.75
Moderate Growth 19,900 24,400 0.5 1
Saturation 24,400 + min»0 0.5
*Change of car ownership (units per 1,000 people) to a change of 100 USD in income per capita
Growth Area
Long-term income per
capita (in real PPP-
adjusted USD)
Sensitivity of car
ownership to income
per capita*
0.0
0.5
1.0
1.5
2.0
2.5
3.0
3.5
0
50
100
150
200
250
300
350
400
450
500
0
5,000
10,000
15,000
20,000
25,000
30,000
35,000
40,000
45,000
COW sensitiv
ity to real GDP pc growth
Car ownership (units/1000 people)
Real GDP per capita inPPP-adj. USD
Car Ownership
Sensitivity
Accelerating
Explosive
Strong growth
Moderate growth
Saturation area
Growth
Car Ownership “Gomperzt” Curve(Car Ownership and Sensitivity to GDP per Capita Growth
as a function of GDP per capita levels)Source: BBVA Research
Car Fleet Growth Areas(Car Ownership and Sensitivity to GDP per Capita Growth
as a function of GDP per capita levels)Source: BBVA Research

A BBVA Research model for long-term automobile projections
26
Explosive and strong growth will be concentrated in Asia, Latam and Turkey
From… …to From… …to
Accelerating Growth 1,100 4,600 1 2.5 Bangladesh, Pakistan, Nigeria, Vietnam, Philippines, India, Cameroon, Kenya
Explosive Growth 4,600 12,500 2.5 3.1 (max) Indonesia, Egypt, Ukraine, Thailand, Colombia, China, S.Africa, Peru, Brazil, Paraguay, Bolivia, Ecuador
Strong Growth 12,500 15.800 1.75 2.5 Turkey, Mexico, Panama, Uruguay, Bulgaria, Romania
Growth 15.800 19,900 1 1.75 Malaysia, Chile, Russia, Argentina, Hungary, Croatia, Lithuania, Latvia
Moderate Growth 19,900 24,400 0.5 1 Poland, Portugal, Slovakia, Saudi Arabia, Greece, Estonia, Oman
Saturation 24,400 + min»0 0.5 Korea, G7, Australia, Spain, Switzerland, Netherlands, Czech Republic, Slovenia, New Zealand
*Change of car ownership (units per 1,000 people) to a change of 100 USD in income per capita
Growth Area
Long-term income
per capita (in real
PPP-adjusted USD)
Sensitivity of car
ownership to
income per capita* Countries and Groups
Car Fleet Growth Areas(Car Ownership and Sensitivity to GDP per Capita Growth as a function of GDP per capita levels)Source: BBVA Research
A BBVA Research model for long-term automobile projections
27
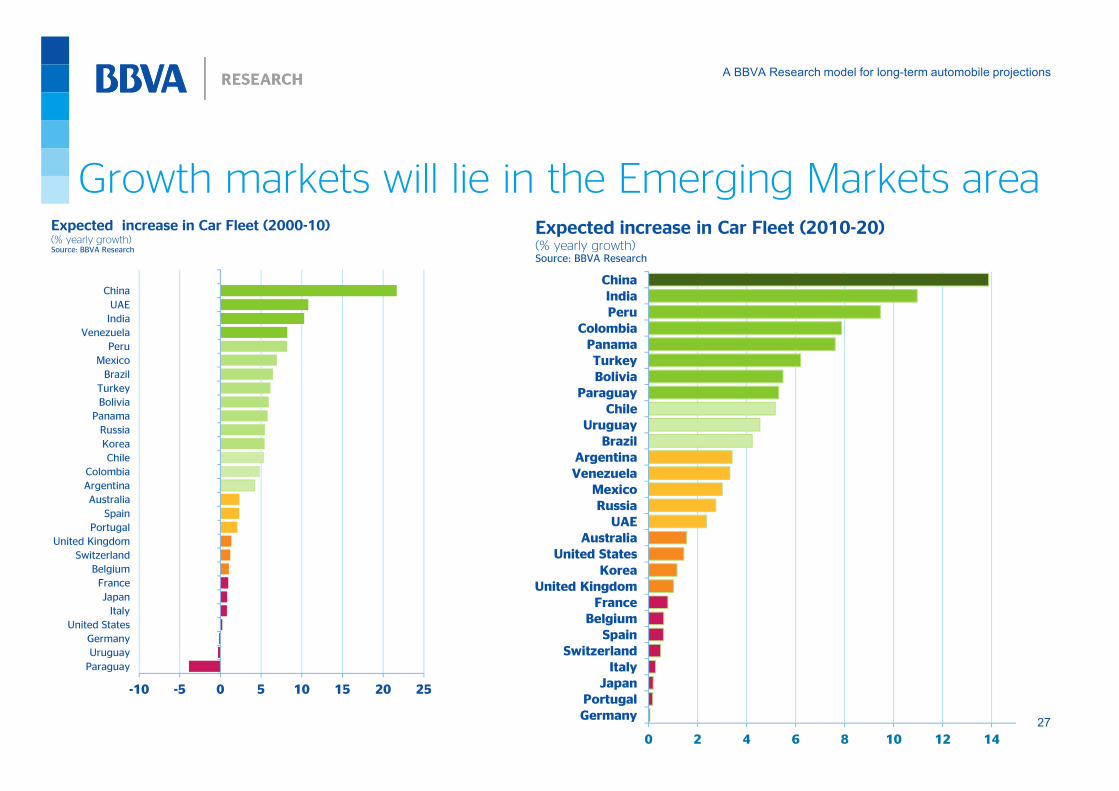
-10 -5 0 5 10 15 20 25
Paraguay
Uruguay
Germany
United States
Italy
Japan
France
Belgium
Switzerland
United Kingdom
Portugal
Spain
Australia
Argentina
Colombia
Chile
Korea
Russia
Panama
Bolivia
Turkey
Brazil
Mexico
Peru
Venezuela
India
UAE
China
0 2 4 6 8 10 12 14
Germany
Portugal
Japan
Italy
Switzerland
Spain
Belgium
France
United Kingdom
Korea
United States
Australia
UAE
Russia
Mexico
Venezuela
Argentina
Brazil
Uruguay
Chile
Paraguay
Bolivia
Turkey
Panama
Colombia
Peru
India
China
Expected increase in Car Fleet (2010-20)(% yearly growth)Source: BBVA Research
Expected increase in Car Fleet (2000-10)(% yearly growth)Source: BBVA Research
Growth markets will lie in the Emerging Markets area
A BBVA Research model for long-term automobile projections
28
Contents
Analysis of long run determinants of Car Industry
Global results
Annex: The BBVA Research CAR Model
A BBVA Research model for long-term automobile projections
29
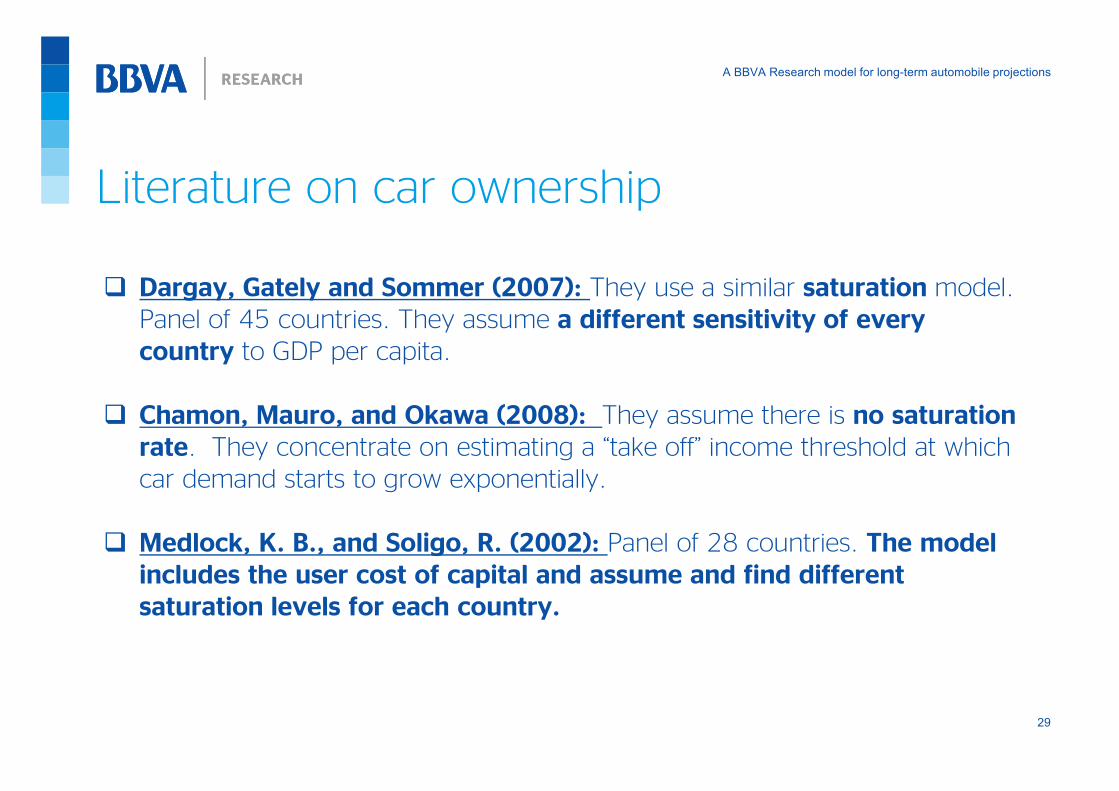
Literature on car ownership
� Dargay, Gately and Sommer (2007): They use a similar saturation model.
Panel of 45 countries. They assume a different sensitivity of every
country to GDP per capita.
� Chamon, Mauro, and Okawa (2008): They assume there is no saturation
rate. They concentrate on estimating a “take off” income threshold at which
car demand starts to grow exponentially.
� Medlock, K. B., and Soligo, R. (2002): Panel of 28 countries. The model
includes the user cost of capital and assume and find different
saturation levels for each country.
A BBVA Research model for long-term automobile projections
30
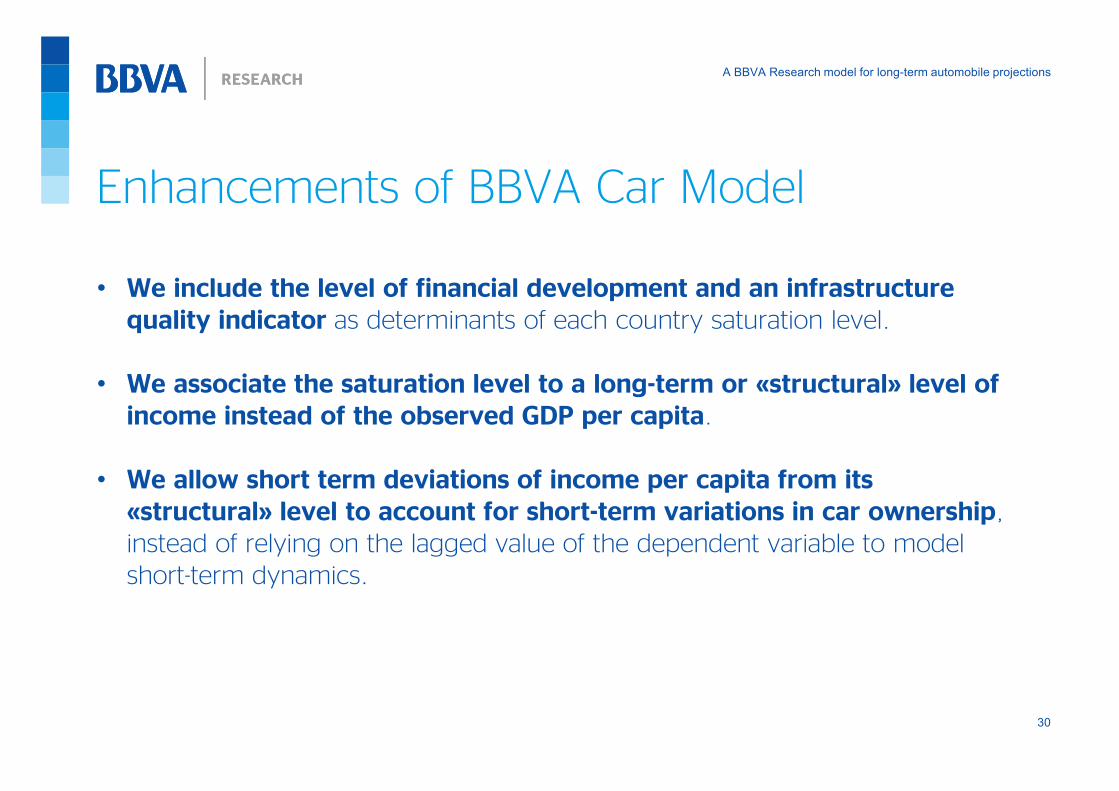
Enhancements of BBVA Car Model
• We include the level of financial development and an infrastructure
quality indicator as determinants of each country saturation level.
• We associate the saturation level to a long-term or «structural» level of
income instead of the observed GDP per capita.
• We allow short term deviations of income per capita from its
«structural» level to account for short-term variations in car ownership,
instead of relying on the lagged value of the dependent variable to model
short-term dynamics.
A BBVA Research model for long-term automobile projections
31
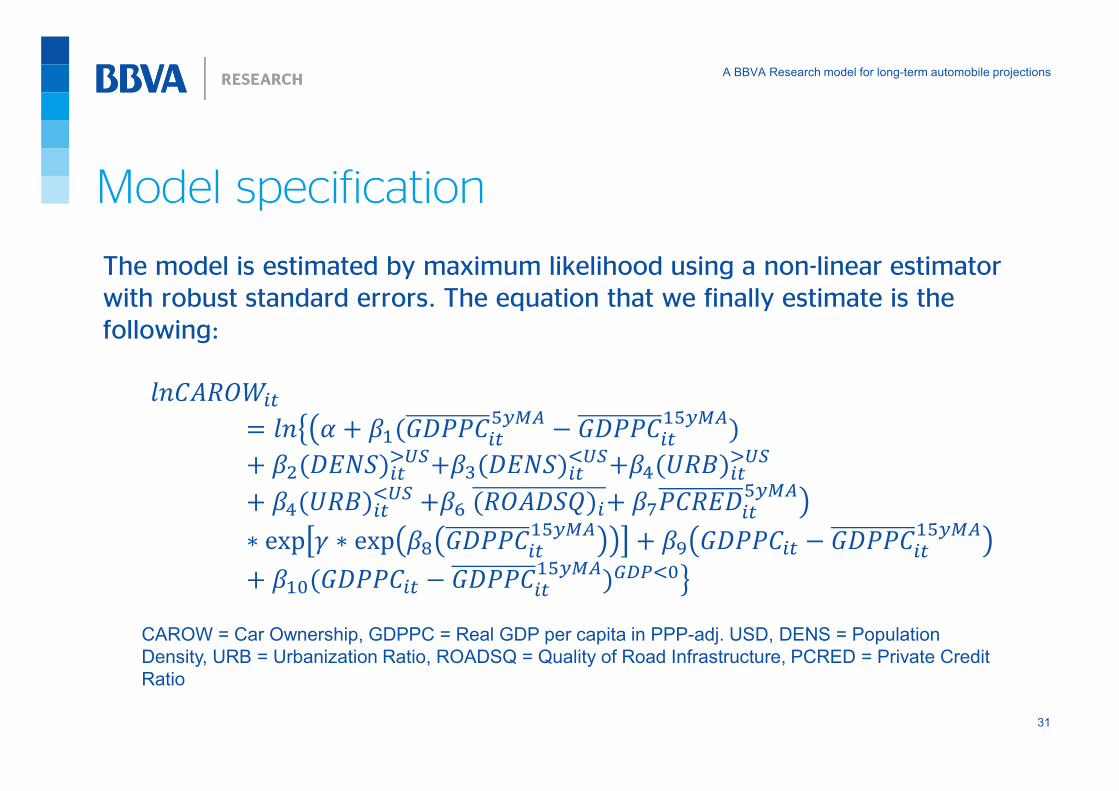
Model specification
The model is estimated by maximum likelihood using a non-linear estimator
with robust standard errors. The equation that we finally estimate is the
following:
�������� ���� � ���������
���� � ������������
� ���������� !��"�������
# !��$�%�&��� !
� �$�%�&��# ! ��' ������(��� �)������
����*∗ exp / ∗ exp �0 ������
����� � �1 ������ � �����������
� ��2������� � ������������345#26
CAROW = Car Ownership, GDPPC = Real GDP per capita in PPP-adj. USD, DENS = Population
Density, URB = Urbanization Ratio, ROADSQ = Quality of Road Infrastructure, PCRED = Private Credit
Ratio
A BBVA Research model for long-term automobile projections
32
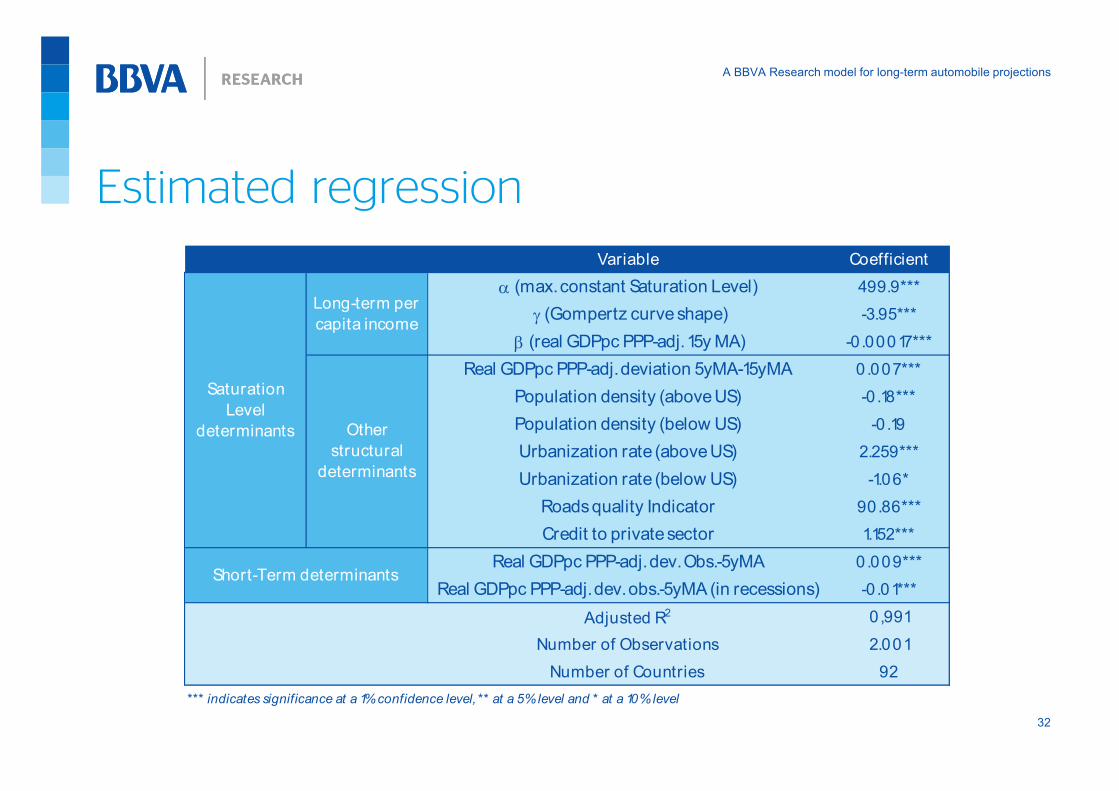
Estimated regression
Variable Coefficient
α (max. constant Saturation Level) 499.9***
γ (Gompertz curve shape) -3.95***
β (real GDPpc PPP-adj. 15y MA) -0 .00017***
Real GDPpc PPP-adj. deviation 5yMA-15yMA 0.007***
Population density (above US) -0 .18***
Population density (below US) -0 .19
Urbanization rate (above US) 2.259***
Urbanization rate (below US) -1.06*
Roads quality Indicator 90.86***
Credit to private sector 1.152***
Real GDPpc PPP-adj. dev. Obs.-5yMA 0.009***
Real GDPpc PPP-adj. dev. obs.-5yMA (in recessions) -0 .01***
Adjusted R2 0,991
Number of Observations 2.001
Number of Countries 92
*** indicates significance at a 1% confidence level, ** at a 5% level and * at a 10% level
Other
structural
determinants
Long-term per
capita income
Short-Term determinants
Saturation
Level
determinants

A BBVA Research model for long-term automobile projections
33
BBVA Research forecasts (2012) compared with previous IMF work (2008)
0
1
2
3
4
5
6
7
8
9
10
11
12
13
14
WORLD Advanced Emerging USA* India China
BBVA Research (2012)
IMF (2008)
*BBVA Research uses only passenger cars and not light trucks
0
100
200
300
400
500
600
700
800
900
1000
1100
1200
WORLD Advanced Emerging USA* India China
BBVA Research (2012)
IMF (2008)
Car fleet of largest markets in 2020 (Million cars)Source: BBVA Research
Growth of Car fleet (2010-2020) (average % yoy)Source: BBVA Research
A BBVA Research model for long-term automobile projections
34
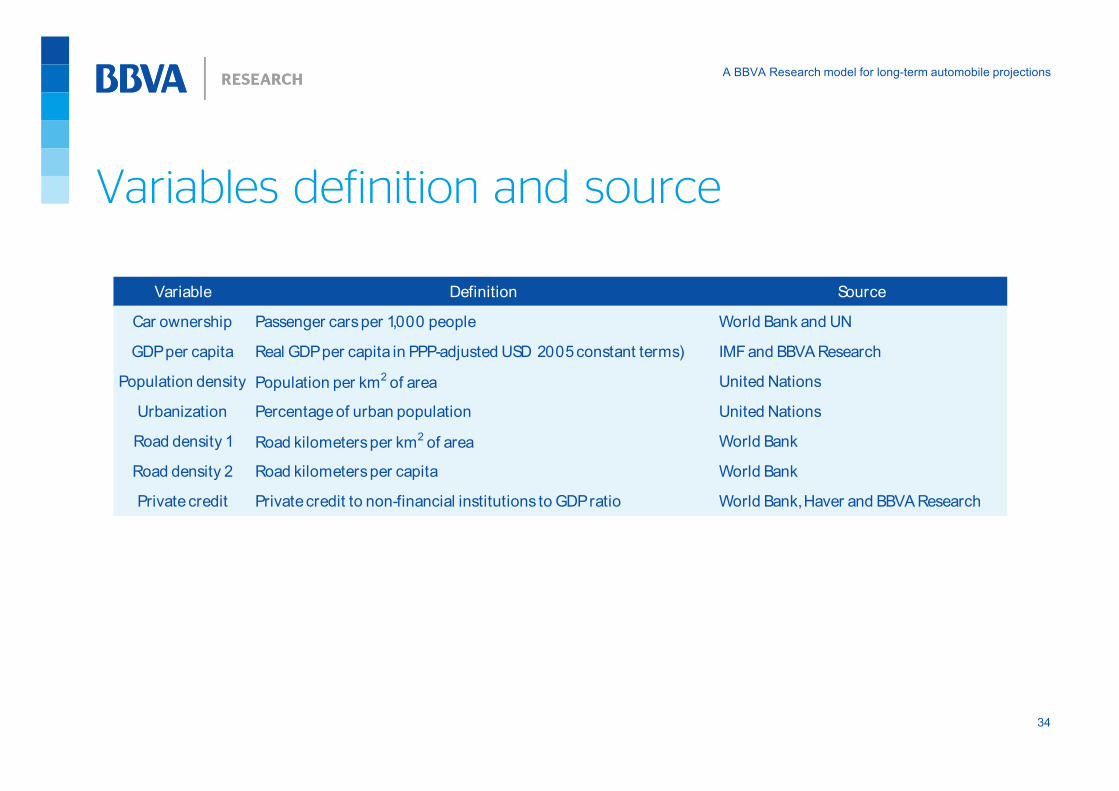
Variables definition and source
Variable Definition Source
Car ownership Passenger cars per 1,000 people World Bank and UN
GDP per capita Real GDP per capita in PPP-adjusted USD 2005 constant terms) IMF and BBVA Research
Population density Population per km2 of area United Nations
Urbanization Percentage of urban population United Nations
Road density 1 Road kilometers per km2 of area World Bank
Road density 2 Road kilometers per capita World Bank
Private credit Private credit to non-financial institutions to GDP ratio World Bank, Haver and BBVA Research
A BBVA Research model for long-term automobile projections
35
Cross-country emerging markets analysis unit
Chief Economist
Álvaro Ortiz [email protected] +34 630144485 Ext 51933
Senior Economist
David Martínez Turé[email protected]+34 690 845 429
SeniorEconomist
Alfonso Ugarte [email protected]+34 91 3743530