the global ccs institute (the institute) is an international
TRANSCRIPT


ABOUT US
The Global CCS Institute (the Institute) is an international think tank whose mission is to accelerate the deployment of carbon capture and storage (CCS), a vital technology to tackle climate change.
As a team of over 30 professionals, working with and on behalf of our Members, we drive the adoption of CCS as quickly and cost effectively as possible; sharing expertise, building capacity and providing advice and support so CCS can play its part in reducing greenhouse gas emissions.
Our diverse international membership includes governments, global corporations, private companies, research bodies and non-governmental organisations; all committed to CCS as an integral part of a net zero emissions future.
The Institute has offices in Abu Dhabi, Beijing, Brussels, Houston, London, Melbourne, Tokyo and Washington DC.
ABOUT THE REPORT
CCS is an emissions reduction technology critical to meeting global climate targets. The Global Status of CCS 2021 documents important milestones for CCS over the past 12 months, its status across the world and the key opportunities and challenges it faces.
We hope this report will be read and used by governments, policy-makers, academics, media commentators and the millions of people who care about our climate.
AUTHORS
This report was led by Guloren Turan and Alex Zapantis. The team of authors included David Kearns, Eve Tamme, Christina Staib, Tony Zhang, Jamie Burrows, Angus Gillespie, Ian Havercroft, Dominic Rassool, Chris Consoli and Harry Liu.
Support from Matt Bright, Jeff Erikson, Patricia Loria, Hiroshi Nambo, Yi Wu, Carla Judge, Ruth Gebremedhin and Matt Steyn made it possible.
ACRONYMS
ACCU Australian Carbon Credit UnitADNOC Abu Dhabi National Oil CompanyBECCS Biooenergy with CCS CCS Carbon Capture and Storage CCUS Carbon Capture Utilisation and Storage CDR Carbon Dioxide RemovalCO2 Carbon DioxideCOP Conference of the PartiesDAC Direct Air CaptureDACCS Direct Air Capture with Carbon Storage DOE US Department of EnergyEC European CommissionEOR Enhanced Oil Recovery EPA Environmental Protection AgencyEPC Engineer, Procure, ConstructEPSs Emission Performance StandardsESG Environmental, Social and Corporate Governance ETS Emissions Trading SystemEU European Union FEED Front-End Engineering Design GFC The Green Climate FundGHG Greenhouse Gas Gt Gigatonne GW Gigawatt IEA International Energy AgencyIEA-SDS IEA’s Sustainable Development ScenarioIMO International Maritime OrganisationIPCC Intergovernmental Panel on Climate Change IRS Treasury and Internal Revenue ServiceJCM Joint Crediting Mechanism
JOGMEC Japan Oil, Gas and Metals National CorporationLCFS Low Carbon Fuel Standard LEDS Long Term Low Greenhouse Gas Development StrategiesLNG Liquified Natural GasMEE Ministry of Ecology and EnvironmentMMV Monitoring, Measurement and Verification Mt Million Metric Tonnes Mtpa Million tonnes per annumMW Megawatt NDC Nationally Determined Contribution NET Negative Emissions TechnologyNETL National Energy Technology LaboratoryNZE Net zero emissionsPV PhotovoltaicR&D Research and Development RD&D Research, Design and DevelopmentSDS Sustainable Development Scenario SLL Sustainability Linked LoanSMR Steam Methane Reforming SOE State Owned Enterprise TWH Terrawatt Hour UNFCCC United Nations Framework Convention on ClimateChange UAE United Arab EmiratesUN SDGs UN’s Sustainable Development GoalsVCM Voluntary Carbon MarketWtE Waste to Energy

1.0 INTRODUCTION
1.0 INTRODUCTION
2.0 GLOBAL STATUS OF CCS
2.1 CCS, NET ZERO AND ECONOMIC PROSPERITY 102.2 GLOBAL CCS FACILITIES UPDATE AND TRENDS 122.3 INTERNATIONAL POLICY UPDATE 22
3.0 REGIONAL OVERVIEWS
3.1 NORTH AMERICA 263.2 ASIA PACIFIC 323.3 EUROPE AND NEARBY REGIONS 383.4 GULF COOPERATION COUNCIL STATES 44
4.0 PATHWAYS IN FOCUS
4.1 ENVIRONMENTAL, SOCIAL AND GOVERNANCE 504.2 FINANCING CCS 504.3 CCS NETWORKS 534.4 INDUSTRY 544.5 HYDROGEN 554.6 TECHNOLOGY-BASED CO2 REMOVAL 584.7 MINERAL CARBONATION 59
5.0 APPENDICES
5.1 COMMERCIAL CCS FACILITIES AND PROJECTS 625.2 CCS NETWORKS 685.3 CO2 GEOLOGICAL STORAGE 70
6.0 REFERENCES 76
Brad Page
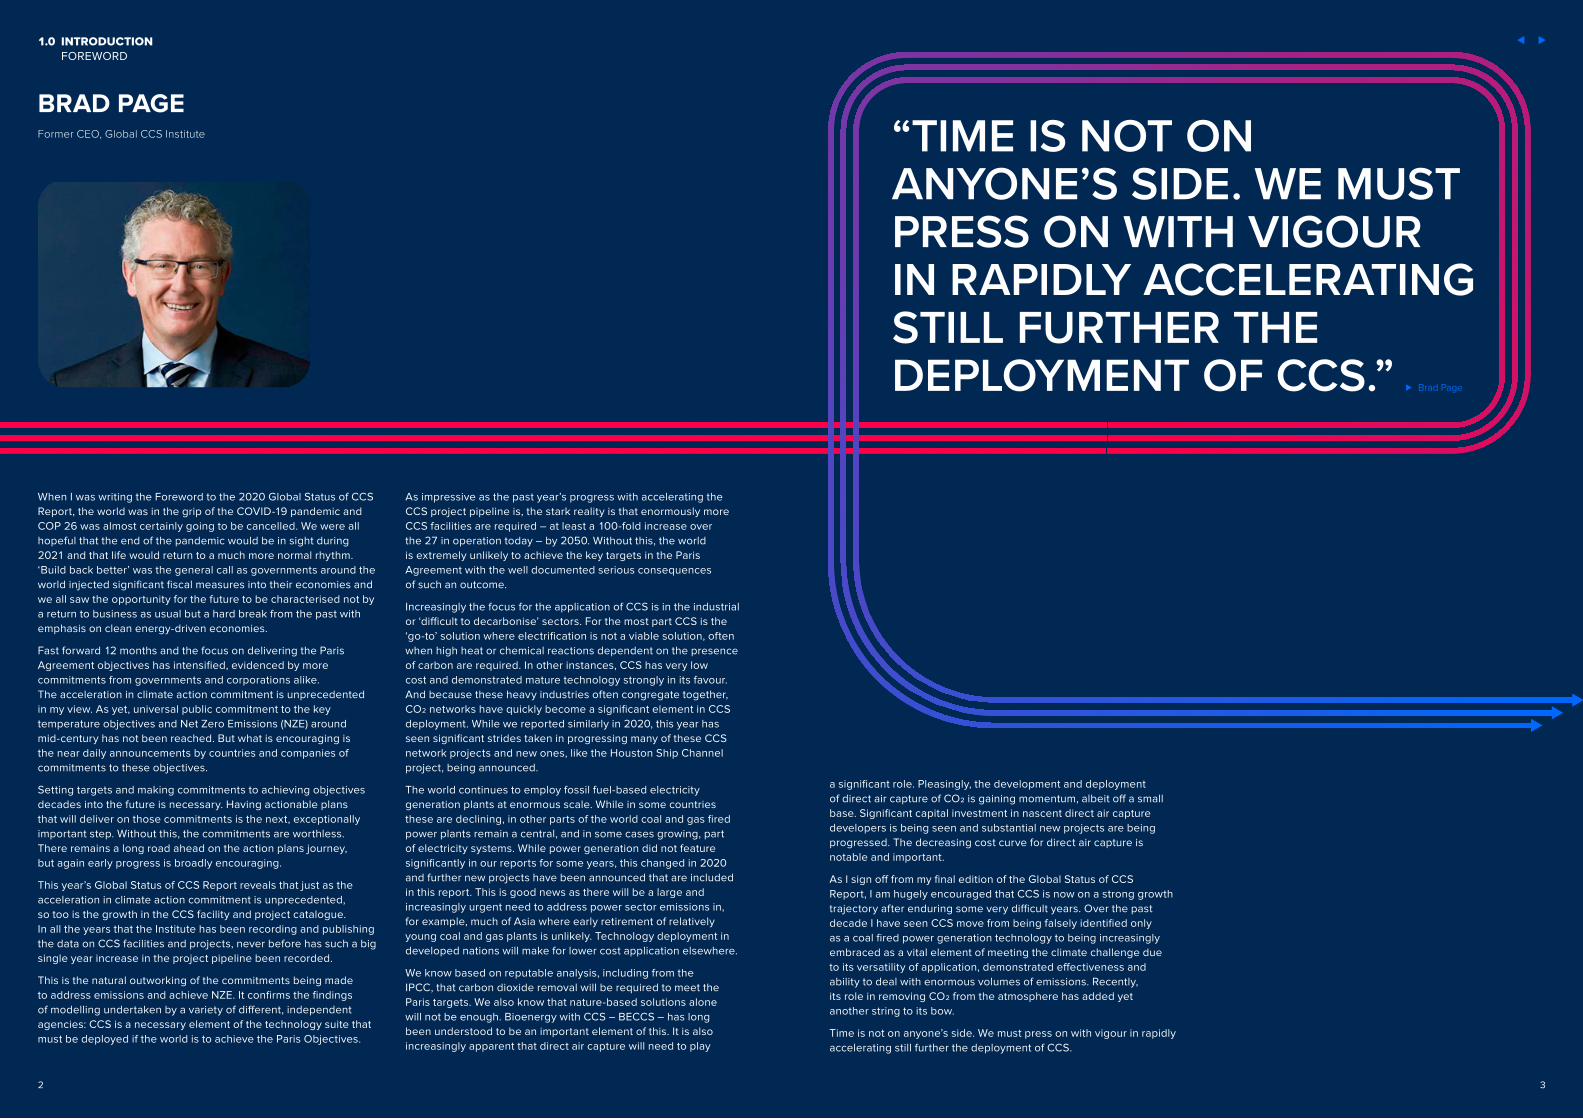
BRAD PAGEFormer CEO, Global CCS Institute
When I was writing the Foreword to the 2020 Global Status of CCS Report, the world was in the grip of the COVID-19 pandemic and COP 26 was almost certainly going to be cancelled. We were all hopeful that the end of the pandemic would be in sight during 2021 and that life would return to a much more normal rhythm. ‘Build back better’ was the general call as governments around the world injected significant fiscal measures into their economies and we all saw the opportunity for the future to be characterised not by a return to business as usual but a hard break from the past with emphasis on clean energy-driven economies.
Fast forward 12 months and the focus on delivering the Paris Agreement objectives has intensified, evidenced by more commitments from governments and corporations alike. The acceleration in climate action commitment is unprecedented in my view. As yet, universal public commitment to the key temperature objectives and Net Zero Emissions (NZE) around mid-century has not been reached. But what is encouraging is the near daily announcements by countries and companies of commitments to these objectives.
Setting targets and making commitments to achieving objectives decades into the future is necessary. Having actionable plans that will deliver on those commitments is the next, exceptionally important step. Without this, the commitments are worthless. There remains a long road ahead on the action plans journey, but again early progress is broadly encouraging.
This year’s Global Status of CCS Report reveals that just as the acceleration in climate action commitment is unprecedented, so too is the growth in the CCS facility and project catalogue. In all the years that the Institute has been recording and publishing the data on CCS facilities and projects, never before has such a big single year increase in the project pipeline been recorded.
This is the natural outworking of the commitments being made to address emissions and achieve NZE. It confirms the findings of modelling undertaken by a variety of different, independent agencies: CCS is a necessary element of the technology suite that must be deployed if the world is to achieve the Paris Objectives.
1.0 INTRODUCTION FOREWORD
As impressive as the past year’s progress with accelerating the CCS project pipeline is, the stark reality is that enormously more CCS facilities are required – at least a 100-fold increase over the 27 in operation today – by 2050. Without this, the world is extremely unlikely to achieve the key targets in the Paris Agreement with the well documented serious consequences of such an outcome.
Increasingly the focus for the application of CCS is in the industrial or ‘difficult to decarbonise’ sectors. For the most part CCS is the ‘go-to’ solution where electrification is not a viable solution, often when high heat or chemical reactions dependent on the presence of carbon are required. In other instances, CCS has very low cost and demonstrated mature technology strongly in its favour. And because these heavy industries often congregate together, CO2 networks have quickly become a significant element in CCS deployment. While we reported similarly in 2020, this year has seen significant strides taken in progressing many of these CCS network projects and new ones, like the Houston Ship Channel project, being announced.
The world continues to employ fossil fuel-based electricity generation plants at enormous scale. While in some countries these are declining, in other parts of the world coal and gas fired power plants remain a central, and in some cases growing, part of electricity systems. While power generation did not feature significantly in our reports for some years, this changed in 2020 and further new projects have been announced that are included in this report. This is good news as there will be a large and increasingly urgent need to address power sector emissions in, for example, much of Asia where early retirement of relatively young coal and gas plants is unlikely. Technology deployment in developed nations will make for lower cost application elsewhere.
We know based on reputable analysis, including from the IPCC, that carbon dioxide removal will be required to meet the Paris targets. We also know that nature-based solutions alone will not be enough. Bioenergy with CCS – BECCS – has long been understood to be an important element of this. It is also increasingly apparent that direct air capture will need to play
a significant role. Pleasingly, the development and deployment of direct air capture of CO2 is gaining momentum, albeit off a small base. Significant capital investment in nascent direct air capture developers is being seen and substantial new projects are being progressed. The decreasing cost curve for direct air capture is notable and important.
As I sign off from my final edition of the Global Status of CCS Report, I am hugely encouraged that CCS is now on a strong growth trajectory after enduring some very difficult years. Over the past decade I have seen CCS move from being falsely identified only as a coal fired power generation technology to being increasingly embraced as a vital element of meeting the climate challenge due to its versatility of application, demonstrated effectiveness and ability to deal with enormous volumes of emissions. Recently, its role in removing CO2 from the atmosphere has added yet another string to its bow.
Time is not on anyone’s side. We must press on with vigour in rapidly accelerating still further the deployment of CCS.
“TIME IS NOT ON ANYONE’S SIDE. WE MUST PRESS ON WITH VIGOUR IN RAPIDLY ACCELERATING STILL FURTHER THE DEPLOYMENT OF CCS.”
2 3

1.0 INTRODUCTION CCS ADVOCATE
HRH, THE PRINCE OF WALES
“THE CLIMATE ACTION EFFORTS WE’RE SEEING GLOBALLY, WHILE ENCOURAGING, ARE NOT ENOUGH. THE SOONER WE INCLUDE CARBON CAPTURE USE AND STORAGE TECHNOLOGIES INTO THE FOLD OF WIDE-SPREAD DECARBONISATION INITIATIVES, THE MORE LIKELY WE WILL BE ABLE TO ACHIEVE PARIS AGREEMENT CLIMATE TARGETS AND GET TO NET ZERO EMISSIONS.” HRH, The Prince of Wales
54

1.0 INTRODUCTION CCS ADVOCATE
TINA BRUNORWEGIAN MINISTER OF PETROLEUM AND ENERGY
The Norwegian government recognises that ambitious, comprehensive and bold steps are required to reach climate neutrality by 2050, and carbon capture and storage technology will be a key part in that effort. CCS is a critical climate change mitigation tool that provides significant emissions reductions for energy intensive sectors. For over 20 years, Norway has been successfully deploying CCS in the country’s climate mitigation plans and actions. With a continued commitment to reduce emissions, Norway’s CCS Longship project will support the European region in its decarbonisation efforts by providing extensive CO2 storage capacity. Working alongside a wide range of climate mitigating approaches, CCS technology will play a central role in the low-carbon transition, both in Norway and beyond. The Global Status of CCS Report highlights the positive steps being taken to tackle climate change around the world, while shedding light on the urgent need to accelerate the deployment of CCS to reach 2050 climate targets.
“CCS IS A CRITICAL CLIMATE CHANGE MITIGATION TOOL THAT PROVIDES SIGNIFICANT EMISSIONS REDUCTIONS FOR ENERGY INTENSIVE SECTORS.”
“FOR OVER 20 YEARS, NORWAY HAS BEEN SUCCESSFULLY DEPLOYING CCS IN THE COUNTRY’S CLIMATE MITIGATION PLANS AND ACTIONS.”
Tina Bru
6 7

8
2.0 GLOBAL STATUS OF CCS
1.0 INTRODUCTION
2.0 GLOBAL STATUS OF CCS
2.1 CCS, NET ZERO AND ECONOMIC PROSPERITY 102.2 GLOBAL CCS FACILITIES UPDATE AND TRENDS 122.3 INTERNATIONAL POLICY UPDATE 22
3.0 REGIONAL OVERVIEWS
3.1 NORTH AMERICA 263.2 ASIA PACIFIC 323.3 EUROPE AND NEARBY REGIONS 383.4 GULF COOPERATION COUNCIL STATES 44
4.0 PATHWAYS IN FOCUS
4.1 ENVIRONMENTAL, SOCIAL AND GOVERNANCE 504.2 FINANCING CCS 504.3 CCS NETWORKS 534.4 INDUSTRY 544.5 HYDROGEN 554.6 TECHNOLOGY-BASED CO2 REMOVAL 584.7 MINERAL CARBONATION 59
5.0 APPENDICES
5.1 COMMERCIAL CCS FACILITIES AND PROJECTS 625.2 CCS NETWORKS 685.3 CO2 GEOLOGICAL STORAGE 70
6.0 REFERENCES 76
9

2.1 CCS, NET ZERO AND ECONOMIC PROSPERITYCCS IS AN ESSENTIAL CLIMATE MITIGATION TOOL
The CCS project pipeline is growing more robustly than ever. From 75 million tonnes a year (Mtpa) at the end of 2020, the capacity of projects in development grew to 111 Mtpa in September 2021 – a 48 per cent increase (1). (F1)
The CCS project pipeline mirrors climate ambition, growing steadily since the 2015 Paris Agreement. Civil society’s calls for government and the private sector to align their policies and practices with climate stabilisation have grown in number and volume, especially since the Intergovernmental Panel on Climate Change’s (IPCC’s) special report. This 2018 publication reviewed scientific literature to develop an authoritative projection of the impacts from global warming. Four pathways show how global anthropogenic emissions must change through this century to achieve a 1.5° Celsius climate outcome. All require a rapid decrease in emissions to net zero by 2060 (2). The IPCC also estimated that 5-10 gigatonnes (Gt) of carbon dioxide (CO2) must be removed from the atmosphere each year in the second half of this century to:
• offset residual emissions that are very difficult to abate – hard to avoid emissions such as those from agriculture and air travel
• reduce the total load of greenhouse gases in the atmosphere to below the carbon budget for 1.5°C of global warming – correcting for the overshoot.
Government and private sector responses to pressure for climate change action have resulted in a wealth of commitments to net zero emissions.
The International Energy Agency (IEA) reports that, by late April 2021, 44 countries and the European Union had announced net zero emissions targets. Ten legislated, eight propose to make them a legal obligation and the rest pledged net zero targets in government policy documents. These commitments cover approximately 70 per cent of global CO2 emissions (4). The Climate Ambition Alliance, which brings together countries, regions, cities, businesses and investors to work towards achieving net zero emissions by 2050, has almost 4,000 participants, including over 2,300 companies and 700 cities (5). The leaders of these organisations have pledged to reach net zero emissions by mid-century. (F3)
Setting a net zero target is an essential first step. Achieving net zero emissions will require many specific actions, in all sectors, over decades.
It is no coincidence that recent growth in net zero commitments has been accompanied by an unprecedented spike in CCS activity. When organisations consider adopting net zero, they commonly do an analysis where they catalogue emissions, identify mitigation options for each, then rank them for cost and efficacy. CCS often emerges as an essential part of the lowest cost pathway to net zero.
There is an increasing recognition by governments of CCS’s critical role. It now appears in 24 of 291 Long Term Low Emissions and Development Strategies (LEDS) submitted under Article 4 of the Paris Agreement, as national governments decide how they’ll deliver their abatement commitments.
Pacala & Socolow (2004) found that CCS should be used in conjunction with other mitigation options. This finding has been reiterated many times by the IEA and others. Taking CCS, or any other option, off the table increases the cost of cutting emissions. CCS is one of many climate mitigating technologies – commercially available and absolutely necessary to achieve a stable climate. (F4)
THE ECONOMIC AND SOCIAL VALUE OF CCS
Effective climate policy must deliver near-term economic and social value as well as net zero emissions. Representative governments will avoid policies where costs fall disproportionately on specific communities or industries. An absence of strong opposition, and sustained support, is essential if governments are to implement strong, effective climate policies that survive the political cycle. CCS can help.
In many countries, climate-focused policy or regulation is increasingly unlikely to be opposed by arguing against climate science. Debate is more often focused on how to mitigate emissions, policy costs and the economic impacts of policies on specific industries or communities. Sustainable climate policy is less likely when a community or industry that would be adversely impacted has political power – due to their size, economic contribution, or cultural value. An aggrieved and motivated group can quickly translate into electoral defeat. By protecting and creating jobs, CCS builds support for strong climate action in places that might otherwise perceive it as a threat.
Emissions intense industries often develop in clusters due to the availability of feedstocks; access to infrastructure, such as ports and rail; the presence of a skilled workforce; and a critical mass of specialist suppliers of engineering and other goods and services. Many local communities rely upon a cluster like this for a large proportion of their employment and local economy. They would suffer severe economic and social dislocation if their emissions intense industries were shut down. CCS can help transform high emissions-intensity industries to near-zero emissions industries – continuing support for economic prosperity, but also helping achieve climate imperatives. Put simply, CCS protects jobs in industries and communities. It is one of the reasons why networks centred on existing industrial precincts are emerging as a preferred model for CCS development.
CCS also creates new high value jobs. CCS facilities begin as large engineering and construction projects that take years to plan, design, construct and commission. They require a significant development and construction workforce. At its peak, the Boundary Dam CCS facility in Canada employed a construction workforce of 1,700. Similarly, up to 2,000 people helped build the Alberta Carbon Trunk Line. Ongoing jobs are then created to run and maintain the CCS facilities. A commercial CO2 capture facility may employ around 20 operators and maintainers, while supporting jobs in firms that provide its goods and services (7).
The global CCS industry must grow by more than a factor of 100 by the year 2050, to achieve Paris Agreement climate targets. This means building 70 to 100 facilities a year, up to 100,000 construction jobs and ongoing jobs for 30,000 to 40,000 operators and maintainers (7). The size of the global CCS industry could approach that of the world natural gas industry within a few decades creating a significant engine of growth, alongside renewable energy, in the new low emissions economy.
2.0 GLOBAL STATUS OF CCS 2.1 CCS, NET ZERO AND ECONOMIC PROSPERITY
10
EM
ISS
ION
S (G
tCO
2/yr
)
40
30
20
10
0
-10
2010 2020 2030 2040 2050 2060 2070 2080 2090 2100
EMISSIONS REMOVALS NET EMISSIONS
FIGURE 2 ILLUSTRATIVE REPRESENTATION OF EMISSIONS TRAJECTORY FOR 1.5 CELSIUSSOURCE: Adapted from Friedmann et al. 2020 (3); Intergovernmental Panel on Climate Change (IPCC) 2018 (2)
2020 SEPTEMBER 2021
EARLYDEVELOPMENT
ADVANCEDDEVELOPMENT
INCONSTRUCTION
150
100
50
0
CA
PA
CIT
Y O
F C
CS
FA
CIL
ITIE
S IN
DEV
ELO
PM
ENT
(Mtp
aCO
2)
35.0
37.7
60.9
46.7
2.3 3.1
FIGURE 1 CCS FACILITIES IN DEVELOPMENTSOURCE: 'CO2RE Database' 2021 (1)
Excludes facilities that have not yet announced their capacity
CCS IN NATIONAL LONG-TERM STRATEGY
CCS OMITTED FROM NATIONAL LONG-TERM STRATEGY
83%
17%
FIGURE 4 CCS IN LONG-TERM STRATEGIES (AS OF JULY 2021)
FIGURE 3 PARTICIPANTS OF THE CLIMATE AMBITION ALLIANCESOURCE: ‘Climate Ambition Alliance: Net Zero 2050’ 2021 (6)
CATEGORY OF PARTICIPANT NUMBER OF PARTICIPANTS
Regions 28
Countries 121
Investors 163
Organisations 624
Cities 700
Companies 2357
Total Participants 3993
1 As of June 2021
10 11

London
Aberdeen
Dublin
COMMERCIAL CCS FACILITIESIN OPERATION AND CONSTRUCTIONCOMMERCIAL CCS FACILITIESIN DEVELOPMENT
OPERATION SUSPENDED
Chicago
Houston
Edmonton
Rotterdam
Antwerp
NORTH AMERICA UNITED KINGDOM AND IRELAND ROTTERDAM AND ANTWERP
2.0 GLOBAL STATUS OF CCS 2.1 CCS, NET ZERO AND ECONOMIC PROSPERITY
NET ZERO BY 2050 REQUIRES STRONG ACTION BY 2030
Despite unprecedented growth in the CCS project pipeline for the last 12 months, there remains a massive gap between today’s CCS fleet and what is required to reduce global anthropogenic emissions to net zero. Limiting global warming to 2°C requires installed CCS capacity to increase from around 40 Mtpa today to over 5,600 Mtpa by 2050 (8). Between USD$655 billion and USD$1,280 billion in capital investment is needed to 2050 (9).
This figure may appear daunting but investing around one trillion dollars over almost 30 years is well within the capacity of the private sector – in 2018, it invested approximately US$1.85 trillion (10) in just the energy sector. In addition to enormous financial resources, the private sector has the expertise and experience to develop projects. In the face of rising expectations from stakeholders and shareholders to invest in assets that aid climate mitigation, the private sector is also actively seeking opportunities. All that’s needed is a business case.
If we assume there is a business case for investment, and that capital is not a big constraint, the largest barrier to meeting climate targets is time. Rapid growth of supporting infrastructure is required by 2030 to bring more projects into the development pipeline and get them operating by 2050. In many cases, supporting infrastructure is an investment prerequisite – not only for CCS but other essential parts of any net zero strategy. For example, investing in new renewable power generation means more electricity transmission lines, while ramping up clean hydrogen production and use requires new storage, transportation and distribution infrastructure. Faster rates of CCS facility development demand additional CO2 transport and storage facilities. North America’s CO2 transport pipeline network is estimated to need to grow from around 8,000 km today to 43,000 km by 2050. This scale is definitely achievable, being only slightly larger than Australia’s natural gas transmission network, which has over 39,000 km of pipelines (3).
Driving infrastructure development to support a net zero economy should be a priority of governments everywhere. There are many examples where their support or direct investment was required to de-risk and initiate industries, including road, rail, telecommunications, electricity generation and distribution, space exploitation and more recently, renewable energy. As these industries matured and became commercial, government intervention was replaced by increased private sector investment. Governments could similarly support the establishment of CO2 transport and storage networks to service industrial CCS hubs.
A CCS network requires geological storage for CO2. Identifying and characterising a storage resource requires tens to hundreds of millions of investment dollars. All funds are at risk as there is no guarantee of success. Unlike mineral or hydrocarbon exploration, exploring for pore space does not yet generally justify risking tens of millions of dollars. Government can assist by supporting the collection of geological data and making it available. Today’s CCS facilities benefited from geological data collected during oil or gas exploration and/or from government funded programs.
Large infrastructure projects like CCS facilities or pipeline networks, usually take seven to 10 years from concept study through feasibility, to design, construction then operation. There is no time to waste. Creating an enabling environment for investment in CCS facilities and other net zero aligned assets – particularly in supporting infrastructure – through both policy and funding, should be a high priority for governments between now and 2030.
2.2 GLOBAL CCS FACILITIES UPDATE AND TRENDS
COMMERCIAL CCS FACILITIESIN OPERATION AND CONSTRUCTIONCOMMERCIAL CCS FACILITIESIN DEVELOPMENT
OPERATION SUSPENDED
FIGURE 5 WORLD MAP OF CCS FACILITIES AT VARIOUS STAGES OF DEVELOPMENT
12 13

PLANT INDUSTRY COUNTRYMEAN CO2 CAPTURE CAPACITY (Mtpa)
EARLY DEVELOPMENT
Dave Johnson Plant Electricity generation United States 4.00
G2 Net zero LNG Natural gas processing United States 4.00
NextDecade Rio Grande LNG Natural gas processing United States 5.00
Keadby 3 Power Station Electricity generation United Kingdom 2.10
Repsol Sakakemang Natural gas processing Indonesia 1.80
Barents Blue Clean Ammonia Chemical production Norway 1.60
ADVANCED DEVELOPMENT
Shell Refinery Rotterdam CCS Hydrogen production Netherlands 1.20
Stockholm Exergi BECCS Electricity and heat generation Sweden 0.80
Air Liquide Refinery Roterdam CCS Hydrogen production Netherlands 0.80
Lawler Biorefinery CCS Bioethanol production United States 0.53
Copenhill (Amager Bakke) Waste to Energy CCS Waste processing Denmark 0.50
Casselton Biorefinery CCS Bioethanol production United States 0.47
Marcus Biorefinery CCS Bioethanol production United States 0.43
FIGURE 8 LARGEST CONTRIBUTORS TO GROWTH OF PROJECTS IN DEVELOPMENT, 2021
160
180
140
120
100
80
60
40
20
0
2010 2011 2012 2013 2014 2015 2016 2017 2018 2019 2020 2021 SEPT
CA
PA
CIT
Y O
F C
CS
FA
CIL
ITIE
S (M
tpa
CO
2)
EARLY DEVELOPMENT ADVANCED DEVELOPMENT IN CONSTRUCTION OPERATIONAL
Facilities that have not announced their capacity are not included in this chart
FIGURE 7 PIPELINE OF COMMERCIAL CCS FACILITIES FROM 2010 TO SEPTEMBER 2021 BY CAPTURE CAPACITY
Figure 7 shows the progress of commercial CCS facilities from 2010 to September 2021. Capacity decreased year on year between 2011 and 2017, likely due to factors such as the public and private sector focus on short term recovery after the global financial crisis. Since 2017 there has been growth at the early and advanced development stages. Importantly, Figure 7 does not include ten early development or five advanced development projects in the pipeline, for which no capacity has been announced. As such, it underestimates potential. (F6)
The large increase in commercial CCS facilities in the first half of 2021, has led to project pipeline capacity levels not seen since 2011 – 149.3 Mtpa. The project pipeline capacity annual average growth rate since 2017 has been 30 per cent.
Most growth so far in 2021 was in early development (25.9 Mtpa) and advanced development projects (9.0 Mtpa). Project numbers in construction, or operational, were stable. Given the long lead-times for CCS projects (up to ten years, depending on location) it will be a while before this growth in early and advanced development translates into operating projects. Nevertheless, the rapid increase in developments is positive news for action on climate change.
All facilities in the project pipeline, including newly listed ones are recorded in the Institute’s ‘CO2RE Database’. (F7)
Figure 6 summarises commercial CCS facilities in the Global CCS Institute’s database. There are 135 (two suspended) in the project pipeline. In the first nine months of 2021, 71 projects were added – with one former project removed because development ceased. These numbers represent an astonishing doubling of the total number of CCS facilities that are operating or in development since the 2020 Global Status of CCS Report was published.
The United States (US) again leads the global league table, hosting 36 of the added facilities. US success demonstrates convincingly that where policy creates a business case for investment, projects proceed. Other leading countries are Belgium with four, the Netherlands with five and the United Kingdom (UK) – eight.
2.0 GLOBAL STATUS OF CCS 2.2 GLOBAL CCS FACILITIES UPDATE AND TRENDS
Commitments to CCS flowed due to the 2015 Paris Agreement, the resulting national pledges to take climate action, and complementary development of CCS-supportive policy in many regions of the world. More private investors now want CCS in their portfolios. There is increased interest in CCS as part of a broad suite of technologies and strategies that can help achieve net zero emissions solutions at the lowest possible risk and cost. Without CCS, net zero is practically impossible.
OPERATIONAL IN CONSTRUCTIONADVANCED DEVELOPMENT
EARLY DEVELOPMENT
OPERATION SUSPENDED TOTAL
Number of facilities 27 4 58 44 2 135
Capture capacity (Mtpa) 36.6 3.1 46.7 60.9 2.1 149.3
FIGURE 6 COMMERCIAL CCS FACILITIES IN SEPTEMBER 2021 BY NUMBER AND TOTAL CAPACITY
14 15

FIGURE 9 CCS PROJECTS BY SECTOR AND SCALE (BY CO2 CAPTURE CAPACITY) OVER TIME
DIRECT AIR CAPTURE
CEMENT PRODUCTION
IRON AND STEEL PRODUCTION
WASTE TO ENERGY
POWER GENERATION NATURAL GAS
POWER GENERATION COAL
HYDROGEN PRODUCTION
CHEMICAL PRODUCTION (OTHERS)
ETHANOL PRODUCTION
FERTILISER PRODUCTION
NATURAL GAS PROCESSING
APPLICATIONS 1972 2010 2015 2020 2025 2030
1.00.2 5.0 Mtpa OF CO2Size of the circle is proportionate to the capture capacity of the facility.
Chart indicates the primary industry type of each facility among various options. IN OPERATION
OPERATION SUSPENDEDIN CONSTRUCTION
The recently approved Norcem Brevik project, part of the Langskip network in Norway, has CCS expanding into a new sector – cement manufacturing. As a significant global emitter with limited decarbonisation options, the cement sector’s use of CCS is an essential step towards net zero. The Norcem project is expected to provide valuable CCS learning and insights.
CCS PROJECTS ARE BECOMING MORE DIVERSE
As new projects are announced and developed, the range in the scale of facilities is becoming broader. Individual capture plants are larger, with facilities like Shell’s Rotterdam hydrogen project developing in the megatonne range. At the same time, networks like the US's Summit Carbon Solutions are making smaller capture viable – their smallest capture plant has a capacity of just 90,000 tonnes a year. Capacities this small would be difficult to justify without supporting network infrastructure.
2.0 GLOBAL STATUS OF CCS 2.2 GLOBAL CCS FACILITIES UPDATE AND TRENDS
ADVANCED DEVELOPMENTCAPTURE CAPACITY TBC
16 17
OXY DAC
NORCEM BREVIK
ABU DHABI CCS 1
BRIDGEPORT MOONIE
BOUNDARY DAM
PETRA NOVA
PRAIRIE STATE
SAN JUAN
GERALD GENTLEMAN
PROJECT TUNDRA
COPENHILL
STOCKHOLM EXERGIFORTUM OSLO VARME
ZEROS
SINOPEC ZHONGYUAN
SINOPEC QILU
LAKE CHARLESKARAMAY DUNHUAGREAT
PLAINSBASF
ANTWERP
PCS NITROGENENID FERTILISER WABASH
COFFFEYVILLE
ACTL NUTRIEN
SHUTE CREEK
SZANK FIELD
ABU DHABI CCS 2
UTHMANIYAH
GORGON
QATAR LNG CCS
CNPC JILIN
TERRELL
SLEIPNER SNØHVIT
LOST CABIN
PETROBRAS SANTOS
CENTURY PLANT
SANTOS COOPER BASINCORE ENERGY
COYOTE CAL CAPTURE
MUSTANG STATION
PLANT DANIEL
IMMINGHAM POWER
GUODIAN TAIZHOU
INTERSEQT PLAINVIEW INTERSEQT HEREFORD ILLINOIS INDUSTRIALBONANZA BIOENERGYARKALON
SUMMIT CARBON SOLUTIONS (31 FACILITIES)
ONE EARTH ENERGY
PHILIPS 66AIR LIQUIDE
ROTTERDAM
SHELL ROTTERDAM
AIR PRODUCTS ROTTERDAM
QUESTACTL STURGEON
AIR PRODUCTS SMR EXXONMOBIL
ROTTERDAM

THE RISE OF CCS NETWORKS
Historically, CCS projects tended to be vertically integrated, with a capture plant having its own dedicated downstream transport system. This favoured large-scale projects, where economies of scale made downstream costs reasonable. Recently, there has been a trend toward projects sharing CO2 transport and storage infrastructure: pipelines, shipping, port facilities, and storage wells. These ‘CCS networks’ mean smaller projects can also benefit from economies of scale.
The Porthos network in Rotterdam entered advanced development early in 2021. A shared pipeline will transport liquid CO2 from four new blue hydrogen projects – Air Products, Air Liquide, ExxonMobil and Shell – under development in the Port of Rotterdam region, to storage about 20 km offshore, beneath the North Sea. The Netherlands Government committed €2.1 billion in grants to these four projects in support of this network (11).
Also in Rotterdam, TotalEnergies and Shell have partnered to develop the Aramis CCS Network; a world-scale network with a proposed capacity in excess of 20 Mtpa. This project is in Early Development. It proposes storage in the Rotliegendes Sandstones Formation beneath the North Sea at 3–4km depth. Transport modes will be mixed: a combination of liquefied CO2 transported by barges, gas-phase CO2 by onshore pipelines, and dense-phase CO2 by offshore pipeline. It is expected to receive CO2 from a range of hard-to-abate sectors such as waste to energy (WtE), steel, chemicals, oil refineries and cement.
When the Norcem Brevik cement plant in Norway (mentioned above) was funded by the Norwegian government in late 2020, the Langskip CCS network also took a step forward. Norcem Brevik will capture and liquefy 400,000 tonnes of CO2 a year which will be transported by ship to the Naturgassparken, then offloaded and pumped via pipeline to offshore storage beneath the North Sea. The other capture project in this network – the Fortum Oslo Varme WtE capture project is in advanced development and also expected to capture and liquefy 400,000 tonnes of CO2 a year. Langskip CCS network has been designed for an initial 1.5 Mtpa of storage (in one well) with plans for 5 Mtpa (multiple wells) in phase two (12).
Summit Carbon Solutions network, under development, is emerging as the world largest negative emissions network, with planned CO2 capture capacity of 7.9 million tonnes a year. Supporting 31 separate bioethanol plants, it leverages the twin economies of low-cost capture (corn fermentation CO2 is high purity) and aggregation of CO2 streams, reducing transport and storage costs.
In recent years, the UK has seen considerable development over multiple regions. These include the Humber Zero network and the nearby Zero Carbon Humber and net zero Teesside networks – the latter two recently combining as the East Coast Cluster. More networks are underway in Northern Scotland (Acorn), Wales and England (HyNet North West) and South Wales (South Wales industrial cluster). All are based in areas with heavy industry – including oil refineries, power stations and natural gas processing plants – with reasonable proximity to offshore storage.
In addition to climate mitigation, these UK networks are driven by the social and economic value they will deliver. They will protect jobs in industries that would otherwise be emissions-intense and incompatible with the net zero commitment, and create many new ones. Work will be available in designing, constructing, operating and maintaining the CCS infrastructure and new low emission industries, such as blue hydrogen production, that the network will support.
FACILITY CAPACITY (Mtpa) SECTOR TRANSPORT STORAGE
1 ACTL 1.7 - 14.6
2 North Dakota Carbonsafe 3.0 - 17.0
3 Integrated Mid-Continent Stacked Carbon Storage Hub 1.9 - 19.4
4 Summit Carbon Solutions 7.9
5 CarbonSafe Illinois 2.0 - 15.0
6 Illinois Storage Corridor 6.5
7 Wabash CarbonSafe 1.5 - 18
8 Petrobras Santos Basin 3.0
9 HyNet North West 4.5 - 10.0
10 South Wales Cluster 9.0
11 Net Zero Teesside 0.8 - 6.0
12 Humber Zero 8.0
13 Zero Carbon Humber Up to 18.3
14 Acorn 5.0 - 10.0
15 Langskip 1.5 - 5.0
16 Antwerp@C 9.0
17 Porthos 2.0 - 5.0
18 Athos 1.0 - 6.0
19 Greensand 3.5
20 C4 Copenhagen 3.0
21 Ravenna Hub Up to 4.0
22 Abu Dhabi Cluster 2.7 - 5.0
23 Xinjiang Junggar 0.2 - 3.0
24 CarbonNet 2.0 - 5.0
Alberta Carbon Grid More than 20.0
Barents Blue 1.8
Dartagnan 10.0
CarbonConnectDelta 6.5
Houston Ship Channel CCS Innovation Zone Up to 100.0
Aramis More than 20.0
Edmonton Hub 10
Louisiana Hub 5.0 - 10.0
CO
AL FIR
ED
PO
WE
R
NA
TU
RA
L GA
S P
RO
CE
SS
ING
HY
DR
OG
EN
PR
OD
UC
TIO
N
ALU
MIN
IUM
PR
OD
UC
TIO
N
CE
ME
NT P
RO
DU
CT
ION
ET
HA
NO
L PR
OD
UC
TIO
N
BIO
MA
SS
PO
WE
R
PIP
ELIN
E
RO
AD
DE
EP
SA
LINE FO
RM
AT
ION
S
DE
PLE
TE
D O
IL AN
D G
AS
RE
SE
RV
OIR
S
NA
TU
RA
L GA
S P
OW
ER
FER
TILIS
ER
PR
OD
UC
TIO
N
IRO
N A
ND
ST
EE
L PR
OD
UC
TIO
N
CH
EM
ICA
L AN
D P
ET
RO
CH
EM
ICA
L PR
OD
UC
TIO
N
OIL R
EFIN
ING
WA
ST
E INC
INE
RA
TIO
N
DIR
EC
T AIR
CA
PT
UR
E
SH
IP
DIR
EC
T INJE
CT
ION
EN
HA
NC
ED
OIL R
EC
OV
ER
Y
VA
RIO
US
OP
TIO
NS
CO
NS
IDE
RE
D2.0 GLOBAL STATUS OF CCS 2.2 GLOBAL CCS FACILITIES UPDATE AND TRENDS
8
1
3
2
4
7
56
24
23
22
20
15
12
9
14
10
11
21
13
1816
19
17
AMERICAS
EUROPE AND UNITED KINGDOM
APAC, ASIA AND MIDDLE EAST
FIGURE 10 CCS NETWORKS AROUND THE WORLD
IN OPERATION ADVANCED DEVELOPMENT EARLY DEVELOPMENT
18 19
2.0 GLOBAL STATUS OF CCS CCS ADVOCATES
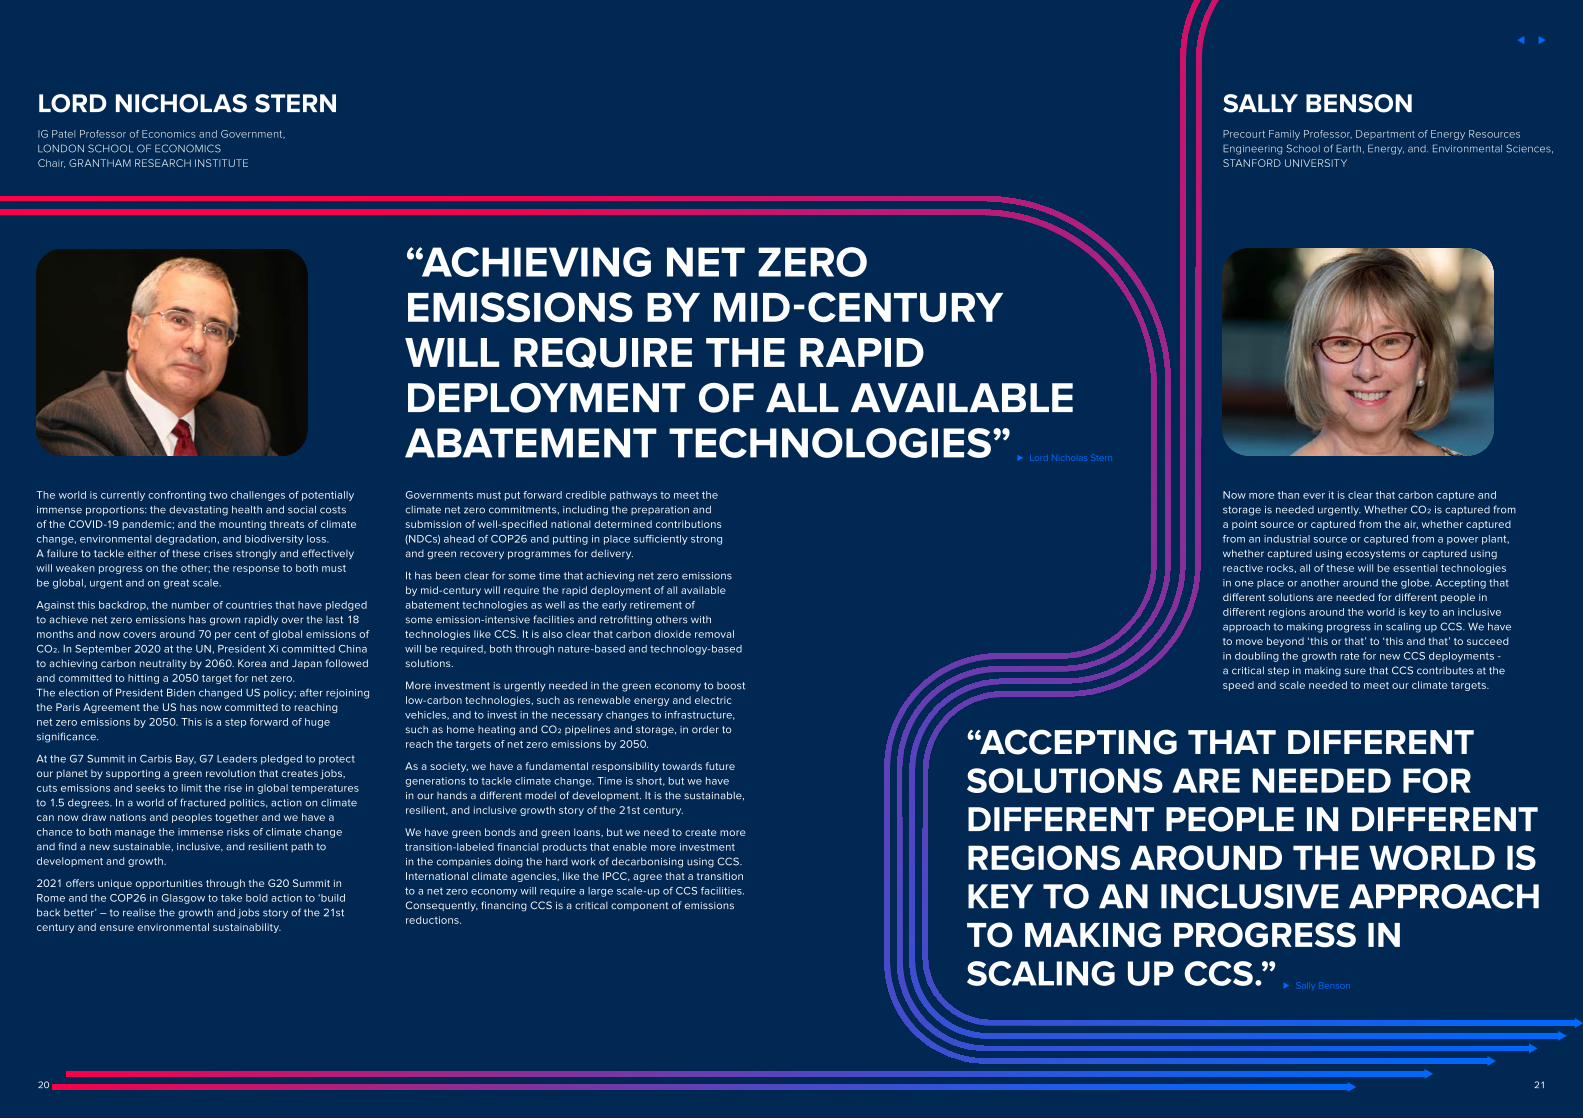
LORD NICHOLAS STERNIG Patel Professor of Economics and Government, LONDON SCHOOL OF ECONOMICS Chair, GRANTHAM RESEARCH INSTITUTE
SALLY BENSONPrecourt Family Professor, Department of Energy Resources Engineering School of Earth, Energy, and. Environmental Sciences, STANFORD UNIVERSITY
The world is currently confronting two challenges of potentially immense proportions: the devastating health and social costs of the COVID-19 pandemic; and the mounting threats of climate change, environmental degradation, and biodiversity loss. A failure to tackle either of these crises strongly and effectively will weaken progress on the other; the response to both must be global, urgent and on great scale.
Against this backdrop, the number of countries that have pledged to achieve net zero emissions has grown rapidly over the last 18 months and now covers around 70 per cent of global emissions of CO2. In September 2020 at the UN, President Xi committed China to achieving carbon neutrality by 2060. Korea and Japan followed and committed to hitting a 2050 target for net zero. The election of President Biden changed US policy; after rejoining the Paris Agreement the US has now committed to reaching net zero emissions by 2050. This is a step forward of huge significance.
At the G7 Summit in Carbis Bay, G7 Leaders pledged to protect our planet by supporting a green revolution that creates jobs, cuts emissions and seeks to limit the rise in global temperatures to 1.5 degrees. In a world of fractured politics, action on climate can now draw nations and peoples together and we have a chance to both manage the immense risks of climate change and find a new sustainable, inclusive, and resilient path to development and growth.
2021 offers unique opportunities through the G20 Summit in Rome and the COP26 in Glasgow to take bold action to ‘build back better’ – to realise the growth and jobs story of the 21st century and ensure environmental sustainability.
Now more than ever it is clear that carbon capture and storage is needed urgently. Whether CO2 is captured from a point source or captured from the air, whether captured from an industrial source or captured from a power plant, whether captured using ecosystems or captured using reactive rocks, all of these will be essential technologies in one place or another around the globe. Accepting that different solutions are needed for different people in different regions around the world is key to an inclusive approach to making progress in scaling up CCS. We have to move beyond ‘this or that’ to ‘this and that’ to succeed in doubling the growth rate for new CCS deployments - a critical step in making sure that CCS contributes at the speed and scale needed to meet our climate targets.
Governments must put forward credible pathways to meet the climate net zero commitments, including the preparation and submission of well-specified national determined contributions (NDCs) ahead of COP26 and putting in place sufficiently strong and green recovery programmes for delivery.
It has been clear for some time that achieving net zero emissions by mid-century will require the rapid deployment of all available abatement technologies as well as the early retirement of some emission-intensive facilities and retrofitting others with technologies like CCS. It is also clear that carbon dioxide removal will be required, both through nature-based and technology-based solutions.
More investment is urgently needed in the green economy to boost low-carbon technologies, such as renewable energy and electric vehicles, and to invest in the necessary changes to infrastructure, such as home heating and CO2 pipelines and storage, in order to reach the targets of net zero emissions by 2050.
As a society, we have a fundamental responsibility towards future generations to tackle climate change. Time is short, but we have in our hands a different model of development. It is the sustainable, resilient, and inclusive growth story of the 21st century.
We have green bonds and green loans, but we need to create more transition-labeled financial products that enable more investment in the companies doing the hard work of decarbonising using CCS. International climate agencies, like the IPCC, agree that a transition to a net zero economy will require a large scale-up of CCS facilities. Consequently, financing CCS is a critical component of emissions reductions.
“ACCEPTING THAT DIFFERENT SOLUTIONS ARE NEEDED FOR DIFFERENT PEOPLE IN DIFFERENT REGIONS AROUND THE WORLD IS KEY TO AN INCLUSIVE APPROACH TO MAKING PROGRESS IN SCALING UP CCS.” Sally Benson
“ACHIEVING NET ZERO EMISSIONS BY MID-CENTURY WILL REQUIRE THE RAPID DEPLOYMENT OF ALL AVAILABLE ABATEMENT TECHNOLOGIES” Lord Nicholas Stern
20 21

A full overview of CCS’s recognition in NDCs and LEDS will be available once more countries had sent in their documents. Although due in 2020, only 88 Parties of 192 had submitted updated NDCs and just 29 their LEDS, as of May 2021. Reasons for the delay include the postponement of COP 26 to 2021, the time required to understand the impact of the global pandemic and the establishment of various pandemic recovery funds in upcoming submissions.
While some developed countries have taken significant steps to deploy CCS, developing countries lag far behind (17). Yet, the world’s emerging economies have a clear need for it (18). They represent high-risk environments for investments, which further extends the funding gap where companies with smaller or more constrained balance sheets are not able to fund their CCS facilities without project finance. This limits recourse to the project that is being funded, as discussed in Section 4.2. Climate finance plays an essential role in helping to close funding gaps and can support CCS investments.
The Green Climate Fund (GCF) is the UNFCCC's most prominent vertical fund. It was developed specifically to assist developing countries to meet their Paris Agreement commitments. The GCF can support the delivery of CCS projects through a range of financial instruments; including grants, loan guarantees, concessional loans and equity investments. By partnering with private sector investors, the GCF offers a blended finance approach, combining different sources of capital to reduce risk and make climate efforts viable.
CCS projects can also be financed via carbon credits, a form of carbon finance. Credits are used to offset emissions either locally or elsewhere in the world. Crediting schemes can be used within the climate finance framework to drive a business case for CCS projects, and then capital can be raised. Carbon crediting forms the basis of an international carbon market, through compliance or voluntary carbon markets (VCMs) or via bilateral agreements between countries.
Ambitious climate targets by nations, corporations, cities and regions have led to exponential growth in VCMs. A major initiative – the Mark Carney-led Task Force on Scaling Voluntary Carbon Markets – highlights DACCS and BECCS as important growth categories, good for short to mid-term scaling of CDR (19). DACCS and BECCS do not appear under the five largest VCM standards but are already operational and issuing credits outside them.
The IPCC released the findings from Working Group I of the Sixth Assessment Report (AR6) in early August. Members of the Institute’s team have participated as expert reviewers, submitting two rounds of comments to the part of AR6 most relevant for CCS – the Working Group III contribution on climate change mitigation (20). The authors of AR6 now have an increasing body of literature on all aspects of CCS – way more than was available when AR5 and the special report on 1.5°C were prepared. The contributions of the three IPCC Working Groups to the AR6 are expected to be finalised in 2021 and their concluding synthesis report completed in the first half of 2022.
Figure 11 shows CCS within the NDCs of Parties to the Paris Agreement. CCS features strongly in the long-term low emissions development strategies (LEDS) submitted so far. These documents have a longer time scale than NDCs and look at the path to 2050 and beyond. As of June 2021, over 80 per cent highlight the role of CCS technologies in national decarbonisation plans. (F10)
A closer look at the LEDS reveals:
• 18 countries see a role for CCS in industrial decarbonisation
• 12 feature BECCS and/or DACCS to remove CO2 from the atmosphere
• nine countries consider using CCS alongside energy production from fossil sources.
CCS provides the foundation for technology-based CDR, through BECCS and DACCS. Interest in these two has surged in the last couple of years.
When designing and implementing policies to deliver both net zero targets and then net negative emissions, focus has been mostly on reducing emissions. Reducing emissions will drive climate ambition in the next decades, but CDR will need to deliver from there on. Once net zero goals are reached, CDR will be the main driver (16). Unfortunately, governance and policy incentives for CDR have been slow to emerge.
Other partnerships:
• In 2021 Shell expanded its activities in CCS when it became a foundation partner of the Porthos network blue hydrogen project feeding CO2 to a shared CO2 infrastructure.
• BP continues to develop CCS projects under its leadership of the UK’s Net Zero Teesside network, along with partners ENI, Equinor, Shell and Total.
• The Greensand project brought together Ineos, Maersk Drilling and Wintershall DEA to develop a CCS network in Denmark with storage in the North Sea.
• Valero, Black Rock and Navigator partnered to develop a CO2 pipeline project in the US mid-west to transport CO2 from bioethanol plants.
• Bechtel and Drax are working together to develop large-scale bioenergy with carbon capture and storage projects (BECCS) – ongoing at the Drax biomass power station, but also new projects in Europe and North America.
• Mitsubishi and South Pole partnered to develop a carbon dioxide removal (CDR) purchasing facility. Project developers access revenue, while also providing removal credits at the scale companies need in order to meet their net zero commitments.
All these CCS partnerships demonstrate the importance of networks. They deliver the economies of scale essential to reducing CO2 transport and storage costs. Ever larger network developments around the world will also help the CCS sector adapt to net zero.
2.3 INTERNATIONAL POLICY UPDATEAn increasing number of countries rely on CCS technologies in their long-term climate policies for reducing emissions from the energy and industrial sectors, and for carbon removal via BECCS and Direct Air Carbon Capture and Storage (DACCS). The growing pipeline of CCS projects is having an impact on the international climate policy setting.
One of the goals of the United Nations Framework Convention on Climate Change’s (UNFCCC) Conference of the Parties (COP 26) in Glasgow – in addition to raising climate ambition and mobilising climate finance – is finalising the Paris Agreement rulebook. The most relevant negotiation stream for the CCS community is Article 6 which governs voluntary cooperation between countries to meet emissions reduction targets:
• Potential for greenhouse gas emissions reduction and enhanced removals is not evenly spread. A global response, helping countries do this cooperatively, can lead to greater joint ambition for global climate change mitigation (15).
• Access to CO2 storage is also not evenly distributed. Carbon markets can incentivise developing CCS projects around the world to produce emission reductions and/or removals. Carbon credits can be used by host countries, or sold to others, to help meet climate targets.
Fourteen countries – Australia, Bahrain, Canada, China, Egypt, Iran, Iraq, Malawi, Mongolia, Norway, Saudi Arabia, South Africa, United Arab Emirates and the US – had CCS in their Nationally Determined Contributions (NDCs) as of July 2021. More countries are expected to submit theirs as COP 26 approaches, potentially highlighting the role of CCS technologies in their decarbonisation targets.
BLUE HYDROGEN PROJECTS
Blue hydrogen involves the use of fossil fuels to produce clean hydrogen. The CO2 emissions are captured and permanently stored. Many blue hydrogen projects are underway.
UK blue hydrogen projects will provide clean hydrogen fuel to help decarbonise other local businesses. All will store CO2 beneath the North Sea, benefiting from economies of scale provided by their host networks. They include:
• Equinor’s Saltend hydrogen project – an anchor for the Net Zero Humber network
• BP developing a hydrogen plant as part of the Net Zero Teesside network
• Phillips 66 developing a blue hydrogen project at its Humber refinery.
The previously mentioned Porthos network is emerging as a globally important hydrogen hub. All four of its CO2 capture sources are blue hydrogen plants – operated by ExxonMobil, Shell, Air Liquide and Air Products.
Complementing its blue hydrogen development in the Netherlands, Air Products recently announced a blue hydrogen project in Edmonton, Alberta, Canada (13). Based on autothermal reforming hydrogen technology, it will supply the Alberta region with industrial scale clean hydrogen to reduce greenhouse gas emissions there. The project incorporates a hydrogen-fuelled power station, to reduce the emissions intensity of the local power grid.
THE EMERGENCE OF STRATEGIC PARTNERSHIPS DRIVING CCS DEVELOPMENTS
The growing scale and complexity of CCS projects – especially those involving networks – means it is increasingly important to partner with a range of companies. Partnership activity is increasing between oil and gas; technology; shipping; electricity generators and distributors; and financial services providers.
In 2021 ExxonMobil established its new business – ExxonMobil Low Carbon Solutions (ELCS). ELCS will commercialise CCS technologies and develop new CCS projects (14). It has already announced plans for 20 new CCS developments worldwide and has $3 billion to invest by 2025. One initiative is the Houston Ship Channel CCS Innovation project – a proposal to develop a big CCS network in the Houston industrial cluster with offshore storage in the Gulf of Mexico.
Siemens and Aker Carbon Capture have partnered to develop CCS technology to capture CO2 from gas turbines and gas power generation. G2, NETPower, Siemens and EJM are working together to capture CO2 at a liquefied natural gas (LNG) plant in Louisiana, US. LaFarge Holcim and Schlumberger have partnered to develop capture plants at cement facilities in Europe and the US.
Italian oil major ENI is also moving into CCS in a big way. Its Ravenna Hub in Italy is set to use depleted natural gas fields for CO2 storage. ENI has a memorandum of understanding with oil services company Saipem to facilitate CCS developments and has partnered with developing UK networks, HyNet North West and Net Zero Teesside. The company is also exploring CCS – with partner Santos – through its part-interest in the Bayu-Undan offshore facilities in the Timor Sea between Australia and Timor-Leste.
2.0 GLOBAL STATUS OF CCS 2.2 GLOBAL CCS FACILITIES UPDATE AND TRENDS
INDC1ST
NDC1ST NDC UPDATE
2ND NDC
Australia
Bahrain
Canada
China
Egypt
Iran
Iraq
Malawi
Mongolia
Norway
Saudi Arabia
South Africa
UAE
United States
FIGURE 11 CCS IN COUNTRIES' NDCS (AS OF JULY 2021)
NDC MENTIONS CCSNDC DOES NOT MENTION CCSNOT AVAILABLE
22 23
24
3.0 REGIONAL OVERVIEWS 1.0 INTRODUCTION
2.0 GLOBAL STATUS OF CCS
2.1 CCS, NET ZERO AND ECONOMIC PROSPERITY 102.2 GLOBAL CCS FACILITIES UPDATE AND TRENDS 122.3 INTERNATIONAL POLICY UPDATE 22
3.0 REGIONAL OVERVIEWS
3.1 NORTH AMERICA 263.2 ASIA PACIFIC 323.3 EUROPE AND NEARBY REGIONS 383.4 GULF COOPERATION COUNCIL STATES 44
4.0 PATHWAYS IN FOCUS
4.1 ENVIRONMENTAL, SOCIAL AND GOVERNANCE 504.2 FINANCING CCS 504.3 CCS NETWORKS 534.4 INDUSTRY 544.5 HYDROGEN 554.6 TECHNOLOGY-BASED CO2 REMOVAL 584.7 MINERAL CARBONATION 59
5.0 APPENDICES
5.1 COMMERCIAL CCS FACILITIES AND PROJECTS 625.2 CCS NETWORKS 685.3 CO2 GEOLOGICAL STORAGE 70
6.0 REFERENCES 76
25

+40TWO LARGE-SCALECCS NETWORKS
CCS ACCELERATIONTECHNOLOGYPROJECTSPOLICY
AT LNG FACILITIES
CCS
MORE CCS INTEGRATION
FACILTATED BY LOW CO2 CAPTURE COSTS FROM ETHANOL PRODUCTION& POTENTIAL ACCESS TO45Q AND LCFS INCENTIVES
45Q LCFS
2
US ENERGY ACT PASSED
AUTHORISING MORE THAN$6 BILLION IN CCS RESEARCH, DEVELOPMENT & DEMONSTRATION
Market interest in low carbon LNG is leading to the announced integration of CCS at more LNG facilities.
Support for CCS in Canada greatly accelerated with newly proposed CCS incentive policies and continued investment in CCS technologies. Large and diverse CCS projects and network elements were announced – with the Province of Alberta leading the way.
More than 40 new projects and networks have been announced since the release of the 2020 Status Report.
Two large-scale CCS networks with biorefineries were announced in the US Midwest, facilitated by low CO2 capture costs from ethanol production and potential access to 45Q and LCFS incentives.
The US Energy Act of 2020 passed, which authorised more than US$6 billion for CCS research, development and demonstration.
1 45Q is a US tax credit for capturing and storing carbon.2 The Allam-Fetvedt Cycle is an innovative natural gas (or syngas from gasification of coal) fired power generation technology with inherent CO2 capture.3 Technology Readiness Level (TRL). There are 9 TRL levels, ranging from TRL 1 – basic research through to TRL 9 – fully proven and ready for commercial deployment.4 The 'lookback period' is the portion of the recapture period during which the IRS can reclaim section 45Q credits after a leakage event (12). 5 The ‘beginning of construction’ deadline is the date that construction must begin for projects to qualify for the 45Q tax credit. Methods for establishing the beginning
of construction have been defined by the IRS (24).
More than 40 new CCS networks and projects have been announced since the publication of the 2020 Global Status of CCS Report, a marked upward trend in North America. Many factors combined to enable CCS development in the US and Canada, including enhanced government climate change priorities, the return to the Paris Agreement by the US, finalisation of 45Q regulations1 and anticipated global demand for low carbon fuels and products. Investment in CCS technologies was also stimulated by growing awareness of the challenges of decarbonisation.
REGIONAL OVERVIEW AND TRENDS
CCS networks – some of the largest ever – were announced amid increasingly supportive policy environments and against a backdrop of ambitious climate change targets. Announced networks included large clusters of emitters located near options for infrastructure and geological storage (→ see ‘Large-Scale CCS Networks’ breakout). Two large-scale CCS networks in the US Midwest were also announced, facilitated by potential access to 45Q and the California low carbon fuel standard (LCFS), and the relatively low cost of CO2 capture from ethanol plants (→ see ‘Biorefineries and CCS Networks’ breakout).
Anticipated buyer demand for manufactured products and fuels with a lower CO2 footprint accelerated CCS projects in hard-to-abate sectors, as buyers more definitively considered the carbon footprints of products and their supply chains. Several pilot and commercial projects were announced and initiated by the cement industry, which despite the challenges of higher capture costs, has taken a proactive approach to CCS implementation in response to expected future demand for low carbon cement products.
Large-scale, low carbon fuel projects also emerged as a market approach with the announced integration of CCS into planned liquified natural gas (LNG) projects (→ see ‘Role of CCS in Low Carbon LNG’ breakout). Multiple, large-scale projects incorporating CCS to produce other low carbon fuels were also announced (1)(2).
Technologies that capture CO2 directly from flue gas streams using solid adsorbents or other innovative methods received commercialisation support from public and private investments. Support for continued deployment of the Allam-Fetvedt Cycle2 was confirmed by the announcement of a feasibility study in Canada and two at-scale projects in the US utilising this pre-combustion CCS technology (3),(4),(5). (F11)
CCS technologies capable of delivering negative emissions, including both direct air capture (DACCS) and bioenergy with CCS (BECCS), were supported by corporate net zero pledges from a broad set of industries, including major technology and online retail. Investments by technology companies in carbon removal technologies are an example of this trend (6),(7).
While attention was understandably focused on new project announcements, it is worth noting that more than half of the world’s operating commercial CCS facilities are located in the US or Canada and most have operated reliably for years. For example, the Shute Creek facility in Wyoming has captured and stored more than 110 MtCO2 since it commenced operations in 1986 (8). While the Petra Nova and Lost Cabin facilities remain
inactive, several other CCS facilities in the Americas also reached impressive storage milestones in the past year. More than 40 million tonnes of CO2 from the Great Plains Synfuel Plant, 20 million tonnes from the Terrell Natural Gas Processing Plant, and 11 million tonnes from the Enid Fertilizer Plant have been captured and stored to date.
UNITED STATES
Policy
Major growth for CCS policy support emerged in the US. In the 2021 financial year (FY 21) Congress appropriated US$228.3 million for carbon capture, utilisation, and storage (CCUS), a US$10.5 million increase from the previous year’s funding for the Office of Fossil Energy and Carbon Management (9). Using this, and prior fiscal year funds, the US Department of Energy (DOE) committed or awarded co-funding agreements for front-end engineering and design (FEED) studies for technologies to capture CO2 from industrial and natural gas sources, DAC and CO2 utilisation and geological storage. The DOE also released a Hydrogen Strategy (10) that detailed the role for CCS as part of the transition to a hydrogen economy.
The US Energy Act of 2020 (11) passed in December 2020 as part of the Stimulus Bill. More than US$6 billion was authorised for CCS research, development, and demonstration (RD&D) programs in the DOE and Environmental Protection Agency (EPA) for FY 21 – FY 25. This significant funding milestone includes:
• US$2.6 billion for six commercial-scale demonstrations (natural gas, coal, industrial)
• US$1 billion for large-scale pilot projects
• US$910 million for DOE low-TRL level3 R&D
• US$800 million for a large-scale carbon storage and validation program
• US$200 million for FEED studies
• more than US$1 billion for other activities.
The Treasury and Internal Revenue Service (IRS) provided, in January 2021, long-awaited regulatory certainty regarding implementation of 45Q tax credits (12). The ruling included important clarifications about geological storage certification, aggregation of multiple projects, reduction of the lookback period4 for credit reclaim, and a broader definition of carbon utilisation. The US Energy Act of 2020, referred to above, extended the beginning of construction deadline5 to 1 January 2026 (11).
Clear support emerged for CCS with major bills introduced in Congress during 2021. Collectively, this legislation (none of which had yet been signed into law at the time this document was finalised) includes elements that support the deployment of CCS including:
• modifications to 45Q that –
− significantly raise the credit value for geological storage, utilisation and DAC
− provide a direct pay option
− extend the beginning of construction deadline to ten years
− allow the credit to more easily offset tax obligations for multinational corporations
3.0 REGIONAL OVERVIEWS 3.1 NORTH AMERICA
3.1 NORTH AMERICA
26 27

• financing CO2 infrastructure and storage and funding for permitting these projects6
• modifications to existing 48A tax credits for CCS equipment on coal-fired power plant retrofits
• enabling the use of a tax-advantaged, master limited partnership structure
• purchase of tax-exempt private activity bonds7 to finance CCS retrofits.
Regulatory developments
A critical step for CCS project development is obtaining permits for CO2 injection wells through EPA’s Underground Injection Control Class VI program. EPA manages the Class VI well permitting process with the exception of delegated primacy to North Dakota and Wyoming. Louisiana has submitted a Class VI Primacy Application to EPA (13). In response to increased interest in Class VI well permits, EPA has added information to its website including a Class VI permit application outline, a table of permitted and proposed Class VI wells and video tutorials (14).
The Texas General Land Office issued in April 2021 its first Request for Proposal (RFP) to establish and operate a geological CO2 storage repository under submerged land in offshore Jefferson County, including the construction of transportation and storage infrastructure (15). This RFP was the first of its kind for a potential CO2 storage site in offshore Texas waters.
Geological storage developments
Large volume, highly permeable deep saline formations with high CO2 injectivity potential are critical resources for CCS networks and projects. Characterisation studies undertaken by the DOE’s National Energy Technology Laboratory (NETL), and further potential storage formation exploration and appraisal by NETL’s CarbonSAFE program, have advanced the identification of suitable US onshore greenfield CO2 storage sites. These studies should provide a higher level of confidence to support CCS development.
CANADA
Policy
The Government of Canada released A Healthy Environment and a Healthy Economy in December 2020 (16). This policy document proposed the development of a comprehensive CCUS strategy for Canada and launched a Net Zero Challenge for large industrial emitters to encourage plans for net zero emissions by 2050. A ‘Strategic Innovation Fund – Net Zero Accelerator’ was also announced to provide CA$3 billion over the next five years to fund initiatives including decarbonisation projects for large emitters. The Hydrogen Strategy for Canada was released in December 2020 by Natural Resources Canada (17). It described Canada’s blue hydrogen production experience and the continued potential for CCS as part of an expanded, low carbon intensity hydrogen strategy.
3.0 REGIONAL OVERVIEWS 3.1 NORTH AMERICA
6 These elements were passed by the Senate in August 2021 as part of the bipartisan Investment Infrastructure and Jobs Act.7 Tax exempt private activity bonds are tax-free bonds issued by local or state governments, with lengthy pay back periods.
LARGE-SCALE CCS NETWORKS
Recognition of the emissions mitigation and economic benefits of CCS was illustrated by the announcement of several large-scale CCS networks. The largest of these was ExxonMobil’s proposal for a Houston Ship Channel CCS Innovation Zone which seeks to bring together multiple stakeholders in support of a concept to capture up to 100 Mtpa of CO2 with permanent geological storage in offshore Gulf of Mexico formations (26), (27). Since the initial announcement in April 2021, ten additional companies have expressed interest in participating in this project.
Elements of three large-scale CCS networks were announced in Alberta, Canada. Shell Canada announced Polaris CCS, a two-phase project at its Scotford Complex near Edmonton. The first phase would capture about 0.75 Mtpa of CO2 from the Scotford refinery and chemicals plant. The second phase would create a CO2 storage hub to further decarbonise Shell’s facilities and
provide third-party storage. Fully built, the hub could store up to 10 Mtpa of CO2 with a capacity of about 300 MtCO2 over the life of the project.
Pembina and TC Energy revealed plans to jointly develop the Alberta Carbon Grid (ACG), an open-access, large-scale system that would transport more than 20 Mtpa of CO2 to a sequestration location northeast of Redwater and to other third-party sequestration locations (28).
The Pathways CCUS system was announced by the Oil Sands Pathways to Net Zero, an alliance of Canadian oil sands producers. The proposed CO2 trunkline would link as many as 20+ oil sands facilities to a storage site near Cold Lake. The first phase of the project would capture 8.5 Mtpa of CO2 from eight facilities, and fully built, the project would capture up to 40 Mtpa of CO2. (29).
Above: Houston Ship Channel. Photo courtesy of ExxonMobil/Robert Seale
CCS ADVOCATE
DR. JENNIFER WILCOXPrincipal Deputy Assistant Secretary, OFFICE OF FOSSIL ENERGY AND CARBON MANAGEMENT, DEPARTMENT OF ENERGY
We have little time left to avoid some of the worst impacts of climate change and its threats to our communities, our public health and our economies. We can tackle this challenge by avoiding carbon emissions through point source carbon capture coupled to reliable storage (CCS) and removing CO2 from the accumulated pool in the atmosphere (CDR). We know CDR will be critical to address the hard-to-abate sectors on the path towards net zero carbon emissions.
To accomplish this, we need to move CCS and CDR out of their silos and expand focus on decarbonising supply chains, including building materials, chemicals, and fuels. If done strategically and collaboratively, deploying these approaches will not only help us address the climate crisis, but it will also spur the creation of high-quality clean economy jobs – helping those populations and communities that have been disproportionately affected by climate change.
“WE NEED TO MOVE CCS AND CDR OUT OF THEIR SILOS AND EXPAND FOCUS ON DECARBONISING SUPPLY CHAINS, INCLUDING BUILDING MATERIALS, CHEMICALS, AND FUELS.”
Dr. Jennifer Wilcox
28 29

SONYA SAVAGEMinister of Energy, PROVINCE OF ALBERTA
As a pioneer in carbon capture, utilsation and storage development, Alberta has witnessed – firsthand – its ability to reduce emissions in a variety of sectors, including oil and gas, the fertiliser industry, and in hydrogen production. We see this technology as foundational to achieving significant emission reductions while also driving long-term economic activities and helping Canada reach its climate goals. We applaud the efforts of the Global CCS Institute to promote and support the development of this technology around the world.
“WE SEE THIS TECHNOLOGY AS FOUNDATIONAL TO ACHIEVING SIGNIFICANT EMISSIONS REDUCTIONS WHILE ALSO DRIVING LONG-TERM ECONOMIC ACTIVITIES AND HELPING CANADA REACH ITS CLIMATE GOALS.”
Sonya Savage
CCS ADVOCATE
BIOREFINERIES AND CCS NETWORKS
More certainty around the 45Q tax credit, the relatively low CO2 capture cost from bioethanol production, and the opportunity to access the California LCFS via the production of low carbon ethanol, has enabled the proposed development of two large-scale CCS network projects in the US Midwest:
• Summit Carbon Solutions announced a project that would link more than thirty biorefineries, with a total CO2 capture of about 8 Mtpa, across the US Midwest to geological storage sites in North Dakota (34). This project would potentially be both the largest CCS network and the largest BECCS project in the world.
• Navigator CO2 Ventures – in collaboration with Valero and BlackRock – has proposed a CCS network spanning more than 1,930 km (1,200 miles) across five states in the US Midwest. The Heartland Greenway Pipeline would transport CO2 from biorefineries and other industrial facilities in Iowa, Illinois, Nebraska, Minnesota, and South Dakota to a geological storage site in Illinois with a capacity of up to 5 Mtpa (35), (36).
Summit Carbon Solutions – planned biorefinery network. Courtesy of Summit Carbon Solutions, LLC
ROLE OF CCS IN LOW CARBON LNG
With growing market interest in lower carbon LNG, the integration of CCS was either announced or under consideration this past year for more LNG facilities than ever before:
• NextDecade announced the integration of CCS into its planned Rio Grande LNG project in Texas as part of an approach to decarbonise its LNG supply chain. The project would capture up to 5 Mtpa of CO2 (33).
• Venture Global LNG announced plans to capture and sequester an estimated 0.5 Mtpa of CO2 from two facilities under construction – Calcasieu Pass LNG and Plaquemines LNG (34).
NextDecade Rio Grande LNG facility – Brownsville, Texas. Courtesy of NextDecade Corporation
• Sempra indicated the consideration of CCS at its Cameron LNG facility. Similarly, Cheniere Energy is considering CCS at its Corpus Christi LNG facility in Texas and its Sabine Pass LNG facility in Louisiana (35,36).
G2 Net-Zero LNG, located on the Calcasieu Ship Channel, also announced that it will use NET Power’s Allam-Fetvedt Cycle technology which would remove CO2 emissions from the facility’s natural gas liquefaction process (37).
Proposed regulations for the Clean Fuel Standard were issued by the Canadian Government in December 2020 (18), with a target to publish final regulations in late 2021, and reduction requirements coming into force on 1 December 2022. One pathway to create compliance credits for the Clean Fuel Standard is to undertake projects that use CCS to reduce the lifecycle carbon intensity of fossil fuels (19). Canada’s recent Budget 2021 (20) also proposed an investment tax credit – to be effective in 2022 – for capital invested in CCUS projects with the goal of reducing CO2 emissions by at least 15 Mtpa.
The Government of Alberta (Alberta) announced, in September 2020, that it was investing up to CA$750 million from its Technology Innovation and Emissions Reduction (TIER) program to fund emissions reductions, including CA$80 million for a new Industrial Energy Efficiency and Carbon Capture Utilisation and Storage Grant Program (21). Grants would be for improvements at facilities regulated, or eligible to be regulated, under TIER. TIER would also invest CA$9.5 million through Emissions Reductions Alberta to support CCUS projects.
Alberta also moved forward with policies to enable CCS, including the ongoing development of a Hydrogen Roadmap to define how Alberta will build a low-carbon hydrogen industry (22). Alberta Energy also issued Information Letter 2021-19 that described a planned Carbon Sequestration Tenure Management process (23). Through a competitive process, the Alberta government would issue carbon sequestration rights to advance development of carbon storage hubs. The process would apply only to dedicated geological storage hubs and not to projects that store CO2 for enhanced oil recovery (EOR). The process remained in development at the time of publication.
Regulatory developments
Following court challenges by several provinces, the Greenhouse Gas Pollution Pricing Act 2018 (GGPPA) was found in March 2021 to be constitutional by the Supreme Court of Canada (24). The GGPPA sets minimum national standards for emissions from carbon-based fuels and CO2 emitting industries. The court’s ruling held that climate change is a matter of national concern. The affirmation of this legislation will enable the proposed increase in Canada’s carbon price from CA$40 per tonne of CO2 as of 1 April 2021 to a proposed CA$170 per tonne of CO2 by 2030 (25).
3.0 REGIONAL OVERVIEWS 3.1 NORTH AMERICA
30 31

AUSTRALIAINCLUDES CCSIN EMISSIONS REDUCTION FUND
FIRST COMMERCIAL PROJECTS FOR MALAYSIA & INDONESIA
CHINALAUNCHESEMISSIONS TRADINGSYSTEMCOVERING4,000 MtpaFROM 2,225POWER PLANTS
+5The Australian Government has included CCS in the Emissions Reduction Fund, providing the first financial incentive scheme for CCS in the Asia Pacific region.
The first commercial CCS projects were announced in both Indonesia and Malaysia.
China launched its emissions trading system, covering 2,225 power plants, which collectively emit over 4,000 million tonnes of CO2 per annum.
Japan continues to be a regional driver of CCS, promoting regional collaboration and exploring low-carbon energy exports.
5 new commercial CCS facilities have been added to the Institute’s CO2RE database in the Asia Pacific region.
The Asia Pacific region includes countries with some of the largest and fastest growing greenhouse gas emission inventories in the world. CCS will be particularly important to achieve ambitious climate targets. Although the last 12 months have seen several positive developments in the region, investment in commercial CCS facilities lags behind North America and Europe.
CCS PROJECT PIPELINE GROWTH
Five new large-scale facilities in the Asia Pacific region have been added to the Institute’s CO2RE Database. One important factor that differentiates CCS development in Asia Pacific from Europe or North America, is that the majority of new projects are emerging in developing countries where emissions growth is the most rapid and policy support is insufficient. (F12)
AUSTRALIA
Projects
New CCS facilities and hubs have been announced:
• Bridgeport Energy is developing its Moonie Project, targeting around 1 Mtpa CO2 injection, sourced from power stations nearby, for CO2-EOR and storage in southeast Queensland. The project is scheduled to start injection in 2023, ramping up to 1 Mtpa by 2028.
• Santos and Eni have formed a partnership to develop a CCS storage hub at the Bayu-Undan field in the Timor Sea, offshore Timor-Leste, storing CO2 from their own operations and potentially from other emitters (38). Details about the hub are still emerging.
Previously announced facilities have progressed:
• Santos’ 1.7 Mtpa Moomba Project in the Cooper Basin, which will store CO2 from natural gas processing, has completed FEED, obtained environmental approval from the South Australian Government and is expected to make a final investment decision before the end of 2021.
• Chevron’s Gorgon CCS Project had technical difficulties in pressure management and will not meet the government requirement that at least 80 percent of reservoir CO2 over every five years (rolling average) should be sequestered underground (39). Nevertheless, the project had injected close to 5 Mt of CO2 as of mid-July 2021.
Hydrogen Energy Supply Chain Demonstration Project
The Hydrogen Energy Supply Chain (HESC) project is demonstrating the conversion of Latrobe Valley brown coal to hydrogen, producing up to 70 kg H2 each day and testing hydrogen transport logistics between Victoria and Japan. The project is being delivered in partnership between Kawasaki Heavy Industries, J-Power, Marubeni Corporation, AGL and Sumitomo Corporation with support from the Victorian, Australian and Japanese governments. A significant milestone is expected between Q4 2021 and Q1 2022 when the liquid hydrogen carrier, Suiso Frontier, should arrive in Victoria to ship liquid hydrogen to HESC’s hydrogen terminal in Kobe, Japan (40). This demonstration project is collecting valuable data on the feasibility of establishing commercial blue hydrogen production and export facilities in Victoria. If it proceeds, such a facility would utilise world class geological storage resources in the Gippsland basin for the permanent storage of CO2.
Policy
In 2020, the Australian Government released its Technology Investment Roadmap: First Low Emissions Technology Statement, which identified CCS, clean hydrogen, energy storage, low carbon materials and soil carbon as priority technologies (41). Guided by the Technology Investment Roadmap, the Australian Government announced AU$263.7 million in new funding to support CCS/CCUS projects and hubs and AU$275.5 million to support four clean hydrogen hubs (42). The previously announced $50 million CCUS Development Fund was awarded to six projects covering natural gas processing, cement, DAC, biogas, and CO2 utilisation/ mineralisation (43).
In June 2021, Australia and Singapore announced a joint initiative to work on low emissions fuels and technologies, including clean hydrogen and clean ammonia (44).
Regulatory developments
In a notable regional development, the Australian Government released a draft CCS method which will allow CCS to be included under the Emissions Reduction Fund. Importantly, the method will allow eligible CCS projects to receive Australian Carbon Credit Units (ACCUs), which can be sold to the government under contract or to private entities through the secondary market. This is the first financial incentive scheme for CCS-specific CO2 abatement in the Asia Pacific region, which may be significant in the wide-scale deployment of projects. Consistency across jurisdictions – particularly regarding eligibility, monitoring and verification – will be essential. To this end, the Institute has established an Australian CCS Regulators’ Network to promote knowledge exchange between regulators.
3.0 REGIONAL OVERVIEWS 3.2 ASIA PACIFIC
3.2 ASIA PACIFIC
FIGURE 12 NEW COMMERCIAL CCS PROJECTS IN THE ASIA PACIFIC REGION (JUNE 2021)
CCS FACILITY COUNTRY INDUSTRYSTAGE OF DEVELOPMENT
EXPECTED START OF OPERATION
Guodian Taizhou Power Station Carbon Capture China Power In construction 2023
Petronas Kasawari Gas Field Development Project Malaysia Natural Gas Processing Early development 2025
Repsol Sakakemang Carbon Capture and Injection Indonesia Natural Gas Processing Early development 2026
Bridgeport Energy Moonie CCUS Project Australia Power Advanced development 2028 or earlier
PAU Central Sulawesi Clean Fuel Ammonia Production with CCUS Indonesia Chemical/Ammonia Early development Late 2020s
32 33

PETRONAS KASAWARI PROJECT
Petronas’ first large-scale CCS project is in the Kasawari Ph2 Field in offshore Sarawak. The field has an estimated reserve of three trillion cubic feet and contains high levels of CO2. To monetise these high CO2 gas resources, Petronas must abate reservoir CO2 emissions.
Gas production is expected to commence in 2023, producing up to 900 million standard cubic feet per day. The gas will be processed and liquefied at Petronas LNG Complex in Bintulu, Malaysia. The project plans to inject around 4.25 million tonnes of CO2 per annum (Petronas, 2021).
Petronas is working with several partners on aspects of the project and plans to commence injection in 2025. It is likely to be Southeast Asia’s first large-scale project sequestering CO2.
MALAYSIA AND INDONESIA
Projects
It has been an exciting year for CCS in several Southeast Asian countries, with commercial facilities announced for the first time. Petronas has started working on its first CCS project (see breakout) and two potential regional offshore CCS hubs in Malaysia. The proposed hubs have the potential to store CO2 from other countries in Southeast Asia and the broader Asia Pacific region.
Repsol announced its 2.5 Mtpa project in Sakekamang, South Sumatra, Indonesia. This facility will capture CO2 from Repsol’s natural gas processing plant and permanently store it in nearby oilfields. It is well positioned to be an anchor for a South Sumatran CCS hub, reducing emissions from gas processing, power stations and other emitting sectors.
The Repsol project demonstrates the trend for large corporations, headquartered in developed countries with net zero commitments, to develop emissions-reducing CCS projects even in the absence of policy support, where CO2 capture costs are very low. A feasibility study for the PAU Central Sulawesi Clean Fuel Ammonia Production with CCUS was initiated by a Japan-Indonesia consortium. They aim to capture CO2 emissions from ammonia production and store it around Central Sulawesi.
Regulatory developments
Public and private-sector stakeholders widely agree that the absence of CCS-specific law and regulation is a critical barrier to the deployment of CCS projects in this region. While a draft CCS regulation was introduced in Indonesia in 2019, it has yet to be formally endorsed by the relevant minister and President. A draft Presidential Regulation on Carbon Economic Value (a carbon pricing scheme) is likely to be issued in Indonesia after the pandemic-driven health crisis has stabilised. Once a Presidential Decree is issued, the Ministry of Energy and Mineral Resources may set up specific regulations to address terms related to CCS/CCUS. In Malaysia, development of a CCS-specific regulatory framework has begun, projected for completion in the first half of 2022. The proposed legislation will most likely be based upon the existing oil and gas production regime.
To help address this critical barrier and promote more widespread understanding of CCS-specific legal and regulatory issues, the Institute is partnering with the Association of Southeast Asian Nations Centre for Energy to establish the Southeast Asia Regulators’ Network. The network will:
• act as a conduit between regulators in the region as they further their knowledge of CCS legal and regulatory frameworks and permitting practices
• seek to develop key legal principles and guidelines to assist policymakers and regulators in the region.
CHINA
Projects
President Xi’s September 2020 commitment for China to achieve carbon peaking before 2030 and carbon neutrality before 2060 has triggered renewed CCS interest and activity in China. This has raised the profile and relevance of subsequent CCS project development milestones:
• China Energy Investment Corporation’s Jinjie post-combustion carbon capture facility commenced commissioning in early 2021, and completed a 168-hour test run in June 2021. The facility has the capacity to capture 150,000 tonnes of CO2 per year.
• Sinopec started constructing China’s first 1 Mtpa CO2-EOR project in Shangdong Province. The project will capture CO2 from Qilu Fertiliser Plant and inject CO2 into Shengli Oilfield for CO2-EOR and storage. It is scheduled to commence operation towards the end of 2021 (45).
• Hebei Iron and Steel Group announced its plan to build CCS demonstration projects at its steel plant by 2030 (46).8
Policy
As a result of China’s carbon neutrality pledge, various Chinese Government ministries have become more active in building understanding of CCS’s role in decarbonisation, laying the groundwork for policy development. For the first time, China’s Five-Year Plan (its fourteenth) includes large-scale CCUS demonstration projects (47).
In May 2021, the Ministry of Ecology and Environment (MEE), with several other ministries, announced support for CCUS pilot and demonstration projects in free trade zones (48). CCUS was also included in the China-US Joint Statement Addressing the Climate Crisis, issued in April 2021 (49). In June 2021, the National Development and Reform Commission issued a notice to request CCUS project information, with the aim of supporting major projects in the near future (50).
3.0 REGIONAL OVERVIEWS 3.2 ASIA PACIFIC
8 Some projects announced by major Chinese corporations toward the end of 2021 may not be included in this report.
PROF. JIUTAIN ZHANGSecretary General, CCUS PROFESSIONAL COMMITTEE, CHINESE SOCIETY OF ENVIRONMENTAL SCIENCES
As the global response to climate change has advanced, many countries announced their carbon neutral strategy. In particular, carbon capture, utilisation and storage (CCUS) received unprecedented attention. We are pleased to see that government enterprises, research institutes and investment organisations have paid close attention to such a vital sector and have begun to act, which did not happen in the past decade.
CCUS is highly valued due to its potential contribution to carbon neutrality targets in terms of creating negative emissions. Agricultural and forestry carbon sinks have a certain ceiling and the majority of additional potential in negative emissions that we need in the future will come from negative emission technologies, with a focus on CCUS. From the perspective of its potential in emissions reductions, CCUS is indispensable to deep decarbonisation in the industrial sector. Even if fossil power use is significantly reduced, it still requires certain amounts of fossil power to guarantee the flexibility and security of the power grid. CCUS will play a critical role in reaching net zero or providing even a negative carbon power system.
CCS ADVOCATES
PROF. JIN HONGGUANGMember of CHINA ACADEMY OF SCIENCES, Chair Commissioner, CCUS PROFESSIONAL COMMITTEE, CHINESE SOCIETY OF ENVIRONMENTAL SCIENCES
Realising carbon neutrality requires using multiple technologies, among which CCUS will play an indispensable part. Because of its own characteristics, CCUS will exert a decisive influence in large-scale emissions reductions for the energy and industrial sectors including power, steel, cement and chemicals. In addition, it will serve as an integral technology pathway for reaching carbon neutrality goals. CCUS has benefited from a great deal of experience in policy, technology and engineering perspectives. It has a great development potential with a future full of opportunities and challenges.
“REALISING CARBON NEUTRALITY REQUIRES USING MULTIPLE TECHNOLOGIES, AMONG WHICH CCUS WILL PLAY AN INDISPENSABLE PART.”
Prof. Jin Hongguang Jiutain Zhang
“CCUS WILL PLAY A CRITICAL ROLE IN REACHING NET ZERO”
34 35

The long-awaited national emissions trading system (ETS) commenced operation on 16 July 2021. Though only covering the power sector, it may be expanded into other industrial sectors. To make CCUS eligible under the ETS, a methodology needs to be developed. A CCUS standardisation working group promoted by the China National Carbon Emissions Standardization Technology Committee; National Energy Infrastructure and Management Standardization Committee; and National Environment Management Standardization Committee is developing CCUS standards for the emerging industry (51).
International corporations are starting to build collaborative relationships with Chinese suppliers and consumers on climate change and CCUS. A good example of this trend is the partnership between BHP and China Baowu Steel Group which will support research into applying CCUS to one of China Baowu’s production facilities (52).
JAPAN
Projects
Japan continues to be a transnational CCS driver, via its clean energy programs:
• In October 2020, 40 tonnes of blue ammonia – ammonia made from hydrocarbons with associated CO2 emissions captured and stored underground – produced by Saudi Basic Industries Corporation, was shipped from Saudi Arabia to Japan for zero-emission power generation, marking a first for both countries (53).
• In December 2020, Japan Oil, Gas and Metals National Corporation (JOGMEC), Irkutsk Oil Company, Toyo Engineering Corporation and Itochu Corporation agreed on a joint low-carbon ammonia value chain feasibility study between eastern Siberia and Japan. It includes the production of ammonia from natural gas and capturing associated CO2 emissions for CO2-EOR in Russia (54).
• In July 2021, INPEX, JERA, JOGMEC and Abu Dhabi National Oil Company (ADNOC) agreed to a joint study exploring the commercial feasibility of clean ammonia production from natural gas, with associated CO2 capture and sequestration for storage and CO2-EOR in the United Arab Emirates (55).
Policy
The Japanese Government continues to promote bilateral and multilateral CCUS collaborations. Japan is using its Joint Crediting Mechanism9 (JCM) to support the Gundih Project in Indonesia and continues to explore further similar JCM funding opportunities. In June 2021, the Japanese Government launched the Asia CCUS Network to support capacity development and promote knowledge sharing (56).
CROSS-BORDER CO2 TRANSPORT AND STORAGE
Countries with limited storage potential are investigating the transport and storage of their CO2 to other nations. This has led to renewed interest in considering and addressing legal barriers to transboundary CO2 movement and storage, respecting the London Protocol – an international marine agreement that governs the dumping of wastes in the marine environment – and relevant domestic laws and regulations. Greater collaboration will be critical. The proposed Bayu-Undan project is one cross-boundary project in the region. It will consider domestic and international legislation when sending CO2 from Australia to storage in Timor-Leste.
GEOLOGICAL STORAGE DEVELOPMENTS
A regional storage potential assessment was completed by ExxonMobil, the National University of Singapore and the Institute. The assessment indicated great possibilities around southeast Asia. High-level estimates identified several locations, like South Sumatra, that offer low-cost storage hub opportunities.
CCS ADVOCATES
TOSHIAKI NAKAJIMA President, JAPAN CCS CO., LTD. (JCCS)
FUTOSHI NASUNODirector-General, INDUSTRIAL SCIENCE AND TECHNOLOGY POLICY AND ENVIRONMENT BUREAU, MINISTRY OF ECONOMY, TRADE AND INDUSTRY
Japan’s first full-chain CCS Project, the Tomakomai CCS Demonstration Project, displays the safety and reliability of CCS technology for offshore CO2 storage in our earthquake-prone country.
With ever rising expectations toward CCS technology as described in the IEA Special Report on CCUS, we recognise that our mission has reached a new phase.
Against this backdrop, Japan CCS established a consortium which was adopted to conduct the Japanese government's demonstration project of CO2 ship transportation, a crucial technology for achieving the government’s goal of early social implementation of CCUS. Additionally, we also wish to implement the demonstration of carbon recycling technology utilising this CO2 and hydrogen obtained from existing facilities.
Japan CCS is also a proud supporting member, of the 'Asia CCUS Network', inaugurated by the Japanese government in June 2021. This Network provides support for the deployment of CCUS in Asian countries.
We look forward to introducing these new developments in a forthcoming update of the of the Global CCS Institute’s CO2RE Database of Projects.
In October 2020, amid an accelerated trend toward decarbonisation, Japan declared an aim of carbon neutrality by 2050 and is furthering its status as a regional leader in clean energy programs. CCS is a vital technology for the realisation of carbon neutrality and Japan has been implementing efforts for its practical use, such as demonstrating the injection of 300,000 tonnes of CO2 in Tomakomai City and the shipping of CO2 that connects emission sources and storage sites.
In Asia, CCUS will be an essential technology for maintaining strong economic growth while achieving decarbonisation. Recognising this, Japan is playing a key role in promoting regional collaboration, providing opportunities to share technologies, experiences and insights. The recently established ‘Asia CCUS Network (ACN)’ seeks to contribute to the deployment of CCUS in Asia by sharing knowledge, conducting studies and undertaking capacity building.
9 The JCM, an important ‘project-based bilateral offset crediting mechanism’ was launched in 2013 to support emissions reduction projects in developing nations (59).
3.0 REGIONAL OVERVIEWS 3.2 ASIA PACIFIC
“WITH EVER RISING EXPECTATIONS TOWARD CCS TECHNOLOGY AS DESCRIBED IN THE IEA SPECIAL REPORT ON CCUS, WE RECOGNISE THAT OUR MISSION HAS REACHED A NEW PHASE.”
Toshiaki Nakajima
“IN ASIA, CCUS WILL BE AN ESSENTIAL TECHNOLOGY TO MAINTAINING STRONG ECONOMIC GROWTH WHILE ACHIEVING DECARBONISATION.”
Mr. Futoshi Nasuno
3736

EUROPE’s FIRSTLARGE-SCALE DAC‘DREAMCATCHER’CAPTURING 0.5–1 Mtpa
CLIMATE NEUTRALITYLEGALLY BINDING
BY 2050 35
£1bn
NORTHERN LIGHTS STORAGE INCREASE
4INDUSTRIAL CLUSTERS BY 2030
UK GOVT
CCUS INFRASTUCTURE FUND
H2CCS+
BLUE H2 FEATURES PROMINENTLY IN CCS DEPLOYMENT PLANS
The EU made climate neutrality by 2050 a legally binding target, along with reducing 2030 net GHG emissions at least 55 per cent compared to 1990 levels.
There are now 35 projects in development in Europe.
Construction is underway on the Norwegian project, Langskip. The Northern Lights Joint Venture, which will manage the transport and storage facility, is in discussions with potential customers representing 48 Mtpa of CO2 – more than the total current annual storage worldwide.
There are an increasing number of CO₂ removal projects in development across Europe. Blue Hydrogen features prominently.
Plans to build Europe’s first large-scale direct air capture facility in Scotland were unveiled. The Dreamcatcher project will use nearby renewable energy and CCS infrastructure to capture 0.5 – 1 Mt of atmospheric CO2 each year.
The UK Government announced a £1 billion CCUS infrastructure fund.
The UK outlined its intention to establish four CCUS industrial clusters by 2030, capturing 10 Mtpa of CO2.
• In Iceland, there is a project to develop the CODA Terminal, a cross-border carbon transport and storage hub. CO2 shipped to the terminal would be dissolved in water then injected into basaltic bedrock, using the Carbfix mineralisation technique (→ see section 4.7).
HYDROGEN PRODUCTION
Blue hydrogen features prominently in CCS deployment plans across Europe. In the majority of locations, blue hydrogen will be the lowest cost clean hydrogen production option. Low production cost is critical to underpin rapid demand growth for clean hydrogen along with the production capacity to meet that demand (60).
• In March, BP announced plans to develop a major blue hydrogen production facility in Teesside. Using Net Zero Teesside to store associated CO2, the project aims to deliver 20 per cent of the UK’s hydrogen production target by 2030.
• In June, Equinor announced plans to triple capacity at its proposed Hydrogen to Humber facility.
• Following the H2morrow steel feasibility study evaluating the use of blue hydrogen at the Duisberg steel plant, German gas transmission system operator OGE, steel producer Thyssenkrupp, and Equinor announced their ongoing cooperation. Their project’s value chain could be established by 2027, exporting CO2 for storage in Norway or the Netherlands.
POWER STATIONS
Important power projects involving CCS emerged across the UK. These were stimulated by UK Government efforts to establish its dispatchable power agreement, which recognises the importance of thermal generation in supplementing high penetrations of renewables.
• In April, Equinor and SSE Thermal unveiled plans to develop two low-carbon power stations in the Humber region –
− Keadby Hydrogen would be the world’s first major 100 per cent hydrogen-fired power station, with peak demand of 1,800 MW of hydrogen. It would create significant demand for the Hydrogen to Humber CCS facility mentioned above.
− Keadby 3 would be a 900 megawatt (MW) power station fuelled by natural gas, fitted with carbon capture technology and storing CO2 via the Humber facility.
• In May, SSE Thermal and Equinor unveiled plans to co-develop a 900 MW gas-fired power station, fitted with carbon capture technology, at Peterhead. The project will capture up to 1.5 Mtpa, and store CO2 via the Acorn project. (Acorn is a CCS project aiming to reuse infrastructure and enable decarbonisation from a cluster of Scottish emission sources.)
Plans to deploy CCS on power stations are emerging elsewhere in Europe too. For example, as part of Nothern Italy’s Ravenna Hub project, there are plans to capture CO2 from the Ravenna, Mantua and Ferrare combined cycle gas turbine power plants. CCS is also being considered as a way to decarbonise Belgian power stations.
The European Union made climate neutrality by 2050 a legally binding target, along with reducing 2030 net GHG emissions at least 55 per cent, compared to 1990 levels. Its long-term low GHG emission development strategy submitted under the Paris Agreement – and those of 14 countries in the European region – includes CCS as a technology that can help Europe reach its climate goals. While growing recognition of CCS’s role in decarbonisation is strengthening its policy support, more progress is required.
Leading Europe’s ambition, in December 2020, the Norwegian Government took the pioneering decision to move ahead with the Langskip project. Construction is currently underway. CO2 will initially be captured from HeidelbergCement’s Norcem plant in Brevik and, subject to additional funding being obtained, from Fortum Oslo Varme waste to energy (WtE) plant. The Northern Lights Joint Venture, established by Equinor, Shell and Total to manage the associated transport and storage facility, is in discussions with potential customers, representing 48 Mtpa of CO2, more than total current annual storage worldwide.
With the Dutch Government allocating the SDE++ subsidy, Porthos is poised to take an investment decision in early 2022, becoming the first commercial CCS project in an EU member state. Poetically, Alexandre Dumas’s remaining musketeers may join the climate fight shortly. Late Summer TotalEnergies, Shell, EBN and Gasunie announced plans to develop Aramis a major CCS hub in the Netherlands. Proposals are emerging for a project named Dartagnan to develop CO2 infrastructure in the Dunkirk region, enabling export of CO2 to the Netherlands for permanent storage.
The UK government set an ambitious target for a 68 per cent reduction in GHG emissions by the end of 2030. It published a ten-point plan for a green industrial revolution, outlining its intention to establish CCUS in two industrial clusters by the mid 2020s, with four such sites by 2030, capturing in excess of 10 Mtpa of CO2. To enable this, the government also announced a £1 billion CCS infrastructure fund. At the time of writing, the Government is selecting the first clusters to develop, with submissions from DelpHYnus, the East Coast Cluster, Hynet, the Scottish Cluster and V Net Zero all meeting eligibility criteria. It is anticipated that successful clusters will be announced in Quarter 4 2021 and that final investment decisions will be made early 2022.
PROJECTS
There are currently 35 projects in development in Europe and the United Kingdom. Most are using North Sea storage, though there are other regions where CCS is happening:
• ENI’s Ravenna Hub project is likely to become one of the first CCS projects in the Mediterranean region. Now recognised as an Oil & Gas Climate Initiative kickstarter hub, the project will initially decarbonise ENI operations in Ravenna, Northern Italy. It offers the potential to handle emissions for third parties in the region.
• In Greece, Energean are evaluating ways to convert their Prinos asset for CO2 storage and estimate that subsurface volumes could sequester up to 50 million tonnes.
• MOL, a Hungarian integrated oil and gas company, aims to capitalise on experience in carbon capture, gained in Croatia and Hungary, to provide CO2 storage services to third parties.
• Horisont Energi are developing what may become Europe’s first blue ammonia plant, in Finnmark, Northern Norway. Collaborating with Equinor, the facility would store CO2 in the Barents Sea using the Polaris facility. A final investment decision is anticipated late 2022, with operations starting in 2025.
3.0 REGIONAL OVERVIEWS 3.3 EUROPE AND NEARBY REGIONS
3.3 EUROPE AND NEARBY REGIONS
38 39

DR. DOMINIK VON ACHTENCEO, HEIDELBERGCEMENT
HeidelbergCement will be the leader in the global cement industry on its transformation path towards climate neutrality. To support this goal, we rely on a combination of measures – most importantly, the increased use of alternative fuels, alternative secondary cementitious materials including recycled materials, and carbon capture and usage or storage (CCUS). Key for decarbonising our industry is to find, apply and scale technical solutions for carbon capture and utilisation or storage. After having gained valuable experience with CCUS technologies in Norway and other countries such as Canada and the UK, we have recently announced making the next step with the world’s first carbon-neutral cement plant in Sweden. This will be a game changer for our industry and demonstrates our conviction that CCS will contribute to carbon neutrality in a responsible way.
As CCS projects adopt the network model, unit costs and risk are reduced. Many networks in development are examining the inclusion of CO2 shipping to broaden their reach, and there is growing recognition of the role regional ports will play. Major CCS projects such as Antwerp@C, Cinfracap and Aramis are already being developed around major European ports.
CCS’s future looks likely to involve international networks spanning multiple industrial clusters and storage sites.
POLICY
European Union
The EU plans to funnel significant funds through EU banks and markets to achieve its climate ambitions. The EU Taxonomy clarifies which economic activities contribute to climate change mitigation and adaptation. This science-based tool recognises CCS, thereby providing access to European Green Bonds.
In July, the EU’s ‘Fit for 55’ legislative proposals were introduced, outlining changes relevant to CCS. Central to the package were modifications to the EU’s emissions trading scheme (ETS) representing 40 per cent of EU emissions. Changes would:
CO2 REMOVAL
An increasing number of CO2 removal projects are in development across Europe:
• The Stockholm Exergi KVV8 facility is Europe’s largest biomass-based combined heat and power plant. A proposed BECCS project at this facility will remove up to 800,000 tonnes of CO2 from the atmosphere each year.
• In Denmark, Orsted, Microsoft and Aker Carbon Capture are collaborating to examine BECCS deployment at various biomass fired power stations.
• The proposed BECCS project at Drax power station in Yorkshire, the UK’s largest, continues to progress. In June, Drax announced its collaboration with Mitsubishi Heavy Industries to capture CO2 at the plant. Reflecting its importance in national climate strategies, Drax also announced a strategic collaboration with Bechtel, exploring the construction of BECCS plants globally.
• Plans to build Europe’s first large scale DAC facility were unveiled by Storegga and Carbon Engineering, in mid-2021. Scotland-based Dreamcatcher will take advantage of abundant renewable energy and anticipated CCS infrastructure nearby, capturing between 500,000 and one million tonnes of atmospheric CO2 each year.
WASTE TO ENERGY (WtE)
Adding CCS to WtE plants has the potential to make waste a zero or even negative emissions energy source, depending on the origin of the wastes utilised. Recognising this potential, a number of CCS projects involving such plants have emerged across Europe.
• The Amager Resource Center (ARC) in Copenhagen is potentially Denmark’s first CCS project. A pilot funded by the Energiteknologiske Udviklings- og Demonstrationsprogram (Energy Technology Development and Demonstration program) is currently operating. It is hoped that a full-scale facility capturing 500,000 tonnes of CO2 a year will be operational by 2025, making a substantial contribution to Copenhagen’s ambition of becoming the world’s first carbon neutral capital.
• In the UK, SUEZ is developing a modular system to capture CO2 from WtE plants with a demonstration project being considered at its Haverton Hill facility on Teesside.
• Elsewhere in Europe, numerous early-stage studies into CCS on WtE plants are underway. For example in Switzerland, where many of the largest point emission sources are WtE plants, a study looked at applying CCS to the KVA Linth plant.
TRANSPORT AND STORAGE
With a growing appetite for capturing and sequestering CO2, comes increased need for transport and storage infrastructure. Reflecting this, European CO2 storage has rapidly evolved beyond the preserve of the world’s energy supermajors. Harbour Energy, Neptune Energy, MOL and Independent Oil and Gas are just some of the companies publicly expressing interest in using European assets for CO2 storage.
3.0 REGIONAL OVERVIEWS CCS ADVOCATE
PR
ICE
(Eur
o p
er t
onne
CO
2)
2010 20112008 2009 2012 2013 2014 2015 2016 2017 2018 2019 2020 2021
0
5
10
15
20
25
30
35
40
45
50
• increase the annual reduction rate of allowances to achieve the EU’s new 2030 target
• recognise CO2 is transported not only by pipelines, and cover all means of CO2 transport
• double the size of the innovation fund (see below)
• add a new carbon border adjustment mechanism to put a carbon price on imports of targeted products, such as steel and cement, to avoid ‘carbon leakage’.
Negotiations are ongoing, and the legislation should be finalised over the next few years.
In the last year, the allowance price reached an all-time high. With greater national ambition and policy support, plus more awareness of climate risk amongst investors, hard to abate industries throughout Europe are increasingly exploring CCS.
At the time of writing, the first call for projects under the EU’s innovation fund is nearing completion with CCS projects, including Fortum Oslo Varme, reaching final stages. The second call for large-scale projects will be launched in October with a larger budget and a faster single stage application process (see Figure 14). (
FIGURE 13 EU PRICE ALLOWANCES DIAGRAM
“KEY FOR DECARBONISING OUR INDUSTRY IS TO FIND, APPLY AND SCALE TECHNICAL SOLUTIONS FOR CARBON CAPTURE AND UTILISATION OR STORAGE.”
Dr. Dominik von Achten
GRANT AWARD FINANCIAL CLOSE ENTRY INTO OPERATION 3–10YRSANNUAL INSTALMENTSPROJECT MILESTONES
UP TO 60% PAYMENT UP TO 40% PAYMENT Not-depending on verified emissions avoidance Depending on verified emissions avoidance
FEASIBILITYSTUDY FEED CONSTRUCTION REPORTING
PERIOD
FIGURE 14 EU INNOVATION FUND DISBURSEMENTS BASED ON MILESTONES
4140

Norway
The Langskip project had its budget approved by the Storting (Norwegian Parliament) in 2021. The total cost estimate is NOK 25.1 billion (US$2.84 billion), comprised of a NOK 17.1 billion ($US1.93 billion) investment and NOK 8 billion ($US910 million) in operating costs over ten years. The state’s share of costs is estimated to be NOK 16.8 billion ($US1.9 billion).
State aid for the proposed capture plant at the Fortum Oslo Varme WtE plant is limited to a maximum of NOK two billion in investment, and one billion in operating expenses. Sufficient additional funding is needed from the EU and other sources.
Denmark
In February, the Danish Council on Climate Change recommended its government develop a national CCS strategy as soon as possible. Denmark submitted its recovery and resilience plan to the EU in summer. It details a subsidy scheme to support the development and demonstration of CO2 storage sites for Denmark.
Germany
In a landmark case during April, Germany’s highest court ruled the Government’s climate legislation insufficient. Subsequently the Federal Government will make binding a reduction of 55 percent of greenhouse gases by 2030, and net zero by 2045. With its Climate Action Programme 2030 the Federal Government has agreed to the funding program ‘CO2-Vermeidung und -Nutzung in Grundstoffindustrien’ (use and avoidance of CO2 in primary industries). This program supports the use of CCS technologies in industry as well as the more rapid and comprehensive establishment of CCUS process chains.
In 2019 CO2 emissions from industry were 188 Mtpa. The 2030 targets require industrial emissions to drop to 140 Mtpa. Germany is both the largest steel and cement manufacturer in the EU. Industry is increasingly looking to Government for support in the development of infrastructure needed to enable captured CO2 to be exported for storage in the North Sea. Unions recognise not only the importance of CCS in the delivery of a just transition, but that it may become a competitive necessity in a world demanding low carbon products.
Sweden
Sweden has pioneered climate policy developments since the 1980s. In January 2021, the Swedish Government asked the Swedish Energy Agency to develop a support scheme for BECCS for implementation in 2022, either as a reverse auction, or flat subsidy.
UK
The UK government set an ambitious target for a 68 per cent reduction in GHG emissions by the end of 2030. It published a ten-point plan for a green industrial revolution, outlining its intention to establish CCS in two industrial clusters by the mid-2020s, with four such sites by 2030, capturing up to 10 Mtpa of CO2. To enable this, the government also announced a £1 billion CCUS infrastructure fund.
PORTHOS CASE STUDY
The Dutch Government’s Climate agreement – the Klimaatakkoord – outlines the aim to reduce GHG emissions 49 per cent by 2030, and 95 per cent by 2050, from 1990 levels. The Klimaatakkoord sets sector specific targets, including a required reduction from Dutch industry of 14.3 Mtpa by 2030. The Klimaatakkoord, and associated policy, allows up to 7.2 Mtpa to be mitigated through CCS.
The Port of Rotterdam, Europe’s biggest, is working with business and government to deliver important decarbonisation initiatives. The Port of Rotterdam CO2 transport hub and offshore storage project, Porthos, is expected to be the first large scale CCS project in an EU member state. A partnership between the Port of Rotterdam, Gasunie and EBN, Porthos is ideally located to:
• capture CO2 from industry in the port
• transport it via pipeline
• store it deep underground in depleted offshore gas reservoirs.
Porthos received a major boost during June when the Dutch Government confirmed allocation of the SDE++ subsidy. Competitively awarded, SDE++ is funded by a surcharge on energy consumption and bridges the gap between the cost of EU ETS allowances and decarbonisation technologies. Porthos’ initial emission sources – facilities operated by Shell, ExxonMobil, Air Liquide and Air Products – received SDE++.
Notably in the first call the successful CCS projects, all associated with Porthos, represented the lowest cost means of decarbonisation. These subsidies, valued at around €2.123 billion and granted over a 15 year period, will enable storage of 2.34 Mtpa,10 the equivalent of €60 a tonne. CCS projects represented around 40 per cent of the overall SDE++ budget, but 70 per cent of CO2 reductions enabled through the subsidies.
There are a number of factors likely to further enhance the value of the Porthos project:
• proposed onshore infrastructure has been oversized and is capable of handling 10 Mtpa. The CO2TransPorts, an EU common interest project, is working on how best to connect Porthos to the North Sea Port and Port of Antwerp where the Carbon Connect Delta and Antwerp@C consortiums are developing local industrial carbon capture clusters
• with hydrogen set to play a key role in decarbonising the Netherlands (and more broadly Europe), there are plans to build an open access hydrogen pipeline through the port area – projects like H-Vision will position Rotterdam as a key European hydrogen hub
• as EU emissions allowances get more expensive, the SDE++ scheme’s contribution will reduce – at the same time, demand to store CO2 is expected to rise.
With the business case for the Porthos project established, efforts are focused on finalising permits so a final investment decision can be made in early 2022. Construction will begin shortly thereafter with operation anticipated in 2024.
FIGURE 15 PORTHOS MAP
PLATFORMP18-A
COMPRESSORSTATIONAZIEWEG
GAS FIELDP 18-6
GAS FIELDP 18-2
‘s-Gravenhage
GAS FIELDP 18-4
3.0 REGIONAL OVERVIEWS 3.3 EUROPE AND NEARBY REGIONS
The cluster sequencing process and further guidance regarding business models were published in May. Phase one of the cluster sequencing process will identify and sequence CCUS clusters, suited to deployment in the mid-2020s. These will have the first opportunity to negotiate support from the government’s CCUS program, including the £1 billion Infrastructure fund. Final investment decisions are anticipated in early 2022. A sophisticated set of complementary CCS business models has been developed. Transport and storage will be enabled through a regulated scheme. Separate models have been outlined for the reward of capturing CO2 from power, the dispatchable power agreement and industrial carbon capture, taking into account the unique characteristics of each.
EUROPEAN REGULATORY DEVELOPMENTS
CCS-specific amendments to the 1996 London Protocol, an international marine agreement that governs the dumping of waste in the marine environment, have been important in developing wider legal and regulatory support for the technology. The original amendment to the Protocol, agreed by the Parties in 2006, removed a significant international barrier to deployment and provided one of the first examples of a regulatory regime for CO2 storage.
Another amendment in 2009 – to address the ban on transboundary movement of CO2 for geological storage – resulted in a stalemate, with an insufficient number of Parties to enable it into force. However, at the fourteenth Meeting of Contracting Parties in October 2019, agreement was reached and provisional application allowed. While this agreement effectively enables proponents wishing to transport CO2 across international boundaries to proceed, there are further issues to consider:
• a declaration of provisional application and notification of any arrangements or agreements, must be provided to the International Maritime Organisation (IMO)
• standards prescribed by the Protocol must be met
• the focus for projects that include a transboundary element, will inevitably shift back to national implementation. National regulators and policymakers will be required to support projects by putting in-place necessary agreements and notifying the IMO.
Expediting this process, particularly in jurisdictions where projects are in the advanced stages, such as Europe, will now be a near-term priority.
10 Source: https://www.rijksoverheid.nl/documenten/kamerstukken/ 2021/06/08/kamerbrief-voorlopige-resultaten-sde-2020-en- voortgang-sde-2021.
NEARBY REGIONS
Russia
Driven by a handful of companies, CCS is a growing part of energy discussions in Russia:
• Early in the year, Novatek indicated plans to capture carbon at its Yamal LNG facilities.
• During June, Novatek and Russian steelmaker PAO Severstal announced the signing of a memorandum of co-operation to develop alternative energy and GHG emissions reduction technologies. The parties will consider a joint pilot project to produce blue hydrogen from natural gas, using CCS.
• In June, Russian Energy giant Gazprom Neft established an agreement with Shell to explore the possibility of deploying CCS at their joint ventures in Russia. Gazprom Neft also indicated the companies will discuss using CCS in blue hydrogen production.
Africa
Many African countries face the challenging task of balancing increased energy access with decarbonisation and economic growth. Carbon capture has been slow to progress, but there are signs of projects emerging. For example, a project is currently being studied by ENI in Libya. Growing expectations of a global market for low carbon hydrogen are driving interest in blue hydrogen from oil and gas producing countries like Mozambique, Angola and Nigeria. Such countries are hopeful that the resources their economies depend on can be used for blue hydrogen production and thereby avoid becoming stranded assets as the world shifts to low carbon pathways.
42 43

PROJECTS
CCS project activity is spread across Qatar, Saudi Arabia and the UAE – more specifically in Abu Dhabi. Around 3.7 Mtpa of CO2 is captured at three CCS facilities:
• Qatar Gas captures 2.1 Mtpa of CO2 from the Ras Laffan gas liquefaction plant.
• Saudi Aramco captures 0.8 Mtpa of CO2 at its Hawiyah Naturals Gas Liquids plant. The CO2 is used to demonstrate the viability of EOR at the Uthmaniyah oil field.
• In Phase I (of at least three phases) of ADNOC’s Al Reyadah project, 0.8 Mtpa of CO2 is captured at the Emirates Steel plant in Abu Dhabi.
Both the Ras Laffan and Al Reyadah projects are already developing expansion plans:
• Qatar Gas expects to expand its capture rate to 5 Mtpa by 2025.
• ADNOC estimates that Phase II of Al Reyadah could see capture of another 2.3 Mtpa of CO2 by 2025 and Phase III could add a further 2 Mtpa of CO2 from the Habshan and Bab gas processing facility by 2030.
Even without further CCS activity, these projects could raise overall regional CO2 capture to almost 10 Mtpa by 2030.
There are two regional CO2 utilisation facilities where permanence of storage is not assured:
• Saudi Basic Industries Corporation captures 0.5 Mtpa of CO2 at its Jubail ethylene facility for use in methanol and urea production
• Qatar Fuel Additive Company captures 0.2 Mtpa of CO2 at its methanol refinery.
It is widely anticipated that planned new coal generation plants in Oman and the UAE be built with CCS to complement NDC ambitions. This could add another 5–10 Mtpa to the regional CO2 capture rate, taking it to 15–20 Mtpa even before any heavy industry CCS plans are added.
The significance of the GCC region in the context of CCS deployment is often overlooked, both in terms of current scale and short-term prospects. Three existing CCS facilities in the United Arab Emirates (UAE) and Saudi Arabia already account for around 10 per cent of global CO2 captured each year.11 Europe accounts for just four per cent.12 The GCC region is poised for a significant take-off in CCS activity over the next decade. Pressure for that growth arises from several sources:
• intensifying global decarbonisation commitments codified in the Nationally Determined Contribution (NDC) Registry maintained by the United Nations Framework Convention on Climate Change13
• increasing regional action on climate change includes material increases in the contribution of renewables and CCS, especially for fossil fuel generation to domestic energy sectors
• demand for CO2 for use in local EOR operations forecast to grow at least fivefold to 203014
• a desire by both Saudi Aramco and ADNOC to continue reducing their carbon footprint for oil and gas production – already the lowest in the world15
• supporting growth in the production, and export, of low-carbon hydrogen by partnering natural gas reformation processes with CCS
• building a broad base of ‘clean and competitive’ heavy industry to underpin industrial diversification plans
• recent G20 endorsement16 of Saudi Arabia’s promotion of the Circular Carbon Economy – it provides a central role for CCS – as developed by King Abdullah Petroleum Studies and Research Center.
The concentration of CO2 emission sources in the GCC region is also conducive to CCS. As Figure 16 shows, more of 2025’s estimated CO2 emissions will come from power generation, rather than oil and gas operations, in four of five countries. As well as reducing the number of CCS facilities needed to decarbonise industry, the geographical concentration of major emitters along the Gulf coast could support the building of CO2 infrastructure networks, reducing overall costs and providing incentives for new CCS projects. (F17)
3.0 REGIONAL OVERVIEWS 3.4 GULF COOPERATION COUNCIL (GCC) STATES
11 Regional 3.7 Mtpa share of global 40 Mtpa of CO2 captured in 2020 (Global CCS Institute, 2020).12 Regional 1.7 Mtpa share of global 40 Mtpa of CO2 captured in 2020 (Global CCS Institute, 2020).13 See for example the revised UAE submission (UAE, 2020) to reduce its 2030 emissions by 23.5 per cent.14 Based on ADNOC-only projection of six-fold increase in EOR CO2 demand by 2030 (S&P Global Platts, 2020a).15 See for example the 2020 S&P Global analysis of oil products’ carbon footprints (S&P Global Platts, 2020b).16 As reported in November 2020 (Chatham House, 2020).
3.4 GULF COOPERATION COUNCIL (GCC) STATES
R
ECYCLE
REUSE
REM
OVE REDUCE
10%
60 GCC STATES
UP TO
*Mtpa BY 2035
CIRCULAR CARBON ECONOMY
GCC STATES POISED FOR SIGNIFICANT CCS ACTIVITY
Three facilities in the United Arab Emirates and Saudi Arabia already account for 10% of global CO2 captured each year, about 3.7 Mtpa.
The GCC region is poised for a significant take-o� in CCS activity over the next decade.
If e�orts to deploy CCS intensify as trends suggest, CO2 capture might reach 60 Mtpa by 2035 across the GCC region.
*Projection only
In late 2020, the leaders of the G20 endorsed the concept of the ‘circular carbon economy’ developed by Saudi Arabia’s King Abdullah Petroleum Studies and Research Center, which recognises and values all forms of CO2 mitigation.
BAHRAIN KUWAIT OMAN QATAR SAUDI ARABIA UAE
Gas-based power generation 13.3 31.1 12.3 20.7 169.8 38.0
Oil-based power generation 12.1 0.2 44.9
Coal-based power generation 7.7 15.4
All other industry 1.2 9.9 17.4 13.4 68.9 12.0
FIGURE 16 ESTIMATED LARGE-POINT CO2 EMISSION SOURCES IN 2025, ANNUAL MILLION TONNES OF CO2SOURCE: Qamar Energy, Global CCS Institute webcast, 23 Feb 2021
44 45
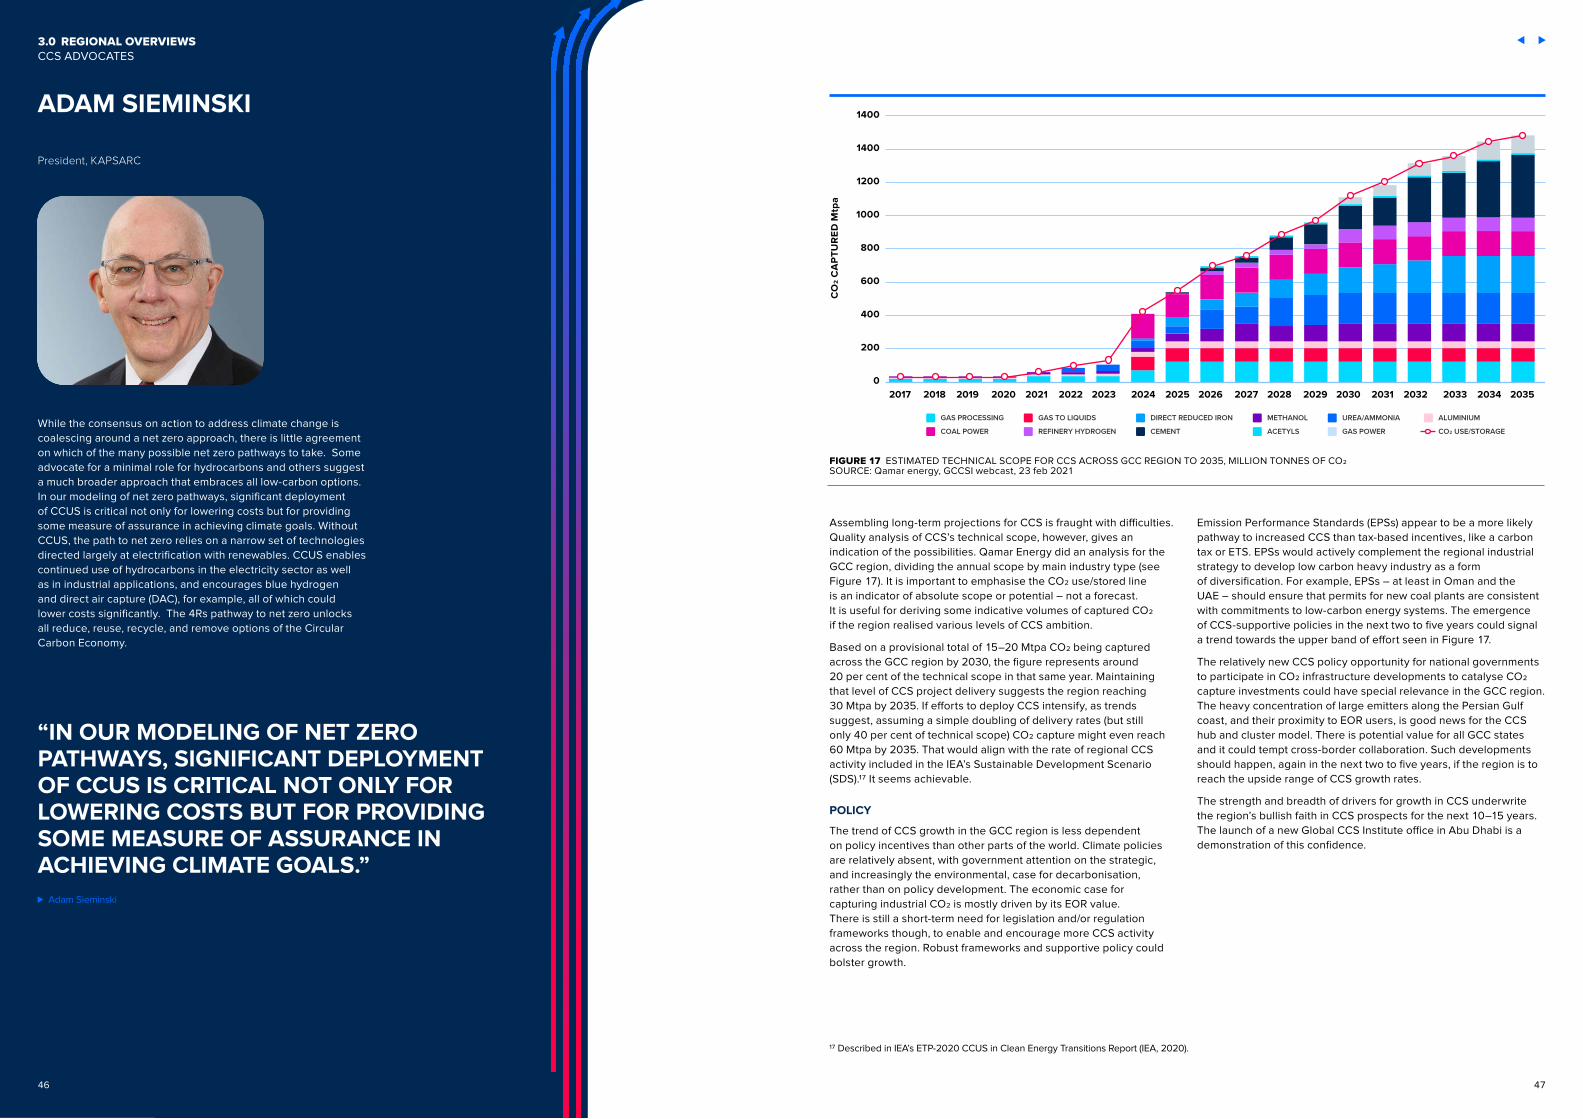
3.0 REGIONAL OVERVIEWS CCS ADVOCATES
Assembling long-term projections for CCS is fraught with difficulties. Quality analysis of CCS’s technical scope, however, gives an indication of the possibilities. Qamar Energy did an analysis for the GCC region, dividing the annual scope by main industry type (see Figure 17). It is important to emphasise the CO2 use/stored line is an indicator of absolute scope or potential – not a forecast. It is useful for deriving some indicative volumes of captured CO2 if the region realised various levels of CCS ambition. (F18)
Based on a provisional total of 15–20 Mtpa CO2 being captured across the GCC region by 2030, the figure represents around 20 per cent of the technical scope in that same year. Maintaining that level of CCS project delivery suggests the region reaching 30 Mtpa by 2035. If efforts to deploy CCS intensify, as trends suggest, assuming a simple doubling of delivery rates (but still only 40 per cent of technical scope) CO2 capture might even reach 60 Mtpa by 2035. That would align with the rate of regional CCS activity included in the IEA’s Sustainable Development Scenario (SDS).17 It seems achievable.
POLICY
The trend of CCS growth in the GCC region is less dependent on policy incentives than other parts of the world. Climate policies are relatively absent, with government attention on the strategic, and increasingly the environmental, case for decarbonisation, rather than on policy development. The economic case for capturing industrial CO2 is mostly driven by its EOR value. There is still a short-term need for legislation and/or regulation frameworks though, to enable and encourage more CCS activity across the region. Robust frameworks and supportive policy could bolster growth.
Emission Performance Standards (EPSs) appear to be a more likely pathway to increased CCS than tax-based incentives, like a carbon tax or ETS. EPSs would actively complement the regional industrial strategy to develop low carbon heavy industry as a form of diversification. For example, EPSs – at least in Oman and the UAE – should ensure that permits for new coal plants are consistent with commitments to low-carbon energy systems. The emergence of CCS-supportive policies in the next two to five years could signal a trend towards the upper band of effort seen in Figure 17.
The relatively new CCS policy opportunity for national governments to participate in CO2 infrastructure developments to catalyse CO2 capture investments could have special relevance in the GCC region. The heavy concentration of large emitters along the Persian Gulf coast, and their proximity to EOR users, is good news for the CCS hub and cluster model. There is potential value for all GCC states and it could tempt cross-border collaboration. Such developments should happen, again in the next two to five years, if the region is to reach the upside range of CCS growth rates.
The strength and breadth of drivers for growth in CCS underwrite the region’s bullish faith in CCS prospects for the next 10–15 years. The launch of a new Global CCS Institute office in Abu Dhabi is a demonstration of this confidence.
17 Described in IEA’s ETP-2020 CCUS in Clean Energy Transitions Report (IEA, 2020).
ADAM SIEMINSKI
President, KAPSARC
While the consensus on action to address climate change is coalescing around a net zero approach, there is little agreement on which of the many possible net zero pathways to take. Some advocate for a minimal role for hydrocarbons and others suggest a much broader approach that embraces all low-carbon options. In our modeling of net zero pathways, significant deployment of CCUS is critical not only for lowering costs but for providing some measure of assurance in achieving climate goals. Without CCUS, the path to net zero relies on a narrow set of technologies directed largely at electrification with renewables. CCUS enables continued use of hydrocarbons in the electricity sector as well as in industrial applications, and encourages blue hydrogen and direct air capture (DAC), for example, all of which could lower costs significantly. The 4Rs pathway to net zero unlocks all reduce, reuse, recycle, and remove options of the Circular Carbon Economy.
“IN OUR MODELING OF NET ZERO PATHWAYS, SIGNIFICANT DEPLOYMENT OF CCUS IS CRITICAL NOT ONLY FOR LOWERING COSTS BUT FOR PROVIDING SOME MEASURE OF ASSURANCE IN ACHIEVING CLIMATE GOALS.”
Adam Sieminski
1400
1400
1200
1000
800
600
400
200
02027 2028 2029 2030 2031 2032 2033 2034 203520182017 2019 2020 2021 2022 2023 2024 2025 2026
CO
2 C
AP
TUR
ED
Mtp
a
GAS PROCESSING
COAL POWER
GAS TO LIQUIDS
REFINERY HYDROGEN
DIRECT REDUCED IRON
CEMENT
METHANOL
ACETYLS
UREA/AMMONIA
GAS POWER
ALUMINIUM
CO2 USE/STORAGE
FIGURE 17 ESTIMATED TECHNICAL SCOPE FOR CCS ACROSS GCC REGION TO 2035, MILLION TONNES OF CO2SOURCE: Qamar energy, GCCSI webcast, 23 feb 2021
4746

48
4.0 PATHWAYS IN FOCUS 1.0 INTRODUCTION
2.0 GLOBAL STATUS OF CCS
2.1 CCS, NET ZERO AND ECONOMIC PROSPERITY 102.2 GLOBAL CCS FACILITIES UPDATE AND TRENDS 122.3 INTERNATIONAL POLICY UPDATE 22
3.0 REGIONAL OVERVIEWS
3.1 NORTH AMERICA 263.2 ASIA PACIFIC 323.3 EUROPE AND NEARBY REGIONS 383.4 GULF COOPERATION COUNCIL STATES 44
4.0 PATHWAYS IN FOCUS
4.1 ENVIRONMENTAL, SOCIAL AND GOVERNANCE 504.2 FINANCING CCS 504.3 CCS NETWORKS 534.4 INDUSTRY 544.5 HYDROGEN 554.6 TECHNOLOGY-BASED CO2 REMOVAL 584.7 MINERAL CARBONATION 59
5.0 APPENDICES
5.1 COMMERCIAL CCS FACILITIES AND PROJECTS 625.2 CCS NETWORKS 685.3 CO2 GEOLOGICAL STORAGE 70
6.0 REFERENCES 76
49
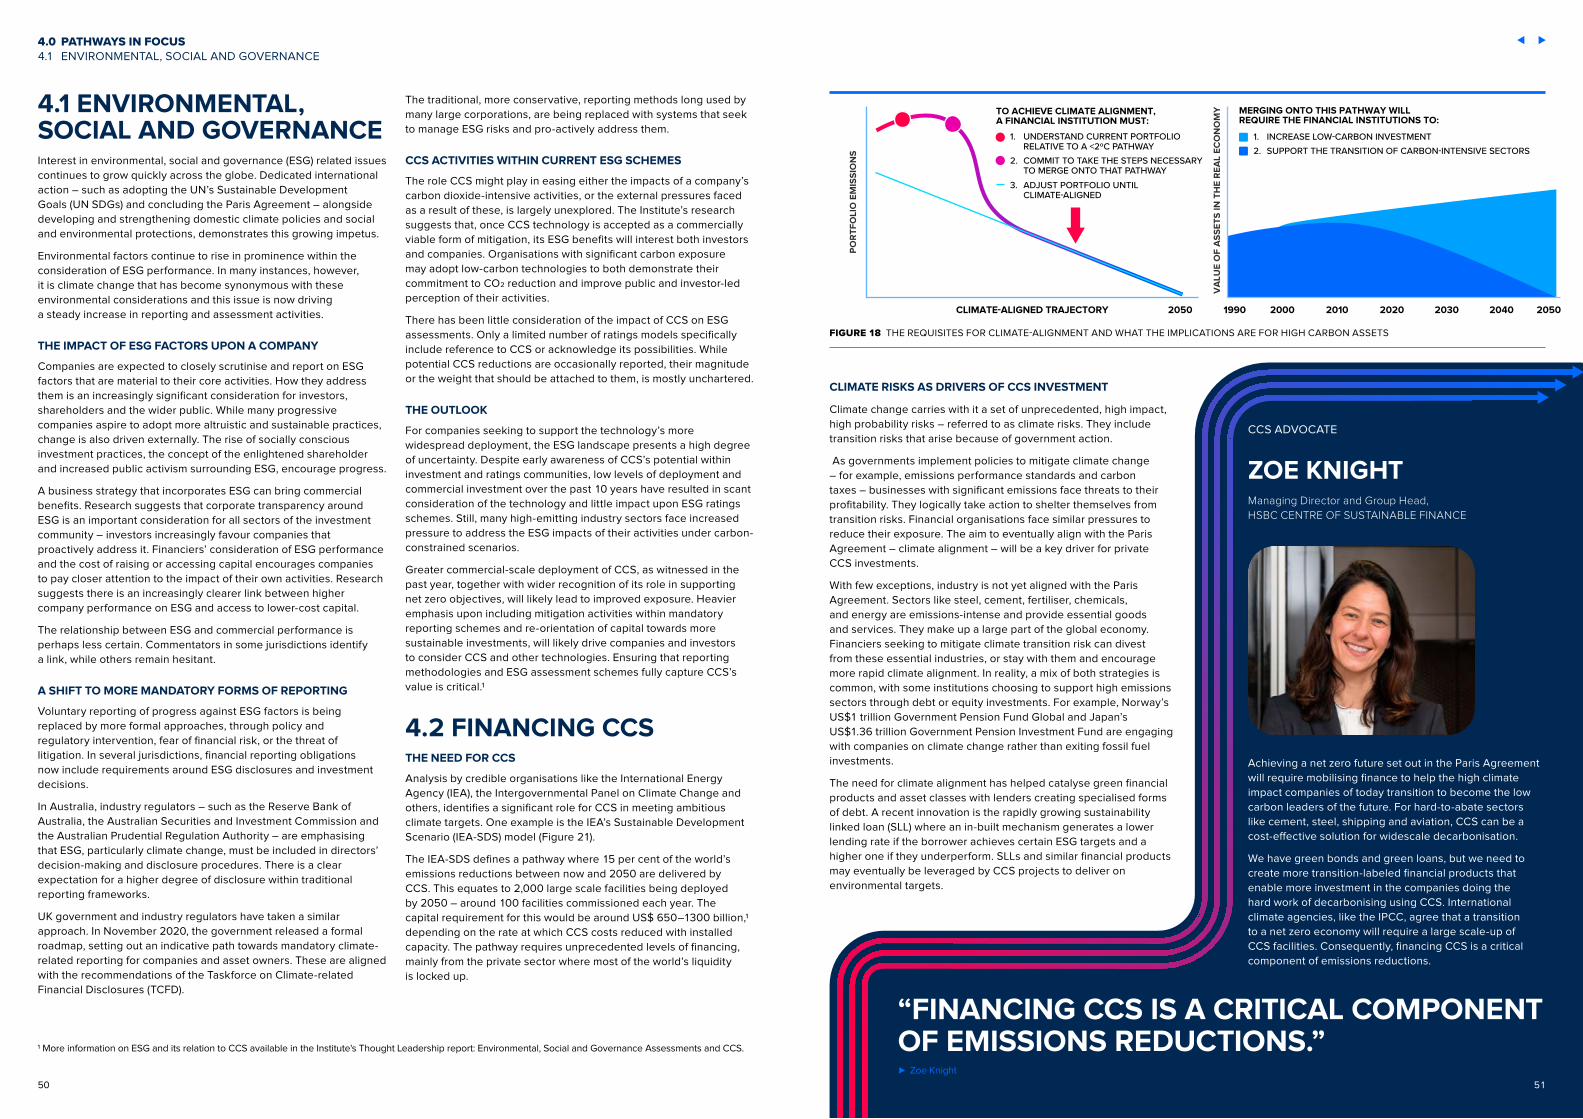
ZOE KNIGHTManaging Director and Group Head, HSBC CENTRE OF SUSTAINABLE FINANCE
Achieving a net zero future set out in the Paris Agreement will require mobilising finance to help the high climate impact companies of today transition to become the low carbon leaders of the future. For hard-to-abate sectors like cement, steel, shipping and aviation, CCS can be a cost-effective solution for widescale decarbonisation.
We have green bonds and green loans, but we need to create more transition-labeled financial products that enable more investment in the companies doing the hard work of decarbonising using CCS. International climate agencies, like the IPCC, agree that a transition to a net zero economy will require a large scale-up of CCS facilities. Consequently, financing CCS is a critical component of emissions reductions.
CCS ADVOCATE
“FINANCING CCS IS A CRITICAL COMPONENT OF EMISSIONS REDUCTIONS.”
4.0 PATHWAYS IN FOCUS 4.1 ENVIRONMENTAL, SOCIAL AND GOVERNANCE
4.1 ENVIRONMENTAL, SOCIAL AND GOVERNANCEInterest in environmental, social and governance (ESG) related issues continues to grow quickly across the globe. Dedicated international action – such as adopting the UN’s Sustainable Development Goals (UN SDGs) and concluding the Paris Agreement – alongside developing and strengthening domestic climate policies and social and environmental protections, demonstrates this growing impetus.
Environmental factors continue to rise in prominence within the consideration of ESG performance. In many instances, however, it is climate change that has become synonymous with these environmental considerations and this issue is now driving a steady increase in reporting and assessment activities.
THE IMPACT OF ESG FACTORS UPON A COMPANY
Companies are expected to closely scrutinise and report on ESG factors that are material to their core activities. How they address them is an increasingly significant consideration for investors, shareholders and the wider public. While many progressive companies aspire to adopt more altruistic and sustainable practices, change is also driven externally. The rise of socially conscious investment practices, the concept of the enlightened shareholder and increased public activism surrounding ESG, encourage progress.
A business strategy that incorporates ESG can bring commercial benefits. Research suggests that corporate transparency around ESG is an important consideration for all sectors of the investment community – investors increasingly favour companies that proactively address it. Financiers’ consideration of ESG performance and the cost of raising or accessing capital encourages companies to pay closer attention to the impact of their own activities. Research suggests there is an increasingly clearer link between higher company performance on ESG and access to lower-cost capital.
The relationship between ESG and commercial performance is perhaps less certain. Commentators in some jurisdictions identify a link, while others remain hesitant.
A SHIFT TO MORE MANDATORY FORMS OF REPORTING
Voluntary reporting of progress against ESG factors is being replaced by more formal approaches, through policy and regulatory intervention, fear of financial risk, or the threat of litigation. In several jurisdictions, financial reporting obligations now include requirements around ESG disclosures and investment decisions.
In Australia, industry regulators – such as the Reserve Bank of Australia, the Australian Securities and Investment Commission and the Australian Prudential Regulation Authority – are emphasising that ESG, particularly climate change, must be included in directors’ decision-making and disclosure procedures. There is a clear expectation for a higher degree of disclosure within traditional reporting frameworks.
UK government and industry regulators have taken a similar approach. In November 2020, the government released a formal roadmap, setting out an indicative path towards mandatory climate-related reporting for companies and asset owners. These are aligned with the recommendations of the Taskforce on Climate-related Financial Disclosures (TCFD).
The traditional, more conservative, reporting methods long used by many large corporations, are being replaced with systems that seek to manage ESG risks and pro-actively address them.
CCS ACTIVITIES WITHIN CURRENT ESG SCHEMES
The role CCS might play in easing either the impacts of a company’s carbon dioxide-intensive activities, or the external pressures faced as a result of these, is largely unexplored. The Institute’s research suggests that, once CCS technology is accepted as a commercially viable form of mitigation, its ESG benefits will interest both investors and companies. Organisations with significant carbon exposure may adopt low-carbon technologies to both demonstrate their commitment to CO2 reduction and improve public and investor-led perception of their activities.
There has been little consideration of the impact of CCS on ESG assessments. Only a limited number of ratings models specifically include reference to CCS or acknowledge its possibilities. While potential CCS reductions are occasionally reported, their magnitude or the weight that should be attached to them, is mostly unchartered.
THE OUTLOOK
For companies seeking to support the technology’s more widespread deployment, the ESG landscape presents a high degree of uncertainty. Despite early awareness of CCS’s potential within investment and ratings communities, low levels of deployment and commercial investment over the past 10 years have resulted in scant consideration of the technology and little impact upon ESG ratings schemes. Still, many high-emitting industry sectors face increased pressure to address the ESG impacts of their activities under carbon-constrained scenarios.
Greater commercial-scale deployment of CCS, as witnessed in the past year, together with wider recognition of its role in supporting net zero objectives, will likely lead to improved exposure. Heavier emphasis upon including mitigation activities within mandatory reporting schemes and re-orientation of capital towards more sustainable investments, will likely drive companies and investors to consider CCS and other technologies. Ensuring that reporting methodologies and ESG assessment schemes fully capture CCS’s value is critical.1
4.2 FINANCING CCSTHE NEED FOR CCS
Analysis by credible organisations like the International Energy Agency (IEA), the Intergovernmental Panel on Climate Change and others, identifies a significant role for CCS in meeting ambitious climate targets. One example is the IEA’s Sustainable Development Scenario (IEA-SDS) model (Figure 21).
The IEA-SDS defines a pathway where 15 per cent of the world’s emissions reductions between now and 2050 are delivered by CCS. This equates to 2,000 large scale facilities being deployed by 2050 – around 100 facilities commissioned each year. The capital requirement for this would be around US$ 650–1300 billion,1 depending on the rate at which CCS costs reduced with installed capacity. The pathway requires unprecedented levels of financing, mainly from the private sector where most of the world’s liquidity is locked up.
CLIMATE RISKS AS DRIVERS OF CCS INVESTMENT
Climate change carries with it a set of unprecedented, high impact, high probability risks – referred to as climate risks. They include transition risks that arise because of government action.
As governments implement policies to mitigate climate change – for example, emissions performance standards and carbon taxes – businesses with significant emissions face threats to their profitability. They logically take action to shelter themselves from transition risks. Financial organisations face similar pressures to reduce their exposure. The aim to eventually align with the Paris Agreement – climate alignment – will be a key driver for private CCS investments. (F21)
With few exceptions, industry is not yet aligned with the Paris Agreement. Sectors like steel, cement, fertiliser, chemicals, and energy are emissions-intense and provide essential goods and services. They make up a large part of the global economy. Financiers seeking to mitigate climate transition risk can divest from these essential industries, or stay with them and encourage more rapid climate alignment. In reality, a mix of both strategies is common, with some institutions choosing to support high emissions sectors through debt or equity investments. For example, Norway’s US$1 trillion Government Pension Fund Global and Japan’s US$1.36 trillion Government Pension Investment Fund are engaging with companies on climate change rather than exiting fossil fuel investments.
The need for climate alignment has helped catalyse green financial products and asset classes with lenders creating specialised forms of debt. A recent innovation is the rapidly growing sustainability linked loan (SLL) where an in-built mechanism generates a lower lending rate if the borrower achieves certain ESG targets and a higher one if they underperform. SLLs and similar financial products may eventually be leveraged by CCS projects to deliver on environmental targets.
1 More information on ESG and its relation to CCS available in the Institute's Thought Leadership report: Environmental, Social and Governance Assessments and CCS.
TO ACHIEVE CLIMATE ALIGNMENT,A FINANCIAL INSTITUTION MUST:
1. UNDERSTAND CURRENT PORTFOLIO RELATIVE TO A <2ºC PATHWAY2. COMMIT TO TAKE THE STEPS NECESSARY TO MERGE ONTO THAT PATHWAY3. ADJUST PORTFOLIO UNTIL CLIMATE-ALIGNED
MERGING ONTO THIS PATHWAY WILLREQUIRE THE FINANCIAL INSTITUTIONS TO:
1. INCREASE LOW-CARBON INVESTMENT2. SUPPORT THE TRANSITION OF CARBON-INTENSIVE SECTORS
CLIMATE-ALIGNED TRAJECTORY 2050 1990 2000 2010 2020 2030 2040 2050
PO
RT
FO
LIO
EM
ISS
ION
S
VA
LUE
OF
AS
SE
TS
IN T
HE
RE
AL
EC
ON
OM
Y
FIGURE 18 THE REQUISITES FOR CLIMATE-ALIGNMENT AND WHAT THE IMPLICATIONS ARE FOR HIGH CARBON ASSETS
Zoe Knight
5150

CCS NETWORKS REDUCE CROSS-CHAIN RISK
The CCS value chain requires a broad range of skills and knowledge. In most cases – natural gas separation being an exception – the CO2 capture plant operator will not have the competencies needed for handling and transporting dense phase gases, or appraising and operating geological storage. Similarly, a host plant operator such as a cement manufacturer, will be unlikely to have expertise in CO2 capture, transport or geological storage. In most cases, a maximum efficiency value chain will involve multiple parties, each specialising in one component. A CCS project requires coordination of multiple investment decisions, all with long lead times.
Once a CCS project is operating, interdependency along value chain actors remains. The storage operator relies upon the capture operator to supply CO2 and vice versa. If any element of the chain fails, the whole chain fails. This creates cross-chain risk. In general, regional colocation of industries and firms creates an industrial ecosystem that benefits all. CCS networks reduce counterparty or cross chain risks by providing capture and storage operators with multiple customers or suppliers.
Cross-border transport networks enable nations lacking good local CO2 storage resources to undertake CCS projects. For example, industrial regions such as Dunkirk, France; Ghent, Belgium; and Gothenberg, Sweden; are planning to aggregate their industrial CO2, then liquefy and ship it for storage in the North Sea, including via Norway’s Northern Lights project. The North Sea offers these countries high quality storage resources with big cost advantages.
4.3 CCS NETWORKSAn emerging trend is the development of CCS networks which aggregate CO2 from multiple sources. Networks offer economies of scale for individual CCS sites, by sharing larger infrastructure for CO2 liquefaction and port facilities, CO2 compression and pipelines. Figure 22 shows indicative pipeline costs in Australia (1). (F23)
After capture, CO2 can be transported as a gas (less than ~74 bar of pressure) or in the dense phase (above 74 bar). Estimated pipeline costs in Figure 22 (including all capital and operational expenditure) show that small flows of CO2 result in very high pipeline costs for each tonne. Once flows exceed ~0.25 Mtpa for the gas phase or around 1.0 Mtpa for the dense phase, most economies of scale have been exploited. Although pipeline costs vary by location, these trends apply everywhere. There is a clear incentive to minimise transport costs by centrally aggregating CO2 streams from multiple smaller capture plants.
Where CO2 shipping is preferable (like in coastal locations with long offshore distances to storage), economies of scale enable lower costs for each tonne of shared CO2 liquefaction infrastructure and for port facilities loading and unloading liquid CO2.
Shared storage facilities also reduce costs. Drilling wells is an expensive process with significant fixed costs that vary only a little, depending on the diameter of the well and the associated CO2 injection capacity. It makes sense to spread investment over larger tonnages of CO2, sharing storage costs across multiple sources.
Shared transport and storage infrastructure makes smaller scale CO2 capture projects (~0.2 Mtpa or smaller) viable. In the United States in 2019, approximately 298 Mtpa of CO2 was produced by 4,931 individual facilities (2) each emitting under 200,000 tonnes of CO2 a year. They represented nearly 16 per cent of US industrial facility emissions. Other parts of the world also have significant volumes of CO2 spread across smaller facilities. Net zero targets require decarbonisation from these facilities and CCS networks can help provide economic, essential infrastructure.
GOVERNMENTS CREATE AN ENABLING ENVIRONMENT FOR CCS INVESTMENTS
Governments have an important role in supporting CCS investments. They can provide direct financial support, such as capital grants, to reduce the commercial debt CCS projects need. Further, they can mandate specialist financiers – such as development banks, multilateral banks and export credit agencies – to support CCS investments. These specialist financiers can provide low-cost loans and insurance to fund the most high-risk components of CCS projects. Figure 20 illustrates a typical project finance structure that can apply to CCS investments.
4.0 PATHWAYS IN FOCUS 4.2 FINANCING CCS
PROJECT FINANCE
From a business perspective, there are barriers to financing CCS projects. CCS projects are perceived as high-risk (driving up the cost of capital) and are capital intensive. Most funding therefore takes place on the balance sheets of large corporations – the corporate finance model. This means CCS investment risks are not reflected in the cost of capital, but lenders have full recourse to corporate assets. Smaller companies and those with constrained balance sheets can’t fund CCS facilities this way. They require project finance, which limits recourse to the one funded project, compounding risks and leading to higher cost debt and higher overall project costs. This can create a funding gap (Figure 19). (F22)
4.0 PATHWAYS IN FOCUS 4.3 CCS NETWORKS
COST OF DEBT
FUN
DIN
G R
AIS
ED
FOR
CC
S P
RO
JEC
T
Risks that are adequately managed will lead to improved terms of lending, including lower lending rates. This allows the project to meet (or surpass) the minimum level of funding required.
Risks that are not adequately managed will drive up lending rates. This reduces the amount of debt that the project can sustain, creating a funding gap.
MINIMUM AMOUNT OF DEBT NEEDED
FUNDING GAP
FIGURE 19 PROJECT RISKS CAN INFLUENCE THE AMOUNT OF DEBT THAT IS MADE AVAILABLE TO CCS PROJECTS, AND IF NOT SUFFICIENTLY WELL MANAGED THIS LEADS TO A FUNDING GAP
GOVERNMENT
FINANCIALCONTRIBUTION
DEBTEQUITYSPECIAL
PURPOSEVEHICLE
DEBTPAYMENTS
VALUE ON CAPTUREAND STORAGE OF CO₂
LENDERS
POLICYMECHANISM
ESCROWAGENT
EG: GRANTS,CONCESSIONAL FINANCE
PARENTCOMPANIES
FIGURE 20 HOW A PROJECT FINANCE STRUCTURE CAN BE USED TO ENABLE CCS INVESTMENT
2040203020202010
10
20
30
40
CURRENT TRENDSSTATED POLICIES
SCENARIO
SUSTAINABLE DEVELOPMENT SCENARIO
Gt C
O2
2050
EFFICIENCY FUEL SWITCH, CCUS & OTHERRENEWABLESINDUSTRIAL ELECTRIC MOTORSBUILDINGSPOWERLIGHT & INDUSTRYCARS & TRUCKSHEAVY INDUSTRYAIR CONDITIONERSAVIATION & SHIPPING
NUCLEARFUEL SWITCH INC. HYDROGENELECTRIC VEHICLESCCUS POWERCCUS INDUSTRYBEHAVIOURAL CHANGERESOURCE EFFICIENCY
WINDSOLAR PVBIOFUELS TRANSPORTOTHER RENEWABLES POWER OTHER RENEWABLES END USESHYDRO
FIGURE 21 THE IEA'S SUSTAINABLE DEVELOPMENT SCENARIO
CO2 FLOWRATE (Mtpa)
0
0.1
0.2
0.3
0.4
0.5
0.6
0.5 1 1.5 2 2.5 3 3.5 4 4.5 5
DENSE PHASE LINESGAS PHASE LINES
CO
ST
OF
PIP
ELIN
E (U
SD
/km
/ton
ne)
FIGURE 22 INDICATIVE COSTS OF CO2 PIPELINES - DENSE PHASE (>74 BAR) AND GAS PHASE
52 53

SIEGFRIED RUSSWURMPresident, The Federation of German Industries (BDI)
CCS ADVOCATE
Carbon Capture, Utilisation and Storage technologies (CCUS) are a crucial element in the decarbonisation of industry. All efforts towards carbon neutrality will only succeed with an open, transparent and unbiased debate on the most effective technologies for avoiding CO2 emissions. The roll-out of renewable energies and the improvement of energy efficiency alone will not be sufficient to meet this challenge.
Especially for abating industrial process emissions, economically viable alternatives to CCUS are not yet available. In view of both energy-intensive industries and the ambitious climate targets in Germany, we need to have a serious discussion about CCUS as an important component of the climate protection toolkit.
CCUS will also be an important stepping stone on the path to net zero-emissions as part of the politically desired development of a hydrogen economy. It is clear that the use of carbon avoidance technologies is inevitably connected with their social and political acceptance. Acceptance requires as a minimum condition, education about facts.
4.5 HYDROGENROLE OF CLEAN HYDROGEN
Clean hydrogen can be produced in three ways:
• from fossil fuels with CCS (blue hydrogen)
• from biomass
• from electrolysers powered by renewable electricity (green hydrogen) or nuclear power
It could deliver multi gigatonnes (Gt) of abatement annually, when used in various industries, transport and stationary energy. The Hydrogen Council estimates that hydrogen demand could exceed 500 Mt by 2050, delivering up to 6 Gt a year of abatement (8). (F24
4.4 INDUSTRYCCS is an essential decarbonisation option for the world’s industrial businesses. Key emissions intensive sectors such as chemicals, iron and steel, and cement are sometimes referred to as ‘hard to abate’. These sectors cannot make their products without producing CO2. Switching to renewable energy or focusing on energy efficiency is unable to solve a substantial fraction of their emissions.
The global cement sector, which emits approximately 4.1 billion tonnes of CO2 each year (3) has a considerable abatement challenge. Although exploring options to substitute fossil fuel use and be more energy efficient, the sector must still contend with CO2 produced by its core calcination reaction. Limestone (CaCO3) is split into calcium oxide (CaO) and CO2. For every tonne of calcium oxide (the primary constituent of cement), 0.785 tonnes of CO2 will be produced, regardless of what fuel or power sources the sector uses. This process CO2 alone represents over 2 billion tonnes a year of CO2 emissions. For this CO2, CCS is an essential option.
Post-combustion style technologies may capture the mixed combustion CO2 and process it. This approach is being developed at HeidelbergCement’s Norcem Brevik plant in Norway, a 0.4 Mtpa capture facility, currently under construction (4). Aker Carbon Capture has been chosen as the Engineer, Procure, Construct contractor and technology provider for this project (5). HeidelbergCement recently announced a larger ‘carbon neutral’ 1.8 Mtpa capture project at the Slite cement plant in Sweden (6). The Slite development would be significant – not only for its scale but also for its intention to create the world’s first carbon neutral cement facility.
An alternative CCS pathway for cement is to separate the calcination CO2 by heating the raw feedstock and keeping it separate from combustion gases. This is seen in the LEILAC 2 demonstration project in Belgium, which incorporates Calix’s new calcination technology. High purity process CO2 is captured as part of the calcination process, ready for compression and transport.
Global iron and steelmaking is another large contributor to global emissions, producing 2.6 billion tonnes of direct CO2 emissions in 2019 (7). Their interest in CCS seems to be growing. With a large and mature fleet installed worldwide, and plants that have lives in excess of 50 years, retrofitting will be a necessary option. There is just one operating CCS plant in the iron and steel sector (Emirates Steel Industries’ Abu Dhabi plant) and one under development (Tata Steel’s Everest project in the Netherlands). The sector’s interest in CCS will need to translate into many more active projects for this industry to meet its decarbonisation goals.
Historically, aluminium smelting has had a large emissions impact through its use of grid electricity. With many aluminium producers now using largely renewable electricity supplies – especially hydropower – focus has turned to the scope 1 (on-site) CO2 emissions.
Aluminium smelting is a very mature electrochemical process in which carbon anodes oxidise when alumina is reduced to aluminium metal, forming CO2. The CO2 is ducted away from the smelting pots with fresh air, forming very dilute CO2 streams. CCS is a challenging solution due to the high capital and operating costs of capturing dilute CO2 but is the best available approach for the world’s large installed smelting fleet.
Newer smelting technologies that don’t use carbon anodes are under development, but it’s unlikely these will be deployed at the scale necessary for the aluminium sector to reach net zero by 2050. They are also unsuitable for retrofitting.
Achieving 6 Gtpa of abatement, requires that demand for, and supply of, clean hydrogen increase. Two factors critical to realising this opportunity, are scale and cost:
• production scale must rise from approximately 1 Mtpa in 2020 to over 500 Mtpa by 2050
• production costs must be low enough to compete with fossil fuels – taking into account the current policy environment – to stimulate demand. (F25)
4.0 PATHWAYS IN FOCUS 4.4 INDUSTRY
4.0 PATHWAYS IN FOCUS 4.5 HYDROGEN
“CARBON CAPTURE, UTILISATION AND STORAGE TECHNOLOGIES (CCUS) ARE A CRUCIAL ELEMENT IN THE DECARBONISATION OF INDUSTRY.”
Siegfried Russwurm
FIGURE 23 EMISSIONS INTENSITY OF HYDROGEN PRODUCTION TECHNOLOGIES
SMRNO CCS
SMR+CCS(90% CAPTURE)
ATR+CCS(94% CAPTURE)
COALGASIFICATION
NO CCS
COALGASIFICATION
+ CCS (98%)CAPTURE
ELECTROLYSIS+ GRID POWER
ELECTROLYSIS+ RENEWABLEELECTRICITY FIRMED BY
GRID POWER
ELECTROLYSIS+ 100%
RENEWABLEELECTRICITY
ATR
EM
ISS
ION
S IN
TE
NS
ITY
OF
H2
PR
OD
UC
TIO
N(k
g C
O2/k
gH
2)
0
5
10
15
20
25
SCOPE 1 EMISSIONS NGCC ELECTRICITY EMISSIONSAssumes emissions intensity of natural gas combined cycle of 400 kgCO2/MWh, 55 kWh/kgH2 for electrolysis; 37 per cent of production from grid firmed electrolysis utilises zero emissions renewable electricity. Electricity required for methane and coal production pathways are full-lifecycle including power used in methane and coal production (9). Fugitive emissions from natural gas and coal production are not explicitly considered and will add to total lifecycle emissions from fossil pathways. Lifecycle emissions from construction and maintenance of renewable generation facilities are also not considered and will add to the emission intensity of those production pathways. SMR= Steam Methane Reformation. ATR = Autothermal Reformation. NGCC = Natural Gas Combined Cycle electricity generation.
H2 PRODUCTION 2020 H2 UTILISATION 2050
CLEAN H2 (FOSSIL ORIGIN WITH CCS OR RENEWABLE POWERED ELECTROLYSIS)
H2 MIXED WITH OTHER GASES (FOSSIL ORIGIN WITHOUT CCSOR CHLOR-ALKALI BI-PRODUCT
PURE H2 (FOSSIL ORIGIN WITHOUT CCS)
POWER GENERATIONTRANSPORTATIONINDUSTRIAL ENERGY
BUILDING HEAT & POWERINDUSTRIAL FEEDSTOCK
0
100
200
300
400
500
MIL
LIO
N T
ON
NES
OF
H2
120Mtpa H2 PRODUCTION 2050 530Mtpa
GREY H2Fossil origin, no CCS: 97%Chlor-alkali bi-product: 2%
CLEAN H2 Fossil origin with CCS orrenewable powered electrolysis: 1%
100% Clean H2(Mixture of Green and Blue H2)
FIGURE 24 HYDROGEN PRODUCTION AND UTILISATION IN 2020 AND 2050
All figures are approximate. 2050 utilisation taken from Hydrogen Council 2017.
54 55

The Asian Renewable Energy Hub (AREH) project in Australia’s remote north-west which, if constructed, will be the world’s largest green hydrogen project, plans to produce 10 Mtpa of ammonia. This requires approximately 1.76 Mtpa of hydrogen, produced by the electrolysis of water and powered by a combined 23 GW of solar PV and wind capacity located on 5,750 square kilometres (km2) of land (14).2
Figure 26 compares resource requirements for renewable hydrogen based on the AREH project, to the same quantity of hydrogen produced from gas or coal with CCS. (F27)
Compared to renewable hydrogen, blue hydrogen production requires modest amounts of land and electricity. For example, producing 1.76 Mt of hydrogen (equivalent to one AREH project) via steam methane reformation (SMR) with CCS would require around 14 km2 of land, assuming a 500 km CO2 pipeline in a 20 m wide corridor, 2 km2 for the plant, and four CO2 injection wells situated over a 2 km2 area.
Production of blue hydrogen also requires access to coal or gas and pore space for the geological storage of CO2. Both the coal and gas industries are mature with well-established supply chains, so accessing coal or gas to support blue hydrogen production in any location would be routine. Global resources for geological storage of CO2 are also more than sufficient for CCS to play its full role in hydrogen production – storage for CCS is ample under any climate mitigation scenario for all applications in all industries. To illustrate, in an extreme hypothetical case where all 530 Mt of clean hydrogen produced in 2050 is blue hydrogen, annual CO2 storage requirements would be just 7.6 billion tonnes.3 This compares to a global storage capacity measured in thousands of billions of tonnes.
COST OF PRODUCTION OF CLEAN HYDROGEN
Production costs for clean hydrogen are not just affected by capital requirements. The price of natural gas affects blue hydrogen costs and the quality of the renewable energy resource (which impacts electricity price and capacity of electrolysers) affects green. Overall, hydrogen produced from coal or gas with CCS is the lowest cost clean hydrogen. It is expected to remain so, except in regions with access to the best renewable resources and lowest-priced renewable electricity. (F28)
In addition to the direct capital and operational costs associated with hydrogen production shown in Figure 28, capital is required for essential off-site infrastructure that supports production:
4.0 PATHWAYS IN FOCUS 4.5 HYDROGEN
FUEL HIGH CAPEX+OPEXFUEL LOW
SMR SMR+CCS CG CG+CCS ELECTROLYSIS SMR SMR+CCS CG CG+CCS ELECTROLYSIS
CURRENT LONG TERM
US
D/k
gH
2
0
1
2
3
4
5
6
7
8
FIGURE 27 CURRENT AND LONG-TERM H2 PRODUCTION COSTS
SMR= Steam Methane Reformation, CG = Coal Gasification, CCS = Carbon Capture and Storage (15).
• For green hydrogen, supporting infrastructure includes constructing renewable electricity generation capacity and where necessary, associated transmission lines.
• For blue hydrogen, supporting infrastructure includes CO2 pipelines and the development of geological storage resources.
The capital cost of essential supporting infrastructure is estimated in Figure 28 for two extreme scenarios – producing 530 Mt of blue or green hydrogen (the potential 2050 demand estimated by the Hydrogen Council). Supporting 530 Mt of green hydrogen would cost over US$8,000 billion, compared to approximately US$300 billion for blue hydrogen. This covers pipelines, electricity generation and distribution (16). (F29)
There are many assumptions built into these cost estimates. While not definitive, they illustrate that the essential infrastructure required to support production of climate-relevant quantities of green hydrogen could cost 20 or 30 times more than the infrastructure required to support production of the same quantity of clean hydrogen using fossil fuels with CCS.
• Clean hydrogen using electrolysers, or coal or gas with CCS, requires similar amounts of water – around 6 kg/kgH2 for gas plus CCS and 9 kg/kgH2 for coal plus CCS or electrolysis (11,12).
• Electrolysis has extremely high electricity demands of 55 kWh/kgH2 (13) compared to 1.91 kWh/kgH2 for gas plus CCS and 3.48 kWh/kgH2 for coal plus CCS – including electricity to produce the gas or coal (9,13).
• Renewable hydrogen requires sufficient land to host the wind and/or solar photovoltaic (PV) generation capacity.
• Fossil hydrogen with CCS requires land for CO2 pipelines and injection infrastructure. It also needs coal or gas, and pore space for the geological storage of CO2.
SCALING UP PRODUCTION OF CLEAN HYDROGEN
Blue hydrogen is very well positioned for rapid scale-up, having been produced in commercial quantities (hundreds to over 1,000 tonnes every day in each facility) since 1982. In comparison, the world’s largest electrolysis hydrogen production facility, powered by wind or solar energy at Fukushima, Japan, can produce – assuming sufficient battery storage – around 2.4 tonnes a day of green hydrogen.
There are currently seven commercial facilities producing blue hydrogen. Their total combined production capacity is 1.3 to 1.5 Mtpa, depending on assumed availability. (F26)
To rapidly scale up clean hydrogen production, certain resources are essential. The best clean hydrogen production method in a specific location is determined by available land, water, electricity, coal, gas and pore space for CO2 storage:
FACILITY
H2 PRODUCTION CAPACITY (tonnes per day)
H2 PRODUCTION PROCESS
H2 USE
OPERATIONAL COMMENCEMENT
Enid Fertiliser 200 (in syngas) Methane reformation Fertiliser production 1982
Great Plains Synfuel 1,300 (in syngas) Coal gasification Synthetic natural gas production 2000
Air Products 500 Methane reformation Petroleum refining 2013
Coffeyville 200 Petroleum coke gasification Fertiliser production 2013
Quest 900 Methane reformation Bitumen upgrading (synthetic oil production) 2015
ACTL Sturgeon 240 Asphaltene residue gasification Bitumen upgrading (synthetic oil production) 2020
ACTL Nutrien 800 Methane reformation Fertiliser production 2020
FIGURE 25 HYDROGEN PRODUCTION CAPACITY WITH CCS (10)
2 Total project area is 6,500 km2, including an additional 3 GW of wind and solar PV capacity that will produce electricity for export. 3 Assumes a 50:50 mix of blue hydrogen production from coal gasification with CCS, and SMR with CCS.
0
25,000,000
50,000,000
75,000,000
100,000,000
CG+CCS SMR+CCS ELECTROLYSIS (AREH PROJECT)
WATER (M3) ELECTRICITY (MWh) COAL (tonnes) CH4 (tonnes)
15,882,353
17 (CG+CCS) 14 (SMR+CCS)
5,750
6,141,176 3,370,588
97,058,824
13,411,7656,529,412
38
13
15,882,353
5,750
11,117,647
0 (Electrolysis)00
2000
4000
6000
10
20
30
40
CO
2 C
AP
TUR
ED
RE
QU
IRIN
GS
TOR
AG
E (M
t)
LAN
D A
RE
AR
EQ
UIR
EM
EN
T (k
m2)
FIGURE 26 RESOURCES REQUIRED FOR THE PRODUCTION OF 1.76 Mt OF H2 FROM COAL OR GAS WITH CCS AND ELECTROLYSIS POWERED BY RENEWABLE ELECTRICITY
Land requirements for the electrolysis pathway is taken from the AREH Project website. It assumes a combined 48 per cent capacity factor for wind and solar PV and 55 kWh/kg of H2 via electrolysis (13). Nine kg water is required for each kg of H2 for electrolysis (13). Electricity requirement for CG+CCS (3.48 kWh/kgH2) and SMR + CCS (1.91 kWh/kgH2) includes electricity used in the production of the coal or gas (9). 6.3 kg of water required per kg of H2 for SMR with CCS (12). Nine kg water required for each kg of H2 for coal gasification with CCS (11). Land requirement for CG+CCS and SMR+CCS assumes 500 km CO2 pipeline in a 20 m wide corridor, 2 km2 for the plant and 10 injection wells over 5 km2 for CG+CCS, and 4 injection wells over 2 km2 for SMR+CCS. CO2 captured requiring geological storage for each kg of H2 is 21.5 kg for CG+CCS and 7.2 kg for SMR+CCS. SMR = Steam Methane Reformation. CG = Coal Gasification.
CO2 PIPELINESCO2 STORAGE RESOURCEDEVELOPMENT
RENEWABLE GENERATIONELECTRICITY TRANSMISSION
BLUEHYDROGEN
GREENHYDROGEN
CA
PIT
AL
CO
ST
OF
ES
SE
NTI
AL
INFR
AS
TRU
CTU
RE
TO S
UP
PO
RT
PR
OD
UC
TIO
N O
F 5
30
Mt O
FC
LEA
N H
2 (U
SD
BIL
LIO
N)
0
1000
2000
3000
4000
5000
6000
7000
8000
9000
53243
2,237
6,116
FIGURE 28 CAPITAL COST OF ESSENTIAL INFRASTRUCTURE TO SUPPORT PRODUCTION OF 530 Mt OF BLUE HYDROGEN OR GREEN HYDROGEN
Green H2 costs and CO2 pipeline costs from CO2 storage resource development costs assume 530 storage resources, each costing US$100 million for exploration, appraisal and development. (16)
56 57

Net zero scenarios vary in how they foresee the role of CDR. The scale of needed removal depends on the steepness of the emissions reduction curve and the estimated amount of residual emissions from hard-to-abate sectors. Estimates range from needing to remove a few to double-digit gigatonnes of CO2 a year by mid-century. This uncertainty around CDR targets is another element making policy design arduous.
If appropriate incentives for technology-based CDR are to be in place for the early 2030s and beyond, work should already be well underway. CDR needs to deliver an increasing amount of climate mitigation action over the coming decades and once net zero targets are reached, will become the main driver of climate ambition (18).
Interest in technology-based CDR has substantially increased in voluntary carbon markets, as discussed in section 2.3.
4.7 MINERAL CARBONATIONMineral carbonation is a geological process in which CO2 reacts with rocks to form stable mineral products known as carbonates (19). Basalts are prevalent globally (20) and have favourable morphology and mineralogy for mineral carbonation storage. These and many other CO2 reactive rocks are conveniently located in regions where conventional CO2 storage (for example, depleted oil and gas fields) is generally absent.
Mineral carbonation is currently employed for carbon storage in two different ways:
• Exposing mafic or ultramafic rocks (those rich in calcium, magnesium, and iron, such as basalt) to the atmosphere, or CO2-saturated air, can result in mineral carbonation. This process has been used to remediate mining waste and produce construction materials. For example, CO2-rich flue gas has been injected into processed kimberlite mine waste above ground (known as ex situ) during field trials at a Canadian mine (21).
• CO2 is dissolved in water and then pumped, via injection wells, into porous and permeable subsurface basalt formations – Carbfix’s model. (See 4.6 DACCS). The Carbfix CCS Facility in Iceland has been storing CO2 using mineral carbonation at small scale since 2014. The project permanently stores CO2 in basalt rock formed by volcanic flows. Around 25 tonnes of water is required for each tonne of CO2. The Carbfix project is injecting 12,000 tonnes annually into shallow basalts (400–800 m depth) through 12 wells. Analysis from their pilot phase shows more than 95 per cent of CO2 was mineralised within two years (22). New research has demonstrated this water-intensive process may also be achieved with seawater – an abundant resource (23). A version of this method was applied in 2013 at the Wallula pilot project in the US state of Washington (24). Here, 1,000 tonnes of supercritical CO2 was directly injected into porous and permeable basalt – without using water as the carrier fluid. Mineralisation rates were also rapid, with 60 per cent of the injected CO2 mineralising within two years (24).
The storage potential of mineral carbonation has been estimated at 100,000–250,000 GtCO2 (22). This number incorporates all basaltic rocks, which comprise 70 per cent of the world’s ocean basins and five per cent of the Earth‘s continents (22). The potential for carbon storage via mineral carbonation is significant but, like all forms of CO2 storage, additional operational projects-at-scale are required to support its use.
Bioethanol is an excellent, low-cost opportunity for BECCS. High purity CO2 from fermentation requires only dehydration and compression before going to storage. As this CO2 recently came from the atmosphere, its capture and storage results in negative emissions. The US Summit Carbon Solutions bioethanol CO2 network project will transport CO2 from 31 individual bioethanol plants, offering economical shared transport and storage. With a capacity of just under 8 Mtpa, it will be the world’s single largest BECCS network.
The waste to energy (WtE) sector is another prime opportunity for negative emissions. WtE plants typically combust sorted municipal solid waste. With a fuel that typically contains over 50 per cent biomass (such as food scraps and green waste), a plant that captures greater than the non-biogenic fraction of CO2 will result in negative emissions. One advanced project is Fortum Oslo Varme CCS at their WtE plant in Klemetsrud, Norway. This is planned to capture 0.4 Mtpa of CO2, helping significantly lower emissions from the city of Oslo. Storage will be in the Northern Lights project (part of the Langskip network) west of Norway in the North Sea.
Biomass power generation is another opportunity for BECCS. The formerly coal-fired Drax power station in England has been converted to use processed biomass fuel. In June 2021, Drax signed a deal with Mitsubishi Heavy Industries to use their KS-21 capture technology. With a capacity of 4.3 Mtpa, this will be the world’s single largest bioenergy capture plant.
DACCS
Direct air capture projects are in an earlier stage of development. They involve direct removal of CO2 from the atmosphere, without photosynthesis. Atmospheric CO2 is very dilute and much harder to capture than industrial CO2. Comparatively large volumes of air must be handled for each tonne captured. Larger capture equipment is needed, so projects cost more than industrial CCS applications with the same capacity. The thermodynamics of gas separation means the more dilute CO2 also requires more energy to capture it.
DACCS projects are under development around the world:
• DAC technology firm Carbon Engineering, in collaboration with Oxy Low Carbon Ventures, are developing a 1 Mtpa project in the Permian Basin in Texas, US. With the DAC advantage of flexible location, this project is positioned adjacent to existing CO2 transport and storage infrastructure.
• Swiss company Climeworks, in collaboration with geological storage company Carbfix, is constructing its commercial-scale Orca DACCS project in Iceland (17). Iceland offers low-cost renewable energy to power the capture. The Carbfix storage approach is also low cost compared to other locations – water flowing from an existing geothermal power plant will dissolve CO2 before it is injected into a basalt formation underground. Mineral carbonation will transform the CO2 into a solid for permanent storage.
POLICY DEVELOPMENTS
Policies to incentivise technology-based CDR are yet to emerge for several reasons. With a large number of net zero targets now in place, the more difficult task of translating them into meaningful policies that lead to emissions reductions and CDR is just commencing. There is concern among policymakers that if emissions reductions are not prioritised, CDR could be used to delay climate action. EU Climate Law recently sought to tackle this by introducing a cap on the contribution of net removals to the EU’s 2030 climate target.
Two main classes of NETs exist: those based on photosynthesis (biomass energy with CCS – BECCS) and direct removal of CO2 from the atmosphere (Direct Air CO2 Capture and Storage – DACCS).
In order to meet global net zero targets, a large fraction of mitigation projects will be about reducing emissions from existing sources. However, some emissions will still be released into the atmosphere, even if the emissions rates are much smaller than today. For a true net zero outcome, NETs will be essential to balance out residual, positive emissions. NETs will also be required well beyond net zero, to further draw down atmospheric CO2 over the long term, reducing the impacts of climate change.
Unlike forestry-based CO2 removal projects, BECCS and DACCS can provide long term security for stored CO2, with no vulnerability to weather, fire, pests and disease. DACCS offers scalability and is not limited by the availability of arable land. Natural solutions will play an essential role in our response to climate change, but are unlikely by themselves to sufficiently deliver the negative emissions the world needs to meet net zero targets.
BECCS
BECCS projects leverage photosynthesis to capture CO2 and store it in biomass. This biomass is used for energy – to create biofuels or via direct combustion. The CO2 produced is captured and stored in the subsurface.
NEW INVESTMENT
The opportunity for clean hydrogen to offer a decarbonised alternative in industry, stationary energy and transport has supported a wave of new project announcements. At 30 September 2021, the Institute’s CO2RE Database included eighteen, either producing blue hydrogen for sale to third parties or for use in production of ammonia, fertiliser and electricity. Total capacity is uncertain, but considering information in the public domain, it is likely to exceed two million tonnes of hydrogen each year.4 (F30)
There are certainly more blue hydrogen facilities in development than those listed. They will be added as they become sufficiently advanced and defined. However, even with this recent increase in project activity, clean hydrogen production capacity must speed up. Faster growth is needed over the next three decades to support achievement of net zero emissions targets. Both blue and green hydrogen are essential in the net zero emissions economy of the future.
4.6 TECHNOLOGY- BASED CO2 REMOVALIn contrast to most CO2 abatement technologies that reduce emissions from point sources, negative emissions technologies (NETs) withdraw CO2 from the atmosphere and securely store it.
4.0 PATHWAYS IN FOCUS 4.5 HYDROGEN
4 Twelve of the 18 facilities have reported their CO2 capture capacity, which sums to 14.6 Mtpa. Assuming 7.6 kg of CO2 is captured for every kg of H2 produced – approximately equivalent to 90 per cent CO2 capture from hydrogen production using SMR – these 12 facilities will have a combined hydrogen production capacity of 1.9 Mtpa. If the remaining six facilities have an average production capacity of 100,000 tpa of H2, total production capacity would be 2.5 Mtpa.
FACILITY COUNTRYANNOUNCED OPERATIONAL COMMENCEMENT
Wabash Valley Resources Hydrogen Plant United States 2022
Air Liquide Refinery Rotterdam Netherlands 2024
Project Pouakai Hydrogen Production New Zealand 2024
Shell Refinery Rotterdam Netherlands 2024
ExxonMobil Benelux Refinery Netherlands 2024
Air Products Refinery Rotterdam Netherlands 2024
Acorn Hydrogen United Kingdom 2025
Clean Energy Systems Carbon Negative Energy Plant - Central Valley United States 2025
Preem Refinery Sweden 2025
Barents Blue Clean Ammonia with CCS Norway 2025
Northern Gas Network H21 United Kingdom 2026
Ravenna Hub - ENI Hydrogen Italy 2026
Hydrogen to Humber Saltend United Kingdom 2026–2027
HyNet North West United Kingdom Mid 2020s
Polaris CCS Project Canada Mid 2020s
Net Zero Teesside - BP H2Teesside United Kingdom 2027
Humber Zero - Phillips 66 Humber Refinery United Kingdom 2028
PAU Central Sulawesi Clean Ammonia with CCS Indonesia Late 2020s
FIGURE 29 BLUE HYDROGEN PRODUCTION FACILITIES IN DEVELOPMENT AS OF JUNE 2021
Excludes facilities that are operating or in construction. Includes facilities where blue hydrogen is an interim product or a final product.
58 59

60
5.0 APPENDICES
1.0 INTRODUCTION
2.0 GLOBAL STATUS OF CCS
2.1 CCS, NET ZERO AND ECONOMIC PROSPERITY 102.2 GLOBAL CCS FACILITIES UPDATE AND TRENDS 122.3 INTERNATIONAL POLICY UPDATE 22
3.0 REGIONAL OVERVIEWS
3.1 NORTH AMERICA 263.2 ASIA PACIFIC 323.3 EUROPE AND NEARBY REGIONS 383.4 GULF COOPERATION COUNCIL STATES 44
4.0 PATHWAYS IN FOCUS
4.1 ENVIRONMENTAL, SOCIAL AND GOVERNANCE 504.2 FINANCING CCS 504.3 CCS NETWORKS 534.4 INDUSTRY 544.5 HYDROGEN 554.6 TECHNOLOGY-BASED CO2 REMOVAL 584.7 MINERAL CARBONATION 59
5.0 APPENDICES
5.1 COMMERCIAL CCS FACILITIES AND PROJECTS 625.2 CCS NETWORKS 685.3 CO2 GEOLOGICAL STORAGE 70
6.0 REFERENCES 76
61
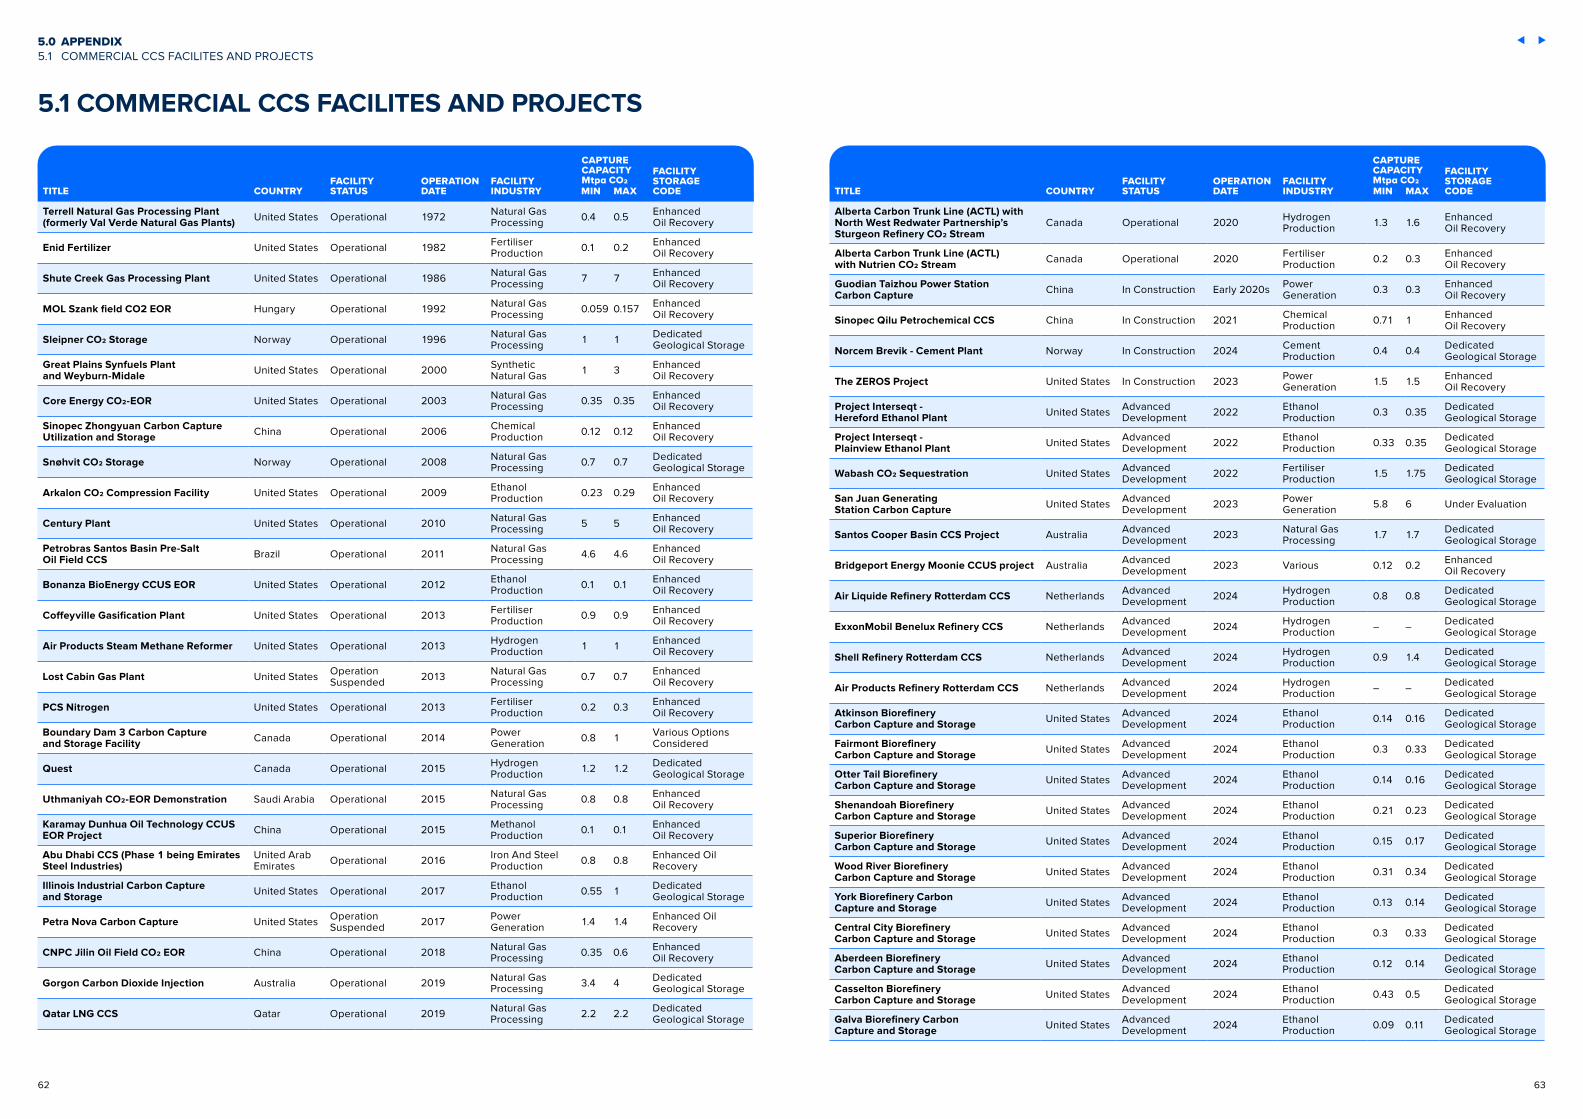
TITLE COUNTRYFACILITY STATUS
OPERATION DATE
FACILITY INDUSTRY
MIN
MAX
FACILITY STORAGE CODE
Terrell Natural Gas Processing Plant (formerly Val Verde Natural Gas Plants) United States Operational 1972 Natural Gas
Processing 0.4 0.5 Enhanced Oil Recovery
Enid Fertilizer United States Operational 1982 Fertiliser Production 0.1 0.2 Enhanced
Oil Recovery
Shute Creek Gas Processing Plant United States Operational 1986 Natural Gas Processing 7 7 Enhanced
Oil Recovery
MOL Szank field CO2 EOR Hungary Operational 1992 Natural Gas Processing 0.059 0.157 Enhanced
Oil Recovery
Sleipner CO2 Storage Norway Operational 1996 Natural Gas Processing 1 1 Dedicated
Geological Storage
Great Plains Synfuels Plant and Weyburn-Midale United States Operational 2000 Synthetic
Natural Gas 1 3 Enhanced Oil Recovery
Core Energy CO2-EOR United States Operational 2003 Natural Gas Processing 0.35 0.35 Enhanced
Oil Recovery
Sinopec Zhongyuan Carbon Capture Utilization and Storage China Operational 2006 Chemical
Production 0.12 0.12 Enhanced Oil Recovery
Snøhvit CO2 Storage Norway Operational 2008 Natural Gas Processing 0.7 0.7 Dedicated
Geological Storage
Arkalon CO2 Compression Facility United States Operational 2009 Ethanol Production 0.23 0.29 Enhanced
Oil Recovery
Century Plant United States Operational 2010 Natural Gas Processing 5 5 Enhanced
Oil Recovery
Petrobras Santos Basin Pre-Salt Oil Field CCS Brazil Operational 2011 Natural Gas
Processing 4.6 4.6 Enhanced Oil Recovery
Bonanza BioEnergy CCUS EOR United States Operational 2012 Ethanol Production 0.1 0.1 Enhanced
Oil Recovery
Coffeyville Gasification Plant United States Operational 2013 Fertiliser Production 0.9 0.9 Enhanced
Oil Recovery
Air Products Steam Methane Reformer United States Operational 2013 Hydrogen Production 1 1 Enhanced
Oil Recovery
Lost Cabin Gas Plant United States Operation Suspended 2013 Natural Gas
Processing 0.7 0.7 Enhanced Oil Recovery
PCS Nitrogen United States Operational 2013 Fertiliser Production 0.2 0.3 Enhanced
Oil Recovery
Boundary Dam 3 Carbon Capture and Storage Facility Canada Operational 2014 Power
Generation 0.8 1 Various Options Considered
Quest Canada Operational 2015 Hydrogen Production 1.2 1.2 Dedicated
Geological Storage
Uthmaniyah CO2-EOR Demonstration Saudi Arabia Operational 2015 Natural Gas Processing 0.8 0.8 Enhanced
Oil Recovery
Karamay Dunhua Oil Technology CCUS EOR Project China Operational 2015 Methanol
Production 0.1 0.1 Enhanced Oil Recovery
Abu Dhabi CCS (Phase 1 being Emirates Steel Industries)
United Arab Emirates Operational 2016 Iron And Steel
Production 0.8 0.8 Enhanced Oil Recovery
Illinois Industrial Carbon Capture and Storage United States Operational 2017 Ethanol
Production 0.55 1 Dedicated Geological Storage
Petra Nova Carbon Capture United States Operation Suspended 2017 Power
Generation 1.4 1.4 Enhanced Oil Recovery
CNPC Jilin Oil Field CO2 EOR China Operational 2018 Natural Gas Processing 0.35 0.6 Enhanced
Oil Recovery
Gorgon Carbon Dioxide Injection Australia Operational 2019 Natural Gas Processing 3.4 4 Dedicated
Geological Storage
Qatar LNG CCS Qatar Operational 2019 Natural Gas Processing 2.2 2.2 Dedicated
Geological Storage
TITLE COUNTRYFACILITY STATUS
OPERATION DATE
FACILITY INDUSTRY MIN
MAX
FACILITY STORAGE CODE
Alberta Carbon Trunk Line (ACTL) with North West Redwater Partnership’s Sturgeon Refinery CO2 Stream
Canada Operational 2020 Hydrogen Production 1.3 1.6 Enhanced
Oil Recovery
Alberta Carbon Trunk Line (ACTL) with Nutrien CO2 Stream Canada Operational 2020 Fertiliser
Production 0.2 0.3 Enhanced Oil Recovery
Guodian Taizhou Power Station Carbon Capture China In Construction Early 2020s Power
Generation 0.3 0.3 Enhanced Oil Recovery
Sinopec Qilu Petrochemical CCS China In Construction 2021 Chemical Production 0.71 1 Enhanced
Oil Recovery
Norcem Brevik - Cement Plant Norway In Construction 2024 Cement Production 0.4 0.4 Dedicated
Geological Storage
The ZEROS Project United States In Construction 2023 Power Generation 1.5 1.5 Enhanced
Oil Recovery
Project Interseqt - Hereford Ethanol Plant United States Advanced
Development 2022 Ethanol Production 0.3 0.35 Dedicated
Geological Storage
Project Interseqt - Plainview Ethanol Plant United States Advanced
Development 2022 Ethanol Production 0.33 0.35 Dedicated
Geological Storage
Wabash CO2 Sequestration United States Advanced Development 2022 Fertiliser
Production 1.5 1.75 Dedicated Geological Storage
San Juan Generating Station Carbon Capture United States Advanced
Development 2023 Power Generation 5.8 6 Under Evaluation
Santos Cooper Basin CCS Project Australia Advanced Development 2023 Natural Gas
Processing 1.7 1.7 Dedicated Geological Storage
Bridgeport Energy Moonie CCUS project Australia Advanced Development 2023 Various 0.12 0.2 Enhanced
Oil Recovery
Air Liquide Refinery Rotterdam CCS Netherlands Advanced Development 2024 Hydrogen
Production 0.8 0.8 Dedicated Geological Storage
ExxonMobil Benelux Refinery CCS Netherlands Advanced Development 2024 Hydrogen
Production – – Dedicated Geological Storage
Shell Refinery Rotterdam CCS Netherlands Advanced Development 2024 Hydrogen
Production 0.9 1.4 Dedicated Geological Storage
Air Products Refinery Rotterdam CCS Netherlands Advanced Development 2024 Hydrogen
Production – – Dedicated Geological Storage
Atkinson Biorefinery Carbon Capture and Storage United States Advanced
Development 2024 Ethanol Production 0.14 0.16 Dedicated
Geological Storage
Fairmont Biorefinery Carbon Capture and Storage United States Advanced
Development 2024 Ethanol Production 0.3 0.33 Dedicated
Geological Storage
Otter Tail Biorefinery Carbon Capture and Storage United States Advanced
Development 2024 Ethanol Production 0.14 0.16 Dedicated
Geological Storage
Shenandoah Biorefinery Carbon Capture and Storage United States Advanced
Development 2024 Ethanol Production 0.21 0.23 Dedicated
Geological Storage
Superior Biorefinery Carbon Capture and Storage United States Advanced
Development 2024 Ethanol Production 0.15 0.17 Dedicated
Geological Storage
Wood River Biorefinery Carbon Capture and Storage United States Advanced
Development 2024 Ethanol Production 0.31 0.34 Dedicated
Geological Storage
York Biorefinery Carbon Capture and Storage United States Advanced
Development 2024 Ethanol Production 0.13 0.14 Dedicated
Geological Storage
Central City Biorefinery Carbon Capture and Storage United States Advanced
Development 2024 Ethanol Production 0.3 0.33 Dedicated
Geological Storage
Aberdeen Biorefinery Carbon Capture and Storage United States Advanced
Development 2024 Ethanol Production 0.12 0.14 Dedicated
Geological Storage
Casselton Biorefinery Carbon Capture and Storage United States Advanced
Development 2024 Ethanol Production 0.43 0.5 Dedicated
Geological Storage
Galva Biorefinery Carbon Capture and Storage United States Advanced
Development 2024 Ethanol Production 0.09 0.11 Dedicated
Geological Storage
5.0 APPENDIX 5.1 COMMERCIAL CCS FACILITES AND PROJECTS
5.1 COMMERCIAL CCS FACILITES AND PROJECTS
CAPTURE CAPACITY Mtpa CO2
CAPTURE CAPACITY Mtpa CO2
62 63

TITLE COUNTRYFACILITY STATUS
OPERATION DATE
FACILITY INDUSTRY MIN
MAX
FACILITY STORAGE CODE
Goldfield Biorefinery Carbon Capture and Storage United States Advanced
Development 2024 Ethanol Production 0.18 0.22 Dedicated
Geological Storage
Grand Junction Biorefinery Carbon Capture and Storage United States Advanced
Development 2024 Ethanol Production 0.29 0.34 Dedicated
Geological Storage
Granite Falls Biorefinery Carbon Capture and Storage United States Advanced
Development 2024 Ethanol Production 0.15 0.18 Dedicated
Geological Storage
Heron Lake Biorefinery Carbon Capture and Storage United States Advanced
Development 2024 Ethanol Production 0.16 0.19 Dedicated
Geological Storage
Huron Biorefinery Carbon Capture and Storage United States Advanced
Development 2024 Ethanol Production 0.08 0.09 Dedicated
Geological Storage
Lamberton Biorefinery Carbon Capture and Storage United States Advanced
Development 2024 Ethanol Production 0.13 0.16 Dedicated
Geological Storage
Lawler Biorefinery Carbon Capture and Storage United States Advanced
Development 2024 Ethanol Production 0.49 0.57 Dedicated
Geological Storage
Marcus Biorefinery Carbon Capture and Storage United States Advanced
Development 2024 Ethanol Production 0.39 0.46 Dedicated
Geological Storage
Mason City Biorefinery Carbon Capture and Storage United States Advanced
Development 2024 Ethanol Production 0.29 0.34 Dedicated
Geological Storage
Merrill Biorefinery Carbon Capture and Storage United States Advanced
Development 2024 Ethanol Production 0.13 0.16 Dedicated
Geological Storage
Mina Biorefinery Carbon Capture and Storage United States Advanced
Development 2024 Ethanol Production 0.34 0.4 Dedicated
Geological Storage
Nevada Biorefinery Carbon Capture and Storage United States Advanced
Development 2024 Ethanol Production 0.22 0.26 Dedicated
Geological Storage
Norfolk Biorefinery Carbon Capture and Storage United States Advanced
Development 2024 Ethanol Production 0.13 0.15 Dedicated
Geological Storage
Onida Biorefinery Carbon Capture and Storage United States Advanced
Development 2024 Ethanol Production 0.19 0.23 Dedicated
Geological Storage
Plainview Biorefinery Carbon Capture and Storage United States Advanced
Development 2024 Ethanol Production 0.27 0.32 Dedicated
Geological Storage
Redfield Biorefinery Carbon Capture and Storage United States Advanced
Development 2024 Ethanol Production 0.15 0.17 Dedicated
Geological Storage
Sioux Center Biorefinery Carbon Capture and Storage United States Advanced
Development 2024 Ethanol Production 0.16 0.19 Dedicated
Geological Storage
Steamboat Rock Biorefinery Carbon Capture and Storage United States Advanced
Development 2024 Ethanol Production 0.19 0.23 Dedicated
Geological Storage
Watertown Biorefinery Carbon Capture and Storage United States Advanced
Development 2024 Ethanol Production 0.32 0.37 Dedicated
Geological Storage
Wentworth Biorefinery Carbon Capture and Storage United States Advanced
Development 2024 Ethanol Production 0.22 0.26 Dedicated
Geological Storage
Fortum Oslo Varme - Klemetsrud Waste to Energy Plant Norway Advanced
Development 2024 Waste Incineration 0.4 0.4 Dedicated
Geological Storage
Coyote Clean Power Project United States Advanced Development 2025 Power
Generation 0.86 0.86 Under Evaluation
Stockholm Exergi BECCS Sweden Advanced Development 2025 Bioenergy 0.8 0.8 Dedicated
Geological Storage
Copenhill (Amager Bakke) Waste to Energy CCS Denmark Advanced
Development 2025 Waste Incineration 0.5 0.5 Dedicated
Geological Storage
Lake Charles Methanol United States Advanced Development 2025 Chemical
Production 4 4 Dedicated Geological Storage
Abu Dhabi CCS Phase 2: Natural gas processing plant
United Arab Emirates
Advanced Development 2025 Natural Gas
Processing 1.9 2.3 Dedicated Geological Storage
One Earth Energy Facility Carbon Capture United States Advanced
Development 2025 Ethanol production 0.5 0.5 Dedicated
Geological Storage
Project Tundra United States Advanced Development 2025 - 2026 Power
Generation 3.1 3.6 Various Options Considered
Humber Zero - VPI Immingham Power Plant CCS
United Kingdom
Advanced Development 2027 Power
Generation – – Dedicated Geological Storage
TITLE COUNTRYFACILITY STATUS
OPERATION DATE
FACILITY INDUSTRY MIN
MAX
FACILITY STORAGE CODE
Humber Zero - Phillips 66 Humber Refinery CCS
United Kingdom
Advanced Development 2028 Hydrogen
Production – – Dedicated Geological Storage
Antwerp@C - BASF Antwerp CCS Belgium Advanced Development 2030 Chemical
Production – – Dedicated Geological Storage
OXY and Carbon Engineering Direct Air Capture and EOR Facility United States Advanced
Development Mid 2020s Direct Air Capture 0.5 1 Dedicated
Geological Storage
Mustang Station of Golden Spread Electric Cooperative Carbon Capture United States Advanced
Development Mid 2020s Power Generation 1 1.5 Under Evaluation
Plant Daniel Carbon Capture United States Advanced Development Mid 2020s Power
Generation 1.6 1.8 Dedicated Geological Storage
Gerald Gentleman Station Carbon Capture United States Advanced
Development Mid 2020s Power Generation 4.3 4.3 Under Evaluation
Prairie State Generating Station Carbon Capture United States Advanced
Development Mid 2020s Power Generation 5 6 Dedicated
Geological Storage
Cal Capture United States Advanced Development
Middle 2020s
Power Generation 1.4 1.4 Enhanced
Oil Recovery
Midwest AgEnergy Blue Flint ethanol CCS United States Early
Development 2022 Ethanol Production 0.18 0.18 Dedicated
Geological Storage
Velocys’ Bayou Fuels Negative Emission Project United States Early
Development 2025 Chemical Production 0.4 0.5 Dedicated
Geological Storage
Project Pouakai Hydrogen Production with CCS New Zealand Early
Development 2024 Various 1 1 Under Evaluation
Red Trail Energy BECCS Project United States Early Development 2025 Ethanol
Production 0.18 0.18 Dedicated Geological Storage
Clean Energy Systems Carbon Negative Energy Plant - Central Valley United States Early
Development 2025
Power Generation and Hydrogen Production
0.32 0.32 Dedicated Geological Storage
Preem Refinery CCS Sweden Early Development 2025 Hydrogen
Production 0.5 0.5 Dedicated Geological Storage
Acorn Hydrogen United Kingdom
Early Development 2025 Hydrogen
Production – – Dedicated Geological Storage
HyNet North West - Hanson Cement CCS
United Kingdom
Early Development 2026 Cement
Production 0.8 0.8 Dedicated Geological Storage
Repsol Sakakemang Carbon Capture and Injection Indonesia Early
Development 2026 Natural Gas Processing 1.5 2 Dedicated
Geological Storage
Ravenna Hub - ENI Power CCS Italy Early Development 2026 Power
Generation – – Dedicated Geological Storage
Ravenna Hub - ENI Hydrogen CCS Italy Early Development 2026 Hydrogen
Production – – Dedicated Geological Storage
G2 Net-Zero LNG United States Early Development 2027 Natural Gas
Processing 4 4 Under Evaluation
Net Zero Teesside - BP H2Teesside United Kingdom
Early Development 2027 Hydrogen
Production 1 2 Dedicated Geological Storage
Net Zero Teesside - Suez Waste to Energy CCS
United Kingdom
Early Development 2027 Waste
Incineration – – Dedicated Geological Storage
ZERO Carbon Humber - Keady 3 CCS Power Station
United Kingdom
Early Development 2027 Power
Generation 1.5 2.6 Dedicated Geological Storage
Antwerp@C – Ineos Antwerp CCS Belgium Early Development 2030 Chemical
Production – – Dedicated Geological Storage
Antwerp@C - Exxonmobil Antwerp Refinery CCS Belgium Early
Development 2030 Chemical Production – – Dedicated
Geological Storage
Antwerp@C – Borealis Antwerp CCS Belgium Early Development 2030 Chemical
Production – – Dedicated Geological Storage
Korea-CCS 1 & 2 South Korea Early Development 2020s Power
Generation 1 1 Dedicated Geological Storage
Sinopec Shengli Power Plant CCS China Early Development 2020s Power
Generation 1 1 Enhanced Oil Recovery
CAPTURE CAPACITY Mtpa CO2
CAPTURE CAPACITY Mtpa CO2
5.0 APPENDIX 5.1 COMMERCIAL CCS FACILITES AND PROJECTS
64 65

TITLE COUNTRYFACILITY STATUS
OPERATION DATE
FACILITY INDUSTRY MIN
MAX
FACILITY STORAGE CODE
Dave Johnston Plant Carbon Capture United States Early Development 2020s Power
Generation 2 6 Enhanced Oil Recovery
NextDecade Rio Grande LNG CCS United States Early Development 2020s Natural Gas
Processing 5 5 Under Evaluation
Caledonia Clean Energy United Kingdom
Early Development 2024 Power
Generation 3 3 Dedicated Geological Storage
Hydrogen 2 Magnum (H2M) Netherlands Early Development 2024 Power
Generation 2 2 Dedicated Geological Storage
Dry Fork Integrated Commercial Carbon Capture and Storage (CCS) United States Early
Development 2025 Power Generation 3 3 Dedicated
Geological Storage
Net Zero Teesside - CCGT Facility United Kingdom
Early Development 2025 Power
Generation 1.7 6 Dedicated Geological Storage
The Illinois Clean Fuels Project United States Early Development 2026 Chemical
Production 4.1 8.1 Dedicated Geological Storage
Northern Gas Network H21 North of England
United Kingdom
Early Development 2026 Hydrogen
Production 1.5 1.5 Dedicated Geological Storage
Hydrogen to Humber Saltend United Kingdom
Early Development 2026-2027 Hydrogen
Production 1 1.2 Dedicated Geological Storage
Drax BECCS Project United Kingdom
Early Development 2027 Power
Generation 1 4.3 Dedicated Geological Storage
Ervia Cork CCS Ireland Early Development 2028
Power Generation and Refining
2.5 2.5 Dedicated Geological Storage
Nauticol Energy Blue Methanol Canada Early Development Late 2020s Methanol
Production 1 1 Enhanced Oil Recovery
Net Zero Teesside - NET Power Plant United Kingdom
Early Development Late 2020s Power
Generation – – Under Evaluation
PAU Central Sulawesi Clean Fuel Ammonia Production with CCUS Indonesia Early
Development Late 2020s Fertiliser Production 0.1 2 Under Evaluation
Saskatchewan NET Power Plant Canada Early Development Late 2020s Power
Generation 0.95 0.95 Under Evaluation
Tata Steel project EVEREST Netherlands Early Development Late 2020s Iron and Steel
Production – – Under Evaluation
Acorn CCS United Kingdom
Early Development Mid 2020s
Natural Gas Processing and Oil Refining
0.34 0.34 Dedicated Geological Storage
HyNet North West United Kingdom
Early Development Mid 2020s Hydrogen
Production 1.5 1.5 Dedicated Geological Storage
LafargeHolcim Cement Carbon capture United States Early
Development Mid 2020s Cement Production 1 2 Under Evaluation
Barents Blue Clean Ammonia with CCS Norway Early Development 2025 Fertiliser
Production 1.2 2 Dedicated Geological Storage
Petronas Kasawari Gas Field Development Project Malaysia Early
DevelopmentNatural Gas Processing – – Under Evaluation
Polaris CCS Project Canada Early Development
Middle 2020s
Hydrogen Production 0.75 0.75 Dedicated
Geological Storage
Caroline Carbon Capture Power Complex Canada Early
DevelopmentMiddle 2020s
Power Generation 1 3 Dedicated
Geological Storage
Acorn Direct Air Capture Facility United Kingdom
Early Development 2026 Direct Air
Capture 0.5 1 Dedicated Geological Storage
5.0 APPENDIX 5.1 COMMERCIAL CCS FACILITES AND PROJECTS
CAPTURE CAPACITY Mtpa CO2
66 67
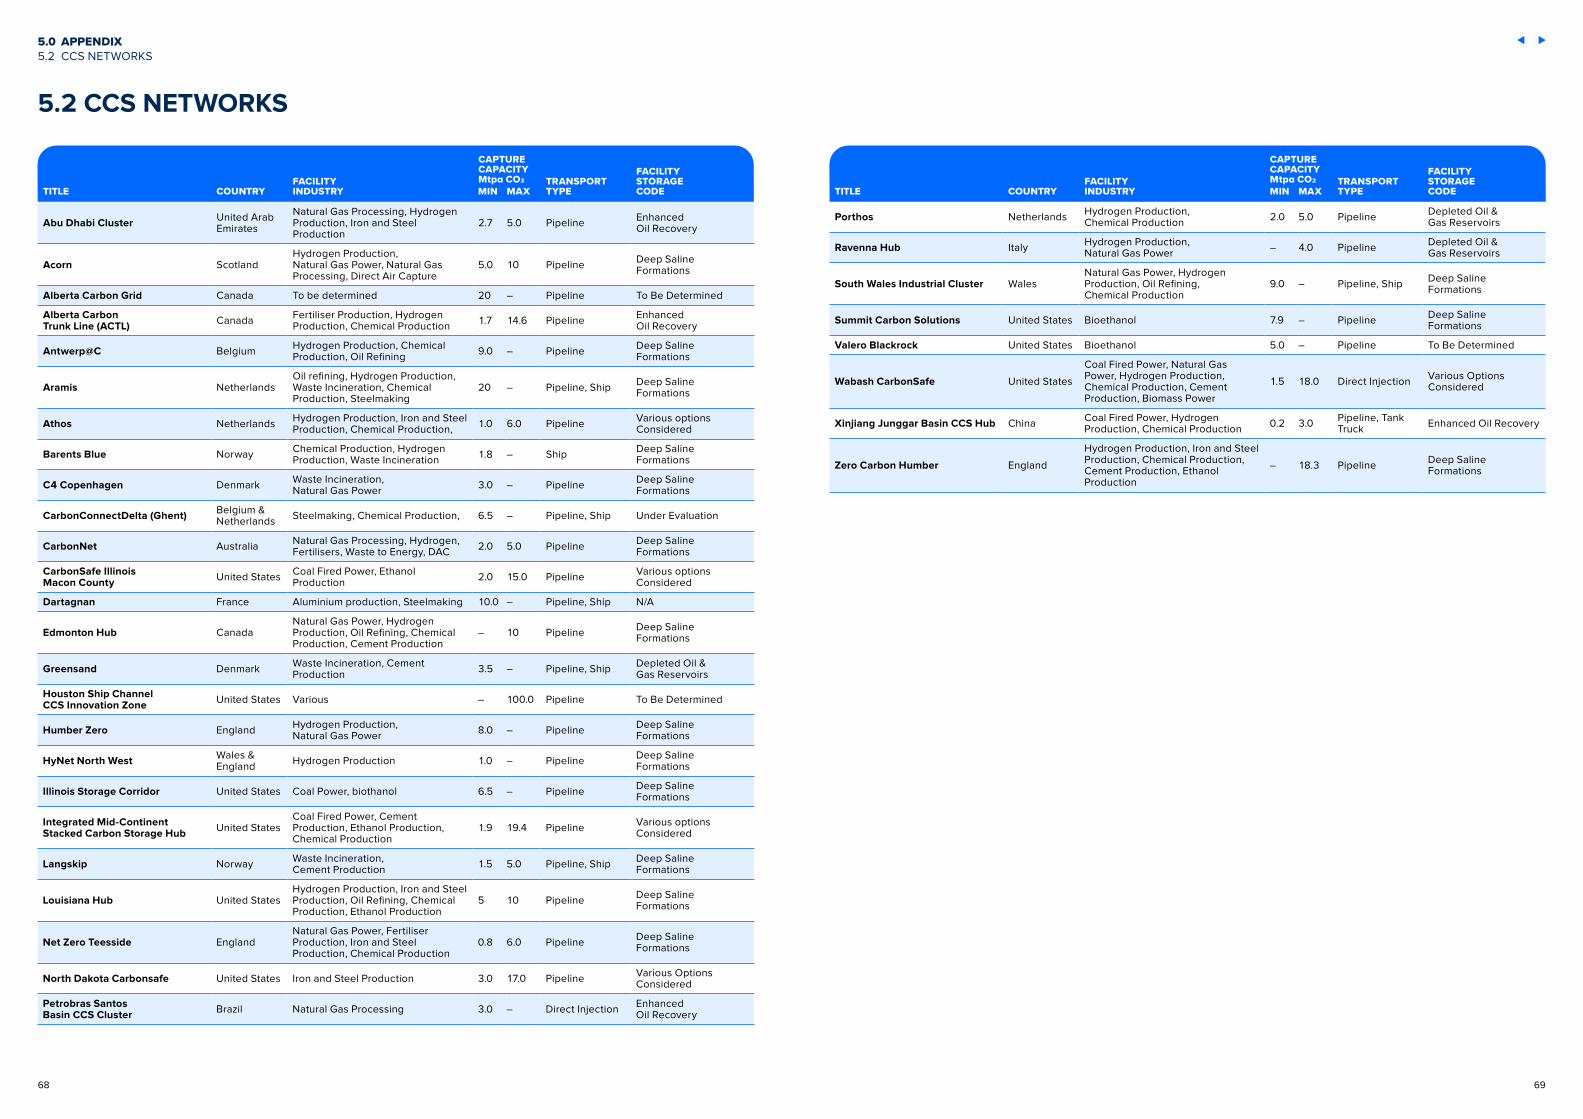
TITLE COUNTRYFACILITY INDUSTRY MIN
MAX
TRANSPORT TYPE
FACILITY STORAGE CODE
Porthos Netherlands Hydrogen Production, Chemical Production 2.0 5.0 Pipeline Depleted Oil &
Gas Reservoirs
Ravenna Hub Italy Hydrogen Production, Natural Gas Power – 4.0 Pipeline Depleted Oil &
Gas Reservoirs
South Wales Industrial Cluster WalesNatural Gas Power, Hydrogen Production, Oil Refining, Chemical Production
9.0 – Pipeline, Ship Deep Saline Formations
Summit Carbon Solutions United States Bioethanol 7.9 – Pipeline Deep Saline Formations
Valero Blackrock United States Bioethanol 5.0 – Pipeline To Be Determined
Wabash CarbonSafe United States
Coal Fired Power, Natural Gas Power, Hydrogen Production, Chemical Production, Cement Production, Biomass Power
1.5 18.0 Direct Injection Various Options Considered
Xinjiang Junggar Basin CCS Hub China Coal Fired Power, Hydrogen Production, Chemical Production 0.2 3.0 Pipeline, Tank
Truck Enhanced Oil Recovery
Zero Carbon Humber England
Hydrogen Production, Iron and Steel Production, Chemical Production, Cement Production, Ethanol Production
– 18.3 Pipeline Deep Saline Formations
TITLE COUNTRYFACILITY INDUSTRY MIN
MAX
TRANSPORT TYPE
FACILITY STORAGE CODE
Abu Dhabi Cluster United Arab Emirates
Natural Gas Processing, Hydrogen Production, Iron and Steel Production
2.7 5.0 Pipeline Enhanced Oil Recovery
Acorn ScotlandHydrogen Production, Natural Gas Power, Natural Gas Processing, Direct Air Capture
5.0 10 Pipeline Deep Saline Formations
Alberta Carbon Grid Canada To be determined 20 – Pipeline To Be Determined
Alberta Carbon Trunk Line (ACTL) Canada Fertiliser Production, Hydrogen
Production, Chemical Production 1.7 14.6 Pipeline Enhanced Oil Recovery
Antwerp@C Belgium Hydrogen Production, Chemical Production, Oil Refining 9.0 – Pipeline Deep Saline
Formations
Aramis NetherlandsOil refining, Hydrogen Production, Waste Incineration, Chemical Production, Steelmaking
20 – Pipeline, Ship Deep Saline Formations
Athos Netherlands Hydrogen Production, Iron and Steel Production, Chemical Production, 1.0 6.0 Pipeline Various options
Considered
Barents Blue Norway Chemical Production, Hydrogen Production, Waste Incineration 1.8 – Ship Deep Saline
Formations
C4 Copenhagen Denmark Waste Incineration, Natural Gas Power 3.0 – Pipeline Deep Saline
Formations
CarbonConnectDelta (Ghent) Belgium & Netherlands Steelmaking, Chemical Production, 6.5 – Pipeline, Ship Under Evaluation
CarbonNet Australia Natural Gas Processing, Hydrogen, Fertilisers, Waste to Energy, DAC 2.0 5.0 Pipeline Deep Saline
Formations
CarbonSafe Illinois Macon County United States Coal Fired Power, Ethanol
Production 2.0 15.0 Pipeline Various options Considered
Dartagnan France Aluminium production, Steelmaking 10.0 – Pipeline, Ship N/A
Edmonton Hub CanadaNatural Gas Power, Hydrogen Production, Oil Refining, Chemical Production, Cement Production
– 10 Pipeline Deep Saline Formations
Greensand Denmark Waste Incineration, Cement Production 3.5 – Pipeline, Ship Depleted Oil &
Gas Reservoirs
Houston Ship Channel CCS Innovation Zone United States Various – 100.0 Pipeline To Be Determined
Humber Zero England Hydrogen Production, Natural Gas Power 8.0 – Pipeline Deep Saline
Formations
HyNet North West Wales & England Hydrogen Production 1.0 – Pipeline Deep Saline
Formations
Illinois Storage Corridor United States Coal Power, biothanol 6.5 – Pipeline Deep Saline Formations
Integrated Mid-Continent Stacked Carbon Storage Hub United States
Coal Fired Power, Cement Production, Ethanol Production, Chemical Production
1.9 19.4 Pipeline Various options Considered
Langskip Norway Waste Incineration, Cement Production 1.5 5.0 Pipeline, Ship Deep Saline
Formations
Louisiana Hub United StatesHydrogen Production, Iron and Steel Production, Oil Refining, Chemical Production, Ethanol Production
5 10 Pipeline Deep Saline Formations
Net Zero Teesside EnglandNatural Gas Power, Fertiliser Production, Iron and Steel Production, Chemical Production
0.8 6.0 Pipeline Deep Saline Formations
North Dakota Carbonsafe United States Iron and Steel Production 3.0 17.0 Pipeline Various Options Considered
Petrobras Santos Basin CCS Cluster Brazil Natural Gas Processing 3.0 – Direct Injection Enhanced
Oil Recovery
CAPTURE CAPACITY Mtpa CO2
CAPTURE CAPACITY Mtpa CO2
5.0 APPENDIX 5.2 CCS NETWORKS
5.2 CCS NETWORKS
68 69

forces of the main portion of the CO2 plume are strong enough to overcome capillary forces in pores; however, along the margins and tail of a migrating plume, small volumes of CO2 ‘snap-off’ from the plume and are held permanently in pores, against the surface of mineral grains. As the CO2 plume migrates away from the higher pressures at an injection well, residual trapping becomes more and more prominent. Although residual trapping occurs at the micro-scale, the volume of CO2 trapped by this mechanism is significant when scaled to a reservoir tens of metres thick and kilometres wide. Residual trapping is critical in the early (decadal) period of a storage project.
Dissolution
Dissolution trapping is a simple mechanism which occurs when CO2 comes into contact with a brine and the CO2 is able to dissolve into the brine, forming a solution. The ability of CO2 to dissolve in a brine (solubility) is dependent on the temperature and pressure conditions of a reservoir. A CO2-saturated brine solution is denser than the unsaturated brine and sinks to the bottom of the reservoir, where it is considered permanently stored. Over time, the CO2-saturated brine diffuses and disperses within the regional hydrogeological system of the wider basin. Dissolution of CO2 into brine happens immediately on contact, but dissolution trapping isn’t critical to storage until decadal- to century-time scales in conventional storage reservoirs.
Mineral Trapping
The interaction of CO2 with the brine and the reservoir lithology can lead to mineral trapping. Injected CO2 can chemically react with the minerals in a rock to form stable, product minerals – often carbonate minerals. CO2-brine-rock reactions and associated product minerals depend on reservoir pressure, temperature, and mineralogy. Fortunately, reservoirs targeted for CO2 storage have favourable conditions for mineralisation. Mineral carbonation begins immediately on injection, but is generally a minor component of a storage project until thousands of years have passed. At this time scale, in a conventional storage reservoir, the majority of CO2 will
5.3 CO2 GEOLOGICAL STORAGESUMMARY OF STORAGE MECHANISMS AND SECURITY
CO2 is stored through four trapping mechanisms. These mechanisms occur simultaneously on injection within the pore space of a storage reservoir; however, the importance of each trapping mechanism – physical, residual, dissolution, mineralisation – changes with time and with the CO2 plume's evolution. Trapping of CO2 is strongly dependent on a site’s geology and local formation conditions (fluids, pressure, temperature).
Structural
Physical trapping includes structural or stratigraphic containment – the same mechanism which traps hydrocarbons. Buoyant, free-phase CO2 is contained below an extensive low-permeability caprock. In certain geological settings, physical trapping of CO2 occurs when a reservoir is terminated against a fault or the reservoir thins stratigraphically and ultimately pinches-out.
In the initial few decades of a standard storage operation, physical trapping of free phase CO2 is the primary trapping mechanism. A portion of the CO2 plume may always remain in its free phase, but it can be considered permanent if the geologic setting is stable and the CO2 plume is behaving as predicted in the reservoir.
Residual
As a CO2 plume migrates through the reservoir, a portion of the CO2 is left behind and trapped in the pore space and micro-scale heterogeneities by capillary forces. This process is called residual trapping and is controlled by the connectivity between pores, reservoir lithology, and pre-existing pore fluid chemistry. Pores in suitable reservoirs are typically <1 mm in size, are well connected, and often make up 10–30 per cent of a rock's volume. Buoyancy
5.0 APPENDIX 5.3 CO2 GELOGICAL STORAGE
Structural Trapping Dissolution Trapping
Caprock Caprock
Residual Trapping Mineral Trapping
Caprock
0
100
CO
NTR
IBU
TIO
N T
OC
O2
TRA
PP
ING
(%)
10 100 10,000
STRUCTURAL TRAPPING RESIDUAL TRAPPING DISSOLUTION TRAPPING MINERAL TRAPPINGTIME AFTER CO2 INJECTION (YEARS)
FIGURE 30 FOUR TRAPPING MECHANISMS DURING THE INJECTION AND STORAGE OF CO2 Source: IPCC 2005 (2)
FIGURE 31 SUITABLE STORAGE REGIONS OF THE WORLD BASED ON THE GLOBAL CCS INSTITUTE'S STORAGE BASIN ASSESSMENT DATABASE
have already been permanently stored by the three mechanisms above. However, injection under certain conditions and into particular rocks (such as basalts) can result in rapid mineralisation of the majority of the CO2 during the lifetime of the storage operation (1).
GLOBAL STORAGE MAP
The Global CCS Institute has completed a review of sedimentary basins around the world for their storage suitability. Basins were ranked as unlikely, possible, suitable or highly suitable. The suitability ranking combined spatial analysis of existing geological, energy, and infrastructure data. The spatial analysis utilised findings from previously published storage assessments, the Institute’s CO2RE database, as well as internal technical expertise.
Two important observations can be made from the distribution of suitable basins. First, those nations with suitable basins are generally near emission-intensive regions. This match will facilitate CCS development. Parts of Europe, the USA, the Middle East, Russia, and some nations in SE Asia fit this category.
Second, the distribution of suitable basins correlates with nations which have formally assessed their sedimentary basins for geological storage. Basins which have undergone detailed assessment achieve higher scores in our analysis. For example, a basin assessed as part of a global desktop review scores lower than one which has been critically appraised for storage. It’s important to note, however, a detailed assessment does not guarantee a high suitability ranking. Some European basins, for example, have undergone detailed analysis, yet only achieve a low ranking due to their geologic characteristics.
Understanding the global distribution of suitable and accessible storage sites is required to enable the full-scale deployment of CCS.
HIGHLY SUITABLESUITABLEPOSSIBLEUNLIKELY
70 71

This second phase of the catalogue adds 715 sites across 18 nations, resulting in a total of 13,000 GtCO2 of storage resources across the entire catalogue. Significantly, resources categorised as 'discovered' – those which are confirmed by subsurface data – continued to grow to over 550 GtCO2. Unfortunately, only 254 MtCO2 of resources have been categorised as ‘commercial.’ Commercial resources must be ready for a storage operation to proceed and have:
• a regulatory environment that enables CO2 storage
• been thoroughly analysed using subsurface data and confirmed as technically feasible.
An order of magnitude difference between total resources and those proven commercial resources demonstrates an incredible opportunity to explore, develop, and appraise storage resources globally.
STORAGE RESOURCE CATALOGUE
The 2021 CO2 Storage Resource Catalogue update has added over 1000 GtCO2 storage resources, bolstering the world's identified storage capacity. These findings are derived from a project funded by the Oil & Gas Climate Initiative (OGCI) and completed by Pale Blue Dot Energy and the Global CCS Institute. The goal of the Storage Resource Catalogue is to create a global storage resource database using the Society of Petroleum Engineers Storage Resources Management System (SRMS). The SRMS creates a commercial framework using a consistent methodology and set of definitions to classify CO2 storage resources.
COUNTRY STORED CAPACITY CONTINGENTINACCESSIBLE SUB-COMMERCIAL PROSPECTIVE
INACCESSIBLE UNDISCOVERED TOTAL
Australia 0.001 0.120 17.956 13.400 470.953 0 502.430
United States 0.003 0.004 55.288 202.691 7,803.826 0 8,061.812
United Kingdom 0 0 17.111 0 60.565 0 77.676
South Korea 0 0 0 0.021 201.281 2.060 203.362
Pakistan 0 0 0 1.702 0 30 31.702
Norway 0.026 0.0368 39.813 16.200 37.550 0 93.626
Mexico 0 0 0 89.540 0 11.260 100.8
Malaysia 0 0 0 0 0 149.573 149.573
Japan 0 0 5.226 31.000 116.040 0 152.266
Indonesia 0 0 0 2.460 0 13.395 15.855
India 0 0 0 0.835 0 63.3 64.135
Germany 0 0 0 0 0.108 0 0.108
Denmark 0 0 0.093 0 1.536 0 1.629
China 0 0 4.795 5.736 0 3,066.900 3,077.431
Canada 0.005 0.056 25.625 18.016 360.270 0 403.972
Bangladesh 0 0 0 1.133 0 20 21.1330
Brazil 0.001 0 0 2.469 0 0 2.470
Total 0.036 0.2168 165.907 385.203 9,052.129 3356.488 12,959.980
FIGURE 31 RESULTS OF THE 2021 CO2 STORAGE RESOURCE CATALOGUE IN GT (GIGATONNES)
PROSPECTIVE
INACCESSIBLEUNDISCOVERED
INACCESSIBLESUB-COMMERCIAL
CONTINGENT
CAPACITY
STORED
0 2000 4000 6000 8000 10,000
5.0 APPENDIX 5.2 CO2 GELOGICAL STORAGE
FIGURE 32 TOTAL STORAGE RESOURCES IN GT (GIGATONNES)
72 73

74
6.0 REFERENCES
1.0 INTRODUCTION
2.0 GLOBAL STATUS OF CCS
2.1 CCS, NET ZERO AND ECONOMIC PROSPERITY 102.2 GLOBAL CCS FACILITIES UPDATE AND TRENDS 122.3 INTERNATIONAL POLICY UPDATE 22
3.0 REGIONAL OVERVIEWS
3.1 NORTH AMERICA 263.2 ASIA PACIFIC 323.3 EUROPE AND NEARBY REGIONS 383.4 GULF COOPERATION COUNCIL STATES 44
4.0 PATHWAYS IN FOCUS
4.1 ENVIRONMENTAL, SOCIAL AND GOVERNANCE 504.2 FINANCING CCS 504.3 CCS NETWORKS 534.4 INDUSTRY 544.5 HYDROGEN 554.6 TECHNOLOGY-BASED CO2 REMOVAL 584.7 MINERAL CARBONATION 59
5.0 APPENDICES
5.1 COMMERCIAL CCS FACILITIES AND PROJECTS 625.2 CCS NETWORKS 685.3 CO2 GEOLOGICAL STORAGE 70
6.0 REFERENCES 76
75

6.0 REFERENCES2.0 GLOBAL STATUS OF CCS
1. CO2RE Database (2021) Global CCS Institute. Available at: https://co2re.co/ (Accessed: 25 June 2021).
2. IPCC (2018) Global warming of 1.5°C. An IPCC Special Report on the impacts of global warming of 1.5°C above pre-industrial levels and related global greenhouse gas emission pathways, in the context of strengthening the global response to the threat of climate change, Ipcc - Sr15.
3. Friedmann, J., Zapantis, A. and Page, B. (2020) ‘Net-Zero and Geospheric Return: Actions Today for 2030 and Beyond’, Center on Global Energy Policy.
4. IEA (2021) ‘Net Zero by 2050 A Roadmap for the Global Energy Sector’, International Energy Agency, p. 222. Available at: https://www.iea.org/reports/net-zero-by-2050.
5. Climate Ambition Alliance: Net Zero 2050 (2021).
6. Pacala, S. and Socolow, R. (2004) ‘Stabilization Wedges: Solving the Climate Problem for the Next 50 Years with Current Technologies’, Science, 305(5686), pp. 968 LP-- 972. doi: 10.1126/science.1100103.
7. Townsend, A., Raji, N. and Zapantis, A. (2020) The Value of Carbon Capture and Storage. Available at: https://www.globalccsinstitute.com/resources/publications-reports-research/the-value-of-carbon-capture-ccs/.
8. International Energy Agency (2020) Energy Technology Perspectives 2020: Special Report on Carbon Capture Utilisation and Storage.
9. Rassool, D. (2021) Unlocking Private Finance to Support CCS Investments.
10. International Energy Agency (2019) ‘World Energy Investment 2019’, World Energy Investment 2019, p. 2021. doi: 10.1787/4f4f25b4-en.
11. Porthos Development C.V (2021) Dutch government supports Porthos customers with SDE++ subsidy reservation, Website. Available at: https://www.porthosco2.nl/en/dutch-government-supports-porthos-customers-with-sde-subsidy-reservation/ (Accessed: 23 June 2021).
12. Norwegian Ministry of Petroleum and Energy (no date) Langskip website. Available at: https://langskip.regjeringen.no/longship/northern-lights-en/ (Accessed: 15 July 2021).
13. Air Products (2021) Air Products Announces Multi-Billion Dollar Net-Zero Hydrogen Energy Complex in Edmonton, Alberta, Canada. Available at: https://www.airproducts.com/campaigns/alberta-net-zero-hydrogen-complex (Accessed: 23 June 2021).
14. ExxonMobil (2021) ExxonMobil Low Carbon Solutions to commercialize emission-reduction technology. Available at: https://corporate.exxonmobil.com/News/Newsroom/News-releases/2021/0201_ExxonMobil-Low-Carbon-Solutions-to-commercialize-emission-reduction-technology (Accessed: 23 June 2021).
15. Tamme, E. and Scowcroft, J. (2020) ‘The Role of CCS in the Paris Agreement and its Article 6’, (April). Available at: https://www.globalccsinstitute.com/wp-content/uploads/2020/05/Article-6-and-CCS-GCCSI-April-2020-final.pdf.
16. Tamme, E. (2021a) ‘Carbon removal with CCS technologies’. Global CCS Institute. Available at: https://www.globalccsinstitute.com/resources/publications-reports-research/carbon-removal-and-ccs/.
17. Rassool, D. and Havercroft, I. (2021) Financing CCS in Developing Countries. Available at: https://www.globalccsinstitute.com/resources/publications-reports-research/financing-ccs-in-developing-countries/.
18. IEA (2013) IEA Technology Roadmap - Carbon Capture and Storage. Available at: technology-roadmap-carbon-capture-and-storage-2013.
19. TSVCM (2021) Public Consultation Report. Available at: https://www.iif.com/tsvcm.
20. Tamme, E. (2021b) ‘Institute’s experts review the upcoming IPCC Sixth Assessment report’. Global CCS Institute. Available at: https://www.globalccsinstitute.com/news-media/insights/institutes-experts-review-the-upcoming-ipcc-sixth-assessment-report/.
3.0 REGIONAL OVERVIEWS
1. Air Products (2021) Air Products Announces Multi-Billion Dollar Net-Zero Hydrogen Energy Complex in Edmonton, Alberta, Canada. Available at: https://www.airproducts.com/campaigns/alberta-net-zero-hydrogen-complex (Accessed: 23 June 2021).
2. Enhance Energy (2021a) Enhance Energy - Megatonne Milestone - Charting a New and Cleaner Path Forward by Capturing Co2 and Producing Lower Carbon Energy. Available at: https://www.prnewswire.com/news-releases/enhance-energy--megatonne-milestone---charting-a-new-and-cleaner-path-forward-by-capturing-co2-and-producing-lower-carbon-energy-301243654.html (Accessed: 5 July 2021).
3. 8 Rivers Capital (2021b) 8 Rivers Capital and City of Estevan Awarded Federal Grant to Perform A Feasibility Study on a NET Power Plant Deployment in Saskatchewan. Available at: https://www.prnewswire.com/news-releases/8-rivers-capital-and-city-of-estevan-awarded-federal-grant-to-perform-a-feasibility-study-on-a-net-power-plant-deployment-in-saskat-chewan-301206842.html (Accessed: 5 July 2021).
4. 8 Rivers Capital (2021a) 8 Rivers Capital, ADM Announce Intention To Make Illinois Home To Game-Changing Zero Emissions Project. Available at: https://www.prnewswire.com/news-releases/8-rivers-capital-adm-announce-intention-to-make-illinois-home-to-game-changing-zero-emissions-project-301269296.html (Accessed: 5 July 2021).
5. 8 Rivers Capital (2021c) 8 Rivers Capital and the Southern Ute Growth Fund Announce Joint Development of Zero Emissions NET Power. Available at: https://www.prnewswire.com/news-releases/8-rivers-capital-and-the-southern-ute-growth-fund-announce-joint-development-of-zero-emissions-net-power-plant-301269105.html (Accessed: 5 July 2021).
6. Microsoft (2021) Sustainability: A Year of Progress and a Decade of Action - Microsoft On the Issues. Available at: https://blogs.microsoft.com/on-the-issues/2021/01/28/sustainability-year-progress-decade-action/ (Accessed: 14 July 2021).
7. Shopify (2021) Shopify Purchases More Direct Air Capture (DAC) Carbon Removal Than Any Other Company. Available at: https://news.shopify.com/shopify-purchases-more-direct-air-capture-dac-carbon-removal-than-any-other-company (Accessed: 14 July 2021).
8. Global CCS Institute (2020) ‘Cumulative Global CO2 Capture Data’.
9. United States Congress (2020b) Energy and Water Development Appropriations explanation of the accompanying bill making appropriations. United States House of Representatives. Available at: https://www.congress.gov/116/crpt/hrpt449/CRPT-116hrpt449.pdf.
10. United States Department of Energy (2020) Enabling A Low-Carbon Economy. Available at: https://www.energy.gov/sites/prod/files/2020/07/f76/USDOE_FE_Hydrogen_Strategy_July2020.pdf.
11. United States Congress (2020a) Consolidated Appropriations Act, 2021. Available at: https://rules.house.gov/sites/democrats.rules.house.gov/files/BILLS-116HR133SA-RCP-116-68.pdf.
12. Internal Revenue Service (2021) Federal Register. Available at: https://www.federalregister.gov/documents/2021/01/15/2021-00302/credit-for-carbon-oxide-sequestration.
13. State of Louisiana (2021) Class VI USEPA Primacy Application for Underground Injection Control Program. Available at: http://www.dnr.louisiana.gov/assets/OC/im_div/uic_sec/ClassVIPrimacyApplicationstamped.pdf.
14. US EPA (2021) Class VI Wells Used for Geologic Sequestration of CO2. Available at: https://www.epa.gov/uic/class-vi-wells-used-geologic-sequestration-co2 (Accessed: 4 July 2021).
15. Texas General Land Office (2021) Texas General Land Office/Lease of Permanent School Fund Land. Available at: http://www.txsmartbuy.com/esbddetails/view/21-SLB-1-ST.
16. Environment and Climate Change Canada (2020) A Healthy Environment and a Healthy Economy: Canada’s strengthened climate plan to create jobs and support people, communities and the planet. Available at: https://www.canada.ca/en/services/environment/weather/climatechange/climate-plan/climate-plan-overview/healthy-environment-healthy-economy.html.
17. NRCan (2020) Hydrogen Strategy For Canada - Seizing the Opportunities for Hydrogen. Available at: https://www.nrcan.gc.ca/sites/www.nrcan.gc.ca/files/environment/hydrogen/NRCan_Hydrogen-Strategy-Canada-na-en-v3.pdf.
18. Government of Canada (2020) Canada Gazette , Part I , Volume 154, Number 51 : Clean Fuel Regulations. Available at: https://canadagazette.gc.ca/rp-pr/p1/2020/2020-12-19/html/reg2-eng.html#reg (Accessed: 4 July 2021).
19. Government of Canada (2021b) Compliance options to meet the Clean Fuel Standard How it drives innovation and economic growth Timelines to implement the standard. Available at: https://www.canada.ca/en/environment-climate-change/services/managing-pollution/energy-production/fuel-regulations/clean-fuel-standard/compliance-options.html (Accessed: 5 July 2021).
20. Government of Canada (2021a) Budget 2021 A Healthy Environment for a Healthy Economy. Available at: https://www.canada.ca/en/department-finance/news/2021/04/budget-2021-a-healthy-environment-for-a-healthy-economy.html.
21. Government of Alberta (2020) Jobs for Alberta, Innovative Tech for the World. Available at: www.eralberta.ca/media-releases/jobs-for-alberta-innovative-tech-for-the-world/ (Accessed: 4 July 2021).
22. Alberta Energy (2020) Natural Gas Vision and Strategy. Available at: https://open.alberta.ca/publications/getting-alberta-back-to-work-natural-gas-vision-and-strategy.
23. Government of Alberta (2021) Information Letter 2021-19: Carbon Sequestration Tenure Management. Available at: https://inform.energy.gov.ab.ca/Documents/Published/IL-2021-19.pdf.
24. Supreme Court of Canada (2021) Case in Brief. Available at: https://www.scc-csc.ca/case-dossier/cb/2021/38663-38781-39116-eng.aspx 1 (Accessed: 4 July 2021).
25. Government of Canada (2021c) GOC Carbon Tax 2030. Available at: https://www.canada.ca/content/dam/eccc/documents/pdf/climate-change/climate-plan/annex_pricing_carbon_pollution.pdf.
26. ExxonMobil (2021b) The promise of carbon capture and storage, and a Texas-sized call to action. Available at: https://energyfactor.exxonmobil.com/insights/partners/houston-ccs-hub/ (Accessed: 4 July 2021).
27. ExxonMobil (2021a) Charting a bold concept for a lower-carbon future. Available at: https://energyfactor.exxonmobil.com/reducing-emissions/carbon-capture-and-storage/lcs-houston-ccs-concept/ (Accessed: 4 July 2021).
28. Pembina Energy (2021) Pembina and TC Energy Partner to Create World-Scale CarbonTransportation and Sequestration Solution: The Alberta Carbon Grid. Available at: https://www.pembina.com/media-centre/news/details/135509/ (Accessed: 4 July 2021).
29. Oil Sands Pathways to Net Zero (2021) Canada’s largest oil sands producers announce unprecedented alliance to achieve net zero greenhouse gas emissions. Available at: https://www.cenovus.com/news/news-releases/2021/06-09-2021-canadas-largest-oil-sands-producers-announce-unprecedented-alliance.pdf (Accessed: 5 July 2021).
30. Summit Carbon Solutions (2021) Summit Carbon Solutions Announces Expansion into Nebraska and Consultant Partnerships. Available at: https://www.summitcarbonsolutions.com/news/scsexpansionannouncement (Accessed: 4 July 2021).
31. Valero (2021) Valero and BlackRock Partner with Navigator to Announce Large-Scale Carbon Capture and Storage Project. Available at: https://static1.squarespace.com/static/6037ccf97a5a7822414fbce3/t/6050ff25e032a677ff2bb4f0/1615920933287/CCS+Press+Release_Final.pdf (Accessed: 5 July 2021).
32. Navigator CO2 Ventures (2021) Navigator Announces Binding Open Season For Carbon Capture Project. Available at: https://www.prnewswire.com/news-releases/navigator-announces-binding-open-season-for-carbon-capture-project-301309008.html (Accessed: 5 July 2021).
33. NextDecade (2021) NextDecade Announces NEXT Carbon Solutions. Available at: http://investors.next-decade.com/news-releases/news-release-details/nextdecade-launches-next-carbon-solutions (Accessed: 5 July 2021).
34. Venture Global LNG (2021) Venture Global Launches CarbonCapture and Sequestration Project. Available at: https://venturegloballng.com/press/venture-global-launches-carbon-capture-and-sequestration-project/.
6.0 REFERENCES
76 77

48. Ministry of Ecology and Environment (2021) Guidance on strengthening ecology and environment protection and promoting quality development in Free Trade Zone. Available at: http://www.mee.gov.cn/xxgk2018/xxgk/xxgk03/202105/t20210531_835481.html?keywords= (Accessed: 20 June 2021).
49. Xinhua (2021) China-U.S. Joint Statement Addressing the Climate Crisis. Available at: http://www.xinhuanet.com/world/2021-04/18/c_1127342714.htm (Accessed: 20 June 2021).
50. National Development and Reform Commission (2021) Notice on submitting CCUS projects information. Available at: https://www.ndrc.gov.cn/xwdt/tzgg/202106/t20210623_1283822.html.
51. Netease (2021) National CCUS Standards Working Group Established. Available at: https://www.163.com/dy/article/G556ROD50514R9OJ.html (Accessed: 21 June 2021).
52. BHP (2020) BHP partners with China Baowu to address the challenges of climate change. Available at: https://www.bhp.com/media-and-insights/news-releases/2020/11/bhp-partners-with-china-baowu-to-address-the-challenges-of-climate-change/ (Accessed: 21 June 2021).
53. Ammonia Energy Association (2020) Saudi Arabia ships low-carbon ammonia to Japan. Available at: https://www.ammoniaenergy.org/articles/saudi-arabia-ships-low-carbon-ammonia-to-japan/ (Accessed: 9 July 2021).
54. JOGMEC (2020) Initiation of Joint Feasibility Study of Ammonia Value Chain between eastern Siberia and Japan for future low-carbon ammonia introduction. Available at: http://www.jogmec.go.jp/english/news/release/news_08_000019.html (Accessed: 20 June 2021).
55. JOGMEC (2021) INPEX, JERA and JOGMEC Sign Joint Study Agreement withADNOC on Exploring the Commercial Potential of CleanAmmonia Production Business in the United Arab Emirates. Available at: http://www.jogmec.go.jp/english/news/release/news_15_000001_00021.html (Accessed: 9 July 2021).
56. Ministry of Economy, Trade and Industry, J. (METI) (2021) ‘Asia CCUS Network’ has launched. Available at: https://www.meti.go.jp/english/press/2021/0622_001.html (Accessed: 9 July 2021).
57. PETRONAS (2021) An Offer Like No Other. Available at: https://www.petronas.com/flow/business/offer-no-other (Accessed: 20 June 2021).
58. Internal Revenue Service (2020) Notice 2020-12: Beginning of Construction for the Credit for Carbon Oxide Sequestration under Section 45Q. Available at: https://www.irs.gov/pub/irs-drop/n-20-12.pdf.
59. ADB (2019) ARTICLE 6 OF THE PARIS AGREEMENT Drawing Lessons from the Joint Crediting Mechanism. Manila. Available at: https://www.adb.org/sites/default/files/publication/541116/article6-paris-agreeement-jcm.pdf.
60. Zapantis, A. (2021) Blue Hydrogen. Available at: https://www.globalccsinstitute.com/resources/publications-reports-research/blue-hydrogen/.
35. Seeking Alpha (2021b) Sempra Energy Earnings Call Transcript - CEO Jeff Martin on Q1 2021 Results. Available at: https://seekingalpha.com/article/4424717-sempra-energy-sre-ceo-jeff-martin-on-q1-2021-results-earnings-call-transcript.
36. Seeking Alpha (2021a) Cheniere Energy Earnings Call Transcript - CEO Jack Fusco on Q1 2021 Results. Available at: https://seekingalpha.com/article/4424219-cheniere-energy-inc-lng-ceo-jack-fusco-on-q1-2021-results-earnings-call-transcript.
37. G2 Net-Zero LNG and NET Power (2021) G2 and NET Power Accelerate G2 Net-Zero LNG’s Project Development. Available at: http://g2net-zerolng.com/21 05 05 G2 FINAL NET Power Press Release.pdf.
38. Santos (2021) SANTOS AND ENI SIGN MOU TO COLLABORATE IN NORTHERN AUSTRALIA AND TIMOR-LESTE. Available at: https://www.santos.com/news/santos-and-eni-sign-mou-to-collaborate-in-northern-australia-and-timor-leste/ (Accessed: 22 June 2021).
39. Australian Financial Review (2021) Gorgon CCS headaches to increase emissions bill. Available at: https://www.afr.com/companies/energy/gorgon-ccs-headaches-to-increase-emissions-bill-20210114-p56u0l (Accessed: 12 July 2021).
40. HESC (2021) Suiso Frontier arriving in Australia in the second half of the 2021 Japanese fiscal year. Available at: https://hydrogenenergysupplychain.com/suiso-frontier-arriving-in-australia-in-the-second-half-of-the-2021-japanese-fiscal-year/ (Accessed: 20 June 2021).
41. Department of Industry Science Energy and Resources (2020) Technology Investment Roadmap: First Low Emissions Technology Statement in 2020. Canberra. Available at: https://www.industry.gov.au/sites/default/files/September 2020/document/first-low-emissions-technology-statement-2020.pdf.
42. Prime Minister of Australia (2021a) Jobs Boost From New Emissions Reduction Projects. Available at: https://www.pm.gov.au/media/jobs-boost-new-emissions-reduction-projects (Accessed: 20 June 2021).
43. Department of Industry Science Energy and Resources (2021) $412 million of new investment in carbon capture projects. Available at: https://www.minister.industry.gov.au/ministers/taylor/media-releases/412-million-new-investment-carbon-capture-projects (Accessed: 21 June 2021).
44. Prime Minister of Australia (2021b) Joint Statement by the Prime Ministers of Singapore and Australia. Available at: https://www.pm.gov.au/media/joint-statement-prime-ministers-singapore-and-australia (Accessed: 9 July 2021).
45. Sinopec (2021) Sinopec launches China’s first million tonne per annum CCUS Project. Available at: http://qlsh.sinopec.com/qlsh/news/all_media/20210707/news_20210707_400476138102.shtml (Accessed: 9 July 2021).
46. Hebei Iron and Steel Group (2021) HBIS Group Accelerate Low Carbon Green Development. Available at: https://www.hbisco.com/site/group/newsinfo/info/2021/16031.html (Accessed: 9 July 2021).
47. Congress, N. P. (2021) 14th Five-Year Plan. Available at: http://www.gov.cn/xinwen/2021-03/13/content_5592681.htm.
4.0 PATHWAYS IN FOCUS
1. Kearns, D., Liu, H. and Consoli, C. (2021) Technology Readiness and Costs of CCS. Melbourne, Australia. Available at: globalccsinstitute.com.
2. United States Environmental Protection Agency (2019) ‘Facility Level Information on GreenHouse Gases Tool (FLIGHT)’. United States Environmental Protection Agency.
3. International Energy Agency (IEA) (2020a) Cement. Paris.
4. AggNet (2020) ‘Brevik CCS facility gets the go-ahead’, AggNet, 18 December.
5. Aker Solutions (2020) Aker Solutions Awarded Contract for the Brevik Carbon Capture Project. Available at: https://www.akersolutions.com/news/news-archive/2020/aker-solutions-awarded-contract-for-the-brevik-carbon-capture-project/ (Accessed: 6 July 2021).
6. Dempsey, H. (2021) HeidelbergCement aims to tackle emissions with new carbon-neutral cement plant, Financial Times.
7. International Energy Agency (2020) Direct CO2 emissions in the iron and steel sector by scenario, 2019-2050. Available at: https://www.iea.org/data-and-statistics/charts/direct-co2-emissions-in-the-iron-and-steel-sector-by-scenario-2019-2050 (Accessed: 6 July 2021).
8. Hydrogen Council (2017) ‘Hydrogen scaling up : A sustainable pathway for the global energy transition. www.hydrogencouncil.com’, Hydrogen scaling up: A sustainable pathway for the global energy transition, (November), p. 80.
9. Mehmeti, A. et al. (2018) ‘Life Cycle Assessment and Water Footprint of Hydrogen Production Methods: From Conventional to Emerging Technologies’, Environments, 5(2), p. 24. doi: 10.3390/environments5020024.
10. CO2RE Database (2021) Global CCS Institute. Available at: https://co2re.co/ (Accessed: 25 June 2021).
11. Bruce, S. et al. (2018) National Hydrogen Roadmap.
12. Naterer, G. F., Jaber, O. and Dincer, I. (2010) ‘Environmental Impact Comparison of Steam Methane Ref- ormation and Thermochemical Processes of Hydrogen Pro- duction Environmental Impact Comparison of Steam Methane Reformation and Thermochemical Processes of Hydrogen Production’, Essen Schriften des Forschungszentrums Jülich / Energy & Environment, 78, pp. 1–7.
13. International Energy Agency (2019) ‘The Future of Hydrogen for G20. Seizing today’s opportunities’, Report prepared by the IEA for the G20, Japan, (June).
14. The Asian Renewable Energy Hub (2020).
15. International Energy Agency (IEA) (2020b) Circular Carbon Economy: Cross-Cutting: Hydrogen.
16. Fan, Z. et al. (2021) Green Hydrogen in a Circular Carbon Economy: Opportunities and Limits.
17. Wurzbacher, J. A. (2021) The world’s biggest climate-positive direct air capture plant: Orca!, Climeworks website. Available at: https://www.climeworks.com/orca (Accessed: 18 June 2021).
6.0 REFERENCES
18. Tamme, E. (2021) ‘Carbon removal with CCS technologies’. Global CCS Institute. Available at: https://www.globalccsinstitute.com/resources/publications-reports-research/carbon-removal-and-ccs/.
19. National Academies (2019) Negative Emissions Technologies and Reliable Sequestration. Washington, D.C.: National Academies Press. doi: 10.17226/25259.
20. CARBFIX (2020) Mineral Storage Atlas, https://www.carbfix.com/atlas.
21. AngloAmerican (2020) Sustainability Report 2020.
22. Snæbjörnsdóttir, S. Ó. et al. (2020) ‘Carbon dioxide storage through mineral carbonation’, Nature Reviews Earth & Environment, 1(2). doi: 10.1038/s43017-019-0011-8.
23. Voigt, M. et al. (2021) ‘An experimental study of basalt–seawater–CO2 interaction at 130 °C’, Geochimica et Cosmochimica Acta, 308. doi: 10.1016/j.gca.2021.05.056.
24. White, S. K. et al. (2020) ‘Quantification of CO2 Mineralization at the Wallula Basalt Pilot Project’, Environmental Science & Technology, 54(22). doi: 10.1021/acs.est.0c05142..
5.0 APPENDICES
1. White, S. K. et al. (2020) ‘Quantification of CO2 Mineralization at the Wallula Basalt Pilot Project’, Environmental Science & Technology, 54(22). doi: 10.1021/acs.est.0c05142.
2. Metz, B. et al. (2005) IPCC special report on carbon dioxide capture and storage. Cambridge: Cambridge University Press.
78 79

BACK PAGE
Find Out MoreThe Global CCS Institute provides knowledge, data, networking and advocacy services to its members and offers a comprehensive range of consultancy services related to CCS.
Any QuestionsContact a member of the Advocacy and Communications Team globalccsinstitute.com/contact
Head OfficeLevel 16, 360 Elizabeth Street, Melbourne VIC 3000 AustraliaP +61 (0)3 8620 7300
©Global Carbon Capture and Storage Institute Ltd 2021Unless stated otherwise, copyright to this publication is licensed under a Creative Commons Attribution-NonCommercial-NoDerivatives 4.0 International Licence. The Global CCS Institute has tried to make information in this publication as accurate as possible. However, it does not guarantee that the information in this publication is totally reliable, accurate or complete. Therefore, the information in this publication should not be relied upon solely when making investment or commercial decisions.The Global CCS Institute has no responsibility for the persistence or accuracy of URLs to any external or third party internet websites referred to in this publication and does not guarantee that any content on such websites is, or will remain, accurate or appropriate. To the maximum extent permitted, the Global CCS Institute, its employees and advisers accept no liability (including for negligence) for any use or reliance on the information in this publication, including any commercial or investment decisions made on the basis of information provided in this publication.
Please use the following to reference the report: Global CCS Institute, 2021. The Global Status of CCS: 2021. Australia.
Design by Fluid Branding fluid.com.au