the home ownership gap
TRANSCRIPT

8/9/2019 The Home Ownership Gap
http://slidepdf.com/reader/full/the-home-ownership-gap 1/11
c u r r e n t
i s s u
e s
F E D E R A L
R E S E R V E
B A N K
O F N E W
Y O R K
I N
E C
O
N
O
M
I C
S
A
N
D
F
I N
A
N
C
E
V o l u m e 1 6 , N u m b e r 5 ✦ M a y 2 0 1 0 ✦ w w w . n e w y o r k f e d . o r g / r e s e a r c h / c u r r e n t_ i s s u e s
The Homeownership Gap
Andrew Haughwout, Richard Peach, and Joseph Tracy
Recent years have seen a sharp rise in the number of negative equityhomeowners—those who owe more on their mortgages than their houses are worth. These homeowners are included in the official homeownership rate computed by the Census Bureau, but the savingsthey must amass to retain their home or purchase a new home aredaunting. Recognizing that these homeowners are likely to convert to renters over time, the authors of this analysis calculate an“effective” rate of homeownership that excludes negative equity
households. They argue that the effective rate—5.6 percentage points below the official rate—may be a useful guide to the future path of the official rate.
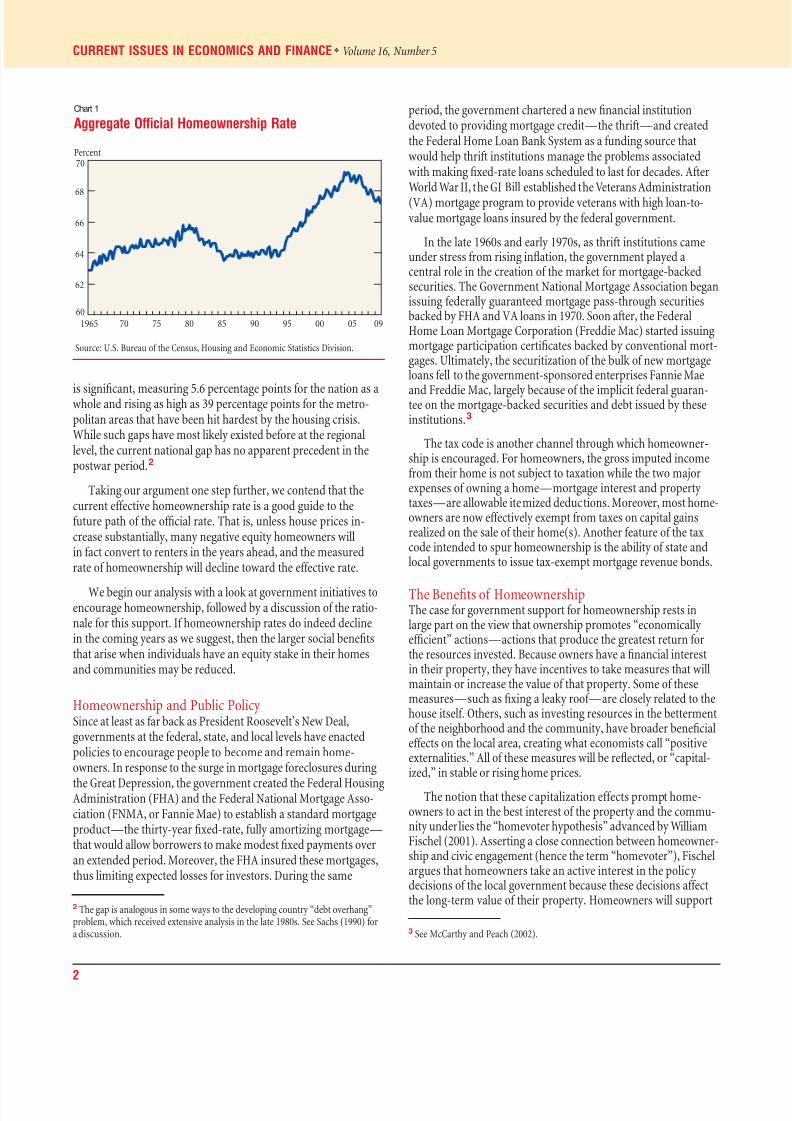
Homeownership is often seen as an integral part of the American dream, andencouraging homeownership has historically been an important feature of U.S.public policy. In 1995, the rate of homeownership in the United States began a
steep rise and between 2004 and 2006, peaked at 69 percent (Chart 1). 1 The last threeyears, however, have seen a marked reversal of this trend. As the housing boom col-lapsed and the recession fueled a sharp rise in unemployment, the homeownershiprate fell to 67.2 percent in the fourth quarter of 2009—its most recent reading anda reversion to its second-quarter 2000 level. Strikingly, the ongoing decline in thehomeownership rate is approaching in magnitude the 2.3 percentage point slideobserved in the early 1980s.
A question of broad interest is how large the decline in the homeownership ratewill ultimately prove to be. In this edition of Current Issues, we assess the downwardpressure on this rate and introduce the notion of a “homeownership gap” as a usefulgauge of the possible extent of the rate’s decline over the next several years.
Our concept of a homeownership gap reflects the dramatic growth in the numberof negative equity homeowners—those who owe more on their mortgages than theirhouses are worth—in the current housing market. While the official homeownershiprate tabulated by the Census Bureau includes negative equity homeowners in its countof owner-occupied houses, our calculations suggest that these homeowners would
need to ramp up their savings by formidable amounts in order to retain their homesor purchase a new home. Thus, we calculate an “effective” homeownership rate thatexcludes negative equity homeowners from the sum of owner-occupied houses andcounts them instead as the renters they are likely to become over time. We find thatthe difference between the official and the effective rates—the homeownership gap—
1 The U.S. Bureau of the Census tabulates quarterly homeownership rates for the nation and for individualstates and metropolitan statistical areas. The measured home ownership rate is the ratio of the number of owner-occupied housing units divided by the total number of occupied housing units. Second homes andvacation homes are excluded from the calculation. In addition, properties that are currently vacant—evenif previously owned or rented—are also excluded. See http://www.census.gov/hhes/www/housing/hvs/annual08/ann08ind.html.
8/9/2019 The Home Ownership Gap
http://slidepdf.com/reader/full/the-home-ownership-gap 2/11
2
CURRENT ISSUES IN ECONOMICS AND FINANCE ❖ Volume 16, Number 5
is significant, measuring 5.6 percentage points for the nation as awhole and rising as high as 39 percentage points for the metro-politan areas that have been hit hardest by the housing crisis.While such gaps have most likely existed before at the regionallevel, the current national gap has no apparent precedent in thepostwar period.2
Taking our argument one step further, we contend that thecurrent effective homeownership rate is a good guide to thefuture path of the official rate. That is, unless house prices in-crease substantially, many negative equity homeowners willin fact convert to renters in the years ahead, and the measuredrate of homeownership will decline toward the effective rate.
We begin our analysis with a look at government initiatives toencourage homeownership, followed by a discussion of the ratio-nale for this support. If homeownership rates do indeed declinein the coming years as we suggest, then the larger social benefitsthat arise when individuals have an equity stake in their homesand communities may be reduced.
Homeownership and Public PolicySince at least as far back as President Roosevelt’s New Deal,governments at the federal, state, and local levels have enactedpolicies to encourage people to become and remain home-owners. In response to the surge in mortgage foreclosures during
the Great Depression, the government created the Federal HousingAdministration (FHA) and the Federal National Mortgage Asso-ciation (FNMA, or Fannie Mae) to establish a standard mortgageproduct—the thirty-year fixed-rate, fully amortizing mortgage—that would allow borrowers to make modest fixed payments overan extended period. Moreover, the FHA insured these mortgages,thus limiting expected losses for investors. During the same
2 The gap is analogous in some ways to the developing country “debt overhang”problem, which received extensive analysis in the late 1980s. See Sachs (1990) fora discussion.
period, the government chartered a new financial institutiondevoted to providing mortgage credit—the thrift—and createdthe Federal Home Loan Bank System as a funding source thatwould help thrift institutions manage the problems associatedwith making fixed-rate loans scheduled to last for decades. AfterWorld War II, the GI Bill established the Veterans Administration(VA) mortgage program to provide veterans with high loan-to-value mortgage loans insured by the federal government.
In the late 1960s and early 1970s, as thrift institutions cameunder stress from rising inflation, the government played acentral role in the creation of the market for mortgage-backedsecurities. The Government National Mortgage Association beganissuing federally guaranteed mortgage pass-through securitiesbacked by FHA and VA loans in 1970. Soon after, the FederalHome Loan Mortgage Corporation (Freddie Mac) started issuingmortgage participation certificates backed by conventional mort-gages. Ultimately, the securitization of the bulk of new mortgageloans fell to the government-sponsored enterprises Fannie Mae
and Freddie Mac, largely because of the implicit federal guaran-tee on the mortgage-backed securities and debt issued by theseinstitutions.3
The tax code is another channel through which homeowner-ship is encouraged. For homeowners, the gross imputed incomefrom their home is not subject to taxation while the two majorexpenses of owning a home—mortgage interest and propertytaxes—are allowable itemized deductions. Moreover, most home-owners are now effectively exempt from taxes on capital gainsrealized on the sale of their home(s). Another feature of the taxcode intended to spur homeownership is the ability of state andlocal governments to issue tax-exempt mortgage revenue bonds.
The Benefits of HomeownershipThe case for government support for homeownership rests inlarge part on the view that ownership promotes “economicallyefficient” actions—actions that produce the greatest return forthe resources invested. Because owners have a financial interestin their property, they have incentives to take measures that willmaintain or increase the value of that property. Some of thesemeasures—such as fixing a leaky roof—are closely related to thehouse itself. Others, such as investing resources in the bettermentof the neighborhood and the community, have broader beneficialeffects on the local area, creating what economists call “positiveexternalities.” All of these measures will be reflected, or “capital-ized,” in stable or rising home prices.
The notion that these capitalization effects prompt home-owners to act in the best interest of the property and the commu-nity underlies the “homevoter hypothesis” advanced by WilliamFischel (2001). Asserting a close connection between homeowner-ship and civic engagement (hence the term “homevoter”), Fischelargues that homeowners take an active interest in the policydecisions of the local government because these decisions affectthe long-term value of their property. Homeowners will support
3 See McCarthy and Peach (2002).
Source: U.S. Bureau of the Census, Housing and Economic Statistics Division.
Chart 1
Aggregate Official Homeownership Rate
Percent
60
62
64
66
68
70
0905009590858075701965
8/9/2019 The Home Ownership Gap
http://slidepdf.com/reader/full/the-home-ownership-gap 3/11
efficient public policies and projects—say, those that do themost to enhance the quality of the services and schools in theircommunities and thus to maximize the value of their homes—inmuch the same way that a corporation’s shareholders will supportprivate projects that have a positive net present value for the firm.
However, the incentives that, in this view, motivate most home-owners will not operate for one subset of homeowners—negativeequity homeowners, or those whose mortgage balance exceedsthe value of their home. For these homeowners, any increasein the value of their house will accrue not to them, but to themortgage lender (up to the value of the mortgage). Thus, withlittle to gain, negative equity homeowners will be much less likelyto pursue improvements in their homes or communities. Theirsituation is essentially analogous to that of renters, who have littleincentive to make improvements to the homes they occupy sinceit is the landlord who reaps the economic benefits.
The homevoter hypothesis is compelling, but is there evidence
for the view that house price capitalization induces homeownersto act in the best interests of the property and the community?Researchers have documented that homeowners typically spendseveral thousand dollars a year in maintenance and repairs tooffset the depreciation of their house over time (Gyourko andTracy 2006; Harding, Sirmans, and Rosenthal 2007). Conversely,negative equity homeowners have been found to under-maintain their property relative to other homeowners during regionalhouse price declines (Gyourko and Saiz 2004). Also consistentwith the homevoter hypothesis are studies showing that elderlyhome-owners who have no school-age children still support localeducation bond issues. While altruism may be a factor, the home-owners appear to be motivated mostly by a belief that backing
local schools will increase the value of their house (Bergstrom,Rubinfeld, and Shapiro 1982; Hilber and Mayer 2009). Otherresearch has demonstrated that children of homeowners are morelikely to finish school than the children of renters and less likelyto become teenaged parents (Green and White 1997). Finally,home-owners have been found to vote at higher rates in localelections and to be more aware of local issues and the identitiesof state and local civic leaders (DiPasquale and Glaeser 1999).4
To be sure, not all researchers are persuaded that homeown-ership leads to increased civic engagement or improved main-tenance of homes and neighborhoods. Engelhardt et al. (2010)maintain that the measured benefits from homeownership stem
from the fact that people who choose to buy homes are simplymore likely than others to value investing in social capital. Con-tending that the homevoter hypothesis and similar arguments“overstate the impact of homeownership on political involve-ment,” the authors find that for the small sample of low-incomehouseholds in their study, the effect is “zero or negative.”
4 Recognition that property ownership carries with it particular interests is as oldas the republic itself. In Federalist 10, James Madison writes, “Those who hold andthose who are without property have ever formed distinct interests in society. Thosewho are creditors, and those who are debtors, fall under a like discrimination.”
Still, although dissenting views exist, the preponderance of research evidence at this point upholds the social benefits of homeownership. And continuing public support for homeowner-ship makes clear that policymakers regard the advantages forneighborhoods and communities as substantial.
Equity and the Homeownership GapThe role of house price capitalization in encouraging home-owners to support economically efficient actions depends onthe homeowner having positive equity in the house. For a home-owner in a negative equity position, this capitalization effect islikely small or nonexistent. If we assume that the homeownerwill seek to move within five years,5 then unless that homeownereither expects to be back in positive equity by the time of themove or intends to use other assets to pay off the loan in fullupon sale of the property, changes in the value of the house willonly affect returns to the lender (or the investor, if the mortgagehas been securitized).6
The idea that having a positive equity stake in one’s house iscritical to the positive externalities from homeownership leadsus to propose an alternative way to measure the homeownershiprate. Specifically, we seek to calculate an effective homeowner-ship rate, defined as the number of owner-occupied housingunits in which the household has a positive equity stake dividedby the total number of occupied housing units.7 This measureof homeownership assumes that negative equity owners are, ineffect, renters—hence the notion of an effective homeowner-ship rate. Owners with negative equity create a split betweenthe official homeownership rate compiled by the Census Bureauand the effective homeownership rate—a split that we term the
homeownership gap.
Since the homeownership gap reflects the extent of negativeequity in the housing market, it is also a gauge of the potentialdownward pressure on the official homeownership rate. Assum-ing that house prices do not appreciate over the next severalyears, negative equity households will very likely convert torenters when they move out of their current homes becausethey will be unable to save enough to cover the negative equity,the transaction costs of selling their existing home, and a downpayment on another home.8 As these transitions from owning torenting take place, the homeownership gap will narrow, with the
5 According to the most recent U.S. census, nearly half (47 percent) of allhomeowners moved in the last five years.
6 The extent to which the capitalization effect is shut off may be a function of themagnitude of the negative equity position.
7 Thus, we remove negative equity homeowners from the numerator of the officialhomeownership ratio but retain them in the denominator.
8 If the homeowner either defaults on the mortgage or negotiates a short-sale withthe lender, then the damage to the homeowner’s credit will likely prevent him orher from buying a house for several years, even if sufficient funds are availablefor a down payment.
www.newyorkfed.org/research/current_issues
3
8/9/2019 The Home Ownership Gap
http://slidepdf.com/reader/full/the-home-ownership-gap 4/11
4
CURRENT ISSUES IN ECONOMICS AND FINANCE ❖ Volume 16, Number 5
official homeownership rate dropping toward the effective rate.9 In this sense, the effective homeownership rate is a useful guideto the future course of the measured homeownership rate. Of course, negative equity homes that come onto the market may bepurchased by individuals who are currently renters—an outcome
that would mitigate the effect on the official homeownership rate.However, the number of foreclosed houses purchased by formerrenters is likely to be limited.
Measuring the Extent of Negative EquityTo construct the effective homeownership rate, we need to esti-mate the extent of negative equity across local housing markets.We start with loan-level data on nonprime mortgages from FirstAmerica LoanPerformance (LP) and on prime mortgages fromLender Processing Services (LPS) Applied Analytics (formerlyMcDash). These data indicate the loan-to-value (LTV) ratio foreach mortgage at origination.10 We update the loan-to-value ratioby adjusting the loan amount(s) to account for debt amortiza-
tion—the reduction in mortgage balances that accompaniesscheduled payments—and to reflect changes in the value of thehouse as indicated by a repeat-sale price index for the metro-politan statistical area (MSA) or, if the property is located outsidean MSA, for the state.11 The house price data are updated quar-terly, allowing us to construct a quarterly estimate of the currentLTV ratio for every mortgage in our data. We restrict our equitycalculations to owner-occupied primary residences since theseare the homes captured in the numerator of the Census Bureau’shomeownership rate.
Having constructed the estimates of LTV ratios, we need tospecify the level of the current LTV ratio that is associated with
9 Public policy initiatives such as mortgage modification and the tax credit forfirst-time home buyers can affect the speed of the decline in the official rate.
10 The LTV ratio is measured as the cumulative value of the mortgage balanceacross the first lien and any subordinate lien mortgages divided by the value of the house. We capture subordinate liens for nonprime mortgages exclusively andonly if the lien was present at the origination of the first lien. If the value of themortgage(s) equals the value of the house, we set the LTV to equal 100 (ratherthan a value of 1).
11 We use the Office of Federal Housing Enterprise Oversight/Federal HousingFinance Agency (OFHEO/FHFA) repeat-sale price indexes. A widely citedalternative set of repeat-sale price indexes, discussed later in the article, arethe S&P/Case-Shiller indexes, which are available for only twenty MSAs.
an owner behaving more like a renter. By convention, a mortgageis judged to be in negative equity if the current LTV exceeds 100,but a key consideration is the value of the current LTV that wouldallow a household to break even when it eventually sells its home.Therefore, some additional factors need to be taken into account.
First, we need to consider the transaction costs involved inselling a house.12 If we assume that these costs amount to 6 per-cent of the sale price, then the LTV at the date of the sale wouldneed to be no higher than 94 for the household to break even onthe sale. Second, for mortgages whose current LTV is above 94, weneed to assess how long it would take to bring the ratio down to94 through scheduled debt amortization, assuming no further net
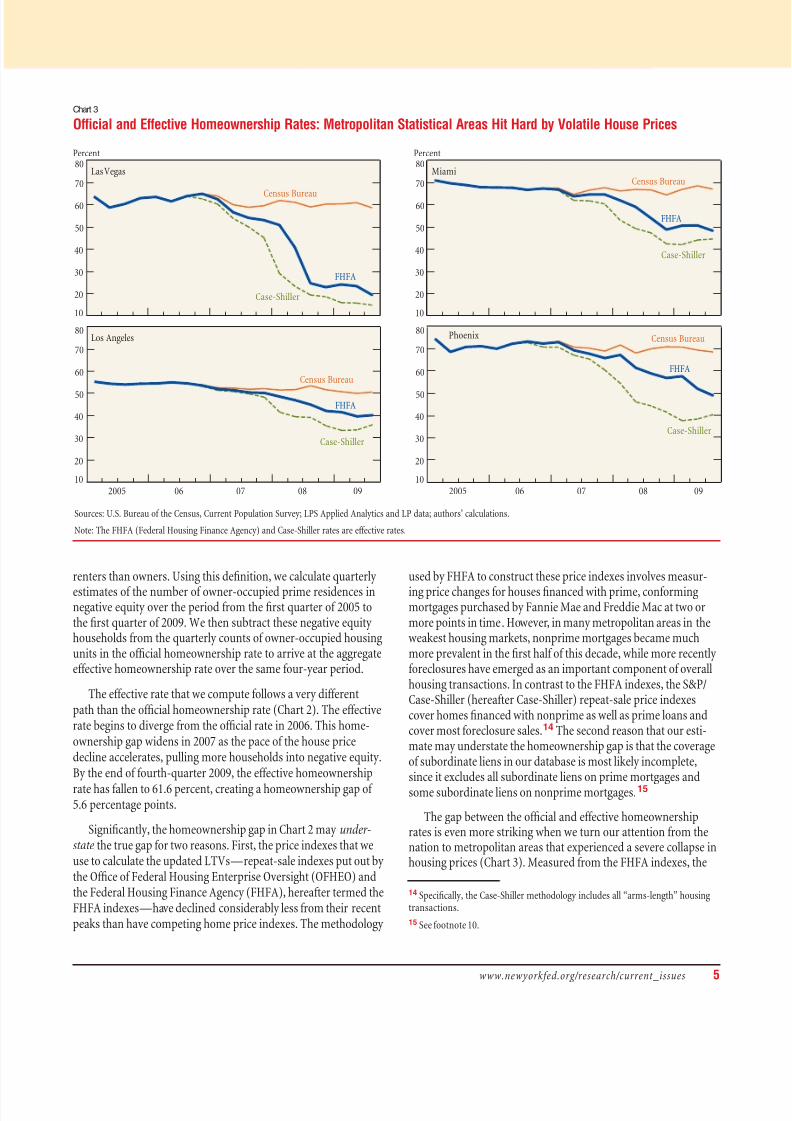
changes in the price of the home.13 Our findings are presented inTable 1, which divides the negative equity mortgages in our datainto percentiles on the basis of the number of months that wouldbe required to bring the LTV down to 94. The distribution reflectsboth the differing magnitudes of negative equity and the remain-ing payment periods for mortgages in our data. Of the mortgageswhose current LTV is greater than 100, 90 percent would takelonger than five years to reach an LTV of 94 through the sched-uled debt pay-down process. The median mortgage in this groupwould take more than twelve years to reach an LTV of 94. If welook at mortgages with even higher current LTVs, the length of time required to reach the break-even point would increase quitesignificantly.
For the purpose of constructing our alternative homeowner-ship rate, we conclude that the incentives to behave like an ownerare very weak if the benefits from this behavior require living inthe house for more than five years. Thus, we identify a currentLTV of 100—that is, the standard definition of negative equity—as our marker for households that are likely to behave more as
12 These include the fees to brokers as well as taxes and transfer fees.
13 This is consistent with house prices continuing to decline over the next yearbut then recovering by the sale date.
Table 1
Number of Months Required for DebtAmortization to Lower the LTV Ratio to 94
Percentiles
Current LTV 10th 25th 50th 75th 90th
> 100 69 99 145 198 242
> 105 95 120 161 208 249
> 110 114 137 174 216 256
Note: Calculations assume constant house prices.
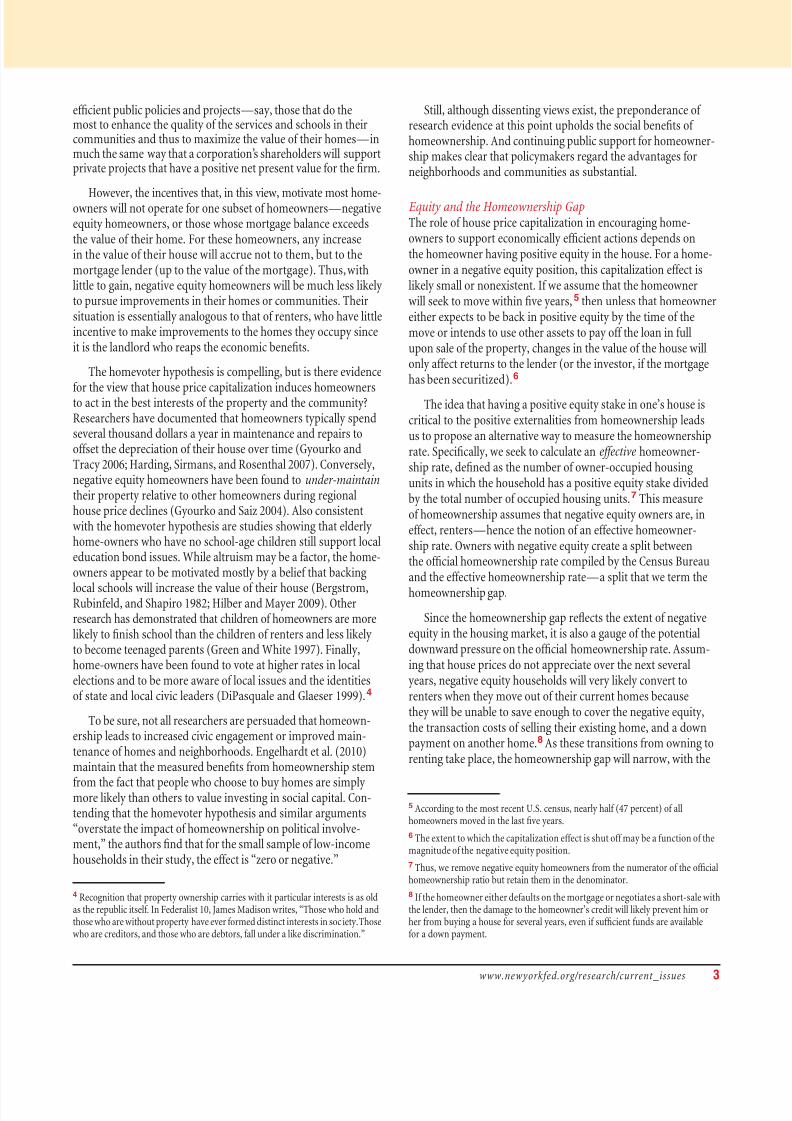
Sources: U.S. Bureau of the Census; LPS Applied Analytics and LP data;authors’ calculations.
Chart 2
Aggregate Official and Effective Homeownership Rates
Percent
60
62
64
66
68
70
Effective
Official
090807062005
8/9/2019 The Home Ownership Gap
http://slidepdf.com/reader/full/the-home-ownership-gap 5/11
www.newyorkfed.org/research/current_issues
5
renters than owners. Using this definition, we calculate quarterly
estimates of the number of owner-occupied prime residences innegative equity over the period from the first quarter of 2005 tothe first quarter of 2009. We then subtract these negative equityhouseholds from the quarterly counts of owner-occupied housingunits in the official homeownership rate to arrive at the aggregateeffective homeownership rate over the same four-year period.
The effective rate that we compute follows a very differentpath than the official homeownership rate (Chart 2). The effectiverate begins to diverge from the official rate in 2006. This home-ownership gap widens in 2007 as the pace of the house pricedecline accelerates, pulling more households into negative equity.By the end of fourth-quarter 2009, the effective homeownership
rate has fallen to 61.6 percent, creating a homeownership gap of 5.6 percentage points.
Significantly, the homeownership gap in Chart 2 may under-state the true gap for two reasons. First, the price indexes that weuse to calculate the updated LTVs—repeat-sale indexes put out bythe Office of Federal Housing Enterprise Oversight (OFHEO) andthe Federal Housing Finance Agency (FHFA), hereafter termed theFHFA indexes—have declined considerably less from their recentpeaks than have competing home price indexes. The methodology
used by FHFA to construct these price indexes involves measur-
ing price changes for houses financed with prime, conformingmortgages purchased by Fannie Mae and Freddie Mac at two ormore points in time. However, in many metropolitan areas in theweakest housing markets, nonprime mortgages became muchmore prevalent in the first half of this decade, while more recentlyforeclosures have emerged as an important component of overallhousing transactions. In contrast to the FHFA indexes, the S&P/Case-Shiller (hereafter Case-Shiller) repeat-sale price indexescover homes financed with nonprime as well as prime loans andcover most foreclosure sales.14 The second reason that our esti-mate may understate the homeownership gap is that the coverageof subordinate liens in our database is most likely incomplete,since it excludes all subordinate liens on prime mortgages andsome subordinate liens on nonprime mortgages.15
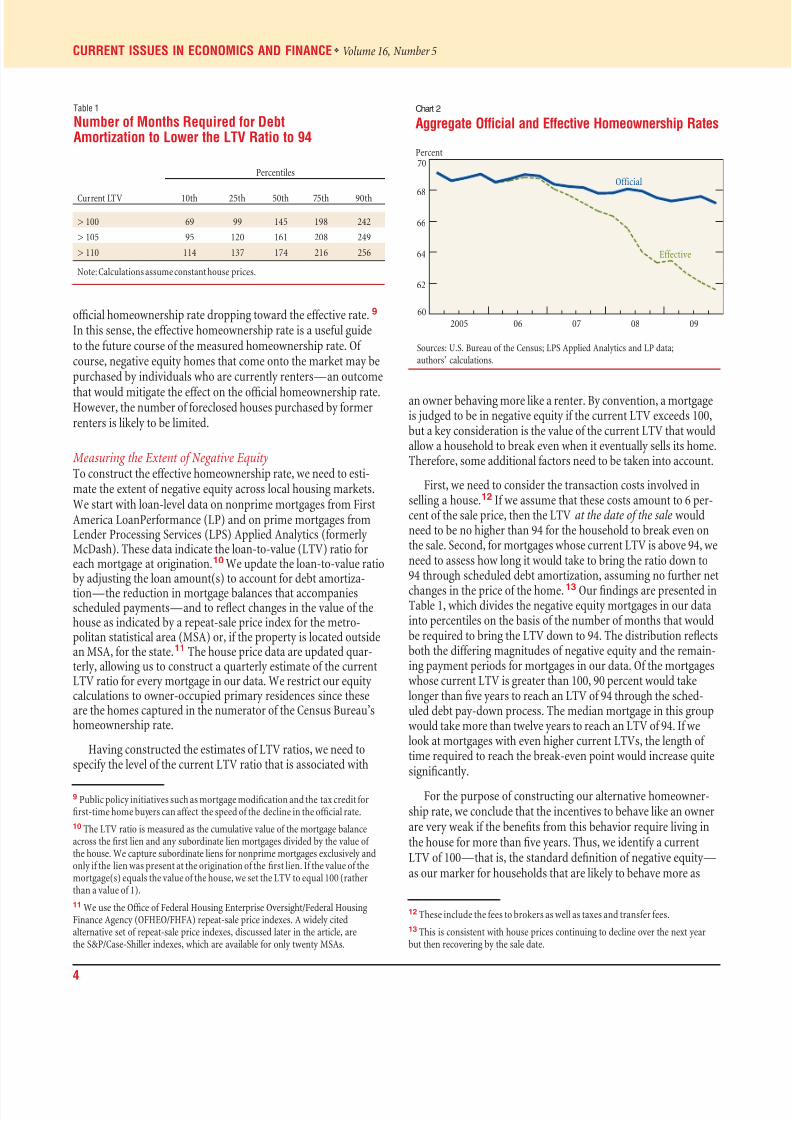
The gap between the official and effective homeownershiprates is even more striking when we turn our attention from thenation to metropolitan areas that experienced a severe collapse inhousing prices (Chart 3). Measured from the FHFA indexes, the
14 Specifically, the Case-Shiller methodology includes all “arms-length” housingtransactions.
15 See footnote 10.
Chart 3
Official and Effective Homeownership Rates: Metropolitan Statistical Areas Hit Hard by Volatile House Prices
Percent
Las Vegas
10
20
30
40
50
60
70
80
Census Bureau
Case-Shiller
FHFA
Percent
Miami
10
20
30
40
50
60
70
80
Census Bureau
Case-Shiller
FHFA
Los Angeles
10
20
30
40
50
60
70
80
Census Bureau
Case-Shiller
FHFA
090807062005
Phoenix
10
20
30
40
50
60
70
80Census Bureau
Case-Shiller
FHFA
090807062005
Sources: U.S. Bureau of the Census, Current Population Survey; LPS Applied Analytics and LP data; authors’ calculations.
Note: The FHFA (Federal Housing Finance Agency) and Case-Shiller rates are effective rates.
8/9/2019 The Home Ownership Gap
http://slidepdf.com/reader/full/the-home-ownership-gap 6/11
6
CURRENT ISSUES IN ECONOMICS AND FINANCE ❖ Volume 16, Number 5
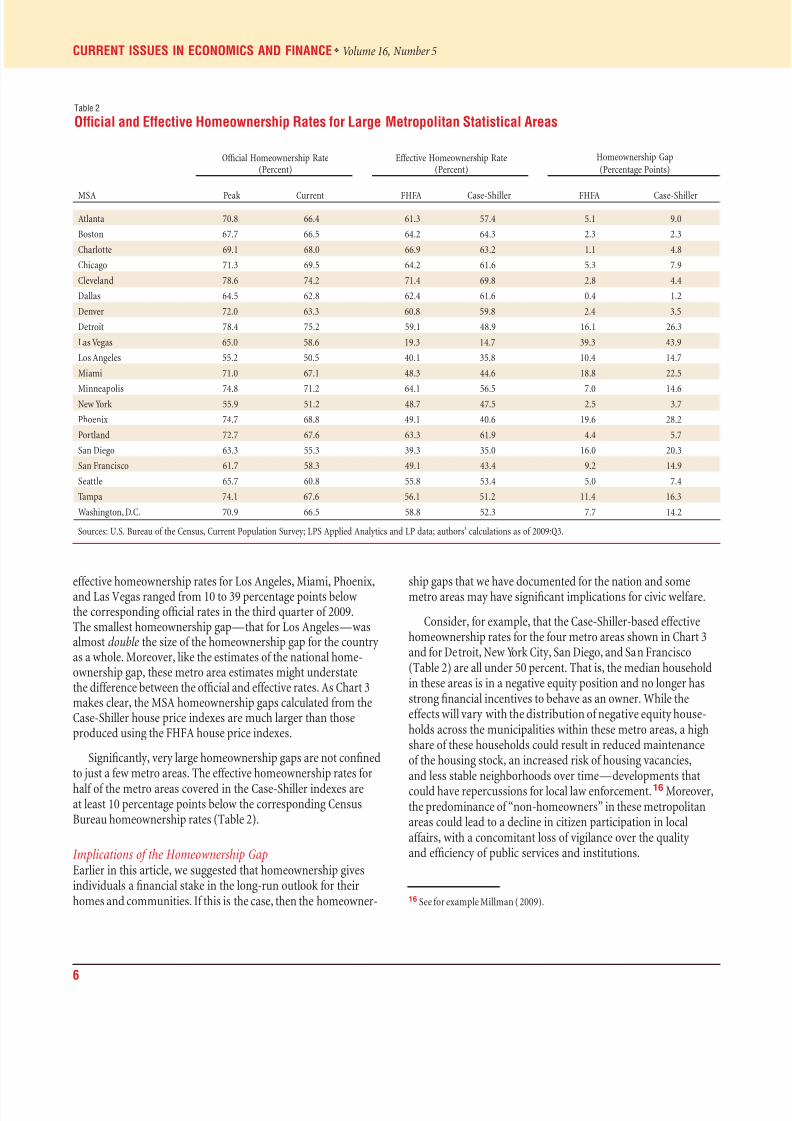
effective homeownership rates for Los Angeles, Miami, Phoenix,and Las Vegas ranged from 10 to 39 percentage points belowthe corresponding official rates in the third quarter of 2009.The smallest homeownership gap—that for Los Angeles—wasalmost double the size of the homeownership gap for the countryas a whole. Moreover, like the estimates of the national home-ownership gap, these metro area estimates might understatethe difference between the official and effective rates. As Chart 3makes clear, the MSA homeownership gaps calculated from theCase-Shiller house price indexes are much larger than thoseproduced using the FHFA house price indexes.
Significantly, very large homeownership gaps are not confinedto just a few metro areas. The effective homeownership rates for
half of the metro areas covered in the Case-Shiller indexes areat least 10 percentage points below the corresponding CensusBureau homeownership rates (Table 2).
Implications of the Homeownership GapEarlier in this article, we suggested that homeownership givesindividuals a financial stake in the long-run outlook for theirhomes and communities. If this is the case, then the homeowner-
ship gaps that we have documented for the nation and somemetro areas may have significant implications for civic welfare.
Consider, for example, that the Case-Shiller-based effectivehomeownership rates for the four metro areas shown in Chart 3and for Detroit, New York City, San Diego, and San Francisco(Table 2) are all under 50 percent. That is, the median householdin these areas is in a negative equity position and no longer hasstrong financial incentives to behave as an owner. While theeffects will vary with the distribution of negative equity house-holds across the municipalities within these metro areas, a highshare of these households could result in reduced maintenanceof the housing stock, an increased risk of housing vacancies,and less stable neighborhoods over time—developments thatcould have repercussions for local law enforcement.16 Moreover,the predominance of “non-homeowners” in these metropolitanareas could lead to a decline in citizen participation in localaffairs, with a concomitant loss of vigilance over the qualityand efficiency of public services and institutions.
16 See for example Millman (2009).
Table 2
Official and Effective Homeownership Rates for Large Metropolitan Statistical Areas
Official Homeownership Rate(Percent)
Effective Homeownership Rate(Percent)
Homeownership Gap
(Percentage Points)
MSA Peak Current FHFA Case-Shiller FHFA Case-Shiller
Atlanta 70.8 66.4 61.3 57.4 5.1 9.0
Boston 67.7 66.5 64.2 64.3 2.3 2.3
Charlotte 69.1 68.0 66.9 63.2 1.1 4.8
Chicago 71.3 69.5 64.2 61.6 5.3 7.9
Cleveland 78.6 74.2 71.4 69.8 2.8 4.4
Dallas 64.5 62.8 62.4 61.6 0.4 1.2
Denver 72.0 63.3 60.8 59.8 2.4 3.5
Detroit 78.4 75.2 59.1 48.9 16.1 26.3
Las Vegas 65.0 58.6 19.3 14.7 39.3 43.9
Los Angeles 55.2 50.5 40.1 35.8 10.4 14.7
Miami 71.0 67.1 48.3 44.6 18.8 22.5
Minneapolis 74.8 71.2 64.1 56.5 7.0 14.6New York 55.9 51.2 48.7 47.5 2.5 3.7
Phoenix 74.7 68.8 49.1 40.6 19.6 28.2
Portland 72.7 67.6 63.3 61.9 4.4 5.7
San Diego 63.3 55.3 39.3 35.0 16.0 20.3
San Francisco 61.7 58.3 49.1 43.4 9.2 14.9
Seattle 65.7 60.8 55.8 53.4 5.0 7.4
Tampa 74.1 67.6 56.1 51.2 11.4 16.3
Washington, D.C. 70.9 66.5 58.8 52.3 7.7 14.2
Sources: U.S. Bureau of the Census, Current Population Survey; LPS Applied Analytics and LP data; authors’ calculations as of 2009:Q3.
8/9/2019 The Home Ownership Gap
http://slidepdf.com/reader/full/the-home-ownership-gap 7/11
www.newyorkfed.org/research/current_issues
7
The large homeownership gaps that have emerged during thishousing market crisis will likely have significant effects on themacroeconomy as well. One possible consequence is an increasein the national saving rate. Homeowners seeking to escape anegative equity mortgage and purchase a new residence will needto make a substantial commitment to save. They must remain
current on their mortgage payments and pay off any remainingnegative equity balances upon the sale of their current home.In addition, they will need to provide cash to cover the downpayment on a new home as well as the transaction costs of thepurchase. Given the large number of households currently innegative equity, a broad-based movement among these house-holds to increase saving would have the potential to boost thenation’s savings significantly.
To shed light on the magnitude of this increase, we estimatehow much the negative equity households in our sample wouldneed to save in order to close out their existing mortgage andbuy a new home. The amount will depend, of course, on the value
of each household’s current and prospective homes, the lendingstandards in effect at the time the household moves, and the costof the transaction. For our analysis, we assume that the house-hold’s “desired” down payment equals 20 percent of the currentvalue of its existing house,17 and that transaction costs total6 percent of that value.
Note that even absent any house price appreciation, home-owners who remain current on their mortgage payments buildtheir equity position through debt amortization. For eachnegative equity homeowner in our sample, we can project thereductions in debt balances that result from making the sched-uled payments for a given period of time, and then incorporate
these reductions in our analysis. Of the households that continueto make payments, more than a third (36 percent) will assume apositive equity position within three years, and more than half (51 percent) within five years.18 For these borrowers, housingequity could serve as part of a down payment on a new home.
17 Our assumption would allow the household to purchase a residence of equivalent value under the current tight lending standards. Since a new homecould be more expensive, this is a conservative assumption.
18 Of course, house price appreciation would hasten this process of equity gains,while continued price declines would slow it.
By contrast, households whose regular debt amortization will notreduce the mortgage balance sufficiently will need to save enoughto pay off the current mortgage before buying again.
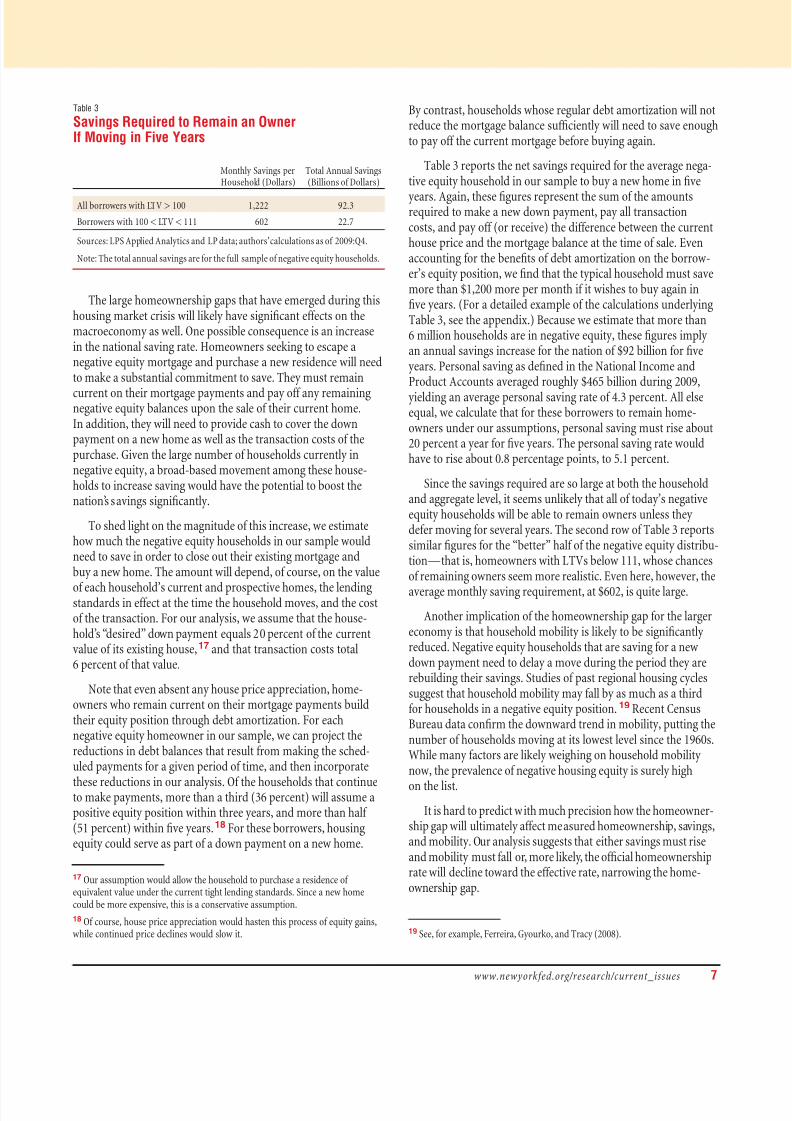
Table 3 reports the net savings required for the average nega-tive equity household in our sample to buy a new home in five
years. Again, these figures represent the sum of the amountsrequired to make a new down payment, pay all transactioncosts, and pay off (or receive) the difference between the currenthouse price and the mortgage balance at the time of sale. Evenaccounting for the benefits of debt amortization on the borrow-er’s equity position, we find that the typical household must savemore than $1,200 more per month if it wishes to buy again infive years. (For a detailed example of the calculations underlyingTable 3, see the appendix.) Because we estimate that more than6 million households are in negative equity, these figures implyan annual savings increase for the nation of $92 billion for fiveyears. Personal saving as defined in the National Income andProduct Accounts averaged roughly $465 billion during 2009,
yielding an average personal saving rate of 4.3 percent. All elseequal, we calculate that for these borrowers to remain home-owners under our assumptions, personal saving must rise about20 percent a year for five years. The personal saving rate wouldhave to rise about 0.8 percentage points, to 5.1 percent.
Since the savings required are so large at both the householdand aggregate level, it seems unlikely that all of today’s negativeequity households will be able to remain owners unless theydefer moving for several years. The second row of Table 3 reportssimilar figures for the “better” half of the negative equity distribu-tion—that is, homeowners with LTVs below 111, whose chancesof remaining owners seem more realistic. Even here, however, the
average monthly saving requirement, at $602, is quite large.
Another implication of the homeownership gap for the largereconomy is that household mobility is likely to be significantlyreduced. Negative equity households that are saving for a newdown payment need to delay a move during the period they arerebuilding their savings. Studies of past regional housing cyclessuggest that household mobility may fall by as much as a thirdfor households in a negative equity position.19 Recent CensusBureau data confirm the downward trend in mobility, putting thenumber of households moving at its lowest level since the 1960s.While many factors are likely weighing on household mobilitynow, the prevalence of negative housing equity is surely high
on the list.
It is hard to predict with much precision how the homeowner-ship gap will ultimately affect measured homeownership, savings,and mobility. Our analysis suggests that either savings must riseand mobility must fall or, more likely, the official homeownershiprate will decline toward the effective rate, narrowing the home-ownership gap.
19 See, for example, Ferreira, Gyourko, and Tracy (2008).
Table 3
Savings Required to Remain an OwnerIf Moving in Five Years
Monthly Savings perHousehold (Dollars)
Total Annual Savings(Billions of Dollars)
All borrowers with LTV > 100 1,222 92.3
Borrowers with 100 < LTV < 111 602 22.7
Sources: LPS Applied Analytics and LP data; authors’ calculations as of 2009:Q4.
Note: The total annual savings are for the full sample of negative equity households.
8/9/2019 The Home Ownership Gap
http://slidepdf.com/reader/full/the-home-ownership-gap 8/11
8
CURRENT ISSUES IN ECONOMICS AND FINANCE ❖ Volume 16, Number 5
ConclusionThe severe decline in house prices in the last few years, combinedwith the large number of borrowers who had little or no equity atthe origination of their mortgages, has led to a dramatic rise inhomeowners with negative equity. This rise in turn has openeda large gap between the Census Bureau’s official homeownershiprate and a measure that we term the effective rate. The effectiverate recognizes that negative equity homeowners are likely to con-vert to renters over time and thus excludes them from the countof owner-occupied housing. The effective homeownership ratefor the nation is currently 5.6 percentage points below the CensusBureau rate, and in some of the metropolitan areas hurt most bythe housing crisis, the effective homeownership rate falls shortof the official rate by a striking 20 to 39 percentage points.
Public policy has long promoted homeownership, and sub-sidies for owner-occupants are a key feature of the tax code. Butthese recent developments present many challenges to policy-makers. Absent any action, the high saving requirements forremaining an owner make it likely that the current effectivehomeownership rate will foreshadow the future official rate.A drop in the homeownership rate may create a large set of residents who are less invested in the long-run outlook for theirhomes and communities—an outcome that could lead to lower
levels of home maintenance and civic participation, as well asmore short-sighted decisions in local affairs. While the nationalsaving rate may well rise as negative equity households who preferto own their own home try to save up a down payment on a newhouse, the task of setting aside sufficient funds will be dauntingfor these households.
Public policy initiatives such as mortgage modification canhelp to support the homeownership rate by reducing foreclosuresand easing conditions for negative equity borrowers to save fora future down payment. However, the efficacy of these modifica-tion programs depends in part on their structure. Programs thatencourage principal write-down will do more to support thehomeownership rate than those that focus solely on the monthlymortgage burden to the borrower, and will allow maintenanceof homeownership without producing steep declines in con-sumption.20 Addressing the problems of negative equity andlow effective homeownership rates is most important for thosemetropolitan areas that suffered the worst house price declines.
The current large homeownership gaps in these housing marketswill make it especially difficult to maintain the broader socialbenefits that stem from a high homeownership rate.
20 See the comparison of mortgage modification programs in the appendix.
8/9/2019 The Home Ownership Gap
http://slidepdf.com/reader/full/the-home-ownership-gap 9/11
www.newyorkfed.org/research/current_issues
9
Appendix: When Negative Equity Mortgage Holders Save for a New Home
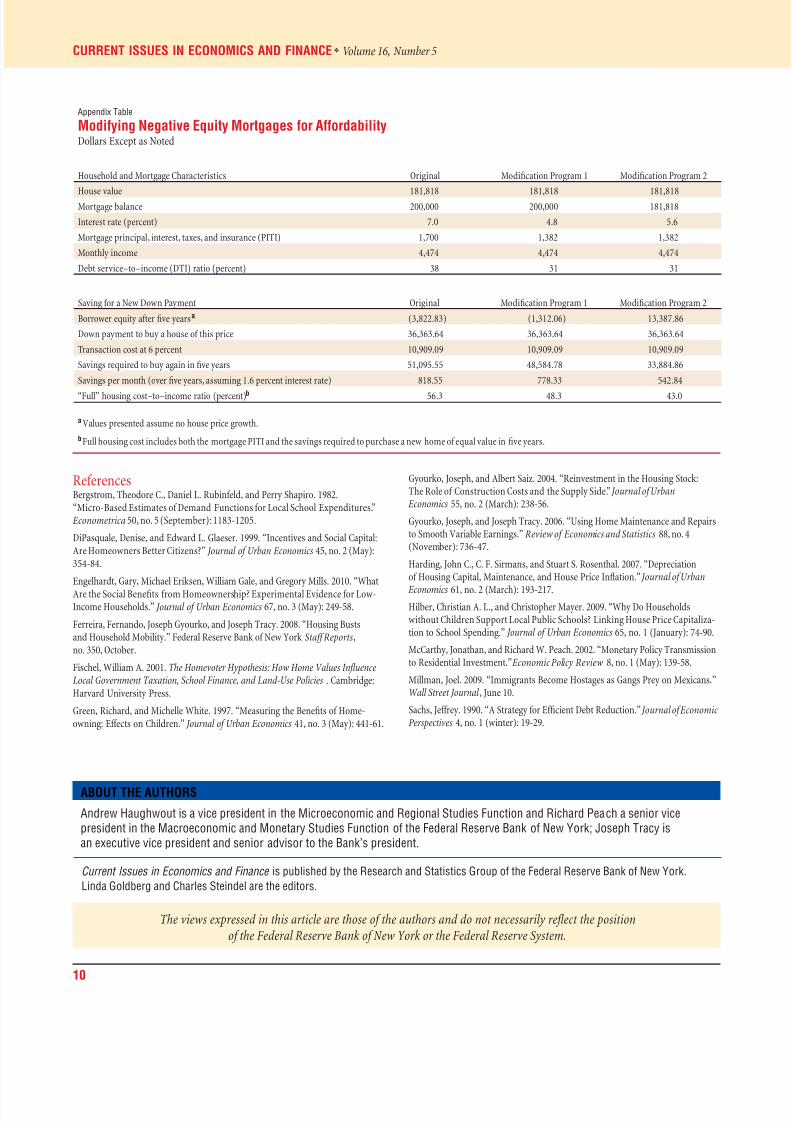
For negative equity mortgage holders, remaining a homeowner requires a substantial saving commitment, but mortgagemodifications—particularly those that reduce the principal
balance—can help.
Negative equity borrowers who want to remain owners butalready have difficulty meeting their mortgage payments mayfind that saving for a down payment on a new home is notfeasible. Mortgage modification programs can assist thesehouseholds, to a degree, by reducing the required monthlymortgage payment, thus freeing up funds that can be saved fora new down payment. But the structure of the modificationprogram is important. Modifications that reduce interest ratesalone will lower the monthly payment, while those that alsoreduce principal balances lower the monthly costs and providefor additional saving through debt reduction.
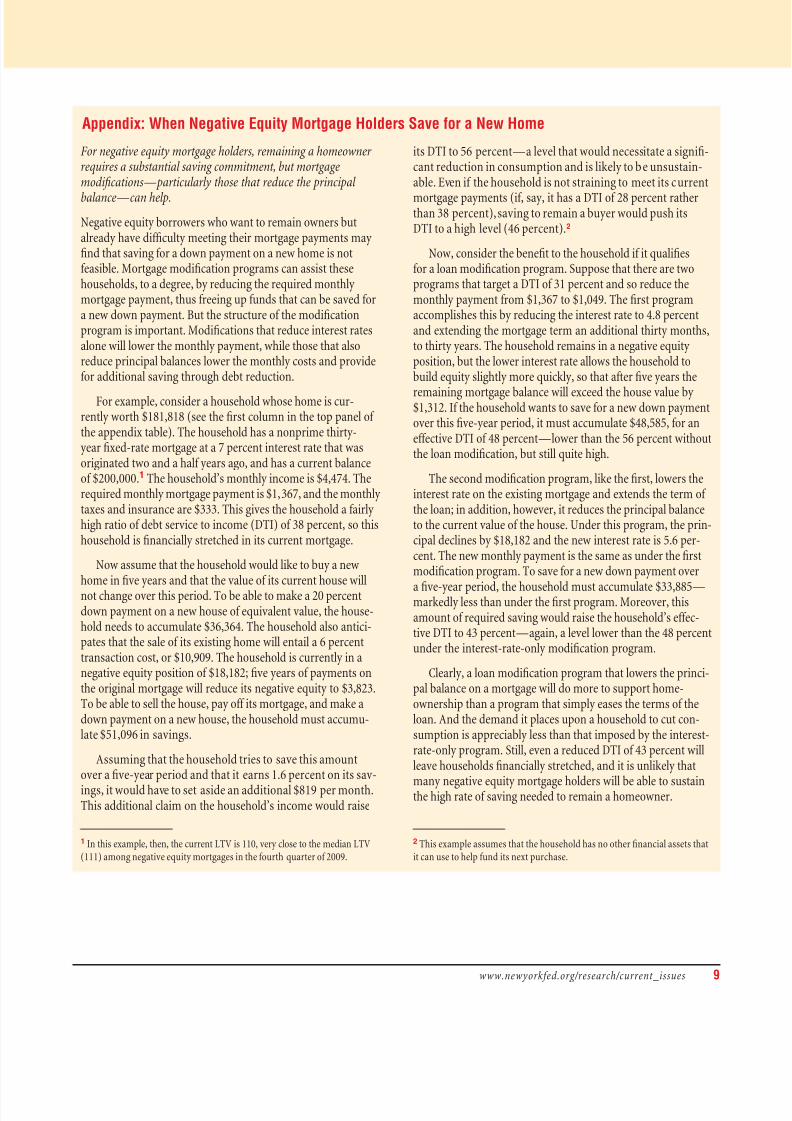
For example, consider a household whose home is cur-rently worth $181,818 (see the first column in the top panel of the appendix table). The household has a nonprime thirty-year fixed-rate mortgage at a 7 percent interest rate that wasoriginated two and a half years ago, and has a current balanceof $200,000.1 The household’s monthly income is $4,474. Therequired monthly mortgage payment is $1,367, and the monthlytaxes and insurance are $333. This gives the household a fairlyhigh ratio of debt service to income (DTI) of 38 percent, so thishousehold is financially stretched in its current mortgage.
Now assume that the household would like to buy a newhome in five years and that the value of its current house willnot change over this period. To be able to make a 20 percentdown payment on a new house of equivalent value, the house-hold needs to accumulate $36,364. The household also antici-pates that the sale of its existing home will entail a 6 percenttransaction cost, or $10,909. The household is currently in anegative equity position of $18,182; five years of payments onthe original mortgage will reduce its negative equity to $3,823.To be able to sell the house, pay off its mortgage, and make adown payment on a new house, the household must accumu-late $51,096 in savings.
Assuming that the household tries to save this amountover a five-year period and that it earns 1.6 percent on its sav-
ings, it would have to set aside an additional $819 per month.This additional claim on the household’s income would raise
1 In this example, then, the current LTV is 110, very close to the median LTV(111) among negative equity mortgages in the fourth quarter of 2009.
its DTI to 56 percent—a level that would necessitate a signifi-cant reduction in consumption and is likely to be unsustain-able. Even if the household is not straining to meet its current
mortgage payments (if, say, it has a DTI of 28 percent ratherthan 38 percent), saving to remain a buyer would push itsDTI to a high level (46 percent).2
Now, consider the benefit to the household if it qualifiesfor a loan modification program. Suppose that there are twoprograms that target a DTI of 31 percent and so reduce themonthly payment from $1,367 to $1,049. The first programaccomplishes this by reducing the interest rate to 4.8 percentand extending the mortgage term an additional thirty months,to thirty years. The household remains in a negative equityposition, but the lower interest rate allows the household tobuild equity slightly more quickly, so that after five years the
remaining mortgage balance will exceed the house value by$1,312. If the household wants to save for a new down paymentover this five-year period, it must accumulate $48,585, for aneffective DTI of 48 percent—lower than the 56 percent withoutthe loan modification, but still quite high.
The second modification program, like the first, lowers theinterest rate on the existing mortgage and extends the term of the loan; in addition, however, it reduces the principal balanceto the current value of the house. Under this program, the prin-cipal declines by $18,182 and the new interest rate is 5.6 per-cent. The new monthly payment is the same as under the firstmodification program. To save for a new down payment over
a five-year period, the household must accumulate $33,885—markedly less than under the first program. Moreover, thisamount of required saving would raise the household’s effec-tive DTI to 43 percent—again, a level lower than the 48 percentunder the interest-rate-only modification program.
Clearly, a loan modification program that lowers the princi-pal balance on a mortgage will do more to support home-ownership than a program that simply eases the terms of theloan. And the demand it places upon a household to cut con-sumption is appreciably less than that imposed by the interest-rate-only program. Still, even a reduced DTI of 43 percent willleave households financially stretched, and it is unlikely that
many negative equity mortgage holders will be able to sustainthe high rate of saving needed to remain a homeowner.
2 This example assumes that the household has no other financial assets thatit can use to help fund its next purchase.
8/9/2019 The Home Ownership Gap
http://slidepdf.com/reader/full/the-home-ownership-gap 10/11
10
CURRENT ISSUES IN ECONOMICS AND FINANCE ❖ Volume 16, Number 5
ReferencesBergstrom, Theodore C., Daniel L. Rubinfeld, and Perry Shapiro. 1982.“Micro-Based Estimates of Demand Functions for Local School Expenditures.”
Econometrica 50, no. 5 (September): 1183-1205.
DiPasquale, Denise, and Edward L. Glaeser. 1999. “Incentives and Social Capital:Are Homeowners Better Citizens?” Journal of Urban Economics 45, no. 2 (May):354-84.
Engelhardt, Gary, Michael Eriksen, William Gale, and Gregory Mills. 2010. “WhatAre the Social Benefits from Homeownership? Experimental Evidence for Low-Income Households.” Journal of Urban Economics 67, no. 3 (May): 249-58.
Ferreira, Fernando, Joseph Gyourko, and Joseph Tracy. 2008. “Housing Bustsand Household Mobility.” Federal Reserve Bank of New York Staff Reports,no. 350, October.
Fischel, William A. 2001. The Homevoter Hypothesis: How Home Values InfluenceLocal Government Taxation, School Finance, and Land-Use Policies. Cambridge:Harvard University Press.
Green, Richard, and Michelle White. 1997. “Measuring the Benefits of Home-owning: Effects on Children.” Journal of Urban Economics 41, no. 3 (May): 441-61.
Gyourko, Joseph, and Albert Saiz. 2004. “Reinvestment in the Housing Stock:The Role of Construction Costs and the Supply Side.” Journal of Urban
Economics 55, no. 2 (March): 238-56.
Gyourko, Joseph, and Joseph Tracy. 2006. “Using Home Maintenance and Repairsto Smooth Variable Earnings.” Review of Economics and Statistics 88, no. 4(November): 736-47.
Harding, John C., C. F. Sirmans, and Stuart S. Rosenthal. 2007. “Depreciationof Housing Capital, Maintenance, and House Price Inflation.” Journal of Urban
Economics 61, no. 2 (March): 193-217.
Hilber, Christian A. L., and Christopher Mayer. 2009. “Why Do Householdswithout Children Support Local Public Schools? Linking House Price Capitaliza-tion to School Spending.” Journal of Urban Economics 65, no. 1 (January): 74-90.
McCarthy, Jonathan, and Richard W. Peach. 2002. “Monetary Policy Transmissionto Residential Investment.” Economic Policy Review 8, no. 1 (May): 139-58.
Millman, Joel. 2009. “Immigrants Become Hostages as Gangs Prey on Mexicans.”Wall Street Journal , June 10.
Sachs, Jeffrey. 1990. “A Strategy for Efficient Debt Reduction.” Journal of Economic Perspectives 4, no. 1 (winter): 19-29.
The views expressed in this article are those of the authors and do not necessarily reflect the positionof the Federal Reserve Bank of New York or the Federal Reserve System.
ABOUT THE AUTHORS
Andrew Haughwout is a vice president in the Microeconomic and Regional Studies Function and Richard Peach a senior vice
president in the Macroeconomic and Monetary Studies Function of the Federal Reserve Bank of New York; Joseph Tracy is
an executive vice president and senior advisor to the Bank’s president.
Appendix Table
Modifying Negative Equity Mortgages for AffordabilityDollars Except as Noted
Household and Mortgage Characteristics Original Modification Program 1 Modification Program 2
House value 181,818 181,818 181,818Mortgage balance 200,000 200,000 181,818
Interest rate (percent) 7.0 4.8 5.6
Mortgage principal, interest, taxes, and insurance (PITI) 1,700 1,382 1,382
Monthly income 4,474 4,474 4,474
Debt service–to–income (DTI) ratio (percent) 38 31 31
Saving for a New Down Payment Original Modification Program 1 Modification Program 2
Borrower equity after five yearsa (3,822.83) (1,312.06) 13,387.86
Down payment to buy a house of this price 36,363.64 36,363.64 36,363.64
Transaction cost at 6 percent 10,909.09 10,909.09 10,909.09
Savings required to buy again in five years 51,095.55 48,584.78 33,884.86
Savings per month (over five years, assuming 1.6 percent interest rate) 818.55 778.33 542.84
“Full” housing cost–to–income ratio (percent)b 56.3 48.3 43.0
a Values presented assume no house price growth.
b Full housing cost includes both the mortgage PITI and the savings required to purchase a new home of equal value in five years.
Current Issues in Economics and Finance is published by the Research and Statistics Group of the Federal Reserve Bank of New York.
Linda Goldberg and Charles Steindel are the editors.
8/9/2019 The Home Ownership Gap
http://slidepdf.com/reader/full/the-home-ownership-gap 11/11
www.newyorkfed.org/research/current_issues 11
A longer, more technical version of this Current Issues articleappeared in the Research and Statistics Group’s working paperseries. See Andrew Haughwout, Richard Peach, and Joseph Tracy,
“The Homeownership Gap,” Federal Reserve Bank of New YorkStaff Reports, no. 418, December 2009.
Other recent New York Fed publications and papers con-sider additional dimensions of the housing crisis: the rating of mortgage-backed securities, the regional experience of houseprice volatility, and the effects of mortgage modification onre-default rates:
MBS Ratings and the Mortgage Credit BoomAdam Ashcraft, Paul Goldsmith-Pinkham, and James VickeryFederal Reserve Bank of New York Staff Reports, no. 449,May 2010
The authors study credit ratings on subprime and Alt-A mortgage-backed securities (MBS) deals issued between 2001 and 2007,the period leading up to the subprime crisis. They find that theamount of credit enhancement increases with the amount of mortgage credit risk (measured either ex ante or ex post),suggesting that ratings contain useful information for investors.However, the authors also find evidence of significant timevariation in risk-adjusted credit ratings, including a progressivedecline in standards around the MBS market peak between thestart of 2005 and mid-2007. They observe, conditional on initialratings, underperformance (high mortgage defaults and lossesand large rating downgrades) among deals with observably
higher-risk mortgages based on a simple ex ante model anddeals with a high fraction of opaque low-documentation loans.These findings hold over the entire sample period, not just fordeal cohorts most affected by the crisis.
Bypassing the Bust: The Stability of Upstate New York’sHousing Markets during the RecessionJaison Abel and Richard Deitz
Federal Reserve Bank of New York Current Issues in Economicsand Finance 16, no. 3, March 2010
Over the past decade, the United States has seen real estateactivity swing from boom to bust. But upstate New York has beenlargely insulated from this volatility, with metropolitan areas suchas Buffalo, Rochester, and Syracuse even registering home priceincreases during the recession. An analysis of upstate housingmarkets over the most recent residential real estate cycle indicatesthat the region’s relatively low incidence of nonprime mortgagesand the better-than-average performance of these loans contrib-uted to this stability.
Second Chances: Subprime Mortgage Modificationand Re-DefaultAndrew Haughwout, Ebiere Okah, and Joseph TracyFederal Reserve Bank of New York Staff Reports, no. 417,December 2009
Mortgage modifications have become an important componentof public interventions designed to reduce foreclosures. Thispaper examines how the structure of a mortgage modificationaffects the likelihood of the modified mortgage re-defaulting overthe next year. Using data on subprime modifications that precedethe government’s Home Affordable Modification Program, theauthors focus their attention on those modifications in which
the borrower was seriously delinquent and the monthly paymentwas reduced as part of the modification. The data indicate thatthe re-default rate declines with the magnitude of the reductionin the monthly payment, but also that the re-default rate declinesrelatively more when the payment reduction is achieved throughprincipal forgiveness as opposed to lower interest rates.
RECENT FEDERAL RESERVE BANK OF NEW YORK RELEASES ON THE HOUSING MARKET
The Federal Reserve Bank of New York’s U.S. Credit Conditionswebsite (data.newyorkfed.org/creditconditions) offers detailed,
timely data on the incidence of mortgage foreclosures and delin-quencies in the nation and in individual states and counties.The information, presented through charts, interactive maps,and spreadsheets, is designed to help government agencies, com-munity groups, commercial institutions, and other practitionersbetter understand and respond to local conditions associatedwith failed and troubled mortgages.
The site offers a range of informative features. Visitors can comparedelinquency rates across geographical areas and across types of mortgages—for example, prime, subprime, or Fannie Mae and
Freddie Mac loans. Red and green “heat maps” illustrate whetherconditions have worsened or improved over the past year. In addi-
tion, a sequence of charts shows the likelihood that subprime andAlt-A mortgages will roll from their current status to thirty dayslate, from sixty to ninety days late, or from ninety days late toforeclosure. The roll rates are presented in terms of the numberof mortgages likely to roll from one status to the next and in termsof dollar volumes.
The goal of the U.S. Credit Conditions website is to provide infor-mation that will help public and private sector decision makersidentify the best strategies to resolve the delinquency and fore-closure problem and to mitigate its impact on communities.
INFORMATION ON THE FORECLOSURE CRISIS AVAILABLE ON NEW YORK FED WEBSITE