the human y-chromosome: populations, mutations, and statistics
TRANSCRIPT

NEAFS Y-mtDNA Workshop (Butler and Coble)Populations, Statistics, Mutations
November 1, 2006
http://www.cstl.nist.gov/biotech/strbase/training.htm 1
Y-Chromosome and Mitochondrial DNA Analysis
NEAFS 2006 WorkshopRye Brook, NY
November 1, 2006
Dr. John M. ButlerDr. Michael D. Coble
The Human Y-Chromosome: Populations, Mutations,
and Statistics
[email protected]@afip.osd.mil
Y-Chromosome Information Resources on the NIST STRBase Website
Largest Y-STR Database
http://www.yhrd.org41,965 haplotypes (9 loci)14,835 haplotypes (11 loci)
Commercial Y-STR kits exist to amplify all of the core loci in a single reaction (plus a few additional markers)
Y-Chromosome Haplotype Reference Database (YHRD)
Run only with minimal haplotype
DYS19DYS389I/IIDYS390DYS391DYS392DYS393
DYS385 a/bUS haplotype requires
2 additional loci:DYS438DYS439
As of 8/1/06: 41,965 haplotypes
http://www.yhrd.org
14,835 haplotypeswith all US required loci
(98 populations)
(357 populations)
As of 12/17/04: 28,650 haplotypes6,281 haplotypeswith all US required loci

NEAFS Y-mtDNA Workshop (Butler and Coble)Populations, Statistics, Mutations
November 1, 2006
http://www.cstl.nist.gov/biotech/strbase/training.htm 2
Haplotype Databases for Y-STR Kits
PowerPlex Y
1311 Caucasians325 Asians894 Hispanics
1108 African Americans366 Native Americans
--------------
4,004 total(as of March 2005)
Yfiler
1276 Caucasians330 Asians597 Hispanics985 African Americans106 Native Americans105 Filipino
59 Sub-Saharan Africans103 Vietnamese
---------------
3,561 total(as of December 2004)
http://www.promega.com/techserv/tools/pplexy/http://www.appliedbiosystems.com/yfilerdatabase/
PowerPlex Y Haplotype Databasehttp://www.promega.com/techserv/tools/pplexy/
1311 Caucasians325 Asians894 Hispanics
1108 African Americans366 Native Americans
--------------4,004 total
595 Caucasians284 Asians630 Hispanics577 African Americans357 Native Americans
--------------2,443 total
March 2005
Yfiler Haplotype Database http://www.appliedbiosystems.com/yfilerdatabase/
259 African Americans
3 Asians
262 Caucasians
139 Hispanics
#Samples Contributed by NIST
663/3561 = 18.6%Data provided by NIST
NEAFS Y-mtDNA Workshop (Butler and Coble)Populations, Statistics, Mutations
November 1, 2006
http://www.cstl.nist.gov/biotech/strbase/training.htm 3
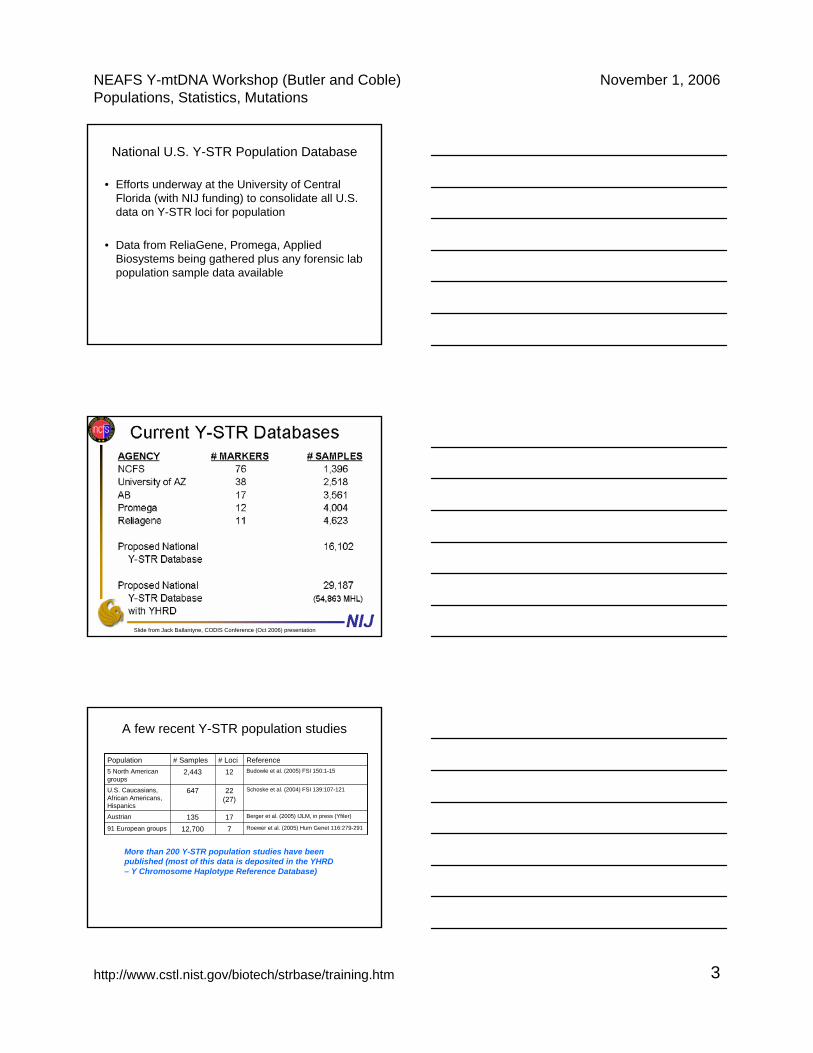
National U.S. Y-STR Population Database
• Efforts underway at the University of Central Florida (with NIJ funding) to consolidate all U.S. data on Y-STR loci for population
• Data from ReliaGene, Promega, Applied Biosystems being gathered plus any forensic lab population sample data available
Slide from Jack Ballantyne, CODIS Conference (Oct 2006) presentation
A few recent Y-STR population studies
Roewer et al. (2005) Hum Genet 116:279-291712,70091 European groups
Berger et al. (2005) IJLM, in press (Yfiler)17135Austrian
Schoske et al. (2004) FSI 139:107-12122 (27)
647U.S. Caucasians, African Americans, Hispanics
Budowle et al. (2005) FSI 150:1-15122,4435 North American groups
Reference# Loci# SamplesPopulation
More than 200 Y-STR population studies have been published (most of this data is deposited in the YHRD – Y Chromosome Haplotype Reference Database)

NEAFS Y-mtDNA Workshop (Butler and Coble)Populations, Statistics, Mutations
November 1, 2006
http://www.cstl.nist.gov/biotech/strbase/training.htm 4
PowerPlex Y Population Study
Initial 2,443 Samples in PowerPlex Y Haplotype Database
159 Canadian samples
PowerPlex® Y Haplotype Databasehttp://www.promega.com/techserv/tools/pplexy/
Compilation of Y STR Population Data
• Source: over 200 published population data papers• Helps define observed allele ranges, which aids in multiplex assay
development (spacing between loci in the same dye color)• Information is available to the community through the STRBase website
– permits analysis of optimal markers for particular population
Appendices in Rich Schoske’s Ph.D. dissertation; available on STRBase
NEAFS Y-mtDNA Workshop (Butler and Coble)Populations, Statistics, Mutations
November 1, 2006
http://www.cstl.nist.gov/biotech/strbase/training.htm 5
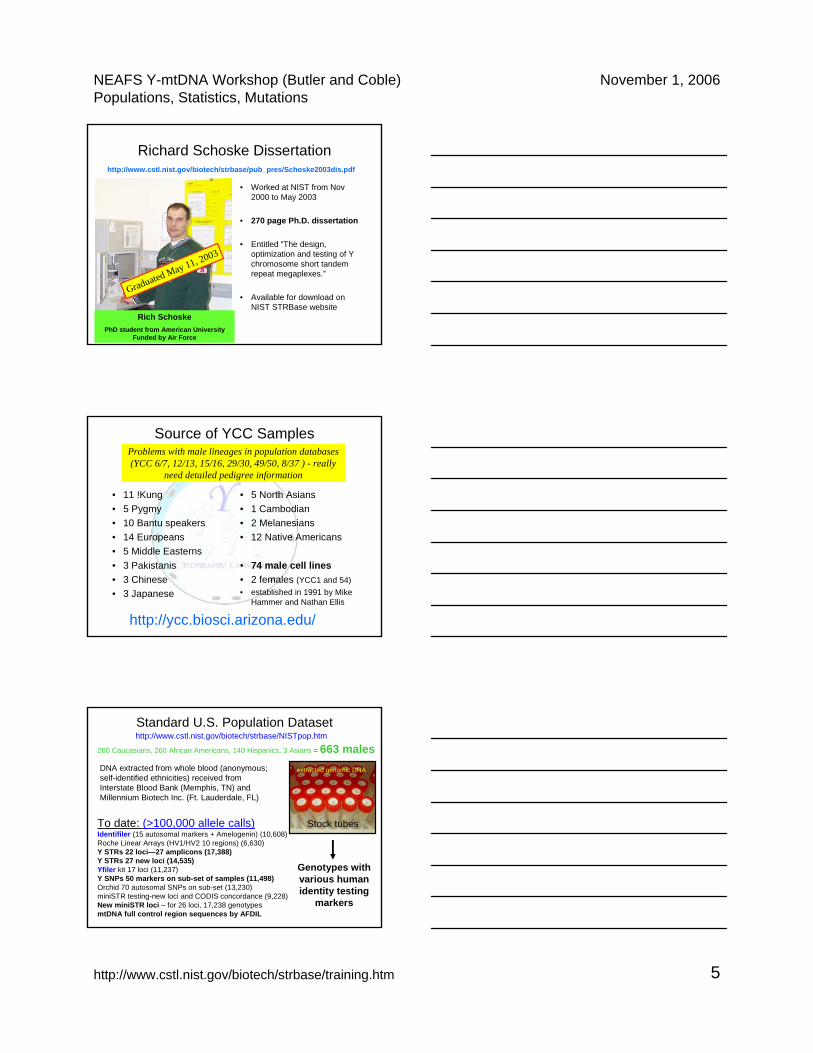
Richard Schoske Dissertation
• Worked at NIST from Nov 2000 to May 2003
• 270 page Ph.D. dissertation
• Entitled “The design, optimization and testing of Y chromosome short tandem repeat megaplexes.”
• Available for download on NIST STRBase website
Rich SchoskePhD student from American University
Funded by Air Force
Graduated May 11, 2003
http://www.cstl.nist.gov/biotech/strbase/pub_pres/Schoske2003dis.pdf
Source of YCC Samples
• 11 !Kung• 5 Pygmy• 10 Bantu speakers• 14 Europeans• 5 Middle Easterns• 3 Pakistanis• 3 Chinese• 3 Japanese
• 5 North Asians• 1 Cambodian• 2 Melanesians• 12 Native Americans
• 74 male cell lines• 2 females (YCC1 and 54)• established in 1991 by Mike
Hammer and Nathan Ellis
http://ycc.biosci.arizona.edu/
Problems with male lineages in population databases (YCC 6/7, 12/13, 15/16, 29/30, 49/50, 8/37 ) - really
need detailed pedigree information
Stock tubes
extracted genomic DNA
To date: (>100,000 allele calls)Identifiler (15 autosomal markers + Amelogenin) (10,608)Roche Linear Arrays (HV1/HV2 10 regions) (6,630)Y STRs 22 loci—27 amplicons (17,388)Y STRs 27 new loci (14,535)Yfiler kit 17 loci (11,237)Y SNPs 50 markers on sub-set of samples (11,498)Orchid 70 autosomal SNPs on sub-set (13,230)miniSTR testing-new loci and CODIS concordance (9,228)New miniSTR loci – for 26 loci, 17,238 genotypesmtDNA full control region sequences by AFDIL
DNA extracted from whole blood (anonymous; self-identified ethnicities) received from Interstate Blood Bank (Memphis, TN) and Millennium Biotech Inc. (Ft. Lauderdale, FL)
Standard U.S. Population Datasethttp://www.cstl.nist.gov/biotech/strbase/NISTpop.htm
260 Caucasians, 260 African Americans, 140 Hispanics, 3 Asians = 663 males
Genotypes with various human identity testing
markers

NEAFS Y-mtDNA Workshop (Butler and Coble)Populations, Statistics, Mutations
November 1, 2006
http://www.cstl.nist.gov/biotech/strbase/training.htm 6
U.S. Population Data on 22 Y-STRs
pdf file available at http://www.cstl.nist.gov/biotech/strbase/NISTpub.htm
Rel
ativ
e Fl
uore
scen
ce U
nits
PCR Product Size (bp)
426
385 a/b
389II
H4388
19392
YCAII a/b
389I
437
390
439391
447448
438
393
460
458
450
448
447456
464 a/b/c/d
385 a/b
NIST Multiplexes for High-Throughput Y STR Typing
17,388 allele calls with 2 multiplexes and 14 96-well plates (<100 hours on ABI 3100)
17,388 allele calls with 2 multiplexes and 14 96-well plates (<100 hours on ABI 3100)
20plex
11plex
22 loci27 PCR products
Schoske et al. (2004) High-throughput Y-STR typing of U.S. populations…, Forensic Sci. Int., 139:107-121
PowerPlex Y (Promega)
Yfiler (ABI)
+C4
US haplotype (Reliagene kits)
Schoske et al. (2004) High-throughput Y-STR typing of U.S. populations…, Forensic Sci. Int., 139:107-121

NEAFS Y-mtDNA Workshop (Butler and Coble)Populations, Statistics, Mutations
November 1, 2006
http://www.cstl.nist.gov/biotech/strbase/training.htm 7
Statistical Calculations on Y-STR Data
• Locus (gene) Diversity = (n/n-1)(1 - Σpi2) where n is the number
of samples in the dataset and pi is the frequency of the ith allele
• Haplotype Diversity (HD) = (n/n-1)(1 - Σpi2) where n is the
number of samples in the dataset and pi is the frequency of the ithhaplotype
• Random Match Probability (RMP) = 1 - HD
• Discrimination Capacity (DC) – total number of observed haplotypes divided by the total number of individuals in the dataset
• Unique Haplotypes (UH) – number of haplotypes that occur only once in the dataset
Calculating Gene (STR) Diversity
Locus Allele Size Range (bp) Count Combined Freq (N = 661)DYS463 17 222.45 1 0.0015
18 227.34-227.44 27 0.040819 232.30-232.39 7 0.010620 237.24-237.44 151 0.228421 242.21-242.41 67 0.101422 247.12-247.40 74 0.112023 252.13-252.33 35 0.053024 257.05-257.49 256 0.387325 262.01-262.26 37 0.056026 267.05-267.21 5 0.007628 277.22 1 0.0015
failure 2STR diversity
TOTAL 661 0.7684
D = (n/n-1)(1 - ∑ x2)
Comparison of Different Datasets to Evaluate Variability in Locus
DYS463-FAM
9 alleles
Combo 1 plate (95 samples)31 Caucasians32 African Americans32 Hispanics
7 plates (663 samples)260 Caucasians260 African Americans140 Hispanics
3 Asians
Our allele ranges are well defined after a 95 sample screen
9 Alleles Observed 11 Alleles Observed

NEAFS Y-mtDNA Workshop (Butler and Coble)Populations, Statistics, Mutations
November 1, 2006
http://www.cstl.nist.gov/biotech/strbase/training.htm 8
Extended Haplotype vs. US Haplotype
HD = (n/n-1)(1 - Σpi2)
U.S. haplotype is as good as extended haplotype in all major U.S. populations
U.S. haplotype is as good as extended haplotype in all major U.S. populations
Extended : 19, 389I/II, 390, 391, 392, 393, 385 a/b + YCAII a/bUS haplotype: 19, 389I/II, 390, 391, 392, 393, 385 a/b + 438, 439
Schoske et al. (2004) High-throughput Y-STR typing of U.S. populations…, Forensic Sci. Int., 139:107-121
0.9999 0.00010.9999 0.00010.9999 0.0001Top 10 (w/o YCAII a/b)
0.9999 0.00010.9999 0.00010.9999 0.000122 Y-STRs
0.9998 0.00020.9998 0.00020.9998 0.0002Y-STR 20plex
0.9992 0.00080.9987 0.00130.9993 0.0007Y-STR 11plex
0.9986 0.00140.9974 0.00260.9993 0.0007“U.S. haplotype”
0.9975 0.00250.9971 0.00290.9988 0.0012“extended” haplotype
0.9957 0.00430.9946 0.00530.9982 0.0018“minimal” haplotype
0.9934 0.00660.9914 0.00860.9974 0.0026 Y-PLEX 6 kit
Y-STR Marker 260 African Americans 244 Caucasians 143 HispanicsCombinations
HD RMP HD RMP HD RMP
99.3% 14197.5% 23296.9% 244Top 10 (w/o YCAII a/b)
99.3% 14199.6% 24298.9% 25422 Y-STR Markers
98.6% 13997.2% 23098.5% 252Y-STR 20plex
94.4% 12788.5% 19893.1% 227Y-STR 11plex
93.3% 12182.3% 17691.9% 222“U.S. haplotype”
89.5% 12083.6% 18491.9% 227“extended” haplotype
81.1% 10075.8% 16188.5% 213“minimal” haplotype
78.3% 9768.9% 13682.3% 188 Y-PLEX 6 kit
Y-STR Marker 260 African Americans 244 Caucasians 143 HispanicsCombinations
DC UH DC UH DC UH
Schoske et al. (2004) High-throughput Y-STR typing of U.S. populations…, Forensic Sci. Int., 139:107-121
Haplotype Diversity (HD) vs.
Discrimination Capacity (DC)
HD = (N/N-1)(1 - ∑ x2)
# times haplotype observed MHL SWGDAM PPY Yfiler ALL 37
1 429 486 505 626 6522 34 33 34 12 23 13 10 14 2 .4 4 6 3 . .5 3 1 2 . .6 1 1 . . .7 1 2 1 . .8 1 . . . .9 2 . . . .10 . 1 . . .11 1 . . . .12 . . 1 . .13 1 . . . .14 . . . . .15 . 1 . . .16 . . . . .17 . . . . .18 . . . . .19 . . . . .20 . . . . .21 . . . . .22 . . . . .23 . . . . .24 . . . . .25 . . . . .26 1 . . . .HD 0.996644 0.998529 0.999064 0.999916 0.999991DC 0.748476 0.824695 0.853659 0.97561 0.996951
# HT 491 541 560 640 654
DC = (#HT)/N
N = 656
x = frequency of each haplotype

NEAFS Y-mtDNA Workshop (Butler and Coble)Populations, Statistics, Mutations
November 1, 2006
http://www.cstl.nist.gov/biotech/strbase/training.htm 9
Y-STR Variants and Mutations
DYS385 Flanking Region Deletion
• In a population of 244 Caucasians, one 15.3 and six 16.3 alleles were observed (~3%)– Alleles 15.3 and 16.3 are caused by a deletion in the flanking
region that can be outside of some primer sets– Thus two different primer sets can produce seemingly
disconcordant results (one primer set will report an “on-ladder” allele while another will result in an “off-ladder” allele)
• Could present challenges to DNA databases…
Really 17 repeats minus 1 bp deletion
Schoske et al. (2004) High-throughput Y-STR typing of U.S. populations…, Forensic Sci. Int., 139:107-121
∆ 1.06 bp
∆ 0.99 bp
∆ 0.03 bp
Verification of DYS385 15.3 and 16.3 Alleles with Y-PLEX™ 6 kit
Schoske et al. (2004) High-throughput Y-STR typing of U.S. populations…, Forensic Sci. Int., 139:107-121

NEAFS Y-mtDNA Workshop (Butler and Coble)Populations, Statistics, Mutations
November 1, 2006
http://www.cstl.nist.gov/biotech/strbase/training.htm 10
Promega kit
ReliaGene Y6
Schoske et al. (2004) High-throughput Y-STR typing of U.S. populations…, Forensic Sci. Int., 139:107-121
Yfiler reverse primer is internal to this deletion so concordance is fine between PowerPlex Y and Yfiler
DYS635 Variant Allele 21.3
Yfiler allelic ladder
[TCTA]4(TGTA)2[TCTA]2(TGTA)2[TCTA]2(TGTA)2 [TCTA]5 TC-A [TCTA]2
Missing T
(Y-GATA-C4)
AFDIL sample from Central Asia
DYS392 Flanking Region Polymorphism
Normal sequence
C-to-G Mutation
AFDIL sample
C->G
180 bp upstream of the STR repeat
PowerPlex Y and Yfiler kits are external to this polymorphism while Y-PLEX 5, which creates a smaller amplicon for DYS392, is internal and therefore not impacted…

NEAFS Y-mtDNA Workshop (Butler and Coble)Populations, Statistics, Mutations
November 1, 2006
http://www.cstl.nist.gov/biotech/strbase/training.htm 11
NIST Work with Father-Son Samples
• Samples obtained from paternity testing laboratory as buccal swabs, extracted with DNA-IQ, quantified, diluted to 0.5 ng/uL
• To-date: 100 father-son pairs of U.S. Caucasian, African American, Hispanic, and Asian (800 samples)
• Verified autosomal STR allele sharing with Identifiler(QC for gender and potential sample switches)
• Typed with Yfiler (17 Y-STRs) – examined mutations
Probability of Finding No Mutation or at Least One Mutation Between Two Y-STR Haplotypes in a Single Generation
# STRs Prob. no mutation Prob. at least one mutation1 0.99720000 0.002800002 0.99440784 0.005592163 0.99162350 0.008376504 0.98884695 0.011153055 0.98607818 0.01392182 6 0.98331716 0.016682847 0.98056387 0.019436138 0.97781829 0.022181719 0.97508040 0.02491960
10 0.97235018 0.0276498211 0.96962760 0.0303724012 0.96691264 0.03308736…40 0.89390382 0.10609618
Using average mutation rate of 0.28% (Kayser et al. AJHG 2000, 66:1580-1588)
3.3% with 12 Y-STRs
Gusmão, L., Butler, J.M., et al. (2006) Forensic Sci. Int. 157:187-197
Separating Brothers with 47 Y-STRs
• Two suspected brothers (ZT79338 and ZT79339) are part of our ~660 U.S. sample dataset at NIST.
• Thus far, we have generated 47 Y-STR allele calls on these samples.
• A mutation at DYS391 separates these individuals(one contains allele 11 and the other allele 10).
• These samples share autosomal STR alleles and contain identical mtDNA sequences.

NEAFS Y-mtDNA Workshop (Butler and Coble)Populations, Statistics, Mutations
November 1, 2006
http://www.cstl.nist.gov/biotech/strbase/training.htm 12
Y-STR Mutation Rates for the 17 Yfiler LociYfiler k it lociLocus Mutations # Meioses Mutation Rate Mutations # Meioses Mutation Rate TOTALDYS19 12 7272 0.165% 0 297 0.000% 0.159%DYS389I 11 5476 0.201% 3 297 1.010% 0.243%DYS389II 12 5463 0.220% 3 297 1.010% 0.260%DYS390 16 6824 0.234% 1 293 0.341% 0.239%DYS391 23 6702 0.343% 0 297 0.000% 0.329%DYS392 4 6668 0.060% 0 297 0.000% 0.057%DYS393 4 5456 0.073% 0 298 0.000% 0.070%DYS385a/b 22 9980 0.220% 0 297 0.000% 0.214%DYS438 1 2434 0.041% 0 297 0.000% 0.037%DYS439 12 2409 0.498% 2 296 0.676% 0.518%DYS437 5 2395 0.209% 0 296 0.000% 0.186%DYS448 0 143 0.000% 0 294 0.000% <0.23%DYS456 1 143 0.699% 1 296 0.338% 0.456%DYS458 3 143 2.098% 2 297 0.673% 1.136%DYS635 3 1016 0.295% 3 298 1.007% 0.457%GATA-H4 3 1179 0.254% 2 296 0.676% 0.339%
Literature Summary * NIST Results
* Literature summary from www.YHRD.org and papers in press
Mutations Seen in 100 African American Father-Son Pairs
DeletionDYS43933BAfrican American
DeletionDYS389I and DYS389II33BAfrican American
Triplication17.2,19,2017.2,19,20DYS44897BAfrican American
Duplication19,2019,20DYS44872BAfrican American
Duplication19,2019,20DYS44822BAfrican American
gain of 1 repeat2322DYS63572BAfrican American
gain of 1 repeat2322DYS63547BAfrican American
loss of 1 repeat2223DYS63516BAfrican American
gain of 1 repeat1918DYS45839BAfrican American
gain of 1 repeat1918DYS45816BAfrican American
gain of 1 repeat1615DYS45690BAfrican American
loss of 1 repeat2324DYS39018BAfrican American
gain of 1 repeat15,3314,32DYS389I and DYS389II58BAfrican American
loss of 1 repeat13,2914,30DYS389I and DYS389II46BAfrican American
loss of 2 repeats911Y GATA H465BAfrican American
CommentsAllele (child)
Allele (father)locusSampleEthnicity
Mutations in both DYS458 and DYS635 were observed in father and son 16B
***
Locus Duplication and Deletion
Events that impact Y-STR interpretation

NEAFS Y-mtDNA Workshop (Butler and Coble)Populations, Statistics, Mutations
November 1, 2006
http://www.cstl.nist.gov/biotech/strbase/training.htm 13
Duplication Observed at DYS390
DYS391 DYS389IDYS439
DYS389II
DYS438 DYS437 DYS19 DYS392
DYS393DYS390
DYS385 a/b
PowerPlex Y results on sample from Ann Marie Gross (MN BCA)
DYS19 Locus Triplication
DYS391 DYS389IDYS439 DYS389II
DYS438DYS437
DYS392
DYS393DYS390 DYS385 a/b
Locus Triplication at DYS19
PowerPlex Y data
DYS439
DYS389IIDYS456 DYS389I DYS390
DYS458DYS19
DYS385 a/b
DYS393 DYS391 DYS635 DYS392
Y GATA H4 DYS437 DYS438 DYS448
Triplication of DYS19 region
Concordant with our previous PowerPlex Y and 20plex data
Yfiler data

NEAFS Y-mtDNA Workshop (Butler and Coble)Populations, Statistics, Mutations
November 1, 2006
http://www.cstl.nist.gov/biotech/strbase/training.htm 14
DYS448 TriplicationSeen in Both Father and Son
DYS448
Father
Son
DYS389I, DYS389II, DYS439 DeletionsSeen in Both Father and Son
Father
Son
DYS389IIDYS389I DYS439
Father
Son
Father
Son
Butler et al. (2005) Chromosomal duplications along the Y-chromosome and their potential impact on Y-STR interpretation J. Forensic Sci. 50(4): 853-859
Y-chromosome mappingDuplication at Multiple Loci
with Single-Source Sample
DYS389I
DYS437
DYS439 DYS389II
Most duplications have a single
repeat spread in allele patterns
Entire region of Y-chromosome has likely been duplicated and then diverged

NEAFS Y-mtDNA Workshop (Butler and Coble)Populations, Statistics, Mutations
November 1, 2006
http://www.cstl.nist.gov/biotech/strbase/training.htm 15
Duplication and Divergence ModelLocus # dup* >1 repeatDYS19 23 2DYS389I 5 0DYS389II 9 2DYS390 1 0DYS391 3 1DYS392 0 0DYS393 3 0DYS385a/b 17 0*from www.yhrd.org, literature, and our work
Since single-step mutations are most common, then single repeat spacing in duplicated alleles is expected
92% have single repeat difference
Butler et al. (2005) Chromosomal duplications along the Y-chromosome and their potential impact on Y-STR interpretation J. Forensic Sci. 50(4): 853-859
Deciphering between a Mixture of Multiple Males and Locus Duplication
• Note the number of loci containing >1 allele (other than multi-copy DYS385)
• Consider relative position on the Y-chromosome if multiple loci have two alleles
• See if repeat spread is >1 repeat unit• Examine DYS385 for presence of >2 alleles
Locus duplication along the Y-chromosome is in many ways analogous to heteroplasmy in mitochondrial DNA, which depending on the circumstances can provide greater strength to a match between two DNA samples.
Butler et al. (2005) Chromosomal duplications along the Y-chromosome and their potential impact on Y-STR interpretation J. Forensic Sci. 50(4): 853-859
CFS-1 with Y filer DYS390 is deleted

NEAFS Y-mtDNA Workshop (Butler and Coble)Populations, Statistics, Mutations
November 1, 2006
http://www.cstl.nist.gov/biotech/strbase/training.htm 16
Sample PC0149 with YfilerDYS392 is
deleted
PC0149 with Additional Y-STRs
FAM DYS643
VIC DYS557
NED DYS534 NED
DYS444
NED DYS485
VIC DYS594
NED DYS449
DYS556 ~32,000 bp away from DYS392 is missing
DYS557 ~600,000 bp away from DYS392 is present
21,572,734
One of the closest available loci fails
FAM DYS556
Deletions of some Y-STRs can be an inadvertent diagnosis of male infertility
• AZFa deletion (<1 in 100,000 men): expected to lack DYS389I/II, DYS437, DYS438, DYS439
• AZFb deletion (very rare): expected to lack DYS385 and DYS392
• AZFc deletion (1 in 4,000 men): expected to lack DYS464
• Possible that “incomplete” haplotypes are not being submitted to the Y-STR haplotype databases
• Thus, Y-STRs are not neutral with respect to fertility information
King et al. (2005) Inadvertent diagnosis of male infertility through genealogical DNA testing. J. Med. Genet. 42:366-368

NEAFS Y-mtDNA Workshop (Butler and Coble)Populations, Statistics, Mutations
November 1, 2006
http://www.cstl.nist.gov/biotech/strbase/training.htm 17
Promega sells a Y-deletion test
for infertility testing http://www.promega.com/tbs/tm248/tm248.pdf
DYS19 Flanking Region Duplication
DYS19
Mb
5
10
15
20
25
30
p
q
AC006335 +
AC007320 -
(AC017019; HSY27H39) +AC006335 -
AC007320 +
YInt. J. Legal Med. (2004) 118: 178-183
Different primers around DYS19 repeat result in selection of
different regions of the Y-chromosome
PCR Product Size (bp)
211-247 bp
233-269 bp
187 bp
187 bp
187 bp
Primer Set 1F/1R
Primer Set 2F/2R
Primer Set 3F/3R
15
14
16
16
16
176-212 bp
Butler and Schoske (2004) Int. J. Legal Med. 118: 178-183
Impact of Different DYS19 Primers
Invariant peak from another region of Y-chromosome

NEAFS Y-mtDNA Workshop (Butler and Coble)Populations, Statistics, Mutations
November 1, 2006
http://www.cstl.nist.gov/biotech/strbase/training.htm 18
DYS19 Primers with Alignment of Several GenBank Sequences
Butler and Schoske (2004) Int. J. Legal Med. 118: 178-183
NIST 20plex and PowerPlex Y = 3F/3R
Pseudoautosomal Region 1 (PAR1)
Pseudoautosomal Region 2 (PAR2)
Non-Recombining Portion of Y Chromosome
(NRY)
Male-specific region of the Y (MSY)
50 Mb
X
Y
154 Mbrecombination
recombination
Butler, J.M. (2005) Forensic DNA Typing, 2nd Edition, Figure 9.4(A), ©Elsevier Science/Academic Press
X- and Y-Chromosomes Recombine at Their Tips
Focus in Forensics is on the NRYPCR primers for Y-STRs need to be carefully designed to avoid X-chromosome homology
DYS391 Primer Improvements
Y
X ** ** ** *
Significant homology exists between X and Y sequences for the DYS391 locus
We have designed primers to anneal to regions that only appear on the Y chromosome (targeted X deletion regions)
These primers produce smaller PCR products and were adopted by Promega for their PowerPlex Y kit
Butler et al. (2002) Forensic Sci. Int. 129:10-24
Deleted regions compared to Y homolog
Mutations relative to Y homolog
New PCR primers designed at NIST
Female artifact problems seen with published and Y-PLEX 6 primers
DYS391 Allelic Ladder

NEAFS Y-mtDNA Workshop (Butler and Coble)Populations, Statistics, Mutations
November 1, 2006
http://www.cstl.nist.gov/biotech/strbase/training.htm 19
Summary
• Mutation rates are similar to autosomal STRs (~0.2%) –based on father-son studies
• Variant alleles are observed as in autosomal STRs due to flanking region mutations, etc.
• Regions of the Y-chromosome can be duplicated or deleted causing Y-STRs to be duplicated or deleted
• Careful primer design is important to avoid X-chromosome homology or Y-chromosome duplications
Statistics with Y-STR Haplotypes
Most labs will probably go with the counting method (number of times a haplotype is observed in a database)
as is typically done with mtDNA results
Example Y-STR HaplotypeCore US Haplotype
• DYS19 – 14• DYS389I – 13• DYS389II – 29• DYS390 – 24• DYS391 – 11• DYS392 – 14• DYS393 – 13• DYS385 a/b – 11,15• DYS438 – 12• DYS439 – 13
Matches by Databases
• YHRD (9 loci)– 7 matches in 27,773
• YHRD (11 loci)– 0 matches in 6,281
• ReliaGene (11 loci)– 0 matches in 3,403
• PowerPlex Y (12 loci)– 0 matches in 4,004
• Yfiler (17 loci)– 0 matches in 3,561

NEAFS Y-mtDNA Workshop (Butler and Coble)Populations, Statistics, Mutations
November 1, 2006
http://www.cstl.nist.gov/biotech/strbase/training.htm 20
www.YHRD.orgRelease "15" from 2004-12-17 16:11:24
Minimal Haplotype Result
DYS19 – 14DYS389I – 13DYS389II – 29DYS390 – 24DYS391 – 11DYS392 – 14DYS393 – 13DYS385 a/b – 11,15
7 matches in 27,773individuals from 236 worldwide populations
Y-Chromosome Haplotype Reference Database
Frequency Estimate CalculationsIn cases where a Y-STR profile is observed a particular number of times (X) in a database containing N profiles, its frequency (p) can be calculated as follows:
p = X/N
An upper bound confidence interval can be placed on the profile’s frequency using:
Nppp )1)((96.1 −
+
7 matches in 27,773
p = 7/27,773 = 0.000252 = 0.025%
773,27)000252.01)(000252.0(96.1000252.0 −
+
= 0.000252 + 0.000187 = 0.000439= 0.044% (~1 in 2270)
When there is no match…
In cases where the profile has not been observed in a database, the upper bound on the confidence interval is
1-α1/N
where α is the confidence coefficient (0.05 for a 95% confidence interval) and N is the number of individuals in the database.
1-α1/N = 1-(0.05)[1/4,004] = 0.000748= 0.075% (~1 in 1340)
0 matches in 4,004
If using database of 2,443, then the best you can do is 1 in 816

NEAFS Y-mtDNA Workshop (Butler and Coble)Populations, Statistics, Mutations
November 1, 2006
http://www.cstl.nist.gov/biotech/strbase/training.htm 21
The Meaning of a Y-Chromosome Match
Conservative statement for a match report:
The Y-STR profile of the crime sample matches the Y-STR profile of the suspect (at xxxnumber of loci examined). Therefore, we cannot exclude the suspect as being the donor of the crime sample. In addition, we cannot exclude all patrilineal related male relatives and an unknown number of unrelated males as being the donor of the crime sample.
Difficult Questions…
• Which database(s) should be used for Y-STR profile frequency estimate determination?
• Are any of the current forensic Y-STR databases truly adequate for reliable estimations of Y-STR haplotype frequencies?– Some individuals share identical Y-STR haplotypes due to
recurrent mutations, not relatedness…– Is the database a random collection reflecting Y-STR
haplotype frequencies of the population?– Is the Y-STR haplotype frequency relevant for the population
of the suspect?
Issues raised by Peter de Knijff at his Promega meeting presentation (Oct 2004)
Conclusions from Peter de Knijff
A haplotype frequency taken from any Y-STR database should not be reported or seen as a random match probability
– Because all male relatives have the same haplotype
– Males can share haplotypes without being related
From his presentation at the Promega meeting (Oct 2004)
Database estimates are at most qualitative…

NEAFS Y-mtDNA Workshop (Butler and Coble)Populations, Statistics, Mutations
November 1, 2006
http://www.cstl.nist.gov/biotech/strbase/training.htm 22
What Peter de Knijff Reports with a Y-STR Match
• The Y-STR profile of the stain matches with the suspect.
• Therefore, the suspect cannot be excluded as the donor of the stain.
• On the basis of this DNA evidence, I can also not exclude all paternally related male relatives of the suspect as possible donors of this stain.
• In addition, an unknown number of males from the same region cannot be excluded. A more accurate answer can only be obtained if (1) we have detailed knowledge of the population structure of the region of interest, (2) the Y-STR frequencies therein are known, and (3) we have knowledge about the family structure of the suspect.
From his presentation at the Promega meeting (Oct 2004)
Can Y-STR results be combined with autosomal STR information?
• Still subject to some debate among experts (most say “yes”)
• Problem of different inheritance modes
• Multiply random match probability from the autosomal STR profile obtained with the upper bound confidence limit from the Y-STR haplotype frequency estimate