the impact of german, french and japanese fdi on … aminian_fung_iizaka... · the impact of...
TRANSCRIPT

1
The Impact of German, French and Japanese FDI on Intra-
East Asian Trade
Nathalie Aminian∗∗∗∗ K.C. Fung
University of Rouen UC, Santa Cruz, USA
France and University of Hong Kong
Hitomi Iizaka Alan Siu
Aoyama Gakuin University University of Hong Kong,
Tokyo, Japan Hong Kong
Third Draft: Please do not cite without permission
Abstract
In this paper we first document the growing importance of intra-East Asian trade of parts
and components. Out empirical analysis shows that FDI does play an important and
independent role in facilitating the trade of parts and components as well as capital
goods in East Asia. Although this is true for all three source countries: Japan, France
and Germany, the magnitude of the impact of different sources of FDI in trade of parts
and components is quite different. Japanese direct investment has a distinctly stronger
influence on intra-East Asian trade relative to FDI from other countries.
∗ Member of CREAM, University of Rouen. This work has been sponsored by the region Upper Normandy, France. Ce travail a bénéficié du soutien financier de la région Haute Normandie dans le cadre du Grand Réseau de Recherche Culture et Société en Normandie (GRR-CSN).
2
1. Introduction
East Asia1 has witnessed a remarkable increase in the volume of intraregional
trade during the past two decades. In particular, many countries in the region have
experienced the explosive growth in intra-regional trade in parts and components. An
important development that has contributed to the phenomena has been identified as the
international fragmentation of production where the production process of a final product
is split into two or more steps and each production stage is undertaken in different
locations across national boundaries. Many alternative names have been coined for such
a phenomenon, including “slicing the value chain” (Krugman, 1995), “vertical
specialization” (Hummels , Ishii and Yi, 2001), “international production sharing” (Ng
and Yeats, 2001) and “outsourcing” (Hanson et al, 2001).
Evidence has been growing of the phenomenal increase in international
fragmentation of production around the globe in a variety of sectors, including textiles
and apparel, machinery and transport equipment, consumer electronics, toys and furniture.
The extent of international production fragmentation and the depth of the regional
production networks however, vary according to industries. As Hiratsuka (2008) points
out, the international production fragmentation in industries such as textile involves a
relatively simple disintegration of procurement and production. In contrast, a much more
elaborate and well-developed production network is found in the electronics and
computer-related industry.
It is often hypothesized that multinational enterprises (MNEs) are driving force
behind the development of the fragmentation process. The international fragmentation of
production will be adopted if it is a cost-saving strategy for MNEs. By doing so, they
combine many resources available at different locations across national borders by
establishing their production networks. A part of cost reduction arises from the standard
comparative advantage of trade theory. The theory predicts that the firms locate relatively
labor-intensive segment of the production in the country where labor is abundant and
locate relatively capital-intensive segment of the production in the country where capital
is abundant. In other words, one major theory argues that the fragmentation of production
1 In this study, East Asia covers the following countries/regions: China, Hong Kong, Japan, Republic of Korea, Indonesia, the Philippines, Malaysia, Singapore, and Thailand.
3
is encouraged by factor-endowment dissimilarities. In East Asia, the rapid growth of
intra-regional trade has also been associated with a rising volume of foreign direct
investment (FDI). As a result, East Asia (excluding Japan) has gained in importance as
recipients of FDI over time. Recent improvements in service links in terms of lower
transportation and communications costs as well as the progressive liberalization and
deregulation of international trade and foreign direct investment in the region also
contributed to this trend. Furthermore, the dispersed production networks created by
such fragmentation appear to be more extensive in East Asia than in other parts of the
world (Fung, Garcia-Herrero and Siu 2009, Athukorala, 2006; Ng and Yeats, 2001 and
2003).
International production fragmentation and the formation of regional production
networks can have various important implications for international trade. When MNEs
engage in production fragmentation, initially, production may be geographically
fragmented across national boundaries but organizationally confined within the
boundaries of a transnational firm. Affiliates of MNEs may rely heavily on imported
intermediate products from their home countries if they are faced with limited choices of
local suppliers of those products. This will be the case if intermediate inputs require
specialized production techniques that are not yet available in the host countries. It is
widely recognized that a significant amount of trade in the global economy is indeed
carried out in the form of intra-firm trade, which may be symptomatic of the prevalence
of FDI-based production fragmentation. Moreover, as production is fragmented across
locations, exports of capital goods required to produce parts and components from an FDI
source country may also expand. It may also increase imports by an FDI source country
as a host country increases exports of finished products back to the source country.
These networks, over time, disseminate knowledge to local suppliers in the host
countries, which can then enhance local capability formation (Ernst, 2000). Advanced
knowledge possessed by the MNEs may be spilled over through contractual relationship
with local firms. Production linkages as well as procurement relationships between the
foreign affiliates and the domestic firms are likely to be created and local technological
capability for producing intermediate goods improves. Furthermore, against the backdrop
of intensified competition in the world market in many industries, MNEs have been under

4
pressure to reduce their costs of sourcing intermediate products instead of focusing on the
origin of the suppliers. Regional production networks then cover both intra-firm and
inter-firm transactions linking together affiliates, joint ventures with its subcontractors,
suppliers as well as service providers. When foreign affiliates start sourcing intermediate
goods locally, it will partially offset the trade-creating effect of FDI.
At the same time, industry agglomeration or industrial clusters in various sectors
may form involving affiliates and non-affiliates for intermediate products when
economies of scale create more profit to offset transportation costs. Countries then tend
to specialize more narrowly within industries to define their own niche markets and
achieve scale economies. Take the hard disk drive industry in Thailand for instance.
Parts and components are procured locally as well as from other countries in Asia.
Furthermore, several suppliers located in different countries supply the same parts and
components to several assemblers on behalf of Seagate, Western Digital, Hitachi, Fujitsu
and etc. (Hiratsuka 2008.) The evidence of industrial clusters can be found in various
parts of East Asia; examples include the Shanghai-Jiangsu corridor and Guangzhou in
China, the Eastern Seaboard in Thailand, Penang in Malaysia and parts of Hsingchu and
Taoyuang in Taiwan. The establishments of a number of industrial clusters subsequently
led to the expansion of the international exchange of parts and components within East
Asia.
Antras (2005) proposes a theory of incomplete contracts that suggests that
production fragmentation will go through several stages. First, parts and components will
be produced within a single country where the firm is located. Second, attracted by lower
wages in the developing countries and facilitated by the standardization of the production
of such parts, the multinational firms will seek to outsource some of the lower end
production activities. The constraining factor however is the weakness of the institutions,
particularly intellectual property rights protection, in these emerging economies. Thus
the first stage of transnational production sharing is intra-firm—using foreign direct
investment and foreign affiliates to protect the technology and skill content contained in
these components. The next stage of offshoring is to localize the fragmentation process
by subcontracting with the local firms. The last stage consists of the entire process being
produced overseas, with only marking, research and development and other managerial

5
functions being retained in the home country. But where is East Asia situated in the
product cycle of offshoring today? Does foreign direct investment play an important
role? Is it really true that foreign direct investment systematically facilitate trade in parts
and components, particularly in East Asia?
Furthermore, does the nationality or the source of investment make a difference in
this regard? Production networks may be coordinated in a variety of ways involving a
mix of intra-firm and inter-firm structures. It has been documented that there exist
significant differences in the nature of the production networks created by MNEs from
different countries. Sturgeon (2003) identifies two kinds of international production
networks, the modular and the relational production network. The modular production
network has developed among US firms in particular the electronic industry in the 1980s
and has grown in importance in 1990s. A unique feature of this form of international
production network is the central role of independent contract manufacturers who not
only manufacture components or partial assemblies, but also offer end-to-end services,
which include production design and engineering, final assembly and test, and after-sales
service including repair service. For example, U.S. electronics companies such as
Hewlett Packard and Ericsson have sold off most of their worldwide manufacturing
infrastructure to specialized contract manufacturers such as Solectron and Flextronics
(Sturgeon, 2003) to which they outsource a rising share of their manufacturing activities.
The use of contract manufacturers has allowed original equipment manufacturers to free
up productive resources and concentrate on their core activities. The international
production networks created by U.S. firms therefore rely on an open and competitive
supply architecture involving independent firms based in the region.
In contrast, defining characteristics of structures of Japanese, Korean production
network is that they are hierarchical and captive networks. These are networks in which
dominant lead firms effectively coordinate tiers of suppliers. Japanese and Korean
networks had been structured on long-term business and traditional keiretsu or chaebol
relationships and relatively closed to outsiders (Borrus et al., 2000). The suppliers are
‘captive’ in a sense that they can’t switch buyers of their products easily due to relation-
specific investment and asset specificity. Lead firms at the same time make exit an
unattractive option for their suppliers by providing enough resources and market access
6
(Gereffi et al., 2005). This type of production networks exhibit a lower propensity to
engage in external souring.
As Japanese manufacturers have expanded into Asia, they have tried to replicate
their homegrown vertical keiretsu system. For example, electrical industries as well as
automobile industries consist of layers of subcontractors in Japan. Small and Medium
Enterprises (SMEs), as subcontractors to larger multinationals, function as suppliers of
intermediate goods. After large Japanese manufacturers shifted their production site from
Japan to various Asian countries seeking low-cost assembly sites for labor-intensive
production processes in 1970’s and 80’s, SMEs as well, established their overseas
production to extend the long-term close business ties which they have created with them
back home. A large part of FDI by Japanese MNEs is undertaken by SMEs, which is a
distinctive characteristic of Japanese FDI. Those SMEs which produce parts and
machinery for the large manufacturers also established support industries in the East
Asian countries.
Although identifying any systematic differences in trade and FDI behavior of
Japanese, U.S., Korean and European firms is beyond the scope of this paper, we will
simply examine whether FDI from those countries could have different implications on
intra-regional trade in East Asia.
The remainder of the paper is organized as follows: Section 2 describes some
characteristics of international trade in East Asia, particularly the extent of intraregional
trade and the characteristics of trade by stages of production for each country. Section 3
briefly discusses the general trend of inward FDI in East Asia. In Section 4, we attempt to
analyze the FDI-trade linkages in intra-regional exports and imports in East Asia,
focusing on FDI conducted by Japan, Germany and France. Our analysis will be
conducted on intra-regional exports and imports of parts and components as well as
capital goods. The section begins with a description of the variables used in the
regression analysis, followed by the estimation methodology. The results for all
regressions are reported and analyzed in Section 4.2. A conclusion is given in section 5.

7
2. Patterns of trade in East Asia2
2.1 Intraregional trade
Table 1a and 1b examine the changes in the share of geographic direction of
individual East Asian imports and exports, respectively for 1985, 1995, 2003, 2006 and
2009. These Tables also include the figures for North America and EU15 for
comparisons.
East Asia in general appears to have gone through significant changes in the
direction of their imports. Intra-East Asian trade already commanded a large share of
their total trade in 1985 at 48.7% continue to grow to 60.8% and 59.6% in 2003 and 2006,
respectively, indicating increased dependency on regional trade. The increase is largely
attributed to the China. China’s share almost tripled from 5.9% to 16.3% between 1985
and 2006. However, the share of intra-Asian trade declined from 59.6% in 2006 to 55.8%
in 2009, alongside the deepening global downturn. A large part of intra-East Asian trade
is linked to the international production networks which produce finished goods that are
then shipped to major importing countries. As the global financial crisis deepened since
2008, the share of intra-East Asian trade which ultimately depends on demand for
finished goods in developed economies may have also declined.
[Table 1a and 1b about here]
The NIEs as well increased its importance in intra-East Asian imports between
1985 and 2006. The share increased from 10.7% in 1985 to 18.4% in 2006. On the other
hand, the table reports relatively small gain in the share of the ASEAN by 3.6% between
1985 and 2006. In contrast, a sizeable decline occurred in the share of Japan by almost
11.3% during the same period and the share further declined by 1.5% from 2006 and
2009. The shares of North America in the East Asian imports also declined, however by
lower intensity relative to the Japanese experience. In contrast, the share of imports from
EU15 rebounded from 2006 to 2009 on the back of a general declining trend.
2 As defined in table 1, in this chapter East Asia includes China, Hong Kong, China, Indonesia, Japan, Republic of Korea, Malaysia, Philippines, Singapore, Taiwan Province of China and Thailand.
8
Increased dependency on regional trade can be seen for all East Asian countries,
although sizeable differences regarding the extent of the dependency exist among those
countries. At the same time, the dependency on North America and EU 15 as an import
source declined for all East Asian countries except for Japan and Singapore where the
share of EU 15 increased slightly.
The increased importance of China as an import source country can be seen in all
East Asian countries, particularly for more advanced nations such as Japan, Korea,
Taiwan and Hong Kong. China has also become an increasingly important factor for non-
regional markets. The increase in the share of China in the imports of North America
between 1985 and 2009 was 17.0%. In spite of the fact that intra-regional imports
dominate in EU15 accounting for 53.1% in 2009, China managed to gain its share by
6.7% since 1985. For both regions, China accounts for approximately 55% of their
imports from the East Asia in 2009.
The table shows that there have been significant changes in the pattern of China’s
imports as well. In 1985, more than one third of its imports originated from Japan. Two
decades later, its reliance on Japan has declined to 13.0%. On the other hand, a large
increase in the share of NIEs is witnessed.
A similar pattern of deepening trade ties among East Asian economies can be
observed on the export side. The share of intra-regional exports increased from 42.4% in
1985 to 51.6% in 2003 followed by the slight decline. Of all countries examined,
significantly higher increase in the share of intra-regional exports is reported for Taiwan
by almost 38% and Japan by 27.4% followed by Hong Kong and Korea by 22.3% and
21.1%, respectively. The increase in the share of intra-regional exports in all countries is
largely attributed to China and to lesser degree to NIEs. If we exclude Japan from East
Asia, increased dependency on regional trade is evidenced for all other Asian countries
except China.
The share of NIEs bound and ASEAN4 bound exports from China shrank from
36.4% to 27.2% between 1985 and 2009. In contrast, much higher portion of Chinese
goods is absorbed by both North America and to lesser extent by EU15 in 2009. As we
have shown in the import side, the reliance on North America declined for all other East
Asian countries except China. The decline in the reliance appears to be even larger on
9
the export side. Taiwan in particular, the share of North America declined from 51.4% in
1985 to 12.3% in 2009.
2.2 Composition of trade by stage of production in East Asia
The above section leads to the conclusion that East Asian countries have generally
become increasingly interdependent in trade. This section considers composition of trade
by stage of production in East Asia.
[Table 2 about here]
Table 2 examines the annual growth rate of trade in total manufactured goods and
compares them with the rate of trade in finished and intermediate goods. The table
provides strong evidence that trade in intermediate goods resulting from the international
fragmentation of production has been the engine driving Asian trade during recent years.
Between 1998 and 2009, exports of intermediate goods grew at a rate of 10.4% among
Asian nations on average, which is faster than the growth rate of 9.5% for exports of final
goods. On the import side, trade in intermediate goods grew over 2.4% faster than trade
in final goods. Compared with other parts of the world, the growth rate in intermediate
goods is much faster among Asian nations, both for exports and imports. The growth rate
of exports of intermediate goods for the world, the EU 15 and North America was 7.4%,
6.6% and 3.2%, respectively while that of imports was 7.4%, 6.4% and 3.5%,
respectively. This reflects the fact that international fragmentation of production has
prevailed more among the countries of East Asia relative to other regions of the world.
[Table 3 about here]
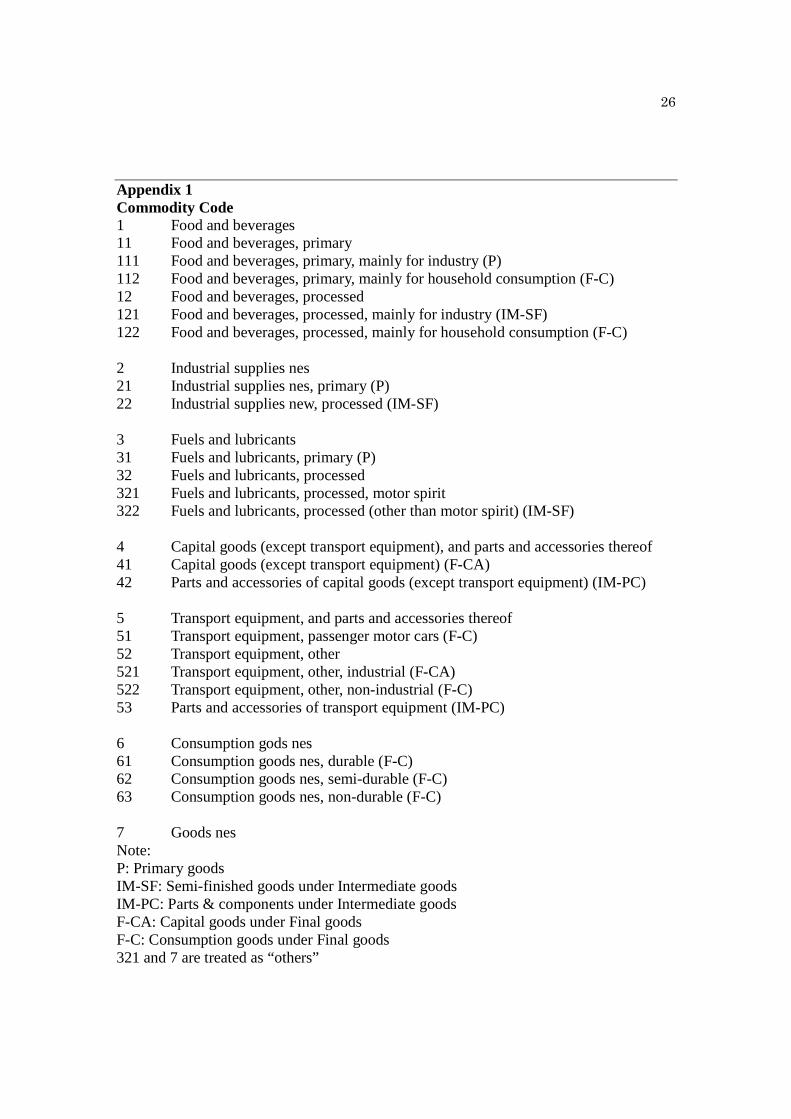
Table 3 further distinguishes different types of intermediate goods, i.e., parts and
components (IMPC) and semi-finished goods (IMSF). Finished goods are also further
classified into consumption goods (FC) and capital goods (FCA). Primary goods (P) form
the last category. This classification by different stages of production is useful in showing
how each nation of East Asia is involved in production fragmentation and to what extent
they differ from other regions of the world. The classification is explained in Annex 1.

10
The most notable difference between the world and the East Asian nations can be
found in the trade pattern of parts and components. At the global level, approximately one
fifth of both imports and exports comprise the exchange of parts and components. That
share remained relatively stable between 1998 and 2009 although both import and export
are on a slight declining trend during the most recent years. Table 3 shows very different
trends for different regions. For example, North America experienced declines of 6.5%
and 8.9%, respectively, in its import and export share of parts and components from 1998
to 2009. The EU 15 also experienced a declining trend in its parts and components trade,
although more moderately relative to North America. The trend in East Asia contrasts
markedly with the other regions, with the share of the parts and components trade
consistently accounts for approximately a quarter or more of total imports and exports
during the same period.
For finished products, the most distinguishing difference between the world and
the Asian nations can be found in the trade pattern of consumption goods, particularly on
the import side. Approximately 24% of world imports take the form of consumption
goods. In the case of North America and the EU15, the share is almost 30%. Among the
East Asian nations, the corresponding share only amounts to 12.5% in 2009, which was a
decline of almost 6% from 1998.
Another interesting point to note is the gradual decline in import share of capital
goods which can be seen in all Asian countries examined except Hong Kong and Korea.
However, one must use caution about BEC classification for capital goods. Capital goods
(41) include producers’ goods that are defined in the System of National Accounts (SNA)
as part of fixed capital formation. However, there are goods in capital goods (41 and 51)
that can be used as intermediate products in the related industry. Examples include
motors, diesel and semi-diesel engines, generators, transformers, radiators, rectifiers, and
so on.
Furthermore, there is considerable variation in the trade patterns across East
Asian countries. A general picture of the division of production processes in East Asia
can be drawn from table 4 as follows: China’s trade structure can be characterized by a
larger import share of parts and components and semi-finished products, and by a large
export share of consumption goods as well as capital goods. This reflects China’s role in

11
production fragmentation as a processing and assembly base for finished products
destined for the world market.
The general feature of three ASEAN countries, Malaysia, the Philippines and
Indonesia is a large share of intermediate goods among both imports and exports. The
decomposition of intermediate goods shows that while parts and components account for
a large share of imports and exports in Malaysia and the Philippines, semi-finished goods
account for a large share in Indonesia. The import structure of Thailand is similar to the
above-mentioned three ASEAN countries; however, the distinctive difference can be
found in its export structure, i.e., a much larger share of exports of consumption goods.
In this comparison, Singapore is treated separately from the four other ASEAN countries
due to its relatively high wages, and is discussed in later paragraphs.
Japan’s trade structure is quite a contrast to those of the developing Asian
countries. Japan is a large supplier of parts and components, reflecting Japanese
industries turning to other countries of the region for the assembly of Japanese products
(Jones et al, 2004). The trend is also marked by a small export share of consumption
goods. Table 3 also indicates that capital goods hold a large share of Japan’s exports,
which reflects in part large foreign direct investment (FDI) outflows from Japan.
Production fragmentation has been facilitated greatly by multinational corporations and
consequent FDI, which has had a significant impact on exports from investing countries
to host countries. This may be due to the fact that new production facilities need to be
equipped using capital goods from the investing country or because new capital goods are
required for expanding existing production capacities.
A large share of parts and components trade can also be found in countries such as
Singapore and Hong Kong, China where wage costs are much higher relative to other
developing countries of East Asia. In Singapore, parts and components make up a
substantial share of its imports and exports. Over 41% of imports and 48% of exports are
induced by the need for parts and components. This represents Singapore’s pivotal role as
an outsourcing centre in East Asia, particularly high-tech manufacturing, and as a hub for
many leading international firms. Singapore’s superior logistics sector as well as finance
industry helps to form world-class supply chains in the region.
Hong Kong as a trading hub for electronic parts and components in Asia hosts

12
a number of multinational manufacturers which source parts of key components and take
advantage of its free port status. At the same time, the Hong Kong, China electronics
industry is characterized by the heavy dependence on imported parts of key components.
Local firms source worldwide as well as from Chinese firms on the mainland. Hong
Kong’s import share of parts and components increased dramatically from 19.2% in 1998
to 39.0% in 2009. On the export side, electronics industry is the largest export industry,
accounting for nearly 50% of Hong Kong, China’s total exports in 2006. Furthermore,
two-thirds of Hong Kong, China’s electronics exports comprise parts and components.
What contributes to the large amount of parts and components exports is Hong Kong,
China’s involvement in outward processing production in China. This led to an increase
in Hong Kong, China’s export share from 17.6% in 1998 to 38.8% in 2009.
3. General trend in FDI inflow in East Asia
Table 4 shows that although global FDI inflow continued to be dominated by the
EU15 since 1980, East Asia (without Japan) has gained in importance as recipients of
FDI over time until mid-1990s in terms of both the volume of inward flows and their
world share. Total value of inflows of FDI into eight East Asian economies that amounted
to US$ 4.5 billion in 1985 increased to US$ 71.8 billion in 1995. Their share in total
world inflows rose from 7.7% in 1985 to 21.1% in 1995. The surge of FDI came to a halt
however in 1997 with the Asian financial crisis. The swift recovery from the crisis in
terms of FDI volume in 1998 was only followed by another sharp downturn in 2001.
Since 2003, FDI inflow to the region has been on a rise again. It reached US$ 132.51
billion in 2004, a 56% increase over 2003 with a backdrop of improved economic
performance, a more favorable FDI policy environment and a rise in merger and
acquisition activities in the region. Considering 30% increase in global FDI inflow in
2004, a gain in the region’s FDI inflow is spectacular. It continued to grow until 2008
reaching US$ 219 billion which was up forty nine-fold from 1985. The global financial
crisis had a major dampening effect on global FDI inflow in 2008 among developed
countries and spread to developing countries in late 2008 and early 2009. In the midst of
the turmoil however, total inflow of FDI in East Asia managed to increase slightly in

13
2008 because of the increased FDI inflow to Korea, Hong Kong, Indonesia and China
during the year countervailing the decreased FDI inflow to the rest of East Asian
economies. The region finally faced a downturn in FDI inflows in 2009, although the
share of East Asia in global FDI flows surged from 10.2% to 16.4% in 2009 as FDI flows
to developed countries further contracted during the year.
[Table 4 about here]
The largest contributor to the region’s rising share in global FDI inflow has been
China. FDI inflow to China has grown dramatically over the past two decades since
China initiated its “open-door” policy in 1978. It was in the mid-1980s when FDI inflows
surged and marked the beginning of China’s ride on the wave of globalization. After it
achieved unprecedented growth during the early 1990s, however, FDI inflow started to
decline. This downturn continued until the next wave of FDI inflow hit China in 2000.
Despite the widespread decline in global FDI inflow between 2000 and 2002, China was
able to increase FDI inflow with expectations of further deregulation and opening up
following that country’s accession to WTO. In 2008, the value inward FDI to China
continue to increase despite the financial crisis. The total value in 2008 was 55 times
larger than in 1985, accounting for 6.1 per cent of global FDI inflow and almost 52 per
cent of aggregate FDI inflow to East Asia. However, even China was not spared a
negative impact of the global financial crisis in 2009.
ASEAN 5 experienced a significant increase in FDI inflow during the early 1990s,
accounting for 7.4 per cent of global FDI inflow in 1995. The Asian financial crisis in
1997 triggered a sharp overall decline in the region’s FDI inflow of 40 per cent during
1998, although individual national performances varied greatly. In order to enhance the
attractiveness of the region for FDI inflow, the ASEAN Investment Area was established
in 1998 and required the member countries to reduce or eliminate investment regulations
and conditions that might impede investment flows. This provided a new impetus for
economic integration among ASEAN member countries. The ASEAN Free Trade Area
(AFTA) became fully operational on 1 January 2003 and this added momentum to
economic integration in the region. FDI inflows to the ASEAN 5 continued to increase

14
until 2007 reaching US$ 65 billion in 2007.
Among the ASEAN 5, Singapore has been a leader in attracting FDI, which has
played a pivotal role in that country’s economy. A liberal open-door policy and extensive
FDI promotion policies towards foreign investors attracted a massive amount of FDI. In
2007, Singapore retained its position as third-largest recipient in East Asia, attracting
US$ 35 billion, which accounted for approximately 55% of total FDI inflow to the
ASEAN 5. FDI inflows into the ASEAN 5 in 2008 varied significantly; they surged in
Indonesia; dropped slightly in Thailand and Malaysia; and fell sharply in the Philippines
and Singapore. Although inward FDI bounced in Singapore and the Philippines in 2009,
it continued to decline in Thailand, Malaysia and Indonesia.
FDI inflows to the East Asian “Tigers” (Hong Kong, China, China, the Republic
of Korea and Taiwan Province of China) began to increase rapidly in the early 1990s
against the backdrop of strong economic growth and the liberalization of investment
regimes. The slowdown of the domestic economy and the regional economic situation as
a result of the Asian financial crisis prompted the sharp decline of FDI inflows to Taiwan
in 1998. As a result, the share of the East Asian “Tigers” in global FDI declined to 2.8%
during the year. Since then, the share of these economies has quickly picked up and has
reached at 5.4% in 2000. Their share in global FDI inflow peaked at 6.1 per cent in 2004.
Hong Kong, China experienced an unprecedented FDI boom in 1999 after it
recovered from the turmoil of the Asian financial crisis. The surge reflected Hong Kong,
China’s role as a financial hub for business in the region, particularly in China. Hong
Kong, China is by far the largest foreign investor in China, and its investments have
increased dramatically since early 1980s. A significant portion of the investment
originates from China itself. Much of China’s capital outflow that takes place either
through legal or illegal channels to Chinese firms located in Hong Kong, China finds its
way back to China as FDI. This type of “round tripping” of funds is mostly used to
escape regulations such as barriers to trade or to gain eligibility for incentives available
only to foreign investors (e.g., tax concessions). Hong Kong, China is also used as a
stepping stone for investment to China. A large number of foreign firms use affiliates in
Hong Kong, China to invest in China on their behalf. In addition, many overseas
companies have regional offices as well as regional headquarters in Hong Kong. Hong

15
Kong, China has been experiencing another surge in FDI inflows during recent years.
This partly reflects the Closer Economic Partnership Arrangement (CEPA) signed
between Hong Kong, China and China, which opened up new opportunities not only for
firms in Hong Kong, China but also for foreign investors. In 2004, Hong Kong, China
attracted almost 26% of the FDI inflow into the region, and accounting for 4.8 % of
global FDI inflow. Hong Kong remained as Asia’s second largest destination for FDI
during more recent years.
Since the 1997 Asian financial crisis, the Republic of Korea has adopted
extensive policy reforms in favor of FDI such as simplifying the approval procedure, the
removal of various restrictions on foreign ownership, strengthening tax incentive systems
and financial support for foreign investors, among others. As a result, FDI inflows began
to surge in 1997 and maintained strong growth until 2000. In 2004, the inflows picked up
once again and the Republic of Korea absorbed more than 1 % of global FDI inflow.
Inflows to Republic of Korea declined considerably in 2006 due mainly to a significant
fall in the value of cross-border M&As and divestment by foreign investors (UNCTAD
2007). Following a continuous decline in FDI inflows during the period 2005-2007, FDI
in Republic of Korea surged despite the impact of the global financial crisis.
The inflow of FDI to Taiwan grew rapidly, particularly towards the end of the
1990s, due to a large-scale reform of various laws and regulations on FDI inflows as well
as further opening up of the financial sector. However, after 2001, the absolute magnitude
of FDI in Taiwan has been small, which was a clear contrast to the surge in FDI inflow in
the Republic of Korea. However, in 2006, Taiwan saw the highest growth rate of FDI in
this region, with inflows jumping to over US$7 billion. This was only followed by the
sharp decline in inward FDI as the global financial crisis spread to East Asia in 2008 and
2009.
4. Gravity equation
4.1. Model specification and estimation method
The gravity model has been widely applied in various studies of international
trade and FDI (Feenstra et al. 2001). The gravity equation in international trade using
16
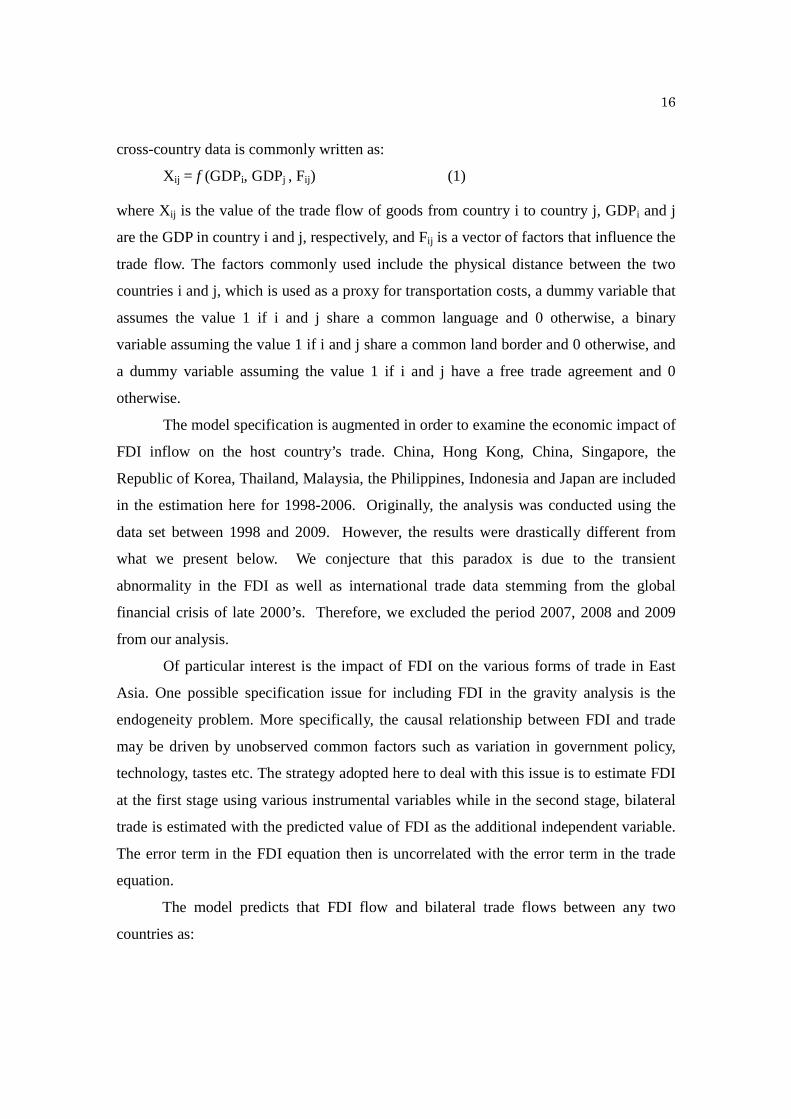
cross-country data is commonly written as:
X ij = f (GDPi, GDPj , Fij) (1)
where Xij is the value of the trade flow of goods from country i to country j, GDPi and j
are the GDP in country i and j, respectively, and Fij is a vector of factors that influence the
trade flow. The factors commonly used include the physical distance between the two
countries i and j, which is used as a proxy for transportation costs, a dummy variable that
assumes the value 1 if i and j share a common language and 0 otherwise, a binary
variable assuming the value 1 if i and j share a common land border and 0 otherwise, and
a dummy variable assuming the value 1 if i and j have a free trade agreement and 0
otherwise.
The model specification is augmented in order to examine the economic impact of
FDI inflow on the host country’s trade. China, Hong Kong, China, Singapore, the
Republic of Korea, Thailand, Malaysia, the Philippines, Indonesia and Japan are included
in the estimation here for 1998-2006. Originally, the analysis was conducted using the
data set between 1998 and 2009. However, the results were drastically different from
what we present below. We conjecture that this paradox is due to the transient
abnormality in the FDI as well as international trade data stemming from the global
financial crisis of late 2000’s. Therefore, we excluded the period 2007, 2008 and 2009
from our analysis.
Of particular interest is the impact of FDI on the various forms of trade in East
Asia. One possible specification issue for including FDI in the gravity analysis is the
endogeneity problem. More specifically, the causal relationship between FDI and trade
may be driven by unobserved common factors such as variation in government policy,
technology, tastes etc. The strategy adopted here to deal with this issue is to estimate FDI
at the first stage using various instrumental variables while in the second stage, bilateral
trade is estimated with the predicted value of FDI as the additional independent variable.
The error term in the FDI equation then is uncorrelated with the error term in the trade
equation.
The model predicts that FDI flow and bilateral trade flows between any two
countries as:

17
FDIi = α0 + β1DIFPGDPij + β2DIFWAGEij +β3DUTY i + β4CTAX i + β5CORRUPTi
+β6GSTABi+β7LAW i + β8TELi+ εij (2)
Tij = γ0+ρ1GDPi+ ρ2GDPj +ρ3DISTij +ρ 4DMB i + ρ5FDIi + δij (3)
where subscripts i and j refer to the reporting country and the partner country. The
definition of the variables in the above equation is listed below. Annual data for eight
countries from 1998 to 2004 are used in the estimation. Equation (3) is run on parts and
components and capital goods separately. In addition, the impact of an each explanatory
variable on bilateral import flows and export flows are examined separately.
• FDI i – the level of FDI stock in the reporting country.
• DIFPGDPij – the absolute value of the difference in per capita GDP between i and j.
• DIFWAGEij – the absolute value of the difference in wages between i and j.
• DUTYi – import tariff of the host country.
• CTAX I – corporate tax rate of the host country.
• CORRUPT i – an index of corruption in the host country.
• GSTAB i – an index of government stability in the host country.
• LAW i – an index of rule of law in the host country.
• TEL i – the number of telephone main lines per 1,000 people in the host country.
• DISTij – the geographical distance between the most important cities in i and j.
• Tij – the volume of exports or imports by country i to or from j in total trade,
intermediate or final products.
• GDP – gross domestic product.
• DMB ij – a dummy variable that is 1 if i and j share a common border and 0 otherwise.
The independent variables included in equation (2) are believed to exert an
influence on inward foreign direct investment in each country of East Asia by changing
the investment environment through institutional and policy changes, and economic
conditions.

18
Two variables have been incorporated in this analysis that may influence the level
of foreign production – the absolute difference of per capita GDP (DIFPGDP) and wages
(DIFWAGE). The gap in per capita GDP and wages between a reporting country and a
partner country should have a positive influence on FDI of the vertical type.3 Trade in
intermediate goods can be very sensitive to cost differences between two countries. For
production fragmentation to take place, additional coordination costs must be offset by a
reduction in the total production costs. Factor price differentials between countries allow
at least one fragment to be produced more cheaply in another country (Deadorff, 2001).
The gap in production costs between the two countries must be sufficiently large in order
for production fragmentation to occur.
Policy-related variables, tariff barriers proxied by import duty and corporate tax
rates have also been incorporated. MNEs, which set up vertical production networks, may
be encouraged to invest in a country with relatively low tariff barriers due to lower costs
of their imported intermediate products. Under such an arrangement, goods-in-process
may cross multiple borders while they are being produced. Since a tariff may be imposed
each time these goods-in-process cross a border, the effect of the lower tariff rate on the
reduction in the cost of production of these goods can be magnified.
Another policy-related variable that can influence a host country’s location
advantage is the host country’s corporate or other tax rates. As global profit maximizers,
MNEs can be assumed to be sensitive to tax factors, since such factors have a direct
effect on their profits. Evidence of significant negative influence from corporate tax rates
on FDI have been reported in previous studies by Wei (1997), Gastanaga and others
(1998) and Hsiao (2001).
Also included in equation (2) are institutional factors, the level of corruption, the
stability of each government and the rule of law. Corruption can discourage FDI by
inducing a higher cost of doing business. Hines (1995) showed that FDI from the United
States grew more rapidly in less corrupt countries than in more corrupt countries after
1977. Wei (1997) presented an alternative explanation of the negative and significant
effect of corruption on FDI. Unlike taxes, corruption is not transparent and involves
3 For a very interesting study on how vertical intra-industry trade helps integrate East Asia, see Wakasugi (2007).
19
many factors that are more arbitrary in nature. An agreement between a briber and a
corrupt official is difficult to enforce and it creates more uncertainty over the total
questionable payments or the final outcome. Wei demonstrated the fact that this type of
uncertainty induced by corruption leads to a reduction in FDI. Political stability of a
government and the sound rule of law can also be important factors in the inflow of FDI.
Uncertain political environments and their related risks can impede FDI inflows despite
favorable economic conditions.
The last variable, TEL, included in equation (2) is a proxy for quality of
infrastructure. On the other hand, as theorized by Jones and Kierzkowski (1990), such
fragmentation is not costless. Unlike final goods, the intermediate goods produced among
network member countries may cross multiple international borders. This incurs
additional costs of transportation as well as costs of a wide variety of services associated
with coordinating production, shipments, sales of final goods etc.
We now turn to equation (3). The volume of trade in both intermediate and final
products is expected to be positively related the market size of the two countries
concerned. The variable GDP captures the idea that larger countries trade more than small
countries as they can offer more differentiated products to satisfy a wide variety of
consumers. At the same time, for producers of both intermediate products as well as
capital goods, the larger the market size of both exporting and importing countries due to
the presence of economies of scale, the larger the volume of trade. According to the
theory of fragmentation outlined by Jones and others (2004), scale of production would
determine the lengths to which the division of labor can proceed since the level of the
workers’ specialization increases as the scale of production rises. As Grossman and
Helpman (2005) proposed, the variable can also be treated as a proxy for the “thickness”
of the markets; this has a positive impact on the location of outsourcing, as the likelihood
of the firms finding an appropriate partner in their search increases as the size of a
country increases.
The distance variable is considered to be a crucial factor in explaining
international trade since distance increases transportation costs, which is a trade-
resistance factor that negatively influences the bilateral trade volume. In particular,
transportation costs are considered to have a larger impact on decisions concerning

20
production fragmentation, as each intermediate product that belongs to the same value-
added chain may cross national boarder multiple times. Geographical proximity, on the
other hand, promotes bilateral trade flows as it reduces transportation needs, information
costs, cultural unfamiliarity etc. Therefore, the expected sign of the variable is negative.
In this study, the great circle distance between the capital cities of the reporting country
and the partner country is used.
The final variable is a dummy variable with regard to whether the importing
country and exporting country are adjacent. The dummy variables may capture various
factors that lead to reduced business transaction costs. For example, firms in adjacent
countries are likely to have a better understanding of business practices than firms from a
different business environment. This familiarity certainly helps to reduce the cost
involving uncertainty. The familiarity with the business environment also helps to reduce
the difficulty of finding an appropriate outsourcing partner in production networks. As
the variable is assumed to capture additional proximity between trading partners that
facilitate trade, it is expected to be positively related to the level of trade.
Except for the dummies, all variables are log-linearized. Sources for the variables
are listed in Appendix 2.
4.2 Estimation results
Table 5 represents the results of the estimations by random effect model. It
reveals a positive and statistically significant influence of all countries’ direct investment
on trade in parts and components as well as in capital goods. The results indicate that FDI
by all source countries cause both intra-regional bilateral exports and imports of parts and
components as well as capital goods to increase among the Asian countries. Thus inward
FDI and trade in both parts and components and capital goods are complementary. On
the import side, the result may be attributed to various trade liberalization policies and
institutional changes that many East Asian economies pursued during the 1990s to help
generate greater openness for trade. For example, many East Asian economies
unilaterally eliminated their tariffs on capital and intermediate goods. In addition, duties
on trade in information technology products were completely eliminated due to the

21
completion of the Information Technology Agreement (ITA) in 1996. This is important
because among the commodities actively traded in the East Asian region (excluding
Japan) the leading category is information technology products. Regarding institutional
changes, the establishment of Export Processing Zones (EPZ), where manufacturers can
enjoy import duty exemption on imported inputs and capital goods as well as extensive
usage of a duty drawback system on the imported parts and components used for the
production of exports, effectively reduces the impact of tariff barriers on trade.
[Table 5 about here]
. As discussed in Sectio 1, Antras (2005) provides a theoretical framework of the
various stages of offshoring or international production fragmentation. Stage I consists of
firms producing parts within the home countries. Stage II refers to the situation when the
firms invest abroad and the affiliates source their more standardized parts from
developing countries. This is the stage when FDI plays an important role. During Stage
III, the multinational firms procure from the localized firms and leave much of the
production chain to the developing countries. The set of variables that affect the
progression of the stages include the quality of the institutions in the developing countries,
the relative wages as well as the degree of standardization of the parts. Using Antras’
basic taxonomy, East Asia remains at Stage II of the product cycle of offshoring.
Furthermore, a closer look reveals that the magnitude of the coefficient of parts
and components is far from homogenous among six countries. Japanese direct
investment appears to have a very large effect on both intra-East Asian bilateral exports
and imports relative to FDI from other countries. On the export side, the impact of
Japanese direct investment exerted on regional bilateral exports of parts and components
is approximately 1.6 times and 1.4 times as large as FDI from Germany and France,
respectively. Similarly, on the import side, the large difference exists between FDI from
Japan and the rest of the countries.
Japanese manufacturing industries over time concentrated production by product
and part through their business networks in East Asia in order to achieve economies of
scale. During the process, a cross-border division of labor by Japanese MNEs started to

22
expand from between Japan and East Asia to between the East Asian countries not
including Japan (METI 2008). The large impact of Japanese direct investment on the
intra-regional trade of parts and components may be attributed to this distinctive
characteristic of Japanese direct investment.
The international production networks created by U.S. firms particularly in
electronics industry has been identified as more open relative to Japanese counterparts
involving independent suppliers both local and other non-U.S. foreign affiliates based in
the region. The relatively small coefficients for U.S. FDI can be explained by their
networks’ general characteristics.
Regarding intra-regional bilateral exports and imports of capital goods, the
difference in the magnitude of the impact of Japanese direct investment relative to other
FDI source countries is magnified in both exports and imports. The stark difference can
partly be due to an extensiveness of Japanese machinery production in Asia and the fact
that a wide range of goods that can be used as intermediate inputs in related industries
being classified as “Capital Goods” in BEC as we discussed in previous section.
The overseas structure of Japanese general machinery industry is characterized by
continual expansion in the number of production and bases around the world. The
geographical spread of general machinery affiliates is diverse, but reflects the locations of
electrical, electronics and automotive industries which are supplied by firms in the
general machinery industry (Farrell 2008). In 2003, 18 % of general machinery industry
affiliates were located in China, 16 % in North America, 15 % in ASEAN and 8 % in the
NIEs economies (JBIC, 2004). Furthermore, with the assistance of the Keiretsu system
and the assistance of local Japanese government in deploying overseas operation for
SMEs (at the prefecture and the ward level), very strong intra- and inter- industry
relationships that originate from Japan exists. In particular, close working relationships of
these firms in overseas locals develop into almost a “brotherhood” with respect to other
foreign presences at a given local or regions. Over time, these working and sometimes
personal relationships of “fellow Japanese” developed into a valuable trust that allows
further intra and inter industrial co-operations that otherwise would not have existed.
Another key aspect of Japanese machinery industries is that they possess strong,
leading history in post WWII machinery industry. Japanese were the early adaptors and

23
developers of then new Numeric Control technology (NC), which they aggressively
applied to their products with continual improvements. This effort resulted in high
valuation and world wide acceptance of their machineries in the latter half of ‘70s. In
1982, Japan has become world largest machine tool producer of the world. At their peak
production in 1990, Japan recorded $13 billion USD. Since then Japan has continued to
lead the industry to this day.
Japanese industry as a whole, not just the machinery industry, has also expanded
in their offerings to the world as well as to themselves. Ranging from common and
relatively low-tech components, to household electric/electronic goods, to automobiles, to
NC machineries to, high-tech machineries, to aerospace components and finish goods. In
contrast, US, German, Chinese, Taiwanese and Korean industries produce narrower
selections at the different levels of development.
A large impact of Japanese direct investment on the bilateral intra-regional trade
in Asia can be best understood by the wide range of offerings from Japan and from their
affiliates in Asia many of which fall into “Capital Goods” classification.
The coefficients for the two standard variables, the market size of both reporting
and partner countries and the distance have expected signs and are statistically significant
at the 1% level for both parts and components and capital goods for all countries
examined. The overall results for GDP are consistent with the hypothesis that larger
countries with a large production capacity are more likely to enjoy economies of scale
and to export more, while at the same time importing more due to a higher capability of
absorption.
Distance is found to be an important resistance factors for trade flows of both
exports and imports of both types of trade. Distance is likely to represent not only
transportation costs, but also other costs incurred in delivering a good to the final user,
such as telecommunications, local distribution, and regulatory costs. Lowering the costs
of these service links that connect the two production blocks is crucial for countries to
successfully be an integral party of production networks. The relatively large impact of
the distance variable found in this study implies that high potential benefits for East Asian
countries can accrue by reducing the level of trade costs.
The adjacency dummy included to capture additional advantages arising from

24
geographical proximity is not found to have significant influence on regional bilateral
trade.
5. CONCLUSION
In this paper we document the growing importance of intra-East Asian trade of
parts and components. Our statistical analysis based on gravity model shows that FDI
from Japan, Germany and France all play an important and independent or exogenous
role in facilitating the trade of parts and components in East Asia. Using Antras’ basic
taxonomy, East Asia remains at Stage II of the product cycle of offshoring. Furthermore,
if we adopt Antras’ framework, this implies that institutional quality, particularly
intellectual property rights protection, remains a concern for the decision to localize the
production chain in the host economies.
Does the source of FDI matter for the linkages between FDI and the various
modes of trade? Our empirical studies show that FDI from Japan has a particularly
strong influence on both trade in parts and components as well as trade in capital goods
relatively other countries examined in this paper. With respect to capital goods, it is
fairly well-known that the Japanese engineering and machinery sector has a long and
distinguished history and continues to be a strong sector of the economy. It seems likely
that Japanese affiliates are set up abroad to import machinery from Japan or to
manufacture and export some of the capital goods to other Asian economies. Such
capital goods are used to produce and export parts and components. Thus for the case of
Japan, trade in capital goods and trade in parts are both facilitated by Japanese investment
and the two modes of trade are positively correlated. In addition, FDI rather than local
supply is needed both because of the quality of the machinery as well as the importance
of safeguarding the intellectual content of such capital goods. Other complementary
explanations of the significant influence of Japanese FDI on modes of intra-East Asian
trade include the activities of the small and medium enterprises as well as other keiretsu
suppliers that follow the Japanese multinationals when they go abroad. In contrast,
investments from the rest of the countries examined also facilitate trade in parts and
components as well as capital goods but they lack the focused activities of their

25
machinery sectors. They may also use local suppliers as well as supplies from foreign
affiliates in the region.
There are several implications from our studies. First, there are other Asian
economies which so far have been outside of the Asian production network, including
much of South Asia. It is clear that to promote trade in parts and components, these
economies will need to adopt policies that are friendly not only to trade, but also to FDI.
A set of policies that are of importance to both trade and FDI will be the improvement of
infrastructure, including ports, highways, airports, etc. However, both our empirical
work as well as existing theoretical studies show that the quality of institutions (rule of
law, corruption, intellectual property rights protection, etc.) will also be important to
attract FDI, which then will facilitate the formation of the production network.
Finally, there may be particular reasons that East Asian economies should focus
on deepening its production network that is facilitated by FDI from other Asian countries
and more centered on Asian consumptions. First, the global financial crisis has been
mainly transmitted to Asian economies through the trade channels as a result of a drop in
the import demand from the developed economies. This was due to the high dependency
of those economies on the U.S. and the EU market to absorb final goods, despite
continuous growth of intra-East Asian trade. Furthermore, as we have shown in this paper,
many countries in the region highly specialize in parts and components trade. The biased
reliance on the trade in parts and components makes those economies vulnerable as the
demand for parts and components heavily depends on the demand for final goods from
the developed economies, which in turn depend on the economic conditions of those
economies. Production and trade networks that are more centered in Asia and hopefully
more catered towards Asian consumers and Asian government purchases may be more
stable and less likely to face sudden sharp declines, as we have witnessed in the most
recent global slowdown.
26
Appendix 1 Commodity Code 1 Food and beverages 11 Food and beverages, primary 111 Food and beverages, primary, mainly for industry (P) 112 Food and beverages, primary, mainly for household consumption (F-C) 12 Food and beverages, processed 121 Food and beverages, processed, mainly for industry (IM-SF) 122 Food and beverages, processed, mainly for household consumption (F-C) 2 Industrial supplies nes 21 Industrial supplies nes, primary (P) 22 Industrial supplies new, processed (IM-SF) 3 Fuels and lubricants 31 Fuels and lubricants, primary (P) 32 Fuels and lubricants, processed 321 Fuels and lubricants, processed, motor spirit 322 Fuels and lubricants, processed (other than motor spirit) (IM-SF) 4 Capital goods (except transport equipment), and parts and accessories thereof 41 Capital goods (except transport equipment) (F-CA) 42 Parts and accessories of capital goods (except transport equipment) (IM-PC) 5 Transport equipment, and parts and accessories thereof 51 Transport equipment, passenger motor cars (F-C) 52 Transport equipment, other 521 Transport equipment, other, industrial (F-CA) 522 Transport equipment, other, non-industrial (F-C) 53 Parts and accessories of transport equipment (IM-PC) 6 Consumption gods nes 61 Consumption goods nes, durable (F-C) 62 Consumption goods nes, semi-durable (F-C) 63 Consumption goods nes, non-durable (F-C) 7 Goods nes Note: P: Primary goods IM-SF: Semi-finished goods under Intermediate goods IM-PC: Parts & components under Intermediate goods F-CA: Capital goods under Final goods F-C: Consumption goods under Final goods 321 and 7 are treated as “others”

27
Appendix II Source of variables
FDI: Aggregate FDI inflows of each country, aggregate FDI inflows to East Asia, and
aggregate FDI to the world are from UNCTAD.
CORRUPT: An index of corruption from the International Country Risk Guide by the PRS Group. It ranges from 0 to 6, with a higher number indicating a lower level of corruption.
GSTAB: An index of government stability from the International Country Risk Guide by the PRS Group. The range is from 0 to 12. A higher score means higher stability of a government.
Law: An index of Law and Order from the International Country Risk Guide by the PRS Group. It ranges from 0 to 6, where a higher number indicates a better system of law and order.
DUTY: Import duties are from the International Monetary Fund’s Government Finance Statistic Yearbook.
WAGE: Average wages in manufacturing from the United Nations Common Database, LABORSTA and official country websites.
CPTAX: Corporate income tax rate, measured in percentage points, from Worldwide Summary by PricewaterhouseCoopers website.
TEL: Telephone mainlines (per 1,000 people) from World Development Indicators.
GDP: GDP in United States dollars are from EconStats.
PGDP: Per capita GDP are from EconStats.
28
References
Antras, Pol, 2005, “Incomplete contracts and the product cycle,” American Economic Review, vol. 95, No.4, pp. 1054-1073. Athukorala, P. C., 2006. “Product fragmentation and trade patterns in East Asia”, Asian
Economic Papers, vol. 4, No. 3; pp. 1-27.
Borrus, Michael, 1997, “Left for dead: Asian production networks and the revival of US electronics”, in B. Naughton (eds.), The China Circle Economics and Technology in the PRC, Taiwan, and Hong Kong, Washington, DC: Brookings Institution Press, pp.139-163.
Borrus, M., D. Ernst and S. Haggard, 2000, “Introduction: cross-border production networks and the industrial integration of the Asia-Pacific region” in M. Borrus, D. Ernst and S. Haggard (eds.), International Production Networks in Asia: Rivalry or riches?, pp4-29. Routledge.
Deardorff, A. V., 2001. “Fragmentation across cones”, in S. W. Arndt and H. Kierzkowski (eds.), Fragmentation: New Production Patterns in the World Economy, pp. 35-51. Oxford University Press.
Ernst, Dieter, 2000. “Evolutionary Aspects: the Asian production networks of Japanese electronics firms”, in M. Borrus, D. Ernst and S. Haggard (eds.), International Production Networks in Asia: Rivalry or riches?, pp79-107. Routledge.
Farrell, Roger Simon, 2008. Japanese Investment in the World Economy: A Study of Strategic Themes in the Internationalization of Japanese Industry, Edward Elgar Publishing.
Feenstra, Robert C., James R. Markusen and Andrew K. Rose, 2001, “Using the gravity equation to differentiate among alternative theories of trade”, Canadian Journal of Economics, 34 (2), 430-437.
Fung, K.C., Alicia Garcia-Herrero and Alan Siu, 2009, “Production Sharing in Latin America and East Asia,” BBVA Working Paper 09-01.
Gastanaga, V. M., J. B. Nugent and B. Pashamova, 1998. “Host country reforms and FDI inflows: How much difference do they make?” World Development, vol. 26, No. 7; pp. 1299-1314.
Gereffi, G., Humphrey, J. and Sturgeon, T., 2005, “The Governance of Global ValueChains”, Review of International Political Economy, 12 (1), pp.78-104.
Grossman, G. M. and E. Helpman, 2005. “Outsourcing in a global economy”, Review of Economic Studies, vol. 72, No. 1; pp. 135-159.
Hanson, G. H., R. J. Mataloni, Jr., and M. J. Slaughter, 2001. “Expansion strategies of U.S. multinational firms”, in S. M. Collins and D. Rodrik (eds.), Brookings Trade Forum 2001, pp. 245-282. Washington, D.C., Brookings Institution Press.
Hines, J. R., Jr., 1995. “Forbidden payment: Foreign bribery and American business after 1977”, National Bureau of Economic Research working paper, No. 5266. Cambridge, MA, United States.
Hiratsuka, Daisuke, 2008. “Japan’s Outward FDI in the Era of Globalization”, in R. S. Rajan, R. Kumar and N. Virgill (eds.), New Dimensions of Economic Globalization:

29
Surge of Outward Foreign Direct Investment from Asia, pp. 87-114. World Scientific Publishing Company, Incorporated.
Hsiao, C., 2001. “Efficient estimation of dynamic panel data models – with an application to the analysis of foreign direct investment to developing countries,” paper prepared for the 2001 Econometric Society Far Eastern Meeting in Kobe, Japan.
Hummels, D., J. Ishii and K-M Yi, 2001. “The nature and growth of vertical specialization in world trade”, Journal of International Economics, vol. 54, No. 1; pp. 75-96.
Japanese Bank of International Cooperation, 2004. JBIC Review, May, Tokyo
Jones, R. W., and H. Kierzkowski, 1990. “The role of services in production and international trade: A theoretical framework,” in R. Jones and A. Krueger (eds.), The Political Economy of International Trade: Festschrift in honor of Robert Baldwin, pp. 31-48. Oxford, Basil Blackwell.
Jones, R. W., H. Kierzkowski and C. Lurong, 2004. “What does the evidence tell us about fragmentation and outsourcing”, International Review of Economics and Finance, vol. 14, No. 3; pp. 305-316.
Krugman, P., 1995. “Growing world trade: Causes and consequences”, Brooking Papers on Economic Activity 1; pp. 327-377.
White Paper on International Economy and Trade 2008, Ministry of Economy, Trade and Industry, Japan.
Ng, F. and A. Yeats, 2003. “Major trade trends in East Asia: What are their implications for regional cooperation and growth?”, policy research working paper No. 3084, World Bank, Washington, D.C.
———, 2001. “Production sharing in East Asia: Who does what for whom, and why?” in L. K. Cheng and H. Kierzkowski (eds.), Global Production and Trade in East Asia, pp. 63-109. Boston, Kluwer Academic.
Sturgeon, T.J., 2003, “What really goes on in Silicon Valley? Spatial clustering and dispersal in modular production networks”, Journal of Economic Geography, 3, pp.199-225.
Wakasugi, Ryuhei, 2007, “Vertical Intra-Industry Trade and Economic Integration in East Asia,” Asian Economic Papers, Winter, v.6, No.1, pp.26-39.
Wei, S-J., 1997. “Why is corruption so much more taxing than tax? Arbitrariness kills”, National Bureau of Economic Research working paper, No. 6255. Cambridge, MA, United States.

30
Table 1.a The Geographic Pattern of East Asian Imports: 1985, 1995, 2003, 2006, 2009
East Asia Japan China NIEs ASEAN4N. America EU15East Asia 1985 48.7% 25.7% 5.9% 10.7% 6.4% 17.1% 13.6%
1995 56.4% 22.8% 10.0% 16.0% 7.5% 15.8% 13.9%2003 60.8% 17.5% 14.3% 18.4% 10.7% 11.3% 11.0%2006 59.6% 14.4% 16.3% 18.4% 10.4% 9.6% 9.8%2009 55.8% 12.9% 16.1% 16.7% 10.1% 9.1% 10.5%
Japan 1985 25.9% 5.1% 7.7% 13.1% 24.0% 7.6%1995 34.7% 10.8% 12.3% 11.5% 25.9% 14.5%2003 42.4% 19.7% 10.2% 12.5% 17.6% 12.8%2006 41.4% 20.5% 9.8% 11.1% 13.7% 10.0%2009 41.9% 22.3% 8.6% 11.0% 12.6% 10.3%
Korea 1985 34.8% 24.2% 0.0% 3.5% 7.1% 22.8% 11.0%1995 40.0% 24.6% 5.6% 4.2% 5.6% 24.7% 13.4%2003 47.1% 20.3% 12.3% 7.1% 7.5% 15.0% 10.8%2006 45.0% 16.8% 15.7% 5.6% 7.0% 11.9% 9.4%2009 45.1% 15.3% 16.8% 5.9% 7.0% 10.1% 9.5%
Taiwan 1985 37.1% 27.6% 0.0% 3.8% 5.7% 25.5% 11.1%1995 48.0% 29.2% 3.0% 8.8% 7.0% 21.6% 14.4%2003 56.1% 25.7% 8.7% 11.4% 10.3% 14.2% 10.4%2006 54.8% 23.0% 12.3% 10.9% 8.6% 11.9% 8.6%2009 52.3% 20.8% 14.0% 9.4% 8.0% 11.1% 8.7%
Hong Kong 1985 68.8% 23.1% 25.5% 17.5% 2.8% 9.8% 12.3%1995 74.5% 14.8% 36.2% 18.8% 4.6% 8.4% 10.8%2003 78.9% 11.8% 43.3% 17.1% 6.6% 5.9% 8.3%2006 81.1% 10.3% 45.8% 18.4% 6.6% 5.2% 7.1%2009 78.5% 9.2% 45.7% 15.7% 7.8% 5.2% 7.6%
Singapore 1985 49.6% 17.0% 8.6% 6.8% 17.2% 15.5% 12.2%1995 57.6% 21.1% 3.3% 11.8% 21.5% 15.5% 13.4%2003 58.1% 11.3% 8.1% 10.7% 28.0% 13.6% 11.7%2006 57.5% 8.3% 11.4% 12.5% 25.3% 13.1% 10.9%2009 53.2% 7.6% 10.5% 12.2% 22.8% 12.3% 13.1%
China 1985 49.8% 35.8% 11.9% 2.1% 14.6% 16.5%1995 54.6% 22.0% 28.1% 4.5% 14.2% 16.1%2003 54.1% 18.0% 27.6% 8.4% 9.3% 12.8%2006 49.3% 14.6% 25.9% 8.7% 8.5% 11.0%2009 42.5% 13.0% 21.3% 8.2% 8.9% 12.0%
Thailand 1985 49.9% 26.5% 2.4% 13.7% 7.2% 12.6% 16.1%1995 55.4% 30.7% 3.0% 15.3% 6.4% 12.7% 15.9%2003 57.5% 24.1% 8.0% 13.8% 11.6% 10.0% 10.0%2006 56.4% 20.1% 10.6% 13.6% 12.1% 7.1% 8.4%2009 56.7% 18.7% 12.7% 13.2% 12.1% 6.8% 8.8%
Malaysia 1985 54.2% 23.2% 2.1% 22.4% 6.6% 16.4% 16.1%1995 59.1% 28.1% 2.3% 23.7% 5.0% 17.1% 15.6%2003 63.1% 17.2% 8.8% 25.1% 12.0% 16.0% 11.8%2006 63.0% 13.2% 12.1% 25.2% 12.5% 13.0% 11.1%2009 60.9% 12.4% 13.9% 22.3% 12.2% 11.7% 11.4%
Indonesia 1985 45.0% 14.4% 5.4% 13.7% 11.5% 25.9% 9.3%1995 51.4% 22.1% 2.3% 21.0% 5.9% 19.9% 10.7%2003 53.1% 13.0% 9.1% 20.8% 10.2% 9.3% 10.9%2006 55.0% 9.0% 10.9% 23.9% 11.3% 7.8% 9.7%2009 61.0% 10.2% 14.5% 25.2% 11.2% 8.4% 8.6%
Philippines 1985 42.9% 25.8% 2.4% 13.5% 1.2% 18.7% 19.0%1995 47.3% 22.7% 3.7% 17.0% 3.9% 13.7% 20.1%2003 55.0% 19.5% 4.6% 21.5% 9.4% 22.4% 8.1%2006 57.6% 14.2% 7.2% 26.2% 10.0% 16.6% 8.3%2009 60.9% 12.6% 8.9% 25.8% 13.7% 12.5% 7.2%
N. America 1985 31.6% 17.7% 1.0% 10.2% 2.7% 27.9% 19.9%1995 35.0% 14.6% 5.6% 9.8% 5.1% 27.5% 16.4%2003 31.0% 8.5% 11.4% 6.8% 4.4% 24.3% 18.1%2006 31.7% 7.3% 14.8% 5.5% 4.1% 22.2% 16.3%2009 32.4% 5.7% 18.0% 5.1% 3.6% 20.6% 16.4%
EU 15 1985 6.5% 3.5% 0.4% 1.7% 0.9% 8.4% 56.2%1995 10.4% 4.1% 1.7% 3.0% 1.6% 8.1% 61.5%2003 11.4% 3.1% 4.1% 2.5% 1.8% 7.2% 58.5%2006 12.2% 2.4% 5.7% 2.5% 1.5% 6.4% 53.9%2009 13.0% 2.1% 7.1% 2.3% 1.5% 6.6% 53.1%
Source: Compiled from UN Comtrade data base Author's calculation

31
Table 1.b The Geographic Pattern of East Asian Exports: 1985, 1995, 2003, 2006, 2009
East Asia Japan China NIEs ASEAN4N. America EU15East Asia 1985 42.4% 16.9% 4.7% 15.1% 5.7% 29.4% 11.4%
1995 51.0% 12.9% 8.7% 20.9% 8.4% 21.1% 13.9%2003 51.6% 10.6% 12.6% 20.1% 8.3% 19.4% 14.2%2006 49.6% 8.9% 13.1% 19.7% 7.9% 17.9% 14.2%2009 47.4% 7.6% 13.5% 18.6% 7.8% 14.8% 13.4%
Japan 1985 24.1% 7.1% 12.8% 4.2% 40.2% 13.2%1995 42.0% 5.0% 25.0% 12.1% 28.9% 15.9%2003 44.9% 12.2% 23.5% 9.2% 26.5% 15.3%2006 45.7% 14.3% 23.2% 8.1% 24.3% 13.6%2009 51.5% 18.9% 23.5% 9.1% 17.7% 11.4%
Korea 1985 25.8% 15.0% 0.0% 7.4% 3.4% 39.7% 11.7%1995 44.8% 13.7% 7.5% 15.9% 7.7% 21.3% 13.3%2003 47.2% 8.9% 18.1% 13.6% 6.6% 19.2% 12.9%2006 47.8% 8.2% 21.3% 12.7% 5.6% 14.8% 12.5%2009 46.9% 6.0% 23.8% 11.8% 5.3% 11.3% 9.1%
Taiwan 1985 26.4% 11.3% 0.0% 12.0% 3.1% 51.4% 9.4%1995 50.2% 11.8% 0.3% 29.6% 8.5% 25.0% 13.1%2003 59.7% 8.6% 15.9% 28.3% 6.8% 19.4% 13.1%2006 64.9% 7.6% 24.3% 25.2% 7.7% 16.0% 10.4%2009 63.7% 7.1% 26.6% 22.3% 7.6% 12.3% 9.5%
Hong Kong 1985 40.8% 4.2% 26.0% 7.0% 3.6% 33.2% 13.6%1995 50.1% 6.1% 33.3% 7.1% 3.6% 23.3% 15.0%2003 57.4% 5.3% 41.7% 7.0% 3.4% 19.5% 13.7%2006 60.6% 4.8% 46.3% 6.2% 3.2% 15.9% 13.7%2009 63.2% 4.3% 49.8% 5.9% 3.2% 12.1% 12.8%
Singapore 1985 40.7% 9.4% 1.5% 9.3% 20.6% 21.9% 11.0%1995 52.0% 7.8% 2.3% 15.4% 26.5% 18.8% 13.4%2003 59.5% 6.1% 6.3% 17.1% 30.0% 13.1% 12.1%2006 60.2% 5.5% 9.7% 16.7% 28.2% 10.5% 10.6%2009 60.5% 4.5% 9.7% 19.5% 26.7% 7.5% 8.7%
China 1985 58.6% 22.2% 33.7% 2.7% 9.4% 9.2%1995 55.9% 19.1% 33.1% 3.7% 17.7% 12.9%2003 43.6% 13.6% 26.1% 4.0% 22.4% 16.5%2006 38.6% 9.5% 25.2% 4.0% 22.7% 17.5%2009 35.4% 8.2% 22.5% 4.7% 19.9% 17.5%
Thailand 1985 39.0% 13.4% 3.8% 15.4% 6.3% 20.9% 19.8%1995 47.7% 16.8% 2.9% 23.0% 4.9% 18.9% 15.1%2003 48.9% 14.2% 7.1% 17.9% 9.7% 18.2% 14.7%2006 47.9% 12.7% 9.0% 16.6% 9.6% 16.0% 13.0%2009 45.6% 10.3% 10.6% 14.6% 10.1% 11.8% 10.6%
Malaysia 1985 60.2% 23.8% 1.1% 29.1% 6.3% 13.7% 14.9%1995 53.1% 12.7% 2.7% 31.6% 6.2% 21.5% 14.2%2003 53.7% 10.7% 6.5% 28.7% 7.8% 20.2% 12.1%2006 52.0% 8.9% 7.2% 26.7% 9.2% 19.4% 12.1%2009 57.4% 9.8% 12.2% 25.6% 9.8% 11.5% 10.3%
Philippines 1985 39.6% 18.9% 1.6% 12.9% 6.1% 37.5% 16.2%1995 40.5% 15.9% 1.2% 16.2% 7.2% 37.4% 16.9%2003 57.7% 22.3% 6.2% 21.5% 7.7% 12.7% 13.1%2006 58.9% 21.6% 8.3% 20.9% 8.2% 11.7% 11.5%2009 56.8% 15.9% 9.8% 20.4% 10.6% 9.7% 11.0%
Indonesia 1985 64.7% 46.2% 0.5% 16.1% 1.9% 22.0% 6.4%1995 58.1% 27.1% 3.8% 22.2% 5.0% 14.7% 14.9%2003 58.4% 15.9% 5.9% 25.5% 11.0% 21.0% 16.3%2006 58.0% 16.7% 9.8% 22.4% 9.1% 18.9% 18.0%2009 54.5% 16.2% 7.6% 23.0% 7.7% 18.3% 20.3%
N. America 1985 17.9% 8.8% 1.6% 5.9% 1.6% 37.9% 18.9%1995 24.8% 9.5% 1.9% 10.2% 3.3% 35.9% 17.5%2003 19.4% 5.8% 3.2% 7.6% 2.9% 40.5% 16.6%2006 18.8% 4.8% 4.3% 7.3% 2.3% 38.4% 16.3%2009 19.5% 4.3% 5.8% 7.2% 2.2% 32.1% 17.4%
EU 15 1985 4.2% 1.2% 0.8% 1.5% 0.7% 10.8% 57.8%1995 7.8% 2.1% 1.0% 3.2% 1.6% 7.3% 61.8%2003 6.2% 1.6% 1.6% 2.2% 0.9% 9.7% 60.9%2006 6.2% 1.3% 1.9% 2.1% 0.8% 9.0% 59.1%2009 7.2% 1.2% 2.7% 2.4% 0.9% 7.7% 57.0%
Source: Compiled from UN Comtrade data base Author's calculation

32
Table 2Average growth rate of total manufactured goods, intermediate goods and final goods, 1998-2009
Intermediate Final Intermediate FinalTotal Goods Goods Total Goods Goods
Eight Asian Nations 9.9% 10.8% 8.4% 9.9% 10.4% 9.5%Japan 6.0% 7.3% 4.7% 4.4% 5.5% 2.6%China 18.3% 17.8% 19.5% 19.9% 21.7% 18.9%Hong Kong 6.2% 8.1% 4.0% 6.3% 9.4% 3.3%Indonesia 15.1% 15.3% 15.3% 7.6% 10.5% 8.4%Malaysia 7.2% 7.1% 7.8% 7.3% 7.9% 6.0%Philippines 2.7% 2.4% 4.7% 2.8% 2.0% 5.0%Rep. of Korea 12.6% 11.5% 16.1% 10.0% 9.5% 10.9%Singapore 7.4% 8.0% 5.4% 8.6% 10.6% 2.8%Thailand 10.7% 11.2% 10.7% 9.9% 11.0% 9.5%
EU15 7.0% 6.4% 6.9% 6.9% 6.6% 6.6%North America 4.3% 3.5% 5.0% 3.6% 3.2% 3.1%World 7.4% 7.4% 7.0% 7.5% 7.4% 7.2%
Source: Compiled from UN Comtrade database Author's calculation
Imports Exports

33
Table 3Trade partner by stage of production
Imports China China, Hong Kong
SAR
Indonesia Japan Malaysia Philippines Rep. of Korea
Singapore Thailand Asia North America
European Union 15
World
1998 FC 4.4% 32.9% 6.1% 28.3% 6.2% 8.6% 5.0% 12.7% 8.3% 18.3% 29.5% 27.4% 24.8%FCA 19.4% 15.6% 21.5% 12.7% 18.2% 10.4% 12.0% 21.0% 17.3% 15.8% 18.1% 16.1% 17.0%IMPC 21.8% 19.2% 16.3% 13.2% 46.1% 46.7% 24.3% 39.7% 26.7% 23.3% 21.1% 17.6% 18.9%IMSF 44.5% 28.6% 37.5% 23.6% 21.7% 24.7% 33.0% 16.4% 34.6% 28.6% 20.1% 27.7% 27.1%P 8.2% 2.1% 12.6% 19.1% 3.7% 9.5% 22.7% 6.0% 11.2% 11.4% 6.4% 7.7% 8.3%
2002 FC 4.5% 29.6% 6.6% 27.7% 7.6% 6.9% 9.8% 11.9% 7.6% 16.1% 32.1% 28.8% 25.3%FCA 21.0% 16.0% 14.0% 12.3% 15.0% 7.0% 14.5% 17.2% 17.5% 15.8% 17.4% 14.9% 16.1%IMPC 27.4% 26.9% 13.8% 14.4% 47.0% 55.5% 22.7% 41.4% 27.1% 26.4% 17.4% 16.5% 18.5%IMSF 34.7% 24.2% 35.6% 22.5% 20.8% 19.4% 29.5% 14.7% 31.6% 26.2% 19.0% 25.7% 25.3%P 10.6% 2.0% 19.5% 19.3% 4.7% 9.5% 20.2% 7.0% 14.3% 12.3% 8.7% 9.1% 10.0%
2006 FC 4.2% 21.6% 6.5% 20.8% 7.5% 7.7% 8.3% 9.0% 7.7% 11.4% 27.9% 25.8% 21.5%FCA 19.2% 16.1% 14.6% 11.0% 14.4% 6.6% 14.6% 14.6% 14.3% 15.2% 16.4% 14.2% 15.5%IMPC 30.5% 36.2% 10.5% 13.7% 41.4% 48.4% 17.6% 40.7% 22.9% 27.0% 15.1% 14.5% 17.3%IMSF 26.0% 21.5% 31.3% 23.5% 22.9% 19.6% 30.3% 14.3% 32.0% 24.4% 20.3% 26.1% 25.2%P 17.9% 2.1% 19.2% 26.8% 7.6% 13.2% 26.1% 9.3% 20.3% 17.6% 14.0% 12.1% 13.5%
2009 FC 5.3% 22.6% 7.8% 24.2% 9.7% 14.0% 8.7% 11.1% 9.2% 12.5%30.0% 29.7% 23.5%FCA 17.1% 17.0% 23.1% 10.4% 15.9% 7.7% 13.8% 16.2% 14.4% 15.2% 18.0% 13.1% 15.4%IMPC 27.7% 39.0% 17.5% 12.4% 37.7% 40.4% 18.7% 41.1% 23.5% 26.2% 14.7% 14.0% 17.1%IMSF 26.2% 19.0% 36.1% 24.4% 26.6% 23.0% 32.3% 17.0% 32.9% 25.5% 19.3% 25.9% 25.6%P 23.5% 2.3% 15.2% 26.7% 9.4% 14.9% 26.4% 11.0% 19.8% 19.7% 14.5% 12.2% 14.3%
Exports China China, Hong Kong
SAR
Indonesia Japan Malaysia Philippines Rep. of Korea
Singapore Thailand Asia North America
European Union 15
World
1998 FC 47.9% 42.6% 20.5% 20.0% 14.0% 17.7% 19.2% 10.9% 37.4%27.0% 16.6% 27.2% 24.9%FCA 15.0% 12.3% 4.1% 27.4% 18.5% 12.2% 20.2% 28.4% 13.0% 20.1% 21.3% 19.2% 17.9%IMPC 9.8% 17.6% 4.7% 29.6% 36.5% 59.6% 22.0% 37.4% 24.8% 24.6% 26.3% 17.9% 19.4%IMSF 22.9% 24.9% 36.3% 19.4% 23.9% 9.0% 34.5% 13.9% 18.8% 22.6% 24.1% 28.3% 26.5%P 3.8% 1.5% 17.5% 0.4% 5.3% 1.5% 0.8% 0.8% 4.0% 2.3% 6.8% 3.1% 7.0%
2002 FC 40.2% 35.9% 20.8% 22.4% 12.7% 14.8% 19.4% 8.5% 33.1% 26.3% 17.6% 29.2% 25.1%FCA 20.0% 14.7% 8.2% 23.0% 18.8% 17.0% 26.2% 22.0% 14.9% 20.1% 18.9% 18.3% 16.7%IMPC 15.6% 25.5% 8.7% 29.6% 38.2% 59.3% 24.3% 42.8% 23.3% 26.7% 25.7% 17.1% 19.0%IMSF 20.3% 22.2% 40.4% 20.2% 22.2% 6.5% 25.9% 15.1% 19.9% 21.3% 24.4% 27.0% 24.8%P 2.9% 1.4% 19.5% 0.4% 5.1% 1.4% 0.3% 0.7% 4.5% 2.4% 7.5% 3.4% 8.9%
2006 FC 31.1% 26.5% 17.1% 20.6% 10.6% 13.2% 14.8% 7.7% 27.2% 22.4% 16.6% 26.8% 22.1%FCA 26.8% 14.9% 5.8% 22.1% 20.4% 15.6% 27.6% 14.4% 17.9% 21.8% 18.9% 18.2% 16.6%IMPC 17.4% 36.4% 7.1% 28.5% 30.9% 53.7% 25.9% 44.4% 21.3% 26.4% 22.1% 16.3% 17.6%IMSF 22.2% 20.3% 41.8% 22.5% 25.3% 12.6% 25.1% 16.1% 22.6% 22.5% 26.1% 28.1% 25.7%P 1.4% 1.6% 25.5% 0.9% 8.4% 2.5% 0.5% 0.7% 6.6% 2.6% 10.2% 4.2%11.3%
2009 FC 30.4% 23.4% 17.3% 16.7% 12.8% 13.4% 11.5% 10.3% 30.2%22.0% 17.9% 29.7% 23.7%FCA 30.2% 17.1% 6.3% 20.9% 15.4% 23.6% 34.5% 13.8% 17.6% 24.1% 15.7% 16.4% 16.4%IMPC 17.8% 38.8% 6.3% 29.2% 31.5% 46.6% 26.0% 48.8% 19.6% 26.0% 17.4% 15.8% 16.8%IMSF 20.3% 19.1% 40.0% 26.0% 32.6% 12.8% 27.4% 18.6% 27.7% 23.5% 27.0% 28.1% 26.0%P 1.0% 1.5% 30.1% 1.2% 7.3% 3.5% 0.5% 0.6% 4.9% 2.6% 12.5% 3.7%12.1%
Source: Compiled from UN Comtrade database Author's calculation

34
Table 4Inward FDI and the share in World Inward FDI, 1985-2009
US$ million 1985 1990 1995 2000 2001 2002 2003 2004 2005 2006 2007 2008 2009
Japan 642.0 1,753.0 41.5 8,322.7 6,241.3 9,239.3 6,324.3 7,815.7 2,775.0 -6,506 22,550 24,426 11,939
Republic of Korea 218.0 759.0 1,250.0 8,591.0 3,692.0 2,975.0 3,785.0 7,687.0 7,198.0 4,950 2,628 8,409 5,844
Taiwan Province of China 342.0 1,330.0 1,559.0 4,928.0 4,109.0 1,445.0 453.0 1,898.0 1,625.0 7,424 7,769 5,432 2,803
Hong Kong, China -267.2 3,275.1 6,213.4 61,924.1 23,776.5 9,681.9 13,623.6 34,034.7 35,897.0 42,892 54,341 59,621 48,449
China 1,956.0 3,487.1 37,520.5 40,714.8 46,877.6 52,742.953,505.0 60,630.0 72,406.0 69,468 83,521 108,312 95,000
Singapore 1,046.8 5,574.7 11,591.3 16,484.5 14,121.6 5,821.5 9,330.8 16,059.8 20,083.0 24,207 35,778 10,912 16,809
Thailand 160.0 2,575.0 2,070.0 3,350.0 3,886.0 947.0 1,952.0 5,862.0 8,957.0 9,751 11,355 8,544 5,949
Malysia 694.7 2,611.0 5,815.0 3,787.6 553.9 3,203.4 2,473.2 4,624.0 3,965.0 6,060 8,538 7,318 1,381
Phillipines 12.0 550.0 1,459.0 1,345.0 899.0 1,792.0 347.0 688.0 1,854.0 2,345 2,916 1,544 1,948
Indonesia 310.0 1,092.0 4,346.0 -4,550.0 -2,978.4 145.0 -596.9 1,023.0 5,260.0 5,556 6,928 9,318 4,877
E. Asia 4,472.2 21,253.9 71,824.2 136,575.0 94,937.2 78,753.7 84,872.6 132,506.5 157,245.0 172,653.0 213,774.0 219,410.0 183,060.0
ASEAN 5 2,223.5 12,402.7 25,281.3 20,417.1 16,482.1 11,908.9 13,506.0 28,256.8 40,119.0 47,919.0 65,515.0 37,636.0 30,964.0
N. America 21,862.0 21,862.0 21,862.0 21,862.0 21,862.0 21,862.0 21,862.0 21,862.0 21,862.0 135,462 374,371 379,830 148,540
EU15 15,965.0 89,459.0 116,324.0 674,278.0 362,418.0 283,863.0 240,572.0 185,227.0 387,858.0 492,090 778,602 414,979 333,932
World 57,959.0 201,614.0 340,336.0 1,409,568.0 832,248.0617,732.0 557,869.0 710,755.0 916,277.0 1,305,852 2,099,973 1,770,873 1,113,189
% 1985 1990 1995 2000 2001 2002 2003 2004 2005 2006 2007 2008 2009
Japan 1.1% 0.9% 0.0% 0.6% 0.7% 1.5% 1.1% 1.1% 0.3% -0.5% 1.1% 1.4% 1.1%
Republic of Korea 0.4% 0.4% 0.4% 0.6% 0.4% 0.5% 0.7% 1.1% 0.8% 0.4% 0.1% 0.5% 0.5%
Taiwan Province of China 0.6% 0.7% 0.5% 0.3% 0.5% 0.2% 0.1% 0.3% 0.2% 0.6% 0.4% 0.3% 0.3%
Hong Kong, China -0.5% 1.6% 1.8% 4.4% 2.9% 1.6% 2.4% 4.8% 3.9% 3.3% 2.6% 3.4% 4.4%
China 3.4% 1.7% 11.0% 2.9% 5.6% 8.5% 9.6% 8.5% 7.9% 5.3% 4.0% 6.1% 8.5%
Singapore 1.8% 2.8% 3.4% 1.2% 1.7% 0.9% 1.7% 2.3% 2.2% 1.9% 1.7% 0.6% 1.5%
Thailand 0.3% 1.3% 0.6% 0.2% 0.5% 0.2% 0.3% 0.8% 1.0% 0.7% 0.5% 0.5% 0.5%
Malysia 1.2% 1.3% 1.7% 0.3% 0.1% 0.5% 0.4% 0.7% 0.4% 0.5% 0.4% 0.4% 0.1%
Phillipines 0.0% 0.3% 0.4% 0.1% 0.1% 0.3% 0.1% 0.1% 0.2% 0.2% 0.1% 0.1% 0.2%
Indonesia 0.5% 0.5% 1.3% -0.3% -0.4% 0.0% -0.1% 0.1% 0.6% 0.4% 0.3% 0.5% 0.4%
E. Asia 7.7% 10.5% 21.1% 9.7% 11.4% 12.7% 15.2% 18.6% 17.2% 13.2% 10.2% 12.4% 16.4%
ASEAN 5 3.8% 6.2% 7.4% 1.4% 2.0% 1.9% 2.4% 4.0% 4.4% 3.7% 3.1% 2.1% 2.8%
N. America 37.7% 10.8% 6.4% 1.6% 2.6% 3.5% 3.9% 3.1% 2.4% 10.4% 17.8% 21.4% 13.3%
EU15 27.5% 44.4% 34.2% 47.8% 43.5% 46.0% 43.1% 26.1% 42.3% 37.7% 37.1% 23.4% 30.0%
Source: World Investment Report, various yearsNote: East Asia excludes Japan

35
Table5: Regression results
Explanatory Variables
Export
Japan Germany France GDP, reporter GDP, partner DIST DB FDIHAT
PC Coefficient
0.671*** (0.062)
0.726*** (0.057)
-1.174***
(0.210)
-0.141 (0.382)
0.666*** (0.106)
CA Coefficient
0.728*** (0.063)
0.691*** (0.058)
-0.935***
(0.187)
0.291 (0.339)
1.129*** (0.119)
PC Coefficient
0.487*** (0.074)
0.770*** (0.055)
-1.137***
(0.204)
-0.100 (0.371)
0.422*** (0.058)
CA Coefficient
0.686*** (0.077)
0.781*** (0.057)
-0.988***
(0.187)
0.240 (0.338)
0.405*** (0.067)
PC Coefficient
0.470*** (0.065)
0.654*** (0.055)
-1.055***
(0.195)
-0.007 (0.355)
0.471*** (0.049)
CA Coefficient
0.647*** (0.070)
0.683*** (0.058)
-0.903***
(0.185)
0.347 (0.344)
0.481*** (0.057)
LM # of obs.
1% 643
1% 643
1% 643
1% 643
1% 643
1% 643
Explanatory
Variables
Import
Japan Germany France GDP, reporter GDP, partner DIST DB FDIHAT
PC
0.593*** (0.066)
0.858*** (0.060)
-1.059***
(0.239)
-0.195 (0.435)
0.668*** (0.107)
CA
0.671*** (0.064)
0.805*** (0.059)
-0.797 (0.194)
0.201
(0.352)
0.880*** (0.121)
PC
0.328*** (0.075)
0.896*** (0.055)
-0.987***
(0.214)
-0.125 (0.389)
0.449*** (0.058)
CA
0.450*** (0.076)
0.854*** (0.056)
-0.754***
(0.186)
0.245 (0.336)
0.539*** (0.066)
PC
0.428*** (0.069)
0.810*** (0.581)
-0.967***
(0.223)
-0.091 (0.405)
0.416*** (0.049)
CA
0.597*** (0.071)
0.802*** (0.059)
-0.769***
(0.192)
0.248 (0.346)
0.381*** (0.057)
LM # of obs.
1% 643
1% 643
1% 643
1% 643
1% 643
1% 643

36