the impact of transitional kindergarten on california ... · kindergarten on california students...
TRANSCRIPT

JUNE 2017
The Impact of Transitional Kindergarten on California Students Final Report From the Study of California’s Transitional Kindergarten Program Karen Manship Aleksandra Holod Heather Quick Burhan Ogut Iliana Brodziak de los Reyes Jennifer Anthony Jodi Jacobson Chernoff Alison Hauser Alejandra Martin Shannon Keuter Emily Vontsolos Elena Rein Emily Anderson


1715_06/17
The Impact of Transitional Kindergarten on California Students Final Report From the Study of California’s Transitional Kindergarten Program
June 2017
Karen Manship Aleksandra Holod Heather Quick Burhan Ogut Iliana Brodziak de los Reyes Jennifer Anthony Jodi Jacobson Chernoff Alison Hauser Alejandra Martin Shannon Keuter Emily Vontsolos Elena Rein Emily Anderson
2800 Campus Drive, Suite 200 San Mateo, CA 94403 202.403.5000
www.air.org
Copyright © 2017 American Institutes for Research. All rights reserved.


Contents Page
Executive Summary ........................................................................................................................ ii
Chapter 1. Introduction ................................................................................................................... 1
The Transitional Kindergarten Program in California ................................................................ 1
Previous Study Findings on the Impacts of TK .......................................................................... 1
Purpose of this Report ................................................................................................................. 2
Overview of Methodology and Data Sources ............................................................................. 2
Data Sources ............................................................................................................................... 5
Chapter 2. Impact of TK on Kindergarten Readiness ..................................................................... 9
Kindergarten Academic Skills .................................................................................................... 9
Executive Function and Social Skills ....................................................................................... 12
The Impact of TK for Student Subgroups ................................................................................ 14
Summary ................................................................................................................................... 16
Chapter 3. Persistence of the TK Advantage Through Kindergarten ........................................... 17
Academic Skills at the End of Kindergarten ............................................................................ 17
Executive Function and Social Skills at the End of Kindergarten ............................................ 21
Kindergarten Attendance Rates ................................................................................................ 22
The Impact of TK for Student Subgroups at the End of Kindergarten ..................................... 23
Kindergarten Characteristics that Support Continued Growth for Students in Kindergarten ............................................................................................................................. 24
Summary ................................................................................................................................... 25
Chapter 4. Characteristics and Quality of TK Classrooms ........................................................... 26
Structural Features That Vary Across TK Programs ................................................................ 26
Instructional Practice in TK Classrooms .................................................................................. 30
Quality Features That Are Consistent Across TK Programs .................................................... 36
Summary ................................................................................................................................... 39
Chapter 5. Impact of TK on English Learner Students ................................................................. 41
The Impact of TK on the Literacy and Mathematics Skills of EL Students ................................. 41
The Impact of TK on English Language Skills ........................................................................ 43
Impact of TK for Specific Language Groups ........................................................................... 44
Summary ................................................................................................................................... 46
Chapter 6. Conclusions and Policy Implications .......................................................................... 48
Next Steps and Recommendations ........................................................................................... 49
References ..................................................................................................................................... 51
Appendix A. Sample Selection and Recruitment ....................................................................... A-1
Appendix B. Data Collection Instruments .................................................................................. B-1
Appendix C. Data Collection Procedures ................................................................................... C-1
Appendix D. Data Analysis Procedures...................................................................................... D-1
Appendix E. Results of RD Analyses for the Main Effect of TK ................................................ E-1
Appendix F. Results of Demographic Subgroup Analyses ......................................................... F-1
Appendix G. Results of Subgroup Analyses by TK Classroom Characteristics ........................ G-1
Appendix H. Results of Analyses Examining Kindergarten Classroom Characteristics ............ H-1
Appendix I. TK for Migrant and Special Education Students ...................................................... I-1
Appendix J. Wraparound Services Provided Through Transitional Kindergarten Programs ...... J-1
Exhibits Page
Exhibit ES-1. Mean Scores for TK and Comparison Students on Letter and Word Identification ................................................................................................................................... iii Exhibit ES-2. Mean Scores for TK and Comparison Students on Applied Problems ................... iii Exhibit ES-3. Mean Scores for TK and Comparison Students on Teacher Ratings of Social-Emotional Skills ................................................................................................................. iv
Exhibit ES-4. Adjusted Mean Scores for TK EL Students and Comparison Students on Overall English Language Skills .................................................................................................... v
Exhibit ES-5. Adjusted Mean Score Growth on Letter and Word Identification from Fall to Spring of Kindergarten .............................................................................................................. vi Exhibit 1. The Regression Discontinuity Approach ....................................................................... 3
Exhibit 2. Demographic Characteristics of Students in the TK and Comparison Samples ............ 4
Exhibit 3. Prior Preschool Experience of Students in the TK and Comparison Samples ............... 5
Exhibit 4. Directly Assessed Measures of Student Outcomes ........................................................ 6
Exhibit 5. Social-Emotional Skills Indirectly Assessed Through Teacher Ratings ........................ 7

Exhibit 6. Adjusted Mean Scores for TK and Comparison Students on Letter and Word Identification ................................................................................................................................... 9
Exhibit 7. Adjusted Mean Scores for TK and Comparison Students on Phonological Awareness ..................................................................................................................................... 10
Exhibit 8. Adjusted Mean Scores for TK and Comparison Students on Expressive Vocabulary .................................................................................................................................... 10
Exhibit 9. Adjusted Mean Scores for TK and Comparison Students on Applied Problems ........ 11
Exhibit 10. Adjusted Mean Scores for TK and Comparison Students on Quantitative Concepts ........................................................................................................................................ 11
Exhibit 11. Summary of Effect Sizes on Academic Skills at Kindergarten Entry ....................... 12
Exhibit 12. Adjusted Mean Scores for TK and Comparison Students on Executive Function ........................................................................................................................................ 13
Exhibit 13. Adjusted Mean Scores for TK and Comparison Students on Teacher Ratings of Social-Emotional Skills ............................................................................................................ 14
Exhibit 14. Summary of Effect Sizes of TK for Demographic Subgroups, Fall Academic Outcomes ...................................................................................................................................... 15
Exhibit 15. Summary of Effect Sizes of TK for Demographic Subgroups, Fall Executive Function and Social-Emotional Outcomes ................................................................................... 16
Exhibit 16. Adjusted Mean Score Growth on Letter and Word Identification from Fall to Spring of Kindergarten ................................................................................................................. 18
Exhibit 17. Adjusted Mean Score Growth on Expressive Vocabulary from Fall to Spring of Kindergarten ............................................................................................................................. 18
Exhibit 18. Adjusted Mean Score Growth on Phonological Awareness from Fall to Spring of Kindergarten ................................................................................................................. 19
Exhibit 19. Adjusted Mean Score Growth on Applied Problems from Fall to Spring of Kindergarten ................................................................................................................................. 19
Exhibit 20. Adjusted Mean Score Growth on Quantitative Concepts from Fall to Spring of Kindergarten ............................................................................................................................. 20
Exhibit 21. Summary of Effect Sizes on Academic Skills, End of Kindergarten ........................ 20
Exhibit 22. Growth of the TK and Comparison Groups From Fall to Spring of Kindergarten, by Assessment, in Months of Learning ................................................................. 21
Exhibit 23. Summary of Effect Sizes on Executive Function and Social Skills at the End of Kindergarten .................................................................................................................................. 22
Exhibit 24. Kindergarten Attendance Rates for TK and Comparison Students, 2015–16 ........... 22
Exhibit 25. Summary of Effect Sizes of TK for Demographic Subgroups, Selected Spring Outcomes ....................................................................................................................................... 23
Exhibit 26. Percentage of TK Classrooms That Were Full Day or Half Day, 2014–15 ............... 27
Exhibit 27. Birth Dates of Children Included in Kindergarten and TK, Before and After TK Implementation ....................................................................................................................... 28
Exhibit 28. Percentage of TK Classrooms That Were Standalone or Combined With Kindergarten, 2014–15 ................................................................................................................. 29
Exhibit 29. Scores of TK Classrooms on CLASS Domains, 2014–15 ......................................... 31
Exhibit 30. Percentage of Time Teachers Engage in Scaffolding or Didactic Instruction, 2014–15......................................................................................................................................... 32
Exhibit 31. Percentage of Class Time Spent in Different Grouping Arrangements, by Type of TK Classroom, 2014-15 .................................................................................................. 33
Exhibit 32. Percentage of TK Teachers Reporting Their Students Spend Time on Different Developmentally Appropriate Activities at Least Daily, by Type of TK Classroom, 2014–15 ..................................................................................................................... 34
Exhibit 33. Percentage of TK Teachers Reporting They Strongly Agree With Statements About Their Use of Differentiated Instruction for Their Students, by Type of TK Classroom, 2014–15 ..................................................................................................................... 35
Exhibit 34. Content of Instruction, by Type of TK Classroom, 2014–15 .................................... 36
Exhibit 35. Percentage of TK Teachers With Various Qualifications, 2014–15 .......................... 38
Exhibit 36. Adjusted Mean Scores for TK EL Students and Non-TK EL Students on Language and Literacy Assessments ............................................................................................ 41
Exhibit 37. Adjusted Mean Scores for TK EL Students and Non-TK EL Students on Mathematics Assessments ............................................................................................................ 42
Exhibit 38. Effect size of Impact of TK, Including English and Spanish Assessments ............... 43
Exhibit 39. Adjusted Mean Scores for TK EL Students and Comparison Students on Overall English Language Skills (CELDT) .................................................................................. 43
Exhibit 40. Adjusted Mean Scores for Spanish-Speaking TK EL Students and Non-TK EL Students on English Language Skills (CELDT) ..................................................................... 44
Exhibit 41. Asian Language Regions............................................................................................ 45
Exhibit 42. Adjusted Mean Scores for Asian Language-Speaking TK EL Students and Non-TK EL Students on English Language Skills (CELDT) ....................................................... 46
Exhibit A1. Characteristics of TK Study Districts Compared With All Districts in California ................................................................................................................................... A–1
Exhibit A2. Number of Students Recruited and Participating in the Study ............................... A–2
Exhibit A3. Characteristics of the TK Study Sample Compared to the California Kindergarten Population (Where Available), by Cohort ........................................................... A–3
Exhibit A4. Demographic Characteristics of Students in the TK and Comparison Samples .... A–4
Exhibit A5. Prior Preschool Experience of Students in the TK and Comparison Samples ....... A–4
Exhibit A6. Characteristics of TK Teachers Who Completed Surveys ..................................... A–5
Exhibit A7. Characteristics of Kindergarten and First-Grade Teachers Who Completed Surveys ....................................................................................................................................... A–6
Exhibit A8. Demographic Characteristics of Students in CELDT Extant Data, by TK Eligibility Status .......................................................................................................................... A–9
Exhibit B1. Measures and Psychometric Properties of Student Outcomes ................................ B–3
Exhibit B2. CLASS Domains and Dimensions .......................................................................... B–5
Exhibit C1. Number of Students Assessed in Each Data Collection Round .............................. C–1
Exhibit C2. Language of Primary Assessment for Spanish Speakers, by Cohort and Wave ..... C–2
Exhibit C3. Summary of Assessor Type for Each Field Period ................................................. C–3
Exhibit C4. 2014 and 2015 TK and TK/K Combination Teacher Survey Response Rates........ C–5
Exhibit C5. Kindergarten and First-Grade Teacher Survey Response Rates, by Survey Type and Data Collection Wave ................................................................................................. C–6
Exhibit D1. Demographic Characteristics of Students in the TK and Comparison Samples .... D–1
Exhibit D2. Compliance by Treatment Assignment .................................................................. D–3
Exhibit D3. TK Participation Rates by Age ............................................................................... D–3
Exhibit D4. The Impact (Effect Size) of Transitional Kindergarten on Fall Student Outcomes by Model Type .......................................................................................................... D–7
Exhibit D5. The Impact (Effect Size) of Transitional Kindergarten on Fall Student Outcomes by Bandwidth ............................................................................................................ D–8
Exhibit D6. The Impact (Effect Size) of Transitional Kindergarten on Fall Student Outcomes by Functional Form for Age ..................................................................................... D–8
Exhibit D7. The Impact (Effect Size) of Transitional Kindergarten on Overall English Language Skills (CELDT) by Bandwidth................................................................................ D–10
Exhibit D8. The Impact (Effect Size) of Transitional Kindergarten on Overall English Language Skills (CELDT) by Functional Form for Age ......................................................... D–10
Exhibit E1. The Impact of TK on Academic and Social Skills, Fall and Spring of Kindergarten ............................................................................................................................... E–1
Exhibit E2. The Impact of TK on Overall English Language Skills (CELDT) of Kindergarten ............................................................................................................................... E–1
Exhibit F1. Regression Discontinuity Estimates of the Effect of TK on Students in the Fall of Kindergarten, by Demographic Subgroup ....................................................................... F–2
Exhibit F2. Regression Discontinuity Estimates of the Effect of TK on Students in the Spring of Kindergarten, by Demographic Subgroup .................................................................. F–3
Exhibit F3. Regression Discontinuity Estimates of the Effect of TK for Students Who Did Not Attend PreK at Age 3, Fall Kindergarten............................................................................. F–4
Exhibit F4. Regression Discontinuity Estimates of the Effect of TK on Overall English Language Skills (CELDT), by Home Language Subgroup ........................................................ F–5
Exhibit G1. Items and Factor Loadings for Developmentally Appropriate Practice Scale ....... G–2
Exhibit G2. Items and Factor Loadings for the Balanced Curriculum Scale ............................. G–2
Exhibit G3. Items and Factor Loadings for Differentiated Instruction Measure ....................... G–2
Exhibit G4. Regression Discontinuity Estimates of the Effect of TK on Students in the Fall of Kindergarten, by TK Classroom Structure ..................................................................... G–3
Exhibit G5. Regression Discontinuity Estimates of the Effect of TK on Students in the Fall of Kindergarten, by TK Classroom Quality as Measured by the Classroom Assessment Scoring System (CLASS) Tool .............................................................................. G–4
Exhibit G6. Regression Discontinuity Estimates of the Effect of TK on Students in the Fall of Kindergarten, by TK Teacher Practices ......................................................................... G–5
Exhibit H1. Multilevel Regression Estimates of the Association Between Kindergarten Classroom Characteristics and Student Learning (n = 461 to 1,907) ........................................ H–2 Exhibit J1. Percentage of Study Districts Reporting They Provide Various Wraparound Services for TK Students…………………………………………………………………………………J–1

Acknowledgments The authors would like to thank Dr. Kimberly Brenneman from the Heising-Simons Foundation; Dr. Bernadette Sangalang, Dr. Meera Mani, and Dr. Jeff Sunshine from the David and Lucile Packard Foundation; and Dr. David Dodds from First 5 California for their support of this study and their substantive input on the implementation of the study and interpretation of findings. We also are grateful for the advice and support of our Technical Advisory Group—Dr. Margaret Burchinal (University of North Carolina), Dr. Megan Franke (University of California at Los Angeles), Dr. Eugene Garcia (Arizona State University), Dr. Timothy Shanahan (University of Illinois at Chicago), and Dr. Ross Thompson (University of California at Davis)—whose questions, suggestions, and feedback helped to strengthen the clarity of the findings presented here.
We could not have completed the study without the support of the entire research team, who in addition to the report authors include Jarah Blum, Connie Chandra, Linda Choi, Connie Conroy, Marie Dalldorf, Mark Garibaldi, Raquel Gonzalez, and Matthew Keuter from AIR; our reviewers Johannes Bos and Susan Muenchow; Linda Kuhn, Julie Berry, Lyn Bopp, Ashley Bronzan, Celina Montorfano, Daniel Mackin, Aimee Elsey, Chelsey Bunyer, and 73 data collectors, from Survey Research Management (SRM); and Matt and Meg Lambert from Tab Service Company.
We are also grateful for the support of Sharon Ritchie and Billie Weiser from the University of North Carolina who assisted us in selecting the Snapshot tool and training and certifying Snapshot observers, and to the California Department of Education who provided statewide English proficiency data for the study.
Finally, we are most grateful to the districts, schools, and families who participated in and supported this study.
Any errors remaining in the report are the sole responsibility of the authors.
American Institutes for Research The Impact of Transitional Kindergarten in California—ii
Executive Summary California’s Kindergarten Readiness Act of 2010 revised the cutoff date by which children must turn five for kindergarten entry in that year. The act established September 1 as the new kindergarten eligibility date—three months earlier than the previous date of December 2. The Kindergarten Readiness Act also established transitional kindergarten (TK), defined as the first year of a two-year kindergarten program, for all students affected by the birthdate eligibility change. Instead of enrolling in regular kindergarten, students who reach age five between September 2 and December 2 now receive an “age and developmentally appropriate” experience in TK prior to entering kindergarten the following year (California Department of Education, 2016; Governor’s State Advisory Council on Early Learning and Care, 2013).
To determine whether California’s TK program is effective at improving school readiness and learning outcomes for students, American Institutes for Research (AIR) conducted an evaluation of TK as it was implemented during the 2013–14 and 2014–15 school years. This study uses a rigorous regression discontinuity design to examine whether TK, as a new approach to prekindergarten education for age-eligible students, leads to positive outcomes, for which students, and under what conditions. Previous research has shown that participation in high-quality early education prior to kindergarten can improve young children’s readiness skills for elementary school, positively affecting behavioral, social-emotional, and cognitive outcomes in particular.
Specifically, the study addresses the following questions:
1. Does TK improve kindergarten readiness in the domains of early literacy/language, mathematics, and social-emotional skills?
2. How do impacts vary by student background characteristics, such as gender, English learner status, or poverty status?
3. To what extent are the impacts of TK sustained through the end of kindergarten?
4. What are the characteristics of TK classrooms, and how does the impact of the program vary with differences in these characteristics?
The findings in this report are based on analysis of data from two cohorts of students: students who entered kindergarten in fall 2014 and those who entered kindergarten in fall 2015 who were born close to the December 2 birth date cutoff for TK eligibility. Both cohorts included students who were eligible for TK (born before December 2, in this sample between October 2 and December 2) and students who were not eligible for TK (born after December 2, in this sample between December 3 and February 2). Twenty California school districts and 168 elementary schools, sampled to be broadly representative of the regions and students in California, participated in the study. We also obtained data for all English learners in the state on the California English Language Development Test (CELDT).
TK Improves Academic Skills and Engagement at Kindergarten Entry
The study found that TK gives students an advantage at kindergarten entry on all academic skills assessed. TK students outperformed comparison students on early literacy and language skills,

American Institutes for Research The Impact of Transitional Kindergarten in California—iii
including letter and word identification (Exhibit ES-1), phonological awareness, and expressive vocabulary, as well as mathematics skills such as problem solving (Exhibit ES-2) and knowledge of mathematical concepts and symbols. These advantages are notable given the large percentage of students (over 80% according to parent report) in the comparison group who attended preschool while TK students were enrolled in TK. TK gave students a six-month learning advantage on letter and word identification and a three-month learning advantage on problem-solving skills in math.
Students who attended TK were also rated by their teachers as more engaged than their peers (Exhibit ES-3). However, there were no differences detected between TK and non-TK students on other social skills measured or on executive function, perhaps because other early childhood programs or experiences of comparison students provided a similar focus on social-emotional and behavioral skills.
Exhibit ES-1. Mean Scores for TK and Comparison Students on Letter and Word Identification
Exhibit ES-2. Mean Scores for TK and Comparison Students on Applied Problems
Note. Effect size: 0.480. n-TK = 2,596, n-Comparison = 3,359. Source: Authors’ analysis of student scores on the Woodcock-Johnson Letter-Word test. *** p < .001.
Note. Effect size: 0.202. n-TK = 2,607, n-Comparison = 3,435. Source: Authors’ analysis of student scores on the Woodcock-Johnson Applied Problems test. ** p < .01.
22.40***
17.45
0
5
10
15
20
25
Letter-Word Identification
TK
Comparison
18.54**17.06
0
5
10
15
20
25
Applied Problems
TK
Comparison

American Institutes for Research The Impact of Transitional Kindergarten in California—iv
Exhibit ES-3. Mean Scores for TK and Comparison Students on Teacher Ratings of Social-Emotional Skills
Note. Effect sizes: 0.183 for Engagement and 0.162 for Self-Control. N-TK = 2,223, N-Comparison = 2,928. Lightly shaded bars indicate no statistically significant differences between groups. Source: Authors’ analysis of teacher responses on the SSIS Rating Scales. † p < .10. * p < .05.
Analyses of the impact of TK for different groups of students suggest that the program is effective for all students. In addition, the program showed a particularly strong impact on math skills for low-income students at kindergarten entry.
TK Improves Language, Literacy, and Math Skills for English Learner (EL) Students
The study also looked more closely at effects for EL students, a group that makes up a notable 33% of kindergartners in California. Consistent with overall study results, TK has an impact on EL students’ language, literacy, and mathematics skills at kindergarten entry. Statewide data also indicate that TK gives EL students a particularly strong advantage over EL students who did not attend TK in speaking, listening, and overall English language skills as measured by the CELDT (Exhibit ES-4). This advantage was found for all language groups tested: Spanish, East Asian, South Asian, Southeast Asian, and West Asian/Middle Eastern languages.
3.37 3.43* 3.31†3.65 3.71
3.28 3.32 3.213.60 3.67
0.00.51.01.52.02.53.03.54.0
Cooperation Engagement Self-Control Absence ofExternalizing
Absence ofInternalizing
TK
Comparison

American Institutes for Research The Impact of Transitional Kindergarten in California—v
Exhibit ES-4. Adjusted Mean Scores for TK EL Students and Comparison Students on Overall English Language Skills
Note. n for TK EL students = 15,902. n for non-TK EL students= 38,952. Effect sizes: 0.747 for Overall, 0.685 for Listening, and 0.583 for Speaking. Source. Authors’ analysis of student scores on the CELDT. *** p < .001.
Impacts of TK Are Smaller by the End of Kindergarten
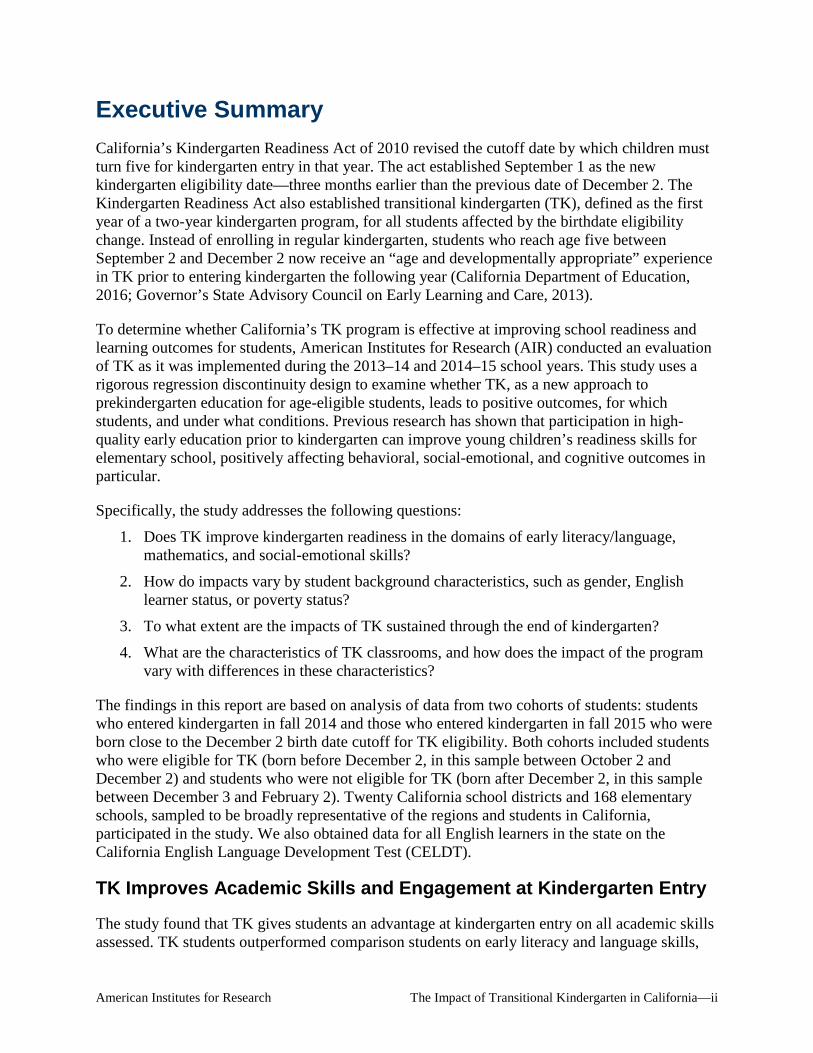
During the kindergarten year, both TK and comparison students showed continued learning. Both groups demonstrated growth at or above what would be expected for their age on letter and word identification, expressive vocabulary, and problem solving in math. However, comparison students showed greater growth during the year, suggesting that they were “catching up” rather than advantages of TK “fading out.” By the end of kindergarten, the only remaining statistically significant impact of TK was on students’ letter and word identification skills (Exhibit ES-5); marginally significant effects on knowledge of mathematics concepts and symbols and on expressive vocabulary were also observed. It is not unexpected that non-TK students will “catch up” in kindergarten, as teachers may focus their attention on students who need the most support to be ready for first grade. In addition, all students in kindergarten, including those who attended TK, showed more growth on these literacy and mathematics measures when their teachers incorporated more differentiation strategies in the classroom.
422*** 423*** 436***
362 364 378
0
100
200
300
400
500
600
Overall Listening Speaking
TK EL Students Non-TK EL Students
American Institutes for Research The Impact of Transitional Kindergarten in California—vi
Exhibit ES-5. Adjusted Mean Score Growth on Letter and Word Identification from Fall to Spring of Kindergarten
Note. Fall: n-TK = 2,596, n-Comparison = 3,359; Spring: n-TK = 2,518, n-Comparison = 3,317. Significance indicators reflect a difference between the TK and comparison groups at one time point (i.e., fall or spring). Source: Authors’ analysis of student scores on the Letter-Word Identification assessment. ** p < .01.
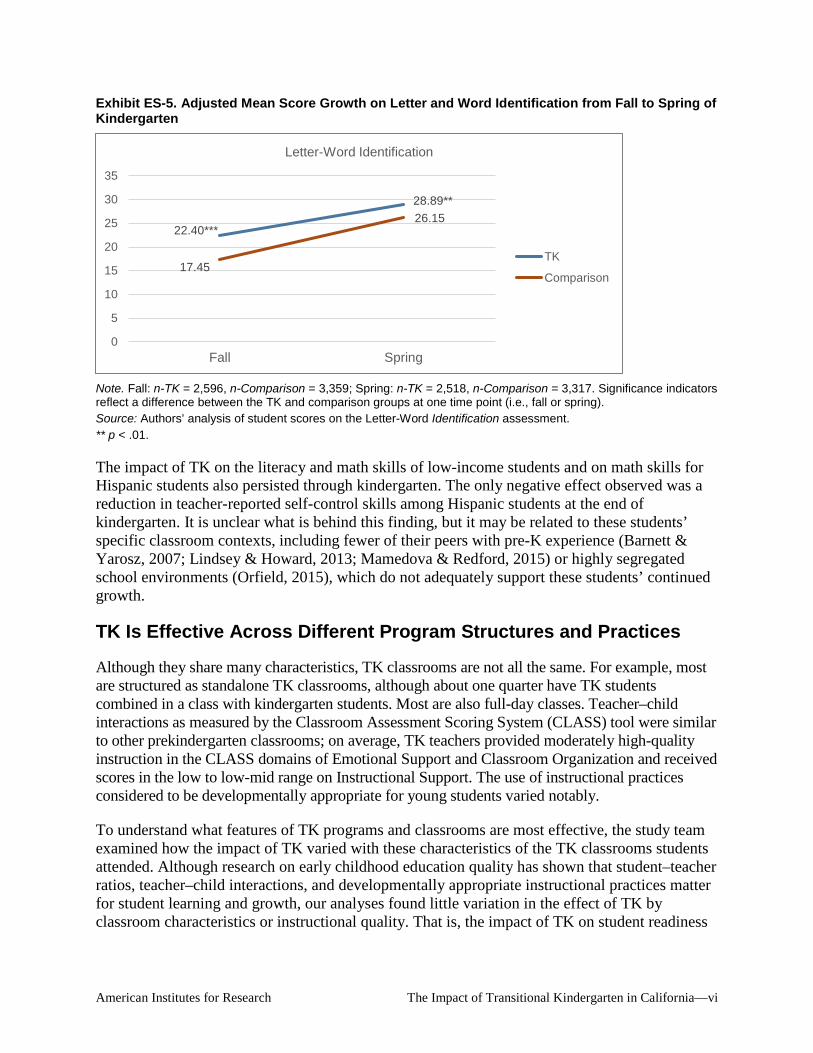
The impact of TK on the literacy and math skills of low-income students and on math skills for Hispanic students also persisted through kindergarten. The only negative effect observed was a reduction in teacher-reported self-control skills among Hispanic students at the end of kindergarten. It is unclear what is behind this finding, but it may be related to these students’ specific classroom contexts, including fewer of their peers with pre-K experience (Barnett & Yarosz, 2007; Lindsey & Howard, 2013; Mamedova & Redford, 2015) or highly segregated school environments (Orfield, 2015), which do not adequately support these students’ continued growth.
TK Is Effective Across Different Program Structures and Practices
Although they share many characteristics, TK classrooms are not all the same. For example, most are structured as standalone TK classrooms, although about one quarter have TK students combined in a class with kindergarten students. Most are also full-day classes. Teacher–child interactions as measured by the Classroom Assessment Scoring System (CLASS) tool were similar to other prekindergarten classrooms; on average, TK teachers provided moderately high-quality instruction in the CLASS domains of Emotional Support and Classroom Organization and received scores in the low to low-mid range on Instructional Support. The use of instructional practices considered to be developmentally appropriate for young students varied notably.
To understand what features of TK programs and classrooms are most effective, the study team examined how the impact of TK varied with these characteristics of the TK classrooms students attended. Although research on early childhood education quality has shown that student–teacher ratios, teacher–child interactions, and developmentally appropriate instructional practices matter for student learning and growth, our analyses found little variation in the effect of TK by classroom characteristics or instructional quality. That is, the impact of TK on student readiness
22.40***
28.89**
17.45
26.15
0
5
10
15
20
25
30
35
Fall Spring
Letter-Word Identification
TK
Comparison

American Institutes for Research The Impact of Transitional Kindergarten in California—vii
for kindergarten is similar even when the program is implemented slightly differently in different classrooms.
Conclusions and Considerations
In conclusion, this study indicates that TK is effective for preparing students in the program’s target age range for kindergarten by increasing their academic skills more than the early childhood experiences of the comparison group. We also found that TK benefits students from all groups. Some of these benefits persist until the end of kindergarten, although the difference between students who attended TK and students who did not declines over the kindergarten year as non-TK students catch up. The study also found that the impact of TK is notably robust to variations in approach. In other words, characteristics that research has suggested are related to child outcomes in early childhood education programs, in general, did not moderate the effect of TK in this study’s analyses. It may be that the features that all TK programs have in common—bachelor’s degree–level teachers with kindergarten teaching experience, curricula and classrooms that facilitate transitions to kindergarten, and classrooms that are inclusive of students at all family income levels—are what drive TK’s impact.
The findings of this evaluation suggest that TK should continue to be offered as a “universal” program—that is, available to students from all socio-economic groups (i.e., not means tested). Although the results provide limited guidance regarding specific classroom practices, analyses of kindergarten classroom practices suggest that differentiated instruction may be important to continue supporting the learning and growth of all students. Additional research is needed to better understand the mechanisms driving TK’s effectiveness and whether it will lead to long-term benefits for students.
Even with these positive impacts, there is room to improve TK in California. First, the lack of impact on executive function and many social-emotional outcomes suggests that more attention could be given to these developmental skills and behaviors in TK classrooms. In addition, more work can be done to support the continued learning of TK graduates in kindergarten and beyond.

American Institutes for Research The Impact of Transitional Kindergarten in California—1
Chapter 1. Introduction To determine whether transitional kindergarten (TK) is effective at improving school readiness and learning outcomes for students, American Institutes for Research (AIR) conducted an evaluation of TK in California as it was implemented during the 2013–14 and 2014–15 school years. The goal of this study is to assess the impact of TK on California students’ readiness for kindergarten across multiple domains of development critical for success in school. Using a regression discontinuity design, this study examines whether TK participation improves kindergarten readiness in the domains of early literacy and language, mathematics, executive function, and social-emotional skills. The study also examines whether the program is especially effective for specific groups of students, whether particular characteristics of TK programs or practices in classrooms have a greater impact, and whether observed impacts at kindergarten entry persist through the end of kindergarten.
The Transitional Kindergarten Program in California
With a kindergarten-entry cutoff date of December 2, California historically had young kindergartners, with up to a quarter of the state’s kindergarten population entering school at age 4. The 2010 Kindergarten Readiness Act changed the kindergarten entry cutoff date such that children must turn age 5 by September 1 (instead of December 2) to enter kindergarten in that school year. In addition, the law established a new grade level—transitional kindergarten (TK)—which districts must provide for all students born between September 2 and December 2, although participation is voluntary for families, as is kindergarten in California.
Overall, research has shown that participation in high-quality preschool prior to kindergarten can improve young children’s readiness skills for elementary school, positively affecting behavioral, social-emotional, and particularly cognitive outcomes (Andrews, Jargowsky, & Kuhne, 2012; Barnett, 1995; Yoshikawa et al., 2013). Evaluations of state preschool efforts in New Mexico, Michigan, New Jersey, Oklahoma, South Carolina, and West Virginia have shown that children’s participation in preschool has a positive impact at kindergarten entry in language, literacy, and math skills (Barnett, Lamy, & Jung, 2005; Hustedt, Barnett, Jung, & Friedman, 2010). In particular, for children who may be at risk for academic challenges in early elementary school, attending a high-quality preschool can improve test scores and attendance and reduce future grade-level retention and placement in special education (Andrews et al., 2012; Barnett, 2008; Karoly & Bigelow, 2005; Reynolds et al., 2007). This study examines whether TK, as a new approach to prekindergarten education for age-eligible students, also supports positive outcomes for students.
Previous Study Findings on the Impacts of TK
In December 2015, AIR released the first impact results from the study (Manship et al, 2015), based on the first study cohort (students in kindergarten in 2014–15, of whom approximately half were eligible for TK and half were not). This study found that students who attended TK were better prepared for kindergarten than were similar students who did not attend TK, independent of age. The AIR study team found that TK broadly benefited enrolled students, improving their language and literacy skills and their mathematical knowledge and problem-solving skills as well

American Institutes for Research The Impact of Transitional Kindergarten in California—2
as their executive function. The effects we found were over and above the learning experiences that comparison students received prior to entering kindergarten, which, for more than 80% of the comparison group, was some form of center-based preschool.
Language and Literacy Skills. Students who attended TK were significantly better able to identify letters and words and had greater phonological awareness (an understanding of the sounds of letters and syllables that make up words) in kindergarten than students who did not attend TK.
Mathematical Knowledge and Problem-Solving Skills. TK participation improved students’ knowledge of basic mathematical concepts and symbols (such as the division and equal signs) in kindergarten. TK students also exhibited stronger mathematics problem-solving skills (such as counting objects, understanding measurements, conducting basic mathematical operations, and solving mathematical word problems).
Executive Function. TK graduates had stronger executive function skills, such as their abilities to regulate their behavior, remember rules, and think flexibly—skills that support a solid foundation for school achievement (Schmitt, Pratt, & McClelland, 2014).
No significant impacts were detected on students’ social skills, as rated by their teachers.
Purpose of This Report
This final report now presents the impact of TK using both study cohorts (students in kindergarten in 2014–15 and students in kindergarten in 2015–16) combined, which enables us to examine more closely whether TK has a differential impact for particular groups of students or when implemented in particular ways. We also examine the extent to which any TK advantage is sustained through the end of kindergarten. We address the following research questions:
1. Does TK improve kindergarten readiness in the domains of early literacy and language, mathematics, and social-emotional skills?
2. How do impacts vary by student background characteristics, such as gender, English learner status, or poverty status?
3. To what extent are the impacts of TK sustained through the end of kindergarten?
4. What are the characteristics of TK classrooms, and how does the impact of the program vary with differences in these characteristics?
Overview of Methodology and Data Sources
To measure the effect of TK compared to not receiving TK, researchers would ideally randomly assign children to be either in TK or to continue with “business as usual,” which could include, for example, enrollment in child care, preschool, or Head Start, or remaining at home. However, such assignment would be difficult to defend and implement, and it would produce results that are not necessarily generalizable to the full population of TK-eligible children (because the results would be limited to children whose parents would be comfortable with the uncertainty inherent in a randomized controlled trial setting). Fortunately for the study, eligibility for TK is limited to children in a very specific age range, which means that a regression discontinuity

American Institutes for Research The Impact of Transitional Kindergarten in California—3
design can be used to approximate the rigor and credibility of random assignment without actually randomly assigning children.
This study takes advantage of the December 2 birthdate cut off and limited age range for TK and employs the regression discontinuity design (Exhibit 1). Students born between October 1 and February 2 (within 60 days on either side of the December 2 cutoff date to enter TK) in sample districts and schools were invited to participate in the study by consent of their parents; participation was voluntary. We then compared kindergarten readiness for students who attended TK with the readiness of students who did not attend TK, as determined by the birthdate cut off. In all impact analyses, we statistically controlled for student age through the design of the regression discontinuity model.
Exhibit 1. The Regression Discontinuity Approach
The research team collected data for two cohorts of students: those students who entered kindergarten in the fall of 2014 and those students who entered kindergarten in the fall of 2015. Both cohorts include students who were eligible for TK and students who were not eligible for TK. Findings in this report are based on both cohorts of students. Data from these two cohorts of students were combined so that the total sample size of students is large enough to allow the research team to examine the impact of TK on subgroups of students (such as English learners) and investigate the particular characteristics of TK classrooms that are most supportive of positive outcomes for students. Data were collected from students in the fall and spring of the kindergarten year; the impacts of the program at both time points also are presented in this report.
Twenty California school districts and 168 elementary schools participated in the study. These districts and schools were sampled to be broadly representative of California and were drawn from all geographic regions of the state (see Appendix A for details of the study’s sampling approach and the study sample characteristics). The background characteristics of the student sample participating in the study were similar to characteristics of California kindergartners overall (see Exhibit A2 in Appendix A).
We also examined the characteristics of students who were eligible for TK and of students who were not eligible for TK to ensure that, after controlling for the age difference between TK and comparison group students, there were no notable differences between these two groups that might drive differences in achievement. In terms of demographic characteristics (Exhibit 2), there were no significant differences between students eligible for and students not eligible for TK in either study cohort. Nonetheless, we controlled for demographic characteristics, including age, in the regression discontinuity models.
Children who
are age eligible for
TK
Compare
Younger children who are not age eligible for
TK Born September 2 to
December 2
TK (Treatment) Group Comparison Group
Born December 3 or later

American Institutes for Research The Impact of Transitional Kindergarten in California—4
Exhibit 2. Demographic Characteristics of Students in the TK and Comparison Samples
Cohort 1 Cohort 2 TK Group N = 1,591
Comparison Group
N = 1,318
TK Group N = 1,792
Comparison Group
N = 1,540 Mean age (as of 9/1/2014 for Cohort 1 and 9/1/2015 for Cohort 2) 5.83*** 5.66 5.83*** 5.66
Female 50.2% 48.0% 50.2% 50.7% Race
White 26.2% 27.8% 30.0% 25.7% Hispanic 55.2% 56.5% 52.4% 54.8% Black 4.5% 3.9% 4.0% 5.2% Asian 11.8% 9.9% 11.5% 12.8% Other 2.4% 2.0% 2.1% 1.5%
Free or reduced-price lunch eligibility 59.4% 58.3% 59.4% 61.0% English learner 44.1% 39.4% 39.6% 36.0% Special education 7.2% 7.0% 4.6% 3.9% Parental education
Less than high school diploma 13.2% 13.7% 11.3% 12.1% High school diploma 20.2% 21.1% 18.9% 20.3% Some college 16.7% 17.5% 16.1% 17.0% Vocational certificate or associate’s degree 17.4% 18.2% 18.9% 18.6%
Graduated from college (bachelor’s degree) 18.5% 15.9% 17.5% 16.8%
Graduate education 14.1% 13.7% 17.2% 15.2% Note. Table displays unadjusted means and percentages, but the significance testing for all variables except age adjusts for student age. Source: Authors' analysis of student record data from participating districts and parent survey data. * p < .05. *** p < .001.
In addition, we considered prior early education experiences among TK students and comparison students (Exhibit 3). First, as context for our findings, it is important to note that more than 80% of students in the comparison group in both cohorts attended some type of center-based preschool program the year before kindergarten (while TK students were enrolled in TK), according to parent reports. And, more than half of all students in the comparison group in both cohorts attended their preschool programs for at least 15 hours per week (roughly equivalent in duration to half-day TK).

American Institutes for Research The Impact of Transitional Kindergarten in California—5
Exhibit 3. Prior Preschool Experience of Students in the TK and Comparison Samples
Cohort 1 Cohort 2 TK Group n = 1,591
Comparison Group
n = 1,318 TK Group n = 1,792
Comparison Group
n = 1,540 Attended center-based preschool in the year before kindergarten
N/A (Attended TK) 80.7%
N/A (Attended TK) 80.9%
Attended center-based preschool in the year before kindergarten for at least 15 hours per week
N/A (Attended TK)
51.1% N/A
(Attended TK) 56.2%
Attended center-based preschool 2 years before kindergarten 75.7% 65.1% 78.3% ** 64.7%
Attended center-based preschool 2 years before kindergarten for at least 15 hours per week
46.3% * 35.1% 50.5% * 39.4%
Note. Table displays unadjusted percentages, but the significance testing adjusts for student age. Source: Authors’ analysis of parent survey data. * p < .05. ** p < .01.
Many of these students also attended a center-based preschool program two years before kindergarten as well. However, more TK-eligible students attended a center-based preschool program two years before kindergarten (in the year before they attended TK) than students in the comparison group in Cohort 2. In both cohorts, TK students were more likely to have attended a center-based preschool for more than 15 hours per week during the year before TK than the comparison group. To account for these differences, we controlled for prior preschool experience (two years before kindergarten) in the regression discontinuity models.
Data Sources
The study team obtained information about students’ skills in kindergarten from both direct student assessments and surveys of kindergarten teachers, who rated students’ behaviors and social skills. We also obtained kindergarten attendance records for students directly from participating districts. We gathered student background information with a parent survey included with the study consent form as well as directly from school districts.
Student Assessments
Kindergarteners’ language, literacy, mathematics and executive function skills were directly assessed in a one-on-one untimed assessment at their schools. The assessment took approximately 45 minutes to administer to a student. Every student was first administered two subtests of the preLAS@2000, Simon Says and Art Show, in English in order to assess each student’s English proficiency. Simon Says assesses receptive language skills, and Art Show assesses expressive language skills. For monolingual English speakers, these two preLAS subtests served as a warm-up, getting the students accustomed to the assessor and the testing situation. For students who spoke a language other than English, these subtests served an additional purpose: The subtests determined if the child could continue the assessment in English. We used the same cut point used in the Early Childhood Longitudinal Study, Birth

American Institutes for Research The Impact of Transitional Kindergarten in California—6
Cohort;1 therefore, the threshold for assessing in English was set low (12 or more correct out of 20) to increase the number of bilingual students assessed in English. If a child scored less than 12 correct and spoke Spanish, the assessment was continued in Spanish. For students who scored less than 12 correct and spoke a language other than English or Spanish, the assessment was terminated after the preLAS. The one exception is that, during the first cohort (2014–15), students who spoke Cantonese, Mandarin, Korean, Tagalog, or Vietnamese but failed to get 12 or more correct on the preLAS were administered the executive function measure in their Asian language before ending the assessment. However, only two Asian students with a home language of Cantonese, Mandarin, Korean, Tagalog, or Vietnamese failed to obtain a score of at least 12 on the preLAS, so this practice was not carried forward to the second cohort of kindergarteners.
Following the preLAS, trained assessors administered a battery of assessments to students, in either English or Spanish, including assessments of vocabulary, phonological awareness, letter and word identification, mathematics, and executive function. Exhibit 4 presents the assessments used (see additional psychometric information about each assessment in Appendix C).
Exhibit 4. Directly Assessed Measures of Student Outcomes
Measure Skills Assessed Language and Literacy Skills Clinical Evaluation of Language Fundamentals Preschool–2 Expressive Vocabulary subtest Expressive vocabulary
Clinical Evaluation of Language Fundamentals Preschool–2 Phonological Awareness subtest Phonological awareness
Woodcock-Johnson Letter-Word Identification subtest Ability to name letters and read words Mathematics Skills
Woodcock-Johnson Quantitative Concepts subtest Mathematical concepts, symbols, and vocabulary
Woodcock-Johnson Applied Problems subtest Numeracy, basic operations, and problem solving
Executive Function
Head, Toes, Knees, and Shoulders (HTKS) assessment Executive function (inhibitory control, attention, and working memory)
All bilingual Spanish-speaking students were administered a supplement immediately following the main assessment battery. Students who had taken the main assessment in Spanish (because their preLAS scores were lower than 12) were administered an English supplement after the main assessment. For this supplement, the assessor switched to English and administered the CELF-2P Expressive Vocabulary test and the Woodcock-Johnson III Applied Problems. Students who had taken the main assessment in English but were bilingual in Spanish were given a Spanish supplement that consisted of the CELF-2 Spanish Vocabulario Expresivo and the Woodcock-Muñoz Batería III Problemas Aplicados. Thus, all bilingual Spanish-speaking students were able to demonstrate their vocabulary and mathematics knowledge in both English and Spanish.
1 U.S. Department of Education, National Center for Education Statistics, Early Childhood Longitudinal Study, Kindergarten Class of 2010-11 (ECLS-K:2011) Restricted-Use Data File.

American Institutes for Research The Impact of Transitional Kindergarten in California—7
Teacher Surveys of Students’ Social Skills
Teachers were asked to provide information about each study child’s social-emotional competence by completing survey items comprising five subscales from the teacher scales of the Social Skills Improvement System (SSIS) Rating Scales (Gresham & Elliott, 2008). The Cooperation, Engagement, Self-Control, Internalizing Behavior, and Externalizing Behavior subscales were included in the spring teacher questionnaire for a total of 39 items. Exhibit 5 presents each subscale rated by teachers.
Exhibit 5. Social-Emotional Skills Indirectly Assessed Through Teacher Ratings
Measure Skills Assessed Social-Emotional Skills
SSIS rating scales, Cooperation subscale Helping others, sharing materials, and complying with rules and directions
SSIS rating scales, Engagement subscale Joining activities in progress and inviting others to join, initiating conversations, making friends, and interacting well with others
SSIS rating scales, Self-Control subscale Responding appropriately to conflict (e.g., disagreeing and teasing) and nonconflict situations (taking turns and compromising)
SSIS rating scales, Externalizing Behavior subscale
Being verbally and physically aggressive, failing to control temper, and arguing
SSIS rating scales, Internalizing Behavior subscale
Feeling anxious, sad, and lonely; exhibiting poor self-esteem
Statewide Data on English Proficiency: California English Language Development Test
The study team secured California English Language Development Test (CELDT) data for all English learners statewide from the California Department of Education. Analysts at the California Department of Education provided the data, which are not publicly available, from the CALPADS system. The data set included non-identifiable enrollment data for all students enrolled in TK and Kindergarten in the 2012–13, 2013–14, and 2014–15 school years. The data included the following variables: date of birth, gender, race/ethnicity, English learner status, home language, county code, district code, and school code. In addition, the data set included CELDT scores by domain (listening, speaking, reading, and writing) and overall performance level (beginning, early intermediate, intermediate, early advanced, advanced).
District Administrative Data and Attendance Data
Student demographic data and attendance data were requested from all 20 school districts with consented students. This district administrative data included: the students’ race/ethnicity, gender, disability status, English learner status, language spoken at home, free or reduced-price lunch status, kindergarten attendance records (days enrolled and days attended), TK attendance information, and preschool experience (if available). We received these data from all districts. Attendance data were most complete for Cohort 2; all analyses of attendance outcomes are based only on the second cohort.

American Institutes for Research The Impact of Transitional Kindergarten in California—8
Teacher Surveys of Classroom Practices
The study team administered surveys to TK, kindergarten, and first-grade teachers in recruited schools to gather information about teacher knowledge, background, and instructional practices. Surveys were sent to TK teachers (including TK/kindergarten combination classroom teachers) in the spring of the 2013–14 and 2014–15 school years, and to kindergarten (including TK/kindergarten combination) and first-grade teachers who had consented kindergarten students in their classrooms in fall and spring of the 2014–15 and 2015–16 school years. (For more details about survey development and administration, see Appendix C.)
Classroom Observations
The study team also observed a subset of TK classrooms (140 classrooms in Cohort 1, 167 classrooms in Cohort 2) in participating schools in order to understand and document the characteristics of TK classrooms. Two trained observers visited each participating classroom. One observer used the Classroom Assessment Scoring System (CLASS®) K–3 observation tool (Pianta, LaParo, & Hamre, 2008) and the other observer used the Emerging Academics Snapshot (Snapshot) observational tool (Ritchie, Howes, Kraft-Sayer, & Weiser, 2002). (Additional details about classroom observation tools are presented in Appendix B, and additional details about training and data collection procedures are presented in Appendix C.)

American Institutes for Research The Impact of Transitional Kindergarten in California—9
Chapter 2. Impact of TK on Kindergarten Readiness Preliminary study findings released in December 2015 revealed that TK has an impact on students’ language, literacy, mathematics, and executive function skills at kindergarten entry but has no detectable effect on kindergarten teacher ratings of students’ social skills. These findings were based on the study’s first cohort of students who were in kindergarten in the 2014–15 school year and thus reflects impacts of TK in its second year of implementation (2013–14). This chapter assesses the impact of TK on kindergarten readiness in its second and third year (2013–2015) of implementation, combining data from two cohorts (kindergartners in 2014–15 and kindergarteners in 2015–16). Results are fairly consistent across the two years.
Academic Skills
Analyses of data from both cohorts confirmed that TK has a significant effect on students’ school readiness skills, particularly academic skills, such that students who attended TK demonstrated greater competency in their language, literacy and early mathematics skills than their peers who did not attend TK. Each of the outcomes examined is presented in the following sections.
Language and Literacy Skills
The study found a positive impact of TK on all language and literacy skills assessed in the fall of kindergarten: letter and word identification, phonological awareness, and expressive vocabulary. First, TK students displayed greater ability to identify letters and words, as measured by the Woodcock-Johnson Letter-Word Identification subtest (effect size = 0.480; p < .001; Exhibit 6). This is a sizable advantage for TK students at kindergarten entry, equivalent to approximately six months of learning2 for students who attended TK, over their similarly aged peers who were not eligible for TK.
Exhibit 6. Adjusted Mean Scores for TK and Comparison Students on Letter and Word Identification
Note. Effect size: 0.480. n-TK = 2,596, n-Comparison = 3,359. Source: Authors’ analysis of student scores on the Woodcock-Johnson Letter-Word test. *** p < .001.
2 Using age equivalent scores to compare performance, TK students score above their peers who did not attend TK by approximately six months. That is, their scores are consistent with what we would expect for children who are six months older, compared to the level at which non-TK students perform.
22.40***
17.45
0
5
10
15
20
25
Letter-Word Identification
TK
Comparison

American Institutes for Research The Impact of Transitional Kindergarten in California—10
Second, TK boosted students’ phonological awareness skills. Specifically, TK students were better able to identify sounds, rhymes, and parts of words and sentences than their non-TK peers (Exhibit 7), as measured by the CELF Phonological Awareness assessment at kindergarten entry (effect size = 0.274, p < .001). These skills are important building blocks for the development of literacy skills.
Exhibit 7. Adjusted Mean Scores for TK and Comparison Students on Phonological Awareness
Note. Effect size: 0.274. n-TK = 2,602, n-Comparison = 3,366. Source: Authors’ analysis of student scores on the Clinical Evaluation of Language Fundamentals Phonological Awareness test. *** p < .001.
Third, TK also improved students’ vocabularies. TK students had somewhat larger and richer vocabularies at kindergarten entry than their peers who did not attend TK, as measured by the CELF Expressive Vocabulary subtest (effect size = 0.145, p < .05; Exhibit 8).
Exhibit 8. Adjusted Mean Scores for TK and Comparison Students on Expressive Vocabulary
Note. Effect size: 0.145. n-TK = 2,602, n-Comparison = 3,366. Source: Authors’ analysis of student scores on the Clinical Evaluation of Language Fundamentals Phonological Awareness test. * p < .05.
Mathematics Skills
TK also strengthened students’ mathematical knowledge and skills. Specifically, TK students exhibited stronger mathematics problem-solving skills at the beginning of kindergarten, such as
17.69***15.73
0
5
10
15
20
25
Phonological Awareness
TK
Comparison
21.55*19.83
0
5
10
15
20
25
Expressive Vocabulary
TK
Comparison

American Institutes for Research The Impact of Transitional Kindergarten in California—11
counting objects, understanding measurement, conducting basic mathematical operations, and solving mathematics word problems, as measured by the Woodcock-Johnson Applied Problems subtest (effect size = 0.202, p < .01; Exhibit 9). TK gave students more than a three-month advantage in learning on these problem-solving skills over non-TK students who entered kindergarten at the same time.
Exhibit 9. Adjusted Mean Scores for TK and Comparison Students on Applied Problems
Note. Effect size: 0.202. n-TK = 2,607, n-Comparison = 3,435. Source: Authors’ analysis of student scores on the Woodcock-Johnson Applied Problems test. ** p < .01.
In addition, TK participation improved students’ knowledge of basic mathematical concepts and symbols in kindergarten, as measured by the Woodcock-Johnson Quantitative Concepts subtest (effect size = 0.286, p < .001; Exhibit 10). This finding suggests that TK students may have received greater exposure to mathematical concepts and symbols in TK than non-TK students who attended other early learning and care programs.
Exhibit 10. Adjusted Mean Scores for TK and Comparison Students on Quantitative Concepts
Note. Effect size: 0.286. n-TK = 2,593, n-Comparison = 3,346. Source: Authors’ analysis of student scores on the Woodcock-Johnson Quantitative Concepts test. *** p < .001.
Summary of TK Impact on Academic Skills
Thus, when examining the effects of the TK program on two cohorts of students at the beginning of kindergarten, we find that, even after controlling for age, TK students show more advanced academic skills at kindergarten entry compared to their non-TK peers. Exhibit 11 summarizes the impact of TK on different academic skills at the beginning of kindergarten using effect sizes—a standardized
18.54** 17.06
0
5
10
15
20
25
Applied Problems
TK
Comparison
9.60
0
5
10
15
20
25
Quantitative Concepts
TK
Comparison
10.59***

American Institutes for Research The Impact of Transitional Kindergarten in California—12
measure that allows us to compare the magnitude of impact across different outcome measures.3 As shown in Exhibit 11, we observed positive and significant effects of TK for students across all language, literacy and mathematics outcomes, with the largest effect related to literacy skills—identifying letters and words.
Exhibit 11. Summary of Effect Sizes on Academic Skills at Kindergarten Entry
Note. n-TK = 2,623, n-Comparison = 3,455. ** p < .01. *** p < .001.
Executive Function and Social Skills
In addition to academic performance, we also examined student skills—such as executive function and social skills—that support academic learning and success in school. Few statistically significant differences were observed on these outcomes. Each outcome is discussed below.
Executive Function
TK graduates scored slightly higher than their non-TK peers on executive function, but this difference was not statistically significant, suggesting similar skills in working memory, inhibition, and cognitive flexibility for TK and non-TK students (Exhibit 12; lighter bars indicate lack of statistical significance). The development of memory, inhibition, and cognitive flexibility—or executive function—is in part dependent on brain maturation, which is driven by age. That is, older children perform better than younger children on this measure of executive function (von Suchodoletz et al., 2013). Thus the similar performance of TK students and their peers may be a function of being of a similar age and having had similar prekindergarten experiences (TK or other center-based preschool programs) in which they had to control behavior and follow directions.
3 Effect sizes are the standardized mean differences in the outcomes between the students who attended TK and those who did not, as estimated by the RD model, and computed by dividing the mean difference in the outcome by overall standard deviation. Effect sizes of 0.2 are considered small, 0.5 moderate, and 0.8 high.
0.48***
0.27***
0.15**0.20**
0.29***
0
0.1
0.2
0.3
0.4
0.5
0.6
Letter-WordIdentification
PhonologicalAwareness
ExpressiveVocabulary
Applied Problems QuantitativeConcepts

American Institutes for Research The Impact of Transitional Kindergarten in California—13
Exhibit 12. Adjusted Mean Scores for TK and Comparison Students on Executive Function
Note. No statistically significant differences. n-TK = 2,614, n-Comparison = 3,431. Source: Authors’ analysis of student scores on the Head Toes Knees Shoulders task.
Social Skills
The study found few differences in teacher ratings of TK and non-TK students’ social skills. For example, TK students were rated by their kindergarten teachers as being equally skilled as their peers who did not go to TK with respect to cooperation, and they received similar ratings on externalizing and internalizing behavior. Given the high rate of participation in center-based preschool for the comparison sample overall, these findings suggest that students’ social behaviors and skills are similarly supported by TK and these other types of prekindergarten programs.
However, kindergarten teachers rated TK graduates as being significantly more engaged in class than students who had not attended TK (effect size = 0.183, p < .05; Exhibit 13). Engagement is an essential student behavior for academic achievement (Reyes, Brackett, Rivers, White, & Salovey, 2012). Engaged students pay attention, participate in class discussions and group activities, and are active learners; students who are not engaged are more likely to be disruptive, to do more poorly in school, and to drop out (Reyes et al., 2012). Thus, this finding suggests that the TK program provides a positive learning experience that fosters engagement of TK students above what is seen in students who do not attend TK. TK students were also rated higher on self-control compared to their non-TK peers, however, this difference was only marginally significant.
31.4828.12
05
101520253035
Executive Function
TK
Comparison

American Institutes for Research The Impact of Transitional Kindergarten in California—14
Exhibit 13. Adjusted Mean Scores for TK and Comparison Students on Teacher Ratings of Social-Emotional Skills
Note. Effect sizes: 0.183 for Engagement and 0.162 for Self-Control. n-TK = 2,223, n-Comparison = 2,928. Source: Authors’ analysis of teacher responses on the SSIS Rating Scales.† p < .10. * p < .05.
The Impact of TK for Student Subgroups
The study team examined the impacts of TK separately for key demographic subgroups of students to determine if TK had a differential impact on students with different characteristics. We assessed impacts by gender, eligibility for free or reduced-price lunch, English learner status, ethnicity, and parent education. Given the need for very large sample sizes to conduct the RD analyses, we were not able to make comparisons between all possible demographic subgroups; for example, to examine impacts by ethnicity, we were only able to compare the two largest ethnic groups in the state: Hispanic and non-Hispanic White students. Overall, this exploration confirmed that TK benefits all eligible students, though specific benefits varied somewhat by demographic subgroup.
First, students who may be viewed as standing to gain more from TK—such as those less likely to have attended preschool (e.g., economically disadvantaged students or Hispanic students), English learners who could benefit from more time for English acquisition, or boys who may need more time for social-emotional maturation—demonstrated consistent impacts across all academic outcomes (Exhibit 14). TK succeeded in giving these students a boost on all language, literacy, and math outcomes relative to their non-TK peers. In addition, the effect on math problem-solving skills (applied problems assessment) was significantly more positive for students eligible for free or reduced-price lunch than students who were not eligible for this lunch program. These students also benefited from TK in terms of self-control.
Additional details on subgroup analyses and results can be found in Appendix F.
3.37 3.43* 3.31†3.65 3.71
3.28 3.32 3.213.60 3.67
0.00.51.01.52.02.53.03.54.0
Cooperation Engagement Self-Control Absence ofExternalizing
Absence ofInternalizing
TK
Comparison

American Institutes for Research The Impact of Transitional Kindergarten in California—15
Exhibit 14. Summary of Effect Sizes of TK for Demographic Subgroups, Fall Academic Outcomes
Letter-Word Identification
Phonological Awareness
Expressive Vocabulary
Applied Problems
Quantitative Concepts
All Students 0.480*** 0.274*** 0.145* 0.202** 0.286*** Girls 0.508*** 0.330*** 0.133 0.195* 0.379*** Boys 0.439*** 0.211* 0.164* 0.211* 0.202* FRPL Eligible 0.573*** 0.330*** 0.178* 0.381***† 0.384*** Non-FRPL Eligible 0.315* 0.157 0.073 -0.095 0.121 English Learner 0.534*** 0.349*** 0.224* 0.319** 0.385*** Non-English Learner 0.435*** 0.204* 0.094 0.100 0.222* Hispanic 0.494*** 0.314*** 0.139* 0.261** 0.318*** Non-Hispanic White 0.211 0.050 0.031 0.027 0.212 Parent Ed: High School Diploma or Less 0.493*** 0.232 0.101 0.253* 0.313** Parent Ed: More than High School 0.465*** 0.258*** 0.174** 0.142 0.276**
† Significant difference in impact for this group compared to its complement group (e.g., FRPL eligible versus non-FRPL eligible). Note. Asterisks indicate significant differences within each student subgroup between TK and non-TK students. Source: Authors’ analysis of student scores on assessments.* p < .05. **p < .01. *** p < .001.
Second, girls and less disadvantaged students benefited from TK as well. For higher income students, in addition to benefits on literacy skills, TK also showed a positive impact on self-control (Exhibit 15). Similarly, although TK did not demonstrate a statistically significant impact on academic outcomes for non-Hispanic White students, these students did show a significant advantage in terms of self-control compared to their non-TK peers. This effect was significantly larger than the effect for Hispanic students as well. Girls also benefited from TK in terms of social skills (engagement) as well as letter and word identification, phonological awareness, applied problems, and quantitative concepts. Students not classified as English learners benefited from TK in terms of letter and word identification, phonological awareness, and their knowledge of quantitative concepts.

American Institutes for Research The Impact of Transitional Kindergarten in California—16
Exhibit 15. Summary of Effect Sizes of TK for Demographic Subgroups, Fall Executive Function and Social-Emotional Outcomes
Executive Function Cooperation Engagement Self-Control Externalizing Internalizing
All Students 0.040 0.118 0.183* 0.162 0.068 0.098 Girls 0.123 0.142 0.273* 0.153 0.022 0.090 Boys -0.034 0.103 0.110 0.189 0.143 0.120 FRPL Eligible 0.125 0.110 0.219* 0.152 0.077 0.190 Non-FRPL Eligible -0.094 0.148 0.170 0.274* 0.193 0.170 English Learner 0.148 -0.031 0.152 0.042 -0.050 0.056 Non-English Learner -0.052 0.188† 0.193† 0.235† 0.140 0.118 Hispanic 0.142 -0.052 0.077 -0.046 -0.099 0.087 Non-Hispanic White -0.206 0.249 0.216 0.337* 0.190 0.098 Parent Ed: High School Diploma or Less 0.030 -0.003 0.190 0.007 -0.084 0.014 Parent Ed: More than High School 0.018 0.116 0.184 0.176 0.047 0.104
Note. Asterisks indicate significant differences within each student subgroup between TK and non-TK students. Source: Authors’ analysis of student scores on assessments.* p < .05. **p < .01. *** p < .001. † Significant difference in impact for this group compared to its complement group (e.g., FRPL eligible versus non-FRPL eligible).
Summary
In summary, study results provide continued evidence of the impact of TK on students’ skills— particularly academic skills—at kindergarten entry. Explorations of the impact on particular subgroups of students underscore the wide-reaching benefits of the program. TK shows particular academic benefits for students from typically underserved populations but improves elements of kindergarten readiness for all groups of students. The next chapter examines the extent to which these benefits persist through the end of the kindergarten year and explores educational circumstances that best support students’ continued learning.

American Institutes for Research The Impact of Transitional Kindergarten in California—17
Chapter 3. Persistence of the TK Advantage Through Kindergarten Participation in high-quality prekindergarten education can improve academic, behavioral, social-emotional, and cognitive outcomes for students of varying backgrounds, including students from disadvantaged backgrounds (e.g., Andrews et al., 2012; Barnett, 2008; Camilli, Vargas, Ryan, & Barnett, 2010; Karoly & Bigelow, 2005; Reynolds et al., 2007). However, the evidence on the long-term effects of state and district pre-K programs in particular is mixed (Phillips et al., 2017). Some recent studies found that these benefits may not persist into later elementary school (e.g., Bogard & Takanishi, 2005; Li et al., 2013; Lipsey, Farran, & Hofer, 2015; Puma et al., 2012). In contrast, an analysis of the impact of Head Start using data from the National Longitudinal Survey of Youth found that Head Start led to higher high school graduation rates, higher college attendance rates, greater self-control in adulthood, and more positive parenting practices that may be attributable to gains in social-emotional skills while attending Head Start (Bauer & Schanzenbach, 2016); and programs in Tulsa and New Jersey were found to have lasting academic effects into late elementary and middle school (Barnett, Jung, Youn, & Frede, 2013; Phillips, Gormley, & Anderson, 2016). Overall, it is unclear under what conditions effects may “fade” and when, and whether there are “sleeper” effects that initially fade but later return. This chapter examines whether the impacts of TK on school readiness at kindergarten entry persist through the end of kindergarten and under what educational circumstances the impacts may persist. Specifically, we examine students’ academic skills, executive function and social skills in the spring of kindergarten, and attendance rates over the course of the year. We also examine the impacts of TK on these outcomes for different groups of students (e.g., English learners, low-income students).
Academic Skills at the End of Kindergarten
Students who attended TK continue to grow in their skills and abilities on all measures over the course of the kindergarten year. Some of the effects of TK on academic outcomes persist through the end of kindergarten, though all effects are smaller in magnitude. Students who did not attend TK show growth from fall to spring as well, and this growth effectively narrows the gap observed at kindergarten entry, reducing the impact of TK in the spring of kindergarten on academic outcomes.
At the end of the kindergarten year, TK students continue to outperform non-TK students on literacy skills (Exhibit 16). Specifically, TK students are able to identify significantly more letters and words by the end of the kindergarten year compared to non-TK students. Although the effect is smaller in the spring, TK has an enduring impact on these early literacy skills.
TK students also demonstrate an advantage over their peers in the spring of kindergarten in terms of their expressive vocabulary, although the difference is only marginally significant (p < .10; Exhibit 17). TK students do not maintain their advantage on phonological awareness (Exhibit 18) by the end of the year.

American Institutes for Research The Impact of Transitional Kindergarten in California—18
Exhibit 16. Adjusted Mean Score Growth on Letter and Word Identification from Fall to Spring of Kindergarten
Note. Fall: n-TK = 2,596, n-Comparison = 3,359; Spring: n-TK = 2,518, n-Comparison = 3,317; significance indicators reflect a difference between the TK and comparison groups at one time point (i.e., fall or spring). Source: Authors’ analysis of student scores on the Letter-Word Identification assessment. ** p < .01.
Exhibit 17. Adjusted Mean Score Growth on Expressive Vocabulary from Fall to Spring of Kindergarten
Note. Fall: n-TK = 2,602, n-Comparison = 3,366; Spring: n-TK = 2,527, n-Comparison = 3,332; significance indicators reflect a difference between the TK and comparison groups at one time point (i.e., fall or spring). Source: Authors’ analysis of student scores on the Expressive Vocabulary assessment.
†p < .10. ** p < .01.
22.40***
28.89**
17.45
26.15
0
5
10
15
20
25
30
Fall Spring
Letter-Word Identification
TK
Comparison
21.55*
24.72†
19.83
23.37
0
5
10
15
20
25
30
Fall Spring
Expressive Vocabulary
TK
Comparison

American Institutes for Research The Impact of Transitional Kindergarten in California—19
Exhibit 18. Adjusted Mean Score Growth on Phonological Awareness from Fall to Spring of Kindergarten
Note. Fall: n-TK = 2,602, n-Comparison = 3,366; Spring: n-TK = 2,521, n-Comparison = 3,326; significance indicators reflect a difference between the TK and comparison groups at one time point (i.e., fall or spring). Source: Authors’ analysis of student scores on the Phonological Awareness assessment. *** p < .001.
The impact of TK on math outcomes is also smaller in the spring. While TK students significantly outperform non-TK students on problem-solving skills (applied problems assessment) at kindergarten entry, by the end of kindergarten, the difference between the groups is not statistically significant (Exhibit 19). TK students do demonstrate higher performance on knowledge of mathematical concepts (quantitative concepts assessment), although the difference is only marginally significant (p < .10; Exhibit 20). Exhibit 21 summarizes effect sizes of the TK program in the spring of kindergarten on students’ outcomes across all academic skill areas.
Exhibit 19. Adjusted Mean Score Growth on Applied Problems from Fall to Spring of Kindergarten
Note. Fall: n-TK = 2,607, n-Comparison = 3,435; Spring: n-TK = 2,521, n-Comparison = 3,326; significance indicators reflect a difference between the TK and comparison groups at one time point (i.e., fall or spring). Source: Authors’ analysis of student scores on the Applied Problems assessment. ** p < .01.
17.69***19.89
15.73
19.16
0
5
10
15
20
25
Fall Spring
Phonological Awareness
TK
Comparison
18.54** 21.10
17.0620.27
0
5
10
15
20
25
Fall Spring
Applied Problems
TK
Comparison

American Institutes for Research The Impact of Transitional Kindergarten in California—20
Exhibit 20. Adjusted Mean Score Growth on Quantitative Concepts from Fall to Spring of Kindergarten
Note. Fall: n-TK = 2,593, n-Comparison = 3,426; Spring: n-TK = 2,521, n-Comparison = 3,326; significance indicators reflect a difference between the TK and comparison groups at one time point (i.e., fall or spring). Source: Authors’ analysis of student scores on the Applied Problems assessment. † p < .10.*** p < .001.
Exhibit 21. Summary of Effect Sizes on Academic Skills, End of Kindergarten
Note. n-TK = 2,527, n-Comparison = 3,332. Source: Authors’ analysis of student scores on assessments. † p < .10. **p < .01.
As noted, the smaller impacts observed in the spring do not mean that TK students stop learning during the course of the kindergarten year. Both former TK students and non-TK students demonstrate growth in their academic skills. Using age-equivalent scores (which are available for the Letter-Word Identification, Expressive Vocabulary, and Applied Problems assessments), we found that, during the course of the six-month period between fall and spring assessments, TK students continue to grow as we would expect, averaging approximately six or even seven months of learning during this time frame. Exhibit 22 shows growth (in terms of months of learning) for both former TK students and comparison students from fall to spring of kindergarten, on those assessments for which age equivalents are available.
10.59***11.94†
9.60
11.42
0
5
10
15
Fall Spring
Quantitative Concepts
TK
Comparison
0.18**
0.060.10 †
0.090.12 †
0
0.1
0.2
0.3
Letter-WordIdentification
PhonologicalAwareness
ExpressiveVocabulary
Mathematics:Applied Problems
Mathematics:Quantitative
Concepts

American Institutes for Research The Impact of Transitional Kindergarten in California—21
Comparison students who were not eligible for TK also show growth in these skills during the course of the kindergarten year. In fact, from fall to spring of kindergarten, they appear to grow at a slightly faster rate than former TK students on letter and word identification and problem solving (learning the equivalent of eight to 10 months of knowledge and skills during the six-month period between assessments). This finding indicates, as suggested in the recent consensus statement from early childhood experts (Phillips et al, 2017), that the smaller effects of TK detected in the spring impact estimates may reflect a “catching up” of the non-TK students rather than a fading out of the benefits of TK. This may result from the non-TK students entering kindergarten with less knowledge and more room to grow and from teachers providing additional support to these students who need it most.
Exhibit 22. Growth of the TK and Comparison Groups From Fall to Spring of Kindergarten, by Assessment, in Months of Learning
Note. n-TK = 2,527, n-Comparison = 3,332. Source: Authors’ analysis of student scores on assessments.
Executive Function and Social Skills at the End of Kindergarten
As described in Chapter 2, there is only one social skill on which TK showed a statistically significant effect in the fall of kindergarten: engagement. There may be less of an impact of the TK program on social skills given that a large majority (more than 80%) of comparison students attended some type of center-based preschool program during the year before kindergarten; and preschool programs typically place a heavy emphasis on developing such skills. Results show a similar pattern at the end of kindergarten; we found no significant impact of TK on students’ executive function or on social skills as rated by their teachers. Exhibit 23 summarizes the effect sizes of the TK program in the spring of kindergarten on students’ executive function and social skills.
6.0 6.0 6.0
7.1
5.86.9
10.0
6.0
8.1
0.0
2.0
4.0
6.0
8.0
10.0
12.0
Letter Word Identification Expressive Vocabulary Applied Problems
Expected Learning TK Non-TK

American Institutes for Research The Impact of Transitional Kindergarten in California—22
Exhibit 23. Summary of Effect Sizes on Executive Function and Social Skills at the End of Kindergarten
Note. No significant effect sizes. n-TK = 2,521, n-Comparison = 3,320. Externalizing behaviors and internalizing behaviors are reverse coded so that larger effect sizes means fewer problem behaviors. Source: Authors’ analysis of student scores on executive function assessment and teacher ratings on SSIS.
Kindergarten Attendance Rates
Previous studies have suggested that students who are chronically absent in kindergarten show lower levels of achievement in mathematics, reading, and general knowledge during first grade (Chang & Romero, 2008), making kindergarten attendance rates an important predictor of future academic success. To explore whether TK helps set children on a positive trajectory toward greater school engagement, the study team examined the effect of TK on attendance during the kindergarten year. As with previous analyses, we used a regression discontinuity approach to examine differences in student attendance rates and the incidence of chronic absenteeism (missing 10% of the school year or more, as defined in Chang & Romero, 2008) in kindergarten. We found no statistically significant differences in former TK students’ attendance rates in kindergarten compared to their non-TK peers (Exhibit 24), nor any differences in the incidence of chronic absenteeism.
Exhibit 24. Kindergarten Attendance Rates for TK and Comparison Students, 2015–16
Note. No significant differences. N = 3,261. Source: Authors’ analysis of district-provided data on days enrolled and attended, 2015–16 school year.
-0.03
0.040.02 0.01
0.070.04
-0.1
0
0.1
0.2
ExecutiveFunction
Cooperation Engagement Self-Control ExternalizingBehaviors
InternalizingBehaviors
95.7% 95.7%
0%
20%
40%
60%
80%
100%
Kindergarten Attendance Rate
TK
Comparison

American Institutes for Research The Impact of Transitional Kindergarten in California—23
The Impact of TK for Student Subgroups at the End of Kindergarten
Examining spring outcomes by demographic groups reveals some additional evidence of enduring impacts of TK, especially for economically disadvantaged students (Exhibit 25). While several TK student groups continue to show an advantage on letter and word identification over their non-TK peers, consistent with the overall sample, TK also has an effect on both measures of math skills (applied problems and quantitative concepts) for free or reduced-price lunch-eligible students.
Hispanic TK graduates also maintain their advantage over non-TK Hispanic students on knowledge of mathematical concepts (quantitative concepts assessment). However, in addition to this continued positive effect of the program, we also found a negative effect of TK on Hispanic students’ self-control, an effect that is significantly different from the effect of the program on non-Hispanic White students’ self-control. So, while Hispanic students benefit from TK academically, it appears that TK leads to lower teacher-rated self-control by the end of the kindergarten year. It is unclear what is behind this finding, but it may be related to these students’ specific classroom contexts, including fewer of their peers with pre-K experience (Barnett & Yarosz, 2007; Lindsey & Howard, 2013; Mamedova & Redford, 2015) or highly segregated school environments (Orfield, 2015), which do not adequately support these students’ continued growth. Hispanic students’ executive function indicates that they are capable of inhibiting their impulses as well as non-TK students (if not better), but they may be acting out if they are in a kindergarten environment that is not meeting their needs. We cannot know for certain the mechanism underlying this finding, but it is worth further exploration.
Exhibit 25. Summary of Effect Sizes of TK for Demographic Subgroups, Selected Spring Outcomes
Letter-Word Identification Applied Problems Quantitative
Concepts Self-Control All Students 0.183** 0.088 0.118 0.009 Girls 0.154 0.043 0.148 0.055 Boys 0.203 0.137 0.075 -0.022 FRPL Eligible 0.224** 0.185* 0.211** -0.138 Non-FRPL Eligible 0.125 -0.065 -0.028 0.228 English Learner 0.139 0.096 0.131 -0.057 Non-English Learner 0.228* 0.069 0.127 0.027 Hispanic 0.132 0.132 0.173* -0.228*† Non-Hispanic White 0.019 -0.113 -0.113 0.239 Parent Ed: High School Diploma or Less 0.084 -0.030 0.196 -0.127 Parent Ed: More than High School 0.209* 0.112 0.095 0.024
Note. Asterisks indicate significant differences within each student subgroup between TK and non-TK students. † Significant difference in impact for this group compared to its complement group (e.g., Hispanic versus non-Hispanic White). Source: Authors’ analysis of student scores on assessments. *p < .05. **p < .01. ***p < .001.
Finally, there were no differences in effect of TK on attendance rates by demographic subgroup. Additional details and complete results from subgroup models can be found in Appendix F.

American Institutes for Research The Impact of Transitional Kindergarten in California—24
Kindergarten Characteristics that Support Continued Growth for Students in Kindergarten
To better understand how students’ kindergarten experiences moderate the impact of TK and under what circumstances former TK students as well as kindergarten students as a whole best grow and learn, the study team examined the relationship between kindergarten classroom characteristics and growth from fall to spring on two key outcomes: letter and word identification, and mathematics (Applied Problems).4 Because TK students were entering kindergarten with a year of formal schooling already complete and were performing at a higher level than non-TK students, we hypothesized that TK students would continue to benefit from the TK experience in kindergarten if:
• Kindergarten teachers had more information about the students’ prior TK experience (e.g., abilities and learning needs)
• Kindergarten instruction was effectively differentiated for the students, such as through grouping by ability level or through providing more advanced learning opportunities
• The kindergarten classroom had a critical mass of former TK students, which we would expect would raise the level of instruction and continue to offer challenges for former TK students
We also examined the amount of instructional time spent on various content areas, including reading, mathematics, science, music, and art, to determine if a greater emphasis on these areas was associated with greater growth on literacy and mathematics outcomes.
Kindergarten Instructional Practices Associated With Literacy Gains
Several instructional practices in kindergarten were positively associated with student learning in literacy as measured by the Letter-Word Identification subtest. For example, as hypothesized, more frequent grouping of students by reading and language arts ability and teaching some first-grade content to more advanced students in the classroom were associated with continued growth on literacy skills for former TK students. These teaching practices were related to growth specifically for the TK group but also for kindergartners as a whole. In addition, providing more challenging supplemental assignments was associated with greater growth during the kindergarten year for all kindergarten students. Some research has suggested that increasing rigor and teaching higher-level academic content in kindergarten may be beneficial (Clements & Sarama 2007; Duncan et al., 2007; Jenkins et al, 2015; Phillips et al, 2017; Watts et al., 2015), and the current findings also suggest this rigor may support learning. These results also corroborate the consensus of early childhood experts (Phillips et al, 2017) that differentiation through grouping or providing enrichment lessons for advanced students may support learning not only for students who come to kindergarten with more advanced skills or exposure to content but for all students in the class. More time spent on reading overall was also associated with greater growth on literacy skills, for the TK group and for kindergarten students as a whole.
4 These analyses used multilevel regression models, not regression discontinuity models, so we can identify associations among characteristics and student learning, but we cannot estimate effects.
American Institutes for Research The Impact of Transitional Kindergarten in California—25
The proportion of former TK students present in the kindergarten classroom and teacher knowledge about students’ prior experiences in TK were not associated with learning gains in literacy from fall to spring for TK or non-TK students.
Kindergarten Instructional Practices Associated With Gains in Mathematics
Differentiating instruction to meet student learning needs was also important for students’ learning in mathematics. On the Applied Problems subtest, all kindergarteners learned significantly more during the course of the kindergarten year in classrooms in which teachers disagreed with the statement that differentiating instruction is “impossible.” We found further evidence that grouping students by skill level in one subject may also support gains in other subjects. Specifically, the TK group exhibited greater gains in mathematics when they were in classrooms in which teachers grouped students by ability in reading/language arts. We also found some evidence for our hypothesis that being in a classroom with other advanced students may support continued growth for former TK students. In contrast to literacy outcomes, the TK group showed greater gains in mathematics when they were in classrooms with a higher proportion of former TK students overall.
However, as with literacy outcomes, teacher knowledge about students’ prior experiences in TK were not associated with gains in mathematics for TK students; and more time spent on mathematics instruction was not associated with gains in mathematics for students.
Summary
By the end of kindergarten, the only remaining statistically significant impact of TK on all students’ learning was on their letter and word identification skills. This “catching up” may be expected in kindergarten classrooms without rigorous or differentiated instruction that builds on students’ existing skills (Phillips et al, 2017). However, low-income and Hispanic students who attended TK showed a continued advantage on multiple academic skills at the end of the year. We also found that the program shows a small negative effect on Hispanic students’ self-control; we do not know what may be driving this finding, but it may be partly explained by characteristics of their classroom environments. Despite the fact that many TK programs aimed to engage families and educate them about the importance of attendance, we did not detect an effect of the program on students’ attendance rates in kindergarten; all students’ attendance rates in kindergarten were quite high.
Both TK and comparison students showed continued learning throughout the kindergarten year, with both groups demonstrating growth at or above what would be expected for their age on letter and word identification, expressive vocabulary, and problem solving. However, comparison students showed greater growth during the year, suggesting a “catch up” phenomenon rather than a “fading out” of the effects of TK. Prior research makes it difficult to predict how the early advantages of TK may persist over the long term, as it is largely dependent on the quality of instruction students receive in subsequent grades. In kindergarten at least, there are strategies teachers can use to support students’ continued learning; former TK students as well as kindergartners overall showed greater growth on these literacy and mathematics measures when their teachers incorporated more differentiation strategies.

American Institutes for Research The Impact of Transitional Kindergarten in California—26
Chapter 4. Characteristics and Quality of TK Classrooms Previous chapters have shown that overall, TK improves students’ readiness for kindergarten. One of the key questions for this study is whether TK programs with different characteristics have a greater or lesser impact on student outcomes. This chapter examines the characteristics and quality of TK programs and explores the relative impact observed for students who attended programs with various program features.
Structural Features That Vary Across TK Programs
Although some structural features of TK programs are mandated by law (e.g., teacher qualifications) and therefore are fairly consistently implemented across all districts, other characteristics are locally driven—determined by district priorities, constraints, and/or characteristics of the district’s kindergarten program. These features lay the groundwork for quality instruction, and, because they vary from district to district, we can examine the extent to which impacts vary for students who attend TK programs with different features. Specifically, we focus on:
• TK program schedule—whether TK is offered in a half-day or full-day format
• TK classroom composition—whether TK students are taught in a standalone classroom or whether they are taught in a classroom that includes kindergarten students (a combination classroom)
• Class size and teacher–student ratio
Schedule: Half Day Versus Full Day
There is some evidence that more intensive full-day prekindergarten programs support better outcomes for students (Reynolds et al., 2014), making the students better prepared for kindergarten. Robin, Frede, and Barnett (2006) found that students who are far behind at entry to preschool show greater improvement on language, literacy, and mathematics skills in full-day preschool compared to students in half-day programs. Districts implementing a TK program are required to offer TK in way that is consistent with their kindergarten programs in terms of the length of the day (Education Code Section 37202); that is, districts that offer full-day kindergarten also have to offer full-day TK.
Based on surveys administered to TK teachers across the state, nearly two thirds of TK classrooms (63%) in 2014–15 were full day (Exhibit 26), offering, on average, six hours of instruction per day. This finding is consistent with the trend in California to move toward full-day kindergarten (Cannon, 2009) and with the structure of most kindergarten classrooms across the country (Child Trends, 2015). Still, 38% of TK classrooms were half day, reflecting some variation across districts.

American Institutes for Research The Impact of Transitional Kindergarten in California—27
Exhibit 26. Percentage of TK Classrooms That Were Full Day or Half Day, 2014–15
Note. n = 183.
Standalone Classrooms Versus Combination Classrooms
The TK legislation does not provide districts with guidance on classroom composition and on whether districts should provide TK in a standalone classroom format, with only TK students enrolled, or whether a combination classroom, in which TK students attend alongside kindergarten students, would be more appropriate. Smaller districts are more likely to provide TK in a combination format, given the challenge of filling a TK classroom from a limited pool of age-eligible students (Quick et al., 2014).
The age distribution of students in combination classrooms is similar to that of kindergarten classrooms prior to the Kindergarten Readiness Act, in which 4-year-olds were enrolled alongside 5-year-olds; however, the age variation within combination classrooms is potentially even larger, with the current year’s TK students (who are not yet 5 years old) attending with a group of kindergarten students that includes the previous year’s TK students (who turn 6 early in the school year) (Exhibit 27). This wide age range requires that teachers differentiate instruction to meet widely varying learning needs.
63%
38%
Full Day Half Day

American Institutes for Research The Impact of Transitional Kindergarten in California—28
Exhibit 27. Birth Dates of Children Included in Kindergarten and TK, Before and After TK Implementation
In addition, research has found that combination classrooms in the first year of implementation are more similar to kindergarten classrooms and that standalone TK classrooms were less similar and often reflected features aligned with high-quality preschool programs (Quick et al., 2014). Thus, although the literature on combined grade classrooms generally is mixed (Mariano & Kirby, 2009; Ong, Allison, & Haladyna, 2000; Veenman, 1995), we might expect standalone classrooms, with their narrower age range and the potential for a more developmentally appropriate approach, to support better outcomes for students. As TK enrollment eligibility expanded in 2013–14 and 2014–15, districts that previously had too few students to form a standalone classroom could now make the decision to separate TK and kindergarten students. Thus, we were interested to see how implementation changed and how the classroom composition affected student learning outcomes.
In 2014–15, about one quarter (24%) of TK classrooms in the study were combination classrooms, in which TK students are in the same classrooms as kindergarten students (Exhibit 28). This is in contrast to 2012–13, when 57% of districts reported that all of their TK classrooms were combined with kindergarten and an additional 8% of districts reportedly offered some combination classrooms and some standalone classrooms. In 2014–15, the majority of TK classrooms (76%) were standalone classrooms, with only TK students enrolled and, therefore, included a much more limited age range.

American Institutes for Research The Impact of Transitional Kindergarten in California—29
Exhibit 28. Percentage of TK Classrooms That Were Standalone or Combined With Kindergarten, 2014–15
Note. n = 189.
Class Size and Teacher–Student Ratio
Class size and teacher–student ratios are a major focus for prekindergarten programs. Child care licensing standards govern the size of preschool classrooms, and California State Preschool Programs and Head Start programs have even more stringent rules regarding the number of children and adults in each classroom. In a summary of features of high-quality prekindergarten classrooms, Minervino (2014) has identified small class sizes and more adults in the classroom as essential elements of high-quality early education. The evidence for small class sizes and high teacher–student ratios suggests that classrooms with 20 or fewer students and at least two adults support better outcomes (Barnett, 2004). This is not to say that these factors directly affect children’s learning but rather these factors support an environment in which skilled teachers can better meet children’s learning needs.
On average, TK classrooms are not far from this mark. Class sizes varied substantially in the study sample, from 8 to 30 students, but, on average, there were 20 students per TK classroom, smaller than the size of the average California kindergarten classroom, which had 23 students in 2014–15 (California Department of Education, n.d.). And, half of the TK classrooms had another teacher or aide to support instruction at least part of the day.
Family Supports
Some TK programs also provide additional support for families through wraparound services. The study team interviewed district officials about these services provided; findings from these interviews are summarized in Appendix J. In general, a wide range of services were provided, from extended learning opportunities, to on-site health and care services, and adult education opportunities for parents.
24%
76%
Combination TK/K Standalone TK

American Institutes for Research The Impact of Transitional Kindergarten in California—30
The Impact of TK Structural Variables on Student Outcomes
By comparing the observed impacts of TK in classrooms with or without particular structural features, we can assess the impact of those TK characteristics on student outcomes. Considering schedule, classroom composition, and class size and teacher–student ratio, we found no statistically significant differences in impacts for classrooms with different structural characteristics (see Appendix G); that is, the impacts of TK are comparable for students who attend full-day and half-day TK, for students who are enrolled in standalone and combination TK classrooms, and for students with high and low class sizes and teacher–student ratios.
Instructional Practice in TK Classrooms
Research suggests that process quality—what happens inside the classroom between teachers and students—is what matters most for children’s learning (La Paro, Pianta, & Stuhlman, 2004; Meyer, Wardrop, Hastings, & Linn, 1993; Rimm-Kaufman, La Paro, Downer, & Pianta, 2005). This section describes instruction in California TK classrooms and examines the extent to which outcomes differ by classroom experience. Specifically, we focus on:
• Teacher–child interactions
• Instructional approaches to meet the needs of young learners
• Balanced curriculum
Teacher–Child Interactions
Some of the strongest evidence of the relationship between instructional quality and children’s learning outcomes is gained from the Classroom Assessment Scoring System (CLASS), which evaluates interactions between teachers and students and has been shown to be associated with growth in reading and mathematics achievement from kindergarten through Grade 5 (Pianta, LaParo, & Hamre, 2008). The CLASS domain of Instructional Support, which reflects teachers’ support for children’s thinking, problem-solving and complex language skills, has been shown to be the most predictive of students’ cognitive outcomes overall (Howes et al., 2008; Mashburn et al., 2008). In addition, high levels of Emotional Support (which fosters children’s comfort, enjoyment of learning, and development of positive relationships) and Classroom Organization (which captures teachers’ management of the classroom and engagement of the children) in both the prekindergarten and kindergarten years appear to have long-term impacts on children’s social skills (Mokrova, Broekhuizen & Burchinal, 2015). Other research focused on kindergarten classrooms has generated mixed findings; one study found that an increase in classroom quality as measured by the CLASS was associated with higher test scores in language and math as well as greater executive function skills (Caridad Araujo, Carneiro, Cruz-Aguayo, & Schady, 2016), while another found that kindergarten CLASS scores were related to student engagement but not directly to reading achievement (Ponitz, Rimm-Kaufman, Grimm, & Gurby, 2009).
In this study, we found some variation in CLASS scores among the TK classrooms observed in 2014–15. On average, TK teachers provided moderately high-quality instruction in the CLASS domain of Emotional Support as well as in the domain of Classroom Organization (Exhibit 29). In contrast, the Instructional Support domain was in the low to low-mid range. These findings

American Institutes for Research The Impact of Transitional Kindergarten in California—31
are consistent with trends observed in other large-scale studies using the CLASS tool, which indicate that even though Emotional Support and Classroom Organization are often of moderate to high quality in prekindergarten classrooms; Instructional Support is typically at a lower level of quality (Barnett, Lamy, & Jung, 2005; National Center on Quality Teaching and Learning, 2012; Office of the Administration for Children and Families Early Childhood Learning and Knowledge Center, n.d.; U.S. Department of Health and Human Services, 2016). This pattern is seen in early elementary classrooms as well (see, for example, Ponitz, Rimm-Kaufman, Grimm, & Curby, 2009).
Exhibit 29. Scores of TK Classrooms on CLASS Domains, 2014–15
Note. n = 184.
Another specific aspect of teacher–child interactions that has been shown to support student learning is student scaffolding (Hogan & Pressley, 1997; van de Pol, Volman, & Beishuizen, 2010) Scaffolding is characterized by a teacher’s awareness of an individual student’s needs and response that supports and expands the student’s learning. Scaffolding, which includes strategies such as helping students expand on their answers and thoughts, linking classroom activities to students’ lives and experiences, and following students’ interests, is considered a developmentally appropriate practice for supporting young children’s learning (Copple, Bredekamp, Korelak, & Charner, 2013; National Association for the Education of Young Children, 2009).
Using the Emerging Academics Snapshot (Ritchie, Howes, Kraft-Sayre, & Weiser, 2002) to capture instructional approaches during direct observations of TK classrooms, we found relatively little evidence of routine scaffolding of students’ learning (Exhibit 30). During the course of two-hour observations, scaffolding was observed only 17% of the time. More common was the use of a didactic approach to instruction, in which teachers present content to students directly, or ask students closed-ended questions.
5.5 5.4
2.5
0
1
2
3
4
5
6
7
Emotional Support Classroom Organization Instructional Support

American Institutes for Research The Impact of Transitional Kindergarten in California—32
Exhibit 30. Percentage of Time Teachers Engage in Scaffolding or Didactic Instruction, 2014–15
Note. n = 184.
Instructional Approaches to Meet the Special Needs of Young Learners
In addition to interactive and responsive instruction, we examined other features of TK classroom instruction that may make it “age and developmentally appropriate” for students in their prekindergarten years.
Student Grouping and Choice
First, allowing students to follow their interests and have some choice in their activities supports the development of children’s curiosity and independence (Denton, 2005; Neuman, Copple, & Bredekamp, 2000) and may be more supportive of their social development (National Association for the Education of Young Children, 2009; Schweinhart & Weikart, 1988). TK teachers reported giving their students opportunities to engage in student-selected activities (e.g., free choice time, in which students select what they would like to do) for about 30% of their classroom time, on average. In addition, TK teachers reported that their students spend about the same amount of time in whole-group activities, which offer fewer opportunities for individualized learning.
Students in standalone TK classrooms spent significantly less time in a whole-group setting and significantly more time engaging in student-selected activities than did their peers in TK/K combination classrooms (Exhibit 31). This finding is consistent with reports from the first year of TK implementation, where we also found that the proportions of the day TK/K combination students spent in whole-group, small-group, teacher-selected individual activities, and student-selected activities were similar to time spent by their peers in standalone kindergarten classrooms (Quick et al., 2014).
0%
10%
20%
30%
40%
50%
60%
70%
Scaffolding Didactic Without Scaffolding
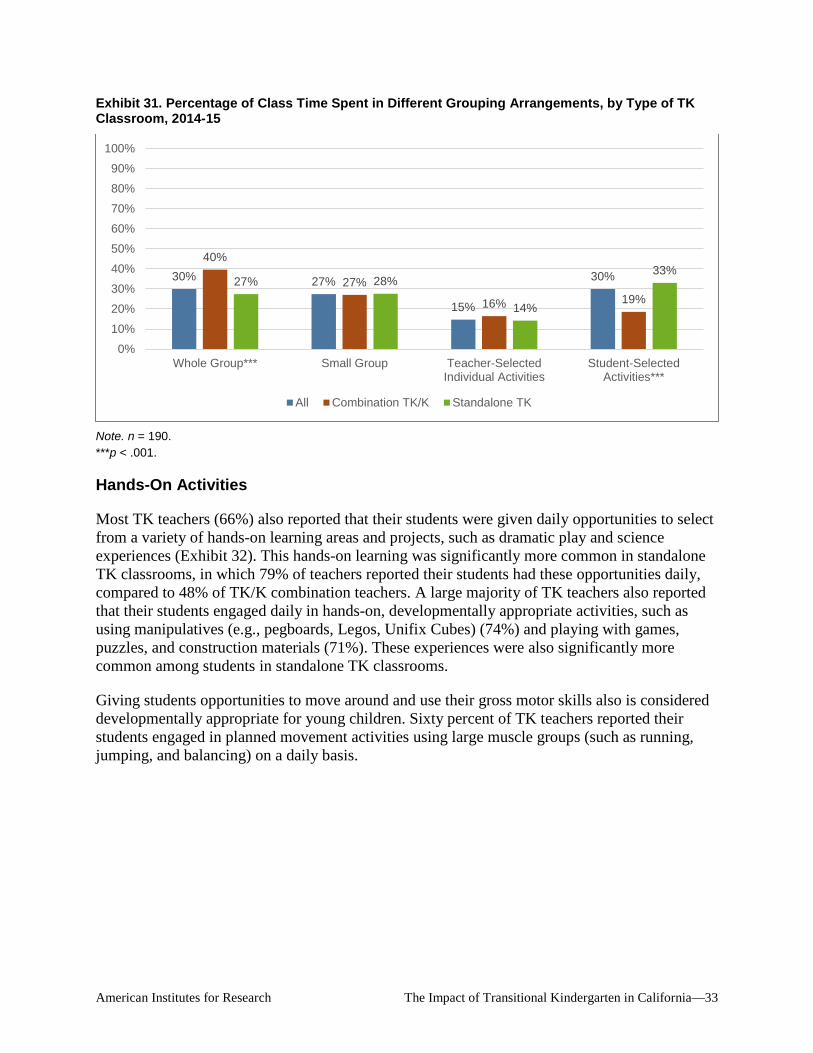
American Institutes for Research The Impact of Transitional Kindergarten in California—33
Exhibit 31. Percentage of Class Time Spent in Different Grouping Arrangements, by Type of TK Classroom, 2014-15
Note. n = 190. ***p < .001.
Hands-On Activities
Most TK teachers (66%) also reported that their students were given daily opportunities to select from a variety of hands-on learning areas and projects, such as dramatic play and science experiences (Exhibit 32). This hands-on learning was significantly more common in standalone TK classrooms, in which 79% of teachers reported their students had these opportunities daily, compared to 48% of TK/K combination teachers. A large majority of TK teachers also reported that their students engaged daily in hands-on, developmentally appropriate activities, such as using manipulatives (e.g., pegboards, Legos, Unifix Cubes) (74%) and playing with games, puzzles, and construction materials (71%). These experiences were also significantly more common among students in standalone TK classrooms.
Giving students opportunities to move around and use their gross motor skills also is considered developmentally appropriate for young children. Sixty percent of TK teachers reported their students engaged in planned movement activities using large muscle groups (such as running, jumping, and balancing) on a daily basis.
30% 27%
15%
30%40%
27%
16% 19%27% 28%
14%
33%
0%
10%
20%
30%
40%
50%
60%
70%
80%
90%
100%
Whole Group*** Small Group Teacher-SelectedIndividual Activities
Student-SelectedActivities***
All Combination TK/K Standalone TK

American Institutes for Research The Impact of Transitional Kindergarten in California—34
Exhibit 32. Percentage of TK Teachers Reporting Their Students Spend Time on Different Developmentally Appropriate Activities at Least Daily, by Type of TK Classroom, 2014–15
Note. n = 190. *** p < .001.
Differentiated Instruction
Particularly for the 24% of classrooms that were TK/K combinations in 2015, which served students spanning a wide age range, teachers faced the challenge of differentiating instruction to meet their students’ individual learning needs. And 20% of these combination teachers strongly agreed that differentiation was “impossible” given the range of needs or size of the class, compared to a similar proportion (17%) of standalone TK teachers who reported similar challenges with differentiation (Exhibit 33). Overall, however, most TK teachers reported that they were able to individualize instruction to meet student learning needs (55% strongly agreed with this statement), suggesting some, but perhaps not a high level, of differentiation in TK classrooms overall. TK/K combination teachers were more likely than standalone TK teachers to strongly agree that they use ability rather than age to guide their differentiation practices, suggesting somewhat more differentiation in combination classrooms.
74% 71%66%
60%
33%
66%
51% 48% 49%
19%
80%86%
79%69%
44%
0%10%20%30%40%50%60%70%80%90%
100%
Usemanipulatives***
Play with games,puzzles,
constructionmaterials***
Select from a varietyof learning areas
(e.g., dramatic play,science)***
Do plannedmovement activitiesusing large muscles
Draw, paint, workwith clay or other art
media***
All Combination TK/K TK standalone

American Institutes for Research The Impact of Transitional Kindergarten in California—35
Exhibit 33. Percentage of TK Teachers Reporting They Strongly Agree With Statements About Their Use of Differentiated Instruction for Their Students, by Type of TK Classroom, 2014–15
Note. n = 190.
Balanced Curriculum
In addition, amid concerns that kindergarten has become too academic (e.g., Bassok & Rorem, 2013), TK teachers in California have the opportunity to provide a more balanced curriculum, with more opportunities for art and music to round out instruction on reading and mathematics. We find that TK teachers were indeed providing more than just reading and mathematics instruction. Although teachers reported that the largest percentage of the day was spent on reading instruction (27%) and mathematics instruction (18%), 17% of the day is dedicated to social-emotional learning—a critically important area of focus for prekindergarteners. TK teachers also report spending more than 10% of their time on music (12%) and art (11%) during the course of the week, suggesting some balance in the curriculum on academic and nonacademic content.
This balance was less common among TK/K combination classrooms, in which teachers reported spending up to 67% of instructional time on reading and mathematics. In contrast, standalone TK teachers spent up to only 39% of the time across these two subjects, devoting a significantly greater percentage of time to social-emotional learning, music, art, and social studies than in TK/K combination classrooms (Exhibit 34). This finding may reflect the intention of the California Legislature for the TK curriculum to be aligned with the California Preschool Learning Foundations developed by the California Department of Education (California Department of Education, 2016).
55.3%63.7%
18.4%
59.5%68.4%
20.3%
52.3%60.4%
17.1%
0%10%20%30%40%50%60%70%80%90%
100%
I individualize instruction to ensurethat I meet individual student
learning needs.
I use student ability level ratherthan age to guide my practice.*
Differentiating instruction for all mystudents is impossible, given the
range of needs or size of my class.
All Combination TK/K Standalone TK

American Institutes for Research The Impact of Transitional Kindergarten in California—36
Exhibit 34. Content of Instruction, by Type of TK Classroom, 2014–15
Note. n = 180. *p < .05. ***p < .001.
The Impact of TK Instructional Variables on Student Outcomes
To evaluate the relative benefits of being enrolled in TK classrooms in which teachers engage in particular instructional strategies compared with those classrooms in which teachers do not use those strategies, we can compare the impact estimates for students in each context. Only one variable emerged as significantly moderating the impact of the program: teachers’ endorsement of the statement “Differentiating instruction for all my students is impossible, given the range of needs or size of my class”. Students who attended TK in classrooms in which the teacher believed that differentiation was possible (disagreed that differentiation was “impossible”) showed a greater effect of TK on letter and word identification at kindergarten entry than students who were in TK classrooms where teachers believed the differentiation was impossible. It may be that teachers with more positive views of differentiation are more effective at implementing it in a way that supports learning. Overall, however, we found that other variations in teacher–child interactions and instructional approaches, in TK classrooms, as they were measured for this study, did not significantly moderate the impact of TK (see Appendix G for details on this analysis). In other words, variations in quality on these measures did not make TK significantly more or less effective; TK was generally beneficial across the board, regardless of differences in these instructional practices.
Quality Features That Are Consistent Across TK Programs
Overall, these analyses did not reveal any structural or process quality features of TK classrooms that made TK more or less effective. Small differences in structure or instructional approach within the TK program as it is currently designed do not significantly moderate the program’s impact. This is surprising, given what we know from prior research about the importance of classroom structure and instructional approaches in prekindergarten settings. There may be
27%
18% 17%12%
8% 11% 10%
41%
26%
8% 7% 7% 7% 7%
23%16% 19%
14%8%
12% 10%
0%
10%
20%
30%
40%
50%
60%
70%
80%
90%
100%
Reading*** Mathematics*** SocialEmotional*
Music*** Science Art*** Social Studies*
All Combination TK/K Standalone TK

American Institutes for Research The Impact of Transitional Kindergarten in California—37
additional indicators of quality that we were not able to capture with our measures that would better differentiate high-impact programs from lower impact programs. But, it also may be that the features that set TK apart from the typical prekindergarten experience may instead be the key factors driving the program’s impact. That is, the critical quality elements that drive impacts may be common to all (or most) TK classrooms: (1) TK is led by credentialed teachers with bachelor’s degrees, (2) TK is structured to facilitate a smooth transition to kindergarten, and (3) TK is not an income-targeted program; it is universally available to all (age-eligible) students regardless of family income. Each of these quality characteristics is discussed in the sections that follow, although we cannot determine if these aspects of TK are in fact driving the impacts of TK observed because there is little or no variation in them.
TK Teachers Are Highly Qualified
Well-trained, well-educated teachers are critical to children’s learning. Recognizing this link, the California quality rating and improvement system (QRIS) awards the maximum rating to early learning programs with lead teachers holding bachelor’s degrees (California Department of Education, 2015). Higher levels of education have been shown to be related to knowledge of child development and teacher beliefs (Goble et al., 2015), but, overall, the literature examining the benefits of holding a bachelor’s degree on the quality of instruction or on children’s learning outcomes is inconclusive (Karoly, 2012; Messan Setodji, Le, & Schaack, 2012; Zaslow, Tout, Halle, Whittaker, & Lavelle, 2010). A meta-analysis of the four most effective state preschool programs identified bachelor’s degree–level teachers as an essential element of effective prekindergarten education (Minervino, 2014), however, limitations in the research has meant that the question has not been rigorously tested.
Unfortunately, we cannot determine whether holding a bachelor’s degree is behind the benefits of TK because all TK teachers in California, being certified elementary teachers, hold a bachelor’s degree. In addition, 96% of TK teachers reported having an elementary (multiple subject) teaching credential. These well-educated teachers may have the training to better incorporate effective instructional strategies with young children, but we cannot test this.
TK teachers also are paid on the same scale as other elementary teachers in their districts, according to their education level and years of experience. Although elementary teacher salaries are not high relative to other professional careers, they are typically significantly higher than salaries for preschool teachers. Professional-level salaries are generally viewed an essential element of successful early learning programs (Minervino, 2014) as they may help recruit and retain highly skilled teachers.
In addition to having a bachelor’s degree, all TK teachers reported participating in professional development activities throughout the year to support their ongoing learning and instructional practice, and 82% of TK teachers reported participating in at least some professional development activities focused specifically on topics related to teaching TK. In addition, 65% of teachers

American Institutes for Research The Impact of Transitional Kindergarten in California—38
reported that they had earned some units in early childhood education or child development as of the 2014–15 school year.5 Exhibit 35 presents information about TK teacher qualifications.
Exhibit 35. Percentage of TK Teachers With Various Qualifications, 2014–15
Note. n = 129.
By Design, TK Promotes a Smooth Transition to Kindergarten
Supportive transitions into, and continued alignment with, kindergarten are important for children’s success in elementary school and beyond (for a review of the literature, see Drummond et al., 2016). By design, TK naturally promotes a smooth transition to kindergarten. The literature emphasizes the importance of alignment across prekindergarten and kindergarten in several different ways.
First, prekindergarten and kindergarten content standards should be aligned, ensuring that connections can be made from one year to the next and key ideas can be reinforced and extended (e.g., Minervino, 2014; Scott-Little & Reid, 2010). TK teachers are required to use a “modified kindergarten curriculum” (Governor’s State Advisory Council on Early Learning and Care, 2013) and thus one that is guided by kindergarten standards. This is an indication of clear alignment built into the TK legislation. But, alignment does not mean that the curriculum should be the same, and, in fact, the legislation indicates that that modifications to the curriculum should make it “age and developmentally appropriate,” encouraging alignment rather than duplication.
Second, there should be alignment in prekindergarten and kindergarten instruction and expectations for students to ensure a smooth transition (New, Palsha, & Ritchie, 2009). Given that most TK teachers have taught kindergarten in previous years, they are likely very familiar with
5 With the passage of SB 876, which requires new TK teachers (as of 2015) to have an early childhood teacher permit, 24 units of early childhood education or child development, or equivalent preschool teaching experience, we expect more TK teachers will be earning early childhood education units in future years as part of their ongoing professional development.
100%96%
100%
82%
0%
10%
20%
30%
40%
50%
60%
70%
80%
90%
100%
Holds a bachelor's degree Holds a multiple subjectsteaching credential
Participated in someprofessional development
in the past year
Participated inprofessional development
on TK in the past year

American Institutes for Research The Impact of Transitional Kindergarten in California—39
instruction in kindergarten and expectations that students will face once they enter kindergarten. Thus, they are well positioned to prepare TK students for kindergarten and facilitate that transition.
Third, to ensure ongoing alignment and articulation, prekindergarten/TK and kindergarten teachers should have opportunities to engage together in planning and learning through joint meetings and professional development experiences (e.g., Shore, 2009). Not surprisingly, given that TK and kindergarten teachers often work in the same building together, joint planning and professional development time with kindergarten teachers are quite common for TK teachers. The majority of TK teachers report collaborating with kindergarten teachers during common planning time (66%) or during joint professional development time (75%).
Finally, specific transition activities to introduce preschool students to kindergarten environments and expectations have been linked to greater kindergarten success (LoCasale-Crouch, Mashburn, Downer, & Pianta, 2008; Schulting, Malone, & Dodge, 2005). One key element of this transition is familiarity with the elementary school campus. Because TK classrooms are all located in district school buildings and, with only a few exceptions, on elementary school campuses, TK graduates may naturally experience greater comfort at the start of kindergarten compared to students who received their prekindergarten experience at a different site, thus paving the way for a smooth transition and ultimately greater success in kindergarten.
TK Is a Universal Program for Age-Eligible Children
Segregating students by income has been shown to have detrimental effects on both academic and social-emotional outcomes, in schooling in general (Bowman, 2013; Mickelson & Bottia, 2010; Palardy, 2013; Rumberger & Palardy, 2005) and in early education specifically (Kainz & Pan, 2014; Reid & Ready, 2013; Schechter & Bye, 2007; Schwartz, 2010). A recent study at Columbia University showed that most preschool programs—perhaps because many of them are targeted, means-tested programs—are quite segregated by income (Reid & Kagan, 2015). Students in preschools with high concentrations of poverty have fewer opportunities to reap the benefits of more advanced language development and learning opportunities observed in programs with a more diverse pool of students (Henry & Rickman, 2007; Neidell & Waldfogel, 2010). Some studies have even identified “spillover effects,” in which more disadvantaged students benefit in kindergarten from being in a class with students who have had high-quality pre-kindergarten experiences (Dodge, Bai, Ladd, & Muschkin, 2016). TK is a program for which students from all income levels are eligible and attend for free and may thus confer benefits through peer effects in both TK and kindergarten.
Summary Although they share many characteristics, TK classrooms are not all the same. For example, most are structured as standalone TK classrooms, although about one quarter have TK students combined in a class with kindergarten students. Most are also full-day classes. Teacher–child interactions as measured by the CLASS tool were similar to other prekindergarten classrooms; on average, TK teachers provided moderately high-quality instruction in the CLASS domains of Emotional Support and Classroom Organization and received scores in the low to low-mid range on Instructional Support. The use of instructional practices considered to be developmentally appropriate for young students varied notably.

American Institutes for Research The Impact of Transitional Kindergarten in California—40
To understand what features of TK programs and classrooms are most effective, the study team examined the impact of TK for students who attended classrooms with different characteristics. Although research on early childhood education quality has suggested that student–teacher ratios, teacher–child interactions as measured by the CLASS tool, and developmentally appropriate instructional practices matter for student learning and growth, these analyses suggest that there is little to no variation in the effect of the TK program for students from TK classrooms that vary in these practices. It may be that the features that all TK programs have in common—bachelor’s degree–level teachers with kindergarten teaching experience, structures that facilitate transitions to kindergarten, and available to students at all income levels—are what is primarily driving the programs’ impact. However, additional exploration is needed in this area.
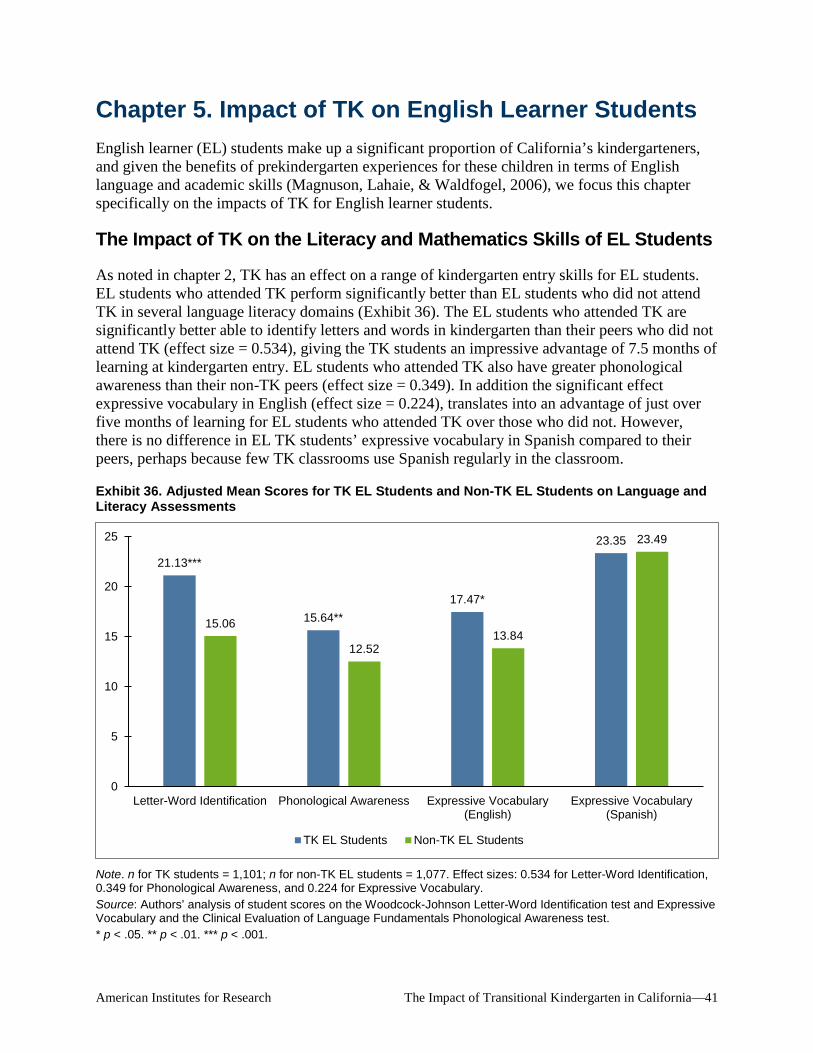
American Institutes for Research The Impact of Transitional Kindergarten in California—41
Chapter 5. Impact of TK on English Learner Students English learner (EL) students make up a significant proportion of California’s kindergarteners, and given the benefits of prekindergarten experiences for these children in terms of English language and academic skills (Magnuson, Lahaie, & Waldfogel, 2006), we focus this chapter specifically on the impacts of TK for English learner students.
The Impact of TK on the Literacy and Mathematics Skills of EL Students
As noted in chapter 2, TK has an effect on a range of kindergarten entry skills for EL students. EL students who attended TK perform significantly better than EL students who did not attend TK in several language literacy domains (Exhibit 36). The EL students who attended TK are significantly better able to identify letters and words in kindergarten than their peers who did not attend TK (effect size = 0.534), giving the TK students an impressive advantage of 7.5 months of learning at kindergarten entry. EL students who attended TK also have greater phonological awareness than their non-TK peers (effect size = 0.349). In addition the significant effect expressive vocabulary in English (effect size = 0.224), translates into an advantage of just over five months of learning for EL students who attended TK over those who did not. However, there is no difference in EL TK students’ expressive vocabulary in Spanish compared to their peers, perhaps because few TK classrooms use Spanish regularly in the classroom.
Exhibit 36. Adjusted Mean Scores for TK EL Students and Non-TK EL Students on Language and Literacy Assessments
Note. n for TK students = 1,101; n for non-TK EL students = 1,077. Effect sizes: 0.534 for Letter-Word Identification, 0.349 for Phonological Awareness, and 0.224 for Expressive Vocabulary. Source: Authors’ analysis of student scores on the Woodcock-Johnson Letter-Word Identification test and Expressive Vocabulary and the Clinical Evaluation of Language Fundamentals Phonological Awareness test. * p < .05. ** p < .01. *** p < .001.
21.13***
15.64**17.47*
23.35
15.06
12.5213.84
23.49
0
5
10
15
20
25
Letter-Word Identification Phonological Awareness Expressive Vocabulary(English)
Expressive Vocabulary(Spanish)
TK EL Students Non-TK EL Students

American Institutes for Research The Impact of Transitional Kindergarten in California—42
TK also shows an effect on EL students’ mathematics knowledge and problem-solving skills at kindergarten entry (Exhibit 37). TK gives EL students an advantage at the beginning of kindergarten on both basic mathematical concepts and symbols (quantitative concepts assessment, effect size = .385) and on problem-solving skills (applied problems assessment, effect size = .319) compared to their non-TK peers. This effect on problem-solving skills translates into an advantage of almost six months of learning over EL students who did not attend TK. Exhibit 37. Adjusted Mean Scores for TK EL Students and Non-TK EL Students on Mathematics Assessments
Note. n for TK EL students = 1,117. n for non-TK EL students = 1,153. Effect sizes: 0.319 for Applied Problems and 0.385 for Quantitative Concepts. Source: Authors’ analysis of student scores on the Woodcock-Johnson Quantitative Concepts and Applied Problems tests. * p < .01. ** p < .001.
Effect of TK: English and Spanish Assessments Combined
Although the large majority of students were able to take the assessment in English, 102 of the 6,241 students assessed received the assessment entirely in Spanish (46 students in fall 2014 and 56 students in fall 2015). The developers of the Woodcock-Johnson subtests (Letter-Word Identification, Applied Problems, and Quantitative Concepts) equated the Spanish and English assessments so that the scores can be transformed and put on the same scale to be analyzed together as “W scores” for each subtest (see Appendix D for more details). When we add the data from the small number of students who received the full assessment in Spanish with the data from the majority of students who were assessed in English, we again find that the data confirm the positive impact of TK on students’ literacy and mathematics skills (Exhibit 38), regardless of whether they are sufficiently proficient in English to be assessed in English.
17.22*
9.93**
14.82
8.52
0
5
10
15
20
25
Applied Problems Quantitative Concepts
TK EL Students Non-TK EL Students
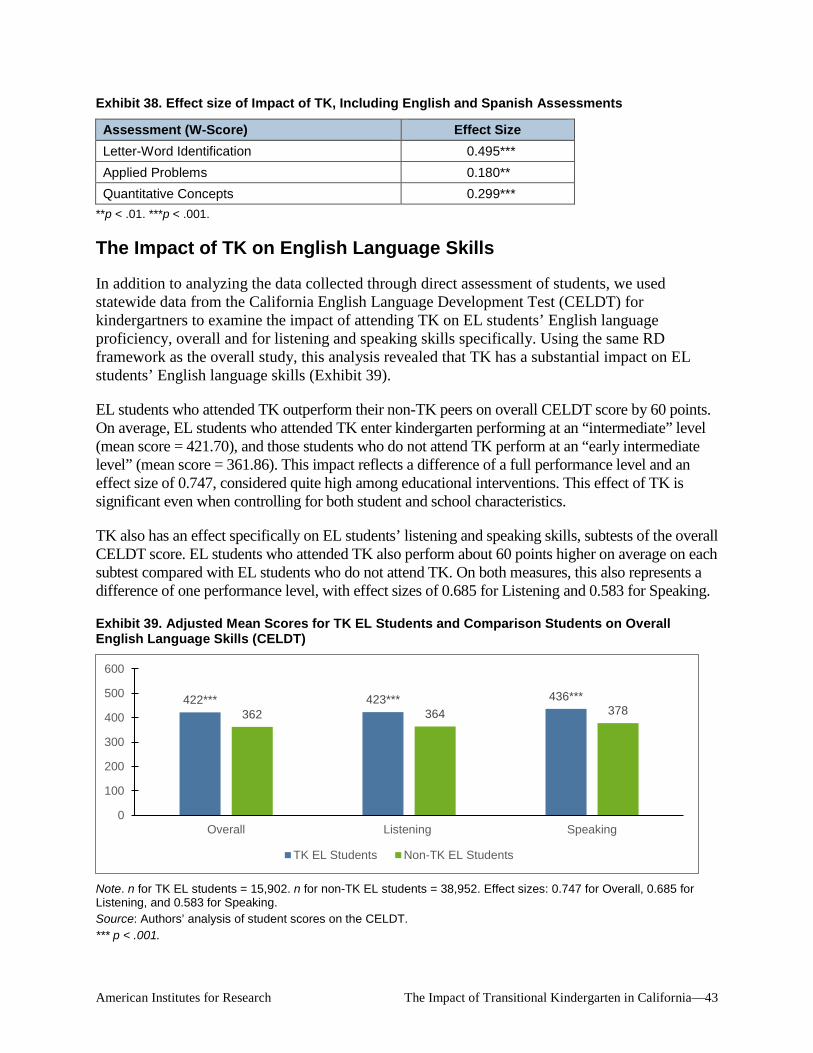
American Institutes for Research The Impact of Transitional Kindergarten in California—43
Exhibit 38. Effect size of Impact of TK, Including English and Spanish Assessments
Assessment (W-Score) Effect Size Letter-Word Identification 0.495*** Applied Problems 0.180** Quantitative Concepts 0.299***
**p < .01. ***p < .001.
The Impact of TK on English Language Skills
In addition to analyzing the data collected through direct assessment of students, we used statewide data from the California English Language Development Test (CELDT) for kindergartners to examine the impact of attending TK on EL students’ English language proficiency, overall and for listening and speaking skills specifically. Using the same RD framework as the overall study, this analysis revealed that TK has a substantial impact on EL students’ English language skills (Exhibit 39).
EL students who attended TK outperform their non-TK peers on overall CELDT score by 60 points. On average, EL students who attended TK enter kindergarten performing at an “intermediate” level (mean score = 421.70), and those students who do not attend TK perform at an “early intermediate level” (mean score = 361.86). This impact reflects a difference of a full performance level and an effect size of 0.747, considered quite high among educational interventions. This effect of TK is significant even when controlling for both student and school characteristics.
TK also has an effect specifically on EL students’ listening and speaking skills, subtests of the overall CELDT score. EL students who attended TK also perform about 60 points higher on average on each subtest compared with EL students who do not attend TK. On both measures, this also represents a difference of one performance level, with effect sizes of 0.685 for Listening and 0.583 for Speaking.
Exhibit 39. Adjusted Mean Scores for TK EL Students and Comparison Students on Overall English Language Skills (CELDT)
Note. n for TK EL students = 15,902. n for non-TK EL students = 38,952. Effect sizes: 0.747 for Overall, 0.685 for Listening, and 0.583 for Speaking. Source: Authors’ analysis of student scores on the CELDT. *** p < .001.
422*** 423*** 436***362 364 378
0
100
200
300
400
500
600
Overall Listening Speaking
TK EL Students Non-TK EL Students

American Institutes for Research The Impact of Transitional Kindergarten in California—44
Impact of TK for Specific Language Groups
Spanish-speaking students represent the largest population of EL students in California; according to the California Department of Education, nearly 84% of EL students are Spanish speaking.6 To investigate whether TK has a similar impact for these Spanish-speaking students and for EL students who speak other languages, we estimated the effect of TK on English language proficiency for different language groups separately.
First, we considered this largest group of EL students. Spanish-speaking EL students who attended TK outperform their peers who did not attend TK on all CELDT assessments examined (Exhibit 40), producing an advantage of a full performance level, or about 60 points, on average, for overall, listening, and speaking scores, consistent with results for the overall EL population.
Exhibit 40. Adjusted Mean Scores for Spanish-Speaking TK EL Students and Non-TK EL Students on English Language Skills (CELDT)
Note. n for TK EL students = 13,373. n for non-TK EL students = 31,637. Effect sizes: 0.746 for Overall, 0.678 for Listening, and 0.589 for Speaking. Source: Authors’ analysis of student scores on the CELDT. *** p < .001.
Next, we examined scores for EL students who speak an Asian language at home. Since Asian language-speaking students are not a homogenous group, we examined the impact of TK for language subgroups organized by region in Asia. Using United Nations classifications, we defined five regions in Asia (Exhibit 41). Given that populations within these regions share some characteristics such as economic and educational opportunities, we examine the impacts of TK by these region designations.
6 http://www.cde.ca.gov/ds/sd/cb/cefelfacts.asp
418*** 420*** 433***358 361 374
0
100
200
300
400
500
600
Overall Listening Speaking
Spanish
TK EL Students Non-TK EL Students

American Institutes for Research The Impact of Transitional Kindergarten in California—45
Exhibit 41. Asian Language Regions
Note. Results for Central Asian language-speakers are not presented due to their small sample size.
TK shows a significant impact on CELDT scores for all Asian language groups. For most of these students, TK has a robust effect equivalent to a two-performance-level advantage for TK students over their non-TK peers on overall and listening scores (Exhibit 42). Southeast Asian language speakers who attended TK outperform their non-TK peers by one performance level. For example, among East Asian language-speaking EL students, overall CELDT performance in kindergarten was at an “early advanced” level for those who attended TK, which means that these students are typically able to identify and summarize most concrete details and abstract concepts, and oral language is more elaborate. In contrast, their non-TK peers performed at an “early intermediate” level where oral language is typically limited to phrases and memorized statements (California Department of Education, n.d.).

American Institutes for Research The Impact of Transitional Kindergarten in California—46
Exhibit 42. Adjusted Mean Scores for Asian Language-Speaking TK EL Students and Non-TK EL Students on English Language Skills (CELDT)
Note. Sample sizes: South Asian TK = 471, South Asian Non-TK = 1,047; East Asian TK = 612, East Asian Non-TK = 2,108; Southeast Asian TK = 878, Southeast Asian Non-TK = 2,245; West Asian/Middle Eastern TK = 288, West Asian/Middle Eastern Non-TK = 683. Effect sizes: 0.989 for South Asian Overall, 1.047 for South Asian Listening, 0.655 for South Asian Speaking; 1.155 for East Asian Overall, 1.023 for East Asian Listening, 0.971 for East Asian Speaking; 0.597 for Southeast Asian Overall, 0.545 for Southeast Asian Listening, 0.445 for Southeast Asian Speaking; and 0.898 for West Asian/Middle Eastern Overall, 0.986 for West Asian/Middle Eastern Listening, and 0.598 for West Asian/Middle Eastern Speaking. Though effects appear larger for some groups than others, no significance testing was conducted between effect sizes; we do not know if the effect of TK on one Asian language group is statistically different from the effect on another language group. Source: Authors’ analysis of student scores on the CELDT. *** p < .001.
Summary
Consistent with overall study results, TK has an impact on EL students’ language, literacy, and mathematics skills at kindergarten entry. In addition, using the statewide CELDT data, TK confers a particularly strong advantage for EL students on speaking, listening, and overall English language skills. This advantage is clearly present for all language groups tested: Spanish, East Asian, South Asian, Southeast Asian, and West Asian/Middle Eastern. Results suggest that TK
463*** 464*** 476***
392 386 416
0
100
200
300
400
500
Overall Listening Speaking
South Asian462*** 462*** 472***
375 379 382
0
100
200
300
400
500
Overall Listening Speaking
East Asian
432*** 430*** 447***382 379 402
0
100
200
300
400
500
Overall Listening Speaking
Southeast Asian
441*** 448*** 452***
368 366 387
0
100
200
300
400
500
Overall Listening Speaking
West Asian/Middle Eastern
TK EL Students Non-TK EL Students

American Institutes for Research The Impact of Transitional Kindergarten in California—47
may play an important role in improving academic outcomes for EL students, because students who start school with stronger academic skills tend to do better over time (Duncan et al., 2007).
There is, however, some interesting variation in impact of TK for EL students. EL students who attended TK do not show an advantage over their peers in terms of social skills or executive function. And, although there is a positive impact of TK on academic outcomes at kindergarten entry, by the spring of the kindergarten year, significant effects for EL students are no longer observed (see Chapter 3). We do not yet have students’ scores on the CELDT in later grades to look at the progression of English language skills through the elementary years; it remains to be seen how these results will play out over time. Further research is needed to see what gains may be associated with TK participation in later academic years.

American Institutes for Research The Impact of Transitional Kindergarten in California—48
Chapter 6. Conclusions and Policy Implications This study found that TK significantly improves students’ readiness for kindergarten. TK students outperformed non-TK students in terms of language and literacy skills, demonstrating a learning advantage of up to six months on letter and word identification. TK also benefited students’ math skills—both in terms of knowledge of quantitative concepts and problem-solving skills. TK improved students’ engagement in learning, though no other statistically significant differences between TK and non-TK students were detected in terms of other teacher-rated social skills or executive function (when both study cohorts were combined). Thus, the benefit of TK over other types of preschool programs appears to be primarily in supporting students’ academic skills at kindergarten entry. The study also examined the effect of the program for specific groups of students. Results suggest an important lesson: TK has a positive impact on all students. Economically disadvantaged students, Hispanic students, and English learners who attended TK all show consistent advantages over their peers who did not attend TK across all academic outcome measures. English learner students who attended TK also demonstrated a dramatic advantage in English language proficiency over their non-TK peers. More advantaged students also benefited from TK in terms of several academic outcomes, and for higher income students and non-Hispanic White students, TK improved self-control as well.
Some of these benefits persist until the end of kindergarten, although the benefits are smaller in magnitude. Specifically, the impact of TK on students’ literacy skills is still evident at the end of kindergarten, and marginally significant effects on knowledge of mathematics concepts and symbols and on expressive vocabulary are observed as well. It is not unexpected that non-TK students show some “catch up” in kindergarten, because teachers may focus their attention on students who need the most support to be ready for first grade. In addition, we know that some recent studies have found that the benefits of prekindergarten programs may not persist into later elementary school (e.g., Bogard & Takanishi, 2005; Li et al., 2013; Lipsey et al., 2015; Puma et al., 2012); these results suggest that this narrowing of the advantage of early education may begin as early as the kindergarten year.
However, some groups of students, most notably economically disadvantaged students, continue to benefit from TK at the end of the kindergarten year. Former TK students who were eligible for free or reduced-price lunch continued to demonstrate an advantage over their non-TK peers in terms of literacy skills, knowledge of math concepts and symbols, and math problem-solving skills at the end of kindergarten. Hispanic TK students also maintain their advantage in math in the spring. However, teacher ratings of Hispanic TK students’ self-control decreases over the course of the year, perhaps because of their segregated school environments or peers with lower levels of preschool experience. TK graduates who show the most continued growth in kindergarten are in classrooms in which teachers believe differentiation is possible and use strategies for providing differentiated instruction, such as grouping students by ability level and teaching more advanced content to students who are ready.
The impact of TK is also notably robust to variations in approach. In other words, characteristics that research has suggested are related to child outcomes in early childhood education programs, in general, did not moderate the effect of TK in this study’s analyses. We detected no differential impacts for students in classrooms varying in features often thought to indicate quality—in terms

American Institutes for Research The Impact of Transitional Kindergarten in California—49
of classroom structure (stand-alone TK versus TK/K combination), teacher–student ratios, teacher–student interactions (CLASS scores), use of developmentally appropriate practice, and the extent to which differentiated instruction is used. Although these commonly-valued quality features are important in early childhood education contexts, it may be that the unique characteristics of the TK program have a stronger influence on TK outcomes. Thus, rather than being changed by small differences in classroom practices, the impact of TK may be driven primarily by the critical characteristics that all TK programs have in common: highly qualified, well-paid teachers; a “universal” program available to students from all socio-economic categories (i.e., not means tested); and strong support for the transition to kindergarten facilitated by having TK classrooms located primarily on elementary school campuses and close connections between TK and kindergarten teachers.
Next Steps for Policy Consideration
Findings of this evaluation suggest that TK should continue to be offered as a “universal” program—that is, available to students from all socio-economic groups, at least within age guidelines. All students benefited from the TK program in its current form—with students from all demographic groups attending their first year of a two-year kindergarten program with a credentialed teacher holding a bachelor’s degree and close connections to the kindergarten context. Furthermore, classroom quality characteristics that are usually associated with improved child outcomes in other early childhood education studies did not moderate the impact of TK in these analyses, suggesting that TK’s universality and strong teacher qualifications—something all TK programs have in common regardless of classroom practice—may be partly behind the program’s effectiveness.
There is room to improve TK in California, however. First, the lack of impact on executive function and social-emotional outcomes suggests that more attention could be given to these developmental skills and behaviors. Center-based preschool programs, attended by over 80% of the comparison sample, appear to be equally effective at supporting these skills. In addition, there is more work to be done to continue to support the learning for TK graduates in kindergarten and beyond. The continued success of TK students depends on their continued access to high-quality learning experiences in early elementary grades, something the field is still working to understand (Phillips et al., 2017). The smaller effects on academic outcomes noted at the end of the year as well as the lower teacher ratings on self-control observed for Hispanic students suggest a need for more effort to provide differentiated learning experiences for students who enter at a higher level of performance than their peers. These may be avenues for further consideration for teacher professional development experiences.
Future Research Needs
Effectiveness of TK for Younger Students
Some school districts in the state have begun to provide TK to younger students who are economically disadvantaged, permitted by Assembly Bill 104 signed in 2015. This program, called Expanded TK (ETK), is sometimes structured to include students with later birth dates (such as in December or January) in existing TK classrooms and sometimes as a standalone classroom for these younger students, allowing for more age-appropriate instruction. According to interviews AIR conducted with staff in 17 of the 20 study districts, as of the summer of 2016, however, most districts had not elected to extend TK enrollment past the three-month eligibility

American Institutes for Research The Impact of Transitional Kindergarten in California—50
window specified by state guidance. Overall, only four districts in the study sample reported some enrollment of younger students, and they varied widely in scope. For example, one district administrator reported that they enrolled three or four students who turned five after December 2 in their regular TK classrooms. Another district administrator reported enrolling a substantial number of students in its new program, which provides a separate classroom for the younger students and a 2:24 teacher to student ratio. This district admitted students for ETK based on the students’ eligibility for free or reduced-price lunch programs. However, in most places, TK enrollment still included only those children born between September 2 and December 2.
Although this study has demonstrated a robust effect of the TK program, within its original narrow eligibility age range, on students’ kindergarten readiness skills, it is not yet known how the TK program would impact younger students who are currently being served by some districts through an ETK program. Additional research is needed to understand the impacts of an ETK approach on student learning and to identify the classroom practices and structural characteristics that are most effective with younger 4-year-olds in a TK context.
Further Exploration of the Longer-Term Impact of TK and the Role of Social-Emotional Skills
Given the research base, many observers of the TK program rollout have perhaps rightly stressed the importance of a developmentally appropriate learning environment for the young students attending TK. This concern has often meant calling for low student-to-teacher ratios, play-based classrooms, and child-directed learning, among other characteristics. This study’s analyses did not find a significant relationship between these features of TK programs and the program’s impact. There was no difference in the program’s impact between high- and low-ratio classrooms or between those classrooms with a more or less child-directed learning focus. However, the program’s impact was primarily limited to academic skills. A critical question is how these early academic advantages, gained through participation in a structured school-based program, fare over time. On the other hand, could TK programs with a stronger focus (and effect) on students’ executive function and social skills show more of an impact on a variety of student outcomes over the long term? Additional research is thus also needed to understand the longer term advantages of the TK program and the relationship between program characteristics and such trends.
Further Exploration of the Factors Contributing to TK’s Effectiveness
Finally, deeper research is needed to understand the lack of relationships found in this study between several commonly used measures of quality in early childhood education classrooms and the impact of the TK program. Additional in-depth qualitative case study research to further examine the classroom contexts and practices in which TK students do best may be helpful to understand specifically what makes particular classrooms effective in supporting students’ success.
American Institutes for Research The Impact of Transitional Kindergarten in California—51
References Andrews, R. J., Jargowsky, P., & Kuhne, K. (2012). The effects of Texas’s targeted pre-
kindergarten program on academic performance (CALDER Working Paper No. 84). Washington, DC: American Institutes for Research.
Araujo, M. C., Carneiro, P., Cruz-Aguayo, Y., & Schady. (2016). Teacher quality and learning outcomes in kindergarten (IDB Working paper series no. IDB-WP-665). Retrieved from https://publications.iadb.org/bitstream/handle/11319/7425/Teacher-Quality-Learning-Outcomes-Kindergarten.pdf?sequence=1
Bassok, D., & Rorem, A. (2013, April). Is kindergarten the new first grade? The changing nature of kindergarten in the age of accountability. Charlottesville, VA: University of Virginia. Retrieved from http://curry.virginia.edu/uploads/resourceLibrary/20_Bassok_Is_Kindergarten_The_New_First_Grade.pdf
Barnett, W. S. (2004). The state of preschool: 2003 state preschool yearbook.
Barnett, W. S., Lamy, C., & Jung, K. (2005). The effects of state prekindergarten programs on young children's school readiness in five states. New Brunswick, NJ: National Institute for Early Education Research.
Barnett, W. S. (2008). Preschool education and its lasting effects: Research and policy implications. Boulder, CO, & Tempe, AZ: Education and the Public Interest Center & Education Policy Research Unit. http://nepc.colorado.edu/files/PB-Barnett-EARLY-ED_FINAL.pdf.
Barnett, W.S., Jung, K., Youn, M., & Frede, E.C. (2013). Abbott Preschool Program Longitudinal Effects Study: Fifth Grade Follow-Up. National Institute for Early Education Research. Retrieved from http://nieer-www1.rutgers.edu/sites/nieer/files/APPLES%205th%20Grade.pdf.
Barnett, W. S., & Yarosz, D. J. (2007). Who goes to preschool and why does it matter? National Institute for Early Education Research Policy Brief, 15.
Bauer, L., & Schanzenbach, D. W. (2016). The long-term impact of the Head Start program. The Hamilton Project. Retrieved from http://www.hamiltonproject.org/papers/the_long_term_impacts_of_head_start
Bogard, K., & Takanishi, R. (2005). PK-3: An aligned and coordinated approach to education for children 3 to 8 years old. Social Policy Report 19(3). Retrieved from http://files.eric.ed.gov/fulltext/ED521747.pdf
Bowman, N. A. (2013). How much diversity is enough? The curvilinear relationship between college diversity interactions and first-year student outcomes. Research in Higher Education 54(8), 874–894.

American Institutes for Research The Impact of Transitional Kindergarten in California—52
California Department of Education. (2015). California quality continuum framework rating matrix. Sacramento, CA: Author. Retrieved from http://www.cde.ca.gov/sp/cd/rt/caqrisratingmatrix.asp
California Department of Education. (2016). Kindergarten in California. Retrieved from http://www.cde.ca.gov/ci/gs/em/kinderinfo.asp
California Department of Education. (2016, June 29). California English Language Development Test—CalEd Facts (Website). Retrieved from http://www.cde.ca.gov/ta/tg/el/cefceldt.asp
California Department of Education. (n.d.-a). English learners. (Website). Retrieved from http://www.cde.ca.gov/sp/el/
California Department of Education. (n.d.-b). Facts about English learners in California—CalEdFacts (Website). Retrieved from http://www.cde.ca.gov/ds/sd/cb/cefelfacts.asp
Camilli, G., Sadako, V., Ryan, S., & Barnett, W. S. (2010). Meta-analysis of the effects of early education interventions of cognitive and social development. Teachers College Record, 112(3), 579–620.
Cannon, J. (2009). Just the facts: Full-day kindergarten in California. San Francisco, CA: Public Policy Institute of California. Retrieved from http://www.ppic.org/content/pubs/jtf/JTF_FullDayKJTF.pdf
CELDT proficiency levels. (n.d). Retrieved from https://web.stanford.edu/~hakuta/Courses/Ed388%20Website/Assignments%202008/Assignment_2/CELDT%20Proficiency%20Level%20Descriptions%20copy.pdf
Chang, H. N., & Romero, M. (2008). Present, engaged, and accounted for: The critical importance of addressing chronic absence in the early grades. New York, NY: National Center for Children in Poverty.
Child Trends. (2015). Full day kindergarten. Washington, DC: Child Trends. Retrieved from https://www.childtrends.org/wp-content/uploads/2013/06/102_Full-day-kindergarten.pdf
Clements, D. H., & Sarama, J. (2007). Early childhood mathematics learning. In F. K. Lester (Ed.), Second handbook of research on mathematics teaching and learning (pp. 461–555). Charlotte, NC: Information Age.
Copple, C., Bredekamp, S., Koralek, D. G., & Charner, K. (Eds.). (2013). Developmentally appropriate practice: Focus on preschoolers. Washington, DC: National Association for the Education of Young Children.
DataQuest, California Department of Education. (n.d.). 2016-17 Enrollment by English language acquisition status (ELAS) and grade. Retrieved from http://dq.cde.ca.gov/dataquest/longtermel/ELAS.aspx?cds=00&agglevel=State&year=2016-17

American Institutes for Research The Impact of Transitional Kindergarten in California—53
Denton, P. (2005). Learning through academic choice. Turners Falls, MA: Northeast Foundation for Children.
Dodge, K. A., Bai, Y., Ladd, H. F., & Muschkin, C. G. (2016). Impact of North Carolina’s early childhood programs and policies on educational outcomes in elementary school. Child Development 88(3), 996–1014.
Duncan, G. J., Dowsett, C. J., Claessens, A., Magnuson, K., Huston, A. C., Klebanov, P., … Japel, C. (2007). School readiness and later achievement. Developmental Psychology, 43(6), 1428–1446. http://dx.doi.org/10.1037/0012-1649.43.6.1428
Drummond, K., Holod, A., Perrot, M., Wang, A., Munoz-Miller, M., & Turner, H. (2016). Preschool through third grade alignment and differentiated instruction: A literature review. Washington, DC: American Institutes for Research. Prepared for: Office of Planning, Evaluation, and Policy Development, U.S. Department of Education.
Gresham, F. M., & Elliott, S. N. (2008). Social skills improvement system rating scales manual. Minneapolis, MN: NCS Pearson.
Governor’s State Advisory Council on Early Learning and Care. (2013). Transitional kindergarten implementation guide: A resource for California public school district administrators and teachers. Sacramento, CA: Author. Retrieved from http://www.cde.ca.gov/ci/gs/em/documents/tkguide.pdf
Henry, G. T., & Rickman, D. K. (2007). Do peers influence children’s skill development in preschool? Economics of Education Review, 26(1), 100–112.
Hogan, K., & Pressley, M. (1997). Scaffolding student learning: Instructional approaches and issues. Cambridge, MA: Brookline.
Howes, C., Burchinal, M., Pianta, R., Bryant, D., Early, D., Clifford, R., & Barbarin, O. (2008). Ready to learn? Children's pre-academic achievement in pre-kindergarten programs. Early Childhood Research Quarterly, 23(1), 27–50.
Hustedt, J. T., Barnett, W., Jung, K., & Friedman, A. H. (2010). The New Mexico PreK evaluation: Impacts from the fourth year (2008-2009) of New Mexico’s state-funded prek program. New Brunswick, NJ: National Institute for Early Education Research.
Jenkins, J. M., Watts, T. W., Magnuson, K., Clements, D., Sarama, J., Wolfe, C., & Spitler, M. (2015). Preventing preschool fadeout through instructional intervention in kindergarten and first grade. Graduate School of Education, University of California, Irvine.
Kainz, K., & Pan, Y. (2014). Segregated school effects on first grade reading gains: Using propensity score matching to disentangle effects for African-American, Latino, and European-American students. Early Childhood Research Quarterly, 29(4), 531–537.
Karoly, L. A. (2012). A golden opportunity: Advancing California’s early care and professional development system. MG-1188. Santa Monica, CA: RAND Corporation.

American Institutes for Research The Impact of Transitional Kindergarten in California—54
Karoly, L. A., & Bigelow, J. H. 2005. The economics of investing in universal preschool education in California. Santa Monica, CA: RAND.
La Paro, K. M., Pianta, R. C., & Stuhlman, M. (2004). The Classroom Assessment Scoring System: Findings from the prekindergarten year. Elementary School Journal, 104(5), 409–426.
Laosa, L. M., & Ainsworth, P. (2007). Is public Pre-K preparing Hispanic Children to succeed in school? (Preschool Policy Brief). Retrieved from nieer.org/wp-content/uploads/2012/04/13
Li, W., Farkas, G., Duncan, G. J., Burchinal, M. R., & Vandell, D. L. (2013). Timing of high-quality child care and cognitive, language, and preacademic development. Developmental Psychology, 49(8), 1440–1451. doi:http://dx.doi.org/10.1037/a0030613.
Lindsey, K., & Howard, M. (2013). Access to preschool for Hispanic and Latino children. Retrieved from https://firstfocus.org/wp-content/uploads/2014/04/Latino-Access-to-Pre-K.pdf
Lipsey, M. W., Farran, D. C., & Hofer, K. G. 2015. A randomized control trial of the effects of a statewide voluntary prekindergarten program on children’s skills and behaviors through third grade (Research Report). Nashville, TN: Vanderbilt University, Peabody Research Institute.
Loeb, S., Bridges, M., Bassok, D., Fuller, B., & Rumberger, R. (2005). How much is too much? The influence of preschool centers on children’s development nationwide. Paper presented at the Association for Policy Analysis and Management, Washington, D.C.
LoCasale-Crouch, J., Mashburn, A. J., Downer, J. T., & Pianta, R. C. (2008). Pre-kindergarten teachers’ use of transition practices and children's adjustment to kindergarten. Early Childhood Research Quarterly, 23(1), 124–139.
Magnuson, K., Lahaie, C., & Waldfogel, J. (2006). Preschool and school readiness of children of immigrants. Social Science Quarterly, 87, 1241–1262. doi:10.1111/j.1540-6237.2006.00426.x
Mamedova, S., & Redford, J. (2015). Early childhood program participation, from the National Household Education Surveys Program of 2012 (NCES 2013-029.REV). Washington, DC: National Center for Education Statistics, Institute of Education Sciences, U.S. Department of Education.
Manship, K., Quick, H., Holod, A., Mills, N., Ogut, B., Chernoff, J., Blum, J., Hauser, A., Anthony, J., and Gonzalez, R. (2015). Impact of California’s Transitional Kindergarten Program, 2013-14. San Mateo, CA: American Institutes for Research.
Mariano, L. T., & Kirby, S. N. (2009). Achievement of students in multigrade classrooms. Institute of Education Sciences, RAND Education.
Mashburn, A. J., Pianta, R. C., Hamre, B. K., Downer, J. T., Barbarin, O. A., Bryant, D., ... & Howes, C. (2008). Measures of classroom quality in prekindergarten and children’s development of academic, language, and social skills. Child Development, 79(3), 732–749.

American Institutes for Research The Impact of Transitional Kindergarten in California—55
Meyer, L. A., Wardrop, J. L., Hastings, C. N., & Linn, R. L. (1993). Effects of ability and settings on kindergarteners’ reading performance. Journal of Educational Research, 86(3), 142–160.
Mickelson, R. A., & Bottia, M. (2010). Integrated education and mathematics outcomes: A synthesis of social science research. North Carolina Law Review, 88(3), 993–1089.
Minervino, J. (2014). Lessons from research and the classroom. Seattle, WA: Bill & Melinda Gates Foundation.
Moats, L. (2001). Overcoming the language gap. American Educator, 25, 4–9.
Mokrova, I., Broekhuizen, M., & Burchinal, M. (2015). Pre-kindergarten and kindergarten Classroom quality and children’s social and academic skills in early elementary grades. Evanston, IL: Society for Research on Educational Effectiveness.
Neidell, M., & Waldfogel, J. (2002). Cognitive and noncognitive peer effects in early education. The Review of Economics and Statistics, 92, 562–576.
National Association for the Education of Young Children. (2009). Developmentally appropriate practice in early childhood programs serving children from birth through age 8 (Position Statement). Washington, DC: Author. Retrieved from http://www.naeyc.org/files/naeyc/file/positions/PSDAP.pdf
Neuman, S., Copple, C., & Bredekamp, S. (2000). Learning to read and write: Developmentally appropriate practices for young children. Washington DC: National Association for the Education of Young Children.
Ong, W., Allison, J., & Haladyna, T. M. (2000). Student achievement of 3rd-graders in comparable single-age and multiage classrooms. Journal of Research in Childhood Education, 14(2), 205–215.
Orfield. (2015). Segregating California’s Future: Inequality and Its Alternative 60 Years after Brown Vs. Board of Education. Los Angeles CA: The Civil Rights Project.
Palardy, G. J. (2013). High school socioeconomic segregation and student attainment. American Educational Research Journal, 50(4), 714–754.
Phillips, D.A., Gormley, W., & Anderson, S. (2016). The Effects of Tulsa’s CAP Head Start Program on Middle-School Academic Outcomes and Progress. Developmental Psychology, 52(8), 1247-1261.
Phillips, D. A., Lipsey, M. W., Dodge, K. A., Haskins, R., Bassok, D., Burchinal., M. R., … Weiland, C. (2017). The current state of scientific knowledge on pre-kindergarten effects. Washington DC: Brookings Institution.
Pianta, R., LaParo, K., & Hamre, B. (2008). Classroom Assessment Scoring System: K–3. Baltimore, MD: Paul H. Brookes.
American Institutes for Research The Impact of Transitional Kindergarten in California—56
Ponitz, C. C., McClelland, M. M., Matthews, J. S., & Morrison, F. J. (2009). A structured observation of behavioral regulation and its contributions to kindergarten outcomes. Developmental Psychology, 45(3), 605–619. doi: 10.1037/a0015365
Ponitz, C., Rimm-Kaufman, S. E., Grimm, K. J., & Curby, T. W. (2009). Kindergarten classroom quality, behavioral engagement, and reading achievement. School Psychology Review, 38(1), 102–120.
Puma, M., Bell, S., Cook, R., Heid, C., Broene, P., Jenkins, F., … Downer, J. 2012. Third grade follow-up to the Head Start Impact Study Final Report (OPRE Report # 2012-45). Washington, DC: Office of Planning, Research and Evaluation, Administration for Children and Families, U.S. Department of Health and Human Services.
Quick, H., Manship, K., Gonzalez, R., Holod, A., Cadigan, M., Anthony, J., … Mercado-Garcia, D. (2014). Study of California’s Transitional Kindergarten Program: Report on the first year of implementation. San Mateo, CA: American Institutes for Research.
Reid, J. L., & Kagan, S. L. (2015). A better start: Why classroom diversity matters in early education. New York, NY: National Center for Children and Families.
Reid, J. L., & Ready, D. D. (2013). High-quality preschool: The socio-economic composition of preschool classrooms and children’s learning. Early Education and Development, 24(8), 1082–1111.
Reyes, M. R., Brackett, M. A., Rivers, S. E., White, M., & Salovey, P. (2012, March 5). Classroom emotional climate, student engagement, and academic achievement. Journal of Educational Psychology. doi: 10.1037/a0027268
Reynolds, A. J., Temple, J. A., Ou, S.-R., Robertson, D. L., Mersky, J. P., Topitzes, J. W., & Niles, M. D. (2007). Effects of a school-based early childhood intervention on adult health and well-being: A 19-year follow-up of low-income families. Archives of Pediatric and Adolescent Medicine, 161(8), 730–739.
Reynolds, A. J., Richardson, B. A., Hayakawa, M., Lease, E. M., Warner-Richter, M., Englund M. M., … Sullivan, M. (2014). Association of a full-day vs part-day preschool intervention with school readiness, attendance, and parent involvement. JAMA, 312(20), 2126–2134.
Rimm-Kaufman, S. E., La Paro, K. M., Downer, J. T., & Pianta, R. C. (2005). The contribution of classroom setting and quality of instruction to children’s behavior in kindergarten classrooms. Elementary School Journal, 105(4), 377–394.
Ritchie, S., Howes, C., Kraft-Sayre, M., & Weiser, B. (2002). Emerging academics snapshot. Los Angeles, CA: University of California Los Angeles.
Robin, K. B., Frede, E. C., & Barnett, W. S. (2006). Is more better? The effects of full-day vs. half-day preschool on early school achievement. New Brunswick, NJ: National Institute for Early Education Research. Retrieved from http://nieer.org/wp-content/uploads/2016/08/IsMoreBetter.pdf

American Institutes for Research The Impact of Transitional Kindergarten in California—57
Rumberger, R. W., & Palardy, G. J. (2005). Does segregation still matter? The impact of student composition on academic achievement in high school. Teachers College Record, 107(9), 1999–2045.
Schechter, C., & Bye, B. (2007). Preliminary evidence for the impact of mixed-income preschool on low-income children’s language growth. Early Childhood Research Quarterly 22(1), 137–146
Schmitt, S. A., Pratt, M. E., & McClelland, M. M. (2014). Examining the validity of behavioral self-regulation tools in predicting preschoolers’ academic achievement. Early Education and Development, 25(5), 641–660. doi: 10.1080/10409289.2014.850397
Schulting, A. B., Malone, P. S., & Dodge, K. A. (2005). The effect of school-based kindergarten transition policies and practices on child academic outcomes. Developmental Psychology, 41(6), 860.
Schwartz, H. (2010). Housing policy is school policy: Economically integrative housing promotes academic success in Montgomery County, Maryland. New York, NY: The Century Foundation.
Schweinhart, L. J., & Weikart, D. P. (1988). Education for young children living in poverty: Child-initiated learning or teacher-directed instruction? The Elementary School Journal, 89(2), 221–225.
Scott-Little, C., & Reid, J. (2010). Aligning the content of early childhood care and education. In S. L. Kagan & K. Tarrant (Eds.), Transitions for young children: Creating connections across early childhood systems (pp. 109-133). Baltimore, MD: Brookes.
Setodji, C. M., Le, V. N., & Schaack, D. (2012). Accounting for movement between childcare classrooms: Does it change teacher effects interpretations? Journal of Applied Developmental Psychology, 33(1), 1–12.
Slavin, R., & Cheung, A. (2005). A synthesis of research on language of reading instruction for English language learners. Review of Educational Research, 75(2), 247–284. Retrieved from rer.sagepub.com/content/75/2/247.full.pdf
Snow, C., Burns, S., & Griffin, P. (1998). Preventing reading difficulties in young children. Washington, DC: National Research Council.
U.S. Department of Education, National Center for Education Statistics, Early Childhood Longitudinal Study, Kindergarten Class of 2010-11 (ECLS-K:2011) Restricted-Use Data File.
van de Pol, J., Volman, M., & Beishuizen, J. (2010). Scaffolding in teacher–student interaction: A decade of research. Educational Psychology Review, 22(3), 271–296.
Veenman, S. (1995). Cognitive and noncognitive effects of multigrade and multi-age classes: A best-evidence synthesis. Review of Educational Research, 65(4), 319–381.

American Institutes for Research The Impact of Transitional Kindergarten in California—58
von Suchodoletz, A., Gestsdottir, S., Wanless, S. B., McClelland, M. M., Birgisdottir, F., Gunzenhauser, C., & Ragnarsdottir, H. (2013). Behavioral self-regulation and relations to emergent academic skills among children in Germany and Iceland. Early Childhood Research Quarterly, 28(1), 62–73. http://dx.doi.org/10.1016/j.ecresq.2012.05.003
Watts, T. W., Duncan, G. J., Chen, M., Claessens, A., Davis-Kean, P. E., Duckworth, K., … Susperreguy, M. I. (2015). The role of mediators in the development of longitudinal mathematics achievement associations. Child Development, 86, 1892–1907. doi:10.1111/cdev.12416
Zaslow, M., Tout, K., Halle, T., Whittaker, J. V., & Lavelle, B. (2010). Toward the identification of features of effective professional development for early childhood educators: Literature review. Washington, DC: Child Trends. Prepared for U.S. Department of Education; Office of Planning, Evaluation and Policy Development; Policy and Program Studies Service.

American Institutes for Research The Impact of Transitional Kindergarten in California—A-1
Appendix A. Sample Selection and Recruitment Sample Selection
To select districts, schools, and students to participate in this study, we began by defining the population of school districts eligible for study. We used several inclusion criteria in order to achieve the required sample size and maximize the statistical power of the research study. To be included, districts had to:
1. Be a regular school district (i.e., one not run by a county office of education)
2. Be in operation in the 2013–14 school year
3. Have at least 10 TK-age children during the 2012–13 school year
4. Follow state guidelines for enrolling students in TK and include no more than 5% of their TK students who were born after the December 2 cutoff (i.e., technically ineligible)
5. Enroll at least 60% of their age-eligible students in TK
Using the resulting sampling frame, we assigned districts to sampling strata, defined by district urbanicity and the proportion of English learner students enrolled in the district. We selected a sample of 94 districts; the two largest districts in the state were included with certainty. Districts were randomly ordered within strata for recruitment. We continued to recruit study districts from this pool of 94, beginning with the districts that had the smallest random number assigned and continuing as needed to the largest random numbers, until we reached the number of districts needed to reach the needed sample of schools and students.
Exhibit A1 shows how the sample of participating districts compares with California districts overall in terms of size and urbanicity. Fewer small districts and rural districts were included in our sample because these types of districts enroll fewer students and were excluded for the sample so that we could more efficiently reach the number of schools and students needed for the sample. However, the sample of districts included in the study does include broad representation from geographic regions across the state and from districts with varied student demographics.
Exhibit A1. Characteristics of TK Study Districts Compared With All Districts in California
Sample (n = 20)
California (n = 942)
District Size Small 0.0% 33.6% Medium 30.0% 33.1% Large 70.0% 33.3% Urbanicity Urban or suburban 60.0% 44.2% Not urban or suburban 40.0% 55.8%
All schools that offered TK within participating districts were invited to be part of the study, except in one large school district that had more schools than were needed for the study design.

American Institutes for Research The Impact of Transitional Kindergarten in California—A-2
In that district, schools were stratified based on their TK classroom configurations. Schools that offered TK in single-grade classrooms and schools that offered TK in combination with kindergarten or other grade levels were both invited to participate in the study, although schools with combination classrooms were oversampled to allow for later subgroup analyses by classroom type. To ensure a balanced student sample that would be representative of the state, schools in that district were selected based on student demographic characteristics—namely, the proportion of English learners and students eligible for free or reduced-price lunch.
All students with birthdates between October 2 and February 2 in participating schools were invited to take part in the study. This birthdate range represents a window of 60 days before and after the December 2 TK eligibility cutoff. To recruit students, the study team sent consent forms to all students with birthdates in this range to schools. Teachers received a $10 gift card for every consent form from their classroom returned, and parents received a $10 gift card for returning the form, regardless of whether they elected to participate. Across the two cohorts of data collection, we invited 12,385 students into our study; 7,994 returned consent forms and 6,225 of these agreed to participate (50% of those invited). The resulting sample for the study consists of 6,225 students, of whom 6,040 have outcome data.
Exhibit A2. Number of Students Recruited and Participating in the Study
Number of Students Cohort 1 Cohort 2 Total Invited to participate in the study 5,897 6,488 12,385 Returned consent form 3,924 4,070 7,994 Agreed to participate on the consent form 2,910 3,315 6,225 Participated in data collection 2,864 3,176 6,040
Child Assessment Sample
The sample of students who participated in study data collection were broadly representative of the state (see Exhibit A3). The TK and comparison groups were also very similar, with no notable differences in demographic characteristics between these two groups, after controlling for age (see Exhibit A4.) The study team also considered prior early education experiences among TK and comparison students (see Exhibit A5). As context for our findings, it is important to note that more than 80% of students in the comparison group in both cohorts attended some type of center-based preschool program the year before kindergarten (while TK students were enrolled in TK), according to parent reports. And, more than half of all students in the comparison group in both cohorts attended their preschool program for at least 15 hours per week (roughly equivalent in duration to half-day TK). Many of these students also attended a center-based preschool program two years before kindergarten as well. However, more TK-eligible students attended a center-based preschool program two years before kindergarten (in the year before they attended TK) than students in the comparison group in Cohort 2. In both cohorts, students who were eligible for TK were more likely to have attended a center-based preschool for more than 15 hours per week during the year before TK than the comparison group. (See Appendix E for additional exploratory analyses excluding students with prior ECE experience.)

American Institutes for Research The Impact of Transitional Kindergarten in California—A-3
Exhibit A3. Characteristics of the TK Study Sample Compared to the California Kindergarten Population (Where Available), by Cohort
Cohort 1 Cohort 2 Sample
n = 2,909 California
n = 511,985 Sample
n = 3,332 California
n = 530,531 Female 49.2% 48.2% 50.4% 48.5% Race/Ethnicity
White 26.9% 23.2% 28.0% 23.0% Hispanic 55.8% 55.5% 53.5% 55.4% Asian 10.9% 8.1% 12.1% 8.3% Black 4.2% 5.3% 4.6% 5.3% Other 2.2% 7.9% 1.8% 8.0%
Free or reduced-price lunch eligibility 58.9% 58.6% 60.1% 58.9% English learner 42.0% 35.2% 37.9% 34.0% Spanish home language 36.7% NA 35.2% NA Special education 7.1% 7.1% 4.2% 7.3% Parental education
Less than high school diploma 13.4% 19% 11.7% 19% High school diploma 20.6% 23% 19.6% 23% Some college 17.1% 24% 16.5% 24% Vocational certificate or AA 17.7% NA 18.8% NA College degree 17.3% 20% 17.2% 20% Graduate education 13.9% 13% 16.3% 13%
Note. NA = not available. Free or reduced-price lunch data are not available by grade level. The most recent comparison data for parental education is 2012–13 and is only available for parents of all students K–12 statewide. Data are not available for vocational certificates or AA degrees: http://api.cde.ca.gov/Acnt2013/2013GrthStAPIDC.aspx?allcds = 0000000. Sources: Authors’ analysis of statewide student data for academic year 2014–15 obtained through DataQuest (http://data1.cde.ca.gov/dataquest/), student record data from participating districts, and parent survey data.

American Institutes for Research The Impact of Transitional Kindergarten in California—A-4
Exhibit A4. Demographic Characteristics of Students in the TK and Comparison Samples
Cohort 1 Cohort 2 TK Group n = 1,591
Comparison Group
n = 1,318
TK Group n = 1,792
Comparison Group
n = 1,540 Mean age (as of 9/1/2014 for Cohort 1 and 9/1/2015 for Cohort 2) 5.83*** 5.66 5.83*** 5.66
Female 50.2% 48.0% 50.2% 50.7% Race/ethnicity
White 26.2% 27.8% 30.0% 25.7% Hispanic 55.2% 56.5% 52.4% 54.8% Black 4.5% 3.9% 4.0% 5.2% Asian 11.8% 9.9% 11.5% 12.8% Other 2.4% 2.0% 2.1% 1.5%
Free and reduced-price lunch eligibility 59.4% 58.3% 59.4% 61.0% English learner 44.1% 39.4% 39.6% 36.0% Special education 7.2% 7.0% 4.6% 3.9% Parental education
Less than high school diploma 13.2% 13.7% 11.3% 12.1% High school diploma 20.2% 21.1% 18.9% 20.3% Some college 16.7% 17.5% 16.1% 17.0% Vocational certificate or AA 17.4% 18.2% 18.9% 18.6% Graduated from college 18.5% 15.9% 17.5% 16.8% Graduate education 14.1% 13.7% 17.2% 15.2%
Note. Table displays unadjusted means and percentages, but the significance testing for all variables except age adjusts for student age. Source: Authors' analysis of student record data from participating districts and parent survey data. *p < .05. ***p < .001.
Exhibit A5. Prior Preschool Experience of Students in the TK and Comparison Samples
Cohort 1 Cohort 2
TK Group n = 1,591
Comparison Group
n = 1,318 TK Group n = 1,792
Comparison Group
n = 1,540 Attended center-based preschool in the year before kindergarten
N/A (Attended TK) 80.7% N/A
(Attended TK) 80.9%
Attended center-based preschool in the year before kindergarten for at least 15 hours per week
N/A (Attended TK) 51.1% N/A
(Attended TK) 56.2%
Attended center-based preschool 2 years before kindergarten 75.7% 65.1% 78.3%** 64.7%
Attended center-based preschool 2 years before kindergarten for at least 15 hours per week
46.3% * 35.1% 50.5%* 39.4%
Note. The table displays unadjusted percentages, but the significance testing adjusts for student age. Source: Authors’ analysis of parent survey data. * p < .05. ** p < .01.

American Institutes for Research The Impact of Transitional Kindergarten in California—A-5
Teacher Survey Sample
To gather additional information about TK teacher and classroom characteristics, AIR administered surveys to teachers of standalone TK and TK/K combination classrooms in the spring of the 2013–14 and 2014–15 school years. The study team administered surveys to kindergarten and first-grade teachers who had consented students in their classrooms in the fall and spring of the 2014–15 and 2015–16 school years. Exhibits A6 and A7 show the characteristics of teacher survey respondents.
Exhibit A6. Characteristics of TK Teachers Who Completed Surveys
Characteristic Cohort 1 n = 194
Cohort 2 n = 206
Certification Type
Multiple Subject 94.9% 94.6% Single Subject 4.5% 6.2% CLAD - Cross-cultural, Language, and Academic Development 53.4% 58.9% BCLAD - Bilingual Cross-cultural, Language, and Academic Development 27.5% 25.6%
Special Education 3.9% 5.4% Substitute 3.4% 7.0% Emergency 3.4% 4.7% California Child Development Teacher Permit 1.1% 5.4% Child Development Associate 1.1% 0.8% Other certificates and/or credentials 11.8% 8.5% Years of Teaching Experience on Average, by Grade
Any Grade (total average years of experience) 15.5 17.0 Preschool or Head Start 1.6 1.4 Transitional Kindergarten 0.6 1.3 Kindergarten 6.9 7.2 Transitional/Pre-1st Grade 0.1 0.4 1st Grade 2.5 2.9 2nd-6th grades summed 3.4 3.7 English as a Second Language Program 0.9 1.0 Bilingual Education Program 0.9 1.0 Special Education Program 0.5 0.5 Grade Taught Last Year
Preschool or Head Start 0.6% 1.6% Transitional kindergarten 56.8% 71.2% Kindergarten 61.5% 32.8% Transitional/Pre-first grade 0.6% 1.6% Grade 1 7.7% 9.6% Grades 2–6 summed 5.3% 4.8%

American Institutes for Research The Impact of Transitional Kindergarten in California—A-6
Characteristic Cohort 1 n = 194
Cohort 2 n = 206
English as a second language program 2.4% 1.6% Bilingual education program 0.6% 0.8% Special education program 1.8% 0.0% Teacher's Home Language
English 63.3% 70.3% Spanish 25.4% 25.8% Cantonese 1.7% 0.8% Mandarin 0.6% 0.0% Tagalog 0.0% 0.0% Vietnamese 1.1% 0.8% Other 8.5% 2.3% Highest Level of Education Completed
Four-year college degree 25.4% 24.8% Some graduate school 22.0% 28.7% MA or MS degree 52.0% 45.7% Specialist degree 0.6% 0.8% Classroom Type
TK/K combination class 58.2% 46.8% Full-day class 75.7% 74.9% Average Number of Students in Classroom 21.8 22.6
Exhibit A7. Characteristics of Kindergarten and First-Grade Teachers Who Completed Surveys
Cohort 1 n = 649
Cohort 2 n = 715
Certification Type
Multiple Subject 93.8% 94.9% Single Subject 4.3% 5.1% CLAD: Cross-cultural, Language, and Academic Development 57.8% 56.8% BCLAD: Bilingual Cross-cultural, Language, and Academic Development 21.9% 23.0%
Special education 8.4% 4.4% Substitute 4.4% 5.9% Emergency 3.2% 4.7% California Child Development Teacher Permit 1.8% 1.8% Child Development Associate 0.4% 0.3% Other certificates and/or credentials 11.2% 10.6%
Years of Teaching Experience, by Grade
Any grade (total average years of experience) 16.0 16.6 Preschool or Head Start 1.1 1.1

American Institutes for Research The Impact of Transitional Kindergarten in California—A-7
Cohort 1 n = 649
Cohort 2 n = 715
Transitional Kindergarten 0.5 0.5 Kindergarten 9.1 9.2 Transitional/Pre-first grade 0.1 0.3 Grade 1 3.7 4.2 Grades 2–6 summed 4.2 4.0 English as a second language program 1.9 2.0 Bilingual education program 1.4 1.6 Special education program 1.3 0.7
Grade Taught Last Year
Preschool or Head Start 0.7% 0.3% Transitional Kindergarten 12.3% 10.3% Kindergarten 77.7% 76.2% Transitional/Pre-first grade 0.6% 0.5% Grade 1 17.3% 17.1% Grades 2–6 summed 7.9% 9.0% English as a second language program 3.5% 3.3% Bilingual education program 1.5% 1.7% Special education program 5.0% 2.6%
Teacher's Home Language
English 64.9% 66.3% Spanish 27.2% 25.0% Cantonese 1.4% 1.2% Mandarin 1.4% 0.9% Tagalog 0.2% 0.3% Vietnamese 0.5% 1.7% Korean 1.1% 1.1% Other 4.3% 3.9%
Highest Level of Education Completed
High school diploma or General Education Development 0.0% 0.2% Some college 0.2% 0.2% Two-year college degree 0.0% 0.0% Four-year college degree 24.2% 25.5% Some graduate school 26.1% 28.8% MA or MS degree 46.5% 42.6% PhD 0.9% 0.8% Specialist degree 2.1% 2.1%
Full-Day Class 84.3% 83.6% Average Number of Students in Classroom 22.1 22.6

American Institutes for Research The Impact of Transitional Kindergarten in California—A-8
Classroom Observation Sample
The study team observed a subset of TK classrooms in participating schools in order to understand and document the characteristics of TK classrooms. We observed 140 TK classrooms in spring 2014 (Cohort 1) of the 218 classrooms included in the study. Of the Cohort 1 classrooms observed, 61% were standalone classrooms, and 39% were combination classrooms.
In spring 2015, 167 classrooms of the 246 study classrooms were observed for Cohort 2. In this cohort, returning teachers were given priority in sampling and additional classrooms were added to ensure that the study represented enough students from combination classrooms. TK combination classrooms and specifically combination classrooms with greater numbers of TK students were given greater priority, and no more than four teachers from each participating school were observed to maximize variability at the school level. As a result, in 2015, 56% of the observed classrooms were standalone and 44% were combination classrooms.
California English Language Development Test (CELDT) Sample
The study team requested and obtained CELDT data from CDE. This extant data sample is composed of all English learner students who entered kindergarten in the state of California in academic years 2013–14 and 2014–15. Among these two cohorts of students, those who were eligible for TK had the option of attending the program in 2012-13 and 2013-14, respectively, the first two years that school districts statewide implemented TK. The analytic sample was composed of 54,854 students. Exhibit A8 displays characteristics of both the TK and comparison samples in the CELDT data. There were significant differences between groups on some of the background variables, as would be expected with such a large sample, but these were exceptionally small in magnitude- less than one percentage point.

American Institutes for Research The Impact of Transitional Kindergarten in California—A-9
Exhibit A8. Demographic Characteristics of Students in CELDT Extant Data, by TK Eligibility Status
Cohort 1 (2013-14) Cohort 2 (2014-15)
TK Group n = 15,185
Comparison Group
n = 13,389
TK Group n = 14,055
Comparison Group
n = 12,225 Mean age (as of 9/1/2014 for Cohort 1 and 9/1/2015 for Cohort 2) 5.79 *** 5.71 5.79 *** 5.70 Female 0.49 0.49 0.49 0.49 Race/Ethnicity
Asian 0.13 0.12 0.12 ** 0.11 Hispanic 0.81 0.82 0.81 0.81 White 0.04 0.03 0.04 0.04 Pacific Islander 0.00 0.00 0.00 0.00 Native American 0.00 0.00 0.00 0.00 Other Race 0.01 0.01 0.01 0.01
Home Language Spanish 0.81 0.83 0.82 0.83 * European 0.01 0.01 0.01 0.01 East Asian 0.05 0.05 0.05 0.05 Southeast Asian 0.06 ** 0.06 0.06 ** 0.05 South Asian 0.03 0.02 0.03 0.03 West Asian 0.02 * 0.02 0.02 0.02 Other languages 0.01 0.01 0.01 0.02
Note. The table displays unadjusted percentages, but the significance testing adjusts for student age. Source: Authors’ analysis of CELDT data. * p < .05. ** p < .01. *** p < .001.

American Institutes for Research The Impact of Transitional Kindergarten in California—B-1
Appendix B. Data Collection Instruments Child Assessments
Students in both the TK and comparison groups were given a battery of direct assessments in the fall and spring of their kindergarten year. Key skill areas, determined in consultation with our technical advisory group members and study partners, targeted for the study included vocabulary, phonological awareness, letter and word identification, early mathematical concepts and problem solving, and executive function. The assessment battery was assembled to ensure that students participating in the assessment had a positive experience and were not burdened by an assessment process that was too long. Therefore, we considered assessments that were quick to administer, easy to administer reliably in a school setting, validated in both English and Spanish, and reliable in measuring specific skills. Additionally, to keep students engaged and interested in the assessment, subtests were presented in an order such that there was as much variation as possible. Thus, the assessment started with language and literacy, where the students were asked first to look at pictures, clap syllables and rhyme, and then identify letters and simple sight words. Next, the assessor administered the executive function task because as described next, it required the student to stand up and move; this functioned as an effective break. Students were then administered the two mathematics assessments to conclude.
Language Skills. Vocabulary and phonological awareness were chosen for the assessment battery because both these skills relate closely to the acquisition of literacy. Vocabulary knowledge is necessary for reading comprehension, and phonological awareness helps a child to decode new words.7 Because few kindergarteners can read upon entry to kindergarten, assessing their vocabulary and phonological awareness is another way to evaluate students’ early literacy skills. Expressive vocabulary and phonological awareness were both assessed using the Clinical Evaluation of Language Fundamentals—Preschool 2 (CELF-2P) assessment. The CELF-2P is a criterion-referenced diagnostic measure consisting of nine subtests designed to identify children ages 3–6 in need of speech or communication therapy. It has been validated in Spanish, and each subtest takes approximately three to five minutes to administer.
The CELF-2P Expressive Vocabulary assessment asks students to name pictures and describe the actions depicted in pictures. The assessor scores the student’s responses, awarding either full or partial credit based on whether the student said exact target words or something similar. The target words and the most common partial credit responses are listed on the answer sheet; assessors circle the child’s answer and then assign a score. Because there is no limit to what the child might say upon seeing each picture, the assessors were trained to write down all responses that were not listed on the answer sheet before scoring them. All written responses were reviewed by the AIR team, and correct scoring was confirmed for every response. The English Expressive Vocabulary assessment is discontinued once the student misses seven consecutive items; the Spanish assessment (Vocabulario Expresivo) is terminated once the student misses five consecutive items.
7 For more information, see http://www.scholastic.com/teachers/article/understanding-vocabulary and http://www.phonologicalawareness.org/#.

American Institutes for Research The Impact of Transitional Kindergarten in California—B-2
The CELF-2P Phonological Awareness subtest asks students to complete various phonological awareness tasks such as putting together two words to make a new word (e.g., “bed” and “room” make “bedroom”) and clapping for each of the words in a sentence. Students are asked to identify and produce rhyming words. For both the Spanish and the English phonological awareness subtests, the subtest is discontinued when the student gets all the items in three consecutive sections incorrect; most students receive the entire subtest.
Early Literacy. Students’ ability to name letters and read common words was assessed using the Woodcock-Johnson III Letter-Word Identification subtest. Those students that were assessed in Spanish took the equivalent subtest in the Batería III by Woodcock-Muñoz. The Letter-Word subtest takes approximately five minutes to administer. Students are asked to point to letters named, name letters, and read sight words. The subtest is discontinued once the student misses six consecutive items.
Executive Function. Executive function is a set of cognitive skills that work in tandem to help an individual formulate and execute a plan. These skills are still developing in 5- and 6-year-old children. Research with this age group tends to focus on the following three skills: working memory, inhibition, and cognitive flexibility. The Head Toes Knees Shoulders (HTKS) activity (Ponitz et al., 2009) was included in the direct assessment because it assesses all three of these critical skills. The task consists of three parts. In the first part, the student is instructed to touch his toes when told to touch his head and to touch his head when told to touch his toes. Thus, the student must remember the rule and, at the same time, inhibit the impulse to touch the body part named. In the second part, the task is made more challenging by adding knees and shoulders. Now the student must touch his shoulders when told to touch his knees and touch his knees when told to touch his shoulders. There are four rules to remember, so the student must remember these additional rules while continuing to inhibit the impulse to follow the commands literally. The third and most challenging part of the task is when the original rules change, taking cognitive flexibility to a higher level. In this part, the student not only needs to be flexible in the rules but also must forget the rules of the previous two parts of the task and learn new rules (for example, “touch your head” now means to touch your knees). The student advances to the next part of the task when he has earned at least four points on the 10 test items in each section. Each item is scored full credit (two points) if the student goes immediately to the correct body part or partial credit (one point) if the student starts to go to the wrong body part and then self-corrects, inhibiting the initial impulse but ultimately giving the correct response.
Mathematics. With the rising emphasis in education on STEM subjects—science, technology, engineering, and mathematics—schools are beginning to introduce and build mathematics skills earlier, including understanding not only number sense and number operations but also shapes, patterns, relative comparisons, and other skills. Consequently, the direct assessments chosen for this study included measurement of multiple mathematics skills. Two subtests of the Woodcock-Johnson III and their equivalent in the Batería III (Woodcock-Munoz) were administered after the HTKS task. The Applied Problems subtest assessed students’ quantitative reasoning and mathematical knowledge, asking them to count, do basic operations, and figure out what information in a word problem is needed to solve the problem. The subtest in both English and Spanish is discontinued when the student misses six consecutive items. The final mathematics assessment administered in the assessment battery was the Woodcock-Johnson III Quantitative Concepts, which assesses students’ understanding of the number line, recognition of

American Institutes for Research The Impact of Transitional Kindergarten in California—B-3
mathematical symbols, and understanding of different types of representations. The Quantitative Concepts subtest is discontinued when the student misses four consecutive items.
Social-Emotional Skills. One goal of TK is to prepare students socially and emotionally for kindergarten, and so the study team chose to assess students’ social and emotional skills along with academic skills. However, because social-emotional skills are displayed in interaction with teachers and peers, they are hard to assess directly. Teachers are commonly asked to report on students’ social-emotional skills, so we asked students’ kindergarten8 teachers to complete selected subscales from the Social Skills Improvement System Rating Scales (SSIS; Gresham & Elliott, 2008). To minimize the burden on the teacher, only five subscales were included in the teacher survey. Three of these subscales tapped positive or prosocial behaviors: cooperation, engagement, and self-control, as well as two problem areas: internalizing behavior and externalizing behavior. These five subscales were selected in consultation with our technical advisory group members. Teachers were asked to rate students on each item using a 4-point Likert scale.
Exhibit B1 presents each student outcome measure used in the study, skills it assesses, its scale, how it was administered, and its reliability coefficient.
Exhibit B1. Measures and Psychometric Properties of Student Outcomes
Measure Skills Assessed Scale Source Reliability Language and Literacy Skills Clinical Evaluation of Language Fundamentals Preschool-2 Expressive Vocabulary subtest
Expressive vocabulary Sum of items correct Range: 0–40
Direct student assessment
.94 (Wiig, Secord, & Semel, 2004)
Clinical Evaluation of Language Fundamentals Preschool-2 Phonological Awareness subtest
Phonological awareness
Sum of items correct Range: 0–24
Direct student assessment .86 (Wiig,
Secord, & Semel, 2004) Direct
student assessment
Woodcock-Johnson Letter-Word Identification subtest
Ability to name letters and read words
Sum of items correct Range: 0–76
Direct student assessment
.94 (Schrank, McGrew, & Woodcock, 2001)
Mathematics Skills
Woodcock-Johnson Quantitative Concepts subtest
Mathematical concepts, symbols, and vocabulary
Sum of items correct Range: 0–34
Direct student assessment
.91 (Schrank, McGrew, & Woodcock, 2001)
Woodcock-Johnson Applied Problems subtest
Mathematics numeracy and basic operations
Sum of items correct Range: 0–63
Direct student assessment
.97 (Schrank, McGrew, & Woodcock, 2001)
8 In some cases, when TK students were promoted directly to first grade, first-grade teachers completed these surveys.

American Institutes for Research The Impact of Transitional Kindergarten in California—B-4
Measure Skills Assessed Scale Source Reliability Executive Functioning
HTKS assessment
Executive function (inhibitory control, attention, and working memory)
Sum of items correct Range: 0–60
Direct student assessment
.93 (McClelland, & Cameron, 2012)
Social-Emotional Skills
SSIS rating scales, Cooperation subscale
Helping others, sharing materials, and complying with rules and directions
Mean rating across items Range: 1–4
Teacher report
.81 (Crosby, 2011)
SSIS rating scales, Engagement subscale
Joining activities in progress and inviting others to join, initiating conversations, making friends, and interacting well with others
Mean rating across items Range: 1–4
Teacher report
SSIS rating scales, Self-Control subscale
Responding appropriately to conflict (e.g., disagreeing and teasing) and nonconflict situations (taking turns and compromising)
Mean rating across items Range: 1–4
Teacher report
SSIS rating scales, Externalizing subscale
Being verbally and physically aggressive, failing to control temper, and arguing
Mean rating across items (reverse coded) Range: 1–4
Teacher report
SSIS rating scales, Internalizing subscale
Feeling anxious, sad, and lonely; exhibiting poor self-esteem
Mean rating across items (reverse coded) Range: 1–4
Teacher report
Classroom Observation Instruments
To measure TK classroom characteristics, the study team used two different observation tools to guide classroom observations: the Classroom Assessment Scoring System (CLASS), and the Emerging Academics Snapshot.
CLASS
The CLASS, a well-established and nationally used observational tool developed at the University of Virginia, was used to evaluate the interactions between TK teachers and students. Using the CLASS, we examined the extent to which TK teachers provided emotional support (e.g., fostered warm, supportive relationships among teachers and students), managed classroom organization (e.g., reinforced students’ prosocial behavior), and offered instructional support (e.g., developed students’ language and conceptual skills). As shown in Exhibit B2, these three domains include a total of 10 dimensions, which are based on developmental theory and research

American Institutes for Research The Impact of Transitional Kindergarten in California—B-5
suggesting that interactions between students and adults are the primary mechanism of student development and learning (Greenberg, Domitrovich, & Bumbarger, 2001; Hamre & Pianta, 2007; Morrison & Connor, 2002; Pianta, 2006; Rutter & Maughan, 2002).
Exhibit B2. CLASS Domains and Dimensions
Each CLASS cycle includes 20 minutes of observation followed by a 10-minute period in which the observer assigns a score ranging from 1 (minimally characteristic of the evidence described) to 7 (highly characteristic) for each dimension. A domain score of 1 or 2 signifies that the quality of teacher–student interactions is low. A score of 3, 4, or 5 is considered midrange and is given when classrooms show a mix of effective interactions with periods when interactions are not effective or are absent. A score of 6 or 7 means effective teacher–student interactions are observed consistently throughout the observation period.
Emerging Academics Snapshot
The Emerging Academics Snapshot tool (Snapshot) is a time-sampling observation instrument. Its 27 items are divided into sections designed to measure student’s exposure to instruction (by content area and grouping format), student’s engagement in different academic activities, and adult responsiveness and involvement. It is intended to provide an in-depth, minute-by-minute analysis of how students experience activity settings (e.g., whole group, free choice, transitions), content areas (e.g., literacy, science, mathematics), and teaching approaches (e.g., didactic, scaffolding) (Ritchie, Weiser, Kraft-Sayre, Howes, & Weiser, 2001).
In each TK classroom observation, four9 “target students”—two boys and two girls, selected randomly—were observed in sequence throughout the morning to measure a TK student’s experience on a typical day of instruction. To complete a Snapshot observation, an observer locates the first target student and spends one minute observing and coding (20 seconds observing, 40 seconds coding) the student’s activities and interactions. The observer then moves on to the next student on the list. This process is repeated in four-minute blocks of time throughout the observation period. Over the course of a program morning, 30–50 observation segments are collected for each target student.
9 If there were fewer than four TK students present in the classroom, the observer followed all TK students in sequence. However, if there was only one TK student present that day, the observer rescheduled the observation. That is to say, a minimum of at least two TK students had to be observed for the Snapshot tool.

American Institutes for Research The Impact of Transitional Kindergarten in California—B-6
Teacher Surveys
The study team developed surveys for TK, kindergarten, and first-grade teachers of students in the study sample to gather additional information about (a) TK teacher and classroom characteristics and (b) the qualities of kindergarten (and sometimes first-grade) classes TK students and their peers attended. AIR developed survey questions with advice from the study partners and the technical advisory group and based on a literature review of relevant topics. In some cases, we used or modified slightly existing survey questions from the literature review. Before finalizing and fielding these survey items, we conducted pilot tests with teachers to ensure that the questions were understood. Based on feedback from the pilot tests, the survey questions were further refined and included in the final survey protocol.
TK teacher surveys covered a variety of topics related to instructional quality in the TK classroom. Topics included structure of the classroom, teacher planning activities, collaboration with teachers of other grade levels, professional development experiences, curriculum, instructional strategies, assessment and family engagement.
Kindergarten teacher surveys—administered to kindergarten teachers with study students enrolled in their classrooms during the kindergarten year—included similar questions about structure of the classroom, curriculum, instructional practices, and family engagement. A small number of TK students were promoted directly to first grade; in these cases, their first-grade teacher was asked to complete a modified version of the survey appropriate for first grade.
In addition, kindergarten and first-grade teachers were asked to complete the SSIS for each student in the sample, through the survey platform. (See the preceding discussion of the SSIS in the section on child assessments.)
Extant Data: English Language Proficiency The study team requested and obtained California English Language Development Test (CELDT) data from CDE. This extant data sample is composed of all English learner students who entered kindergarten in the state of California in academic years 2013–14 and 2014–15. CELDT results are reported for overall English proficiency attained by students as well as performance in each of four domains (i.e., listening, speaking, reading and writing). Results are reported at five performance levels for accountability purposes based on scale score ranges: beginning (184–345 points), early intermediate (346–396 points), intermediate (397–447 points), early advanced (448–498 points), and advanced (499–598 points). Data for this study included overall CELDT scores for each student as well as scores on speaking and listening subtests. The CELDT listening domain assesses a student’s skill in following oral directions, understanding teacher talk, extended listening comprehension, and rhyming. The speaking domain assesses a student’s skill in oral vocabulary, speech functions, choosing and giving reasons, and narrative explanation of pictures. The internal consistency of the listening and speaking domain tests for kindergarten are 0.80 and 0.90, respectively. The overall performance score is computed by combining listening and speaking scores (each contributing 45%) and reading and writing scores (each contributing 5%). The CELDT is scored on a common scale across grades (M = 500, SD = 50) (CTB/McGraw Hill, 2016).

American Institutes for Research The Impact of Transitional Kindergarten in California—C-1
Appendix C. Data Collection Procedures Child Assessment Procedures
Each cohort of kindergarten students was assessed twice during the kindergarten year: at the beginning and end of the school year (fall and spring). Cohort 1 students were first assessed in the fall of 2014. At that time, trained assessors visited study schools and assessed 2,836 kindergarten students in the areas of language, literacy, mathematics, and executive function as described previously. In spring 2015, assessors returned to the schools and reassessed 2,777 students from the original Cohort 1 fall sample10 on the same measures. The second cohort was assessed in the fall and spring of 2015–16 using the same assessment battery. The team assessed 3,279 kindergarten students in the fall and 3,176 students in the spring from the original Cohort 2 fall sample.11 The direct assessment took approximately 45 minutes.
Exhibit C1. Number of Students Assessed in Each Data Collection Round
Number of Students Assessed in the Fall
Number of Students Assessed in the Spring
Cohort 1: 2014–15 school year 2,836 2,777 Cohort 2: 2015–16 school year 3,279 3,176
Assessment Procedure for Bilingual Students
Given the large number of California students who come from homes where a language other than English is spoken, assessors began by administering the first two subtests of the preLAS: Simon Says and Art Show to all students. The preLAS served as a screener for the English learners (ELs) in the sample, with the students’ performance indicating whether they could receive the full assessment battery in English. In addition, administering the preLAS to all students first, regardless of home language, allowed it to serve as a warm-up for all students, giving students the chance to become comfortable with the assessor and the assessment setting.
Using the same cut point used in the Early Childhood Longitudinal Study, Birth Cohort,12 AIR set the threshold for testing in English low (12 or more correct out of 20) to increase the number of English learner students who would qualify for the full battery of assessments in English.13
10 Of the original fall sample, 146 students could not be reassessed because they declined to continue participation (2), moved away (103), or were not available to be assessed (41). 11 The cohort 2 spring sample was slightly larger than the fall sample because some consents came in after the end of the fall field period. Approximately 46 additional consents were received. Additionally, from this sample, 149 students could not be assessed in spring 2016 because they declined to continue participation (2), moved away (139), or were not eligible to be assessed (8) because of special needs that could not be accommodated (e.g., most students were nonverbal). 12 U.S. Department of Education, National Center for Education Statistics, Early Childhood Longitudinal Study, Kindergarten Class of 2010–11 (ECLS-K:2011) Restricted-Use Data File. 13 Because the official language of instruction in California at the time of this research was English, assessments in English best represented students’ classroom experiences. Also, in order to track growth from fall to spring, it was important that both assessments were in the same language if possible; in spring, almost all children were able to be assessed in English, so fall assessments in English were best for measuring growth over the kindergarten year.
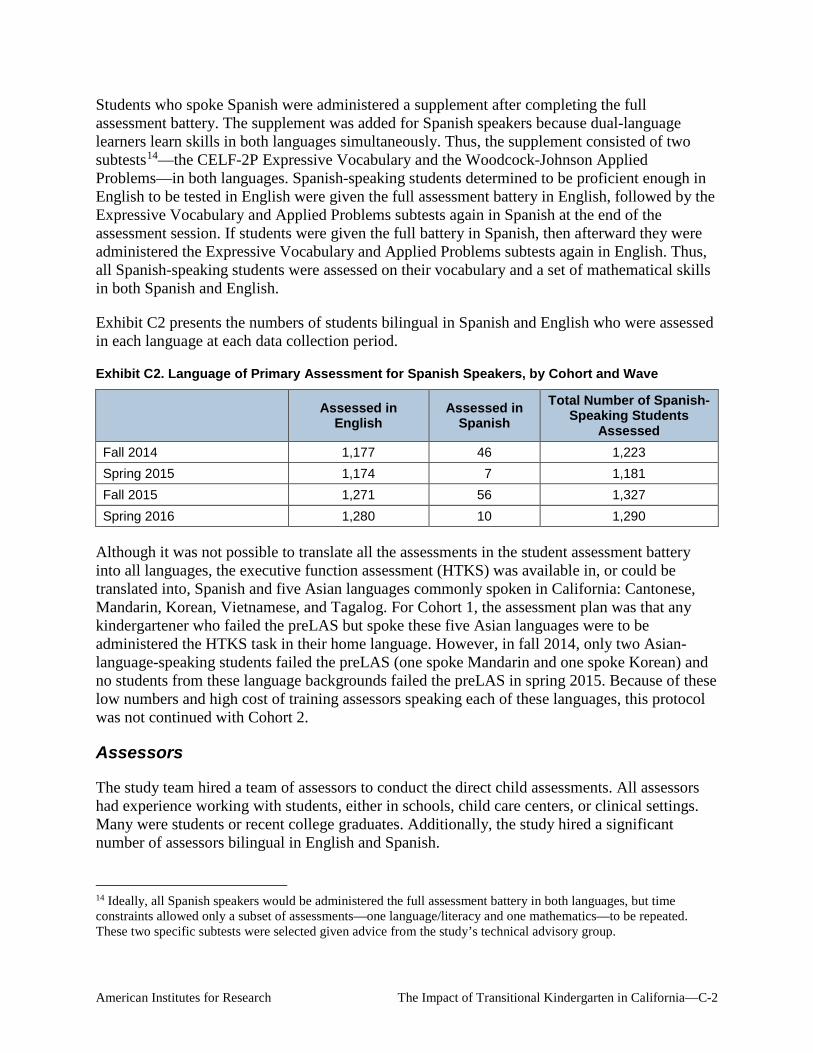
American Institutes for Research The Impact of Transitional Kindergarten in California—C-2
Students who spoke Spanish were administered a supplement after completing the full assessment battery. The supplement was added for Spanish speakers because dual-language learners learn skills in both languages simultaneously. Thus, the supplement consisted of two subtests14—the CELF-2P Expressive Vocabulary and the Woodcock-Johnson Applied Problems—in both languages. Spanish-speaking students determined to be proficient enough in English to be tested in English were given the full assessment battery in English, followed by the Expressive Vocabulary and Applied Problems subtests again in Spanish at the end of the assessment session. If students were given the full battery in Spanish, then afterward they were administered the Expressive Vocabulary and Applied Problems subtests again in English. Thus, all Spanish-speaking students were assessed on their vocabulary and a set of mathematical skills in both Spanish and English.
Exhibit C2 presents the numbers of students bilingual in Spanish and English who were assessed in each language at each data collection period.
Exhibit C2. Language of Primary Assessment for Spanish Speakers, by Cohort and Wave
Assessed in English
Assessed in Spanish
Total Number of Spanish-Speaking Students
Assessed Fall 2014 1,177 46 1,223 Spring 2015 1,174 7 1,181 Fall 2015 1,271 56 1,327 Spring 2016 1,280 10 1,290
Although it was not possible to translate all the assessments in the student assessment battery into all languages, the executive function assessment (HTKS) was available in, or could be translated into, Spanish and five Asian languages commonly spoken in California: Cantonese, Mandarin, Korean, Vietnamese, and Tagalog. For Cohort 1, the assessment plan was that any kindergartener who failed the preLAS but spoke these five Asian languages were to be administered the HTKS task in their home language. However, in fall 2014, only two Asian-language-speaking students failed the preLAS (one spoke Mandarin and one spoke Korean) and no students from these language backgrounds failed the preLAS in spring 2015. Because of these low numbers and high cost of training assessors speaking each of these languages, this protocol was not continued with Cohort 2.
Assessors
The study team hired a team of assessors to conduct the direct child assessments. All assessors had experience working with students, either in schools, child care centers, or clinical settings. Many were students or recent college graduates. Additionally, the study hired a significant number of assessors bilingual in English and Spanish.
14 Ideally, all Spanish speakers would be administered the full assessment battery in both languages, but time constraints allowed only a subset of assessments—one language/literacy and one mathematics—to be repeated. These two specific subtests were selected given advice from the study’s technical advisory group.

American Institutes for Research The Impact of Transitional Kindergarten in California—C-3
New assessors were hired for each data collection wave (fall 2014, spring 2015, fall 2015, and spring 2016), although many assessors continued working for the study for multiple data collection waves. New assessors were required to attend either a three-day or four-day in-person comprehensive training.15 All new assessors spent the first two days of training learning about purpose of the study, necessary administrative tasks, and how to administer each assessment reliably. The remainder of training was spent practicing and completing certification (described next).
Returning assessors for the spring of 2015 (Cohort 1) were retrained via webinar in which the entire assessment was reviewed and challenges they encountered in the field in the fall were discussed. Returning assessors for Cohort 2 (both fall 2015 and spring 2016) were required to attend a one-day in-person training in which study staff reviewed the assessments, reminding them how to handle the more challenging parts of the assessment.
All assessors were trained just prior to each field period. Exhibit C3 portrays the total number of assessors, as well as bilingual assessors were hired for each field period.
Exhibit C3. Summary of Assessor Type for Each Field Period
Field Period Total Assessors Spanish Bilingual Asian Language Bilingual
Fall 2014 50 32 8 Spring 2015 48 31 8 Fall 2015 50 41 0 Spring 2016 46 40 0
Quality Assurance
Three processes were in place to ensure the quality, validity, and reliability of the assessment data collected: (1) a required certification process for all assessors, (2) reliability checks in the field, and (3) overall quality control checks. These are described in the following sections.
Certification
During the last phase of each in-person training, assessors were tested to ensure that they could reliably and consistently administer the assessment. They were also observed by training staff administering sections of the assessment to actual students in order to confirm that they could appropriately interact with young children. Assessors were required to achieve 80% agreement with training staff on scoring and to demonstrate nearly all the targeted administration behaviors to pass certification. Given these procedures, by the time these assessors entered the schools to assess students, they were highly trained and able to collect valid and reliable data.
Reliability Checks
All assessors were also checked for reliability and accuracy at the start of each data collection field period, and when the field period was more than six weeks, again at around the midpoint of 15 The three-day training was very tight, so an extra day was added to training for Cohort 2, and consequently, the training per day was shortened.

American Institutes for Research The Impact of Transitional Kindergarten in California—C-4
the data collection period. The strongest assessors were trained to serve as these reliability checkers. The reliability check procedures were similar to the certification procedures at training, and thus, the procedures were familiar to the reliability checkers. Before the reliability checkers were permitted to check their fellow assessors, they first had to check each other. Then, they went on to check the assessors in their field area. Nearly all assessors passed their checks on the first try. Additional support and checks were provided to a few assessors before they could continue data collection.
Quality Control Checks
During each field period, study staff visited a few schools to ensure that that assessors were administering the assessment properly, following study protocol, and maintaining positive relationships with schools. In addition, study staff observed the conditions under which the assessments were being conducted throughout the state.
Classroom Observation Procedures
For each round of data collection, observers were trained on the two instruments used in the study: the CLASS and Snapshot. After training, observers completed certification tests to establish their reliability on the tools. For the CLASS tool, observers took an online certification test through the tool developer’s (Teachstone’s) website. The certification test involved viewing and coding five 15- to 20-minute videos and scoring at least 80% of codes within one of the master code. In addition, within each dimension at least two out of five codes were required to be within one point of the master code. For the Snapshot, observers viewed and coded 80 one-minute video segments, and the study team submitted tests to the developers of the Snapshot, who calculated Kappa values to measure inter-rater agreement with the master codes. Trainees had to obtain a Kappa of at least .75 to meet reliability requirements for conducting Snapshot observations.
Once observers had been certified on one or both tools, the study team worked with school liaisons to schedule observations and communicate information on the observation process, including observation procedures, length of time, the tools to be used and related information. During April–June 2014 and February–May 2015, two trained observers conducted half-day observations in each TK classroom in the study (one observer using the CLASS and the other using the Snapshot observation tool). Observers recorded observation data on coding forms that were later entered into the study database for analysis. To ensure reliability of observation data, a reliability checker—a member of the research team who was highly reliable on a particular tool—co-observed during each observers first visit. Observers compared scores with the reliability checker and discussed any inconsistencies. If 80% reliability was not achieved, then the data from the reliability checker were used for analysis purposes and an additional reliability check was scheduled. Once reliability was established, observers were cleared to conduct observations on their own.

American Institutes for Research The Impact of Transitional Kindergarten in California—C-5
Survey Procedures
Administration of the TK Teacher Surveys
AIR administered surveys to teachers of standalone TK and TK/K combination classrooms in the spring of the 2013–14 and 2014–15 school years to better understand TK classroom characteristics and instructional practices. As participating schools were recruited, teacher contact information was collected and teachers were sent invitations to complete online surveys. Teachers were sent an e-mail invitation with a hyperlink to the survey. To encourage teacher participation, survey respondents received a $20 incentive with their survey invitation. The study team followed up with weekly e-mail reminders, and school recruiters followed up with school liaisons and teachers to encourage a high response rate. The response rates are shown in Exhibit C4.
Exhibit C4. 2014 and 2015 TK and TK/K Combination Teacher Survey Response Rates
Data Collection Wave Total Administered Completed Response Rate Spring 2014 218 178 82% Spring 2015 240 196 82%
Administration of the Kindergarten and First-Grade Teacher Surveys
AIR administered surveys to kindergarten and first-grade teachers who had study students in their classrooms to understand the instructional context during the year in which assessments were given. Surveys were administered in the fall and spring of the 2014–15 (Cohort 1) and 2015–16 (Cohort 2) school years. The survey team sent teachers an e-mail invitation with a hyperlink to the surveys online. Teachers were asked to complete two surveys: (1) a survey asking about their classroom practices (“classroom survey”) and (2) a survey asking them to rate the social skills of each of the study students in their classroom using the SSIS items described previously (“Student Behaviors Form”). Teachers were given an incentive (an electronic gift card code) with the initial survey e-mail invitation and additional incentives for student survey submitted, upon completion. The study team sent a weekly reminder via e-mail and school recruiters followed up with school liaisons and teachers to ensure a high response rate.
The totals and response rates for kindergarten and first-grade classroom and student surveys are presented in Exhibit C5.

American Institutes for Research The Impact of Transitional Kindergarten in California—C-6
Exhibit C5. Kindergarten and First-Grade Teacher Survey Response Rates, by Survey Type and Data Collection Wave
Data Collection
Wave Survey Total
Administered Completed Response Rate
Fall 2014
Classroom Survey—All 715 563 79% Classroom Survey—K 641 517 81% Classroom Survey—1st 74 46 62% Student Behavior Form—All 715 589 82% Student Behaviors Form—K 641 541 84% Student Behaviors Form—1st 74 48 65%
Spring 2015
Classroom Survey—All 593 495 83% Classroom Survey—K 517 438 85% Classroom Survey—1st 76 57 75% Student Behavior Form—All 701 580 83% Student Behaviors Form—K 624 526 84% Student Behaviors Form—1st 77 54 70%
Fall 2015
Classroom Survey—All 742 658 89% Classroom Survey—K 667 600 90% Classroom Survey—1st 75 58 77% Student Behavior Form—All 745 657 88% Student Behaviors Form—K 669 595 89% Student Behaviors Form—1st 76 62 82%
Spring 2016
Classroom Survey—All 743 655 88% Classroom Survey—K 666 595 89% Classroom Survey—1st 77 60 78% Student Behavior Form—All 745 656 88% Student Behaviors Form—K 668 598 90% Student Behaviors Form—1st 77 58 75%
CELDT Procedures
Local education agencies (LEA) administer the CELDT as a requirement of state and federal law and use the test results to inform student placement in English learner programs (California Department of Education, 2016). For students in kindergarten and first grade, the CELDT is an individually administered, untimed test with an approximate administration time of 15-30 minutes.

American Institutes for Research The Impact of Transitional Kindergarten in California—D-1
Appendix D. Data Analysis Procedures For most of the results presented in this report, the study team conducted analyses on a data file that contained the data from both cohorts. Stacking the data ensured that the study had adequate power to detect any program effects, including effects for subgroups of students. Regression discontinuity designs are less statistically efficient than a randomized-assignment design (Schochet, 2008) because of the correlation between the treatment variable (eligibility for TK) and the forcing variable that determines eligibility for treatment (age in days). Therefore, large sample sizes are needed to detect program effects. Initial power analyses indicated that a sample size of 2,352 students (14 students from each of 168 schools) would be needed in order to achieve the desired minimum detectable effect size of 0.19 at the spring of kindergarten. Descriptive statistics indicate that both cohorts had similar demographic characteristics (Exhibit D1). In addition, all statistical models include an indicator for cohort to control for any unobservable differences between cohorts, among other controls described later.
Exhibit D1. Demographic Characteristics of Students in the TK and Comparison Samples
Cohort 1 Cohort 2
TK Group n = 1,591
Comparison Group
n = 1,318
TK Group n = 1,792
Comparison Group
n = 1,540 Mean age (as of 9/1/2014 for Cohort 1 and 9/1/2015 for Cohort 2) 5.83*** 5.66 5.83*** 5.66
Female 50.2% 48.0% 50.2% 50.7% Race/Ethnicity
White 26.2% 27.8% 30.0% 25.7% Hispanic 55.2% 56.5% 52.4% 54.8% Black 4.5% 3.9% 4.0% 5.2% Asian 11.8% 9.9% 11.5% 12.8% Other 2.4% 2.0% 2.1% 1.5%
Free and reduced-price lunch eligibility 59.4% 58.3% 59.4% 61.0% English learner 44.1% 39.4% 39.6% 36.0% Special education 7.2% 7.0% 4.6% 3.9% Parental education
Less than high school diploma 13.2% 13.7% 11.3% 12.1% High school diploma 20.2% 21.1% 18.9% 20.3% Some college 16.7% 17.5% 16.1% 17.0% Vocational certificate or AA 17.4% 18.2% 18.9% 18.6% Graduated from college 18.5% 15.9% 17.5% 16.8% Graduate education 14.1% 13.7% 17.2% 15.2%
Note. The table displays unadjusted means and percentages, but the significance testing for all variables except age adjusts for student age. Source: Authors' analysis of student record data from participating districts and parent survey data. ***p < .001.

American Institutes for Research The Impact of Transitional Kindergarten in California—D-2
Coding the Assessment Data
Most analyses were conducted on raw scores, but the study team also explored models using age-equivalent scores that were available for the Woodcock-Johnson Tests of Achievement and the CELF Expressive Vocabulary assessment, and W scores for the Woodcock-Johnson subtests. Age-equivalent scores indicate the child’s performance in an age metric that is measured relative to the norming sample. W scores represent underlying ability on an equal interval scale (Jaffe, 2009). The study team used W scores for analyses that combined English and Spanish child assessment data on the letter-word identification, applied problems, and quantitative concepts subtests of the Woodcock Johnson Tests of Achievement and the Woodcock Munoz Batería. Because W scores are horizontally equated, they allow for joint analysis of Spanish and English language assessment data, even though the Spanish and English tests were normed on samples with different demographic characteristics.
Analysis Approach
Eligibility for TK is limited to students in a very specific age range, which means that a regression discontinuity (RD) design can be used to approximate the rigor and credibility of random assignment without actually randomly assigning children. This study takes advantage of this birthdate cutoff and limited age range, and it employs the RD design. Students born between October 1 and February 2 (within 60 days on either side of the December 2 cutoff date to enter TK) in sample districts and schools were invited to participate in the study by consent of their parents; participation was voluntary. We then compared the academic and social kindergarten readiness of students who attended TK with the readiness of those who did not, as determined by the birthdate cutoff.
Effect Sizes
In these analyses, all outcome variables are standardized. Thus, the regression coefficients are effect sizes that report the standardized mean difference between the treatment and comparison groups. The effect size can be represented by the following formula:
𝑑𝑑 =𝑀𝑀�𝑡𝑡 − 𝑀𝑀�𝑐𝑐𝑆𝑆𝑆𝑆
where 𝑀𝑀�𝑡𝑡 represents the treatment group mean 𝑀𝑀�𝑐𝑐 represents the comparison group mean, and SD represents the pooled standard deviation. The use of effect sizes allows the reader to compare across outcomes, even if they were originally on different scales, to see which outcomes demonstrate a larger impact of TK.
Effect sizes are thus the standardized mean differences in the outcomes between the students who attended TK and those who did not, as estimated by the RD model, and computed by dividing the mean difference in the outcome by overall standard deviation. Effect sizes of 0.2 are considered small, 0.5 moderate, and 0.8 high.

American Institutes for Research The Impact of Transitional Kindergarten in California—D-3
Diagnostic Checks for RD Analyses
The RD analyses require that there is a discontinuity (i.e., a jump) in the program participation around the cutoff, as expected and required for an RD model. Exhibit E2 shows that compliance with treatment assignment was high in the study sample. In Cohort 1, 82.2% of students who were eligible for TK participated in the program, and 98.4% of students who were not eligible did not participate. In cohort 2, 74.2% of eligible students participated, and 98.2% of students who were not eligible did not participate (Exhibit D2). In other words, there is a big jump in program participation at the cutoff, but there is also some “fuzziness” in program participation, mainly due to eligible students not attending TK (Exhibit D3).
Exhibit D2. Compliance by Treatment Assignment
Cohort 1 Cohort 2
Group Attended TK
Did Not Attend TK
Attended TK
Did Not Attend TK
Eligible (treatment) 82.1% 17.9% 74.2% 25.8% Ineligible (comparison) 1.4% 98.6% 1.8% 98.2%
Exhibit D3. TK Participation Rates by Age
The impact estimate in RD designs depends on the assumption that, in the absence of any intervention, there would be a smooth relationship (i.e., no discontinuity) between the outcome and the forcing variable. For this reason, any discontinuity observed in the outcome at the cutoff is attributed to the intervention. Therefore, to check the smoothness assumption, we checked for the discontinuity at the cutoff in the forcing variable and student and family background characteristics, such as poverty status, English learner status, race/ethnicity, family income, and

American Institutes for Research The Impact of Transitional Kindergarten in California—D-4
parental education, among others. The visual inspection of the figures did not reveal any jump around the cutoff. Finally, we examined the functional form of the relationship between the forcing variable and the outcomes because, in the parametric approach, the validity of estimates from RD depends on whether the polynomial function is an accurate representation of 𝐸𝐸[𝑌𝑌𝑖𝑖| 𝑥𝑥𝑖𝑖]. Otherwise, an apparent jump at the cutoff that might be due to misspecification of the mean function could be mixed with the treatment effect. The results from these functional form analyses are discussed in the section that follows.
Model Specification
The primary results presented in this report are from fuzzy RD models with a 60-day bandwidth on either side of the eligibility cutoff. These models use a linear functional form for age, as opposed to a quadratic or cubic functional form, and include demographic covariates.16 The analytic sample includes data from both cohorts of students, and the model includes a cohort indicator variable to control for any differences between cohorts. Because we have a hierarchical data structure in which students are clustered within schools, we take this dependency in the data into account by using cluster-adjusted standard errors in all of our analyses. The study team conducted a series of sensitivity analyses that tested alternative model specifications, including
• Fuzzy and sharp RD models,
• Varying bandwidths around the eligibility cutoff,
• Different functional forms for student age, and
• Models with and without covariates.
The results of the alternative models are presented in Exhibits E4 through E6.
Sharp Versus Fuzzy RD Estimates
Sharp RD models ignore any noncompliance with treatment assignment. The purpose of these models is to compare students who are eligible for TK with those who are not eligible for TK to estimate the effect of offering the program, that is, the so-called intent-to-treat effect. Ignoring noncompliance attenuates the estimated impact of TK because some of the control students might have attended TK and some treatment students might have chosen not to attend TK. Therefore, the results from these analyses, which are also called intent-to-treat estimates, provide a conservative estimate of the effect of TK participation on student outcomes.
Let 𝑥𝑥𝑖𝑖 and 𝑥𝑥0 denote the student i’s birth date and the December 2 enrollment cutoff date for TK eligibility, respectively. The treatment 𝑆𝑆𝑖𝑖 is defined as TK participation,
𝑆𝑆𝑖𝑖 = �1 if 𝑥𝑥𝑖𝑖 < 𝑥𝑥00 if 𝑥𝑥𝑖𝑖 ≥ 𝑥𝑥0
(1)
16 Student-level covariates included race/ethnicity, disability status, free or reduced-price lunch eligibility, English learner status, parents’ highest education, family income, preK program participation two years prior to kindergarten entry, date tested, and cohort. School-level covariates included academic performance index, percentage of students eligible for free or reduced-price lunch, percentage English learners, and total school enrollment.

American Institutes for Research The Impact of Transitional Kindergarten in California—D-5
a common regression model representation of this evaluation problem would become
𝑌𝑌𝑖𝑖𝑘𝑘 = α + β𝑆𝑆𝑖𝑖 + ε𝑖𝑖 (2)
where in the main specification, 𝑌𝑌𝑖𝑖𝑘𝑘 is the test score of student i in assessment k in the fall of kindergarten, where k is Woodcock-Johnson Letter-Word Identification subtest, Woodcock-Johnson Quantitative Concepts subtest, Woodcock-Johnson Applied Problems subtest, HTKS assessment, or SSIS rating scales.
Provided that the conditional mean function 𝐸𝐸�ε𝑗𝑗|𝑥𝑥𝑗𝑗� is continuous at the TK eligibility cutoff, the causal impact of TK participation on a student outcome is given by
β = lim𝑥𝑥𝑗𝑗↑𝑥𝑥0
𝐸𝐸�𝑌𝑌𝑖𝑖𝑘𝑘|𝑥𝑥𝑗𝑗� − lim𝑥𝑥𝑗𝑗↓𝑥𝑥0
𝐸𝐸�𝑌𝑌𝑖𝑖𝑘𝑘|𝑥𝑥𝑗𝑗� (3)
Parametrically, we estimate equation 3 with the following equation using ordinary least squares:
𝑌𝑌𝑖𝑖𝑘𝑘 = 𝛼𝛼 + 𝛽𝛽1𝑆𝑆𝑖𝑖 + 𝑓𝑓(𝑥𝑥𝑖𝑖) + 𝜀𝜀𝑖𝑖 (4)
where 𝑓𝑓�𝑥𝑥𝑗𝑗� is a polynomial function of the selection variable. Because we have a hierarchical data structure in which students are clustered within schools, we take this dependency in the data into account by using cluster-adjusted standard errors in all of our analyses. In other words, in our models we separate the residual into student-level and classroom-level residuals. The final model run is in the following form:
𝑌𝑌𝑖𝑖𝑖𝑖𝑘𝑘 = α + β1Eligible𝑖𝑖𝑖𝑖 + β2Age𝑖𝑖𝑖𝑖 + β3Age𝑖𝑖𝑖𝑖2 + β4Age𝑖𝑖𝑖𝑖3 + β5Age𝑖𝑖𝑖𝑖4 + β5Covariates𝑖𝑖𝑖𝑖 + ϑ𝑖𝑖 +ε𝑖𝑖𝑖𝑖 (5)
where Eligible𝑖𝑖𝑖𝑖 is the TK eligibility status for student i in school s, Age𝑖𝑖𝑖𝑖 refers to the student’s birthdate centered at eligibility cutoff, Covariates𝑖𝑖𝑖𝑖 denotes student-level covariates, ϑ𝑖𝑖 is the school residual, and ε𝑖𝑖𝑖𝑖 is the student residual.
Noncompliance with enrollment guidelines leads to fuzziness at the December 2 enrollment cutoff, where the effect of the TK is to be estimated. Fuzzy RD models account for the fact that some children do not comply with their treatment assignment; this process enables a better estimate of the effect of TK for children who actually attend. Some districts enroll students in TK who are younger than the state eligibility guidelines. Although we excluded districts from our sampling frame that did so frequently, some sample districts still allowed this for some students (in our sample, 1.6% of ineligible students). In addition, some parents chose to keep their TK-eligible child at home or in a preschool program for an additional year prior to school enrollment rather than attend TK (in our sample 22.0% of eligible students).
The model representation for fuzzy RD is similar to sharp RD as shown in equation 2. However, in fuzzy RD, instead of a deterministic jump at the cutoff score (as in sharp RD), we estimate the probability of jump by
𝑃𝑃[𝑆𝑆𝑖𝑖|𝑥𝑥𝑖𝑖] = �𝑔𝑔0(𝑥𝑥𝑖𝑖) 𝑖𝑖𝑓𝑓 𝑥𝑥𝑖𝑖 ≥ 𝑥𝑥0
𝑔𝑔1(𝑥𝑥𝑖𝑖) 𝑖𝑖𝑓𝑓 𝑥𝑥𝑖𝑖 < 𝑥𝑥0where 𝑔𝑔0(𝑥𝑥𝑖𝑖) ≠ 𝑔𝑔1(𝑥𝑥𝑖𝑖) (6)

American Institutes for Research The Impact of Transitional Kindergarten in California—D-6
which can be rewritten as
𝐸𝐸[𝑆𝑆𝑖𝑖|𝑥𝑥𝑖𝑖] = 𝑃𝑃�𝑆𝑆𝑖𝑖 = 1|𝑥𝑥𝑖𝑖� = 𝑔𝑔0(𝑥𝑥𝑖𝑖) + [𝑔𝑔1(𝑥𝑥𝑖𝑖) − 𝑔𝑔0(𝑥𝑥𝑖𝑖)]𝑇𝑇𝑖𝑖 (7)
where 𝑇𝑇𝑖𝑖 = 1(𝑥𝑥𝑖𝑖 > 𝑥𝑥0) (i.e., eligibility status) and is an instrument for the TK participation cutoff. We use two-stage least squares to estimate the impact of TK, where the first stage is
𝑆𝑆𝑖𝑖 = θ0 + 𝑓𝑓(𝑥𝑥) + π𝑇𝑇𝑖𝑖 + ϑ1𝑖𝑖 (8)
Inserting this into the equation for RD model (equation 3), we find the reduced form of fuzzy RD as
𝑌𝑌𝑖𝑖 = µ + β1π𝑇𝑇𝑖𝑖 + (β1 + 1)𝑓𝑓(𝑥𝑥) + ϵ𝑖𝑖 (9)
where µ = α + β1θ0 and ϵ𝑖𝑖 = ϑ1𝑖𝑖 + ε𝑖𝑖. Again, because we have a hierarchical data structure in which students are clustered within schools, we take this dependency in the data into account by using cluster-adjusted standard errors in all of our analyses. The fuzzy RD design employs a two-stage least-squares correction to account for both of these forms of noncompliance with the cutoff date. The model estimates the effect of the treatment on those who received it by using predicted participation, rather than eligibility, as the primary explanatory variable in the impact model. In the first-stage model for the fuzzy RD, the probability of participation is estimated using student age:
Participationi = θ0 + θ1Agei + εi
In the second stage, estimated participation from the first stage model is used as a predictor variable:
Outcomesisk = α + β1Partıcıpatıon� is + β2Ageis + ϑ𝑖𝑖 + ε𝑖𝑖𝑖𝑖
Inclusion of Covariates
We present models with student- and school-level covariates in order to fully account for student background characteristics. This approach is more conservative and follows the norms in early childhood literature. The covariates included in the model are dummy variables for race/ethnicity, special education, free or reduced-price lunch, English learner status, parental education, income, early childhood education participation two years before kindergarten, and missing indicators for any missing covariates. Through the design of the RD model, we specifically control for student age, which is the only baseline variable on which TK and comparison group students varied by design. (That is, all TK students were slightly older than all comparison group students.) We ran models without covariates to determine how results differ. The addition of covariates did not increase the predictive power of our models, defined as the total variance explained, in the first stage of the two-stage least-squares models used for impact estimation. However, the study team continued to include covariates because doing so is standard practice for studies of early childhood outcomes that use a regression discontinuity design. The relative magnitude of the effects for the different outcomes is similar in the sharp and fuzzy RD models and are robust to the inclusion of covariates, as shown in Exhibit D4.

American Institutes for Research The Impact of Transitional Kindergarten in California—D-7
Exhibit D4. The Impact (Effect Size) of Transitional Kindergarten on Fall Student Outcomes by Model Type
Outcome Sharp Sharp With Covariates Fuzzy Fuzzy With
Covariates Language and Literacy Outcomes W-J Letter-Word ID 0.376*** 0.333*** 0.541*** 0.480*** CELF Phon Aware (raw) 0.202*** 0.195*** 0.284*** 0.274*** CELF Exp Vocab (raw) 0.089† 0.099* 0.133† 0.145* Mathematics Outcomes W-J Applied Problems 0.170** 0.140** 0.247** 0.202** W-J Quant Concepts 0.235*** 0.198*** 0.341*** 0.286*** Social-Emotional Skills HTKS 0.037 0.028 0.054 0.040 SSIS—Cooperation 0.074 0.081 0.113 0.118 SSIS—Engagement 0.131* 0.127* 0.193* 0.183* SSIS—Self-Control 0.112† 0.112† 0.166* 0.162† SSIS—External 0.026 0.043 0.048 0.068 SSIS—Internal 0.053 0.065 0.085 0.098
Note. The estimates are from models with a bandwidth of 60 days around the cutoff and linear functional form for age. The covariates included in the models with covariates are dummy variables for race/ethnicity, special education, free or reduced-price lunch, English learner status, parental education, income, early childhood education participation two years before kindergarten, and missing indicators for any missing covariates. †p < .10. * p < .05. ** p < .01. *** p < .001.
Optimal Bandwidth
Bandwidth refers to the age range of students on either side of the eligibility cutoff who are included in the analytic sample. Several tests can be used to determine optimal bandwidth (Imbens & Kalyanaraman, 2012; Ludwig & Miller, 2007). However, these tests rely on comparing averages within arbitrarily small neighborhoods around the cutoff, which is not feasible with a discrete forcing variable. For this study, age measured in days is the forcing variable that defines TK program eligibility. We chose 60 days on either side of the eligibility cutoff as our optimal bandwidth, which represents students born up to two months before the cutoff and students born up to two months after the cutoff. A formal statistical test for optimal bandwidth, called cross-validation, supports this choice of bandwidth.17 This bandwidth is ideal because it uses all available data and maximizes our statistical power. However, we tested models using 15-, 30-, and 45-day bandwidths to test whether our results were sensitive to the bandwidth selection, which they were not. As shown in Exhibit D5, the sample size decreases as the bandwidth decreases. The estimates are less precise and are less likely to be statistically significant in the models with smaller samples.
17 Statistical tests for optimal bandwidth require a continuous variable for program eligibility, whereas age is a discrete variable. However, we still computed the optimal bandwidth using both the IK (Imbens & Kalyanaraman, 2012) method and the cross-validation method (CV) proposed by Ludwig and Miller (2007). The optimal bandwidths for IK range from 22.3 to 57.2, which varies with the outcome, whereas the bandwidth from CV is 59 for all outcomes.

American Institutes for Research The Impact of Transitional Kindergarten in California—D-8
Exhibit D5. The Impact (Effect Size) of Transitional Kindergarten on Fall Student Outcomes by Bandwidth
Outcome Bandwidth =
15 days (n = 1,282-
1,526)
Bandwidth = 30 days
(n = 2,528–3,035)
Bandwidth = 45 days
(n = 3,733–4,456)
Bandwidth = 60 days
(n = 4,976– 5,928 )
Language and Literacy Outcomes W-J Letter-Word ID 0.380** 0.393*** 0.441*** 0.480*** CELF Phon Aware (raw) 0.255† 0.194* 0.233** 0.274*** CELF Exp Vocab (raw) 0.079 0.114 0.139* 0.145* Mathematics Outcomes W-J Applied Problems 0.175 0.197* 0.190* 0.202** W-J Quant Concepts 0.223† 0.263** 0.239** 0.286*** Social-Emotional Skills Executive function 0.038 0.009 -0.038 0.040 Cooperation 0.179 -0.016 0.033 0.118 Engagement 0.196 0.028 0.094 0.183* Self-control 0.078 -0.002 0.064 0.162† Externalizing problem behaviors -0.105 -0.104 -0.014 0.068
Internalizing problem behaviors 0.115 0.056 0.015 0.098
Note. The estimates are from fuzzy RD models with a linear functional form for age. The covariates included in the model are dummy variables for race/ethnicity, special education, free or reduced-price lunch, English learner status, parental education, income, early childhood education participation two years before kindergarten, and indicators for any missing covariates. †p < .10. * p < .05. ** p < .01. *** p < .001.
Functional Form for Age
For all outcomes, we present the linear model that includes only the linear age term, but we tested the sensitivity of results to the use of functional forms using quadratic and cubic terms. We determined that the linear model was the best fit for the data because the higher order polynomial terms were not consistently significant. Exhibit D6 shows the magnitude of the effect of TK across outcomes for each functional form.
Exhibit D6. The Impact (Effect Size) of Transitional Kindergarten on Fall Student Outcomes by Functional Form for Age
Outcome Linear Quadratic Cubic Sample Size Language and Literacy Outcomes W-J Letter Word ID 0.480*** 0.478*** 0.416*** 5,808 CELF Phon Aware (raw) 0.274*** 0.273*** 0.189* 5,821 CELF Exp Vocab (raw) 0.145* 0.139* 0.133† 5,928 Mathematics Outcomes W-J Applied Problems 0.202** 0.204** 0.178† 5,892 W-J Quant Concepts 0.286*** 0.282*** 0.206* 5,793 Social-Emotional Skills
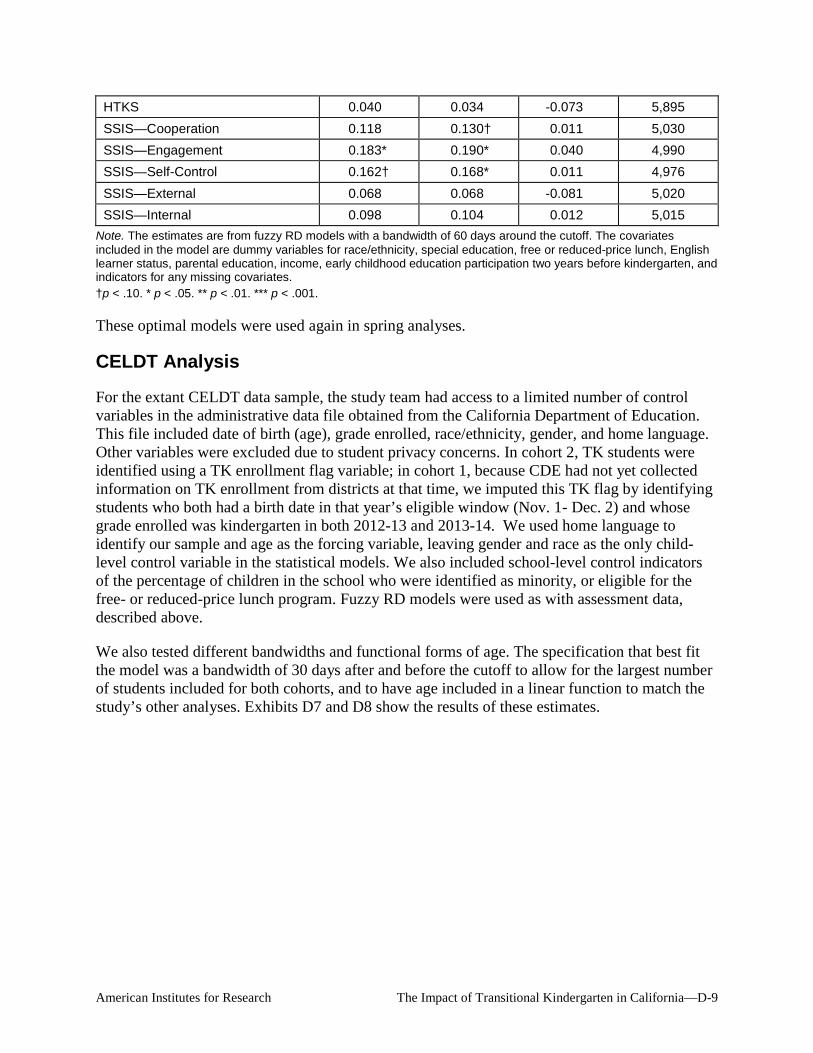
American Institutes for Research The Impact of Transitional Kindergarten in California—D-9
HTKS 0.040 0.034 -0.073 5,895 SSIS—Cooperation 0.118 0.130† 0.011 5,030 SSIS—Engagement 0.183* 0.190* 0.040 4,990 SSIS—Self-Control 0.162† 0.168* 0.011 4,976 SSIS—External 0.068 0.068 -0.081 5,020 SSIS—Internal 0.098 0.104 0.012 5,015
Note. The estimates are from fuzzy RD models with a bandwidth of 60 days around the cutoff. The covariates included in the model are dummy variables for race/ethnicity, special education, free or reduced-price lunch, English learner status, parental education, income, early childhood education participation two years before kindergarten, and indicators for any missing covariates. †p < .10. * p < .05. ** p < .01. *** p < .001.
These optimal models were used again in spring analyses.
CELDT Analysis
For the extant CELDT data sample, the study team had access to a limited number of control variables in the administrative data file obtained from the California Department of Education. This file included date of birth (age), grade enrolled, race/ethnicity, gender, and home language. Other variables were excluded due to student privacy concerns. In cohort 2, TK students were identified using a TK enrollment flag variable; in cohort 1, because CDE had not yet collected information on TK enrollment from districts at that time, we imputed this TK flag by identifying students who both had a birth date in that year’s eligible window (Nov. 1- Dec. 2) and whose grade enrolled was kindergarten in both 2012-13 and 2013-14. We used home language to identify our sample and age as the forcing variable, leaving gender and race as the only child-level control variable in the statistical models. We also included school-level control indicators of the percentage of children in the school who were identified as minority, or eligible for the free- or reduced-price lunch program. Fuzzy RD models were used as with assessment data, described above.
We also tested different bandwidths and functional forms of age. The specification that best fit the model was a bandwidth of 30 days after and before the cutoff to allow for the largest number of students included for both cohorts, and to have age included in a linear function to match the study’s other analyses. Exhibits D7 and D8 show the results of these estimates.

American Institutes for Research The Impact of Transitional Kindergarten in California—D-10
Exhibit D7. The Impact (Effect Size) of Transitional Kindergarten on Overall English Language Skills (CELDT) by Bandwidth
Outcome Bandwidth =
15 days (n = 27,962)
Bandwidth = 30 days
(n = 54,854)
Bandwidth = 60 days
(n = 81,464) Overall 0.710*** 0.747*** 0.806*** Listening (scale scores) 0.661*** 0.685*** 0.753*** Speaking (scale scores) 0.536*** 0.583*** 0.624***
Note. The estimates are from fuzzy RD models with a linear functional form for age. The covariates included in the model are dummy variables for gender, race/ethnicity, school level percentage of students classified as free or reduced-price lunch eligible, school level percentage of students classified as minority, and indicators for any missing covariates. *** p < .001.
Exhibit D8. The Impact (Effect Size) of Transitional Kindergarten on Overall English Language Skills (CELDT) by Functional Form for Age
Outcome Linear Quadratic Cubic Sample Size Overall 0.747*** 0.766*** 0.718*** 54,854 Listening (scale scores) 0.685*** 0.701*** 0.661*** 54,854 Speaking (scale scores) 0.583*** 0.600*** 0.554*** 54,854
Note. The estimates are from fuzzy RD models with a bandwidth of 30 days around the cutoff. The covariates included in the model are dummy variables for gender, race/ethnicity, school level percentage of students classified as free or reduced-price lunch eligible, school level percentage of students classified as minority, and indicators for any missing covariates. *** p < .001.

American Institutes for Research The Impact of Transitional Kindergarten in California—E-1
Appendix E. Results of RD Analyses for the Main Effect of TK Exhibit E1 presents the effect sizes of TK on each outcome in the fall and spring of kindergarten, using both cohorts stacked.
Exhibit E1. The Impact of TK on Academic and Social Skills, Fall and Spring of Kindergarten
Outcomes Fall Spring (n = 4,976–5,928) (n = 4,905–5,715)
Direct Assessments Letter-word identification 0.480*** 0.183** Phonological awareness 0.274*** 0.063 Expressive vocabulary 0.145* 0.101† Applied problems 0.202** 0.088 Quantitative concepts 0.286*** 0.118† Executive function 0.040 -0.028
Teacher Ratings Cooperation 0.118 0.040 Engagement 0.183* 0.018 Self-control 0.162† 0.009 Externalizing 0.068 0.066 Internalizing 0.098 0.040
Note. The estimates are from fuzzy RD models with a bandwidth of 60 days around the cutoff with a linear functional form for age. The covariates included in the model are dummy variables for race/ethnicity, special education, free or reduced-price lunch, English learner status, parental education, income, early childhood education participation two years before kindergarten, and indicators for any missing covariates. †p < .10. * p < .05. ** p < .01. *** p < .001.
Exhibit E2 presents the effect sizes of TK on each CELDT outcome, using both cohorts stacked.
Exhibit E2. The Impact of TK on Overall English Language Skills (CELDT) of Kindergarten
Outcomes CELDT (n = 54,854) Overall 0.747*** Listening 0.685*** Speaking 0.583***
Note. The estimates are from fuzzy RD models with a bandwidth of 30 days around the cutoff with a linear functional form for age. The covariates included in the model are dummy variables for gender, race/ethnicity, school level percentage of students classified as free or reduced-price lunch eligible, school level percentage of students classified as minority, and indicators for any missing covariates. *** p < .001.

American Institutes for Research The Impact of Transitional Kindergarten in California—F-1
Appendix F. Results of Demographic Subgroup Analyses To understand whether the effect of TK differs by student background characteristics, we ran separate regression discontinuity (RD) models for each subgroup with a large enough sample size, including: boys (vs. girls), students eligible for free or reduced-price lunch (FRPL) (vs. those not eligible), English learner students (vs. non-EL students), Hispanic students (vs. White non-Hispanic students), and students whose parents have a high school degree or less education (vs. parents with at least some college). Detailed results for the specific impacts on girls and boys, FRPL-eligible and non-eligible students, English learners and non-English learners, Hispanic and non-Hispanic White students, and students whose parents had a high school degree or less or more than a high school degree are presented in Exhibits F1 (fall) and F2 (spring). Asterisks in these tables indicate where the effects for each group of students are statistically significant. We then executed t tests to compare the effect sizes for each group (e.g., girls vs. boys) to determine whether they were significantly different from one another. Impact estimates that are different for a subgroup compared with its complement (e.g., girls and boys) are indicated with a dagger symbol and are presented in boldface font.

American Institutes for Research The Impact of Transitional Kindergarten in California—F-2
Exhibit F1. Regression Discontinuity Estimates of the Effect of TK on Students in the Fall of Kindergarten, by Demographic Subgroup
Outcomes Overall (n = 5,955)
Girls (n = 2,959)
Boys (n = 2,969)
FRPL Eligible
(n = 3,519)
Not FRPL Eligible
(n = 2,380)
English Learner
(n =2,287)
Non-English Learner
(n = 3,479)
Hispanic (n = 3,130 )
Non-Hispanic
White (n = 1,577)
Parent Ed: Diploma or
Less (n = 1,795)
Parent Ed: More than
High School (n = 3,698)
WJ-LW 0.480*** 0.508*** 0.439*** 0.573*** 0.315* 0.534*** 0.435*** 0.494*** 0.211 0.493*** 0.465***
CELF-PA 0.274*** 0.330*** 0.211* 0.330*** 0.157 0.349** 0.204* 0.314*** 0.050 0.232 0.258***
CELF-EV 0.145* 0.133 0.164* 0.178* 0.073 0.224* 0.094 0.139* 0.031 0.010 0.174**
WJ-AP 0.202** 0.195* 0.211* 0.381***a -0.095 0.319** 0.100 0.261** 0.027 0.253* 0.142
WJ-QC 0.286*** 0.379*** 0.202* 0.384*** 0.121 0.385*** 0.222* 0.318*** 0.212* 0.313** 0.276**
HTKS 0.040 0.123 -0.034 0.125 -0.094 0.148 -0.052 0.142 -0.206 0.030 0.018
SSIS-Coop 0.118 0.142 0.103 0.110 0.148 -0.031 0.188 -0.052 0.249 -0.003 0.116
SSIS-Eng 0.183* 0.273* 0.110 0.219* 0.170 0.152 0.193 0.077 0.216 0.190 0.184
SSIS-SC 0.162 0.153 0.189 0.112 0.274* 0.042 0.235 -0.046 0.337**a 0.007 0.176
SSIS-Extrn 0.068 0.022 0.143 -0.006 0.193 -0.050 0.140 -0.099 0.190 -0.084 0.047
SSIS-Intrn 0.098 0.090 0.120 0.055 0.170 0.056 0.118 0.087 0.098 0.014 0.104 Note. FRPL = free or reduced-price lunch. *p < .05. **p < .01. ***p < .001. a Estimated effects for the subgroup and its complement (e.g., girls and boys) were significantly different from each other.
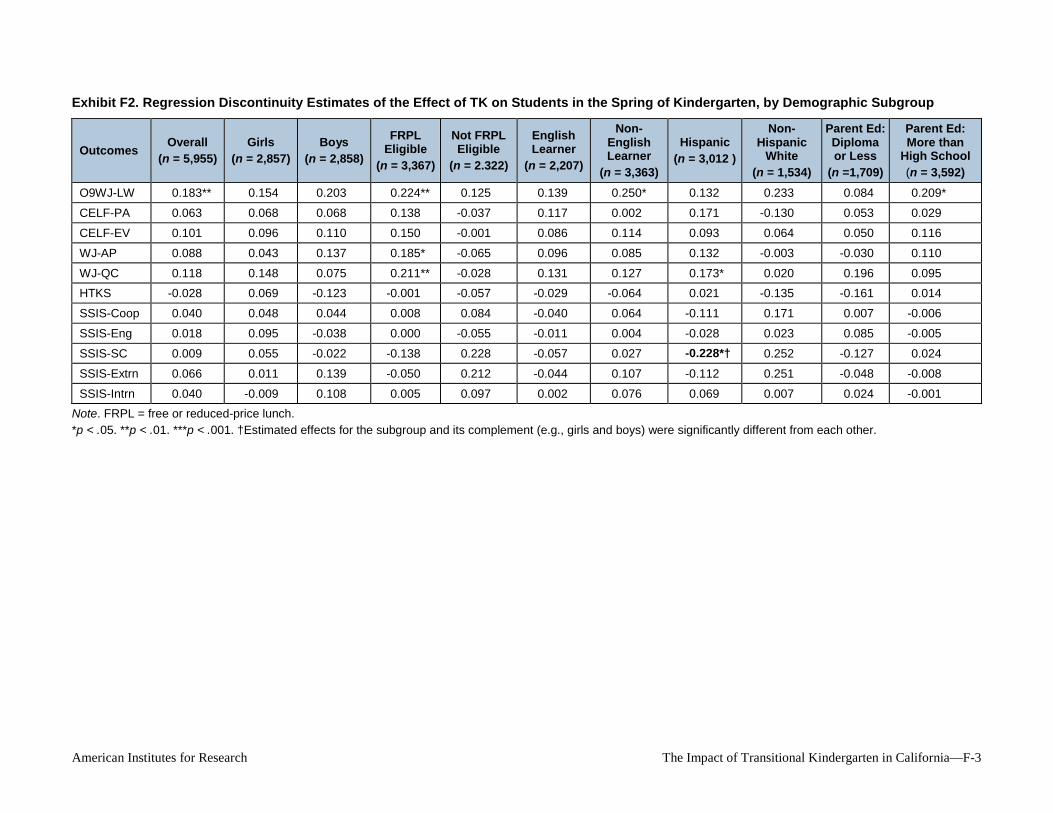
American Institutes for Research The Impact of Transitional Kindergarten in California—F-3
Exhibit F2. Regression Discontinuity Estimates of the Effect of TK on Students in the Spring of Kindergarten, by Demographic Subgroup
Outcomes Overall (n = 5,955)
Girls (n = 2,857)
Boys (n = 2,858)
FRPL Eligible
(n = 3,367)
Not FRPL Eligible
(n = 2.322)
English Learner
(n = 2,207)
Non-English Learner
(n = 3,363)
Hispanic (n = 3,012 )
Non-Hispanic
White (n = 1,534)
Parent Ed: Diploma or Less
(n =1,709)
Parent Ed: More than
High School (n = 3,592)
O9WJ-LW 0.183** 0.154 0.203 0.224** 0.125 0.139 0.250* 0.132 0.233 0.084 0.209*
CELF-PA 0.063 0.068 0.068 0.138 -0.037 0.117 0.002 0.171 -0.130 0.053 0.029
CELF-EV 0.101 0.096 0.110 0.150 -0.001 0.086 0.114 0.093 0.064 0.050 0.116
WJ-AP 0.088 0.043 0.137 0.185* -0.065 0.096 0.085 0.132 -0.003 -0.030 0.110
WJ-QC 0.118 0.148 0.075 0.211** -0.028 0.131 0.127 0.173* 0.020 0.196 0.095
HTKS -0.028 0.069 -0.123 -0.001 -0.057 -0.029 -0.064 0.021 -0.135 -0.161 0.014
SSIS-Coop 0.040 0.048 0.044 0.008 0.084 -0.040 0.064 -0.111 0.171 0.007 -0.006
SSIS-Eng 0.018 0.095 -0.038 0.000 -0.055 -0.011 0.004 -0.028 0.023 0.085 -0.005
SSIS-SC 0.009 0.055 -0.022 -0.138 0.228 -0.057 0.027 -0.228*† 0.252 -0.127 0.024
SSIS-Extrn 0.066 0.011 0.139 -0.050 0.212 -0.044 0.107 -0.112 0.251 -0.048 -0.008
SSIS-Intrn 0.040 -0.009 0.108 0.005 0.097 0.002 0.076 0.069 0.007 0.024 -0.001 Note. FRPL = free or reduced-price lunch. *p < .05. **p < .01. ***p < .001. †Estimated effects for the subgroup and its complement (e.g., girls and boys) were significantly different from each other.

American Institutes for Research The Impact of Transitional Kindergarten in California—F-4
Although few significant differences between groups were detected, an overall pattern suggested a larger impact for disadvantaged student subgroups on academic outcomes. To further examine this pattern, the study team conducted additional exploratory analyses. We created composite variables that represented the total of scores on all outcome measures in a given domain—i.e., math, reading, social-emotional skills, and overall development (academic and social-emotional). Regressing these composite outcomes on TK participation for the sample overall and for the subgroups revealed no evidence of a significant pattern of higher impact for a set of subgroups. The effect of TK on these outcomes was similar across all subgroups of students.
We explored how students’ participation in non-TK ECE programs might relate to the impact of TK. As noted, TK graduates were significantly more likely to have attended a center-based early childhood education program at the age of 3 (i.e., two years before kindergarten, the year before TK) than the comparison group in Cohort 2 (78% vs. 65%, respectively). To explore the possibility that this participation in center-based early childhood education in the year prior to TK was a confounding factor, the study team repeated the RD analyses, focusing only on those students who did not have this preschool experience as a 3-year-old (Exhibit F3). Due to the smaller sample size, the estimated effects had large standard errors. The point estimates for some outcomes were larger than for students who had attended early childhood programs, but the results were not significantly different from the RD models for the full sample.
Exhibit F3. Regression Discontinuity Estimates of the Effect of TK for Students Who Did Not Attend PreK at Age 3, Fall Kindergarten
Outcomes Overall (n = 5,955) Sample Size
Direct assessments Letter-word identification 0.480*** 5,808 Phonological awareness 0.274*** 5,821 Expressive vocabulary 0.145* 5,928 Applied problems 0.202** 5,892 Quantitative concepts 0.286*** 5,793 Executive function 0.040 5,895 Teacher ratings Cooperation 0.118 5,030 Engagement 0.183* 4,990 Self-control 0.162+ 4,976 Externalizing 0.068 5,020 Internalizing 0.098 5,015
†p < .10. *p < .05. **p < .01. ***p < .001.

American Institutes for Research The Impact of Transitional Kindergarten in California—F-5
CELDT Analyses by Language
To understand whether the effect of TK on English language proficiency differed by student’s home language, we ran separate regression discontinuity (RD) models for each language subgroup with a large enough sample size, including: Spanish, East Asian, Southeast Asian, South Asian, and West Asian language groups. Detailed results for the specific impacts are presented in Exhibit F4. Asterisks in this table indicate where the effects for each group of students are statistically significant.
Exhibit F4. Regression Discontinuity Estimates of the Effect of TK on Overall English Language Skills (CELDT), by Home Language Subgroup
Outcomes Spanish East Asian Southeast Asian South Asian
West Asian/Middle
Eastern (n = 45,010) (n = 2,720) (n = 3,123) (n = 1,518) (n = 971) Overall 0.743*** 1.133*** 0.588*** 0.993*** 0.898*** Listening 0.676*** 1.000*** 0.537*** 1.055*** 0.986*** Speaking 0.585*** 0.952*** 0.438*** 0.655*** 0.598**
*** p < .001.

American Institutes for Research The Impact of Transitional Kindergarten in California—G-1
Appendix G. Results of Subgroup Analyses by TK Classroom Characteristics To examine whether particular characteristics of TK teachers and classrooms are associated with a greater impact of TK (i.e., moderate its impact), we selected variables (and, in some cases, combined them into scales) based on our hypotheses about the characteristics of TK that might influence student learning, derived from the existing research literature. We divided students who had attended TK into “high” and “low” categories on each TK quality measure using a median split where needed, and we again ran separate RD models for each group, using students in the same kindergarten schools as the comparison group. We ran t tests to determine whether the effect sizes for each group were significantly different from one another. It should be noted that because many schools had kindergartners who had attended “low-quality” TK classrooms as well as kindergarteners who had attended “high-quality” TK classrooms (as defined by our measures), the comparison groups for the “high” and “low” models have substantial overlap.
For the first set of analyses, we examined TK classroom structure variables as potential moderators. Classroom structure variables included TK program schedule (half day or full day), classroom composition (standalone or combination classroom and the proportion of TK students in the classroom), and student–teacher ratio. The program schedule was coded as full day or half-day. Classroom composition was measured in two ways: whether the TK classroom enrolled a combination of TK and kindergarten students (TK/K combination) or enrolled exclusively TK students (standalone TK) and the proportion of students in the classrooms who were TK students. (In TK/K combination classrooms, this proportion was less than 1, and in standalone TK classrooms, the proportion was equal to 1.) Finally, the teacher–student ratio indicates the number of full-time teachers divided by the number of students. No significant differences in the impact of TK were detected with variation in these classroom structure variables (Exhibit G4).
We examined the potential moderating effect of scores on the Classroom Assessment Scoring System (CLASS), a measure of the quality of teacher–student interactions, on the impact of TK. We examined scores on all three domains on the CLASS, including emotional support, instructional support, and classroom organization.
No significant differences were detected in TK impact for students who attended TK classrooms that scored higher than the median on these CLASS domains versus those that scored lower than the median, as shown in Exhibit G5.
Finally, we investigated TK teachers’ classroom practices as a potential moderator. We examined four variables, including two measures of differentiated instruction, a measure of balanced curriculum, and a measure of developmentally appropriate practice. First, we created a differentiation scale from teacher survey items that captured teachers’ use of strategies to individualize instruction to meet student learning needs, including students with different ability levels, students with learning difficulties, and English learners. A second differentiation variable (Differentiation is possible)—was a single survey item measuring teachers’ level of agreement with a statement reading, “Differentiating instruction for all my students is impossible, given the range of needs or size of my class.” This item was reversed for analyses. We also created a balanced curriculum scale measuring the extent to which the teacher balanced time on core

American Institutes for Research The Impact of Transitional Kindergarten in California—G-2
academic topics, such as reading and math, with art, music, and social-emotional learning activities, as well as various instructional formats such as having students select their own activities versus engaging in whole-group instruction. Developmentally appropriate practice is a scale that measured the extent to which students were able to select from a variety of activities, including art, movement, games, puzzles, and manipulatives. Items included in each of these scales and their factor loadings are presented in Exhibits G1 through G3.
Exhibit G1. Items and Factor Loadings for Developmentally Appropriate Practice Scale
Item Factor Loading Select from a variety of learning areas and projects (i.e., dramatic play, construction, art, music, science experiences, etc.) 0.595
Play with games, puzzles, and construction materials (e.g., Tinker Toys, bristle blocks) 0.843 Do planned movement activities using large muscles (e.g., balancing, running, jumping) 0.561 Use manipulatives (e.g., pegboards, Legos, and Unifix Cubes) 0.702 Engage in child-chosen, teacher-supported play activities. 0.611 Draw, paint, work with clay, and use other art media. 0.447
Note. The resulting scale had an alpha of .80.
Exhibit G2. Items and Factor Loadings for the Balanced Curriculum Scale
Item Factor Loading Proportion of the day spent on art 0.621 Proportion of the day spent on music 0.454 Proportion of the day spent on child-selected activities 0.5862 Proportion of the day spent on fantasy play 0.490 Proportion of the day spent on math (reversed) 0.579 Proportion of the day spent on reading (reversed) 0.716 Proportion of the day spent in whole group (reversed) 0.561
Note. The resulting scale had an alpha of .77.
Exhibit G3. Items and Factor Loadings for Differentiated Instruction Measure
Item Factor Loading I individualize instruction to ensure that I meet individual student learning needs. 0.711 I know how to provide instruction in English so it can be understood by English learners (ELs). 0.579
I use developmentally appropriate practice with all of my students. 0.702 I use student ability level rather than age to guide my practice. 0.559 I use Response to Intervention (RTI) strategies for students who are having difficulty learning.
0.536
Note. The resulting scale had an alpha of .75.
Exhibits G4 through G6 present the subgroup moderator analyses for these quality characteristics. Only one of these teacher practice variables was associated with differential effects of TK. The second differentiation variable measuring whether it was impossible to differentiate (reversed). Students of TK teachers who disagreed more strongly with a statement that differentiation was impossible scored higher than their peers with teachers who reported less agreement on this question on letter and word identification at kindergarten entry (Exhibit G6).

American Institutes for Research The Impact of Transitional Kindergarten in California—G-3
Exhibit G4. Regression Discontinuity Estimates of the Effect of TK on Students in the Fall of Kindergarten, by TK Classroom Structure
Outcomes Full Day (n = 4,239)
Half Day (n = 1,654)
TK/K Combination
(n = 2,119)
Standalone TK
(n = 5,016)
Proportion TK Students in
TK Classroom
(High: 100%) (n = 4,164)
Proportion TK Students
in TK Classroom
(Low: 4 - 96%)
(n = 2,288)
Teacher–Student
Ratio (High:
19.2 - 30:1) (n = 2,663)
Teacher–Student
Ratio (Low:
1.2 - 19:1) (n = 2,689)
Direct Assessments Letter-word identification 0.406*** 0.546** 0.374** 0.437*** 0.419*** 0.552*** 0.481*** 0.460*** Phonological awareness 0.305*** 0.151 0.315* 0.291*** 0.186* 0.399*** 0.330*** 0.376*** Expressive vocabulary 0.126* 0.259* 0.060 0.122* 0.097 0.150 0.195* 0.175* Applied problems 0.230** 0.193 0.109 0.213** 0.168* 0.272* 0.224* 0.231* Quantitative concepts 0.259** 0.348* 0.227 0.255*** 0.217* 0.289* 0.274* 0.288** Executive function 0.008 -0.046 -0.225 0.065 -0.044 -0.038 -0.043 0.038 Teacher Ratings Cooperation 0.064 0.264 -0.082 0.162 0.151 0.019 0.106 0.113 Engagement 0.179 0.225 0.182 0.185* 0.124 0.258 0.266 0.102 Self-control 0.197 0.148 0.244 0.156 0.107 0.137 0.219 0.054 Externalizing 0.075 0.065 -0.047 0.093 0.102 -0.093 0.070 0.079 Internalizing 0.171 -0.219 0.150 0.076 -0.023 0.088 0.054 0.085
Note. No significant differences in effect were detected between models. *p < .05. **p < .01. ***p < .001.

American Institutes for Research The Impact of Transitional Kindergarten in California—G-4
Exhibit G5. Regression Discontinuity Estimates of the Effect of TK on Students in the Fall of Kindergarten, by TK Classroom Quality as Measured by the Classroom Assessment Scoring System (CLASS) Tool
Outcomes
CLASS Emotional Support
(High: Scores of 5.5 - 6.8) (n = 3,741)
CLASS Emotional Support
(Low: Scores of 2.85 - <5.5)
(n = 3,512)
CLASS Instructional
Support (High: Scores
of 2.3 - 5.2) (n = 3,610)
CLASS Instructional
Support (Low: Scores of 1.0 - 2.3) (n = 3,763)
CLASS Classroom
Organization (High: Scores
of 5.3 - 6.9) (n = 3,754)
CLASS Classroom
Organization (Low: Scores of 2.1 - 5.3) (n = 3,567)
Direct Assessments Letter-word identification 0.513*** 0.489*** 0.475*** 0.499*** 0.624*** 0.428*** Phonological awareness 0.264** 0.262** 0.308** 0.226* 0.293** 0.254** Expressive vocabulary 0.175* 0.096 0.178* 0.090 0.154 0.133 Applied problems 0.142 0.297*** 0.262** 0.208* 0.179* 0.254** Quantitative concepts 0.272** 0.209* 0.336*** 0.199* 0.348*** 0.219* Executive function -0.045 0.038 -0.016 0.077 0.021 0.012 Teacher Ratings Cooperation 0.187 0.056 0.067 0.168 0.200 0.073 Engagement 0.205 0.187 0.204 0.232 0.241* 0.203 Self-control 0.152 0.207 0.122 0.199 0.217 0.093 Externalizing 0.123 -0.026 0.055 0.050 0.189 -0.107 Internalizing 0.056 0.155 0.159 0.104 0.128 0.049
Note. No significant differences in effect were detected between models. *p < .05. **p < .01. ***p < .001.

American Institutes for Research The Impact of Transitional Kindergarten in California—G-5
Exhibit G6. Regression Discontinuity Estimates of the Effect of TK on Students in the Fall of Kindergarten, by TK Teacher Practices
Outcomes Differentiation Scale (High) (n = 3,560)
Differentiation Scale (Low) (n = 3,678)
Differentiation Is
“Impossible” (Low)
(n = 5,040)
Differentiation Is Less
“Impossible” (High)
(n = 1,506)
Balanced Curriculum
(High) (n = 3,767)
Balanced Curriculum
(Low) (n = 3,421)
Development-ally
Appropriate Practice (High)
(n = 3,908)
Development-ally
Appropriate Practice
(Low) (n = 3,357)
Direct Assessments Letter-word identification 0.614*** 0.476*** 0.436***a 0.833***a 0.460*** 0.491*** 0.442*** 0.560*** Phonological awareness 0.349*** 0.293** 0.268*** 0.561*** 0.265** 0.342*** 0.235** 0.349*** Expressive vocabulary 0.173* 0.104 0.132* 0.300* 0.159* 0.139 0.129 0.158* Applied problems 0.199* 0.246** 0.172* 0.365* 0.154 0.244** 0.173* 0.211* Quantitative concepts 0.303** 0.266** 0.250** 0.349* 0.260** 0.255** 0.170 0.323*** Executive function 0.030 -0.042 -0.002 0.110 -0.015 0.032 -0.025 -0.063 Teacher Ratings Cooperation 0.002 0.214 0.134 0.085 0.157 0.176 0.105 0.252* Engagement 0.199 0.209 0.182 0.237 0.160 0.305* 0.227 0.218 Self-control 0.051 0.283* 0.167 0.090 0.143 0.277* 0.171 0.248 Externalizing -0.041 0.139 0.070 0.117 0.100 0.094 0.091 0.155 Internalizing 0.160 0.061 0.088 -0.024 0.084 0.084 0.132 0.082
*p < .05. **p < .01. ***p < .001. a Estimated effects for the subgroup and its complement (e.g., female and male) were significantly different from each other.

American Institutes for Research The Impact of Transitional Kindergarten in California—H-1
Appendix H. Results of Analyses Examining Kindergarten Classroom Characteristics Given the smaller effects of TK in the spring of kindergarten, the study team explored aspects of the kindergarten classrooms and instruction that could help TK and non-TK students continue on a trajectory of strong academic growth. To explore this question, we conducted a multilevel regression analysis examining aspects of kindergarten classrooms that may be associated with student learning during the kindergarten year (Exhibit H1). Variables of interest included student composition (proportion of TK graduates in the kindergarten class), classroom schedule (part day or full day), the teacher’s prior knowledge of TK students’ abilities, sources of information teachers accessed about students’ prior TK experience, time spent on various content areas, and differentiation of instruction through student grouping and special assignments for advanced students. We focused on two key academic outcomes for this subset of analyses: the Woodcock Johnson Letter-Word Identification and Applied Problems subtests.

American Institutes for Research The Impact of Transitional Kindergarten in California—H-2
Exhibit H1. Multilevel Regression Estimates of the Association Between Kindergarten Classroom Characteristics and Student Learning (n = 461 to 1,907)
Effect Sizes: Full Sample
Effect Sizes: TK Students
WJ-LW WJ-AP WJ-LW WJ-AP Student Composition and Classroom Schedule
Proportion of K students who attended TK (high) -0.285 0.021 0.348 0.383* Proportion of K students who attended TK (mid) -0.064 -0.016 0.150 0.088 Full-day kindergarten -0.234 -0.007 -0.234 -0.029
Teacher’s Familiarity With Abilities of K Students Who Attended TK Familiarity with ELA abilities of your K students who attended TK -0.015 0.011 0.009 -0.031
Familiarity with MATH abilities of your K students who attended TK -0.043 0.014 -0.022 -0.016
Sources of Information on K Students’ Prior TK Experience Used by K Teacher Written notes from TK teacher -0.017 0.047 0.256 0.252 Conversation with parents -0.031 -0.006 -0.351 -0.125 No sources of information on K students’ prior TK experience used -0.273 -0.049 0.199 -0.120
Content of instruction Proportion of time per week on reading 2.049** 0.079 1.801* 0.323 Proportion of time per week on math 0.206 0.089 0.977 -0.281 Proportion of time per week on science 1.189 -0.096 -1.456 1.306 Proportion of time per week on music -1.223 0.283 0.909 0.835 Proportion of time per week on art -2.591 0.037 -3.587 -0.470
Student Grouping Practices Use of student ability rather than age for grouping -0.111 0.007 -0.220 -0.020 How often group students by ELA ability 0.271* 0.020 0.320* 0.211* How often group students by math ability 0.145 0.012 0.275 0.025 Differentiating instruction for all my students is impossible (reversed) 0.101 0.024* 0.134 0.081
Teaching Practices for Advanced Students Use of supplemental challenging ELA assignments 0.460** 0.017 0.293 -0.072 Cover some first-grade ELA content 0.443*** 0.008 0.413** -0.079 Use of supplemental challenging math assignments 0.205 0.019 0.150 0.077 Cover some first-grade math content 0.224 0.020 0.279 0.017
Note. ELA = English language arts. *p < .05. **p < .01. ***p < .001.

American Institutes for Research The Impact of Transitional Kindergarten in California—I-1
Appendix I. TK for Migrant and Special Education Students The study sought to understand how districts were serving specific subpopulations: migrant TK students and TK students in special education. The study team gathered information on districts’ approaches to serving these students through interviews with TK administrators. Administrators in 18 of the 20 districts in the study participated in interviews.
Supports for Migrant Students
According to the California Department of Education, “a child is considered ‘migrant’ if the parent or guardian is a migratory worker in the agricultural, dairy, lumber, or fishing industries and [the] family has moved during the past three years” (California Department of Education, 2016b). During the spring 2016 interviews, most of the school district administrators reported that they had few or no migrant students enrolled in their schools; however, a few districts with large populations of migrant students had developed innovative programming for these students that included additional services for the student and/or families; extended school days, weeks, or months; summer school; and looping (i.e., the teacher remained with the same group of students for two years).
Additional services. Two school districts provided additional services for TK migrant students during the school day. For example, in one district, classroom instructional aides provided additional help to migrant students.
Extended day or week. In one school district, programming for migrants students extended beyond the regular school day and five-day week. In this district, migrant students could attend both Saturday school and afterschool programming three days a week. During the afterschool programming, students received further instruction on core subjects (e.g., language arts, math). The Saturday school, held at one of the district’s elementary schools 20 times a year, was available to children in preschool through eighth grade. The district offered transportation to the school as well as breakfast and lunch. Staff offered instruction in core content areas (e.g., math, science) and devoted time to other areas such as physical education and technology.
Summer school. In three school districts, officials reported that migrant TK students could attend summer school. One school district offered a six-week summer program for migrant students. In this district, a teacher or an aide made home visits to the migrant student’s family. These visits served two purposes. First, staff brought schoolwork or books to ensure that students “were continuing to learn over the summer.” Second, in the time spent together, staff, children, and families developed a relationship. An administrator from this district added, “They’re kind of in school almost all year.” Another school district also extended migrant students’ learning year through a 20-day summer program for 4-year-olds called “Ready to Start,” which is offered to students before they enter kindergarten and is intended to strengthen foundational skills. A third school district coordinated with its county office of education migrant department to offer a summer program for TK through sixth-grade students.

American Institutes for Research The Impact of Transitional Kindergarten in California—I-2
Looping. One administrator shared that the district had a small migrant population overall, but one of its schools with a proportionally larger migrant population received migrant education services. In that school, the teacher looped with the students for two years, beginning in their TK year; an administrator believed that this helped provide the students with stability.
Family supports and services. Finally, in some districts, additional support services were offered to both migrant students and their families. For example, one district offered medical and dental care for families and parent education that was provided on campus or through in-home tutors. Another district offered a migrant, biliteracy preschool program for 3- to 5-year-old migrant students at one its elementary school campuses. Although children attended the two-hour preschool evening program, staff offered education to the parents. Parents in this same school district had access to health and parent support services that the district provided through collaborations with the regional migrant program and district, school, and community agencies. A third school district offered parent education classes, through which coaches offered literacy instruction. One school district’s migrant education contractors provided home visits and according to one administrator, “There's nothing that they won't touch on as a resource.... If health care is an issue or housing is an issue, they will try and break down those barriers for them.”
Special Education
Few districts reported serving TK special education students differently from other young students with special needs. However, two district administrators reported that they planned to change their approach to serving children with special needs in the near future. For example, one administrator noted that the district was moving away from a self-contained class and toward an inclusion class for their special needs TK students in school year 2016–17. A second district planned to implement approximately 60 “ETK/Preschool Collaborative Classrooms (PCC)” in school year 2016–17. These classrooms would be considered a general education setting; however, they would have special education supports in place. For example, an ETK/PCC classroom would have both a special education teacher and a special education trainee/assistant to provide support to students with an individualized education program. The district planned to model these classrooms after the model for 4-year-olds in its early education centers. The classroom ratios for ETK/PCC would be 16:1 general education students and 8:1 for students with an individualized education program.

American Institutes for Research The Impact of Transitional Kindergarten in California—J-1
Appendix J. Wraparound Services Provided Through Transitional Kindergarten Programs According to surveys of district administrators, districts provided a variety of “wraparound” or support services to students and their families. These services varied from district to district, and even within district, based on schools’ unique needs. Wraparound services include everything from extended learning opportunities (e.g., afterschool or special classes or activities provided outside of normal school hours); on-site health and care services (e.g., dental, vision, or hearing evaluations and/or care; developmental screenings; behavioral health services); referrals to community-based health evaluation or care (e.g., for vision evaluations, developmental screenings, mental health services); nutrition and wellness services; adult education for parents; and social work and family crisis response. The most commonly provided services (reported by half of the districts) were referral services to health, dental, or vision care or mental health services (Exhibit J1).
Exhibit J1. Percentage of Study Districts Reporting They Provide Various Wraparound Services for TK Students
Service Percentage of study districts reporting they provided this service
Extended learning programs 25%
On-site health care 25%
On-site dental care 10%
On-site vision care 30%
On-site hearing care 25%
On-site developmental screenings 10%
On-site behavioral health services 35%
Referrals to community-based health care 50%
Referrals to community-based dental care 50%
Referrals to community-based vision care 50%
Referrals to community-based hearing care 45%
Referrals to community-based developmental screenings 40%
Referrals to community-based mental health services 50%
Nutrition and wellness services 40%
Adult education 30%
Social work and family crisis response 50% Source: District administrator survey
American Institutes for Research The Impact of Transitional Kindergarten in California—J-1
The study team also followed up with district administrators through more in-depth interviews. In these interviews, district administrators further discussed the wraparound services that their schools provide to TK students and/or their families.
Parent support and education. Several districts offered services to TK students’ families. For example, one district offered monthly parent meetings on Tuesday nights. During these meetings, parents could learn more about ways to help their children at home, keep informed about local programs and events, and find out more information about different topics and programs. Another district partnered with a community agency that ran a program called “Wraparound,” which helped support the entire family through additional services. This school district also partnered with their local mental health agencies to help support families. An administrator from another school district noted that it had active Parent Clubs.
Innovative services. Several districts in the study offered innovative programming for students of all ages, including TK students. One district had a program open to all of its students called “Breakthrough,” which offered different services, depending on students’ needs. For example, if a special education student presented significant needs, the individualized education program process might determine a need for wraparound services from Breakthrough Speech, which offered afterschool intensive speech support (e.g., one student needed intensive speech services during the day but they were significantly decreasing her time in the classroom). A second example from this district was services for a student or family who were experiencing a family crisis, or circumstances that staff felt were “beyond school support.” In this situation, after staff made a referral to Breakthrough, the family met with a district counselor, and the counselor worked with the family to develop a crisis support plan. After six to eight weeks, they followed up with the families, either through the school counselors or back through Breakthrough, to gauge how well they were doing.
Interviews revealed some innovative services being targeted to younger students. For example, one district had an early learning coordinator, which was a contracted position. According to an interviewee, the early learning coordinator helped the district provide its summer programs for students; she worked with TK teachers to determine whether there were students that might benefit from another four weeks of school before they entered kindergarten. A second district had a program called Student Enrichment and Extended Day Program; staff collaborated closely with teachers to ensure that they were reinforcing the skills and themes that the children had learned during the school day and that the before-school and afterschool care was “not just fluff.” In a third district, TK students identified for services (i.e., low-income students) who attend Preppy K, the district’s name for its TK program, for part of the day could attend the State Preschool for the remainder of the school day (e.g., they attend Preppy K in the morning and State Preschool in the afternoon).
Challenges in providing wraparound services. Two rural districts noted that it was difficult to provide wraparound services in remote, rural areas. For example, one district administrator shared that they did not provide such services as onsite or offsite health care because the nearest large city was at least 45 minutes away. An administrator from a second school district echoed this sentiment, noting that most service agencies are “about 35 miles away. And so for our folks, it's hard for them to get out there if they don’t have transportation.”

American Institutes for Research The Impact of Transitional Kindergarten in California—J-2
Other needed wraparound services. District administrators reported other services that they would like to be able to provide to TK students and their families to support their success in the classroom. Four district administrators noted that although they offered parent training, they wished they could provide parents with even more opportunities. As one administrator explained, “I would like to see like more parent education. We’re seeing that across the grade levels, but it would be really good to start young and get those parents aware of the importance of getting their kids to school, ways to support them, with learning, not necessarily doing homework, but just talking to them, asking them questions, providing those models for them.” Another district administrator shared that although they provided parent classes and an annual event called Parent University, during which a speaker presented information about parenting and student needs, she would like to do even more, especially for their low-income populations. A third administrator noted that because of budget cuts in 2008, their district had lost an intensive, 10-week parent education program that covered everything from school readiness to healthy eating habits.
Two district administrators noted that they wished that they could provide more counseling/mental health services. As with the parent education services, some counseling services had also been impacted by the financial crisis in the late 2000s. According to one administrator, “One of the needs that we’ve had that, for many years went unmet, probably paralleling the dive in California economy, is the need for school counselors.” A second administrator noted that mental health services have always been insufficient, sharing, “There’s always the need for additional counseling related services—behavioral counseling. We have a growing population of students, especially in our early grades, [who] have experienced trauma. And so, we have a higher level of need this year than ever before for counseling services. And so of course, I’d like to be able to increase and expand that, to be able to help all of my students. But that would impact TK as well.”

1715_06/17
ABOUT AMERICAN INSTITUTES FOR RESEARCH
Established in 1946, with headquarters in Washington, D.C.,
American Institutes for Research (AIR) is an independent,
nonpartisan, not-for-profit organization that conducts behavioral
and social science research and delivers technical assistance
both domestically and internationally. As one of the largest
behavioral and social science research organizations in the
world, AIR is committed to empowering communities and
institutions with innovative solutions to the most critical
challenges in education, health, workforce, and international
development.
2800 Campus Drive, Suite 200 San Mateo, CA 94043 202.403.5000
www.air.org
LOCATIONS
Domestic Washington, D.C.
Atlanta, GA
Austin, TX
Baltimore, MD
Cayce, SC
Chapel Hill, NC
Chicago, IL
Columbus, OH
Frederick, MD
Honolulu, HI
Indianapolis, IN
Metairie, LA
Naperville, IL
New York, NY
Rockville, MD
Sacramento, CA
San Mateo, CA
Waltham, MA
International Egypt
Honduras
Ivory Coast
Kyrgyzstan
Liberia
Tajikistan
Zambia