the importance of the pharmaceutical industry for switzerland
DESCRIPTION
Study on behalf of Interpharma by BAK Basel Economics on the economic importance of the pharmaceutical industry for Switzerland. Published in November 2015.TRANSCRIPT

BAK Basel EconomicsMichael Grass, Samuel Mösle
In collaboration with Polynomics
Study on behalf of Interpharma
The Importance of the Pharmaceutical Industry for Switzerland

Published by:
Interpharma, Association of research-basedpharmaceutical companies in Switzerland, Basel
© Interpharma /BAK Basel Economics, November 2015
Ordering address: InterpharmaPetersgraben 35, P.O. BoxCH-4009 BaselE-mail: [email protected]: www.interpharma.ch
Layout:Continue AG, Basel
Printing:Effingerhof, Brugg
Disponible en traduction françaiseDeutsche Version verfügbar In case of reprint, please credit source

Content
Client’s Foreword . . . . . . . . . . . . . . . . . . . . . . . . . . . . . . . . . . . . . . 2 In Brief . . . . . . . . . . . . . . . . . . . . . . . . . . . . . . . . . . . . . . . . . . . . . . . 5
1 The Pharmaceutical Industry as an Employer . . . . . . . . . . . . . . . 8 1.1 Number of employees . . . . . . . . . . . . . . . . . . . . . . . . . . . . . . . . . . . . 8 1.2 Employment structure . . . . . . . . . . . . . . . . . . . . . . . . . . . . . . . . . . . 14 1.3 Wages and salaries . . . . . . . . . . . . . . . . . . . . . . . . . . . . . . . . . . . . . 19 1.4 Importance for other industries . . . . . . . . . . . . . . . . . . . . . . . . . . . . 22
2 Contribution to Value Creation by the Pharmaceutical Industry . . . . . . . . . . . . . . . . . . . . . . . . . . . . 242.1 Direct contribution to value creation: economic performance . . . . . . 242.2 Contribution to growth by the pharmaceutical industry . . . . . . . . . . . 262.3 International comparison . . . . . . . . . . . . . . . . . . . . . . . . . . . . . . . . . 282.4 Importance for other industries . . . . . . . . . . . . . . . . . . . . . . . . . . . . 30
3 Productivity of the Pharmaceutical Industry . . . . . . . . . . . . . . . 323.1 Job productivity . . . . . . . . . . . . . . . . . . . . . . . . . . . . . . . . . . . . . . . . 323.2 Productivity per hour worked . . . . . . . . . . . . . . . . . . . . . . . . . . . . . . 343.3 Contribution to growth by the pharmaceutical industry . . . . . . . . . . . 35
4 The Pharmaceutical Industry as an Export Sector . . . . . . . . . . 404.1 Total exports . . . . . . . . . . . . . . . . . . . . . . . . . . . . . . . . . . . . . . . . . . 404.2 Exports based on destination . . . . . . . . . . . . . . . . . . . . . . . . . . . . . . 42
5 Summary . . . . . . . . . . . . . . . . . . . . . . . . . . . . . . . . . . . . . . . . . . . . 47
6 Bibliography . . . . . . . . . . . . . . . . . . . . . . . . . . . . . . . . . . . . . . . . . 51
7 Annex . . . . . . . . . . . . . . . . . . . . . . . . . . . . . . . . . . . . . . . . . . . . . . . 537.1 Concept of the impact analysis . . . . . . . . . . . . . . . . . . . . . . . . . . . . 537.1.1 Underlying idea . . . . . . . . . . . . . . . . . . . . . . . . . . . . . . . . . . . . . . . . 537.1.2 Impact levels . . . . . . . . . . . . . . . . . . . . . . . . . . . . . . . . . . . . . . . . . . 537.1.3 Impact model . . . . . . . . . . . . . . . . . . . . . . . . . . . . . . . . . . . . . . . . . . 547.2 International comparison of multipliers for the pharmaceutical industry . . . . . . . . . . . . . . . . . . . . . . . . . . . . . . . 57

2 BAK Basel Economics / Polynomics
Client’s Foreword
This study on the macroeconomic importance of the pharmaceutical industry in Switzerland, now in its sixth edition, has been updated to include an important new element. Effective 30 September 2014, the Swiss Federal Statistical Office (SFSO) has adjusted the public statistics of Switzerland to conform to the new European System of National and Regional Accounts (ESA 2010). One of the major consequences of this is that the expenditures for research and develop-ment (R&D) are now considered to be investments and as a result, the gross domestic product (GDP) is higher.
Charging R&D expenditures to investments is a positive change, both from the point of view of the pharmaceutical industry and in general. For one thing, it illustrates that the importance of the pharmaceutical industry is even greater than previously as-sumed. Due to the adjustment, direct value creation by the pharmaceutical industry has been corrected upward by one third totalling over CHF 25 billion in 2014. If we take into account that every CHF 100 of value added in the pharmaceutical in-dustry generates another CHF 80 in the supplier sectors, the direct and indirect contribution by the pharmaceutical industry in 2014 amounted to approximately CHF 45 billion. The modification of the value creation data also impacts the level of job productivity. In 2014 it was around CHF 627,000, or four times the average of the Swiss economy overall and more than twice that of the banks. All this should be viewed as a positive change for the national economy, because as recently as the turn of the millennium there was talk of “slow growth” in Switzer-land. It was said to be caused, particularly in comparison with other OECD coun-tries, by insufficient productivity growth. The upsurge in productivity in the Swiss
Thomas B. Cueni, Secretary General
Importance of the Pharmaceutical Industry 3
pharmaceutical industry over the past 15 years is likely to be a not insignificant reason why the discussion about “slow growth” in Switzerland has mostly died down by now.
Nevertheless, the pharmaceutical industry is also facing considerable chal-lenges. As all other export sectors in Switzerland, the pharmaceutical industry suffered a substantial erosion of margins in recent years due to the exchange rate developments. Additional pressure on drug prices is felt even from within Switzerland: The persistent increase in healthcare expenditures and health in-surance premiums continues to influence the price discussion, although the drug price index in Switzerland has dropped by over 30 percent since 2005 and is now at the level of the neighbouring countries. Last but not least, the uncertain future of Switzerland’s relations with the European Union (EU) is fraught with risks that could have an adverse impact on Switzerland as an industrial base. The fact that, despite this trend, international pharmaceutical companies continue to in-vest in Switzerland and expand their production capacities should not be taken for granted. Therefore, it is even more crucial to preserve the Swiss economy’s unrestricted access to the largest single market in the world and establish the necessary framework conditions to ensure that Switzerland will continue to be a step ahead of the competition.
Interpharma Thomas B. Cueni, Secretary General

Importance of the Pharmaceutical Industry 5
In Brief
The pharmaceutical industry is the backbone of the Swiss export industry. In 2014 pharmaceutical exports amounted to approximately CHF 71 billion, which means that about one third of the money earned abroad by the Swiss industry is attributable to pharmaceuticals. With real growth in value creation averaging 9.4 percent a year, the sector has contributed significantly to the economic growth in Switzerland over the past two decades. In the course of its expansion, the industry’s macroeconomic importance has continued to grow steadily. Nominal gross value added in excess of CHF 25 billion in 2014 represented a share of 4 percent of the economy overall. The pharmaceutical industry has around 41,800 employees accounting for approximately 0.8 percent of all jobs. Com-panies from other sectors are also benefiting considerably from the economic success of the Swiss pharmaceutical industry. As illustrated by a macroeconomic impact analysis, additional value added of CHF 19.5 billion, affecting around 139,000 jobs, was generated in other sec-tors in 2014 as a result of the economic activities of the pharmaceutical companies.
This study presents the latest results on the importance of the Swiss pharma-ceutical industry for the economy as a whole based on updated data. A major change in the national economic statistics was brought about by the adoption of the European System of National and Regional Accounts ESA 2010, according to which, among other adjustments, research and development expenditures are now integrated into the calculation of gross value added.
Outstanding productivity within the industry spectrumBased on the new data, the pharmaceutical industry’s lead in productivity is even more obvious than before. With value added of CHF 332 per hour worked or CHF 627,000 per job, productivity per hour in 2014 in the pharmaceutical industry was about four times higher than that of the economy overall and 3.5 times higher than the Swiss industry in general. The above-average job productivity is a re-flection of how competitive the pharmaceutical companies are. It is the result of strong capitalization, extensive innovation activities and high production effi-ciency.

6 BAK Basel Economics / Polynomics
Strong real growth – price pressure inhibiting nominal expansionThe rate of real growth in the pharmaceutical industry has been strong in recent years. However, since 2010 there has been considerable pressure on producer and consumer prices. The strengthening of the Swiss currency caused margins to erode, resulting in lower profits and temporarily reduced nominal value added (2011). Nominal value added has been on the rise again since 2012. In the long term, the exchange rate is only one of several factors affecting growth potential. Other, more important factors in terms of long-term developments include ac-cess to the (international) labour market and other framework conditions in Swit-zerland (regulation). On the demand side, structural aspects, such as demo-graphic changes, a growing middle class in the emerging markets and an increase in the occurrence of chronic diseases are important drivers for the in-dustry.
Source: BAK Basel Economics, Polynomics, SFSO.
Macroeconomic importance
Possible rounding differences
Direct Indirect Total Multiplier
Gross value addedmillion CHF 25,286 19,534 44,821
1.8in % of total for Switzerland 4.0 3.1 7.1
Workforcenumber of persons 41,778 182,488 224,266
5.4in % of total for Switzerland 0.8 3.6 4.4
Workforce (FTE)number of persons 39,552 139,011 178,563
4.5in % of total for Switzerland 1.0 3.5 4.5
Hours workedmillion hours 75 272 347
4.6in % of total for Switzerland 1.0 3.5 4.5
Gross wages and salaries
million CHF 5,584 13,377 18,960 3.4
in % of total for Switzerland 1.5 3.6 5.1
Exportsmillion CHF 70,658
in % of all exports of goods 34.5

Importance of the Pharmaceutical Industry 7
Macroeconomic impact analysis shows vital importance for other industriesTo manufacture its products, the pharmaceutical industry not only requires la-bour and capital, it also needs input in the form of goods and services from other industries. The demand from the pharmaceutical industry for such input creates jobs for other industries and suppliers, etc. In addition, trade and commerce benefit from consumer spending by the workforce of the pharmaceutical com-panies. Within the scope of an impact analysis all relevant payment streams triggered by the economic activity in the pharmaceutical industry were analyzed and quantified by vertical integration across the entire value-added chain. Based on the number of jobs (full-time equivalents, FTE) the model calculations result in a multiplier of 4.5, i.e. every job in the pharmaceutical industry additionally generates 3.5 full-time equivalents in companies of other industries benefiting indirectly from the research and production activities of the pharmaceutical sec-tor. Thus, in addition to approximately 40,000 jobs in the pharmaceutical indus-try, in 2014 another 139,000 jobs in other businesses depended on the pharma companies. These additional jobs represented total wages of around CHF 13 billion in 2014. Therefore, every CHF 1,000 in wages paid by the pharmaceu-tical industry is tied to an average of another CHF 2,400 in wages earned by workers in companies of other industries.
The multiplier calculated for gross value added is 1.8. Accordingly, every CHF 1 of value added in the pharmaceutical industry generates another CHF 0.80 in value added in other Swiss industries. Overall, other companies benefit from the research and production activities of the pharmaceutical sector in excess of CHF 19.5 billion in value added. In 2014, the direct and indirect contribution to value added totalled about CHF 45 billion, corresponding to 7.1 percent of Switzer-land’s total gross value added.
8 BAK Basel Economics / Polynomics
1 The Pharmaceutical Industry as an Employer
Although the workforce of the pharmaceutical industry accounts for a relatively minor share of less than one percent of total employment in Switzerland, it con-tributes significantly to the national labour market. This is reflected in the continu-ous above-average growth of a highly productive workforce.
1.1 Number of employeesThe importance of the pharmaceutical industry for Switzerland’s national econ-omy continued to rise in 2014. With around 41,800 employees the workforce of the Swiss pharmaceutical companies grew by 2.4 percent compared to the prior year. While the pharmaceutical sector employed approximately 22,800 workers in the early 1980s, the increase in its employment rate compared to the economy as a whole has clearly been above average, particularly since the second half of the 1990s (see Figure 1.1).
This rapid job growth was preceded by a decline between 1990 and 1995, marked on the one hand by a general economic slowdown, and on the other hand, by a structural change in the chemical/pharmaceutical industry, signalling the transformation of the industry from a classical production base for chemical products to one of the most significant bases for pharmaceuticals in the world.
Jobs have doubled since 1995 and the number of employees has increased to 41,800. With this, the pharmaceutical industry has contributed significantly to the expansion of Switzerland as an industrial base. Due to extensive investments in research and development, among other factors, as well as global industry drivers, such as demographic changes, new technologies and a growing middle class in the emerging nations, the expansion projects continued to develop favourably and led to a comparatively constant increase in employment, which continued nearly unchecked even in times of international economic crises.
Between 1996 and 2014 the pharmaceutical industry increased its workforce by an average of 3.7 percent a year. During the same period the total economic growth rate in Switzerland averaged only 1.2 percent per year. An analysis across the entire timeframe since 1980 shows an average increase in employment of 1.8 percent in the pharmaceutical industry compared to 1.1 percent in Switzerland as a whole.

Importance of the Pharmaceutical Industry 9
Figure 1.1 | Employment in the pharmaceutical industry relative to the national economy
Number of employees (in thousands), 1980–2014
1,000
2,000
3,000
4,000
5,000
6,000
0
8
16
24
32
40
48
0
1980 1997 2014
Source: BAK Basel Economics, Polynomics, SFSO.
Total in Switzerland (left axis) Pharmaceutical industry (right axis)

10 BAK Basel Economics / Polynomics
Consequently, the dynamic above-average job growth is also reflected in the rising importance of the industry for the Swiss labour market. Taking the part-time structures of different industries into consideration, i.e. the number of full-time equivalents (FTE), the pharmaceutical sector accounted for around 1.0 per-cent of the total workforce in Switzerland in 2014 (see Figure 1.2). By comparison, up to the year 2000 this figure ranged between 0.6 and 0.7 percent. It also clearly shows the structural transformation of the industry and the subsequent growth in jobs.
Figure 1.2 | Employment in the pharmaceutical industry relative to the national economy
Share in percent, 1980–2014
0
0.7
0.9
1.0
0.8
0.6
0.5
0.4
0.3
0.2
0.1
1980 1997 2014
Source: BAK Basel Economics, Polynomics, SFSO.
Importance of the Pharmaceutical Industry 11
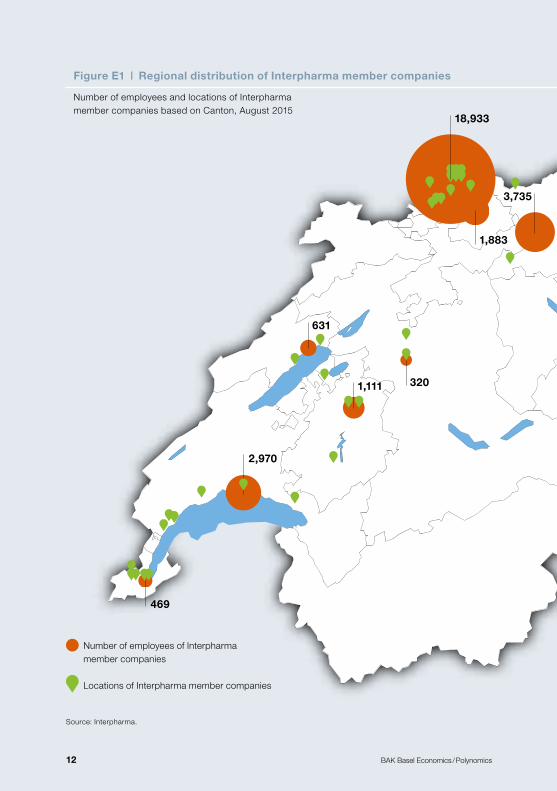
Focus on the regional distribution of Interpharma members
The members of the Association of research-based pharmaceutical companies in Switzerland (Interpharma) are not all from the pharmaceutical industry. Many operate in sectors associated with the pharmaceutical industry, including, in par-ticular, orthopaedic and electronic medical technology and biotech research.
Collectively, the member companies employ around 38,040 workers and main-tain headquarters, research and development as well as manufacturing opera-tions in 16 Swiss cantons with strong regional concentrations. The Basel region (Cantons Basel-City and Basel-Country and Canton Aargau) acts as the national leader. As a primary base of long-established pharmaceutical companies, such as Boehringer Ingelheim, Novartis, and Roche and the biopharmaceutical com-pany Actelion, the Basel region, with approximately 25,000 employees, repre-sents around 65 percent of the total workforce of all members.
Another concentration of pharmaceutical companies is found in the so-called “Espace Lémanique” (Cantons Bern, Fribourg, Geneva, Neuchâtel, and Vaud), which is where the Swiss subsidiaries of Celgene, Eli Lilly, GlaxoSmithKline (GSK), Merck Serono, Sanofi, UCB, Vifor Pharma, and others are located. The workforce of Interpharma members in the Espace Lémanique region totals about 5,500, corresponding to 14 percent of the nationwide employment of Inter-pharma companies.
The Zurich-Zug-Lucerne cluster has grown into an attractive area for international businesses, but it also serves as a research and development and manufacturing base for Swiss companies. AbbVie, Alcon, Amgen, AstraZeneca, Bayer, Biogen, Bristol-Myers Squibb, Gilead, Janssen, Lundbeck, Merck, MSD (Merck Sharp & Dohme), and Pfizer are represented here in addition to Swiss giants Novartis, Roche and Vifor Pharma. With over 5,680 employees, the number of jobs in this region has increased considerably in recent years and currently accounts for 15 percent of the nationwide employment of all Interpharma members.
Another major manufacturing base is located in the Canton Schaffhausen. Ap-proximately 1,600 employees, or about 4 percent of the workforce, are employed in the northernmost Swiss canton, where Interpharma companies, such as Jans-sen, Merck and Novartis maintain manufacturing operations.
12 BAK Basel Economics / Polynomics
18,933
1,604
887
4,202
600320
631
1,111
2,970
109
100
232
3,735
1,883
469
21
Source: Interpharma.
Number of employees of Interpharma member companies
Locations of Interpharma member companies
Figure E1 | Regional distribution of Interpharma member companies
Number of employees and locations of Interpharma member companies based on Canton, August 2015

Importance of the Pharmaceutical Industry 13
18,933
1,604
887
4,202
600320
631
1,111
2,970
109
100
232
3,735
1,883
469
21
Figure E1 | Regional distribution of Interpharma member companies
Number of employees and locations of Interpharma member companies based on Canton, August 2015

14 BAK Basel Economics / Polynomics
1.2 Employment structure
Qualification structurePartly due to its extensive research and development activities, the pharmaceut-ical industry has an above-average number of employees with a tertiary level of education compared to the rest of Switzerland. In 2011, almost half of all employ-ees had completed specialized training or graduated from a university. At just under 35 percent, this number was much lower in the Swiss economy as a whole. In the industry sector, employees with high qualifications accounted for less than 30 percent (see Figure 1.3). An analysis over time shows, on the one hand, an increase in jobs in the pharmaceutical industry related to research and development activities, and on the other hand, it also illustrates the nationwide changes in the education system with the introduction of advanced technical colleges and simplified access to tertiary education, resulting in a steady trend growth rate in both the national economy and in the pharmaceutical industry. The share of tertiary education has increased at an above-average rate, particularly since 2006.
Part-time structureAn analysis of the employment statistics demonstrates that the structures in the pharmaceutical industry have not changed much over the years. In 2014 87.6 percent of the workforce held at least a 90-percent job. 1.6 percent of all em-ployees worked less than 50 percent (part-time II) and 10.8 percent worked between 50 and 89 percent of normal working hours (part-time I). With this, the pharmaceutical companies do not vary significantly from the employment pattern in the industry sector. The number of part-time jobs in the service industries, such as retail or hotels and restaurants is typically considerably higher than in the in-dustry sector.

Importance of the Pharmaceutical Industry 15
Full-time equivalentsBecause of the difference in part-time structures, employment figures are not necessarily suitable for comparison with other industries in terms of their size or importance for the labour market overall. Therefore, such comparisons are based on the measure of so-called full-time equivalents (FTE) to indicate what the num-ber of employees would be hypothetically, if all of the work were to be completed only by full-time employees. This calculation arrives at a number of around 39,600 full-time equivalents for the pharmaceutical industry. Since the proportion of part-time employees in the pharmaceutical industry is below the overall industry average, its 1.0 percent share of the national economy measured by full-time equivalents is higher than it would be without correction of the part-time effects.
Figure 1.3 | Qualification structure
Employees in the chemical/pharmaceutical industry (NOGA 02), the national economy and the industry sector broken down according to qualification level, in percent
Source: BAK Basel Economics, Polynomics, SFSO.
0
20
40
60
80
100
2000 2005
Pharmaceutical industry
2011 2000 2005 2011 2000 2005 2011
National economy Industry sector
3238
48
2328
35
20 2228
59 49
42
5753
49
56 5352
9 13 1020 19 16
24 25 20
n Low qualification n Average qualification n High qualification

16 BAK Basel Economics / Polynomics
Human Resources
A significant growth driver in Switzerland is the high level of productivity, espe-cially in the key industries. The high productivity level, in turn, is based on the extensive automation of production processes, for one and for another it is achieved by activities creating substantial added value. The latter, in particular, requires a highly qualified workforce. This brings up the problem of a growing shortage of skilled labour in Switzerland. With regard to the shape the relation-ship between Switzerland and the EU will take in the future, this issue has grown in importance. Because of its high degree of specialization and its international focus, the pharmaceutical industry has a great need for specialized labour.
A look at the Swiss corporate headquarters of Actelion, Novartis and Roche, for example, shows that foreign employees accounted for around 60 percent in 2010. This number had increased to 65 percent by 2014. With this, the workforce of the three companies is considerably more international than that of Switzer-land as a whole (according to the Swiss Federal Statistical Office the share of foreign employees was 22 percent in 2014). In addition, during that same period, the three corporations created a combined total of 4,611 new jobs at their head-quarters, and the number of Swiss employees also increased by 2 percent to over 10,500 between 2010 and 2014.
In addition to hiring foreign workers, employers have other options to cover their labour needs. An important factor in this context is to have the highest possible share of female employees and having all age groups represented. In the three pharmaceutical companies that were analyzed by way of example, Actelion, No-vartis and Roche, the percentage of women is slightly below average, although it went up from 41.5 percent to 42.5 percent between 2010 and 2014 (vs. approxi-mately 47 percent nationwide in 2014). The share of part-time workers in the pharmaceutical industry is considerably below the national average. Ninety-seven percent of men and around 77 percent of women work on a full-time basis com-

Importance of the Pharmaceutical Industry 17
pared to 84 percent of men and 43 percent of women nationwide holding, on average, at least a 90 percent job. With respect to age it was found that the share of young people (up to the age of 40) in Switzerland as a whole declined slightly from 45 to 44 percent between 2010 and 2014, while the percentage of workers aged 54 and over increased slightly from 18 to 19 percent. The above-mentioned three pharmaceutical companies followed a similar trend, although with a some-what sharper decrease in younger workers, while the share of employees be-tween the age of 40 and 50 has increased.
The considerable international concentration of the workforce structure in the pharmaceutical industry is an expression of the global activities of these com-panies, on the one hand, and on the other hand it is due to a lack of Swiss workers. According to the surveyed pharmaceutical companies, the pool of Swiss human resources is not large enough, particularly as far as scientific work and internationally focused management functions are concerned.
To maximize the use of the available Swiss workforce, some pharmaceutical companies have created special development programmes for apprentices, in addition to trainee and international job rotation programmes and other options. However, these types of programmes are increasingly also being offered to older employees, not only to the younger staff.
To make even better use of the potential of women in the workforce, the surveyed companies are offering a variety of different infrastructural models to facilitate especially the reintegration of women after giving birth to a baby, for example, including flexible work hours, child care, or the possibility to take an extended leave. In the three companies, around 90 percent of female employees reportedly return to their job after having a baby.
18 BAK Basel Economics / Polynomics
ConclusionOn average, the employee structure in the pharmaceutical industry is more inter-national compared to Switzerland as a whole. This is due, on the one hand, to the global focus of the companies operating in this industry, and on the other hand, it is a result of a lack of local labour. To make better use of the pool of Swiss workers, special programmes have been developed for younger employees, al-though different employment models are also increasingly offered to older work-ers. Additionally, some programmes are focusing specifically on the reintegration of women after giving birth to a baby.

Importance of the Pharmaceutical Industry 19
1.3 Wages and salariesDue, in part, to a significant increase in wages in the service sector, driven by the financial sector, the pharmaceutical industry’s share of the national wage bill (total wages and salaries paid to employees) decreased before the onset of the financial and economic crisis in 2007/2008. At its lowest level, the pharmaceut- ical industry represented no more than 1.2 percent, although its rate of employ-ment continued to go up.
The pharmaceutical industry has successfully weathered the currently challen- ging economic environment and achieved above-average increases in total wages representing 1.5 percent of the national economy in 2014. Based on a comparison within the industry sector, the share of the pharmaceutical industry has grown even more significantly since the start of the euro crisis and the sub-sequent strengthening of the Swiss currency. At currently 6.2 percent (2010: 5.1%) the share of total wages held by the industry sector increased by 1.1 per-cent within just a few years.
In 2014 wages and salaries paid by the pharmaceutical industry totalled CHF 5.6 billion (total for Switzerland: CHF 362.9 billion). Adjusted for the number of employees and hours worked, this results in an average hourly pay rate of CHF 75 in the pharmaceutical industry compared to CHF 47 in the economy as a whole. Particularly in view of the various economic crises emerging since 2007, the pharmaceutical industry, which is considered to be crisis resistant, was able to pay hourly wages considerably above average, while the growth rates in the national economy and the industry sector were lower (see Figure 1.4).

20 BAK Basel Economics / Polynomics
Figure 1.4 | Industry comparison of increase in income from employment
Average annual growth of hourly wages (in percent)
Source: BAK Basel Economics, Polynomics, SFSO.
6
5
3
1
0
4
2
1980–1990 1990–2000 2000–2007 2007–2014
4.95.2
2.82.2 2.4
1.2 1.11.4 1.6
1.3
3.0
4.8
n Pharmaceutical industry n National economy n Industry sector

Importance of the Pharmaceutical Industry 21
Estimated induced tax revenue and consumer spending
In addition to the employees of the pharmaceutical industry, the government also benefits from above-average pay rates in the form of taxes and social security contributions, while trade and commerce receive a boost from the workforce’s consumer spending.
The fiscal effect resulting from the wages and salaries of the employees in the pharmaceutical industry can only be estimated, because the information avail-able on the distribution of income and places of residence (based on income class) of the pharmaceutical workforce is not sufficiently detailed. Nevertheless, a rough estimate and classification is warranted.
A general correction for income earned based on the rate of cross-border em-ployees (16%) and assuming that the distribution of total wages between the group of workers residing in Switzerland and the group residing abroad is in proportion with the number of total employees (FTE) results in estimated income and withholding taxes of approximately CHF 644 million.
Around 12 percent of gross salaries are flowing into social security in the form of contributions to the retirement and disability pension insurance, unemployment insurance, pension funds, etc. In addition, all employees pay into a mandatory health insurance plan. The contributions to the social security programme and the mandatory health insurance (basic insurance only) are estimated to total CHF 693 million.
About 74 percent of gross income is left after deduction of all taxes, social se-curity contributions, insurance premiums, fees and other charges. Considering a typical savings rate based on the average income level of the pharmaceutical workforce, the calculations result in approximately CHF 3 billion in consumer spending. Manufacturers and providers of consumer goods and personal ser-vices are the beneficiaries of such consumer spending. According to model cal-culations, the total effect in value added amounts to CHF 1.9 billion. However, it should be noted that the causal relationship of this induced effect with the pri-mary impulse (production pharmaceutical industry) cannot be interpreted on a strictly causal basis because consumer spending at an individual level is not only financed by income from employment. It is also financed by other types of in-come (unearned income or government transfers), which is taken into account in the model calculations.

22 BAK Basel Economics / Polynomics
1.4 Importance for other industriesIn 2014, the Swiss pharmaceutical industry had approximately 42,000 employ-ees. Allowing for the part-time structure of employment, this corresponds to approximately 40,000 full-time equivalents, representing around one percent of total employment in Switzerland.
However, the impact of the pharmaceutical industry on the labour market goes beyond these figures. For the manufacture of pharmaceutical products, input products are purchased from companies in various other industries and sectors and from abroad. For example, machinery is required to manufacture drugs and new research and production facilities are being built. Furthermore, commerce and trade are benefiting from consumer spending by the pharmaceutical work-force.
As a result of these economic interactions the production activities of the pharma-ceutical companies are tied to jobs in other branches of the economy. The level of the effect on national employment from the research and production activities in the pharmaceutical industry is calculated based on a macroeconomic impact model. This impact model is used to analyze and quantify all relevant payment streams by vertical integration across the entire value-added chain (see Section 7.1).
The impact analysis shows that every job in the pharmaceutical industry add- itionally generates 3.5 full-time equivalents in companies in other industries bene fiting indirectly from the research and production activities of the pharma-ceutical sector. In other words, in 2014 the pharmaceutical companies were di-rectly or indirectly supported in the manufacture of their products by around 139,000 jobs in other companies and sectors, in addition to about 40,000 jobs in the pharmaceutical industry.
The additional jobs in other branches of the economy were related to income from employment in the amount of around CHF 13 billion. Therefore, for every CHF 1,000 in wages paid by the pharmaceutical industry, an average of CHF 2,400 is paid in wages to employees in other companies and industries.
Importance of the Pharmaceutical Industry 23
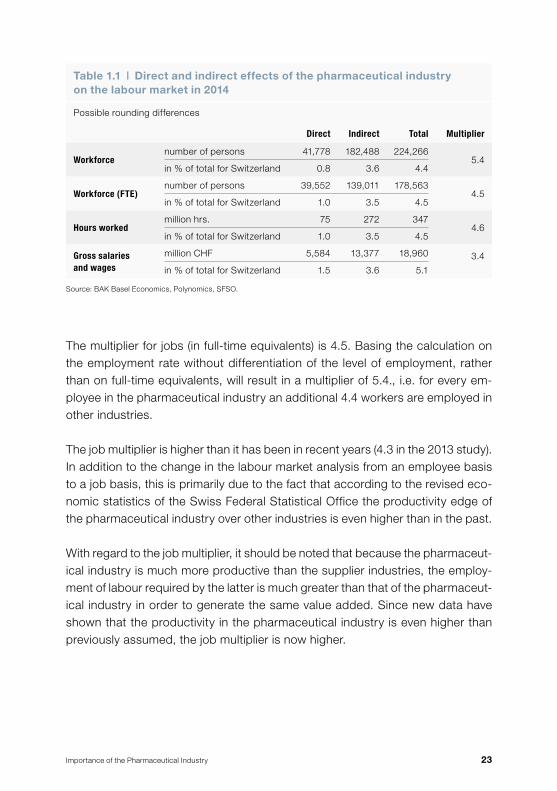
The multiplier for jobs (in full-time equivalents) is 4.5. Basing the calculation on the employment rate without differentiation of the level of employment, rather than on full-time equivalents, will result in a multiplier of 5.4., i.e. for every em-ployee in the pharmaceutical industry an additional 4.4 workers are employed in other industries.
The job multiplier is higher than it has been in recent years (4.3 in the 2013 study). In addition to the change in the labour market analysis from an employee basis to a job basis, this is primarily due to the fact that according to the revised eco-nomic statistics of the Swiss Federal Statistical Office the productivity edge of the pharmaceutical industry over other industries is even higher than in the past.
With regard to the job multiplier, it should be noted that because the pharmaceut-ical industry is much more productive than the supplier industries, the employ-ment of labour required by the latter is much greater than that of the pharmaceut-ical industry in order to generate the same value added. Since new data have shown that the productivity in the pharmaceutical industry is even higher than previously assumed, the job multiplier is now higher.
Source: BAK Basel Economics, Polynomics, SFSO.
Table 1.1 | Direct and indirect effects of the pharmaceutical industry on the labour market in 2014
Possible rounding differences
Direct Indirect Total Multiplier
Workforcenumber of persons 41,778 182,488 224,266
5.4in % of total for Switzerland 0.8 3.6 4.4
Workforce (FTE)number of persons 39,552 139,011 178,563
4.5in % of total for Switzerland 1.0 3.5 4.5
Hours workedmillion hrs. 75 272 347
4.6in % of total for Switzerland 1.0 3.5 4.5
Gross salaries and wages
million CHF 5,584 13,377 18,960 3.4
in % of total for Switzerland 1.5 3.6 5.1
24 BAK Basel Economics / Polynomics
2 Contribution to Value Creation by the Pharmaceutical Industry
Despite the strong pressure on drug prices, the pharmaceutical industry suc-cessfully created value added on products at an above-average level and as the driver of the industry sector it contributed significantly to the growth in the na-tional value creation.
2.1 Direct contribution to value creation: economic performanceBesides employment, the contribution by the pharmaceutical industry to the gross domestic product is another important measure of its importance. The contribution to the gross domestic product is the value created by the industry. Value added measures the income from economic activity as the difference be-tween the total output of an economic unit and the input required for this perform-ance. Value added is composed of several components: compensation of em-ployees, capital gains (profit and interest on borrowed capital) and depreciation. Therefore, gross value added measures the production value of the output achieved by the industry with deduction of the necessary input.
The rapid increase in employment at the end of the last millennium (see Section 1.1) was also accompanied by a considerable acceleration in the rate at which gross value added grew in the pharmaceutical industry (see Figure 2.1). The end of the structural transformation in 1996 brought an average annual increase of 6.7 percent in the nominal gross value added in the pharmaceutical industry until 2014. In 2014 the pharmaceutical sector generated gross value added of over CHF 25 billion. In comparison, the national economy achieved an increase of only 2.6 percent per year during the same period. Starting in 2010 heavy price pressures (e.g. drug price adjustments, restriction of the national healthcare ex-penditures) led to a slight decline in nominal value creation. This development went hand in hand with a decrease in the share of value added by pharmaceut-icals to the gross domestic product (or the national value creation, respectively). In 2014 this figure stood at 4.0 percent. In 1980 at the beginning of the period under review it was approximately 1.0 percent and 2.0 percent in 1996.
Unlike nominal value creation, real value creation is adjusted for inflation, which allows an analysis based on the number of production units. A comparison be-tween nominal and real value creation clearly emphasizes the price pressures on the pharmaceutical industry mentioned above: Units with stronger real growth

Importance of the Pharmaceutical Industry 25
Figure 2.2 | Value creation by the pharmaceutical industry compared to the national economy
Share in percent, 1980–2014
Source: BAK Basel Economics, Polynomics.
0
4
5
3
2
1
1980 1997 2014
real
nominal
Share in nominal value creation Share in real gross value creation
Figure 2.1 | Gross value creation by the pharmaceutical industry compared to the national economy
Indexed: 1980 = 100
Source: BAK Basel Economics, Polynomics.
100
300
500
700
900
1,100
1,300
1980 1997 2014
Pharmaceutical industry National economy

26 BAK Basel Economics / Polynomics
imply falling price levels. Between 1996 and 2014 the annual growth rate of real value added in the pharmaceutical industry was 9.2 percent. As a result of a considerably lower momentum in the economy as a whole (+2.0 percent per year) the pharmaceutical industry was able to steadily increase its share of the real gross domestic product over the years, resulting in 4.8 percent in 2014 (see Figure 2.2).
2.2 Contribution to growth by the pharmaceutical industryWith its comparatively high productivity (see Section 3), high investments in re-search and development and the entrepreneurial success resulting from a grow-ing global demand in recent years as well as continuing advances in technology, the pharmaceutical industry has turned into one of the most important industries of the Swiss national economy. This is most clearly demonstrated by the increase in value creation generated by the industry.
Between 2000 and 2014 the real gross domestic product increased at an annual rate averaging 1.81 percent. About one sixth of this growth was contributed by the pharmaceutical industry. On average, real gross value added by the pharma-ceutical industry to the economy as a whole accounted for 3.7 percent. Only the trade industry was similarly successful during that time, driven particularly by the achievements in wholesales, with a contribution to growth of 0.44 percentage points, and the public sector with 0.33 percentage points.
Although the pharmaceutical industry depends heavily on exports (see Section 4) positive growth contributions were generated in a market environment of a strong Swiss currency, which indicates that the pharmaceutical industry is very competitive. The average contributions to the growth of the Swiss gross domes-tic product by other predominantly export-oriented industries, such as the metal industry, machine engineering or the hotel and restaurant industry have been negative since 2000.
Consequently, the pharmaceutical industry not only carries great importance for the economy as a whole, it also has a disproportionate effect on the develop-ments in the industry sector. Around 60 percent of the total industrial growth of 1.99 percent per year was attributable to the contribution provided by the phar-maceutical sector, making it the key driver of the Swiss industry.

Importance of the Pharmaceutical Industry 27
Source: BAK Basel Economics, Polynomics.
Table 2.1 | Contribution to growth by selected industries
Annual contribution to the average increase in real gross value creation of the national economy (in percentage points), 2000–2014
To national economy To industry sector
Pharmaceutical 0.31 1.15
Chemical 0.04 0.14
Metal –0.01 –0.05
Electronics/precision engineering
0.15 0.58
Machine engineering –0.01 –0.05
Trade 0.44 –
Hotels and restaurants –0.03 –
IT/communication 0.07 –
Financial sector 0.18 –
Business services 0.09 –
Public sector 0.33 –
National economy +1.81% –
Industry sector – +1.99%

28 BAK Basel Economics / Polynomics
2.3 International comparisonIn addition to above-average value creation by the pharmaceutical industry within Switzerland’s industry structure, the Swiss pharmaceutical sector is also a top performer at an international level.
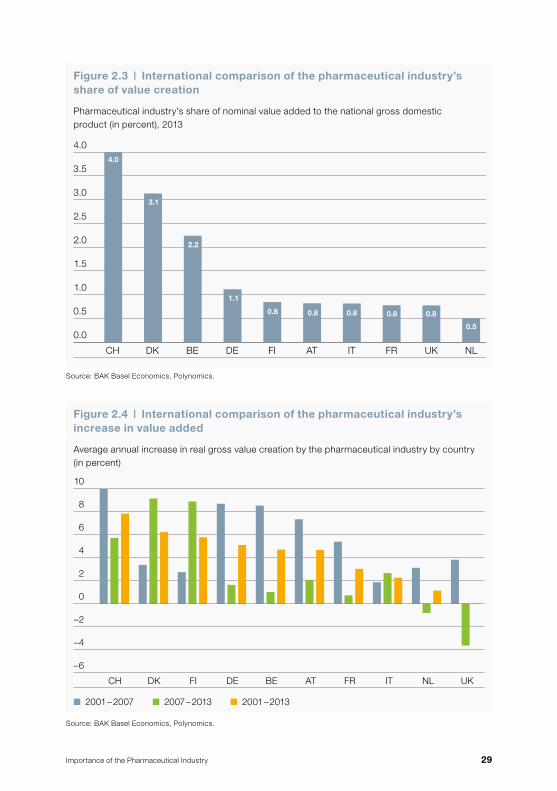
Contribution by the pharmaceutical industryBased on an international comparison, the share of the pharmaceutical value creation in the value creation of the Swiss economy overall is very high. In 2013 about 4 percent of the national value creation in Switzerland was generated by the pharmaceutical industry (see Section 2.1). In many industrial nations, this figure is below one percent (see Figure 2.3). Within Europe, it is also above aver-age in Denmark (3.1%) and in Belgium (2.2%), but still considerably lower than in Switzerland.
Growth rateThe edge that Switzerland has over the other countries has increased, especially also with regard to the above-average growth rates. Between 2001 and 2013 the average annual growth rate in gross value creation of the Swiss pharmaceutical industry was higher than in other nations. This is attributable, in particular, to high annual growth rates between 2001 and 2007. Switzerland is followed by Den-mark, Finland and Germany.
Great Britain was the only country where the pharmaceutical industry was unable to increase value creation between 2001 and 2013. After a strong boost before the onset of the financial and economic crisis, the positive results were eroded by the downturn between 2007 and 2013. Similar developments were seen in the Netherlands, albeit to a somewhat lesser extent. The pharmaceutical industry in the other countries successfully continued to increase their real gross value cre-ation, even during the years of the financial and currency crises, although fre-quently at lower annual growth rates, with the exception of Denmark and Finland (see Figure 2.4).
Importance of the Pharmaceutical Industry 29
Figure 2.3 | International comparison of the pharmaceutical industry’s share of value creation
Pharmaceutical industry’s share of nominal value added to the national gross domestic product (in percent), 2013
Source: BAK Basel Economics, Polynomics.
Source: BAK Basel Economics, Polynomics.
3.0
3.5
4.5
4.0
2.5
2.0
1.5
1.0
0.5
0.0
CH DK FIDEBE FRAT IT UK NL
4.0
3.1
2.2
1.1
0.8 0.8 0.8 0.8 0.8
0.5
Figure 2.4 | International comparison of the pharmaceutical industry’s increase in value added
Average annual increase in real gross value creation by the pharmaceutical industry by country (in percent)
–6
8
12
4
0
–4
6
10
2
–2
CH DK FI DE BE FRAT IT NL UK
n 2001 – 2007 n 2007 – 2013 n 2001 – 2013
30 BAK Basel Economics / Polynomics
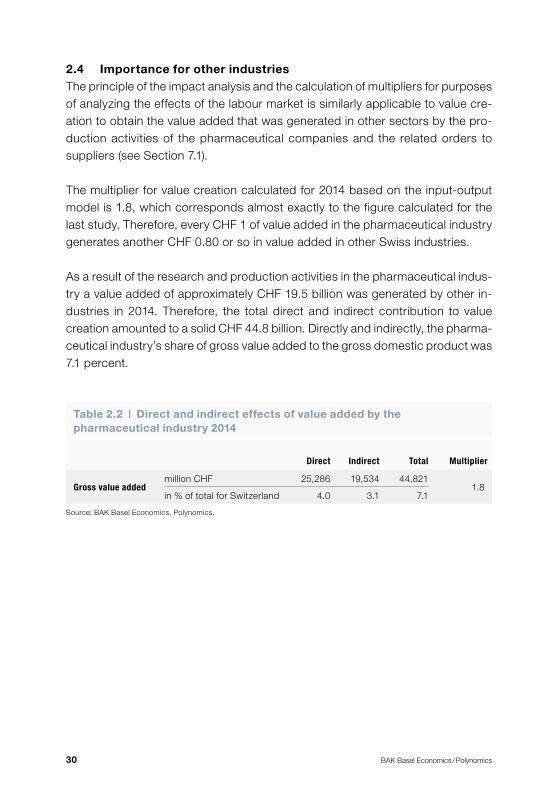
2.4 Importance for other industriesThe principle of the impact analysis and the calculation of multipliers for purposes of analyzing the effects of the labour market is similarly applicable to value cre-ation to obtain the value added that was generated in other sectors by the pro-duction activities of the pharmaceutical companies and the related orders to suppliers (see Section 7.1).
The multiplier for value creation calculated for 2014 based on the input-output model is 1.8, which corresponds almost exactly to the figure calculated for the last study. Therefore, every CHF 1 of value added in the pharmaceutical industry generates another CHF 0.80 or so in value added in other Swiss industries.
As a result of the research and production activities in the pharmaceutical indus-try a value added of approximately CHF 19.5 billion was generated by other in-dustries in 2014. Therefore, the total direct and indirect contribution to value creation amounted to a solid CHF 44.8 billion. Directly and indirectly, the pharma-ceutical industry’s share of gross value added to the gross domestic product was 7.1 percent.
Source: BAK Basel Economics, Polynomics.
Table 2.2 | Direct and indirect effects of value added by the pharmaceutical industry 2014
Direct Indirect Total Multiplier
Gross value addedmillion CHF 25,286 19,534 44,821
1.8in % of total for Switzerland 4.0 3.1 7.1

Importance of the Pharmaceutical Industry 31
Importance of investments for other industries
In recent years, the pharmaceutical industry has expanded its Swiss base like no other sector, and this trend will continue in the years ahead. Examples of high in-vestment activity are the expansion of the Novartis campus and the renovation and expansion of the Roche headquarters in Basel. The multibillion investments made by the pharmaceutical industry are strengthening local research and production and signify a strong commitment to Switzerland as an industrial base. Companies in other industries also benefit from these investments in the form of orders for the construction of buildings, laboratory instruments, IT investments and other equip-ment. Model calculations have shown that a typical construction investment of CHF 1 billion will generate total domestic value added of approximately CHF 735 million. The value creation effect of a typical investment in machinery and equipment in the amount of CHF 1 billion is approximately CHF 417 million.
32 BAK Basel Economics / Polynomics
3 Productivity of the Pharmaceutical Industry
With above-average dynamic growth and continuous investments in research and development the pharmaceutical sector became the most productive indus-try in Switzerland. Over the years, its contribution to the increase in the product-ivity of the national economy has continued to grow.
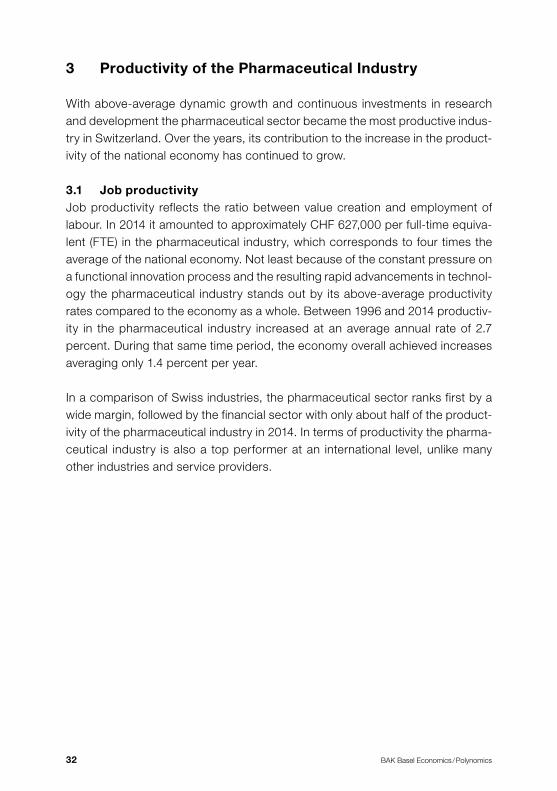
3.1 Job productivityJob productivity reflects the ratio between value creation and employment of labour. In 2014 it amounted to approximately CHF 627,000 per full-time equiva-lent (FTE) in the pharmaceutical industry, which corresponds to four times the average of the national economy. Not least because of the constant pressure on a functional innovation process and the resulting rapid advancements in technol-ogy the pharmaceutical industry stands out by its above-average productivity rates compared to the economy as a whole. Between 1996 and 2014 productiv-ity in the pharmaceutical industry increased at an average annual rate of 2.7 percent. During that same time period, the economy overall achieved increases averaging only 1.4 percent per year.
In a comparison of Swiss industries, the pharmaceutical sector ranks first by a wide margin, followed by the financial sector with only about half of the product-ivity of the pharmaceutical industry in 2014. In terms of productivity the pharma-ceutical industry is also a top performer at an international level, unlike many other industries and service providers.
Importance of the Pharmaceutical Industry 33
Figure 3.1 | Job productivity
Nominal gross value added per job (FTE), in CHF
Source: BAK Basel Economics, Polynomics.
Source: BAK Basel Economics, Polynomics.
600,000
700,000
800,000
500,000
400,000
300,000
200,000
100,000
0
1980 1997 2014
National economy Pharmaceutical industry
Figure 3.2 | Productivity per hour worked
Nominal productivity generated per hour worked (in CHF), 2014
300
350
250
200
150
100
50
0
Phar
mac
eutic
alin
dust
ry
Fina
ncial
sec
tor
Chem
ical in
dust
ry
Elec
troni
cs/p
recis
ion
engi
neer
ing
IT/co
mm
unica
tion
Trad
eNat
iona
l Eco
nom
y
Mac
hine
eng
inee
ring
Busin
ess
serv
ices
Publ
ic se
ctor
Met
al in
dust
ry
Hotels
and
rest
aura
nts
155
111 10994
86 81 76 76 7260
31
332

34 BAK Basel Economics / Polynomics
3.2 Productivity per hour workedIn terms of productivity per hour worked the pharmaceutical industry also leads the list. In 2014 every employee of a pharmaceutical company generated an average of CHF 332 per hour worked, four times the national average.
Between 1996 and 2014 the pharmaceutical industry has increased its product-ivity per hour by an average of 2.9 percent every year, starting at CHF 200 per hour in 1996. Similar to the productivity per worker, productivity per hour has also declined slightly since 2008. The economy as a whole achieved an average annual growth rate of 1.7 percent in productivity per hour between 1996 and 2014. In 2014 the level of productivity of the Swiss economy stood at CHF 81 per hour.
Compared to other high value creation sectors, such as the financial sector, the chemical industry, precision engineering and electronics or information and tele-communications, the productivity level in the pharmaceutical industry is consid-erably higher (see Figure 3.2). Although the financial sector has returned to more stable growth rates in productivity following the onset of the financial and bank-ing crisis in 2007/2008, the sector’s productivity per hour worked, even as the second-most productive industry, was less than half of the productivity per hour worked in the pharmaceutical industry in 2014.

Importance of the Pharmaceutical Industry 35
3.3 Contribution to growth by the pharmaceutical industryThe above-average increase in productivity in the pharmaceutical industry over time has led to a growing importance of its contribution to the national product-ivity overall. Between 2007 and 2014 the pharmaceutical industry contributed an annual average of 0.76 percentage points to the growth in job productivity of the Swiss economy. The pharmaceutical industry was also a major driver of the in-crease in productivity of the manufacturing sector.
However, at the beginning of the new millennium (2000–2007), this contribution averaged 1.52 percentage points. Both in the economy as a whole and in the pharmaceutical industry, the average increases in productivity flattened out slightly. The importance and the constancy of the pharmaceutical industry during times of economic crisis also became evident as it continued to achieve above- average increases in productivity.
In an industry comparison, it was found, in particular, that the financial sector has lost much steam as a result of the 2007/2008 economic crisis. While the financial sector was instrumental in the productivity growth of the economy as a whole between 2000 and 2007, the contribution by the banking and insurance sector plunged in subsequent years.
A number of branches of industry, which lost much of their lustre especially due to the strengthening of the Swiss currency, suffered a similar fate. The chemical and the electronic/precision engineering sectors contributed considerably less on average to the total growth in productivity and between 2007 and 2014 their contributions continued to dwindle further.

36 BAK Basel Economics / Polynomics
Table 3.1 | Contribution to the increase in productivity by selected industries
Annual contribution to the average national increase in job productivity (in percentage points), 2000–2014
2000–2007 2007–2014
Pharmaceutical 1.52 0.76
Chemical 0.24 0.01
Metal 0.00 0.06
Electronics/precision engineering
0.25 0.10
Machine engineering –0.01 0.02
Trade 1.13 0.62
Hotels and restaurants 0.05 0.07
IT/communication 0.06 –0.02
Financial sector 0.37 0.01
Business services 0.01 –0.06
Public sector –0.05 0.00
National economy +1.06% +0.33%
Source: BAK Basel Economics, Polynomics, SFSO.

Importance of the Pharmaceutical Industry 37
Focus on Biotechnology
The term biotechnology generally refers to technical or technically useable elem-ents from the fields of biology or biochemistry, including, in particular, the com-mercial exploitation of knowledge acquired in molecular biology, virology, micro-biology, and cell biology. According to the Organization for Economic Cooper- ation and Development (OECD) the term is defined as “the application of science and technology to living organisms, as well as parts, products or models thereof, to alter living or non-living materials for the production of knowledge, goods and services” (OECD, 2009). This is a very broad definition and it also includes many traditional or conventional activities not covered by the current understanding of biotechnology. To this end, a more specific definition has been established break ing down the modern biotechnology industry into three major segments: Green biotechnology involves plants in the broadest sense and is used to manu-facture food and animal feed.
Red biotechnology is related to the development and production of drugs, for example by modifying bacterial genes enabling them to produce basic pharma-ceutical substances, such as insulin. White (or grey) genetic engineering uses genetically modified microorganisms to increase the efficiency and hygiene of industrial production compared to standard manufacturing processes. Biotech-nology is a cross-sectional technology applied primarily in the agricultural, pharma ceutical, chemical, agro and food industries, in medical technology, re-search and development as well as in waste management, although it is not di-rectly attributable to any of these industries.
According to the Ernst & Young biotechnology report (2015a), the biotech indus-try, after years of consolidation, has set new records in 2014 in terms of profits, sales, research, and stock market performance. The industry is no longer made up of mostly small research and development firms as it was just a few years ago. Biotech companies are increasingly growing into established businesses, as evi-denced, among other factors, by the increase in initial public offerings: 94 U.S. and European biotech companies went public in 2014, breaking the record of 79 IPOs set in 2000. In addition, the number of mergers and acquisitions has also gone up. The transaction volume in the biotech industry reached a ten-year high with 68 mergers and acquisitions (M&A). In 2014 the companies listed on the stock exchange achieved a total market value of over USD 1,000 billion for the first time. By comparison, market capitalization in 2012 was USD 90 billion. These trends were also reflected in the sales, which increased by 24 percent to USD

38 BAK Basel Economics / Polynomics
123.1 billion between 2013 and 2014. Net profits of USD 14.9 billion more than tripled during that same period. This upturn in sales and profits was also driven by a significant increase in new product approvals. In 2014, the U.S. Food and Drug Administration (FDA) approved a total of 41 new products compared to just 27 in 2013. The long list of new substances currently in corporate pipelines is expected to ensure continued growth in the future. Overall, 3,592 substances were in the development or approval phase last year (prior year 2,768). Research and development expenditures, another key indicator for strength and future growth, increased by 20 percent compared to 2013. On average, the industry is investing close to 29 percent of its sales (USD 35.4 billion), with small companies investing at a disproportionately higher rate. Another indication of future trends is provided by the information on innovation capital invested in the industry. In 2014 biotech companies in the USA and in Europe raised funds totalling USD 54.3 billion, which corresponds to an impressive upsurge of 72 percent from 2013, in itself a successful year.
For the biotech industry, Switzerland is a valuable research, production and network centre, made even more attractive by a highly qualified workforce in addition to liberal political conditions. According to Ernst & Young (2015b) sales of CHF 4.9 billion were generated in 2014, representing a growth rate for the year of over 4 percent (CHF 4.7 billion) and clearly continuing the positive trend that began in 2012. However, due to a strong performance worldwide, the share in global sales has steadily declined from 5.4 percent in 2012 to 4 percent in 2014. Research and development expenditures in 2014 amounted to around CHF 1.5 billion, slightly above the level in prior years. Profits of CHF 427 million in 2014 also increased further from CHF 311 million in 2013. According to the Ernst & Young report (2015b), profits are generated by 207 companies engaged in R&D and 57 engaged in sales, with a combined total of 14,492 employees in 2014. Compared to the prior year, this represents an increase of 361 qualified full-time positions. Most of the jobs were created by large corporations listed on the stock exchange. While most of the industry’s workforce was employed by privately held

Importance of the Pharmaceutical Industry 39
unlisted companies in 2012 and 2013, the number had decreased to just over 50 percent by 2014, reflecting the general industry trend toward larger, established biotech companies, and also driven to a large extent by M&A. These businesses are predominantly located in the Lake Geneva region and in the areas of Zurich, Zug and Basel. The concentration of companies in these three clusters is also manifested in terms of financing. The “Swiss Venture Capital Database” main-tained by the University of Basel shows the flow of capital in various industries and regions (see Dubacher et al., 2015). In 2014 venture capital of approximately CHF 180 million was invested in the biotechnology industry in the Cantons of Basel-City, Geneva and Vaud, corresponding to around 95 percent of the total biotechnology venture capital volume of CHF 189 million. This, in turn, represents just under 25 percent of the total investments of approximately CHF 720 million in Swiss biotech companies, which increased by around CHF 300 million from the prior year.

40 BAK Basel Economics / Polynomics
4 The Pharmaceutical Industry as an Export Sector
The importance of the pharmaceutical industry for the economy is also evi-denced by pharmaceutical exports. In 2014 a third of all Swiss exports was at-tributable to the pharmaceutical industry.
4.1 Total exportsThe pharmaceutical industry is heavily export oriented. Around 90 percent of the goods it produces are sold abroad. Only the watchmaking industry is similarly dependent on the demand from abroad.
In 2014, total exports of the pharmaceutical industry reached a new peak of CHF 71 billion, or five times the amount of 1996 when CHF 14 billion worth of pharma-ceutical products were exported. Consequently, since 1996 nominal exports of the pharmaceutical industry have grown by 9.4 percent a year (economy overall: +4.6 percent).
Exports of pharmaceutical products have not only steadily increased in absolute numbers (exception 2011), but also in comparison with total Swiss exports: While pharmaceutical products accounted for only 15 percent of Swiss exports in 1996, they represented around 34 percent in 2014. As a result, the pharmaceut-ical sector was the most important export industry by far. The share of watch exports (11 percent) and exports of machinery and chemical products (10 and 6 percent) were considerably lower in 2014.

Importance of the Pharmaceutical Industry 41
Figure 4.1 | Change in the share of exports
Shares of nominal exports of selected industries in total exports (in percent), 1996–2014
Source: EZV, BAK Basel Economics, Polynomics.
1996 1998 2000 2002 2004 2006 2008 2010 2012 2014
0
10
20
30
40
50
60
70
80
90
100
20
19
16
9
8
13
15
19
16
9
8
12
17
18
17
8
8
11
18
15
15
7
8
10
23
15
15
8
8
10
24
14
15
7
8
9
27
13
15
7
8
8
27
11
15
7
8
8
32
10
13
7
11
7
34
10
14
6
11
7
33
2220 20 20 22 19 181919
n Pharmaceutical industry n Chemical n Metal n Watches
n Machinery n Electronics and precision instruments n Rest
Figure 4.2 | Development of pharmaceutical exports based on destination
In percent
Source: EZV, BAK Basel Economics, Polynomics.
0 10080604020
2000
2007
2014
Rest Welt
BRIC
Japan
USA
Rest EU
Grossbritannien
Frankreich
Italien
Deutschland
14 9 10 6 21 11 6 194
14 11 8 5 24 10 5 185
14 8 5 5 22 16 4 197
n Germany n Italy n France n Great Britain n Rest EU
n USA n Japan n BRIC n Rest world
42 BAK Basel Economics / Polynomics
4.2 Exports based on destination The most important market for Swiss pharmaceutical products in 2014 was the European Union, where exports in an amount of CHF 38.3 billion were sold, corresponding to a share of 54 percent of total pharmaceutical exports. The pharmaceutical industry accounted for 34 percent of all exports into the EU. Demand within the EU varies significantly. Around 25 percent of pharmaceutical exports to the EU were sold to Germany, 14 percent to Italy, 10 percent to France and 7 percent to Austria. Other important markets are Great Britain and Spain.
In 2014 pharmaceutical products valued at CHF 11.5 billion were sold to the U.S. During the economic recovery following the 2007/2008 financial and banking crisis the U.S. became the most important market for Swiss pharmaceutical products. Exports sold to the U.S. went up from 10 to 16 percent between 2008 and 2014. Consequently, the importance of pharmaceutical goods with regard to total exports to the U.S. has also increased. While only around 20 percent of the exports to the U.S. were attributable to pharmaceutical products in 2000, they accounted for 45 percent of exports to the U.S. in 2014.
Japan is another important export market. In 2014 exports totalling approxi-mately CHF 2.5 billion were sold to the yen region, corresponding to 3.6 percent of total pharmaceutical exports. However, after reaching an all-time high in 2009 (CHF 3.8 billion), exports to Japan have fallen off somewhat in recent years.
The growing middle classes and demographic shifts in the populations of emerg-ing nations caused pharmaceutical exports to the BRIC countries (Brazil, Russia, India, China) to grow steadily. While pharmaceutical products in an amount of CHF 443 million were exported from Switzerland to the BRIC countries in 1996, this figure had increased to CHF 4.7 billion by 2014, with China (CHF 2.8 billion) and Russia (CHF 880 million) representing the major markets.

Importance of the Pharmaceutical Industry 43
Focus on Exchange Rates
Effective January 15, 2015, the Swiss National Bank discontinued the minimum exchange rate of CHF 1.20 against the euro introduced on September 6, 2011. After an immediate strengthening of the Swiss currency, the exchange rate has since recovered somewhat, although the Swiss franc is still viewed as overvalued. The effects of these significant changes in the exchange rate situation on the different sectors of the Swiss national economy vary. Consumers in general and industries that import their materials largely from the euro zone and sell their products and services on the Swiss market are considered to be the winners. Export-oriented sectors, particularly those importing only a minor share of their materials from the euro zone, have been negatively impacted.
The pharmaceutical industry is heavily focused on exports. In 2014 it accounted for 33.6 percent of Switzerland’s nominal exports of goods. During that same year, some 54 percent of pharmaceutical exports were sold to the EU region. The remaining exports went to countries outside of the EU, with the USA, China and Japan, in particular, representing the major buyers of Swiss exports.
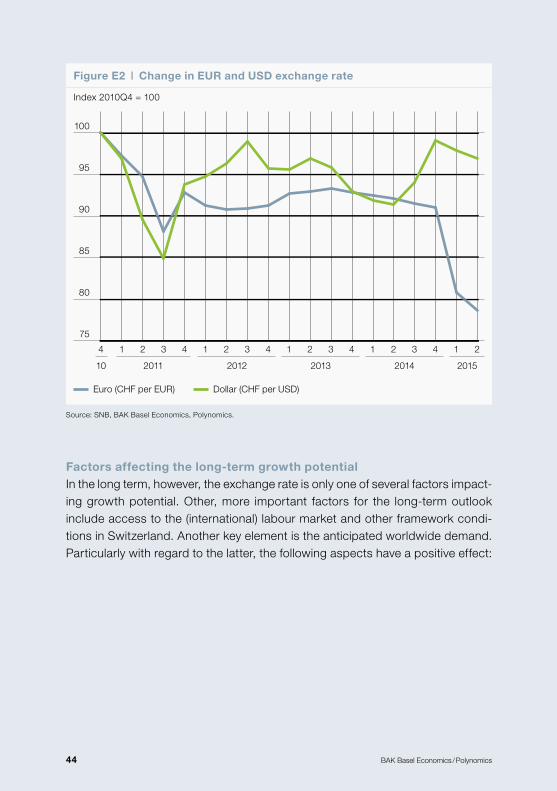
As shown in Figure E2, the recent exchange rate situation between the Swiss franc and the US dollar, as the key currency for non-EU exports, has not changed as much as the relationship between the Swiss franc and the euro, although the US dollar has also weakened against the Swiss franc over the course of the last ten years. Since the lion’s share of exports is sold to the euro and the dollar re-gions, the strengthening of the Swiss currency is affecting the pharmaceutical industry in Switzerland. The reason is that while the sales generated in the export markets continue to decline on account of the exchange rate, the relative cost of operating in Switzerland has gone up because of the strong franc. This results in lower profit margins, for one, and for another, the internal pressure in some companies regarding a possible relocation is building, the latter primarily be-cause globally operating pharmaceutical companies located in Switzerland are burdened by an unfavourable cost-sales ratio. This means that the costs incurred in Switzerland vastly exceed the sales generated in this country.
Source: SNB, BAK Basel Economics, Polynomics.
44 BAK Basel Economics / Polynomics
Figure E2 | Change in EUR and USD exchange rate
Index 2010Q4 = 100
Factors affecting the long-term growth potentialIn the long term, however, the exchange rate is only one of several factors impact-ing growth potential. Other, more important factors for the long-term outlook include access to the (international) labour market and other framework condi-tions in Switzerland. Another key element is the anticipated worldwide demand. Particularly with regard to the latter, the following aspects have a positive effect:
Euro (CHF per EUR) Dollar (CHF per USD)
100
95
90
85
80
75
4 1 2 3 4 1 2 3 4 1 2 3 4 1 2 3 4 1 2
2011 2012 2013 2014 201510

Importance of the Pharmaceutical Industry 45
• Faster growth of incomes Growth rates in the buyer countries that are important for the pharmaceutical industry are above average compared to the EU. The average annual growth rates between 2015 and 2020 in countries such as China (5.5%), the USA (2.7%) and in selected key countries in Africa (4.5%) and Latin America (3.2%) are expected to exceed those projected for the EU (1.8%) and Switzerland (1.9%). The increasingly dynamic economic growth goes hand in hand with an increase in incomes in these countries, which is likely to have a positive impact on the demand for healthcare services in these nations.
• AgeingAccording to United Nations estimates, the percentage of the over-60 popu-lation worldwide will continue to rise significantly in the years ahead. While it was just 9.2 percent in 1990, it rose to 11.7 percent by 2013 and is expected to reach 21.1 percent by 2050. The major reasons for this are a drop in mor-tality and declining birth rates. An increasingly ageing society combined with higher incomes has a stimulating effect on the demand for healthcare ser-vices.
• Rise in chronic diseases The World Health Organization (WHO) estimates that worldwide, chronic illnesses are responsible for 60 percent of the years lost to premature death. In addition to the lost years of life, chronic diseases frequently also have an adverse impact on the quality of life. If this aspect is additionally taken into account, chronic diseases are responsible for 46 percent of the years with reduced quality of life and lost years. This number is expected to increase to 57 percent by 2020. Approximately half of the deaths caused by chronic illnesses are attributable to cardiovascular diseases. However, obesity and diabetes, which is increasingly occurring at a younger age, will also be on the rise in the coming years. All these developments will boost the demand for medication.
46 BAK Basel Economics / Polynomics
On the other hand, the following aspects are more likely to have a negative effect on the growth prospects of the pharmaceutical industry:
• Stricter regulationsAlong with the rising costs of healthcare, regulations in many countries are expected to tighten. From the point of view of the pharmaceutical industry, this is primarily associated with the risks of more restrictive price regulations, di-minishing patent protection or the lack of consistent enforcement of such protection and the related risk of limited market access.
• Rising cost of new drugsResearch and development expenses for new drugs will continue to go up. The estimated cost of CHF 1 to 1.5 billion for the development of a new, in- novative drug will cause R&D activities to continue focusing on the medical fields with a constant high demand for new treatments. In addition, the willin-gness to pay for the treatment of diseases such as cancer and Alzheimer’s as well as widespread autoimmune disorders, e.g. rheumatoid arthritis and mul-tiple sclerosis, is likely to be substantial.

Importance of the Pharmaceutical Industry 47
5 Summary
This study presents the latest available results on the macroeconomic import-ance of the pharmaceutical industry in Switzerland based on updated data. The economic statistics of Switzerland underwent a major change in the past year with the revision of the national accounts and the related adoption of the Euro-pean System of National and Regional Accounts (ESA 2010). One of the changes involves research and development expenditures which are now considered to be part of gross value added. This had a particularly significant impact on the calculation of value creation for the research-intensive pharmaceutical industry.
Growing importance for the labour market Employment in the pharmaceutical industry continues to grow at a very high level. The annual increase since the end of the structural transformation in 1996 averaged approximately 3.7 percent and, in contrast with many other industry sectors, was virtually unaffected by the economic and financial crisis. In 2014, the pharmaceutical industry employed around 42,000 workers, corresponding to approximately 40,000 full-time equivalents. As a result, the pharmaceutical industry is becoming an increasingly important employer in Switzerland. At the current time, its share of total employment is approximately 1 percent (full-time equivalents, FTE) compared to 0.6 percent in 1996.
High real growth and increasing importance for the national economyThe growing importance of the pharmaceutical industry is also reflected in the above-average growth in value added. In 2014, the pharmaceutical industry gen-erated value added of CHF 25.3 billion. In the past two decades real gross value added increased by an average of 9.4 percent per year and as a result, the in-dustry’s macroeconomic importance continued to rise steadily. Its share of value creation in the economy as a whole was 4.0 percent in 2014.
Price pressure inhibiting nominal growth in recent yearsAlthough the pharmaceutical industry continued to achieve considerable real growth in the past few years, producer and consumer prices have been under significant pressure since 2010, which has a negative impact on nominal value added. The price pressures are due not only to political developments in Switz-erland, but also to exchange rate developments. The strengthening of the Swiss currency caused margins to erode and resulted in reduced profits in the short term and a temporary (2011) decrease in nominal gross value added.

48 BAK Basel Economics / Polynomics
Fundamental factors suggest continued strong structural growthMore than economic factors, such as the exchange rate, fundamental factors are affecting long-term growth in the pharmaceutical industry. These factors include, e.g. access to the (international) labour market and other framework conditions in Switzerland (regulation). On the demand side, structural factors, such as demo-graphic changes, a growing middle class in emerging nations and an increase in the occurrence of chronic diseases are major drivers of the industry.
Significant lead in productivity compared to other industriesThe newly available data illustrates the pharmaceutical industry’s lead in product-ivity over the other industries even more clearly than before. With value added of CHF 332 per hour worked or CHF 627,000 per job, productivity in the pharma-ceutical industry in 2014 was approximately four times higher than that of the economy as a whole and 3.5 times higher than the industry sector overall. The disproportionately high job productivity is an indication of how competitive the pharmaceutical companies are. It is a result of strong capitalization, extensive innovation activities and high production efficiency.
Impact analysis: other industries benefit from the success of the pharmaceutical industryThe significant importance of the pharmaceutical industry for the Swiss labour market is also evidenced by the fact that its production and research activities generate numerous jobs in companies of other industries. The reason is that in order to manufacture its products, the pharmaceutical industry not only requires labour and capital. It also requires input in the form of goods and services from other industries. Within the scope of an impact analysis, all relevant payment streams triggered by the economic activities of the pharmaceutical industry were analyzed and quantified by vertical integration across the entire value-added chain. The so-called multipliers are a key result of the impact analysis. They in-dicate the factor by which the effect of the industry under review is intensified at the macroeconomic level taking into account all economic interactions.
Importance of the Pharmaceutical Industry 49
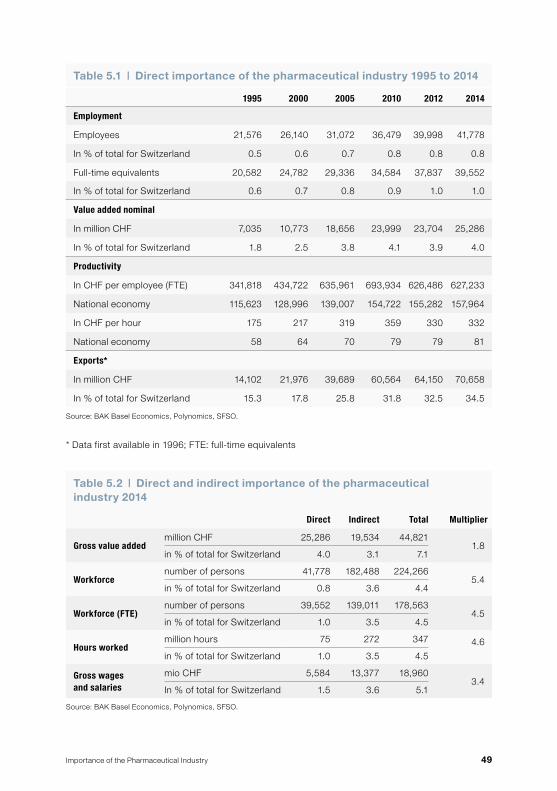
Table 5.1 | Direct importance of the pharmaceutical industry 1995 to 2014
1995 2000 2005 2010 2012 2014
Employment
Employees 21,576 26,140 31,072 36,479 39,998 41,778
In % of total for Switzerland 0.5 0.6 0.7 0.8 0.8 0.8
Full-time equivalents 20,582 24,782 29,336 34,584 37,837 39,552
In % of total for Switzerland 0.6 0.7 0.8 0.9 1.0 1.0
Value added nominal
In million CHF 7,035 10,773 18,656 23,999 23,704 25,286
In % of total for Switzerland 1.8 2.5 3.8 4.1 3.9 4.0
Productivity
In CHF per employee (FTE) 341,818 434,722 635,961 693,934 626,486 627,233
National economy 115,623 128,996 139,007 154,722 155,282 157,964
In CHF per hour 175 217 319 359 330 332
National economy 58 64 70 79 79 81
Exports*
In million CHF 14,102 21,976 39,689 60,564 64,150 70,658
In % of total for Switzerland 15.3 17.8 25.8 31.8 32.5 34.5
Source: BAK Basel Economics, Polynomics, SFSO.
* Data first available in 1996; FTE: full-time equivalents
Source: BAK Basel Economics, Polynomics, SFSO.
Table 5.2 | Direct and indirect importance of the pharmaceutical industry 2014
Direct Indirect Total Multi plier
Gross value addedmillion CHF 25,286 19,534 44,821
1.8in % of total for Switzerland 4.0 3.1 7.1
Workforcenumber of persons 41,778 182,488 224,266
5.4in % of total for Switzerland 0.8 3.6 4.4
Workforce (FTE)number of persons 39,552 139,011 178,563
4.5in % of total for Switzerland 1.0 3.5 4.5
Hours workedmillion hours 75 272 347 4.6
in % of total for Switzerland 1.0 3.5 4.5
Gross wages and salaries
mio CHF 5,584 13,377 18,9603.4
In % of total for Switzerland 1.5 3.6 5.1

50 BAK Basel Economics / Polynomics
The calculation based on the number of jobs (full-time equivalents, FTE) results in a multiplier of 4.5. Every job in the pharmaceutical industry generates 3.5 full-time equivalents in other industries that benefit indirectly from the research and production activities of the pharmaceutical companies. Therefore, in 2014 the 40,000 or so jobs in the pharmaceutical industry resulted in approximately 139,000 additional jobs in other companies. In 2014 these additional jobs were related to wages paid totalling approximately CHF 13 billion. For every CHF 1,000 in wages paid in the pharmaceutical industry, an average of around CHF 2,400 is additionally paid to employees in companies of other industries.
The multiplier calculated for gross value added is 1.8, which means that every CHF 1 of value created in the pharmaceutical sector generates another CHF 0.80 of value added in other Swiss industries. Overall, other companies benefit from the research and production activities of the pharmaceutical industry in the form of value added in excess of CHF 19.5 billion. The total direct and indirect contri-bution to value added in 2014 was around CHF 45 billion, corresponding to 7.1 percent of the national gross value added.

Importance of the Pharmaceutical Industry 51
6 Bibliography
Archstone Consulting Economic Impact of the Biopharmaceutical Sector on New York State [report]. – Stamford, CT: Archstone Consulting, 2009b.
Archstone Consulting The Biopharmaceutical Sector’s Impact on the U.S. Economy [report]. – Stamford, CT: Archstone Consulting, 2009a.
Battelle Technology Partnership Practice The U.S. Biopharmaceuticals Sector: Economic Contribution to the Nation [report]. – [s.l.]: Pharmaceutical Research and Manufacturers of America (PhRMA), 2011.
Dubacher J. [et al.] Swiss Venture Capital Report No. 3 [report]. – Lucerne: startupticker.ch, 2015.
Ernst & Young Beyond Borders: Biotechnology Industry Report [report]. – 2015a.
Ernst & Young Swiss Biotech Report [report]. – 2015b.
Ewen Peters Associates Contribution of Pharma-Related Business Activity to the Scottish Economy [report]. – Edinburgh: Association of the British Pharma-ceutical Industry (ABPI), 2006.
Milken Institute Biopharmaceutical Industry Contributions to State and U.S. Economics [report]. – Santa Monica, CA: Milken Institute, 2004.
Nusser M. and Tischendorf A. Innovative Pharmaindustrie als Chance für den Wirtschaftsstandort Deutschland [Innovative pharmaceutical industry as an op-portunity for Germany as a business base] [report]. – [s.l.]: Fraunhofer-Institut für System- und Innovationsforschung
A.T. Kearney, study commissioned by PhRMA (Pharmaceutical Research and Manufacturers of America), the industry association of the research-based phar-maceutical companies in the USA and the German LAWG [Local American Work-ing Group], 2006.
OECD OECD Biotechnology Statistics [report]. – Paris: OECD, 2009.

52 BAK Basel Economics / Polynomics
Pavel F. [et al.] Ökonomischer Fussabdruck von Novartis Deutschland: Die Bedeutung von Novartis für den Wirtschafts- und Wissenschaftsstandort Deutschland [report]. – 2015: Politikberatung kompakt 94, Deutsches Institut für Wirtschaftsforschung (DIW), 2015.
Polynomics Wirkung des Breitbandausbaus auf Arbeitsplätze und die deutsche Volkswirtschaft [Impact of the expansion of broadband on jobs and the German economy [report]. – New York, Olten : [s.n.], 2009.
Weiss J.-P., Raab S. et Schintke J. Demand for Pharmaceuticals - Impact on Production and Employment in Nearly Every Sector of the Economy [report]. –Berlin: Politikberatung kompakt 4, Deutsches Institut für Wirtschaftsforschung (DIW), 2005.
Weiss J.-P., Raab S. et Schintke J. Die pharmazeutische Industrie im ge- samtwirtschaftlichen Kontext: Ausstrahlung auf Produktion und Beschäftigung in den Zulieferbranchen [report]. – Berlin: Politikberatung kompakt in Weekly Report 6/2005, Deutsches Institut für Wirtschaftsforschung (DIW), 2004.

Importance of the Pharmaceutical Industry 53
7 Annex
7.1 Concept of the impact analysis7.1.1 Underlying ideaThe idea underlying the impact analysis is to present all payment streams trig-gered in connection with the economic activity of the pharmaceutical industry and to quantify the related effects on value creation, employment and income. The result is a virtual vertical integration along the entire value creation chain from procurement to production and up to the sale of goods.
7.1.2 Impact levelsBasically, we differentiate between three levels of impact: The first impact level consists of the direct effects of the pharmaceutical industry involving the indus-try’s direct performance in terms of macroeconomics (gross value added) and the related impact on employment and income. The second level of impact shows various secondary effects that require specification, including orders placed with other companies in connection with production (input) and consumer demand by the workforce. At the third impact level the overall macroeconomic effects resulting from the various secondary effects are identified and quantified.
The purpose of the impact analysis is to quantify the macroeconomic effects resulting from the various secondary effects within the economic cycle. In doing this, a number of multiplier effects are taken into account based on an impact model. These multiplier effects are caused by the multifaceted economic rela-tions of the companies involved. For example, in order to manufacture drugs, machinery is required, semi-finished products or electric power, which is ob-tained from other businesses. Suppliers of goods and service providers, in turn, also generate value added and jobs.
Aside from these effects, the impact analysis additionally takes into account that the manufacturers of semi-finished products and other suppliers also obtain products and services from other companies and this input, in turn, is also pur-chased from other suppliers that also generate value added, and so on. The effects of value added are decreasing in every additional “round”. The thought experiment can be solved mathematically using the impact model and all the consequential effects resulting from the secondary effects can be quantified.

54 BAK Basel Economics / Polynomics
7.1.3 Impact modelThe key instrument of an impact analysis is the input-output model, which is a static model of equilibrium whose system of equation is derived from the struc-tural information about the composition of supply and demand for the goods and services of a particular industry.
The input-output analysis is based on a schematic representation of the national economy illustrating the interdependency between the different industries and the relationship between final demand, domestic production and imported goods (see Figure 7.1). The horizontal axis shows the utilization of the goods and ser-vices manufactured by the sectors. They either flow into other sectors in the form of input or they are consumed, invested or exported directly in the form of final demand. The sum of input demand and final demand represents the total de-mand.
The vertical axis shows the composition of total supply, which must correspond to total demand in a state of equilibrium. Total supply consists of domestic pro-duction (“gross production value”) and imports. Deducting the input required for production by a given sector from the gross production value provides the gross value added of the particular sector. Gross value added is used to compensate the production factors labour and capital.1
The structure of input-output models (IO models) varies. The classic IO model (type I) only considers the direct effects on the suppliers involved at the various levels of the value added chain (so-called “indirect impacts”). The utilization of the income generated at these levels is not taken into account.
By (partial) endogenization of private households, the expanded IO model (type II) allows for the fact that a part of income is reintegrated into the economic cycle in the form of consumer spending. In a further step of expansion, corporate profits and the investments financed by these profits can be similarly included. In the economic cycle, this kind of (consumer or investment) spending, in turn, will induce value creation and employment (so-called “induced impacts”).
1 In the interest of simplification, taxes and subsidies on products were excluded from the schematic representation (but not from the model).
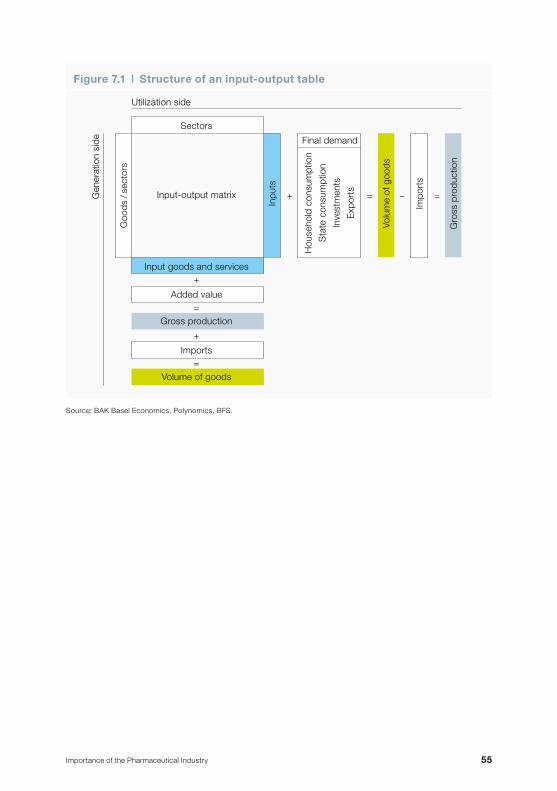
Importance of the Pharmaceutical Industry 55
Figure 7.1 | Structure of an input-output table
Source: BAK Basel Economics, Polynomics, BFS.
Input goods and services
Input-output matrix
=Gross production
Sectors
+ = –
+
Imports=
Volume of goods
+
Added value
Volu
me
of g
oods
Gro
ss p
rodu
ctio
n
=
Final demand
Hou
seho
ld c
onsu
mpt
ion
Sta
te c
onsu
mpt
ion
Inve
stm
ents
Exp
orts
Inpu
ts
Impo
rts
Goo
ds /
sect
ors
Gen
erat
ion
side
Utilization side
56 BAK Basel Economics / Polynomics
The use of the expanded type-II model is frequently criticized because the causal relationship of the induced income effect with the primary impulse is consider- ably less pronounced than in the case of the indirect effect. For example, con-sumer spending at an individual level is not only financed by income from em-ployment, but also by other sources of income (unearned income or government transfers).
The connection between the primary impulse and the resulting consumer spend-ing by workers involved is considerably less stable than the connection with the production effects of suppliers involved along the value added-chain. If the sup-pliers involved generate additional production units with existing capacities, no additional jobs are created, but additional value added is in fact created. The more links are inserted between primary impulse and the corresponding conse-quential effect in the value added chain, the more uncertain is the connection between primary impulse and the corresponding job effects.
Based on the further reaching assumptions, it should be expected that the ef-fects in the fully expanded model in consideration of the income-induced effects at every impact level are overestimating actual interdependence. On the other hand, an analysis using the simple standard model may fall short in some cases.
Limiting the induced effect to the impact of the income of the workers directly involved in the industry under review would strike a balance between the two. Such a semi-expanded IO model was used for purposes of this study, since it merely takes into account the consumer spending of the pharmaceutical indus-try’s workforce. A further restriction of the model includes opportunity income and excludes exogenous consumer spending which is independent of employ-ment in the pharmaceutical industry as well as spending abroad.

Importance of the Pharmaceutical Industry 57
7.2 International comparison of multipliers for the pharmaceutical industry
The macroeconomic impact of the pharmaceutical industry has also been ana-lyzed in other countries. This section provides a brief overview of the results of these studies.
In a study by Battelle Technology Partnership Practice (2011) for the United States both indirect and induced impacts have been calculated based on the 2009 input-output matrix, obtaining multipliers for value creation of 2.1 (type I) and 3.3 (type II). The multipliers for employment at 3.1 for indirect impacts and 5.9 for induced impacts are considerably higher than those for value creation. As in Switzerland, the sector’s above-average job productivity is likely to play a vital role in this.
In “The Biopharmaceutical Sector’s Impact on the U.S. Economy” the authors of Archstone Consulting (2009a) describe the multipliers for 2006. For gross value added, they arrive at an induced multiplier of 3.3 and of 4.7 for employment. Neglecting the induced impacts and counting only the indirect impacts results in considerably lower multipliers of just 2.0 for real value added and 2.5 for the number of employees.
In addition to the nationwide importance of the biopharmaceutical industry Arch-stone Consulting (2009b) also determined its regional economic importance for the State of New York in 2006. The multipliers are lower both for employment (type I: 1.7; type II: 2.4) and for value creation (type I: 1.5; type II: 1.8) than those for the national economy of the U.S.
An analysis conducted by the Milken Institute (2004) (“Biopharmaceutical Indus-try Contributions to State and U.S. Economics”) for 2003 with and without in-duced impacts resulted in multipliers of 2.7 and 2.1, respectively, for gross value added and 4.5 and 3.0, respectively, for employment.

58 BAK Basel Economics / Polynomics
In Scotland a study by Ewen Peters Associates (2006) (“Contribution of Pharma-Related Business Activity to the Scottish Economy”), which was carried out on behalf of the Association of the British Pharmaceutical Industry (ABPI), also con-siders the direct, indirect and induced impacts. The study, based on an in-put-output table for 2003, shows a type-II multiplier of 1.6 for both value creation and for employment.
In Germany the multipliers including induced impacts according to the calcula-tions by Polynomics (2009) on the basis of the input-output table published for 2005 are 2.1 for value creation and 3.0 for employment. If the induced impacts are neglected, the multiplier for value added is reduced to 1.5, while a value of 1.8 is obtained for the employment multiplier in this case.
On the basis of the input-output matrix of 2003, Nusser and Tischendorf (2006) have calculated multipliers of 1.6 (type I) and 2.3 (type II) for employment. A study by Weiss et al. (2004) (“The pharmaceutical industry in a macroeconomic con-text: impact on production and employment in the supplier sectors”) focused only on the direct and indirect impacts of the pharmaceutical industry.
The study was updated in 2005 (Weiss et al., 2005) based on adjusted employ-ment figures and shows a value creation multiplier of 1.7 for 1995 and of 1.8 for both 2000 and 2002. Weiss et al. (2004, 2005) calculated an employment multi-plier of 1.9 for 1995 and 2000 and of 2 for 2002.
In a company-specific analysis Pavel et al. (2015) established a multiplier (type II) of 3.1 for value added by Novartis in Germany and an employment multiplier of 4.8. This study also analyzes the Novartis multipliers at a regional level.

Importance of the Pharmaceutical Industry 59
Source: BAK Basel Economics, Polynomics.
Type I: Including the direct effects on the upstream and downstream levels of value creation (direct and indirect impacts)Type II: Also including the reintegration of income effects (direct, indirect and induced impacts)
Table 7.1 | Overview of international impact analyses for the pharmaceutical industry
Country/Authors Variable Year Type I Type II
USA
Milken Institute (2004)Value added 2003 2.1 2.7
Workforce/job holders 3.0 4.5
Archstone Consulting (2009a)Value added 2006 2.0 3.3
Workforce/job holders 2.5 4.7
Archstone Consulting (2009b)New York State
Value added 2006 1.5 1.8
Workforce/job holders 1.7 2.4
Battelle Technology Partnership Practice (2011)
Value added 2009 2.1 3.3
Workforce/job holders 3.1 5.9
Scotland
Ewen Peters Associates (2006)Value added 2009 — 1.6
Workforce/job holders — 1.6
Germany
Weiss et al. (2004)
Value added 1995 1.7 —
Workforce/job holders 1.9 —
Value added 2000 1.8 —
Workforce/job holders 1.9 —
Weiss et al. (2005)Value added 2002 1.8 —
Workforce/job holders 2.0 —
Nusser and Tischendorf (2006)Value added 2003 — —
Workforce/job holders 1.6 2.3
Polynomics (2009)Value added 2003 1.5 2.1
Workforce/job holders 1.8 3.0
Pavel et al. (2015)Valeur ajoutée 2012 — 3.1
Personnes actives/emploi — 4.8

60 BAK Basel Economics / Polynomics
Classification of multipliers for the pharmaceutical industry in SwitzerlandGenerally, the multipliers calculated for the Swiss pharmaceutical industry are to be classified as average in relation to value creation (type I). Compared to the U.S. studies, the pharmaceutical-related multipliers are at the lower end of the scale in Switzerland, which is mainly due to the perimeter of the analysis: As a result of a smaller perimeter (e.g. Switzerland vs. U.S.) the flow of funds abroad via the demand for input is greater. This relationship is also evident in the two Archstone Consulting studies, where the multipliers for the biopharmaceutical industry were calculated both for the U.S. economy nationwide and for the State of New York. The regional multipliers are considerably lower.
In terms of employment, on the other hand, the multipliers calculated for Switz-erland are significantly higher than the type-I reference multipliers for other coun-tries. The reason for this is that the productivity differential between the pharma-ceutical industry and the other sectors involved in the overall value creation process is particularly high in Switzerland. Accordingly, the number of additional jobs depending on each pharmaceutical job in Switzerland is considerably greater than abroad.


InterpharmaPetersgraben 35, P.O. BoxCH-4009 BaselPhone +41 (0)61 264 34 00Fax +41 (0)61 264 34 [email protected]