the influence of government policy and ngos on
TRANSCRIPT
OECD Global Forum on International Investment OECD Investment Division www.oecd.org/investment/gfi-7
THE INFLUENCE OF GOVERNMENT POLICY AND NGOS
ON CAPTURING PRIVATE INVESTMENT
Gayle Allard, Ph.D & Candace Agrella Martinez, Ph.D
Breakfast Session 1: New frontiers in investment promotion
This paper was submitted in response to a call for papers conducted by the organisers of the OECD Global Forum on International Investment. It is distributed as part of the official conference documentation and serves as background material for the relevant session in the programme. The views expressed in this paper do not necessarily represent those of the OECD or its member governments.
1
The Influence of Government Policy and NGOs
on Capturing Private Investment
Gayle Allard, Ph.D.
Professor of Economic Environment and Country Analysis
Chair, Department of Economics
Instituto de Empresa
Maria de Molina, 11
28006 Madrid, Spain
(34) 915-568-9600 (office)
(34) 91-568-9710 (fax)
Email: [email protected]
Candace Agrella Martinez, Ph.D.
Assistant Professor of International Business
John Cook School of Business
St. Louis University
3674 Lindell Blvd.
St. Louis, MO 63108
(314) 977-7603 (office)
(314) 977-7188 (fax)
Email: [email protected]
ABSTRACT
Our paper applies new institutional economics theory to a unique data set of the world‘s low-income
economies to examine the association between host governments‘ social policies and their ability to
attract foreign direct investment. We add to this another new data set to explore the direct and
indirect role of nongovernmental organizations (NGOs) in the business-society-government interface.
We find that a host government‘s social inclusion policies are strongly associated with a country‘s
FDI inflows. NGOs, however, obtain no statistically significant indirect effect on this relationship and
only weak statistical significance as a direct influence on FDI inflows. Despite these mixed results,
the findings of this exploratory study suggest future directions of research of interest to policy makers
and business scholars.
Key words: foreign direct investment, globalization, nongovernmental organizations (NGOs),
social policies
2
…polities significantly shape economic performance because they
define and enforce the economic rules….. (North, 1994: 366).
Globalization, the ―ongoing process of integration and interconnection of states, markets,
technologies, and firms,‖ (Barkema, Baum, and Mannix, 2002) appears to be here to stay. Increased
levels of trade and foreign direct investment worldwide, a cause or effect of the closer
interdependence of world economies, are a reality. One of the most striking trends of recent increases
in private investment is the emergence of nongovernmental organizations (NGOs) as important
conduits for aid and as providers of development services in low-income economies. According to
the United Nations Development Program, by the end of the 20th century more than 50,000 NGOs
were working at the grass-roots level in developing countries, and their activities were affecting the
lives of 250 million individuals (Besley and Ghatak, 1999). The increasingly important role of NGOs
as they have advanced from mere service-providers to major players with the funds and potential to
influence policy and institutions has received ample empirical and theoretical attention (Besley and
Ghatak, 1999; Doh and Guay, 2006; Eden, 2004; Keim, 2003; Nancy and Yontcheva, 2006; Teegen,
Doh, and Vachani, 2004). Further, as the civil society counterparts of multinational enterprises
(MNEs) and governments, NGOs have become ―major new organizational forms and vehicles to
deliver social services such as poverty relief and environmental protection‖ (Teegen et al., 2004: 475).
They have influenced corporate strategy by inducing firms to seek a competitive advantage through
reputational assets or by responding to pressures from the ―moral marketplace‖ (Hess, Rogovsky, and
Dunfee, 2002), and they have caused many corporate executives to internalize their commitment to
social objectives and corporate social responsibility ―even when there is no apparent economic benefit
to the firm or other individual‖ (Doh and Guay, 2006: 58). In the international arena NGOs often
create and institutionalize new norms in the societies where they operate (Keck and Sikkink, 1998;
Lawrence, Hardy, and Phillips, 2002).
Private investment, NGOs, and the latter‘s role in the ability of host governments to promote private
investment into their local economies, are the focal point of this paper and new institutional
economics provides the underpinning rationale that guides its logic. We start with the premise that
NGOs (civil society organizations) influence the institutional context in which they operate; the same
context that defines the choice sets of multinational firms (the private sector) when they invest in host
governments (the public sector). The institutional environment provides the framework in which an
NGO operates, but an NGO can also establish formal rules and informal norms of its own that in turn
influence, over time, other actors in society. What is the relationship among these private, public, and
civil society sectors? Do NGOs modify the impact of host government policies (as manifestations of
formal institutions) on the private sector? What is the influence of NGOs when they act alone in the
institutional setting as compared to their influence when they act in tandem with host government
policy? How do they affect the local environment that is perceived by foreign investors?
We seek to answer these questions as we examine the relationship among actors in three sectors of
society: NGOs, host governments, and business. Building on the elements of new institutional theory
highlighted above, this paper examines NGOs and host government policy, the former as ―agents of
globalization‖ (Teegen et al., 2004) and the latter as promoters of social welfare and inclusion (wealth
distribution). It then tests the direct effect of each as well as the moderating role of NGOs in
influencing firm-level private investment.
This paper purports to shed light on the interconnectedness of a society‘s business, public and civil
society sectors across developing countries. It empirically tests the effectiveness that a host
government‘s social policies have in attracting private investment as well as the emerging role of
NGOs in today‘s globalized world. Its main contribution is to add to the public policy/NGO research
stream a new set of data and an understanding of how the main forces in society operate and
cooperate in promoting foreign direct investment. It is hoped that scholars will conduct further
research to refine our understanding of the dual role of host government policy and NGOs in the
3
―ongoing process of integration and interconnection of states, markets, technologies, and firms,‖
(Barkema, Baum, and Mannix, 2002).
The paper takes the following format. First, we present background information on nongovernmental
organizations. We then develop our theoretical rationales and propose hypotheses grounded in these
theories. Finally, we present our data, explain the methodology used to test our hypotheses
empirically and provide the results of our tests. We close the paper with a discussion of the results and
concluding remarks.
NONGOVERNMENTAL ORGANIZATIONS (NGOs)
Non-governmental organizations (NGOs) are non-profit, voluntary citizens´ groups that are organized
on a local, national or international level. They may be of three types: 1) advocacy NGOs, that
promote before governments or in international for the interests of groups who do not have either
voice or access to do so themselves; 2) operational NGOs, that provide goods and services to needy
clients; and 3) ―hybrid‖ NGOs, which perform both of the previous functions (Doh and Teegen,
2003). Generally, they are organized around specific issues (some of their most visible and most
successful work has been in the areas of human rights, health and environmental protection), and in
their areas of concern they can serve as early warning mechanisms or monitors of official agreements.
NGOs have operated in areas such as social services for decades, often in collaboration with
governments or private partners. The United States has a particularly rich history of these types of
partnerships (Salamon 1987).
In the academic literature, NGOs have been categorized as membership or ―club‖ NGOs and social
purpose NGOs (Teegen et al., 2004). The former refers to those nongovernmental organizations that
―tend to promote the material, social, or political interests of their own members‖ (Putnam, 2002: 11),
while the latter refers to those NGOs that have exclusively social (including human rights and
environmental) agendas (Teegen et al., 2004: 466). In the remainder of this paper, we follow Teegen
et al.‘s (2004) definition and use of the term NGO to mean social purpose NGOs:
NGOs are private, not-for-profit organizations that aim to serve particular
societal interests by focusing advocacy and/or operational efforts on social,
political and economic goals, including equity, education, health,
environmental protection and human rights. (Teegen et al., 2004: 466)
NGOs offer a number of distinct advantages that can enhance the provision of social services or the
promotion of social needs, whether on their own or in cooperation with business or government.
They include the following (Nancy and Yontcheva 2006; Yaziji 2004):
They generally enjoy a great degree of legitimacy in the eyes of the public;
They are well attuned to public concerns, and to the needs of specific groups that
might not be represented by the market or defended by the government;
Their dense, extensive networks are different from those of the typical MNE or
government;
Their members and representatives have technical expertise in the issue at hand, often
due to having worked in difficult settings or with underserved populations;
They are often more cost-effective than their private or public partner.
Although NGOs also suffer from some drawbacks –chief among them their relative immunity from
transparency and accountability and their dependence on donors for funds, which are often scarce
(Kapstein, 2000) -- their strengths have led governments and multilateral institutions to direct more
and more funding through them. Although precise figures are difficult to obtain, the OECD noted that
4
the funds that industrialized economies channelled through NGOs rose from 0.2% of their total
bilateral official development aid (ODA) in 1970 to 17% in 1996 (Wood, 2003). In Africa, by 1994
already 12% of foreign ODA was being funnelled to the region through NGOs, and the number has
continued to rise (Chege, 1999). Transfers of official developed-country aid to NGOs in 2006 totalled
more than $2bn of total ODA, about 123% more than in 2002 (OECD.Stat and Epstein and Gang,
2006).
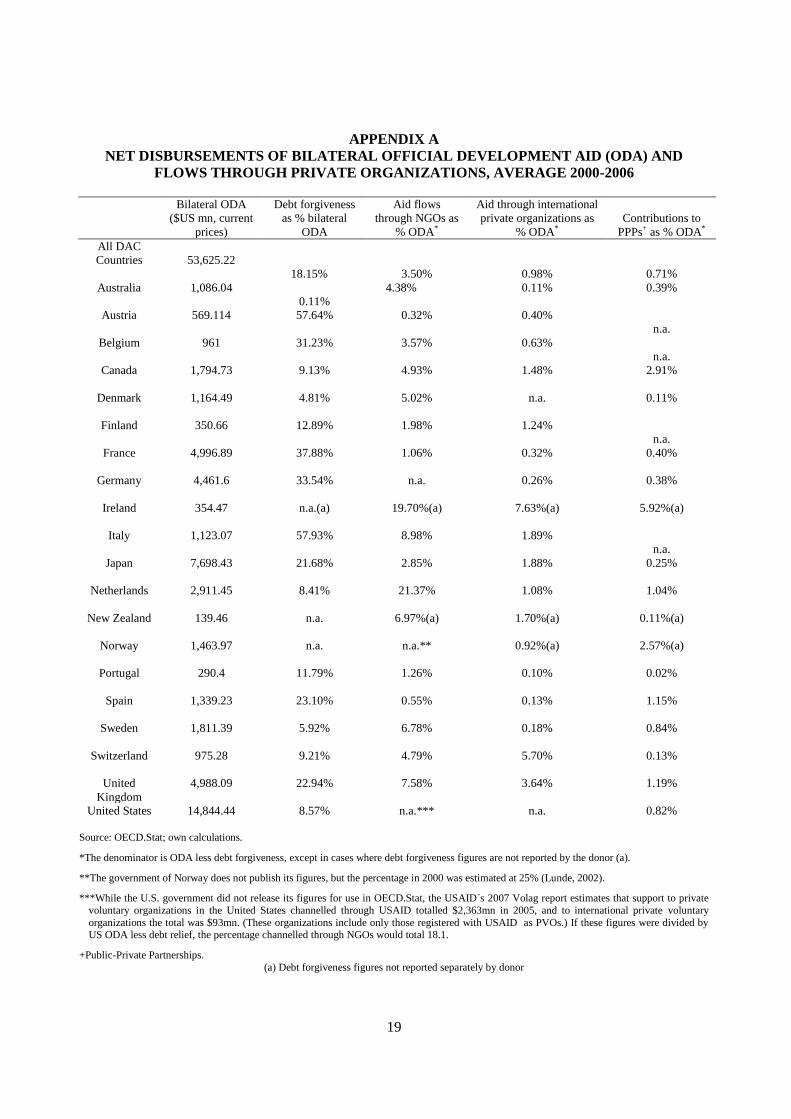
The OECD figures in Appendix A demonstrate how significant aid through NGOs has become as a
percentage of all bilateral ODA for the member nations in the Development Assistance Committee
(DAC)1, especially Ireland and the Netherlands, where it represents about 20% of the total. Italy, the
United Kingdom, New Zealand, Sweden, Denmark, Canada and Switzerland also direct a large
proportion of their development aid through NGOs. In cases like the Netherlands, New Zealand or the
United Kingdom, this proportion has risen steadily over the 2000-2006 period, partly in response to a
conscious government decision to direct more aid through these channels in order to increase aid
effectiveness. In the United States, Congress mandated in the late 1980s that 13.5% of US funding of
international development efforts should be passed through PVOs (Private Voluntary Organizations),
and USAID stated in its latest report that PVOs receive about a third of USAID´s development
assistance budget.2 Unfortunately, since the United States does not make NGO aid flows publicly
available, it is not possible to determine how much ODA goes through this conduit.
THEORY AND HYPOTHESES
Host governments have always been concerned about how to position themselves in an increasingly
competitive market for a limited supply of investment resources. Why should a multinational firm
choose one host country over another when many of these countries offer similar attractions (tax
breaks, profit repatriation, low domestic content requirements, etc.)? How can one country
strategically position itself against others in the chase after cash inflows in the form of FDI?
More important, does this competition for funds involve the way a recipient country treats its citizens?
Do multinational corporations (and their FDI) respond to the institutional environment of a host
country on a social policy level? At the firm level, recent empirical research has corroborated the
association between ―good‖ companies and higher profit levels (Mackey, 2007) and, conversely,
―bad‖ companies and decreasing bottom lines (Harris and Bromiley, 2007). We ask whether the same
relationship applies at the country level: that is, are ―good‖ countries rewarded with more private
investment. Is there an association between pro-social public policy and levels of global private
investment? We are particularly interested in those economies in earlier stages of development, where
pro-social policies are a rarer phenomenon, as they provide a fertile empirical testing ground for our
hypotheses. We can then restate our question thus: What is the relationship between the ability of an
emerging country (host country) to attract private investment and the quality of public policies
affecting the life of its citizens? Are pro-social host government policies in emerging countries linked
to higher inward flows of foreign direct investment to that country?
To answer these questions, we rely on the theoretical underpinnings of the new institutional
economics. Beginning with the premise that institutions matter (North, 1990; Williamson, 2000), the
institutional environment refers to the set of fundamental political, social, and legal ground rules that
establishes the basis for production, exchange, and distribution (Davis and North, 1971) and defines
the conditions under which business occurs (North, 1990). Institutions are the humanly devised rules
of the game, both formal and informal norms of behaviour. Formal institutions are explicitly created,
1 The percentages in the table are calculated using the data available in OECD.Stat. However, the DAC
Development Co-operation Report gave substantially higher estimates of Commitments support to/through
NGOS as a share of total bilateral commitments for the 2001-2002 period, ranging from a high of 14.1% for
Sweden to a low of 0.6% for France.
2 USAID Chapter 6: Sources and amounts of private aid, p. 13
(http://www.usaid.gov/fani/ch06/privateaid12.htm).
5
usually by law and government (North, 1990) and include the formal written rules, regulations, laws
and contracts that represent the choices made by a society to give structure to its relations with others.
Implicit in the theoretical tenets of this theory is that formal institutions lessen uncertainty. They spell
out in written form what is acceptable and what is not and thus promote more cost-efficient
transactions to take place. Assuming that transaction costs are everywhere (Coase, 1937) and that
institutions mitigate the costs associated with carrying out transactions in a society, it follows that
efficient markets depend on market-based supporting institutions (North 1990). Therefore, the formal
institutions of a society, those political, social, and legal rules of the game that a country has in place
(Davis and North, 1971), have important consequences for foreign investors.
While the components of the institutional environment of most interest to social scientists in the
management field have typically been those legal and political constraints that encourage or
discourage a multinational firm in the daily operations of its businesses overseas (Click, 2005; (Delios
and Beamish,1999; Delios and Henisz, 2003; Hill, 1998; Kobrin, 1979, 1982; Moran, 2004; Oxley,
1999; Yu and Cannella, 2007), there has been a dearth of studies exploring the social ground rules in
place in a host country‘s institutional environment. We ask whether host governments that proactively
promote pro-social policies for their citizens are in a better position to reap the benefits of
globalization. Do those host countries that devote resources to social policies and institutions compete
more effectively for multinational firms‘ foreign direct investment projects? Does FDI flow toward
environments that have better distributions of wealth and more broadly shared benefits of growth and
development for citizens?
Institutional theory posits that institutions mitigate transaction costs by reducing uncertainty and
establishing a stable structure to facilitate interactions, thus enhancing efficiency. Consequently,
those host governments that have put into place pro-social, formal institutions that embrace sound
policies would help investors to see them as more efficient, would send positive signals to the
marketplace --that is, private investment--, and would, therefore, enhance the host government‘s
chances of capturing foreign direct investment. We would expect such policies to underpin a
country‘s ability to attract multinational firms to invest there and thus increase its levels of foreign
direct investment. We thus posit the following hypothesis:
H1: Ceteris paribus, host government social policies will be positively associated with a country’s
ability to capture private investment.
We now introduce the role of nongovernmental organizations into the conversation. NGOs have
changed the way that governments and corporations do business and have altered the dyadic
relationship between government and business. If we view NGOs as organizations, we can continue to
apply new institutional economics logic. Organizations, embedded within the institutional framework,
are supported and constrained by institutional forces (Scott, 1995) and it is the interaction between
organizations and institutions that shapes economic activities across borders (North, 1990; Scott,
1995). Indeed, management scholars have long noted the importance of non-market, institutional
factors for multinational firms‘ strategic decisions, such as choosing a foreign location for their direct
investment (Boddewyn and Brewer, 1994; Dunning, 1998).
NGOs are organizations embedded in the institutional fiber of a society. As ―new organizational
forms‖ they influence how business is carried out in countries where they have a presence because
they are attuned to specific groups‘ needs and wants. They are often able to influence public opinion
and have been successful in getting governments and multilateral institutions to direct more and more
funding through them. Further, as ―agents of globalization,‖ nongovernmental organizations demand
attention not only from governments and multilateral institutions but also from multinational
corporations that look overseas for potential foreign direct investment locations. They form an
integral part of the institutional context of a country and are often a third party in the business-
government interface. We therefore posit that a country that has high levels of NGO presence will
6
more likely to attract private investment in an increasingly competitive market of recipient countries.
Thus:
H2: Ceteris paribus, the presence of NGOs in a host country will be positively associated with a
country’s ability to capture private investment.
The impact of NGOs on private investment may not only be a direct one, however. It is possible that
as two important components of a society‘s institutional environment, NGOs work in tandem with a
host government to secure better outcomes for the greater good. As we predict a positive direct
association between ―good‖ government social policy, i.e., one that is beneficial to citizens, and levels
of inward foreign direct investment (H1), we further predict that the presence of NGOs in a host
country will increase the intensity of that relationship. We therefore state the following hypothesis:
H3: Ceteris paribus, the presence of NGOs in a host country will increase the direct effect of that
country’s social policies on its ability to capture private investment.
METHODS
Sample
Our sample of 59 countries was drawn from the group of countries that are the poorest and least
creditworthy in the world, and as such are eligible for International Development Assistance loans
from the World Bank. To determine how much to lend to each country, the World Bank staff has
developed a Country Policy and Institutional Assessment (CPIA) that scores these countries on the
quality of their policy performance in four basic areas: Economic Management, Structural Policies,
Policies for Social Inclusion/Equity, and Public Sector Management and Institutions. Three of these
areas are not new to empirical analysis, since numerous rankings have been developed to assess the
quality of institutions and performance in economic management, structural policies and public sector
management. What is new and interesting to researchers about the CPIA is that it includes numeric
scores to reflect the quality of pro-social policies, and that those detailed scores were recently made
public for the first time, in 2006.
In this study, we use as independent variables the CPIA rankings, in particular those that refer to pro-
social policies or policies promoting social inclusion (explained more fully below). Since the scores
are only recently available, it is not possible to compare 2005 scores with those obtained in previous
years to determine whether major policy changes have occurred. The World Bank, however, states
that little change is likely in the overall CPIA rankings from year to year, since the criteria focus on
the quality of policies and institutions, which tend to be longer-term in nature. This should mean that
the single year for which full numerical scores have been made available -- 2005 -- should serve as an
adequate reflection of the policy and institutional environment for each country in recent years. To
ensure that the single score does reflect a fairly stable institutional environment, we compared the
overall 2005 CPIA score with the quintile rankings for 2002-2004, which are publicly available. As a
result, of the original pool of 77 countries ranked in 2005, ten were dropped because they had been
ranked on fewer than two quintiles or because their quintile ranking on the CPIA had varied by more
than one position between 2002 and 2005 (e.g., a move from 1st to 2
nd quintile was considered to
reflect a fairly stable institutional environment over the period but a move from 1st to 3
rd was not). A
further four countries were dropped due to lack of homogeneous GDP or FDI data from the World
Bank. This left a pool of 62 countries with adequate data and stable CPIA rankings for the empirical
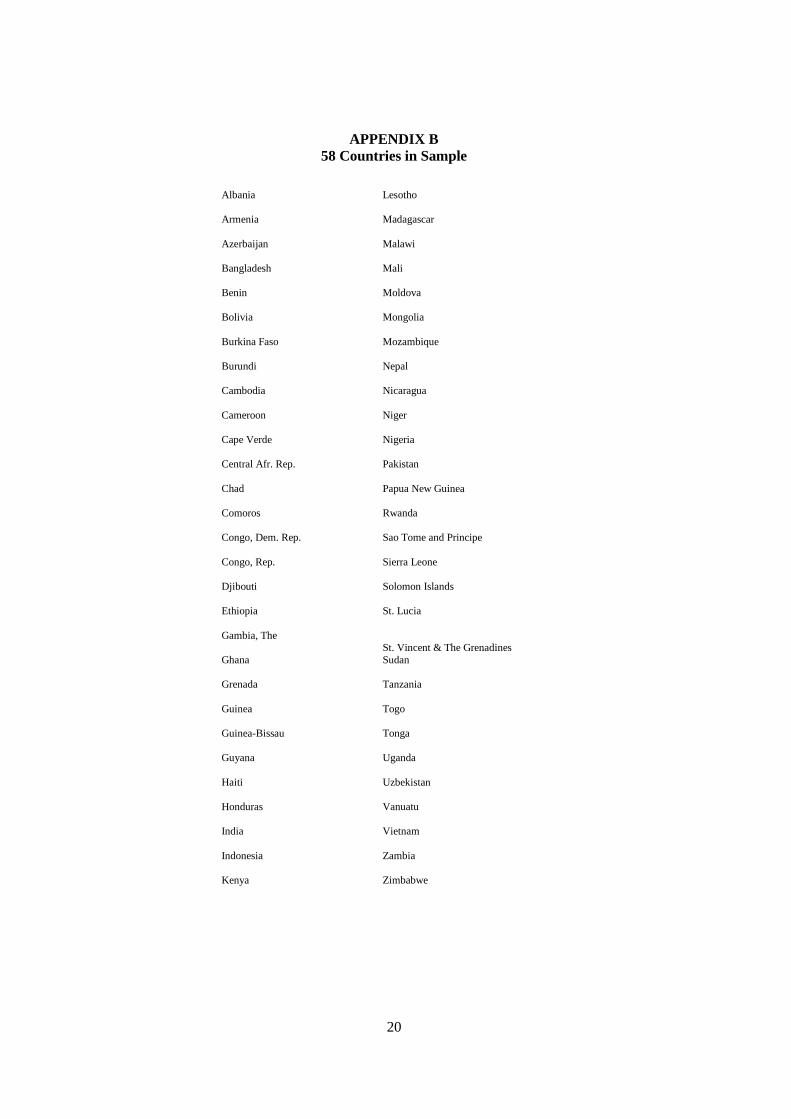
analysis. We later had to drop three more countries due to other missing data, however. Appendix B
provides a list of the countries in our final sample.
7
Data
To empirically test the role of NGOs in low-income countries and their contribution to private
investment, a data set had to be obtained that reflected the presence of NGOs in the individual
recipient countries. Obtaining this data was a major challenge. The OECD, in its excellent reporting
of data on private and official development aid from member nations, does not offer a breakdown of
NGO aid by recipient country. The alternative of searching for the data from the NGOs themselves
was not only daunting --tens of thousands of NGOs are present in developing countries— but it also
turned out to be impossible since many do not report their expenditures by country. The only
alternative to was to approach each of the countries in the DAC for data on how much of their
development aid to the countries in our study was channelled through NGOs. Since some donor
countries report data only by region, they were excluded from our data set; and the biggest donor of
all, the United States, declined to release any of its NGO data by recipient country or region. The
sheer size of U.S. giving, combined with the preference for private and voluntary channels for ODA
in that donor nation, makes this omission especially serious for a study of this type3.
There are additional reasons why the data we were able to obtain represent very low estimates of
actual NGO development spending and other important omissions in the NGO and private aid data.
The figures reported by those governments that do publish them normally reflect only the official aid
given to or channelled through these agencies, and not the NGO spending funded by autonomous
sources such as private volunteer giving, which is substantial and surpasses public-sector
contributions in many cases. (A 2007 USAID report estimated that PVOs in the United States
received only 10% of their funding from the government (USAID), with 80% coming from private
donations and 10% from other sources4). As a result of these factors, the official NGO figures used in
this report are very low estimates of the total.
Measures
Dependent variable. FDI flows to emerging market economies have increased dramatically over the
past 15 years, despite the financial market setbacks in many countries (Brukoff and Rother, 2007). In
fact, multinational firms provide the largest proportion of worldwide FDI monies and are the single
largest source of emerging markets‘ net capital inflows (IMF 2003). It can be expected that these
multinational firms would be selective about the host countries where they choose to invest,
particularly when they are selecting among the world‘s poorest developing countries.
As a proxy for private investment by MNCs worldwide, we use levels of foreign direct investment as
our dependent variable. We measure it by using the natural log of FDI net inflows (LNFDI) to a
recipient country, averaged for two years, 2000 and 2005. FDI net inflows serve as a reflection of the
confidence that foreign investors have in the local economy and their expectations of growth,
economic success and company profits on an aggregate level. We follow the IMF‘s definition of FDI: international investment that reflects the objective of a resident in one economy (the direct investor) to obtain a lasting interest in an enterprise resident in another economy (the direct investment enterprise). A direct investment relationship is established when the direct investor has acquired ten percent or more of the ordinary shares or voting power of an enterprise abroad (5th Edition of the IMF’s Balance of Payments Manual (BPM5).
Independent variables. The construct of host government social policies (SOCIALPOL) is
operationalized by the social policy (a formal institution) used by host governments in our sample of
59 developing countries. The construct of societal formal institutions is measured by using social
3 There is much speculation over why NGO figures are so difficult to come by. One source that has worked
with the data for several decades alleges that the sheer size of the flows has created opportunities for
corruption and misuse of funds that officials are reluctant to reveal.
4 2007 Volag Report of Voluntary Agencies.
8
welfare as a proxy for the policies of a host government that address the well-being of its citizen. This
measure is a numerical score encompassing five distinct dimensions that together measure the extent
to which a country‘s policies for social inclusion and equity support sustainable growth and poverty
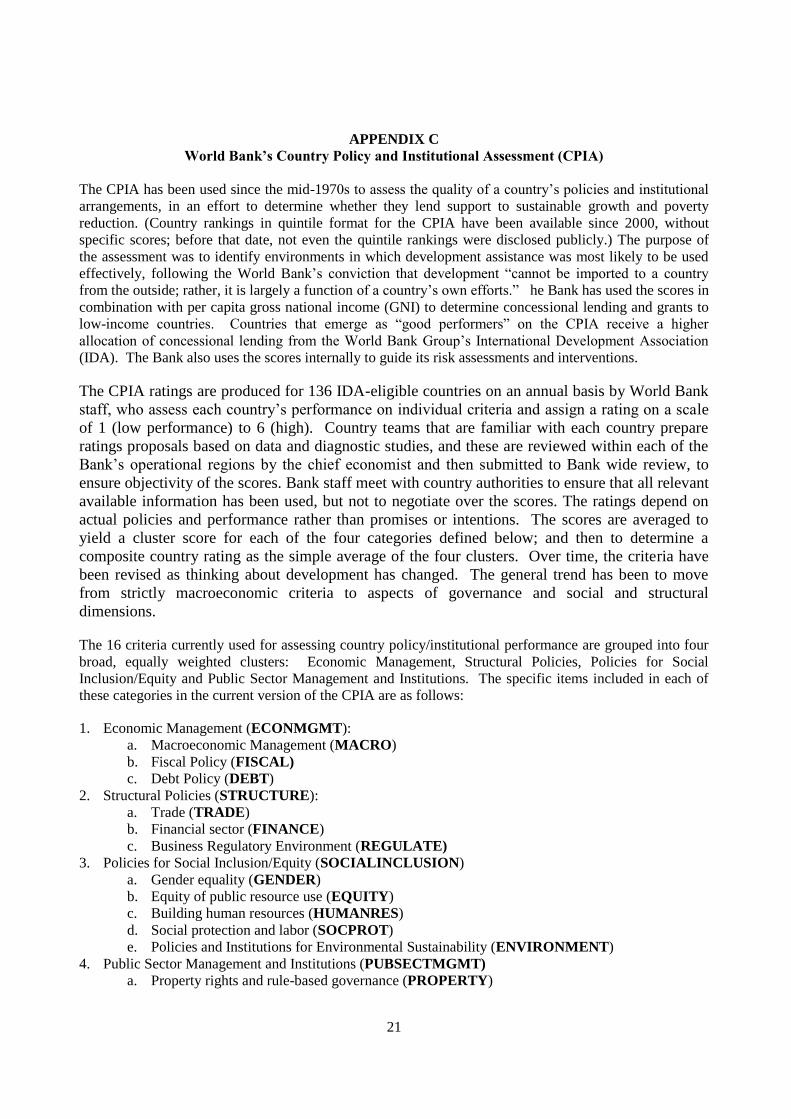
reduction. The World Bank‘s Country Policy and Institutional Assessment (CPIA) was the source for
this measure. Appendix C gives a detailed description.
Our measure for the influence of NGOs (NGOs) in each of the 59 developing countries in our sample
is the data set we compiled from each of the countries in the DAC that report the development aid
channelled through NGOs to the countries in our sample. (See Appendix D for a list of the developed
countries that use NGOs.) Despite the limitations and inevitable measurement error in our new series,
it is the first set of its kind and therefore has merit on its own. We therefore decided to use this
measure as the main variable representing NGOs in the empirical portion of our paper.
To check the robustness of our results, however, we compiled a second data set with a simple count of
the number of NGOs operating in each of the recipient countries in our sample, taken from The
Directory of Development Organizations 2008. The Directory is published by a not-for-profit
organization located in The Netherlands, with the objective of facilitating ―international cooperation
and knowledge sharing in development work, both among civil society organizations, research
institutions, governments and the private sector‖ (http://www.devdir.org/index.html). Starting in 1997
(although available online since only 2000), the directory now lists 53,750 development organizations
in 228 countries. It is divided into six geographical sections (Africa, Asia and the Middle East,
Europe, Latin America and the Caribbean, North America, and Oceania) and uses nine classifications
to categorize the development organizations around the world: (1) international organizations; (2)
government institutions; (3) private sector support organizations (including fair trade); (4) finance
institutions; (5) training and research centers; (6) civil society organizations; (7) development
consulting firms (including references to job opportunities and vacancy announcements); (8)
information providers (development newsletters/journals); and, (9) grant makers. After consulting
with the head economist at The Directory of Development Organizations, we determined that for our
research purposes we should focus exclusively on group 6: civil society organizations (CSOs). For
the 62 countries in our sample, one country is not included in the directory (Lao PRD), and the
Republic of Congo and the Democratic Republic of Congo have 23 between them. In order to include
both countries in our final sample without double counting, we allocated 11 CSOs to the Republic of
Congo and 12 to the Democratic Republic of Congo (for a total of 23 between the two countries).
Among the remaining countries in our sample, the number of civil society organizations totals 9028.
It should be added that while The Directory of Development Organizations data suffers from obvious
limitations, since it gives no idea of the relative magnitude of the different NGO projects, it at least
gives an idea of how active NGOs are in different countries. Again, we used these results as a
robustness check on those obtained from our preferred data set. We do not report the results of the
analyses we conducted with the second measure of NGOs.
Control variables. Several alternative explanations for an increase in a recipient country‘s
level of inward FDI flows are possible. The attractiveness of a host country for investing
firms depends, in great part, on the size of its market (Contractor, 1991; Delios and Henisz,
2003; Dhanaraj and Beamish, 2004; Loree and Guisinger, 1995). We therefore control for
the size and attractiveness of the host country‘s macro economy as an alternative explanation
for multinational firms‘ choices to channel FDI there. To that end we include as control
variables three country-level macroeconomic indicators to represent different facets of size:
host country economic growth rate, host country population, and the host country‘s rate of
inflation.
GDP growth, the annual % change of output in real terms (%GDPGROW), reflects the
strength of the local economy and the increase in the size of the domestic market, opening the
9
door to larger sales and higher profits. Thus higher GDP growth should generally be
associated with larger FDI inflows.
Population (LNPOP) is another indicator of market size. FDI is most likely to be
attracted to economies with both large populations and higher GDP per capita. Following
previous researchers, we use the natural log of the host country‘s population.
Inflation (INFLA) enters the regression as a proxy for macroeconomic stability and as a
reflection of the internal or external shocks suffered by the economy during the period under
study, which may affect potential direct investors. A high and/or variable rate of inflation is a
sign of internal economic instability and of the host government‘s inability to maintain
consistent monetary policy. It also may boost costs, making exports from the region less
competitive on international markets (Grosse and Trevino, 2005).
Two other control variables were included to reflect possible alternative explanations in a host
economy that might influence a foreign investor‘s decision.
If a host country produces oil (OIL), it may favorably skew its chances of receiving large
FDI projects. We controlled for this possibility by using a dummy variable for oil producing
countries (1=oil-producing; 0=otherwise).
The openness (OPENNESS) of the host country, that is, its exports + imports/GDP, is
controlled for because an economy more deeply integrated into the world trade system is
more likely not only to receive FDI inflows but also to experience higher rates of GDP
growth and per-capita GDP growth, all other things being equal (Maddison, 2001).
For the control variables, except oil, a simple average of the values for the 2000-2005 period was used
in order to represent the period immediately prior to and coinciding with the CPIA social policy score.
The only exception was the ―count‖ variable for NGO, which could only be obtained for the year
2007.
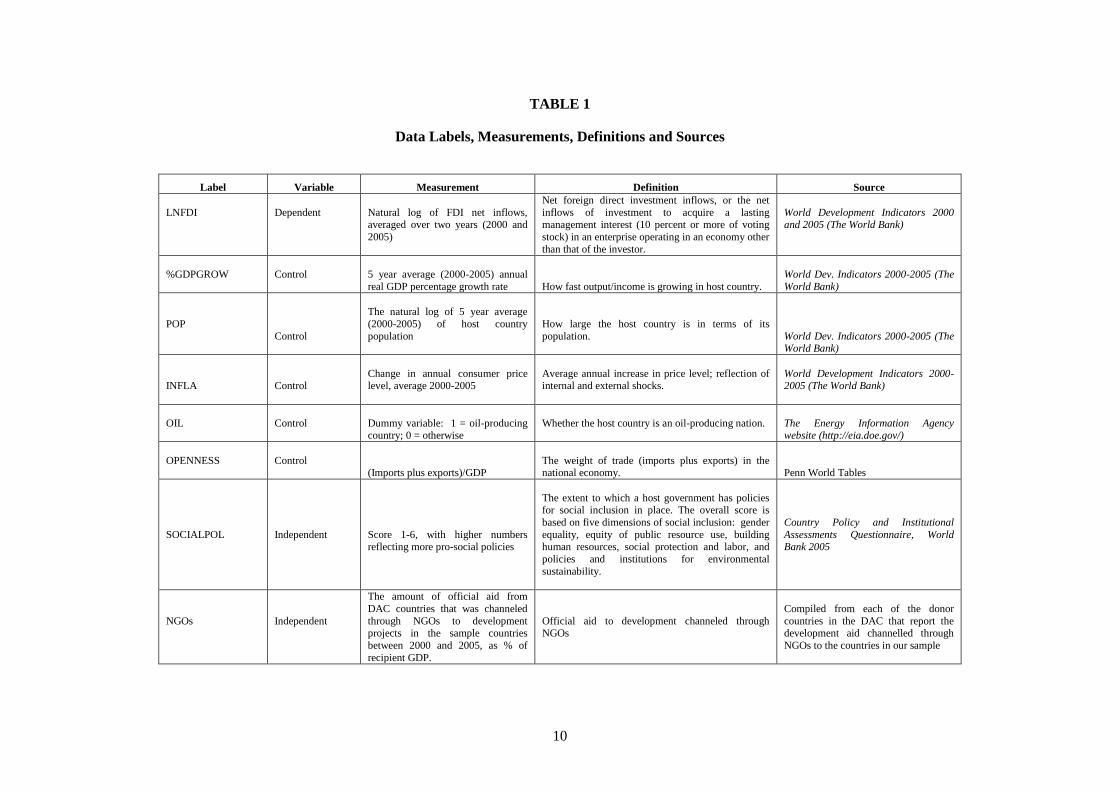
An overview of all variables, their measurements, definitions, and sources is reported in Table 1.
10
TABLE 1
Data Labels, Measurements, Definitions and Sources
Label Variable Measurement Definition Source
LNFDI
Dependent
Natural log of FDI net inflows, averaged over two years (2000 and
2005)
Net foreign direct investment inflows, or the net
inflows of investment to acquire a lasting management interest (10 percent or more of voting
stock) in an enterprise operating in an economy other
than that of the investor.
World Development Indicators 2000 and 2005 (The World Bank)
%GDPGROW
Control
5 year average (2000-2005) annual
real GDP percentage growth rate How fast output/income is growing in host country.
World Dev. Indicators 2000-2005 (The
World Bank)
POP
Control
The natural log of 5 year average
(2000-2005) of host country
population
How large the host country is in terms of its
population.
World Dev. Indicators 2000-2005 (The World Bank)
INFLA
Control
Change in annual consumer price level, average 2000-2005
Average annual increase in price level; reflection of internal and external shocks.
World Development Indicators 2000-2005 (The World Bank)
OIL
Control
Dummy variable: 1 = oil-producing
country; 0 = otherwise
Whether the host country is an oil-producing nation.
The Energy Information Agency website (http://eia.doe.gov/)
OPENNESS
Control (Imports plus exports)/GDP
The weight of trade (imports plus exports) in the national economy. Penn World Tables
SOCIALPOL Independent
Score 1-6, with higher numbers reflecting more pro-social policies
The extent to which a host government has policies for social inclusion in place. The overall score is
based on five dimensions of social inclusion: gender
equality, equity of public resource use, building human resources, social protection and labor, and
policies and institutions for environmental
sustainability.
Country Policy and Institutional
Assessments Questionnaire, World Bank 2005
NGOs Independent
The amount of official aid from
DAC countries that was channeled
through NGOs to development projects in the sample countries
between 2000 and 2005, as % of
recipient GDP.
Official aid to development channeled through NGOs
Compiled from each of the donor
countries in the DAC that report the development aid channelled through
NGOs to the countries in our sample
11
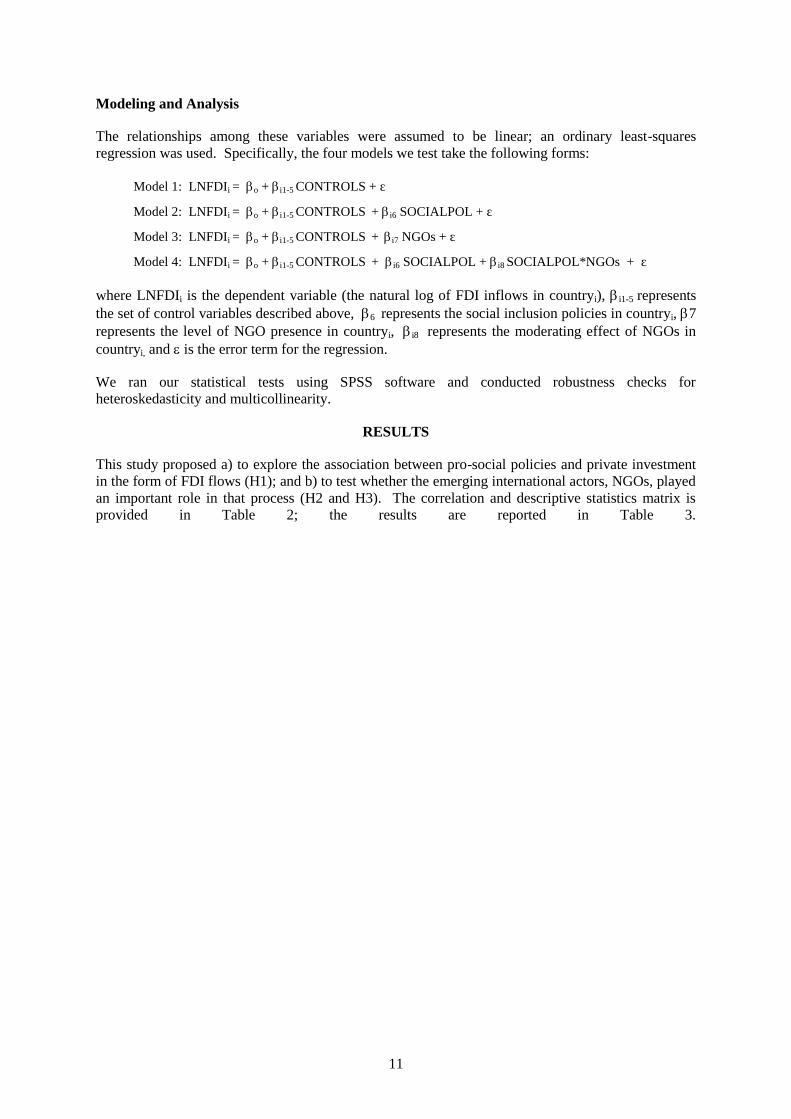
Modeling and Analysis
The relationships among these variables were assumed to be linear; an ordinary least-squares
regression was used. Specifically, the four models we test take the following forms:
Model 1: LNFDIi = o + i1-5 CONTROLS + ε
Model 2: LNFDIi = o + i1-5 CONTROLS + i6 SOCIALPOL + ε
Model 3: LNFDIi = o + i1-5 CONTROLS + i7 NGOs + ε
Model 4: LNFDIi = o + i1-5 CONTROLS + i6 SOCIALPOL + i8 SOCIALPOL*NGOs + ε
where LNFDIi is the dependent variable (the natural log of FDI inflows in countryi), i1-5 represents
the set of control variables described above, 6 represents the social inclusion policies in countryi, 7
represents the level of NGO presence in countryi, i8 represents the moderating effect of NGOs in
countryi, and is the error term for the regression.
We ran our statistical tests using SPSS software and conducted robustness checks for
heteroskedasticity and multicollinearity.
RESULTS
This study proposed a) to explore the association between pro-social policies and private investment
in the form of FDI flows (H1); and b) to test whether the emerging international actors, NGOs, played
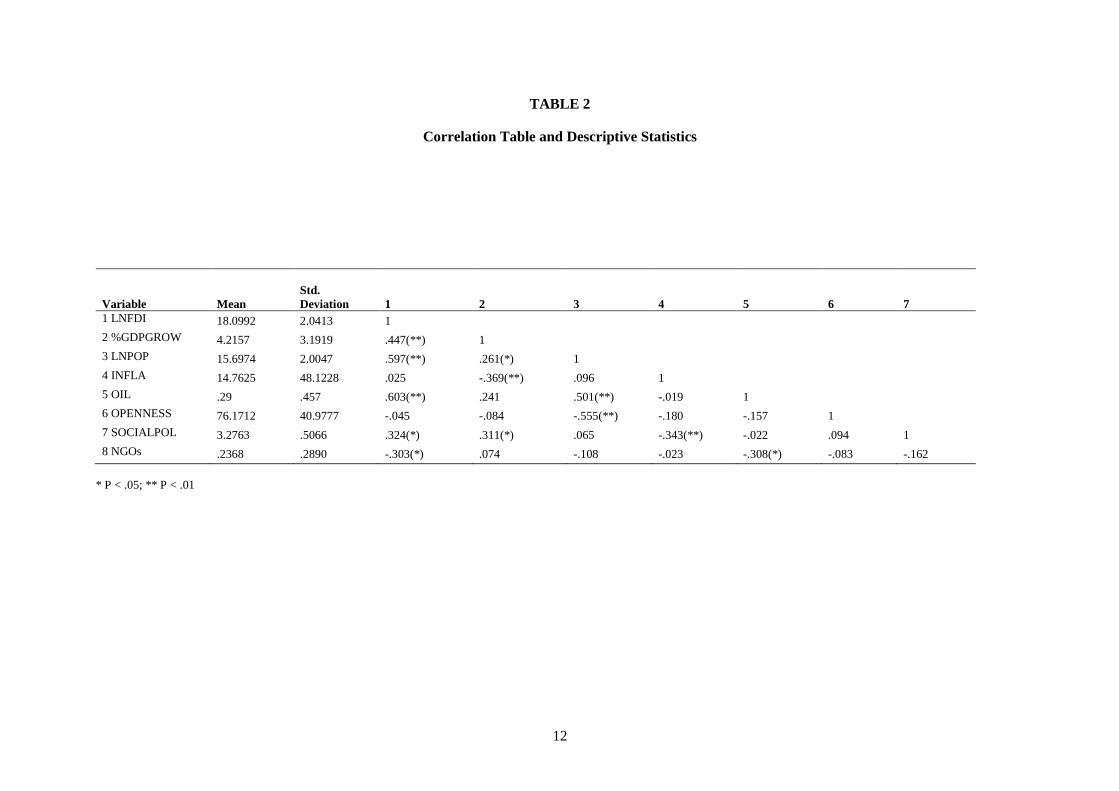
an important role in that process (H2 and H3). The correlation and descriptive statistics matrix is
provided in Table 2; the results are reported in Table 3.
12
TABLE 2
Correlation Table and Descriptive Statistics
Variable Mean
Std.
Deviation 1 2 3 4 5 6 7
1 LNFDI 18.0992 2.0413 1
2 %GDPGROW 4.2157 3.1919 .447(**) 1
3 LNPOP 15.6974 2.0047 .597(**) .261(*) 1
4 INFLA 14.7625 48.1228 .025 -.369(**) .096 1
5 OIL .29 .457 .603(**) .241 .501(**) -.019 1
6 OPENNESS 76.1712 40.9777 -.045 -.084 -.555(**) -.180 -.157 1
7 SOCIALPOL 3.2763 .5066 .324(*) .311(*) .065 -.343(**) -.022 .094 1
8 NGOs .2368 .2890 -.303(*) .074 -.108 -.023 -.308(*) -.083 -.162
* P < .05; ** P < .01
13
TABLE 3
Results of OLS Regression
Dependent Variable:
Natural log FDI inflows Model 1 Model 2 Model 3 Model 4
Control Variables
% GDP growth 0.320*** 0.263** 0.346*** 0.283*
(0.060) (0.057) (0.059 (0.057)
Population 0.541*** 0.49*** 0.529*** 0.449***
(0.119) (0.111) (0.116) (0.11)
Inflation rate 0.161* 0.23** 0.163* 0.224**
(0.004) (0.004) (0.004) (0.004)
Oil producer 0.314** 0.354*** 0.260** 0.312***
(0.433) (0.404) (0.443) (0.43)
Open economy 0.360** 0.321*** 0.335** 0.306***
(0.005) (0.005) (0.005) (0.005)
Independent Variables
Social inclusion policies 0.267** 0.254**
(0.339) (0.339)
NGOs -0.160*
(0.610)
Soc. inclusion policies*NGOs -0.105
(0.198)
N 59 59 59 59 Constant 6.720 4.224 7.266 4.817
R² 0.643 0.701 0.665 0.710

14
As the correlation table illustrates, multicollinearity does not appear to be a severe problem in this
dataset. The maximum variance inflation factor (VIF) obtained was 2.059 and the overall mean VIF
was 1.5031, substantially below the rule-of-thumb cut-off of 10 for multiple regression models (Neter,
Wasserman, and Kutner, 1985: 392).
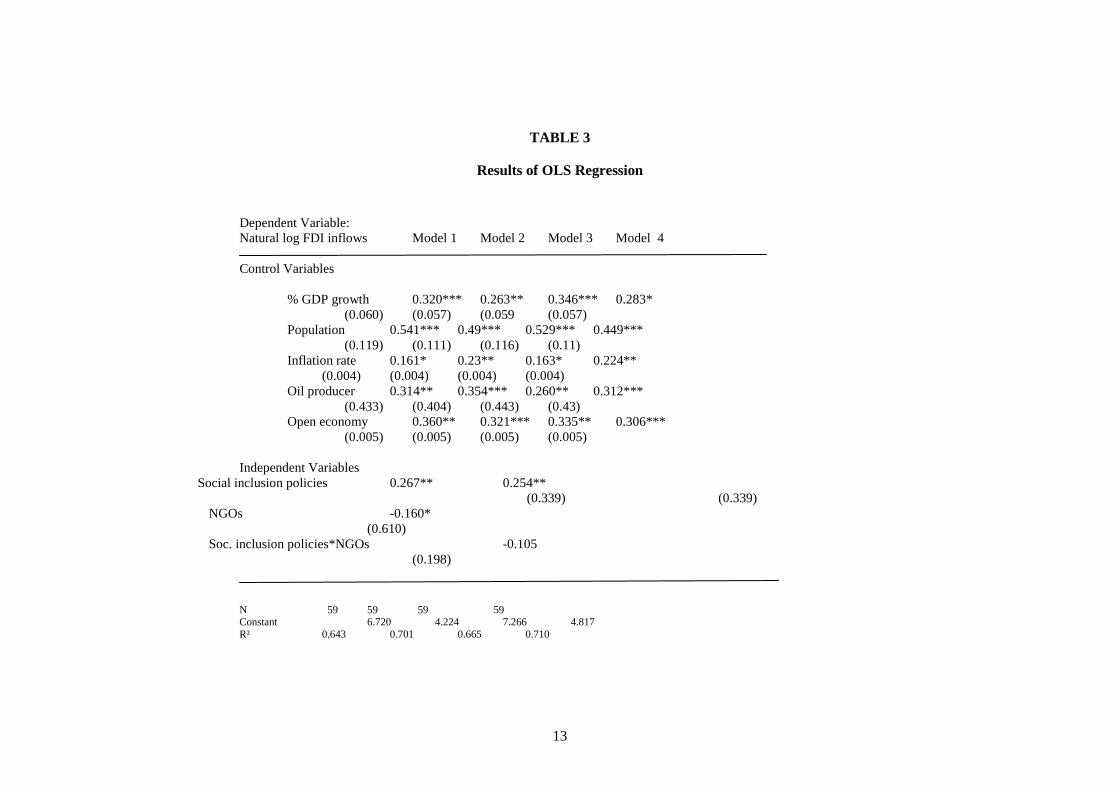
As Table 3 indicates, all control variables performed largely as expected. One of the key variables of
interest in this study, host government social policies, was strongly and statistically significant. The
positive association that we predicted between pro-social government policies and private foreign
direct investment was confirmed. Hypothesis 1 therefore found support. NGO presence in the
countries in our sample yielded mildly statistically significant coefficients when it entered the model
directly, giving marginal evidence to support Hypothesis 2. When we tested the moderating effect of
NGOs on the role of host government social inclusion policies, however, the statistical significance
evaporated. Hence, our prediction of a positive indirect effect of the presence of NGOs (indicating
that NGOs work in tandem with government policy to attract private investment) was not confirmed.
This implies that while NGOs on their own play a small role in the levels of inward FDI flows to a
developing country, this role is not as important as the policies themselves to send a positive signal to
the market place. No moderating effect further indicates that the supplementary relationship that we
expected between social policies and private investment in the poorest developing countries is simply
not there.
The results for the NGO variable were corroborated when we tested Models 2 and 4 using our second
measure of NGO presence (a simple count measure) in the 59 sampled countries. No statistical
significance was achieved either as a direct or indirect effect.
DISCUSSION AND CONCLUSION
While our results seemed to confirm the role of the institutional environment in attracting private
investment insofar as a host government‘s social policies are concerned, the role of NGOs was not as
strong as we had expected. The most obvious reason behind NGO´s poor showing is the preliminary
nature of the two data sets that we compiled for the study. Figures on NGO activity are still very
difficult to obtain, and our series could contain enough omissions and measurement error, as
discussed above, to distort the coefficients. Other than the count mesure we used as a second measure,
we could discover no alternative data set on NGO presence to provide more robustness checking on
our results. We are aware of only one other paper which has attempted to empirically test NGOs‘ role
in the aid and development process (Nancy and Yontcheva, 2006), and that paper relied on figures
provided by the EU Commission on the matching aid channelled through European NGOs. The
figures they used are no longer publicly provided because the Commission considers them to be
unreliable.5 If better data were available, the results of our regressions might have been different and
could have confirmed a more crucial role for NGOs in developing countries and in the process of
private investment flows..
Another possible explanation for the lack of strong positive associations between NGO activity or
FDI flows and policies promoting social inclusion in development countries is a simple question of
sample selection. By choosing to focus on the poorest and least creditworthy developing countries,
we biased our sample toward countries that had lower GDP per capita and were therefore likely to
have poorer social policies and institutions than those found in more developed countries. FDI is less
likely to flow to countries like those in our sample simply because they are poorer. To wit, some
international business scholars have highlighted the regional as opposed to global pattern of FDI these
past thirty years as more than 75% of FDI occurs among the triad nations of the world, namely the
U.S. the E.U., and Japan (Rugman, 2000). This phenomenon could predispose the data toward a weak
association (such as the one we found) or even a negative association between FDI and the policy
variables. A similar effect could bias the NGO results: the countries where NGO aid is most needed
5 Commission representatives say that a reasonable data set reflecting the activities of European NGOs in
developing countries could be available later in 2008.
15
may naturally be those that are least attractive for foreign investors. At the same time, donor
countries may be more likely to use NGOs as investment channels for the countries with poorer
institutions and worse social policies, in an effort to bypass corrupt or inefficient governments and
make their own aid more effective. Hence there could be a tendency to find more NGO activity in
countries with less socially inclusive policies. This selection bias could play a large role in our results.
Another consideration about the poor showing by our NGO variables is that the surge of NGO activity
in developing countries is relatively recent. As we compiled the NGO series, we noted that for some
large donor countries like Japan, the decision to channel aid through NGOs was made in the middle of
the 2000-2005 period covered by our study. Clearly the role of NGOs will be larger and more
observable in the future, but at the time of this study, NGO involvement in development aid was still
in its infancy in many countries.
The greatest drawback of this study, therefore, was that we could not avoid serious understatement of
the size and scope of NGOs in some of the lowest-income countries. As data improve, it will become
easier to measure and evaluate the role of NGOs, and to test our hypotheses about the importance of
their role in the developing world.
Nevertheless, despite this study‘s data limitations and mixed empirical results, we believe it takes an
important preliminary step forward toward providing supporting evidence on the role and
effectiveness of host government social policy and the role of NGOs in fostering direct investment.
We positioned NGOs both as sole contributors to the process of global value creation (as proxied by
private investment) and as collaborators with host governments‘ social inclusion policies to promote
the attractiveness of a country for private investment funds. In this sense, this paper makes a
contribution by providing a first attempt at laying the foundations for a fruitful research agenda for
social scientists, economists, political scientists, public policy makers, and multinational corporations
as they go forward in trying to understand the expanding role of NGOs on the world stage.

16
References
Barkema, H. G., Baum, J. and Mannix, E. 2002. Management challenges in a new time. Academy of
Management Journal, 45(5): 916-930.
Besley, T. and Ghatak, M. 1999. Public-Private Partnerships for the Provision of Public Goods: Theory and an
Application to NGOs. The Development Economics Discussion Paper Series, London School of
Economics.
Boddewyn, J. J., and Brewer, T. L. 1994. International business political behavior: New theoretical directions.
Academy of Management Review, 19: 119–143.
Brukoff and Rother, 2007.
Chege, S. 1999. Donors Shift more aid to NGOs, Africa Recovery 13 (1) (June 1999): 6.
Click, R. 2005. Financial and political risks in US direct foreign investment. Journal of International Business
Studies, 36 (5): 559-575.
Contractor, F. 1991. Government policies toward foreign investment: An empirical investigation of the link
between national policies and FDI flows. Paper presented at the Annual Meeting of the Academy of
International Business, Miami, FL.
Dahan, N., Doh, J., and Guay, T. 2006. The role of multinational corporations in transnational institution
building: A policy network perspective. Human Relations 59: 1571.
http://hum.sagepub.com/cgi/content/abstract/59/11/1571.
Davis, L., and North, D. 1971. Institutional change and American economic growth. Cambridge, U.K.:
Cambridge University Press.
Delios, A., and Beamish, P. W. 1999. Ownership strategy of Japanese firms: Transactional, institutional, and
experience influences. Strategic Management Journal, 20: 915–933.
Delios, A. and Henisz, W. 2003. Policy uncertainty and the sequence of entry by Japanese firms, 1980-1998.
Journal of International Business Studies, 34: 227-241.
Dhanaraj, C., and Beamish, P. 2004. Effect of equity ownership on the survival of international joint ventures.
Strategic Management Journal, 25: 295-305.
Doh, J. and Guay, T. 2006. Corporate Social Responsibility, Public Policy, and NGO Activism in Europe and
the United States: An Institutional-Stakeholder Perspective. Journal of Management Studies 43: 1
January 2006 (47-73).
Doh, J. and Teegen, H. (Eds.) 2003. Globalization and NGOs: Transforming business, government, and society.
Westport, CT: Praeger Publications.
Drechsler, D. and Zimmermann, F. 2006. New Actors in Health Financing: Implications for a Donor Darling.
Policy Brief No. 33, OECD.
Dunning, J. H. 1998. Location and the multinational enterprise: A neglected factor? Journal of International
Business Studies, 29(1): 45-68.
Eden. L. 2004. A review of: Globalization, NGOs: Transforming business, government, and society. Journal of
International Business Studies, 35:564-566.
Edwards, M. and D. Hulme, 1994, NGOs Performance and Accountability in the New World Order
(unpublished; Manchester; Institute for Development Policy and Management).
Epstein, G. and Gang, I. 2006. Good Governance and Good Aid Allocation, Departmental Working Papers
200627, Rutgers University, Department of Economics, revised.
17
Epstein, G. and Gang, I. 2005. Contests, NGOs and Decentralizing Aid, IZA Discussion Papers 1711, Institute
for the Study of Labor (IZA).
Gilles, N. and Yontcheva, B. 2006. Does NGO Aid Go to the Poor? Empirical Evidence from Europe. IMF
Working Paper, IMF Institute.
Harris, J. and Bromiley, P. 2007. ―Incentives to cheat: The influence of executive compensation and firm
performance on financial misrepresentation,‖ Organization Science, 18(3):350-367.
Hess, D., Rogovsky, N., and Dunfee, T. 2002. The Next Wave of Corporate Community Involvement:
Corporate Social Initiatives. California Management Review, 44:2, 110-125.
Hill, C. 1998. How investors react to political risk. Duke Journal of Comparative and International Law, 8(2):
283-313.
Jones, T.M., 1995. Instrumental stakeholder theory: a synthesis of ethics and economics. Academy of
Management Review, 20, 2, 404-37.
Kapsstein, E., 2001. The corporate ethics crusade. Foreign Affairs 80, 5, 105-19.
Keck, M. and Sikkink, K. 1998. Activists Beyond Borders: Advocacy Networks in International Relations.
Ithaca, N.Y.: Cornell University Press.
Keim, G. 2003. ‗Nongovernmental Organizations and Business-Government Relations: The Importance of
Institutions‘. In Doh, J.P. and Teegen, H. (Eds.) Globalization and NGOs: Transforming Business,
Government, and Society. Westport, CT: Praeger.
Kobrin, S. 1979. Political risk: A review and reconsideration. Journal of International Business Studies, 10
(Spring): 67-80.
Kobrin, S. 1982. Managing political risk: Strategic response to environmental change. Berkeley, California:
University of California Press.
Lawrence, T.B., C. Hardy and N. Phillips, 2002. Institutional effects of interorganizational collaboration: the
emergence of proto-institutions. Academy of Management Journal, 45 (1): 281-290.
Loree, D. W., and Guisinger, S. E. 1995. Policy and nonpolicy determinants of US equity foreign direct
investment. Journal of International Business Studies, 26: 281–299.
Lunde, Leiv, 2002. Added Value and Aid Through NGO´s – New Challenges. Occasional Paper Number 2/02,
Norwegian Church Aid.
Mackey, A. 2007. Dynamics in executive labor markets: CEO effects, executive-firm matching, rent sharing.
Best Doctoral Dissertation Award in the Business Policy and Strategy Division at the National
Academy of Management Conference, Philadelphia, PA.
Maddison, A. 2001. The World Economy: A Millennial Perspective (Paris: The Development Centre of the
Organisation for Economic Co-operation and Development, 2001) Table 3-1a.
Moran, T. 2004. International political risk management: The brave new world. Washington, D.C.: The World
Bank.
Naim, M. 2000. Lor´s War, Foreign Policy, 118, 29-55.
Neter, J., Wasserman, W., and Kutner, M. 1985. Applied linear statistical models (2nd
edition). Homewood,
Illinois: Irwin.
North, D.C. 1990. Institutions, institutional Change and Economic Performance. Cambridge: Cambridge
University Press.
18
____ 1994. Economic performance through time. The American Economic Review, 84, 359-68.
OECD, 2008. OECD Journal on Development: Development Co-operation Report 2007, vol. 9:no. 1.
http://www.oecd.org/statisticsdata/0,3381,en_2649_33721_1_119656_1_1_1,00.html
Oxley, J. 1999. Institutional environment and the mechanisms of governance: The impact of intellectual
property protection on the structure of inter-firm alliances. Journal of Economic Behavior and
Organization, 38: 283-309.
Rugman, A. M. 2000. The end of globalization. London: Random House Business Books.
Salamon, L. 1987. Of Market Failure, Voluntary Failure, and Third-Party Government: Toward a Theory of
Government-Nonprofit Relations in the Modern Welfare State. Nonprofit and Voluntary Sector
Quarterly, 16:29-49.
Spar, D.L. and La Mure, L.T. 2003. The Power of NGO Activism: Assessing the impact of NGOs on global
business. California Management Review, 45: 78-101.
Stubbs, P. 2003. International Non-State Actors and Social Development Policy. Global Social Policy, 3 (3):
319-348.
Scott, W. R. 1995. Institutions and Organizations. Thousand Oaks, California: Sage Publications.
Teegen, H., Doh, J., and Vachani, S. 2004. The importance of nongovernmental organizations (NGOs) in global
governance and value creation: an international business research agenda. Journal of International
Business Studies 35, 463-483.
United Nations, 1999. Africa Recovery, vol. 13, no. 1 (June 1999).
USAID Chapter 6: Sources and amounts of private aid (http://www.usaid.gov/fani/ch06/privateaid12.htm).
US Department of State: Partnerships: New Alliances for Sustainable Development
(http://www.state.gov/g/oes/sus/pr.)
Williamson, O. 2000. The new institutional economics: Taking stock, looking ahead. Journal of Economic
Literature, 38:595-613.
Wood, D.J., 1991. Corporate social performance revisited. Academy of Management Review 16: 691-718.
Yaziji, M. 2004. Turning gadflies into allies. Harvard Business Review, 82 (2), 110-115.
Yu, T., and Cannella, A., 2007. Rivalry between multinational enterprises: An event history. Academy of
Management Journal, 50(3): 665-686.
19
APPENDIX A
NET DISBURSEMENTS OF BILATERAL OFFICIAL DEVELOPMENT AID (ODA) AND
FLOWS THROUGH PRIVATE ORGANIZATIONS, AVERAGE 2000-2006
Bilateral ODA
($US mn, current
prices)
Debt forgiveness
as % bilateral
ODA
Aid flows
through NGOs as
% ODA*
Aid through international
private organizations as
% ODA*
Contributions to
PPPs+ as % ODA*
All DAC
Countries
53,625.22
18.15% 3.50%
0.98% 0.71%
Australia 1,086.04
0.11%
4.38%
0.11%
0.39%
Austria 569.114
57.64%
0.32%
0.40%
n.a.
Belgium 961
31.23%
3.57%
0.63%
n.a.
Canada 1,794.73
9.13%
4.93%
1.48%
2.91%
Denmark 1,164.49
4.81%
5.02%
n.a. 0.11%
Finland 350.66
12.89%
1.98%
1.24%
n.a.
France 4,996.89
37.88%
1.06%
0.32%
0.40%
Germany 4,461.6
33.54%
n.a. 0.26%
0.38%
Ireland 354.47
n.a.(a) 19.70%(a)
7.63%(a) 5.92%(a)
Italy 1,123.07
57.93%
8.98%
1.89%
n.a.
Japan 7,698.43
21.68%
2.85%
1.88%
0.25%
Netherlands 2,911.45
8.41%
21.37%
1.08%
1.04%
New Zealand 139.46
n.a. 6.97%(a) 1.70%(a)
0.11%(a)
Norway 1,463.97 n.a. n.a.** 0.92%(a)
2.57%(a)
Portugal 290.4 11.79%
1.26%
0.10%
0.02%
Spain 1,339.23
23.10%
0.55%
0.13%
1.15%
Sweden 1,811.39
5.92%
6.78%
0.18%
0.84%
Switzerland 975.28
9.21%
4.79%
5.70%
0.13%
United
Kingdom
4,988.09
22.94%
7.58%
3.64%
1.19%
United States 14,844.44
8.57%
n.a.*** n.a.
0.82%
Source: OECD.Stat; own calculations.
*The denominator is ODA less debt forgiveness, except in cases where debt forgiveness figures are not reported by the donor (a).
**The government of Norway does not publish its figures, but the percentage in 2000 was estimated at 25% (Lunde, 2002).
***While the U.S. government did not release its figures for use in OECD.Stat, the USAID´s 2007 Volag report estimates that support to private
voluntary organizations in the United States channelled through USAID totalled $2,363mn in 2005, and to international private voluntary
organizations the total was $93mn. (These organizations include only those registered with USAID as PVOs.) If these figures were divided by US ODA less debt relief, the percentage channelled through NGOs would total 18.1.
+Public-Private Partnerships.
(a) Debt forgiveness figures not reported separately by donor
20
APPENDIX B
58 Countries in Sample
Albania Lesotho
Armenia Madagascar
Azerbaijan Malawi
Bangladesh Mali
Benin Moldova
Bolivia Mongolia
Burkina Faso Mozambique
Burundi Nepal
Cambodia Nicaragua
Cameroon Niger
Cape Verde Nigeria
Central Afr. Rep. Pakistan
Chad Papua New Guinea
Comoros Rwanda
Congo, Dem. Rep. Sao Tome and Principe
Congo, Rep. Sierra Leone
Djibouti Solomon Islands
Ethiopia St. Lucia
Gambia, The St. Vincent & The Grenadines
Ghana Sudan
Grenada Tanzania
Guinea Togo
Guinea-Bissau Tonga
Guyana Uganda
Haiti Uzbekistan
Honduras Vanuatu
India Vietnam
Indonesia Zambia
Kenya Zimbabwe
21
APPENDIX C
World Bank’s Country Policy and Institutional Assessment (CPIA)
The CPIA has been used since the mid-1970s to assess the quality of a country‘s policies and institutional
arrangements, in an effort to determine whether they lend support to sustainable growth and poverty
reduction. (Country rankings in quintile format for the CPIA have been available since 2000, without
specific scores; before that date, not even the quintile rankings were disclosed publicly.) The purpose of
the assessment was to identify environments in which development assistance was most likely to be used
effectively, following the World Bank‘s conviction that development ―cannot be imported to a country
from the outside; rather, it is largely a function of a country‘s own efforts.‖ he Bank has used the scores in
combination with per capita gross national income (GNI) to determine concessional lending and grants to
low-income countries. Countries that emerge as ―good performers‖ on the CPIA receive a higher
allocation of concessional lending from the World Bank Group‘s International Development Association
(IDA). The Bank also uses the scores internally to guide its risk assessments and interventions.
The CPIA ratings are produced for 136 IDA-eligible countries on an annual basis by World Bank
staff, who assess each country‘s performance on individual criteria and assign a rating on a scale
of 1 (low performance) to 6 (high). Country teams that are familiar with each country prepare
ratings proposals based on data and diagnostic studies, and these are reviewed within each of the
Bank‘s operational regions by the chief economist and then submitted to Bank wide review, to
ensure objectivity of the scores. Bank staff meet with country authorities to ensure that all relevant
available information has been used, but not to negotiate over the scores. The ratings depend on
actual policies and performance rather than promises or intentions. The scores are averaged to
yield a cluster score for each of the four categories defined below; and then to determine a
composite country rating as the simple average of the four clusters. Over time, the criteria have
been revised as thinking about development has changed. The general trend has been to move
from strictly macroeconomic criteria to aspects of governance and social and structural
dimensions.
The 16 criteria currently used for assessing country policy/institutional performance are grouped into four
broad, equally weighted clusters: Economic Management, Structural Policies, Policies for Social
Inclusion/Equity and Public Sector Management and Institutions. The specific items included in each of
these categories in the current version of the CPIA are as follows:
1. Economic Management (ECONMGMT):
a. Macroeconomic Management (MACRO)
b. Fiscal Policy (FISCAL)
c. Debt Policy (DEBT)
2. Structural Policies (STRUCTURE):
a. Trade (TRADE)
b. Financial sector (FINANCE)
c. Business Regulatory Environment (REGULATE)
3. Policies for Social Inclusion/Equity (SOCIALINCLUSION)
a. Gender equality (GENDER)
b. Equity of public resource use (EQUITY)
c. Building human resources (HUMANRES)
d. Social protection and labor (SOCPROT)
e. Policies and Institutions for Environmental Sustainability (ENVIRONMENT)
4. Public Sector Management and Institutions (PUBSECTMGMT)
a. Property rights and rule-based governance (PROPERTY)
22
b. Quality of budgetary and financial management (BUDGET)
c. Efficiency of revenue mobilization (REVENUE)
d. Quality of Public Administration (ADMIN)
e. Transparency, accountability and corruption in the public sector (CORRUPTION).
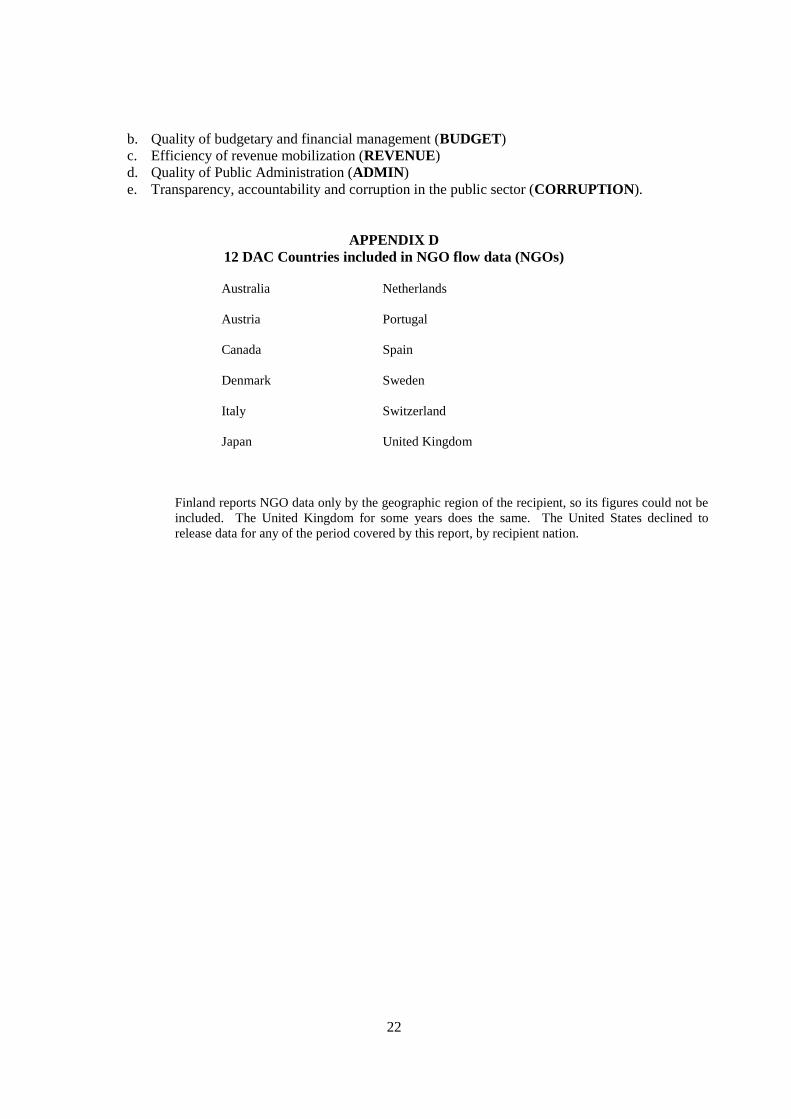
APPENDIX D
12 DAC Countries included in NGO flow data (NGOs)
Australia Netherlands
Austria Portugal
Canada Spain
Denmark Sweden
Italy Switzerland
Japan United Kingdom
Finland reports NGO data only by the geographic region of the recipient, so its figures could not be
included. The United Kingdom for some years does the same. The United States declined to
release data for any of the period covered by this report, by recipient nation.