the international, secular infant mortality decline - the dual role of resources department of...
TRANSCRIPT

The International, Secular Infant Mortality Decline - The Dual Role of Resources
Department of StatisticsUniversitety of Dar es Salaam
December 2005
Gunnar ThorvaldsenRegistreringssentral for historiske data
http://www.rhd.uit.no/

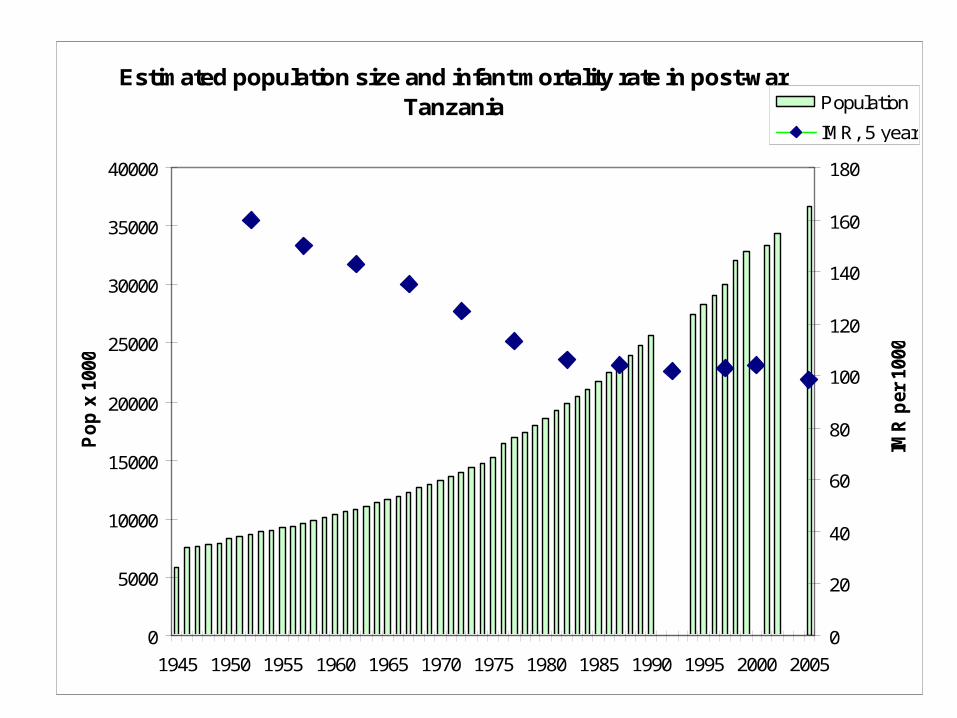
Estimated population size and infant mortality rate in post-war Tanzania
0
5000
10000
15000
20000
25000
30000
35000
40000
1945 1950 1955 1960 1965 1970 1975 1980 1985 1990 1995 2000 2005
Po
p x
100
0
0
20
40
60
80
100
120
140
160
180
IMR
per
100
0
Population
IMR, 5 year

Doctoral candidate Bonaventure Ngowi,studying infant mortality and parity

Infant mortality study
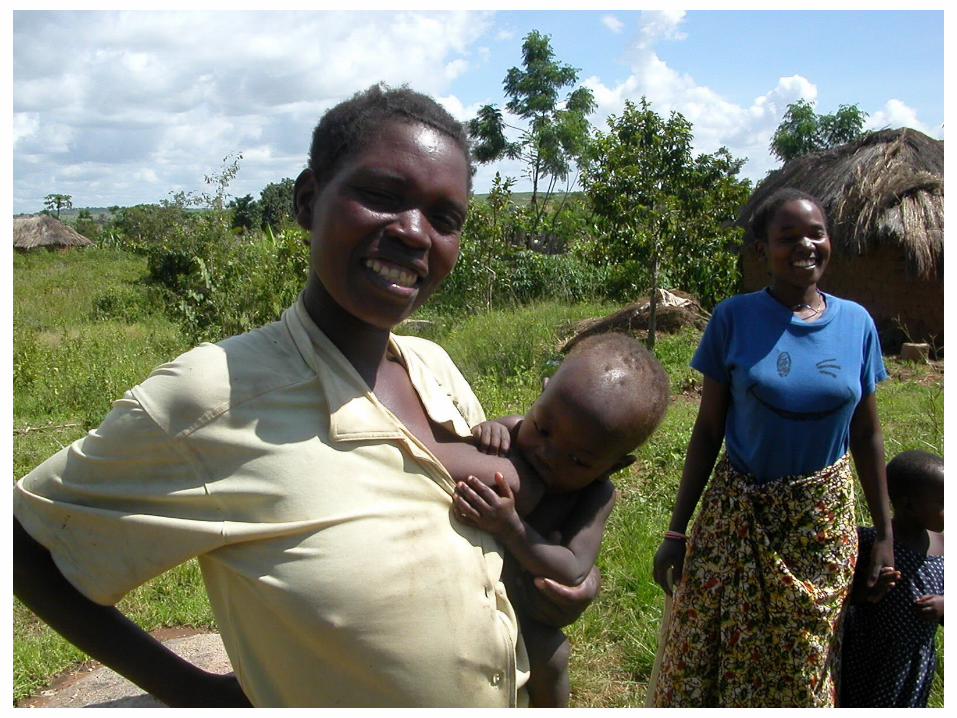
• As is well known both from historical studies of western countries and current developing countries that the life conditions of the mother is a crucial factor with respect to improving children's health and survival chances. Whether she has the time, resources and knowledge to breast-feed and implement other measures of proper child care has time and again been shown to affect the infant mortality rates dramatically. Doctoral student Ngowi analyzes infant mortality in Tanzania with special reference to child spacing and parity. Since the number of children ever born and surviving is a variable in the Tanzanian census, we shall be able with multivariate statistics to analyse the relationships between infant mortality and the mothers' status in different types of families and households.
Administered by SEMUT Centre for Environment and Development studies


Main source of drinking water 2002
-
500,000
1,000,000
1,500,000
2,000,000
2,500,000
3,000,000
Household
sUrban
Rural
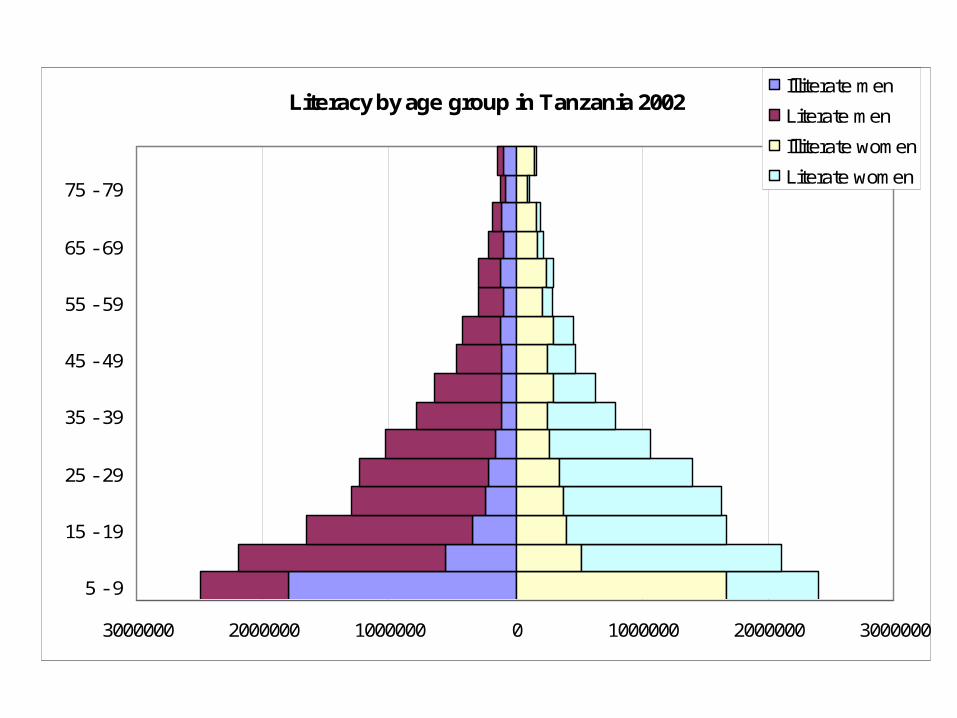
Literacy by age group in Tanzania 2002
3000000 2000000 1000000 0 1000000 2000000 3000000
5 - 9
15 - 19
25 - 29
35 - 39
45 - 49
55 - 59
65 - 69
75 - 79
Illiterate men
Literate men
Illiterate women
Literate women

. . . and the superstition surrounding infant care, here magical hut for curing sick babies, Dar es Salaam Village Museum

www.whc.ki.se
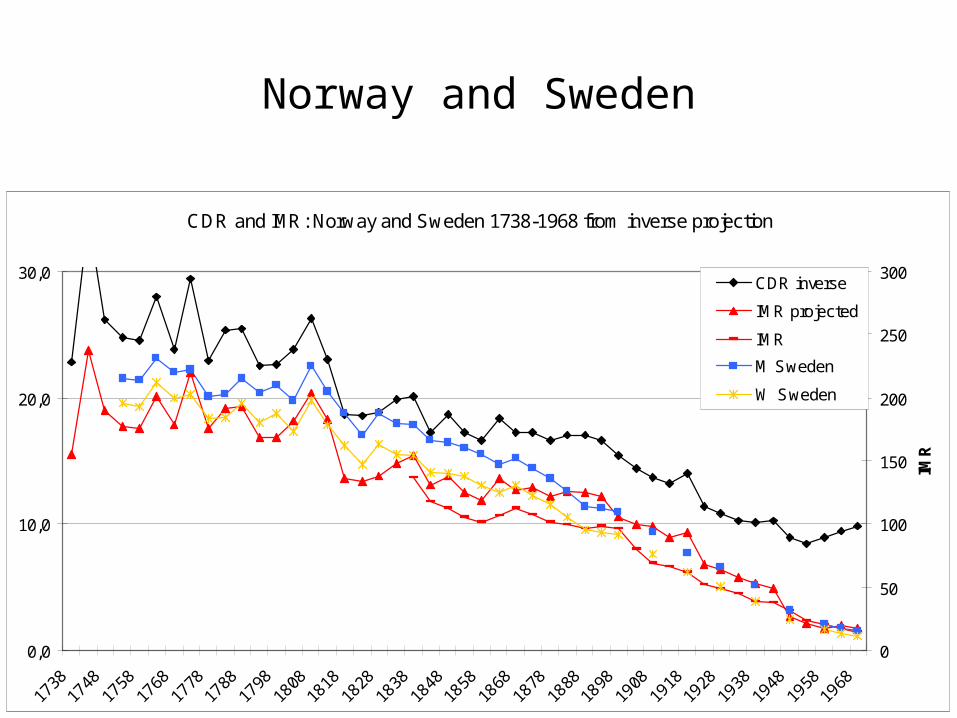
Norway and Sweden
CDR and IMR: Norway and Sweden 1738-1968 from inverse projection
0,0
10,0
20,0
30,0
1738
1748
1758
1768
1778
1788
1798
1808
1818
1828
1838
1848
1858
1868
1878
1888
1898
1908
1918
1928
1938
1948
1958
1968
0
50
100
150
200
250
300
IMR
CDR inverse
IMR projected
IMR
M Sweden
W Sweden
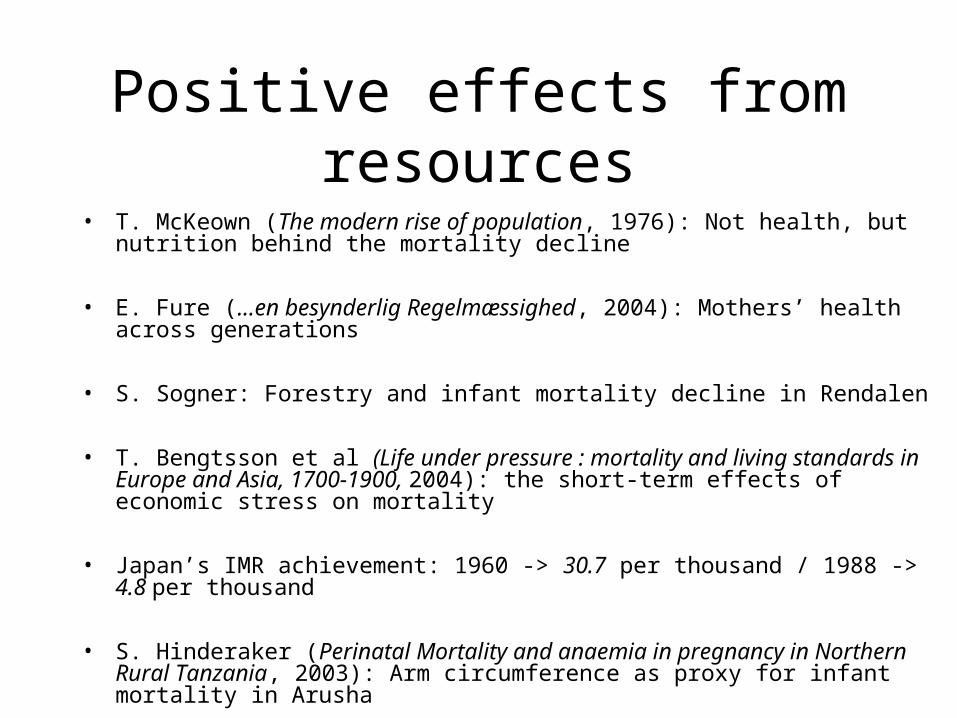
Positive effects from resources
• T. McKeown (The modern rise of population, 1976): Not health, but nutrition behind the mortality decline
• E. Fure (...en besynderlig Regelmæssighed, 2004): Mothers’ health across generations
• S. Sogner: Forestry and infant mortality decline in Rendalen
• T. Bengtsson et al (Life under pressure : mortality and living standards in Europe and Asia, 1700-1900, 2004): the short-term effects of economic stress on mortality
• Japan’s IMR achievement: 1960 -> 30.7 per thousand / 1988 -> 4.8 per thousand
• S. Hinderaker (Perinatal Mortality and anaemia in pregnancy in Northern Rural Tanzania, 2003): Arm circumference as proxy for infant mortality in Arusha
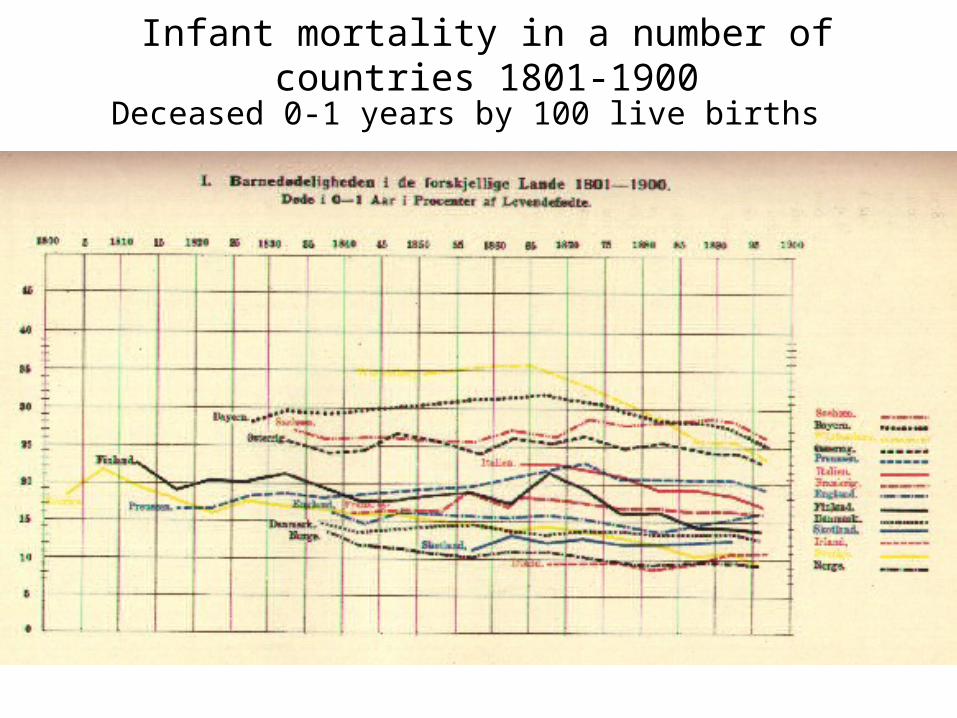
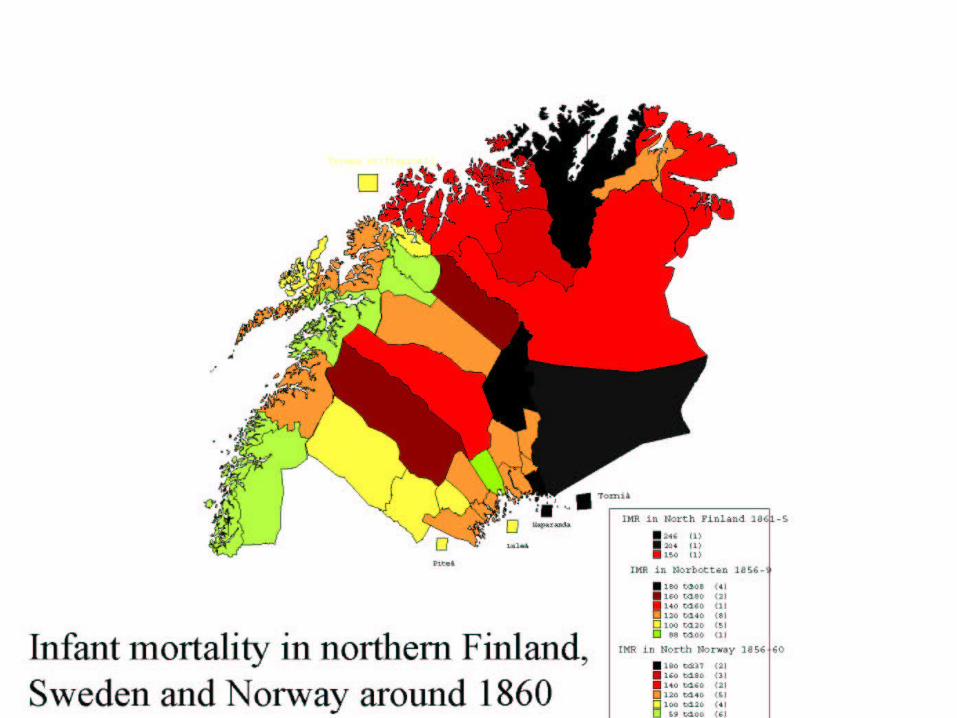
Deceased 0-1 years by 100 live births
Infant mortality in a number of countries 1801-1900

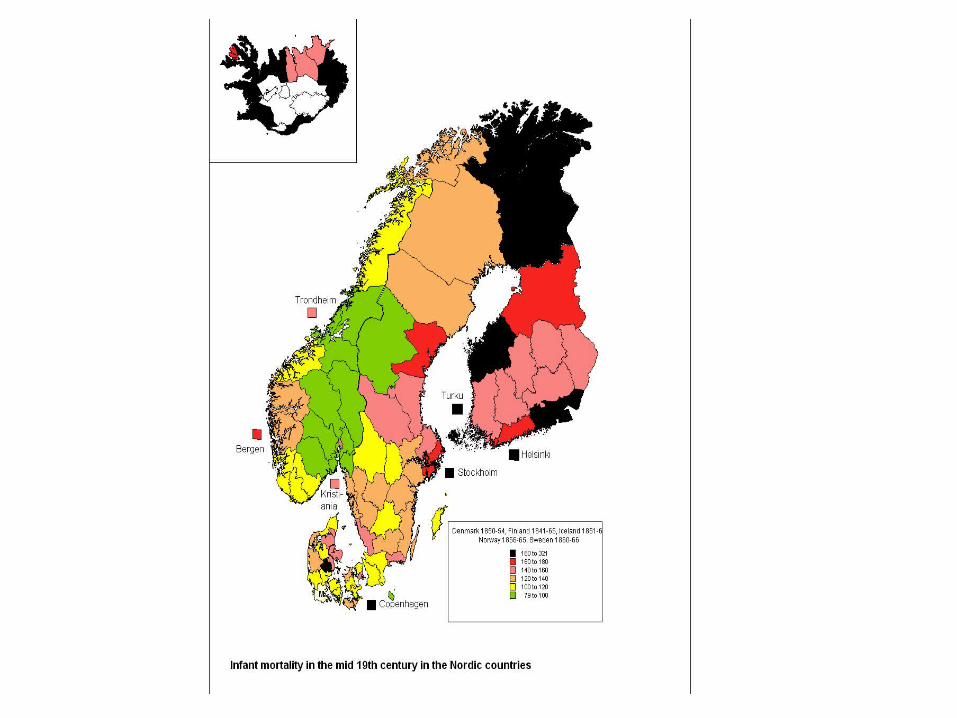
Infant mortality in the Nordic countries till 1998
0
50
100
150
200
250
300
350
400
450
1751 1767 1783 1799 1815 1831 1847 1863 1879 1895 1911 1927 1943 1959 1975 1991
IMR
Norway
Denmark
Finland
Iceland
Sweden
Eng & Wales
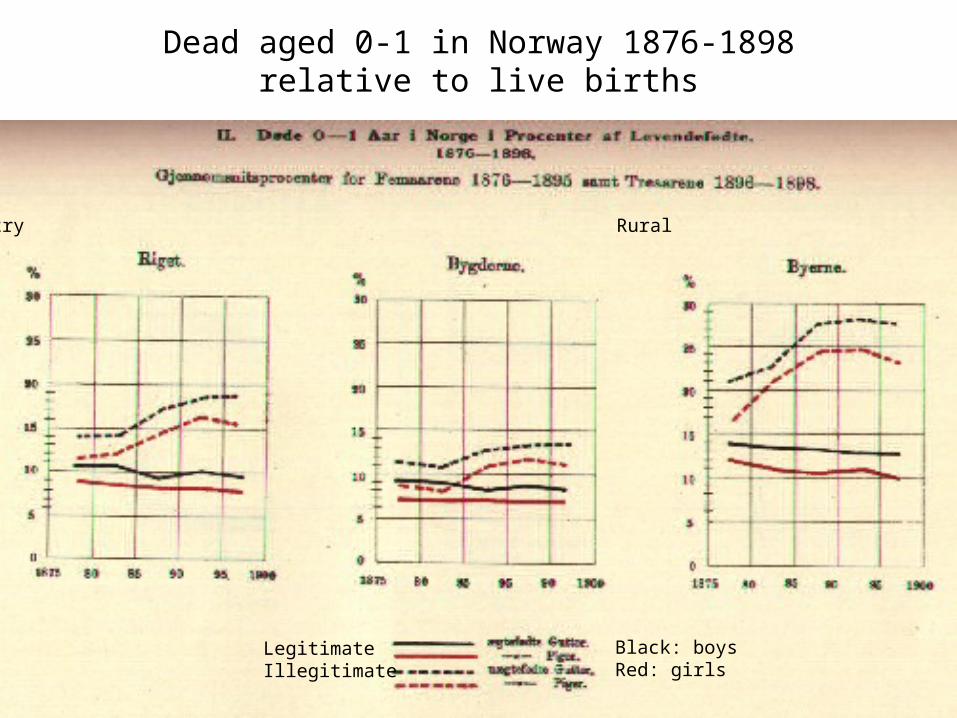
Dead aged 0-1 in Norway 1876-1898 relative to live births
The country Rural Towns
LegitimateIllegitimate
Black: boysRed: girls

Main background factors for child mortality in the late 19th century and today
Level of economic development
Level of technical
knowledge about health
Low High
Low
3rd world countries in the 19th century
3rd world countries today
High
Late 19th
century US
Developed countries today

Negative or no effect from resources• A. Perrenoud (‘La mortalité des enfant en Europe francophone: etat de la question’,
1994): Can infant mortality develop independently from the surrounding social, economic and cultural factors? Climate!
• O. Turpeinen (‘Infant mortality in Finland 1749-1865', 1979): “fluctuations from year to year showed little significant correlation with the extent of the harvest yields. The highest rates of infant mortality figures did not appear in the poorest but in relatively wealthy districts”
• R. Engelsen (Sosiale skilnader i mortalitet på landsbygda i Norge i åra 1802 og 1803, 1982): Higher mortality among farmers than among cottars
• Ó Garðarsdottir (Saving the Child, 2002): In Reykjavík, the higher social strata initially had higher infant mortality, but benefited sooner from the late 19th century improvements than the lower strata.
• England and France in the 19th century (Woods, 2000): Earlier decline for older children than for infants
• K. McQuillan (Culture, religion, and demographic behaviour : Catholics and Lutherans in Alsace, 1750-1870, 1999): Occupational differentials in multivariate study are moderate, some effect for children of workers and servants, else little effect
• A. Brändström ("De kärlekslösa mödrarna" : spädbarnsdödligheten i Sverige under 1800-talet med särskilt hänsyn till Nedertorneå, 1984)
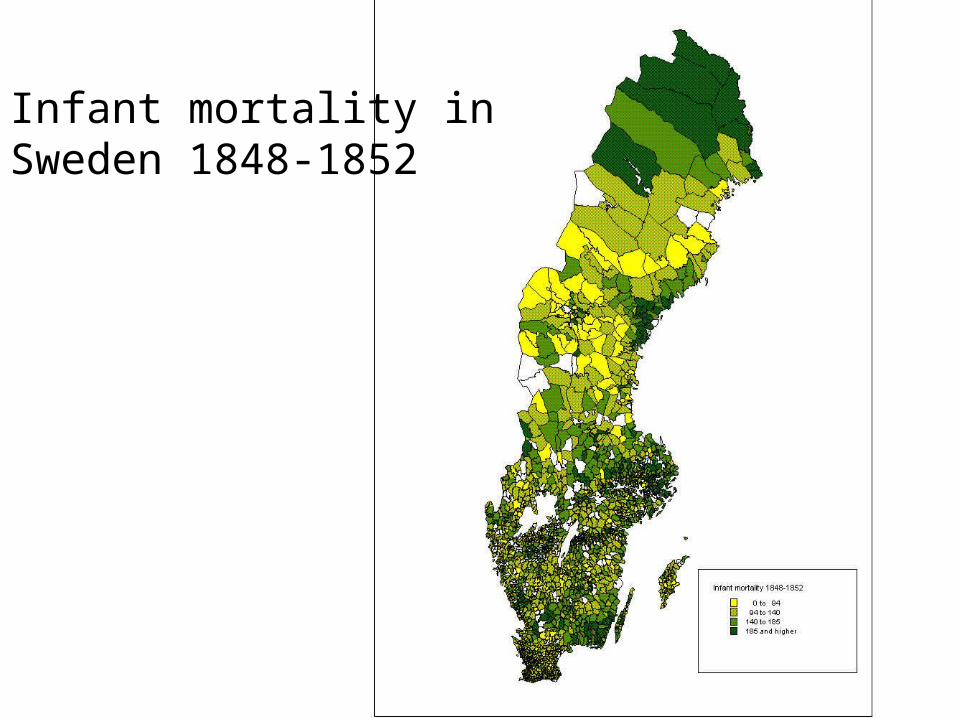
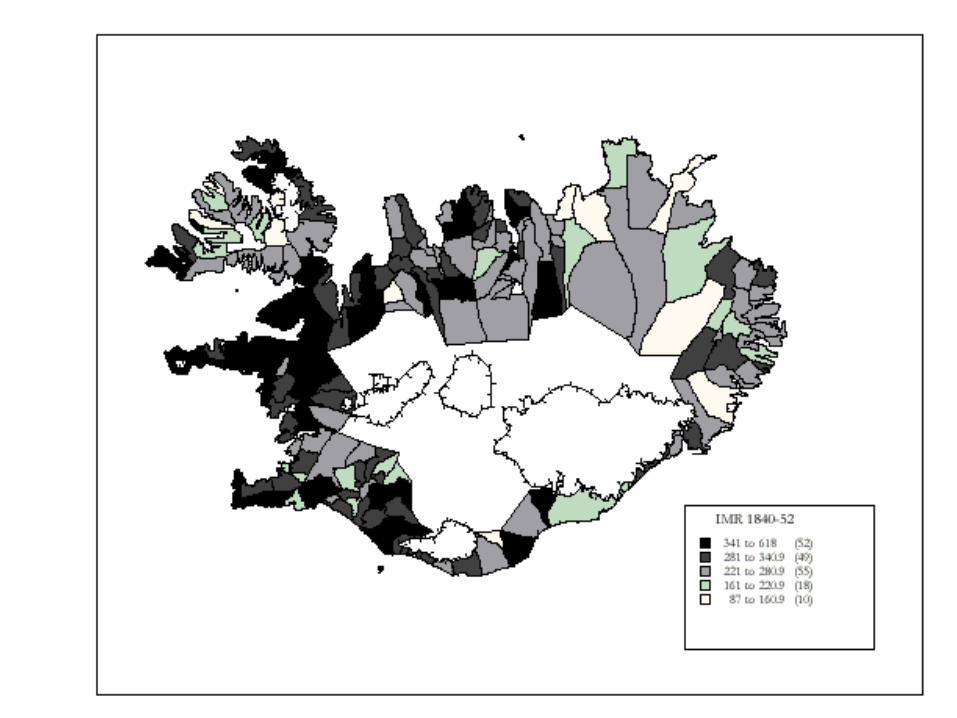
Infant mortality in Sweden 1848-1852
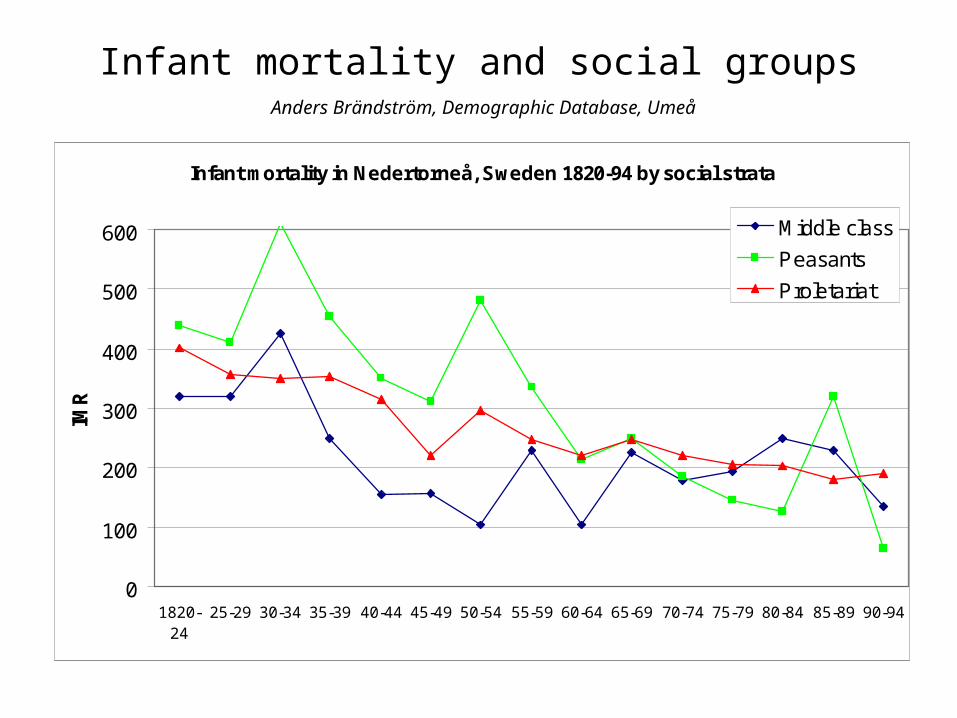
Infant mortality and social groups
Infant mortality in Nedertorneå, Sweden 1820-94 by social strata
0
100
200
300
400
500
600
1820-24
25-29 30-34 35-39 40-44 45-49 50-54 55-59 60-64 65-69 70-74 75-79 80-84 85-89 90-94
IMR
Middle class
Peasants
Proletariat
Anders Brändström, Demographic Database, Umeå
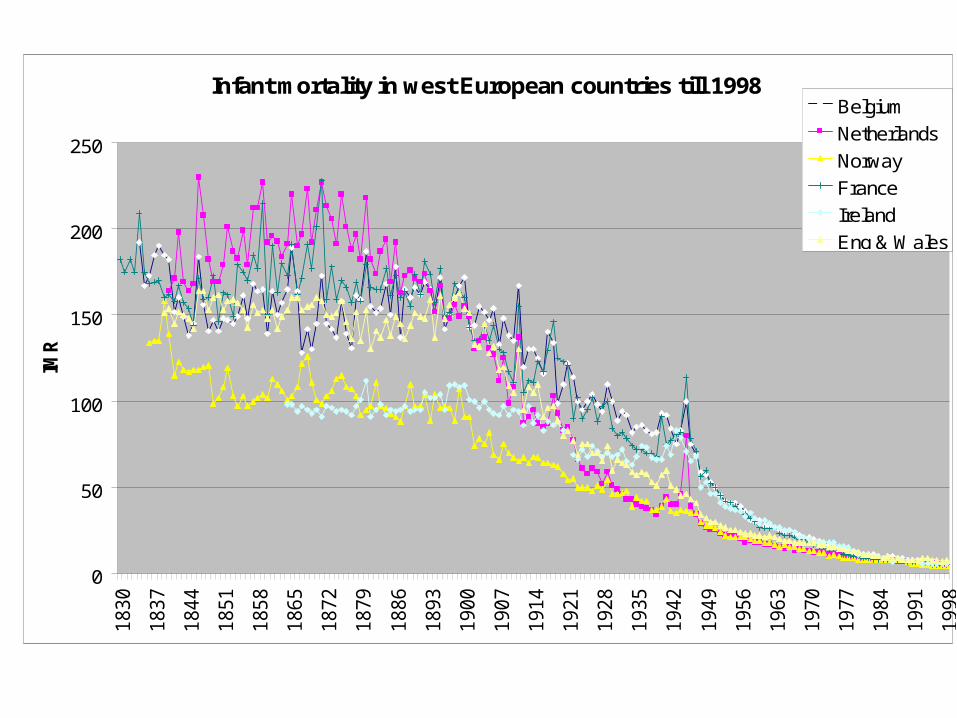
Infant mortality in west European countries till 1998
0
50
100
150
200
2501830
1837
1844
1851
1858
1865
1872
1879
1886
1893
1900
1907
1914
1921
1928
1935
1942
1949
1956
1963
1970
1977
1984
1991
1998
IMR
Belgium
Netherlands
Norway
France
Ireland
Eng & Wales
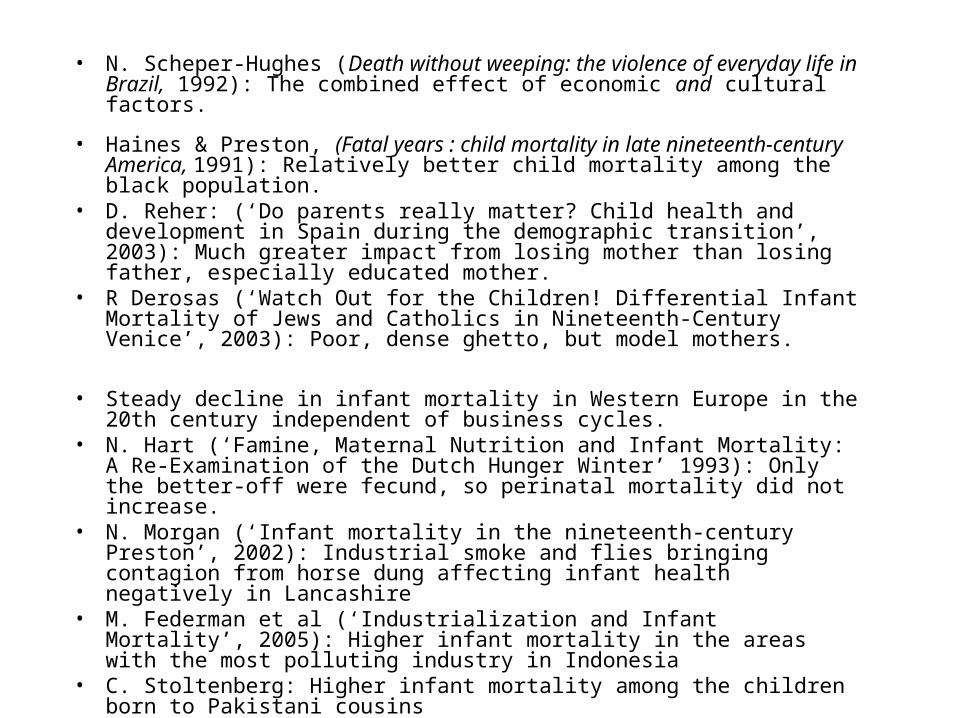
• N. Scheper-Hughes (Death without weeping: the violence of everyday life in Brazil, 1992): The combined effect of economic and cultural factors.
• Haines & Preston, (Fatal years : child mortality in late nineteenth-century America, 1991): Relatively better child mortality among the black population.
• D. Reher: (‘Do parents really matter? Child health and development in Spain during the demographic transition’, 2003): Much greater impact from losing mother than losing father, especially educated mother.
• R Derosas (‘Watch Out for the Children! Differential Infant Mortality of Jews and Catholics in Nineteenth-Century Venice’, 2003): Poor, dense ghetto, but model mothers.
• Steady decline in infant mortality in Western Europe in the 20th century independent of business cycles.
• N. Hart (‘Famine, Maternal Nutrition and Infant Mortality: A Re-Examination of the Dutch Hunger Winter’ 1993): Only the better-off were fecund, so perinatal mortality did not increase.
• N. Morgan (‘Infant mortality in the nineteenth-century Preston’, 2002): Industrial smoke and flies bringing contagion from horse dung affecting infant health negatively in Lancashire
• M. Federman et al (‘Industrialization and Infant Mortality’, 2005): Higher infant mortality in the areas with the most polluting industry in Indonesia
• C. Stoltenberg: Higher infant mortality among the children born to Pakistani cousins
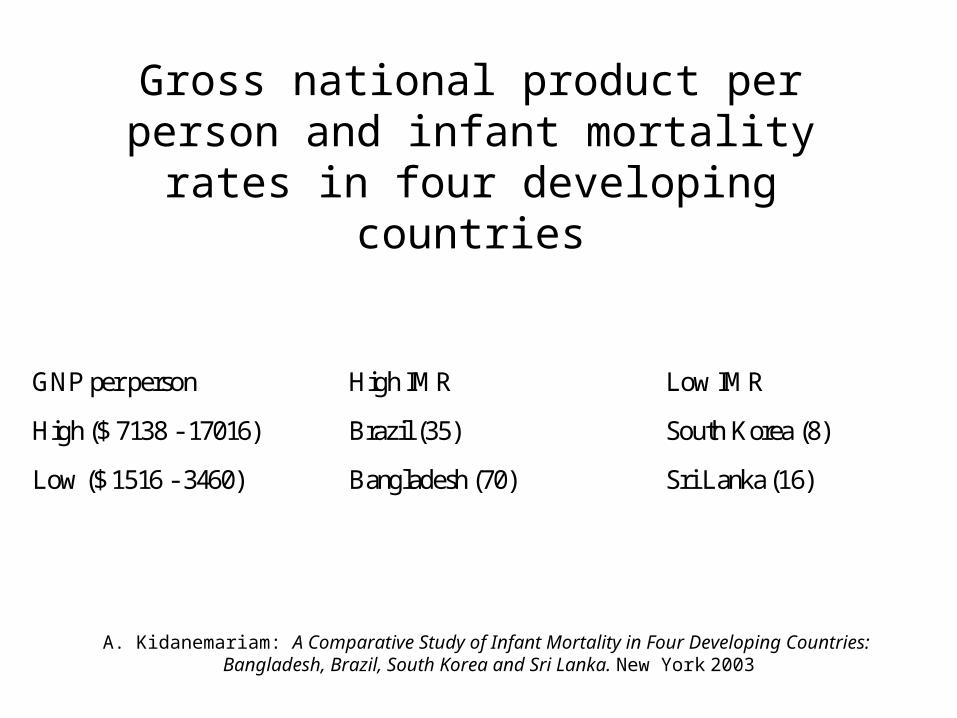
Gross national product per person and infant mortality rates in four developing countries
GNP per person High IMR Low IMR
High ($ 7138 - 17016) Brazil (35) South Korea (8)
Low ($ 1516 - 3460) Bangladesh (70) Sri Lanka (16)
A. Kidanemariam: A Comparative Study of Infant Mortality in Four Developing Countries: Bangladesh, Brazil, South Korea and Sri Lanka. New York 2003
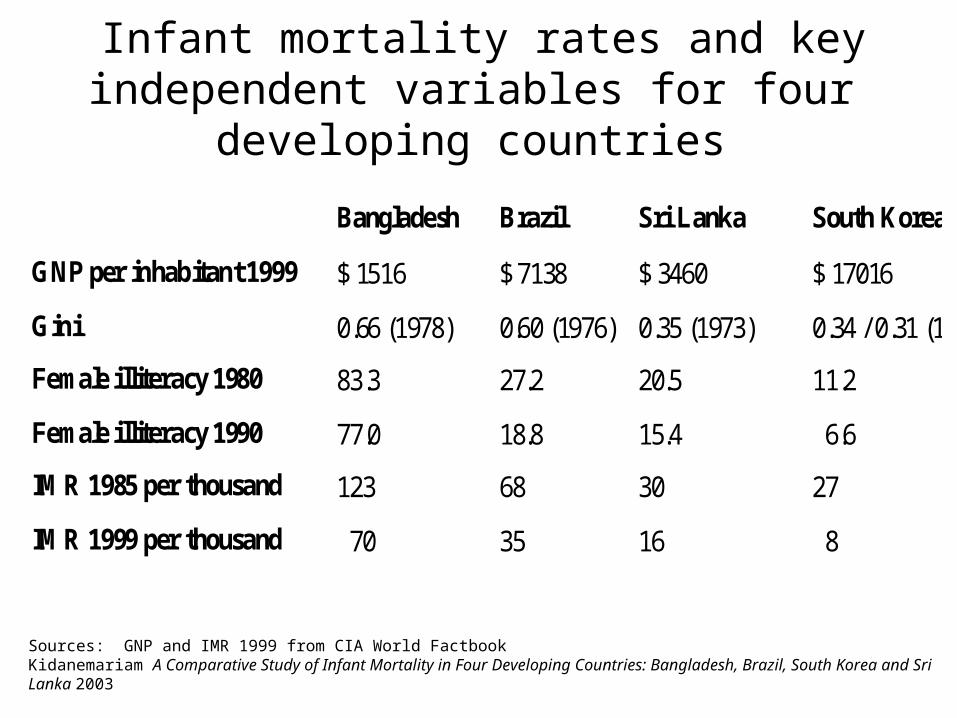
Infant mortality rates and key independent variables for four developing countries
Bangladesh Brazil Sri Lanka South Korea
GNP per inhabitant 1999 $ 1516 $ 7138 $ 3460 $ 17016
Gini 0.66 (1978) 0.60 (1976) 0.35 (1973) 0.34 / 0.31 (1978)
Female illiteracy 1980 83.3 27.2 20.5 11.2
Female illiteracy 1990 77.0 18.8 15.4 6.6
IMR 1985 per thousand 123 68 30 27
IMR 1999 per thousand 70 35 16 8
Sources: GNP and IMR 1999 from CIA World Factbook Kidanemariam A Comparative Study of Infant Mortality in Four Developing Countries: Bangladesh, Brazil, South Korea and Sri Lanka 2003
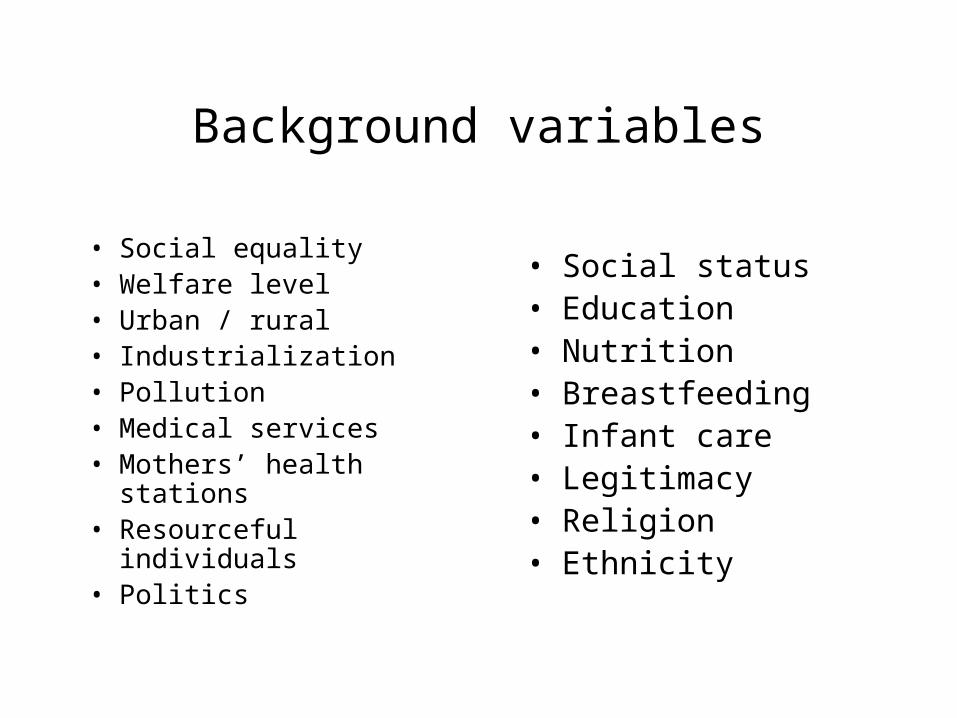
Background variables
• Social equality• Welfare level• Urban / rural• Industrialization• Pollution• Medical services• Mothers’ health stations• Resourceful individuals• Politics
• Social status• Education• Nutrition• Breastfeeding• Infant care• Legitimacy• Religion• Ethnicity

ReferencesDenmark: Anne Løkke, Døden i barndommen, København: 1998Grethe Banggaard, Befolkningsfremmede foranstaltninger og faldende barnedødelighet, Odense 2004.
Iceland: Òlöf Garðarsdottir: Saving the Child. Regional, cultural and socio-economic aspects of the infant mortality decline in Iceland 1820-1940, 2002
Finland: Kari J. Pitkänen, ”Infant Mortality Decline in a Changing Society,” in Yearbook of Population Research in Finland 1983, 46-74.
Sweden: Sören Edvinsson, Marie C Nelson, John Rogers: Dying Young. Swedish infant and childhood mortality in review. Hygiea Internationalis.
Norway: Rural infant mortality in nineteenth century Norway. Hygiea Internationalis: http://www.liu.se/tema/inhph/journal/
Classic work on neonatology: http://www.neonatology.org/classics/
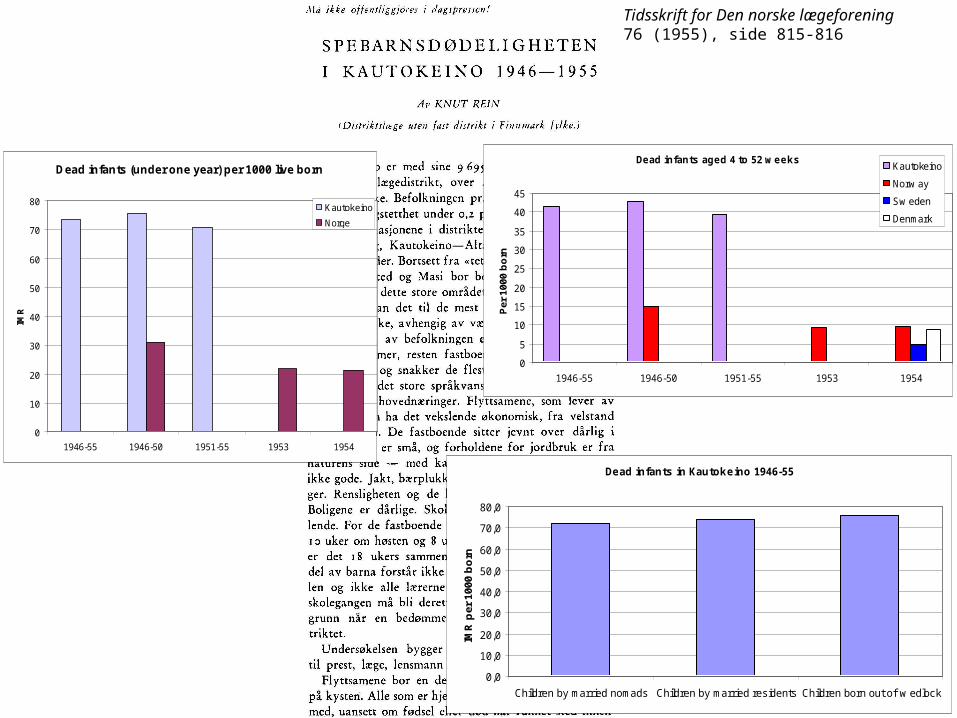
Tidsskrift for Den norske lægeforening76 (1955), side 815-816
Dead infants (under one year) per 1000 live born
0
10
20
30
40
50
60
70
80
1946-55 1946-50 1951-55 1953 1954
IMR
Kautokeino
Norge
Dead infants aged 4 to 52 w eeks
0
5
10
15
20
25
30
35
40
45
1946-55 1946-50 1951-55 1953 1954
Per
100
0 b
orn
Kautokeino
Norw ay
Sw eden
Denmark
Dead infants in Kautokeino 1946-55
0,0
10,0
20,0
30,0
40,0
50,0
60,0
70,0
80,0
Children by married nomads Children by married residents Children born out of w edlock
IMR
per
100
0 b
orn
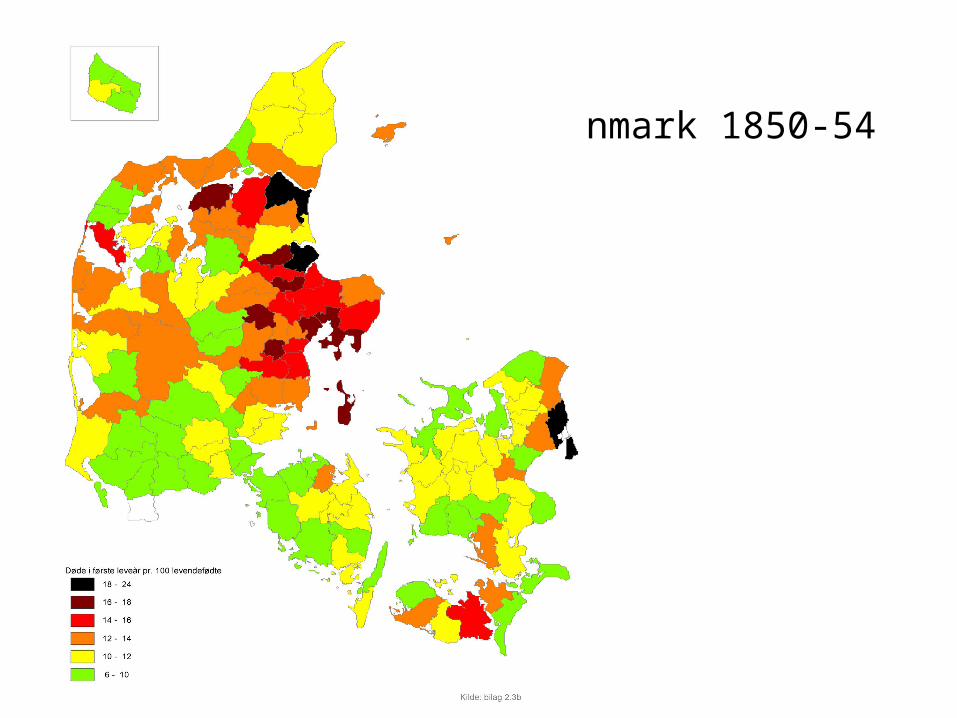
Denmark 1850-54

Bourgeouis-Pichat's biometric test for Norway 1876-85 by sex and legitimacy
0,0
20,0
40,0
60,0
80,0
100,0
120,0
140,0
160,0
1 and 2 w eeks / 1 - 12 months / [log(days+1)]3
Cu
m p
r 1
00
0
Legitimate boys
Legitimate girls
Illeg boys
Illeg girls
Biometric test - Norway
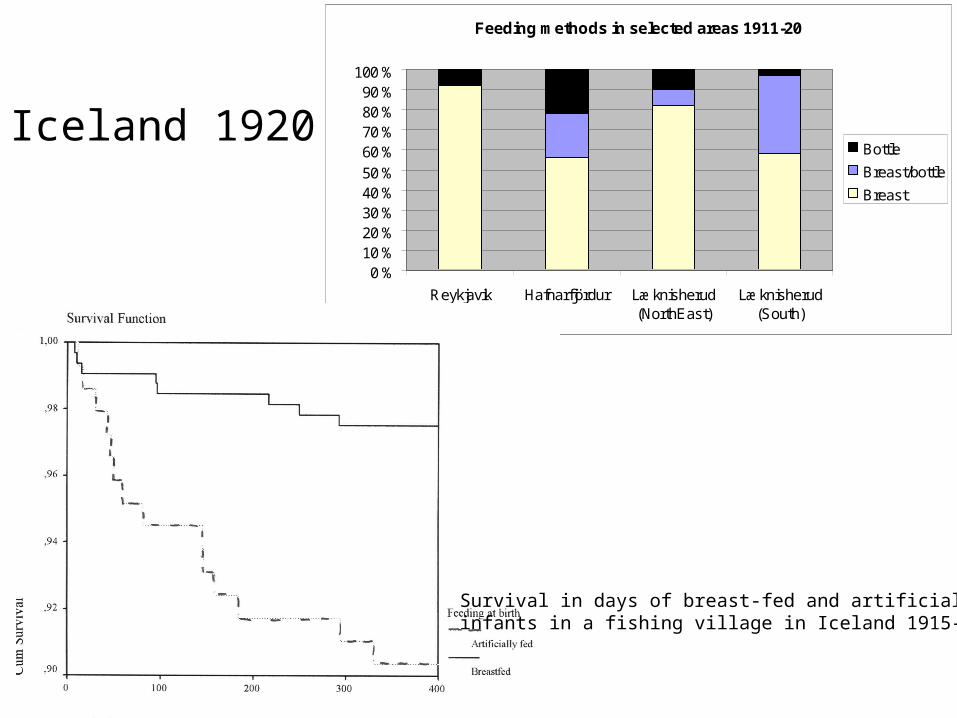
Iceland 1920
Feeding methods in selected areas 1911-20
0 %10 %20 %30 %40 %50 %60 %70 %80 %90 %
100 %
Reykjavik Hafnarfjördur Læknisherud(NorthEast)
Læknisherud(South)
Bottle
Breast/bottle
Breast
Survival in days of breast-fed and artificially fed infants in a fishing village in Iceland 1915-1925
x
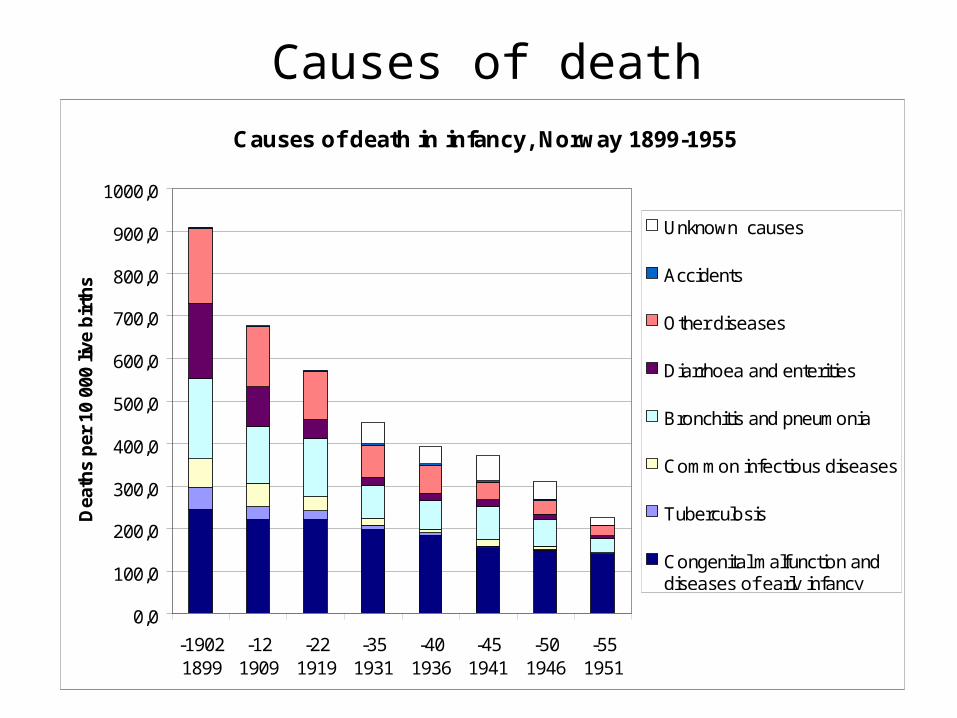
Causes of deathCauses of death in infancy, Norway 1899-1955
0,0
100,0
200,0
300,0
400,0
500,0
600,0
700,0
800,0
900,0
1000,0
-19021899
-121909
-221919
-351931
-401936
-451941
-501946
-551951
Dea
ths
per
10
000
live
bir
ths
Unknown causes
Accidents
Other diseases
Diarrhoea and enterities
Bronchitis and pneumonia
Common infectious diseases
Tuberculosis
Congenital malfunction anddiseases of early infancy
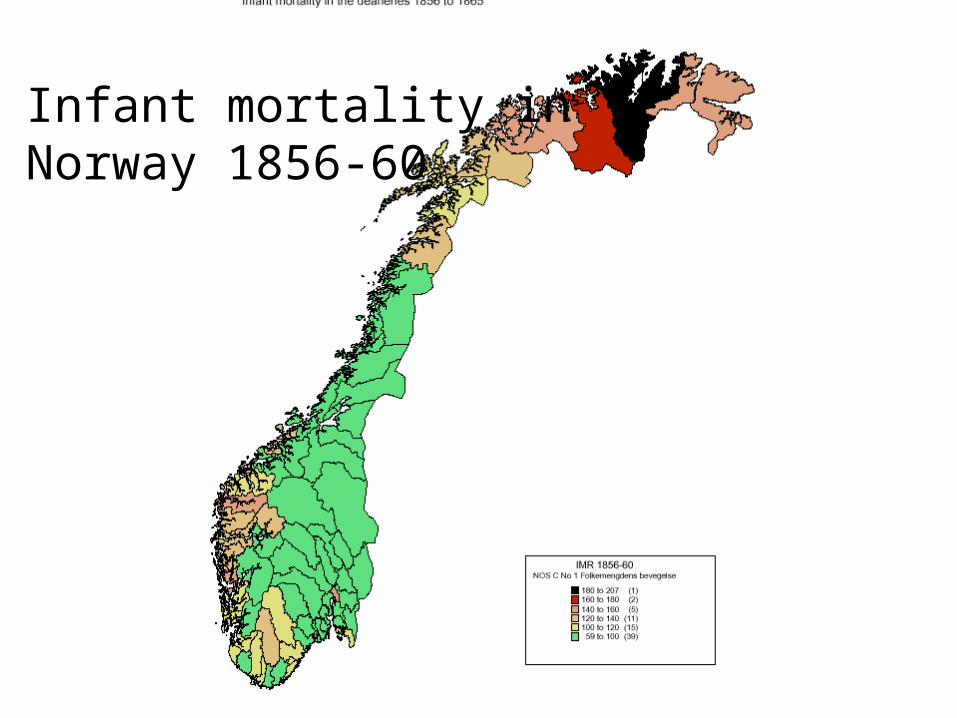
Infant mortality in Norway 1856-60
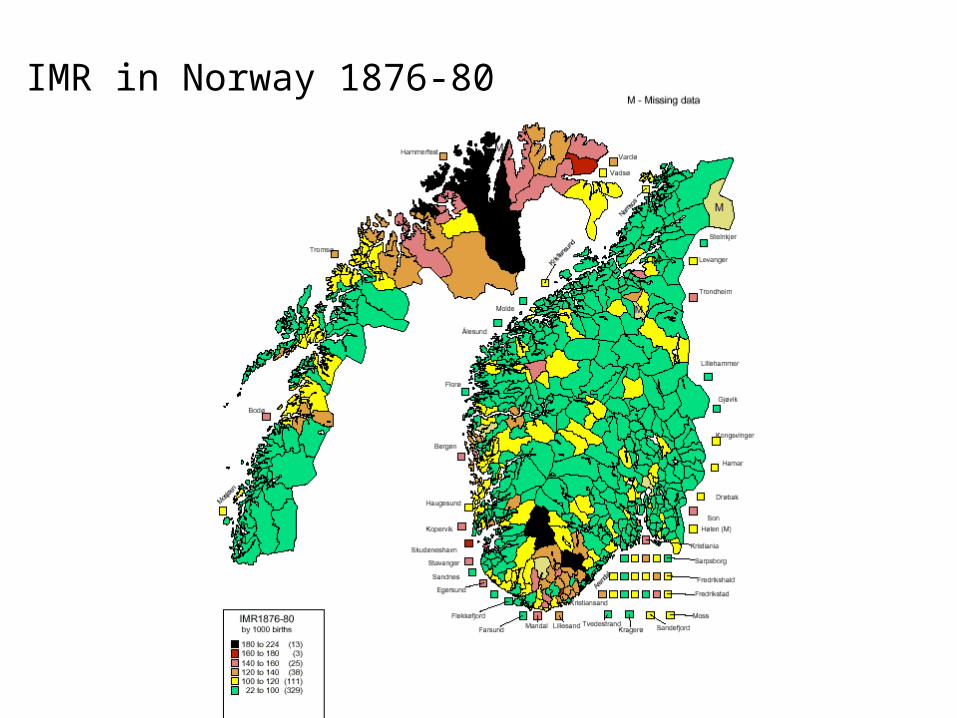
IMR in Norway 1876-80
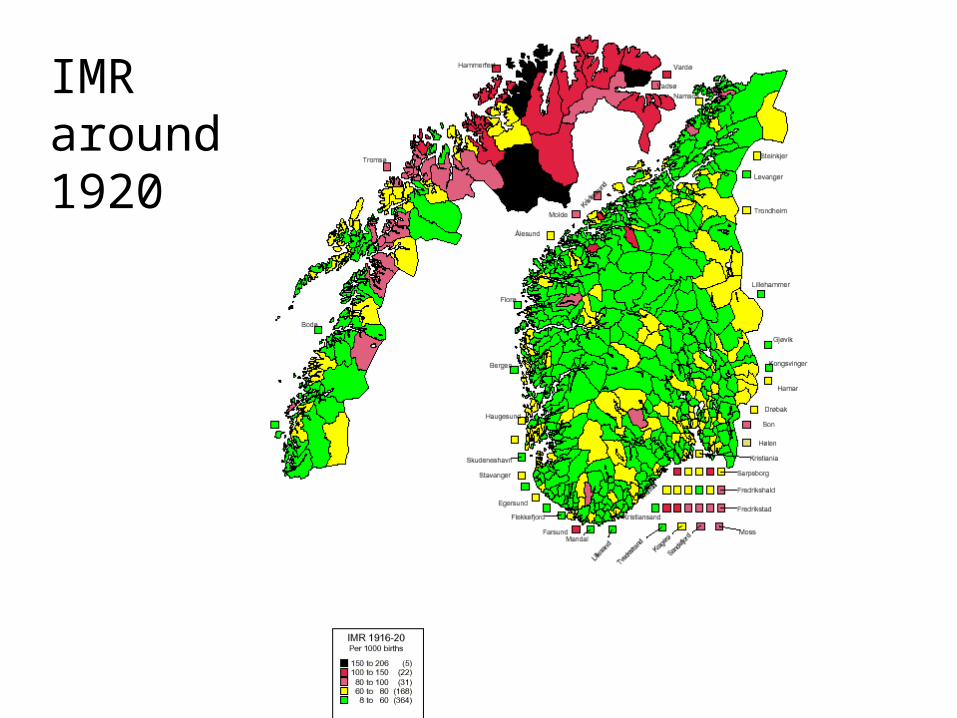
IMR around1920
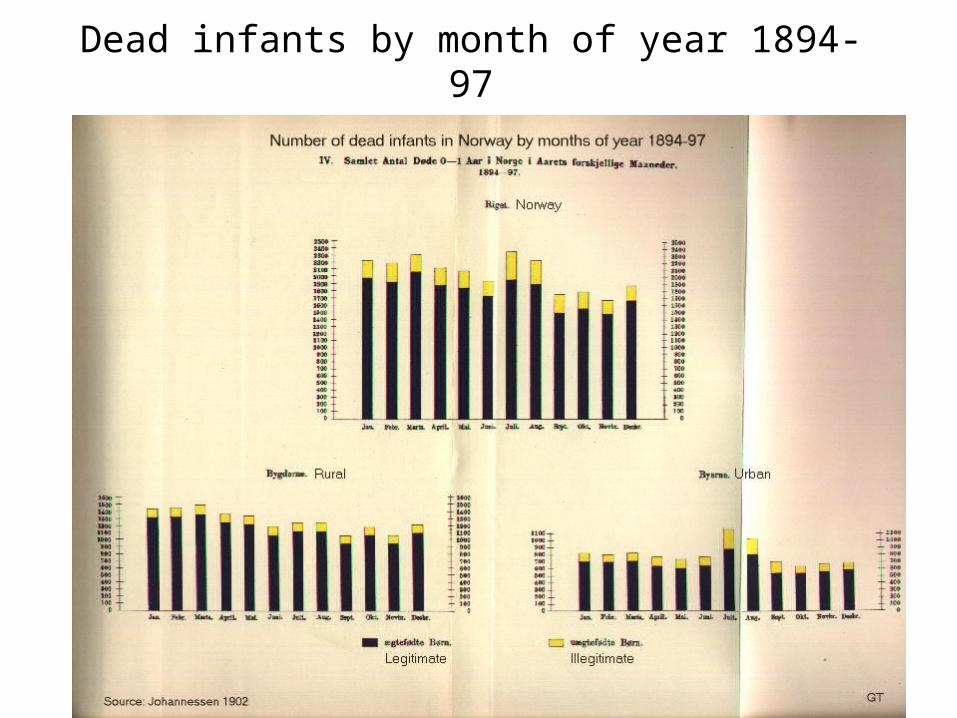
Dead infants by month of year 1894-97
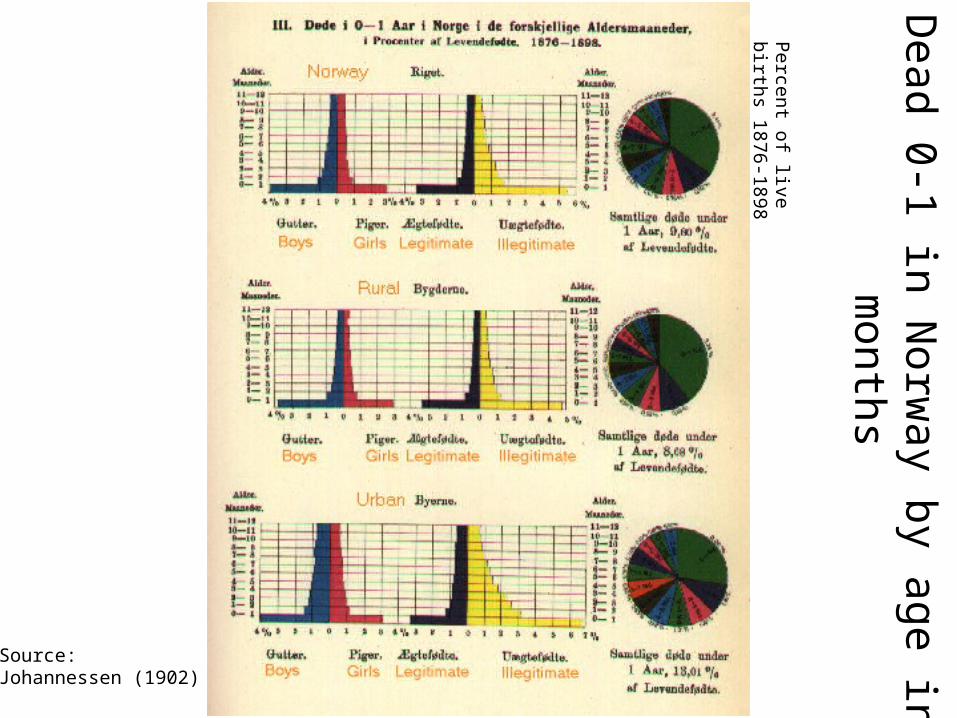
Percent of live births 1876-
1898
Source: Johannessen (1902)
Dead 0-1 in N
orway by age in m
onths

IMR by province
IMR in Norwegian Provinces 1856-1950
0,0
20,0
40,0
60,0
80,0
100,0
120,0
140,0
160,0
180,0
200,0
1856-60
1866-70
1876-80
1886-90
1896-1900
1906-10
1916-20
1926-30
1936-40
1946-50
Pr
1000
bo
rn
Nordland
Troms
Finnmark
Rural districts
Byer Towns