the lebanon brief - mofcomimages.mofcom.gov.cn/lb/accessory/201101/1295868424211.pdf · i r m f r t...
TRANSCRIPT

Your Investment Reference
THE LEBANON BRIEF
ISSUE 709 Week of 17 – 22 January, 2011
ECONOMIC RESEARCH DEPARTMENT Rashid Karame Street, Verdun Area P.O.Box 11-1540 Beirut, Lebanon T (01) 747802/12 F (+961) 1 737414 [email protected]
www.blom.com.lb
S A L

The Lebanon Brief Table Of Contents Page 2 of 14
ISSUE 709; Week of 17 – 22 January, 2011
S A L
TABLE OF CONTENTS
FINANCIAL MARKETS 3 Equity Market 3
Foreign Exchange Market 5
Money & Treasury Bills Markets 5
Eurobond Market 6
ECONOMIC STATISTICS & INDICATORS 7
BdL Foreign Reserves at $31.02B by Mid-January 2011 7
The Number of Tourists at a Record of 2.16M in 2010 7
Tourists Spending Rose a Yearly 21% in 2010 8
ECONOMIC AND FINANCIAL NEWS 9
S&P Revises Downwards its Outlook on Lebanon 9
ESCWA: Lebanon’s Economic Growth to Slow Down in 2011 9
CORPORATE DEVELOPMENTS 10
Bank Audi Profit Reached $352.2M in 2010 10
Fransabank Grants $28.5M Line of Credit to AUB 10
MEA to Join Skyteam Global Alliance 10
FOCUS IN BRIEF 11
New Vehicle Sales in Lebanon in Perspective 11
This report is published for information purposes only. The information herein has been compiled from, or based upon sources we believe to be reliable, but we do not guarantee or accept responsibility for its completeness or accuracy. This document should not be construed as a solicitation to take part in any investment, or as constituting any representation or warranty on our part. The consequences of any action taken on the basis of information contained herein are solely the responsibility of the recipient.

I
FE
The Lebanon Br
SSUE 709; Week
FINANCEquity Mark
Stock Mark
BLOM StockAvg Traded Avg Traded
*22 January 1996
Banking Se
BLOM (GDRBLOM ListedBLOM (GDRAudi (GDR) Audi Listed Audi (GDR) Byblos (C) Byblos PriorByblos (GDRBank of BeirBLC (C) Fransabank BEMO (C)
Banks’ PrefeShares IndeBLOM PrefeBLOM PrefeBEMO PrefeAudi Pref. DAudi Pref. E Byblos PrefeByblos PrefeBank of BeirBank of Beir
* 25 August 200
1300
1500
1700
Jan-10
BLOM StHI: 16
rief Financi
k of 17 – 22 Jan
CIAL Mket
et
k Index* Volume Value
6 = 1000
ctor
M
R) Bd B
R) LBB
Brity BR) rut (C) B
B(B) O
B
Merred x *
erred 2004 Berred 2005 Berred 2006 BD B
Berred 08 Berred 09 Brut Pref. D Brut Pref. E B
6 = 100
Mar-10 May
tock Index 652.42
ial Markets
nuary, 2011
MARKET
21/01/11 1458.37 146,747
1,438,765
Mkt 21/01
BSE $10.2BSE $10.2LSE $10.1BSE $8.5BSE $7.8LSE $8.5BSE $1.8BSE $1.8LSE $85.0BSE $18.5BSE $1.6OTC $30.0BSE $5.6
Mkt 21/01/
104.
BSE $10.4BSE $10.5BSE $99.3BSE $10.4BSE $100.BSE $103.BSE $102.BSE $26.5BSE $25.5
y-10 Jul-10
LO: 14
TS
14/01/111494.29281,525
2,705,580
/11 14/01/
25 $10.525 $10.315 $10.6
51 $8.9880 $7.9250 $8.6180 $1.8585 $1.8500 $85.050 $18.7
66 $1.6600 $30.0
60 $5.40
/11 14/01/1
1 104.1
49 $10.4950 $10.5030 $99.3045 $10.4550 $100.500 $103.050 $102.550 $26.5050 $25.50
Sep-10 N
401.83
1 % Cha -2.40 -47.870 -46.82
/11 % Chan
2 -2.57%9 -1.35%0 -4.25%8 -5.23%2 -1.52%1 -1.28%5 -2.70%5 0.00%0 0.00%5 -1.33%6 0.00%0 0.00%0 3.70%
11 % Chan
1 0.00%
9 0.00%0 0.00%0 0.00%5 0.00%50 0.00%00 0.00%50 0.00%0 0.00%0 0.00%
Nov-10 Jan-1
nge % 7% 2%
The charconcdelaydaily$1.43valueLebanegaloweBSI -1.17weedecr(P/E) On bencEmepresMoreArab1.24loser6.4%declifears Heavdowthe Ltotalsettl4.37low exch
nge
% % % % % % % % % % % % %
nge
%
% % % % % % % % %
1
performanceacterized by c
cern that the y the formatio
y traded volum3M, lower thed at $2.7M.anon’s leadingative note, deest close since
narrowed its7%. As for thekly basis by $ease in the m ratio to 8.91 f
a comparativchmark inderging index tsured by mieover, the BS Composite L% to 124 por in Arab equ
% to settle atine in eight ms over a possi
vyweight Sonward trend tLebanese stoc trades. Solide at $18.18, w% to $18.16 aof $18.02 on
hange, Solider
e of Beirut scautiousness conflicting pon of a new cme reached 1han last wee. The BLOMg index, end
eclining 2.4% e December 2s year to dae market capi
$267.63M to $market weightfrom a previo
ve scale, thex underperfthat fell 1.71ixed corporatI failed to outLargeMidCapints. Egypt buity markets t 6,698 after
months on Tuble spillover f
olidere stocthis week, weck market by
dere Class “Awhile Solidereafter they bot Thursday. O
re GDR tumble
Page
S A L
tock exchang this week on
political interecabinet. The a46,747 sharesek’s 281,525 Stock Index
ded the wee to 1,458 poi29, 2010. Henate performaitalization, it f$10.86B, leadited price to eus value of 9.
e Lebanese formed the % to 1,143
te earnings rperform the S index that dourse was ththis week, tu reaching its uesday on incrom Tunisia.
ck continueighing the mocapturing 83.
A” dropped 4.0e Class “B” dth fell to an 8
On the Londoned 4.25% to $
3 of 14
ge was n higher sts will average s worth shares
x (BSI), k on a ints, its nce, the ance to ell on a ing to a arnings 75.
equity MSCI
points, reports. S&P Pan dropped he main umbling
largest reasing
ed its ost over 87% of 06% to
declined 8-month n Stock $10.15.
I
R
M
F
R
T
The Lebanon Br
SSUE 709; Week
Real Estate
Solidere (A) Solidere (B) Solidere (GDR
Manufacturin
HOLCIM LibaCiments BlanCiments Blan
Funds
Beirut PreferrBLOM Cedars Fund Tranche BLOM Cedars Fund Tranche BLOM Cedars Fund Tranche
BLOM Bond F
Retail Sector
RYMCO ABC (New)
Tourism Sec
Casino Du LibSGHL
rief Financi
k of 17 – 22 Jan
M
BSBS
R) LS
ng Sector
M
n BScs (B) BScs (N) BS
Mred Fund BBalanced “A”
--
Balanced “B”
--
Balanced “C”
--
Fund --
r
MBSO
ctor
M
ban OTOT
ial Markets
nuary, 2011
Mkt 21/01/
SE $18.1SE $18.1SE $18.6
kt 21/01/
SE $17.0SE $2.64SE $0.50
Mkt 21/01/
BSE $104.0
---- $6,612
---- $5,592
---- $5,022
---- $10,175
Mkt 21/01/SE $2.70TC $23.0
Mkt 21/01/
TC $470.0TC $6.00
/11 14/01/
8 $18.96 $18.9
61 $19.5
11 14/01/
0 $16.94 $2.640 $0.50
/11 14/01/
00 $104.
.79 $6,695
.82 $5,663
.46 $5,085
5.94 $10,175
/11 14/01/0 $2.700 $23.0
/11 14/01/
00 $470.00 $6.00
/11 % Cha
95 -4.0699 -4.3755 -4.81
/11 % Cha
95 0.29%4 0.00%0 0.00%
/11 % Cha
00 0.00
5.79 -1.24
3.02 -1.24
5.50 -1.24
5.94 0.00
/11 % Chan0 0.00%00 0.00%
/11 % Chan
00 0.00%0 0.00%
ange
6% 7%
%
In the0.29% With BLOMtrackweekBLOMrespeAs fo$8.51Bybloand Alterthe w2006$8.5,
ange
% % %
Normlead durindetermay perfoovers
ange
%
4%
4%
4%
%
nge % %
nge
% %
e manufacturi% up to $17.
respect to M MENA banks the Leban
kly 2.29% to sM GDR and ective 2.57% or Audi bank1, while its lisos common sBank of Beirnatively, BEMweek at $5.6. In London, and BLOM G
mally, robust to an increag the cominrioration in th
have a ormance of shadowing po
ing sector, Ho
o banking stking index (BMnese financiasettle at 3,696 listed stock and 1.35% tk, its GDR psted stock festock decreasrut stock lost
MO stock clim6, its highest Audi GDR d
GDR fell 4.81%
fourth quartase in prices ng week. Hohe country’s negative im Lebanese
ositive develop
Page
S A L
olcim stock ed
tocks, LebanMBI Lebanon)al stocks, fe6 points. In dek retreated bto align at $1plunged 5.23%ell 1.52% to sed 2.7% to t 1.33% to $
mbed 3.7% toclose since
declined 1.28%% to $18.61.
ter financials of banks’ stowever, a fu
political situmpact over stock, hpments.
4 of 14
dged
non’s ) that ell a
etails, by a 0.25. % to $7.8. $1.8, 18.5.
o end June % to
will tocks rther ation
the ence

I
M
The Lebanon Br
SSUE 709; Week
Foreign ExLebanese F
Dollar / LP Euro / LP Swiss FrancYen / LP Sterling / LPNEER Index
*Close of GMT 0**Nominal Effec**The unadjustemajor currenciesthe approximate
Nominal Eff
Money & Tre
Money Mar
Treasury Yi
3-M TB yield
6-M TB yield
12-M TB yie
24-M TB cou
36-M TB cou
60-M TB cou
Overnight InBDL 45-d
BDL 60-d
88
91
94
97
100
Jan-10 Mar-1
rief Financi
k of 17 – 22 Jan
xchange MaForex Market
2
c / LP
P ** 09:00+2 ctive Exchange Raed weighted averas being traded wit relative price a co
fective Exch
easury Bills
rket Rates
ields
2
d
d
eld
upon
upon
upon
2
nterbank day CD
day CD
0 Apr-10 May-10
ial Markets
nuary, 2011
arket
t 21/01/11 1
1507.50 12040.25 21565.10 118.19
2396.02 294.01
ate; Base Year Janage value of a couthin a pool of curronsumer will pay
ange Rate (N
s Markets
21/01/11 1
3.89%
4.42%
4.59%
5.34%
5.94%
6.18%
21/01/11 1
2.75% 4.40%
4.89%
0 Jul-10 Aug-10
4/01/11 %
1507.50 2015.68 1565.42 -18.20 -
2388.03 94.54 -
n 2006=100 ntry’s currency reencies. The NEER for an imported g
NEER)
4/01/11 Ch
3.89%
4.42%
4.59%
5.34%
5.94%
6.18%
4/01/11 Ch
2.75% 4.40%
4.89%
Oct-10 Nov-10 J
%Change
0.00% 1.22% -0.02% -0.05% 0.33% -0.56%
elative to all R represents good.
Ttb$F0mrr
TsPt2fpLReim
hange bps
0
0
0
0
0
0
hange bps
0 0
0
Te(l1d(Aedd5r TfJlLcsrurc5c
Jan-11
The dollar remhis week as
banks stabiliz$/LP1,510.5-$/Foreign asset0.57% to $31mid-Decembeeached 62.86ecorded in Oc
The euro rosesuccessful bonPortugal and So defuse its
2011, the eurorom $/€1.337
pegged LebanLP/€2,015.68 Rate (NEER) dearlier. The Nmproved 1.49
The Lebaneseending Januar$7M) to reaatter augmen12.3% from Jduring that w$25.2M) and As for total expanded by deposits incredollarization r57.36%. The Crate at 2.75%.
The Ministry ofrom the issuaJanuary 13, 2ess than reLP662.89B ($concentrated subscriptions,remaining 21unchanged acrate for the 1Ycoupon rate fo5.94% respeccontinues to u
mained on dem the local exed towards /LP1,514.5 wts of the Ce.02B by the mr 2010, while6% in Novemctober 2010.
e against thend sales fromSpain, and risdebt crisis. F
o climbed 1.2271 a week eanese currency on 21/01/11.
dropped by 0.NEER decline% from the s
e money markry 6th, 2011, wch LP139,044nted by 0.01January 2010.week, as modemand depodeposits (ex$63.02M, as
eased by a reate of broadCentral Bank m
of Finance maance of Treasu2011. Neverthequired to c$439.7M). Inon the 3Y pa while the 2.5% and 7%ross the matu
Y paper was reor the 2Y and ctively. To noundertake all a
mand on the loxchange ratethe higher b
with a mid-pentral Bank (emid of Januae the dollarizamber 2010 c
e dollar this m highly indebsing confidenFor the week2% to close aarlier. Accord
y depreciated The Nomina.56% to 94.0ed 0.46% same period la
kets slightly gwith broad mo4B ($92.23B)% from Dec. M1 declined
oney in circuosits retreatedxcluding dems both LP anespective $61d money remmaintained th
anaged to raisury bills throuheless, the amcover the mnvestors’ de
aper, accounti2Y and 1Y p% respectiveurity curve as etained at 4.5 3Y papers weote that the accepted bids
Page
S A L
ocal exchangee between Leband of the rice of $/LPexcluding gory 2011 comp
ation rate of dcompared to
week, suppoted countries ce in Europek ending Janat $/€1.3534 odingly, the USto LP/€2,040.
al Effective Ex1 from 94.54 ince year st
ast year.
grew during thoney M3 rising). Consequen
cember 2010 d by LP84B (lation fell byd by LP46B ($
mand depositnd foreign cu1.02M and $2
mained unchahe overnight in
e LP307.63B gh an auctionmount collect
maturing TBsemand was ng for 71.5%papers captuely. Yields re the average d9% while the ere kept at 5.3 Ministry of during the au
5 of 14
e market ebanese peg at
P1,512.5. ld) rose pared to deposits 62.65%
orted by such as ’s ability uary 22,
on Friday S dollar-.25 from xchange a week tart, but
he week g LP11B ntly, the and by $55.7M)
y LP38B $30.5M). s), they
urrencies 2M. The nged at nterbank
($204M) n held on ted was s worth
mainly % of total ured the emained discount average 34% and Finance
uction.

I
E
The Lebanon Br
SSUE 709; Week
Eurobond M Eurobonds
Lebanese G
Matu
2012, 2012, 2013, 2013, 2014, 2014, 2015, 2015, 2016, 2016, 2017,2018,2020,2021, 2022,
2024, • Mid P
The Lebaneseof holding govin purchasingbetween the January 21, thsince DecembJP Morgan eliquidity, this sposition, prov
Lebanon’s cre326bps. In regAs for emerg111-112bps a
4.00%4.50%5.00%5.50%6.00%6.50%
Ja
We
rief Financi
k of 17 – 22 Jan
Market
Index and Y
BLOM WeightWeight*Base Ye** The c
Government
rity - Coupon
Mar - 7.500%Sep - 7.750%Mar - 9.125%Jun - 8.625%Apr - 7.375%May - 9.000%Jan - 5.875%Aug - 8.500%Jan - 8.500%May - 11.625%, Mar - 9.000%, Nov - 5.150%, Mar - 6.375%Apr - 8.250%, Oct - 6.100%Dec - 7.000%
Prices ; BLOMINV
e Eurobond mavernment debt the offered bbid-ask prices he Blom bond ber 2009. The merging marksetback in the
vided the politic
edit default swgional marketsing economiesnd 150-153bps
n-10
ighted Effect
ial Markets
nuary, 2011
Yield
Bond Index (Bted Yield** ted Spread***ear 2000 = 100; i
change is in basis
Eurobonds
n 21/01/11 Price*
% 103.25 % 104.88 % 108.75 % 108.75 % 107.50 % 111.75 % 102.50 % 112.00 % 112.00 % 124.00
% 115.00 % 94.50 % 99.00 % 111.50
% 94.50 % 99.50 VEST bank
arket witnesset amid a deter
bonds, in an at of Eurobonds index (BBI) fel spread againskets’ bond ind secondary macal crisis doesn
wap for 5 years s, Saudi Arabias, insurance ps.
Mar-10
tive Yield of E
BBI)*
* includes US$ sov points ***
14/01/1Price*
104.75106.88111.00111.13109.63114.25104.50115.50115.50131.00119.2599.50104.25116.94100.50103.25
ed a consideraiorating politictempt to main to almost 200l 2% to 109.78
st the US bencex that lost 0arket for Lebann’t persist.
(CDS) was las’s CDS quotesremiums again
May-10
Eurobonds
21/01/11 109.780 5.54%
390 vereign bonds tra*Against US Treas
1 WeeklyChange%
-1.43% -1.87% -2.03% -2.14% -1.94% -2.19% -1.91% -3.03% -3.03% -5.34% -3.56%
-5.03% -5.04% -4.65% -5.97% -3.63%
ble slump thisal environmen
ntain their high0 basis points 8 points, drivin
chmark similarl.7% to 523.1
nese debt will
st trading at 33 remained at 6nst state-debt
Jul-
14/01/11 112.120 4.61%
302 ded on the OTC msuries (in basis po
y %
21Y
4 4 4 4 4 5 5 5 5 6 6 6 6 6 6 7
s week as intert. Major local
h liquidity ratio (bps), depressng the portfolioy broadened t points. Consilikely prove to
34-373bps; sig65-85bps, whedefault in Braz
-10
Change Y-2.09%
93 88
marketoints)
/01/11 Yield
4.57% 4.60% 4.76% 4.73% 4.84%
.06%
.18%
.48%
.71%
.24%
.04%
.05%
.52%
.68%
.79%
.06%
rnational invesholders on thes. These marksing bonds’ pro’s weighted yo 390bps. Thedering the circ be only tempo
nificantly highereas Dubai’s Czil and Turkey
Sep-10
Year to Date -2.04%
98 101
14/01/11 Yield
3.32% 3.39% 3.74% 3.77% 4.16% 4.30% 4.63% 4.68% 4.96% 4.92% 5.30% 5.23% 5.77% 6.01% 6.04% 6.64%
stors succumbe other hand sket dynamics wrices further. Fyield up to 5.54e BBI fell at a fcumstances oorary, and is to
er than last weCDS contracted closed with re
Nov-10
Page
S A L
Weekly Change bps
125 121 102 96 68 76 55 80 75 132 74 82 75 67 75 42
ed to the preshowed little inwidened the s
For the week e4%, the highesfaster pace thaof contained mo regain its pre
eek’s closing ad to 396-410bpespective quot
Jan
6 of 14
ssures terest pread
ending st rate an the
market evious
t 302-psbps. tes of
n-11
The Lebanon Brief Economic Statistics & Indicators Page 7 of 14
ISSUE 709; Week of 17 – 22 January, 2011
S A L
ECONOMIC STATISTICS & INDICATORS BdL Foreign Assets
Source: BdL
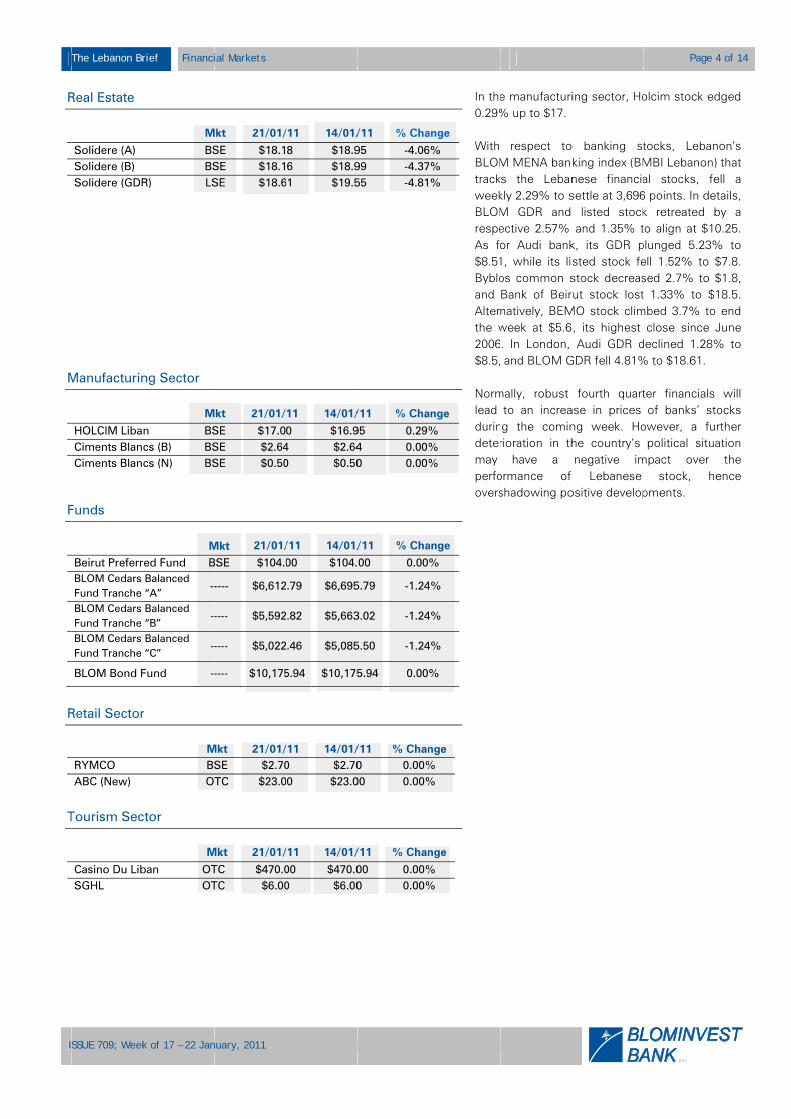
BdL Foreign Reserves at $31.02B by Mid-January 2011 Lebanon’s Central Bank (BdL) bi–weekly balance sheet reached $62.61B by mid-January 2011, recording a significant growth of 14.35% compared to the same period last year. In details, BdL’s foreign assets (excluding Gold) recorded a y-o-y growth of 8.18% to reach $31.02B. The value of gold reserves at the central bank appreciated as well at the mid of January 2011 to $12.61B, up by 20.5% from the same period last year, reflecting the increase in gold prices. As for securities portfolio, it rose by 25.15% on a yearly basis to $9.62B. On the liabilities side, the financial sector deposits that accounted for 69.25% of total liabilities, added a yearly 13.8% to reach $43.36B by mid-January 2011. These comprise the outstanding certificates of deposits issued by BdL in the domestic currency that increased to $18.77B by the end of October 2010, and BdL’s certificates of deposits denominated in foreign currencies that reached $5.4B. Public sector’s deposits, accounting for 9.59% of total liabilities, fell by 5.06% from mid-January 2010 to $6B.
Number of Tourists
Source: Ministry of Tourism
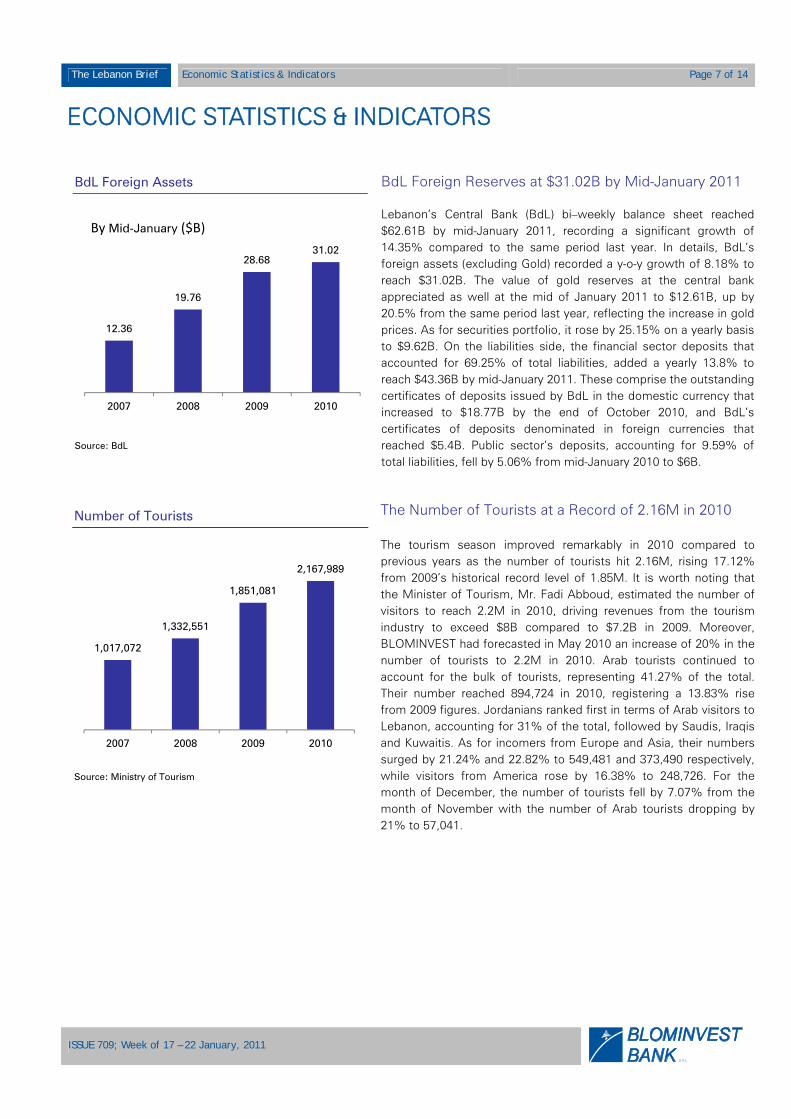
The Number of Tourists at a Record of 2.16M in 2010 The tourism season improved remarkably in 2010 compared to previous years as the number of tourists hit 2.16M, rising 17.12% from 2009’s historical record level of 1.85M. It is worth noting that the Minister of Tourism, Mr. Fadi Abboud, estimated the number of visitors to reach 2.2M in 2010, driving revenues from the tourism industry to exceed $8B compared to $7.2B in 2009. Moreover, BLOMINVEST had forecasted in May 2010 an increase of 20% in the number of tourists to 2.2M in 2010. Arab tourists continued to account for the bulk of tourists, representing 41.27% of the total. Their number reached 894,724 in 2010, registering a 13.83% rise from 2009 figures. Jordanians ranked first in terms of Arab visitors to Lebanon, accounting for 31% of the total, followed by Saudis, Iraqis and Kuwaitis. As for incomers from Europe and Asia, their numbers surged by 21.24% and 22.82% to 549,481 and 373,490 respectively, while visitors from America rose by 16.38% to 248,726. For the month of December, the number of tourists fell by 7.07% from the month of November with the number of Arab tourists dropping by 21% to 57,041.
12.36
19.76
28.6831.02
2007 2008 2009 2010
By Mid-January ($B)
1,017,072
1,332,551
1,851,081
2,167,989
2007 2008 2009 2010

The Lebanon Brief Economic Statistics & Indicators Page 8 of 14
ISSUE 709; Week of 17 – 22 January, 2011
S A L
Spending Distribution by Area in 2010
Source: Global Blue
Tourists Spending Rose a Yearly 21% in 2010 Total tourists spending increased by 21% in 2010 compared to 2009 as the total number of tourists surged 17.12% to reach 2.16M in 2010, according to statistics published by Global Blue Lebanon. Saudi incomers payments’ climbed 27% in 2010 to maintain their leading position as the highest spender in Lebanon, corresponding to 23% of the total. With respect to tourists heading from the UAE, their spending increased by 11%, and represented 10% of total spending. Kuwait’s visitors spent 1% less and accounted for 10% of the total. The most striking performance this year came from Syrian tourists who spent 47% more in 2010 to be ranked fourth, capturing 8% of total spending. Egyptian’s tourists spending in Lebanon advanced 32% compared to 2009. In terms of spending distribution by category, “Fashion & Clothing” industry remains tourists’ largest spending item, however “Electronics” witnessed an important jump last year rising by 33%. With respect to point of sale distribution, Beirut shops attracted visitors the most catching 83% of their total spending.
Baabda, 1%
Kessrwan, 3%
Metn, 13%
Beirut, 83%

I
E
The Lebanon Br
SSUE 709; Week
ECONO Lebanon’s F
Rating Agen
Standard &
Fitch
Moody's
Source: Bloomb
Lebanon’s G
BMI
IMF
IIF
ESCWA
Economist
Source: Blominv
rief Econom
k of 17 – 22 Jan
OMIC A
Foreign Curr
ncy
Poor's
berg
GDP Growth
Intelligence Un
vest Bank-Resear
mic & Financial
nuary, 2011
AND FIN
rency LT De
Rating
B
B
B1
h Forecasts f
nit
ch Dept.
News
NANCIA
bt Rating
g Outloo
Stable
Stable
Stable
for 2011
6.5%
5%
6.5%
6.7%
5.8%
AL NEW
ok
e
e
e
S&P Standits outof botnew odeveloon mAccorgoverin Lebgrowtreducsystemforwaimpro
ESCWin 20 LebanaccordEconoSimonindicabreakdcurrenWith Lebanto imRemiteconothat dglobalindustthis ye
WS
Revises Do
ard & Poor’s tlook on Lebath, long and soutlook reflecopments, and
maintaining suding to S&P,nment will onbanon, especth. This in tue its fiscal dem. S&P addedrd in its stivement of sov
WA: Lebano011
non’s economding to chiefomic and Socn Neaime. Thtors and ddown into acnt circumstanregards to o
non’s unemplomprove with tttances will coomy, totaling developing anl growth in 20trial countries ear.
wnwards it
credit rating aanon from poshort term forects the agenc the effect of
ustainable gro, the internanly delay the mially in the pu
urn will influeeficit, and maid that the inabll faint reforvereign’s cred
on’s Econo
mic growth wf economic cial Commisshis estimate doesn’t takeccount added ces will likelyther local fu
oyment rate sthe persistenontinue to pla$8B in 2011.
nd emerging 011, whereas t that started i
ts Outlook o
agency (S&P) sitive to stableeign denomincy's view of f the Lebanesowth over tl conflict witmuch neededublic sector, wence the abilintain confidebility of the gorm strategiesditworthiness.
mic Growth
will decline analyst at th
sion of Westeis solely ba
e Lebanon’s Neaime, po
y damage grondamentals,
stands at arount growth leay a major ro On a global countries withe slowdownn Q4-2010 wi
Page
S A L
on Lebanon
revised downe keeping its ated debt at BLebanon’s poe cabinet’s dihe medium thin the Leba
d structural reweighing dowity of Leban
ence in the baovernment to s will impede.
h to Slow D
in 2011 to he United Naern Asia (ESCased on econ recent pointing out tha
owth levels fuhe estimated
und 16%, but vels. Furtherle in the Lebanote, Neaime
ll continue ton in the recovll linger throu
9 of 14
n
nward rating
B. The olitical ispute term.
anese forms
wn on on to
anking move e the
Down
5.4%, ations CWA), nomic olitical at the urther. d that is set more, anese e said o lead very of ghout

I
C
The Lebanon Br
SSUE 709; Week
CORPO Bank Audi F
Customer's deposits
Net Loans &advances tocustomers
Total assets
Net Profit
Source: Compan
Fransabank
Source: Compan
MEA Passe
Source: MEA
1.09
2006
In millions
100,000
130,000
160,000
190,000
220,000
250,000
rief Corpora
k of 17 – 22 Jan
ORATE
Financial Hig
8,3
& o 24,
s 28,
3
ny Data
k Gross Loan
ny Data
ngers in 201
2.04
2007
s of $
ate Developme
nuary, 2011
DEVEL
ghlights ($M
2010 2
387.23 6,5
,675.59 22,8
,692.99 264
352.24 28
ns and Adva
10
2.35
2008
nts
LOPME
)
009 %ch
87.63 27.32
807.49 8.19%
486.01 8.33%
88.95 21.90
nces
2.94
2009
NTS
h
2%
%
%
0%
Bank A Bank Aincreaseis mainlyand com$489.71balance 2009 toattain $8.19% twith an Earningsfigure.
Fransa FransabUniversi$28.5M.interest with thencoura
MEA to Middle FebruaryFrance aFrance MohamNovembbe the sthe sign
Audi Profit
udi publishede of 21.9% in y attributed to
mmission incoM and $173 sheet, total a
o reach $28.7$8.38B. On to $24.67B, w 11.7% capits per share (
bank Grant
ank signed ty of Beirut (A. The line of rates. Fransa
he guidelinesge the provis
o Join Skyte
East Airlines y this year toand Delta Air
CEO, Pierrmed al-Houtber. Accordingsecond Arab ing of the Sau
t Reached
d its financianet profits to
o a dual rise inome, which c.4M respectivassets grew b7B, with custhe liabilities
while shareholdtal adequacy EPS) stood a
s $28.5M L
a corporate AUB) to grantcredit that is abank declare of the ceion of funds to
eam Global
said it will so join the SkyLines. The agre-Henri Gou, during theg to Lebanesecarrier to join
udi Airlines wi
$352.2M i
al results for $352.2M comn net interest climbed by 15vely. With reby 8.33% frotomers' loansside, custom
ders’ equity u ratio as per t $0.96, up b
Line of Cred
agreement t it an 11-year in Lebaneseed that this aentral bank oo different loc
l Alliance
sign an agreeyteam Global greement wasurgeon, and
e former’s ve Newspapern the Skyteamith the alliance
Page 1
S A L
in 2010
r 2010 reveampared to 200income and n
5.5% and 17.8spect to the m end of Decs adding 27.3mers’ depositup 10.62% to Basel II sta
by 20% from
dit to AUB
with the Amr line of credi pounds carr
agreement coof Lebanon, cal sectors.
ment by the Alliance, leds set up betwd MEA chisit to Lebar, al-Nahar, Mm Alliance foe earlier this m
0 of 14
ling an 09. This net fees 82% to bank's cember 32% to ts rose $2.42B ndards. 2009’s
merican t worth ies low
onforms which
end of by Air
ween Air airman, non in
MEA will ollowing month.
The Lebanon Brief Focus In Brief Page 11 of 14
ISSUE 709; Week of 17 – 22 January, 2011
S A L
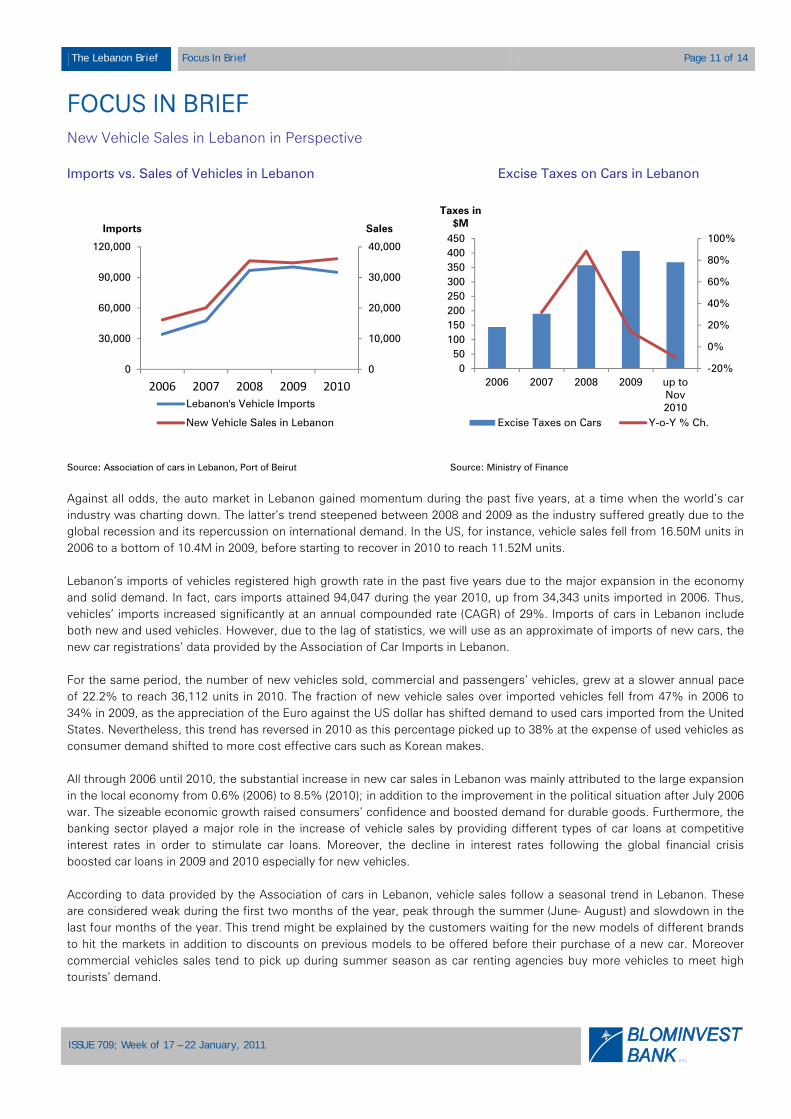
FOCUS IN BRIEF New Vehicle Sales in Lebanon in Perspective Imports vs. Sales of Vehicles in Lebanon Excise Taxes on Cars in Lebanon
Source: Association of cars in Lebanon, Port of Beirut Source: Ministry of Finance
Against all odds, the auto market in Lebanon gained momentum during the past five years, at a time when the world’s car industry was charting down. The latter’s trend steepened between 2008 and 2009 as the industry suffered greatly due to the global recession and its repercussion on international demand. In the US, for instance, vehicle sales fell from 16.50M units in 2006 to a bottom of 10.4M in 2009, before starting to recover in 2010 to reach 11.52M units. Lebanon’s imports of vehicles registered high growth rate in the past five years due to the major expansion in the economy and solid demand. In fact, cars imports attained 94,047 during the year 2010, up from 34,343 units imported in 2006. Thus, vehicles’ imports increased significantly at an annual compounded rate (CAGR) of 29%. Imports of cars in Lebanon include both new and used vehicles. However, due to the lag of statistics, we will use as an approximate of imports of new cars, the new car registrations’ data provided by the Association of Car Imports in Lebanon. For the same period, the number of new vehicles sold, commercial and passengers’ vehicles, grew at a slower annual pace of 22.2% to reach 36,112 units in 2010. The fraction of new vehicle sales over imported vehicles fell from 47% in 2006 to 34% in 2009, as the appreciation of the Euro against the US dollar has shifted demand to used cars imported from the United States. Nevertheless, this trend has reversed in 2010 as this percentage picked up to 38% at the expense of used vehicles as consumer demand shifted to more cost effective cars such as Korean makes. All through 2006 until 2010, the substantial increase in new car sales in Lebanon was mainly attributed to the large expansion in the local economy from 0.6% (2006) to 8.5% (2010); in addition to the improvement in the political situation after July 2006 war. The sizeable economic growth raised consumers’ confidence and boosted demand for durable goods. Furthermore, the banking sector played a major role in the increase of vehicle sales by providing different types of car loans at competitive interest rates in order to stimulate car loans. Moreover, the decline in interest rates following the global financial crisis boosted car loans in 2009 and 2010 especially for new vehicles. According to data provided by the Association of cars in Lebanon, vehicle sales follow a seasonal trend in Lebanon. These are considered weak during the first two months of the year, peak through the summer (June- August) and slowdown in the last four months of the year. This trend might be explained by the customers waiting for the new models of different brands to hit the markets in addition to discounts on previous models to be offered before their purchase of a new car. Moreover commercial vehicles sales tend to pick up during summer season as car renting agencies buy more vehicles to meet high tourists’ demand.
0
10,000
20,000
30,000
40,000
0
30,000
60,000
90,000
120,000
2006 2007 2008 2009 2010
SalesImports
Lebanon's Vehicle Imports
New Vehicle Sales in Lebanon
-20%
0%
20%
40%
60%
80%
100%
050
100150200250300350400450
2006 2007 2008 2009 up toNov2010
Taxes in $M
Excise Taxes on Cars Y-o-Y % Ch.

The Lebanon Brief Focus In Brief Page 12 of 14
ISSUE 709; Week of 17 – 22 January, 2011
S A L
On the geographical front, European makes have given away their leading place in the Lebanese market to Japanese and Korean brands. This is mainly attributable to the strengthening of the euro currency, and consumers’ willingness to shift their preference to small and fuel efficient cars in light of rising fuel prices that hit $79.6/barrel in 2010 up from $66.2/barrel in 2006. In detail, market share of European brands in Lebanon fell from 42% in 2005 to around 23% in 2010. Sales of Japanese and Korean brands showed also a direct correlation with the rise in oil prices mentioned previously, lifting their combined market share from 58% to 70% over the 2006-2010 period. However, the appreciation of the yen over the US dollar in late 2010, led to a decline in Japanese brand sales from 40% in 2009 to 30% in 2010. This decline was compensated by a rise in Korean brands’ market share from 66% in 2009 to 70% in 2010, as consumers shifted their interest towards lower cost fuel efficient vehicles. As for US vehicles, their market share slightly dropped from 7.6% in 2006 to 5.5% last year. In terms of new vehicles sales by brand type, between the years 2006 and 2009, Nissan kept its leadership in the Lebanese market whereas KIA overtook its place in 2010. In fact, Nissan sales rose from 2,178 units in 2006 to 7,394 units in 2009 allowing its dealer in Lebanon, Rasamny Younis Motor to grasp the lion’s share in the market during the aforementioned period with a stake ranging between 21% and 23%. Throughout that period, Toyota and KIA lagged behind with their sales reaching 5,010 vehicles and 3,922 vehicles respectively in 2009. Their corresponding dealers in Lebanon, BUMC and NATCO SAL, captured the second and third positions accounting for around 15% and 11% of the market. However, this trend was reversed in 2010, as KIA sales grew significantly to 6,494 units driving NATCO to seize the lion’s share with a stake of 17.98% ahead of Rasamny Younis. The latter’s shares stood at 17.64% as Nissan’s sales fell to 5,988 units hit by strong yen. Huyndai’s sales at 4,315 units in 2010 also allowed its dealer, Century Motor Co, to gain market share of 11.95% and hit the third place in the market ahead of BUMC. The latter’s market share drew back to 10.4% as Toyota’s sales fell by a yearly 26.7% to 3,669 units. It is interesting to note that new luxury car brand sales surged during the past five years, climbing 128% from 2006 to reach 397 units in 2010, while adding 19.5% year-on-year. In fact, 26, 12, 335, 22 of Maserati, Aston Martin, Porsche and Bentley were sold respectively in 2010 compared to 6, 3, 159 and 5 cars sold in 2006. On the economic front, the contribution of the auto market in Lebanon to government revenues through excise taxes on cars and private car registration fees witnessed a remarkable surge between 2006 and 2010. Statistically, data provided from the Ministry of Finance showed that combined excise taxes on cars and new car registration fees reached $510.7M in the first eleven months of 2010 compared to $216.2M recorded in 2006, registering an annual compounded rate growth of around 24%. To conclude, we expect that Lebanon’s automotive market will remain on the rise in the coming years backed by a robust economic expansion, notwithstanding the political differences in the country. .

Your Investment Reference
S A L
Research Department: Marwan Mikhael [email protected] Cynthia Zeilah [email protected] Malak Hawa [email protected] Walid Sayegh [email protected] Gaelle Khoury [email protected]