the long-term game: an analysis of the life...
TRANSCRIPT

1
The Long-Term Game: An Analysis of the Life Expectancy of National Football
League Players
By Ruud Koning, Victor Matheson, Anil Nathan, and James Pantano
March 2014
COLLEGE OF THE HOLY CROSS, DEPARTMENT OF ECONOMICS FACULTY RESEARCH SERIES, PAPER NO. 14-01*
Department of Economics College of the Holy Cross
Box 45A Worcester, Massachusetts 01610
(508) 793-3362 (phone) (508) 793-3708 (fax)
http://academics.holycross.edu/economics-accounting
*All papers in the Holy Cross Working Paper Series should be considered draft versions subject to future revision. Comments and suggestions are welcome.

2
The Long-Term Game: An Analysis of the Life Expectancy of National Football
League Players
Ruud Koning†, Victor Matheson††, Anil Nathan†††, and James Pantano††††
Abstract
The National Football League (NFL) has recently received significant negative media attention surrounding the safety of its players, revolving largely around the long term health risks of playing the sport. Recent premature deaths and instances of suicide associated with chronic traumatic encephalopathy and other football related injuries have brought the sport under increased scrutiny. By comparing mortality rates of the general population to mortality rates of players from the 1970 and 1994 NFL seasons, we test whether or not participation in football is significantly harmful to the longevity of the players. We conclude that, in total, players in the NFL have lower mortality rates than the general population. However, there is evidence that line players have higher mortality rates than other players and that those who played more games have higher mortality rates than those who played fewer games.
JEL Classification Codes: L83, I10, I19
Keywords: National Football League, premature deaths, survivability, injurie
†Department of Economics and Econometrics, Faculty of Economics and Business, University of Groningen, PO Box 800, 9700 AV Groningen, The Netherlands. Email: [email protected]
††Department of Economics and Accounting, College of the Holy Cross, One College Street, P.O. Box 157A, Worcester, MA 01610. Email: [email protected]
†††Department of Economics and Accounting, College of the Holy Cross, One College Street, P.O. Box 145A, Worcester, MA 01610. Email: [email protected]
††††Class of 2013, College of the Holy Cross

3
1. Introduction
The National Football League (NFL) has recently been scrutinized about the
impact of playing the game on mortality and quality of life. High profile cases such
as the suicides of Atlanta Falcons safety Ray Easterling, Chicago Bears defensive back
Dave Duerson, and San Diego Chargers linebacker Junior Seau, as well as the tragic
premature death of long-time Pittsburgh Steeler Mike Webster, have certainly pushed
these issues to the forefront of media attention (Schmalzbauer, 2004). Cantu (2007)
and Rukovets (2013) confirm that both Webster and Seau had chronic traumatic
encephalopathy (CTE), and other sources confirmed evidence of CTE in both Duerson
and Easterling (Mecham, 2013). CTE is most often caused by severe and repeated
head injuries and leads to brain degeneration and dementia (McKee et al., 2013).
In August 2013, the NFL attempted to settle a lawsuit brought by former players
claiming that the league downplayed the risks of concussion-related brain injuries. The
NFL agreed to provide $765 million to compensate victims, pay for medical exams for
4,500 plaintiffs and other retired players, and engage in medical research (Smith, 2013).
Due to questions regarding the adequacy of the payout, however, the settlement was not
granted initial approval by Judge Anita Brody who noted that, “…it is difficult to see how
the Monetary Award Fund would have the funds available over its lifespan to pay all
claimants…” (Farrar, 2014)
However, the financial implications go much further than just settling the
grievances of past players. The long term future if the NFL could be at stake through two
channels. First of all, the perception already exists that the NFL is a guilty pleasure where
spectators enjoy the game at the long-term expense of the health of the participants
(Reilly, 2013). Mounting evidence that playing in NFL causes serious health problems or
4
shortens life could cause a drop in the NFL’s popularity similar to what is happened to the
sport of boxing (Donnelly, 1988). Secondly, due to health concerns there has already been
a drop in football participation rates at the youth level. Between 2010 and 2012, a period
of heightened awareness of head injuries in the NFL, there was a 6.7% drop in the number
of players ages 6 through 14 playing Pop Warner Football, the largest decline in the
organization’s long history (Fainaru and Fainaru-Wada, 2013). A continued drop in
participation would impact the pipeline of players into the NFL as well as future interest in
the sport in general.
While anecdotal evidence of players dying prematurely is both alarming and the
subject of considerable attention in the popular press, can it be statistically shown that
playing in the NFL leads to a lower life expectancy for ex-players? This paper will
examine both whether NFL players have a higher mortality rate than the general population
and will look at which factors affect the mortality of NFL players.
Baron and Rinsky (1994) show that former NFL players have a much lower
mortality rate than the general population, as well as some other interesting
patterns.1 Lehman et al. (2012) also find that NFL players have lower mortality
rates than the general population while having a higher incidence of
neurodegenerative mortality. These papers show evidence that high profile deaths
can skew the perception of the risk of playing in the NFL.
Our paper adds to the literature by using a flexible probability model
developed in Koning and Amelink (2012) that can be used to compare NFL mortality
rates to those in the general population. In addition, we also use Cox hazard rate
1 For example, defensive linemen have higher rates of cardiovascular disease than the general population, and black players were more likely to develop cardiovascular disease than white players.
5
models to estimate survival of players at an individual level and to determine the
impact of games played, position, and race on player mortality.
Our results show that NFL players have a lower mortality rate than the general
population (by race and overall) in both the 1970 and 1994 seasons. In the 1970
season, offensive and defensive line players have higher mortality rates than those in
the other positions, and non-white players have higher mortality rates than white
players. Most importantly, players who played more than 2 seasons worth of games
have higher mortality rates than those that have played less. In the 1994 season, line
players have higher mortality rates than those who are in the skilled positions, but
other factors are not statistically significant.
Sections 2 and 3 describe the data and models used in the study, while Section
4 displays the results. Section 5 concludes and discusses some more potential
research.
2. Data
We examine player cohorts for two seasons, 1970 and 1994, and include all
players who appeared in at least one game during either of those seasons. The 1970
season was chosen for two reasons. First, using an older season ensures that survival
probabilities in the general population become sufficiently low and observational data
with the players have enough natural attrition to be meaningful. Second, 1970 was
the first season after the National Football League-American Football League merger
effectively doubling sample size of players and also ensuring that players in the sample
had relatively standardized equipment and playing conditions. It should be noted,
however, that the data set includes all players who played during the 1970 season, not

6
just who started their careers in the 1970 season, so the player statistics may include
games played prior to the merger. The 1994 season included to see whether changes in the
game, including better equipment as well and stronger and faster players, has had an effect
on player mortality. In addition, the 1994 cohort is one which has, anecdotally, experienced
an abnormally large number of premature deaths.
Most of the player data for the 1970 and 1994 NFL seasons were collected
on “Pro-Football-Reference.com” which has season-by-season statistics for every
player to have appeared in an NFL game as well as dates of birth and death for all
players. Data on race was revealed through online picture searches of the players.
Players were placed into one of three positional categories: skill positions, which
include wide receivers, tight ends, quarterbacks, and running backs; line positions,
which include players on the offensive and defensive lines, who tend to be much larger
and heavier than other players; and other, which includes mostly defensive players who
are not linemen plus punters and kickers.
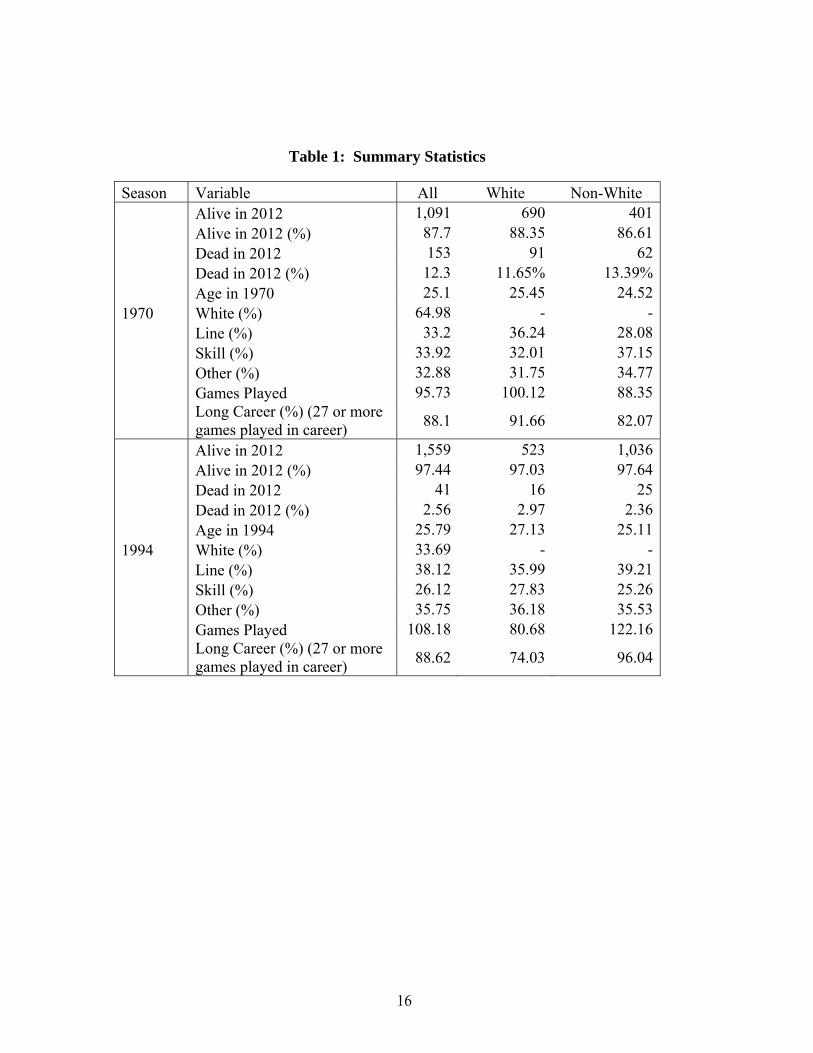
Table 1 lists summary statistics for the 1970 and 1994 seasons. There were 1244
total players who participated in the 1970 season and 1600 players in the 1994 season
with identifiable race data. Approximately two-thirds of the players who played in the
1970 season are white, but that statistic is reduced to approximately one-third by 1994.
Across both whites and non-whites, the percentage of players still alive is very similar.
This survival rate equality is not reflective of the survival rates of whites and non-
whites in the general population where non-whites have experienced significantly
higher mortality rates than whites. For both seasons, the average age is in the mid-
twenties at the relevant time. The split between positions is generally even in 1970,
with a shift towards line players and away from skill players in 1994. Players in 1994

7
participated in more games over their career than those in 1970, at least in part due to
the regular season being extended by two games. In 1970, whites played about a
season’s more worth of games over a career than non-whites, but in 1994 non-whites
played more than two-and-a-half more seasons than whites. This fact is also reflected
in the percentage of whites and non-whites that played at least two season’s worth of
games in 1970 compared to 1994.
3. Models
The following survival model is an adaptation of the one developed in Koning
and Amelink (2012) for Dutch soccer players. The idea is to compare the expected
survival of individuals based on the general population at the appropriate time to the
observed survival of NFL players. Let x be the age of an individual, t be the base
(or starting) year, and let s be the number of years after t. Also, let N (x, t) be the
number of individuals of age x alive at time t. Therefore, N (t), which is the number
of individuals (regardless of age) that are alive at time t is as follows.
, 1
Let (x, t, t + s) be the probability that an individual of age x at time t survives
to time t + s (or in other words, survives s years from time t). So, for example, an
individual survives one year from time t with a probability P (x, t, t + 1). As such, the
probability that an individual of age x at time t survives to time t + s can be represented
by the product of successive one-year probabilities.
, , , 1, 2

8
The expected number of individuals of age x alive at time t that are still alive
at t + s can be represented as follows.
N (x + s, t + s) = N (x, t) ∗ P (x, t, t + s) (3)
Using equation (1) above, the total number of individuals alive at time t that are
expected to be alive at time t + s is the following.
, 4
N (t + s), the expected number of individuals that survive to time t + s can
then be compared to the actual number of players that survive to time t + s to see if
these players experience different longevity than the general population of a similar
age composition.
This approach compares mortality between the population of NFL players, and
the US population in general. Besides that, we also examine whether observable risk
factors influence the individual risk of mortality within the population of NFL players.
To do so, we estimate a Cox proportional hazard model was also constructed to
determine factors that impact mortality with the following equation.
λ(t) = λ0(t) exp(β′x) (5)
The covariates used are games played, position played, and race. In this case,
the baseline hazard (λ0(t)) captures mortality among NFL players in general. In this
specification, we do not allow for time-varying covariates. That is, we only allow for
individual specific covariates. The relevant time scale is the age of the player, and we
allow for censored observation using the usual start/stop approach as in Therneau and
Grambsch (2000) and Fox (2002).

9
4. Results
The expected number of survivors, classified by age, based on population
probabilities of survival and the model above can be calculated in order to make a
comparison with the actual numbers of players (also classified by age) surviving.
Tables 2 and 3 list the comparisons overall and by race for 1970 and 1994. For the
1970 cohort for almost all ages, the actual number of NFL players still alive in 2013 is
statistically significantly higher than what is predicted by the population survival
model.2 In 1994, the actual numbers of players surviving by age is also generally
higher than expected, but the observed number of survivors is typically not statistically
significantly larger than the expected number of survivors. There are two possible
explanations for this result. First, most of the players from the 1994 cohort are still be
alive and therefore the statistical power of this test to uncover differences in survival
rates is lower than statistical tests for the 1970 cohort. Second, it is possible that the
increasing size, speed and strength of players in the modern game subjects more recent
players to higher long-term risks. Thus, the much higher survival rates of older NFL
veterans may not be replicated in more recent age groups. That being said, it is still
notable that the number of deaths in this cohort is below the number of deaths that
would be expected in the general population which goes against the popular notion that
this cohort had a particularly high mortality rate.
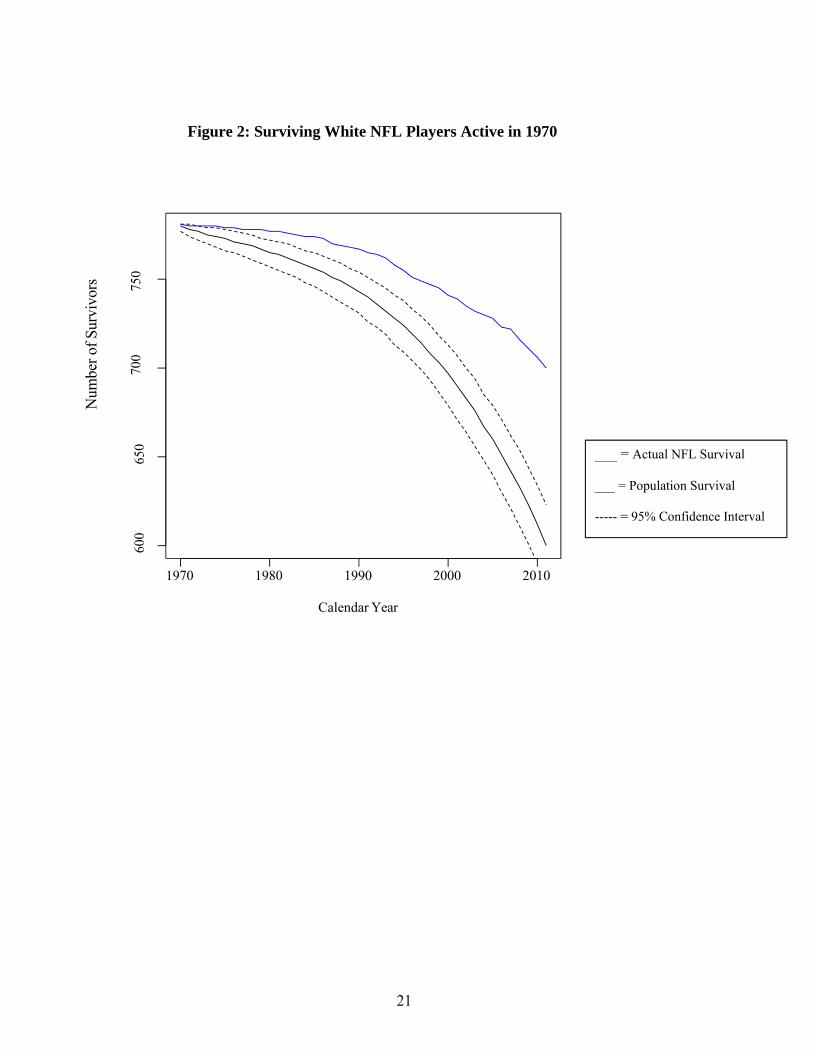
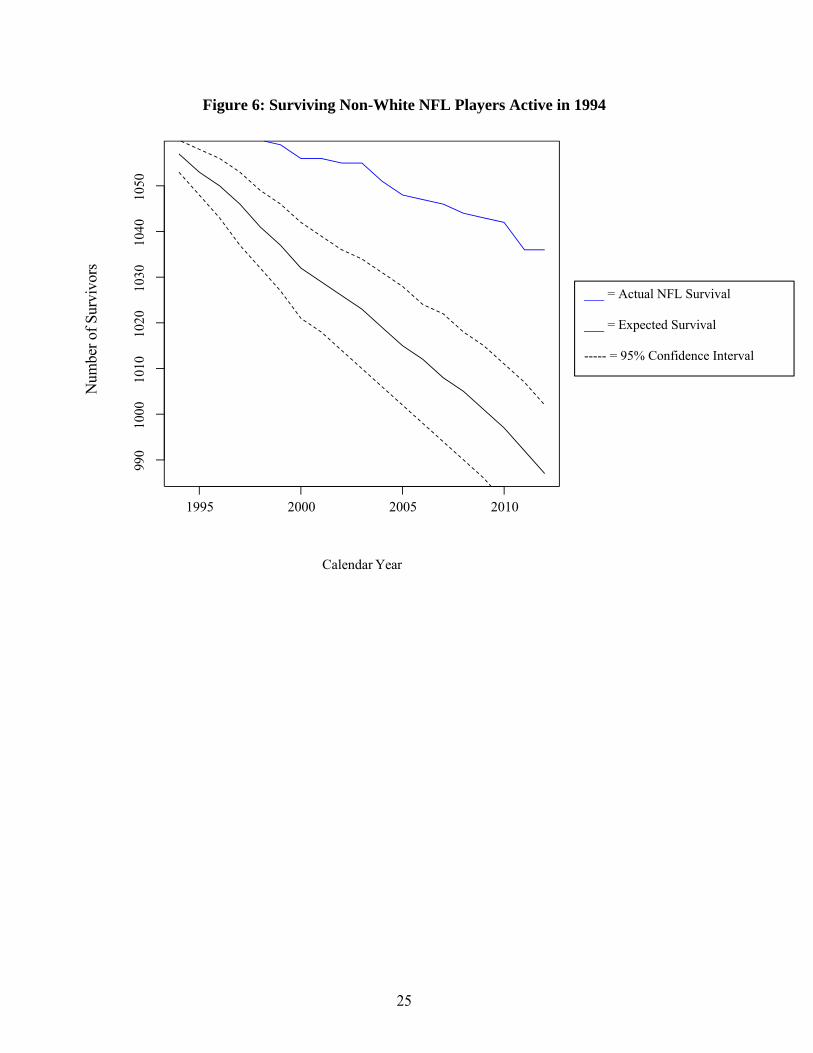
Figures 1 through 6 chart overall survival by year versus the number expected
to survive by year. For both the cohorts, the actual survival plot is above the expected
survival plot. In fact, the only time when the actual survival plot is even within the
95% confidence interval of survival is for whites that played in the 1994 season.
2 The level of significance is 5%.

10
Perhaps this reflects the unusual mortality of that particular season, but the confidence
interval is very wide due to the fact that one would not expect there to be many deaths
for such a young cohort.
Table 4 reports the results of the Cox hazard rate model. A negative coefficient
implies a lower hazard rate of death (compared to the baseline hazard), a positive
coefficient implies increased risk. In both seasons, the baseline hazard is that of non-
white line players with a career length in the bottom 10% of their respective cohort.
For both 1970 and 1994 this means career lengths of approximately two NFL seasons
or less. The results are quite striking in for the 1970 cohort. A white players have a
33% lower hazard rate than a non-white players.3 Skill position players and other
players have a 38% and 46% lower hazard rate, respectively, than the baseline. Both of
these results are in line with the findings of Baron and Rinsky (1994) who found that
defensive linemen and black players both experienced high rates of cardiovascular
disease. Of most interest, however, is that the players with more than 2 seasons of
experience have a striking 347% higher hazard rate than those players who played in
the NFL in 1970 but had only a short NFL career. Other specifications of games
played are also robust to this analysis.
The 1994 cohort produces substantially different results. White players no
longer exhibit lower mortality than non-white players. In addition, only skill position
players have a significantly different hazard rate than linemen. Here, skill position
players have an 81% lower hazard than the baseline, but other players are not
statistically significantly different. Players with short NFL careers no longer exhibit
lower mortality than players with longer careers. However, as discussed before, not
3 The percentage is calculated by subtracting the odds ratio from 1.

11
enough time has elapsed since that season to estimate effects with a high degree of
precision.
5. Conclusion
It has been popular recently, based on anecdotal evidence and very high
profile cases, to conclude that playing in the NFL may to higher mortality rates
than the general population. Using data on the actual survivability of NFL players
and comparing it to the expected population survival of individuals in a similar time
period, it seems that NFL players have higher survivability (lower mortality) rates than
the general population. However, there is evidence that mortality rates are higher for
line players, who may take more abuse or have different physical characteristics than
other players. There is also evidence that those players who play more than two
seasons worth of games also face higher mortality rates than other players. So
compared to the overall population, NFL players survive longer, but when compared
with their peers who do not play many games, those that play more do not survive as
long.
There are some limitations to this study. For example, a claim may be
made that the difference in expected versus actual survivability may be
overestimated due to the fact that players in the NFL may be healthier (they are
elite athletes, after all) or have better access to quality health care in general
(Andersen et al. (2000); Lee and Paffenbarger (2000)). Income differences could also
lead to differential health effects, and Weir et al. (2009) show that NFL player
earnings are substantially higher than that of the general population. If it can be
assumed, however, that players with longer careers have similar general background

12
characteristics (such as innate health, life circumstances, etc.) as those without career
longevity, then this study provides clear evidence that the rigors of the NFL may
actually shorten life expectancy, but not to an extent that NFL players have a higher
mortality rate than the general population.
We have also not touched on any specific ailments or any injury history (such as
concussions), which could cause quality of life issues that differ from the general
population. This issue is often conflated with mortality, but may be even more
important and elucidating. In terms of purely examining life expectancy, however, our
results suggest that this is another example of confirmation bias in the NFL, where a
presupposition is backed by strong anecdotal evidence but no statistical backing
(Bursik, 2012).
However, the NFL has some cause to be alarmed by the line players and games
played result above. If certain types if players die faster than others, this could cut into
the future pipeline of these types of players. Also, a general public distaste of knowing
that a source of entertainment may actually shorten lives of those who participate in it
the most may hurt interest in the NFL in the long term.

13
References
Andersen, L. B., Schnohr, P. Schroll, M., and Hein, H. O. (2000). All-Cause
Mortality Associated With Physical Activity During Leisure Time, Work,
Sports, and Cycling To Work. Archives of internal medicine, 160(11):1621.
Baron, S. and Rinsky, R. (1994). NIOSH Mortality Study of NFL Football Players:
1959-1988. Cincinnati, OH: Centers for Disease Control, National Institute for
Occupational Safety and Health, pp. 88–085.
Bursik, P. B. (2012). Behavioral Economics in the NFL. In The Economics of the
National Football League. pp. 259–276. Springer.
Cantu, R. C. (2007). Chronic Traumatic Encephalopathy in the National Football
League. Neurosurgery, 61(2):223–225.
Donnelly, P. (1988). On boxing: notes on the past, present and future of a sport in
transition. Current Psychology, 7(4), 331-346.
Fainaru, S. and Fainaru-Wada, M. (2013) Youth Football Participation Drops
http://espn.go.com/espn/otl/story/_/page/popwarner/pop-warner-youth-football-
participation-drops-nfl-concussion-crisis-seen-causal-factor,
Posted November 13th, 2013
Farrar, Doug. (2014). Judge Anita Brody denies preliminary approval for NFL
concussion settlement. http://nfl.si.com/2014/01/14/nfl-concussion-lawsuit-
settlement-2/, posted January 14, 2014.
Fox, J. (2002). "Cox Proportional-Hazards Regression for Survival Data." An R and S-
PLUS Companion to Applied Regression, pp. 1-18.
Culhane, J. G. (2012). Not Just the NFL: Compensation, Litigation, and Public
Health in Concussion Cases. FIU Law Review, 8:5–217.

14
Koning, R. H. and Amelink, R. (2012). Medium-Term Mortality of Dutch Professional
Soccer Players. The Economic and Labour Relations Review, 23(2):55–68.
Lee, I.-M. and Paffenbarger, R. S. (2000). Associations of Light, Moderate, and
Vigorous Intensity Physical Activity with Longevity: The Harvard Alumni
Health Study. American Journal of Epidemiology, 151(3):293–299.
Lehman, E. J., Hein, M. J., Baron, S. L., and Gersic, C. M. (2012).
Neurodegenerative Causes of Death Among Retired National Football League
Players. Neurology, 79(19):1970–1974.
McKee, A.C., Stein, T.D., Nowinski, C.J., Stern, R.A., Daneshvar, D.H., Alvarez,
V.E., Lee, H.-S., Hall, G., Wojtowicz, S.M., Baugh, C.M., et al. (2013). The
Spectrum of Disease in Chronic Traumatic Encephalopathy. Brain, 136(1):43–
64.
Mecham, McKoye (2013). Paul Oliver: Latest in a string of NFL suicides.
http://fox13now.com/2013/09/26/paul-oliver-latest-in-a-string-of-nfl-suicides/,
Posted September 26, 2013.
Reilly, R. (2013). Football Getting Harder to Watch.
http://espn.go.com/nfl/story/_/id/9932209/nfl-becoming-guilty-pleasure, Posted
November 6, 2013.
Rukovets, O. (2013). Former NFL Player Junior Seau Had CTE. Neurology Today.
Schmalzbauer, A. (2004). The History of the San Diego Chargers. The Creative
Company.
Smith, Stephanie (2013). NFL and ex-players reach deal in concussion lawsuit.
http://www.cnn.com/2013/08/29/health/nfl-concussion-settlement/ , posted August
30, 2013.

15
Therneau, T. M., & Grambsch, P. M. (2000). Modeling survival data: extending the Cox
Model. Springer-Verlag. New York.
Weir, D. R., Jackson, J. S., and Sonnega, A. (2009). National Football League Player
Care Foundation Study of Retired NFL Players. Ann Arbor: University of
Michigan Institute for Social Research.
16
Table 1: Summary Statistics
Season Variable All White Non-White Alive in 2012 1,091 690 401
Alive in 2012 (%) 87.7 88.35 86.61 Dead in 2012 153 91 62 Dead in 2012 (%) 12.3 11.65% 13.39% Age in 1970 25.1 25.45 24.52 1970 White (%) 64.98 - - Line (%) 33.2 36.24 28.08 Skill (%) 33.92 32.01 37.15 Other (%) 32.88 31.75 34.77 Games Played 95.73 100.12 88.35
Long Career (%) (27 or more games played in career)
88.1 91.66 82.07
Alive in 2012 1,559 523 1,036 Alive in 2012 (%) 97.44 97.03 97.64 Dead in 2012 41 16 25 Dead in 2012 (%) 2.56 2.97 2.36 Age in 1994 25.79 27.13 25.11 1994 White (%) 33.69 - - Line (%) 38.12 35.99 39.21 Skill (%) 26.12 27.83 25.26 Other (%) 35.75 36.18 35.53 Games Played 108.18 80.68 122.16
Long Career (%) (27 or more games played in career)
88.62 74.03 96.04

Table 2: Actual Survival and Expected Survival (1970 Season)
All White Non-White
Age Number Alive Expected Alive P-value Number Alive Expected Alive P-value Number Alive Expected Alive P-value
21 116 107 94.97 0.00 64 60 53.41 0.03 38 34 25.46 0.00
22 186 176 150.28 0.00 110 107 90.65 0.00 71 64 46.42 0.00
23 168 156 133.71 0.00 94 87 76.36 0.00 67 62 42.67 0.00
24 150 126 117.35 0.09 90 81 71.92 0.02 53 39 32.82 0.09
25 154 137 118.18 0.00 97 85 76.09 0.03 52 48 31.23 0.00
26 100 89 75.11 0.00 64 58 49.18 0.01 35 30 20.35 0.00
27 104 87 76.29 0.02 64 54 48.07 0.11 37 30 20.79 0.00
28 75 63 53.61 0.01 56 46 41.02 0.17 19 17 10.29 0.00
29 60 50 41.68 0.02 43 35 30.63 0.18 16 14 8.34 0.00 30 47 34 31.62 0.54 28 22 19.33 0.31 19 12 9.48 0.26 31 32 29 20.76 0.00 24 22 16.00 0.01 7 6 3.33 0.06 32 18 12 11.21 0.81 15 10 9.61 1.00 3 2 1.35 0.59 33 14 10 8.33 0.43 13 9 7.96 0.78 1 1 0.43 0.43 34 10 9 5.66 0.05 9 8 5.24 0.09 1 1 0.40 0.40 35 4 4 2.14 0.13 4 4 2.20 0.13 - - - - 36 4 1 2.01 0.37 4 1 2.07 0.36 - - - - 38 1 1 0.44 0.44 1 1 0.45 0.45 - - - - 42 1 0 0.30 1.00 1 0 0.31 1.00 - - - -

Table 3: Actual Survival and Expected Survival (1994 Season)
All White Non-White
Age Number Alive Expected Alive P-value Number Alive Expected Alive P-value Number Alive Expected Alive P-value
19 1 1 0.97 1.00 1 1 0.97 1.00 - - - -
20 7 7 6.79 1.00 - - - - 7 7 6.62 1.00
21 66 66 63.97 0.27 14 14 13.61 1.00 52 52 49.09 0.12
22 163 163 157.78 0.01 37 37 35.93 0.63 126 126 118.68 0.00
23 255 249 246.46 0.49 62 61 60.12 1.00 193 188 181.28 0.05
24 202 195 194.85 1.00 43 42 41.62 1.00 159 153 148.88 0.25
25 175 170 168.41 0.69 49 48 47.32 1.00 126 122 117.54 0.15
26 154 149 147.79 0.84 48 44 46.23 0.10 106 105 98.45 0.01
27 135 130 129.16 1.00 44 43 42.26 1.00 91 87 84.10 0.32 28 116 113 110.62 0.38 50 47 47.88 0.47 66 66 60.66 0.01 29 87 87 82.68 0.02 48 48 45.82 0.17 39 39 35.62 0.05 30 58 57 54.92 0.37 32 31 30.44 1.00 26 26 23.59 0.17 31 70 68 66.02 0.44 45 44 42.66 0.73 25 24 22.50 0.51 32 44 41 41.31 0.75 20 19 18.88 1.00 24 22 21.41 1.00 33 30 28 28.03 1.00 18 17 16.92 1.00 12 11 10.60 1.00 34 14 12 13.01 0.26 9 8 8.42 0.45 5 4 4.37 0.49 35 7 7 6.47 1.00 6 6 5.59 1.00 1 1 0.86 1.00 36 4 4 3.67 1.00 4 4 3.70 1.00 - - - 37 9 9 8.22 1.00 7 7 6.44 1.00 2 2 1.68 1.00 38 1 1 0.91 1.00 1 1 0.92 1.00 - - - 39 2 2 1.80 1.00 1 1 0.91 1.00 1 1 0.82 1.00

19
Table 4: Cox regression results
1970 Season 1994 Season Race Coeff. Odds Ratio P-Value Coeff. Odds Ratio P-Value White -0.40 0.67 0.02 0.03 1.03 0.93 Skill -0.48 0.62 0.00 -1.65 0.19 0.01 Other -0.63 0.54 0.01 -0.34 0.71 0.30 Long career 1.50 4.47 0.01 -0.30 0.74 0.60

20
Num
ber o
f Sur
vivo
rs
900
950
1000
10
50
1100
11
50
1200
12
50
Figure 1: Surviving NFL Players Active in 1970
1970 1980 1990 2000 2010
Calendar Year
___ = Actual NFL Survival
___ = Population Survival
----- = 95% Confidence Interval
21
600
650
700
750
Num
ber o
f Sur
vivo
rs
Figure 2: Surviving White NFL Players Active in 1970
1970 1980 1990 2000 2010
Calendar Year
___ = Actual NFL Survival
___ = Population Survival
----- = 95% Confidence Interval

22
250
300
350
400
Num
ber o
f Sur
vivo
rs
Figure 3: Surviving Non-White NFL Players Active in 1970
1970 1980 1990 2000 2010
Calendar Year
___ = Actual NFL Survival
___ = Expected Survival
----- = 95% Confidence Interval

23
1500
15
20
1540
15
60
1580
16
00
Num
ber o
f Sur
vivo
rs
Figure 4: Surviving NFL Players Active in 1994
1995 2000 2005 2010
Calendar Year
___ = Actual NFL Survival
___ = Expected Survival
----- = 95% Confidence Interval

24
520
525
530
535
Num
ber o
f Sur
vivo
rs
Figure 5: Surviving White NFL Players Active in 1994
1995 2000 2005 2010
Calendar Year
___ = Actual NFL Survival
___ = Expected Survival
----- = 95% Confidence Interval
25
990
1000
10
10
1020
10
30
1040
10
50
Num
ber o
f Sur
vivo
rs
Figure 6: Surviving Non-White NFL Players Active in 1994
1995 2000 2005 2010
Calendar Year
___ = Actual NFL Survival
___ = Expected Survival
----- = 95% Confidence Interval