the master budget copyrighted material · cash budget the cash budget, shown in figure 1.8, offers...
TRANSCRIPT

P1: a/b P2: c/d QC: e/f T1: g
c01 JWBT172-Proctor September 14, 2009 14:44 Printer: Yet to Come
PART
OneThe Master Budget
1
COPYRIG
HTED M
ATERIAL

P1: a/b P2: c/d QC: e/f T1: g
c01 JWBT172-Proctor September 14, 2009 14:44 Printer: Yet to Come
2

P1: a/b P2: c/d QC: e/f T1: g
c01 JWBT172-Proctor September 14, 2009 14:44 Printer: Yet to Come
CHAPTER 1Overview of Budgetsand Financial Models
BUDGETS
The Cambridge Dictionary defines a budget as “a plan to show how muchmoney a person or organization will earn and how much they will need or beable to spend.” Businesses use several different types of budgets to managetheir operations. Whatever form various budgets may take, the primary goalof all budgets is to provide a tangible and quantifiable estimate of the receiptand allocation of resources. In the context of this book, a budget representsa core element of a financial model; financial models are discussed later inthe chapter.
Businesses use several types of budgets for planning purposes. Thesebudgets are typically categorized by the timeframe that they cover. A “long-range plan,” one type of budget, typically forecasts financial statements out5 to 10 years into the future. Long-range plans usually evolve from “strategicplans,” which define the overall mission and goals for a business. These long-range plans are coordinated with Capital Budgets, which map out large mon-etary commitments for things such as facilities and large pieces of equipment.
From a budgeting perspective, this book is focused on the “MasterBudget,” which forecasts a business’s complete operations over the medium-term (1–5 years). The Master Budget consists of many interrelated financialand operating schedules, including sales, purchases, and operating expenses,among many others. While some of the key outputs of a Master Budget arethe consolidated financial statements (Balance Sheet, Income Statement, andStatement of Cash Flows), a vast array of supporting schedules are also partof the Master Budget. Figure 1.1 outlines the various components of theMaster Budget.
As Figure 1.1 indicates, there are two key components of the MasterBudget: the Operating Budget and the Financial Budget.
3

P1: a/b P2: c/d QC: e/f T1: g
c01 JWBT172-Proctor September 14, 2009 14:44 Printer: Yet to Come
4 THE MASTER BUDGET
F IGURE 1.1 Components of the Master Budget
Operat ing Budget
The Operating Budget focuses on the Budgeted Income Statement and itssupporting components and schedules—these items are described below.
Sales and Col lect ions Budget The Sales and Collections Budget representsone of the first steps in the budgeting process, as items such as inventorylevels and operating expenses are driven off of the Sales and CollectionsBudget. Effective sales budgeting is a key factor in building a useful andrepresentative financial model for a business. Regardless of the nature ofyour business (for example, whether it is product- or service-based), thisbook takes a unit-based approach in which forecast sales are based on(1) projected unit sales and (2) projected unit prices. This topic is covered indetail later in the book.
P1: a/b P2: c/d QC: e/f T1: g
c01 JWBT172-Proctor September 14, 2009 14:44 Printer: Yet to Come
Overview of Budgets and Financial Models 5
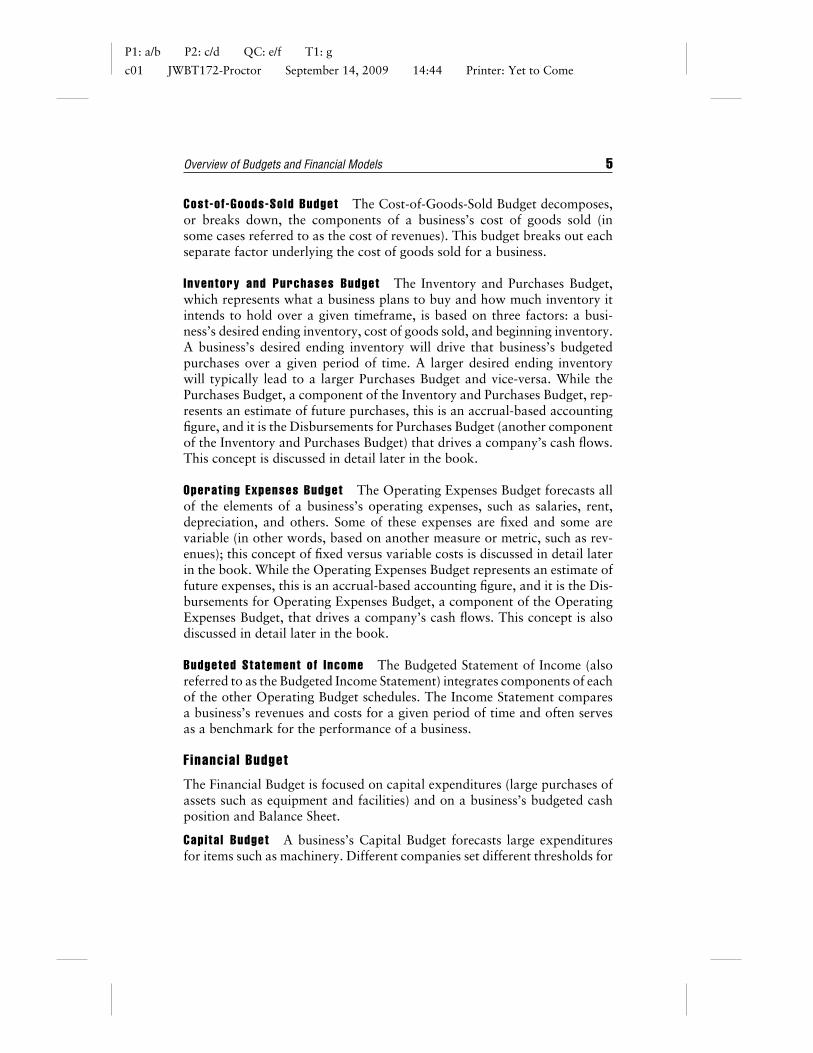
Cost-of -Goods-Sold Budget The Cost-of-Goods-Sold Budget decomposes,or breaks down, the components of a business’s cost of goods sold (insome cases referred to as the cost of revenues). This budget breaks out eachseparate factor underlying the cost of goods sold for a business.
Inventory and Purchases Budget The Inventory and Purchases Budget,which represents what a business plans to buy and how much inventory itintends to hold over a given timeframe, is based on three factors: a busi-ness’s desired ending inventory, cost of goods sold, and beginning inventory.A business’s desired ending inventory will drive that business’s budgetedpurchases over a given period of time. A larger desired ending inventorywill typically lead to a larger Purchases Budget and vice-versa. While thePurchases Budget, a component of the Inventory and Purchases Budget, rep-resents an estimate of future purchases, this is an accrual-based accountingfigure, and it is the Disbursements for Purchases Budget (another componentof the Inventory and Purchases Budget) that drives a company’s cash flows.This concept is discussed in detail later in the book.
Operat ing Expenses Budget The Operating Expenses Budget forecasts allof the elements of a business’s operating expenses, such as salaries, rent,depreciation, and others. Some of these expenses are fixed and some arevariable (in other words, based on another measure or metric, such as rev-enues); this concept of fixed versus variable costs is discussed in detail laterin the book. While the Operating Expenses Budget represents an estimate offuture expenses, this is an accrual-based accounting figure, and it is the Dis-bursements for Operating Expenses Budget, a component of the OperatingExpenses Budget, that drives a company’s cash flows. This concept is alsodiscussed in detail later in the book.
Budgeted Statement of Income The Budgeted Statement of Income (alsoreferred to as the Budgeted Income Statement) integrates components of eachof the other Operating Budget schedules. The Income Statement comparesa business’s revenues and costs for a given period of time and often servesas a benchmark for the performance of a business.
F inancia l Budget
The Financial Budget is focused on capital expenditures (large purchases ofassets such as equipment and facilities) and on a business’s budgeted cashposition and Balance Sheet.
Capita l Budget A business’s Capital Budget forecasts large expendituresfor items such as machinery. Different companies set different thresholds for
P1: a/b P2: c/d QC: e/f T1: g
c01 JWBT172-Proctor September 14, 2009 14:44 Printer: Yet to Come
6 THE MASTER BUDGET
what qualifies as a capital expenditure (versus an expense). If the purchase ofan item (such as a piece of machinery) is classified as a capital expenditure, itis then depreciated (or amortized in some cases) over a predetermined periodof time. The Capital Budget covers Capital Expenditures, Disbursements forCapital Expenditures, and Depreciation Budgets.
Cash Budget The Cash Budget tracks a business’s anticipated cash receiptsand disbursements. This is a very detailed and important schedule that drawson information in the Operating Budget.
Budgeted Balance Sheet The Budgeted Balance Sheet represents the finalstep in building the Master Budget as outlined in Figure 1.1. The budgetedBalance Sheet integrates components from both the Operating and the Fi-nancial Budgets.
F INANCIAL MODELS
A financial model is a quantitative representation of a company’s past,present, and future business operations. This quantitative representationis expressed through the use of accounting—the language of business. Fi-nance, which may be broadly defined as the science of managing money andother assets, is based on accounting. As such, it is important to recognize thecentral role accounting, or the enumeration of business transactions, playsin building financial models. While this book does not cover or addressaccounting concepts in any level of detail, it is worth noting that the consol-idated financial statements (Balance Sheet, Income Statement, and Statementof Cash Flows) represent the product of a series of accounting transactions.
A financial model is a required component of nearly any business plan.Anyone interested in starting a new business, starting a new line of businesswithin an existing company, assessing the operations of an existing or pro-posed business, and/or comparing the operations of two or more businesses,among other tasks, should know how to build, use, and modify a financialmodel.
While there are a variety of approaches to building financial models,this book will focus on the inclusion of the following sections in a financialmodel: (1) a Master Budget (which is made up of an Operating Budgetand a Financial Budget), (2) the consolidated financial statements (BalanceSheet, Income Statement, and Statement of Cash Flows), (3) a free cash flowanalysis, (4) a sensitivity analysis of the model’s outputs versus inputs, (5) acontribution margin analysis, (6) a financial ratios analysis, (7) a valuationanalysis, and (8) a capitalization chart.

P1: a/b P2: c/d QC: e/f T1: g
c01 JWBT172-Proctor September 14, 2009 14:44 Printer: Yet to Come
Overview of Budgets and Financial Models 7
For the sake of illustration, sample templates for each of these sectionsare shown below. Please note that no numbers/values have been insertedinto these templates—over the course of this book, I will walk through theprocess of filling in all of these templates one step at a time.
A financial model integrates all of the components of a Master Budgetinto a working model of a company’s planned financial activities for a giventime period. As this represents a significant amount of information, thecomponents of a financial model are presented in several figures.
As discussed earlier, the components of the Master Budget are brokeninto the two primary budgets—the Operating Budget and the FinancialBudget. Please note that the areas shaded in gray in the screenshots representthe areas in which I will fill in values to build a financial model over thecourse of this book. These figures are presented as a road map for the nextseveral chapters of the book.
Master Budget—Operat ing Budget
The following figures represent components of the Operating Budget. Notethe following convention used throughout the book for time periods: “1QX4” is to be interpreted as “the first quarter of a year ending in the number4.” The use of “X4” for a year is a common practice in accounting andfinance—it is meant to refer to a specific year without referring to an exacttime period such as “94” or “04.” I also use the following conventionthroughout the book: “X4” is to be interpreted as “the year X4.” Again,this is meant to refer to a particular year without referring to an exact timeperiod.
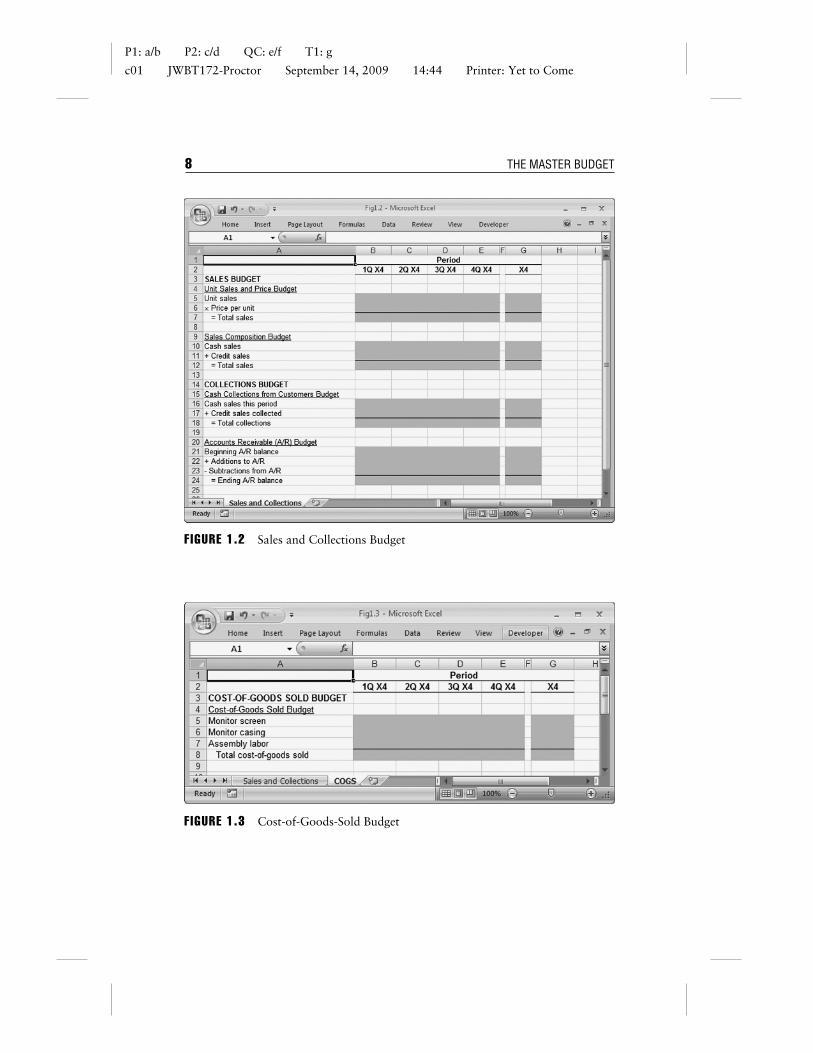
Sales and Col lect ions Budget The Sales and Collections Budget, shown inFigure 1.2, consists of a Sales Budget and a Collections Budget.
Cost-of -Goods-Sold Budget The Cost-of-Goods-Sold Budget, shown inFigure 1.3, breaks out each component of a business’s cost of goods sold.
Inventory and Purchases Budget The Inventory and Purchases Budget,shown in Figure 1.4, consists of an Inventory Budget and a Purchases Budget.
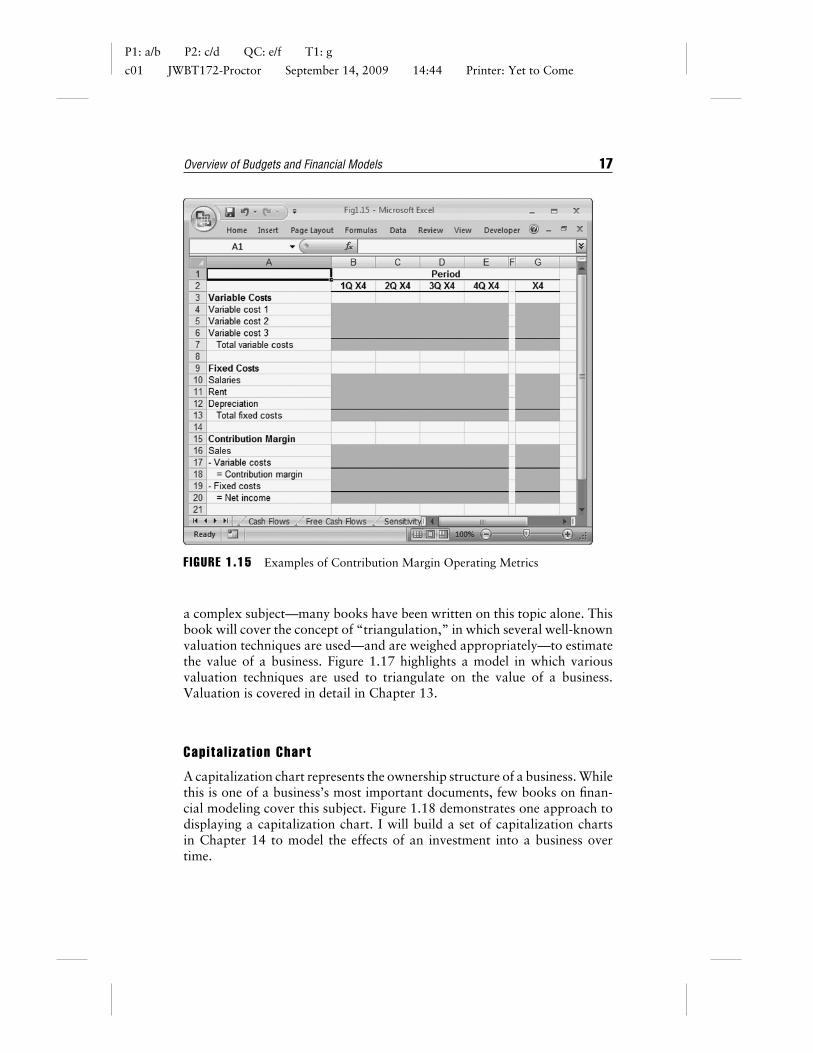
Operat ing Expenses Budget The Operating Expenses Budget, shown inFigure 1.5, consists of an Operating Expenses Budget and a Disbursementsfor Operating Expenses Budget.
Budgeted Statement of Income The Budgeted Statement of Income, shownin Figure 1.6, compares a business’s revenues and expenses.
P1: a/b P2: c/d QC: e/f T1: g
c01 JWBT172-Proctor September 14, 2009 14:44 Printer: Yet to Come
8 THE MASTER BUDGET
F IGURE 1.2 Sales and Collections Budget
F IGURE 1.3 Cost-of-Goods-Sold Budget

P1: a/b P2: c/d QC: e/f T1: g
c01 JWBT172-Proctor September 14, 2009 14:44 Printer: Yet to Come
Overview of Budgets and Financial Models 9
FIGURE 1.4 Inventory and Purchases Budget
F IGURE 1.5 Operating Expenses Budget

P1: a/b P2: c/d QC: e/f T1: g
c01 JWBT172-Proctor September 14, 2009 14:44 Printer: Yet to Come
10 THE MASTER BUDGET
F IGURE 1.6 Budgeted Statement of Income
Master Budget—Financia l Budget
The following figures represent components of the Financial Budget.
Capita l Budget The Capital Budget, shown in Figure 1.7, consists of threecomponents: the Capital Expenditures Budget, the Disbursements for Capi-tal Expenditures Budget, and the Depreciation Budget.
Cash Budget The Cash Budget, shown in Figure 1.8, offers a detailedreconciliation of a business’s beginning and ending cash balances for a givenperiod of time.
Budgeted Balance Sheet The Budgeted Balance Sheet, shown in Figure1.9, compares a business’s Assets, Liabilities, and Owners’ Equity.
Addit ional Components of a Master Budget
A working financial model should include several additional schedules be-yond those presented in Figures 1.2 through 1.9. These schedules include an

P1: a/b P2: c/d QC: e/f T1: g
c01 JWBT172-Proctor September 14, 2009 14:44 Printer: Yet to Come
Overview of Budgets and Financial Models 11
FIGURE 1.7 Capital Budget
F IGURE 1.8 Cash Budget

P1: a/b P2: c/d QC: e/f T1: g
c01 JWBT172-Proctor September 14, 2009 14:44 Printer: Yet to Come
12 THE MASTER BUDGET
F IGURE 1.9 Budgeted Balance Sheet
Assumptions and Dashboard worksheet and Headcount worksheets, amongothers.
Consol idated F inancia l Statements
The consolidated financial statements consist of the Balance Sheet, the In-come Statement, and the Statement of Cash Flows. Publicly traded com-panies are required to report these statements to the SEC (U.S. Securitiesand Exchange Commission) on a regular basis, so many readers may befamiliar with each of these statements. Templates for each of these financialstatements are provided below.
Balance Sheet A Balance Sheet, shown in Figure 1.10, offers a view of abusiness’s financial position in terms of its Assets, Liabilities, and Owners’Equity.

P1: a/b P2: c/d QC: e/f T1: g
c01 JWBT172-Proctor September 14, 2009 14:44 Printer: Yet to Come
Overview of Budgets and Financial Models 13
FIGURE 1.10 Balance Sheet
Income Statement An Income Statement, shown in Figure 1.11, presentsa summary of a business’s results of operations in terms of its revenues andexpenses.
Statement of Cash F lows A Statement of Cash Flows, shown in Figure1.12, reconciles a business’s net income to its change in cash position overa given time period in terms of Cash Flows from Operating Activities, CashFlows from Investing Activities, and Cash Flows from Financing Activities.
Free Cash F low Analysis
The concept of free cash flows is central to modern finance. Broadly speak-ing, free cash flows represent the amount of cash a business generates (or,in some cases, consumes) over a given timeframe after paying all of its“required” costs for that period. I will discuss free cash flows in Chapter 9,but technically speaking, free cash flows represent the cash available to all

P1: a/b P2: c/d QC: e/f T1: g
c01 JWBT172-Proctor September 14, 2009 14:44 Printer: Yet to Come
14 THE MASTER BUDGET
F IGURE 1.11 Income Statement
F IGURE 1.12 Statement of Cash Flows

P1: a/b P2: c/d QC: e/f T1: g
c01 JWBT172-Proctor September 14, 2009 14:44 Printer: Yet to Come
Overview of Budgets and Financial Models 15
FIGURE 1.13 Free Cash Flows Worksheet
providers of capital (providers of both debt and equity) after all “required”expenses have been paid. Figure 1.13 presents a view of the free cash flowsworksheet. All of the terms in this worksheet will be explained and discussedin Chapter 9.
Sensit iv i ty Analys is
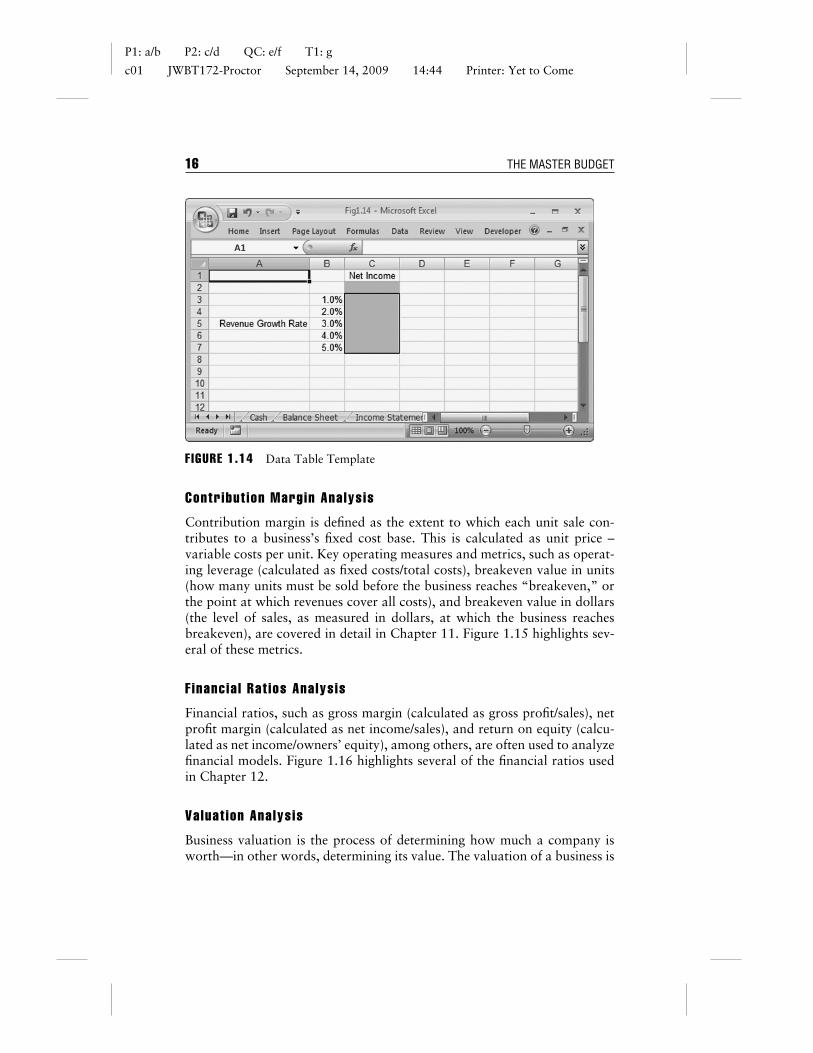
Sensitivity analyses are used to model the effect of changing input variableson some output of interest, such as net income or free cash flows. It is oftenhelpful to build a series of sensitivity analyses to get a sense for what inputvariables will have a significant influence on your output measure or metricof interest (for example, net income). Figure 1.14 shows a data table templatethat could be used to test the effect of varying the assumed growth rate inrevenues on net income. Chapter 10 is devoted entirely to the coverage ofsensitivity analyses.
P1: a/b P2: c/d QC: e/f T1: g
c01 JWBT172-Proctor September 14, 2009 14:44 Printer: Yet to Come
16 THE MASTER BUDGET
F IGURE 1.14 Data Table Template
Contr ibut ion Margin Analys is
Contribution margin is defined as the extent to which each unit sale con-tributes to a business’s fixed cost base. This is calculated as unit price –variable costs per unit. Key operating measures and metrics, such as operat-ing leverage (calculated as fixed costs/total costs), breakeven value in units(how many units must be sold before the business reaches “breakeven,” orthe point at which revenues cover all costs), and breakeven value in dollars(the level of sales, as measured in dollars, at which the business reachesbreakeven), are covered in detail in Chapter 11. Figure 1.15 highlights sev-eral of these metrics.
F inancia l Rat ios Analys is
Financial ratios, such as gross margin (calculated as gross profit/sales), netprofit margin (calculated as net income/sales), and return on equity (calcu-lated as net income/owners’ equity), among others, are often used to analyzefinancial models. Figure 1.16 highlights several of the financial ratios usedin Chapter 12.
Valuat ion Analys is
Business valuation is the process of determining how much a company isworth—in other words, determining its value. The valuation of a business is
P1: a/b P2: c/d QC: e/f T1: g
c01 JWBT172-Proctor September 14, 2009 14:44 Printer: Yet to Come
Overview of Budgets and Financial Models 17
FIGURE 1.15 Examples of Contribution Margin Operating Metrics
a complex subject—many books have been written on this topic alone. Thisbook will cover the concept of “triangulation,” in which several well-knownvaluation techniques are used—and are weighed appropriately—to estimatethe value of a business. Figure 1.17 highlights a model in which variousvaluation techniques are used to triangulate on the value of a business.Valuation is covered in detail in Chapter 13.
Capita l i zat ion Chart
A capitalization chart represents the ownership structure of a business. Whilethis is one of a business’s most important documents, few books on finan-cial modeling cover this subject. Figure 1.18 demonstrates one approach todisplaying a capitalization chart. I will build a set of capitalization chartsin Chapter 14 to model the effects of an investment into a business overtime.

P1: a/b P2: c/d QC: e/f T1: g
c01 JWBT172-Proctor September 14, 2009 14:44 Printer: Yet to Come
18 THE MASTER BUDGET
F IGURE 1.16 Financial Ratios Examples
F IGURE 1.17 Valuation Model Example

P1: a/b P2: c/d QC: e/f T1: g
c01 JWBT172-Proctor September 14, 2009 14:44 Printer: Yet to Come
Overview of Budgets and Financial Models 19
FIGURE 1.18 Capitalization Chart
QUESTIONS
1. What is the main goal of all budgets?2. What are the two main components of a Master Budget?3. What is a financial model?4. What are the names of the three components of standard consolidated
financial statements?5. What do free cash flows represent for a business?6. Why should a business use a sensitivity analysis? A contribution margin
analysis? A financial ratios analysis?7. What is valuation?8. What is a capitalization chart?