the mobility-productivity paradox - vtpi.org · the mobility-productivity paradox victoria...
TRANSCRIPT
www.vtpi.org
250-360-1560
The Mobility-Productivity Paradox
Exploring The Negative Relationships Between
Mobility and Economic Productivity 12 March 2014
By Todd Litman
Victoria Transport Policy Institute
Email: [email protected]
Phone: 250-360-1560
For presentation at
I-TED 2014
International Transportation Economic Development Conference
Paper 14
Abstract This paper explores a paradox: negative correlations between indicators of mobility (such
as VMT) and productivity (such as GDP), and positive correlations between mobility
constraints (higher road use prices or traffic congestion) and productivity. These
relationships contradict common assumptions that policies and projects that increase
vehicle travel (roadway expansions and lower road user prices) increase productivity and
support economic development. This paradox can be explained by the following: First,
motor vehicle travel is just one of many factors affecting overall accessibility, and
planning decisions often involve trade-offs between mobility and other accessibility
factors such as the quality of other modes and land use accessibility. Second, many
policies that increase mobility violate efficient market principles, which tends to reduce
productivity. Third, motor vehicle travel is resource intensive, so increases in such travel
increase various costs, including costs borne by industry. Fourth, increased vehicle travel
increases the portion of household budgets devoted to vehicles and fuel, expenditures that
generate low regional employment and business activity. This paper examines these
issues, describes empirical evidence of these impacts, and discusses their implications.
Key Word Economic development, Productivity, Economic Efficiency, Transport Policy
The Mobility-Productivity Paradox Victoria Transport Policy Institute
2
Introduction Many current policies and planning practices reflect the assumption that constraints on
motor vehicle travel (traffic congestion, high fuel prices, road tolls, etc.) reduce economic
productivity, and policies which increase vehicle travel (roadway expansions, low road
user fees, etc.) increase productivity and support economic development.
However, there are reasons to question those assumptions. Certainly, motor vehicle travel
is an important input in most economic activities: it delivers raw materials to producers,
goods to markets, employees to work, students to schools, and customers to markets. All
else being equal, an increase in transport system efficiency should increase productivity.
Increased transportation efficiency has contributed significantly to past economic
productivity gains. But motor vehicle travel also imposes significant costs. Evidence
described in this paper indicates that in regions with high levels of mobility, a significant
portion of vehicle travel is economically inefficient: vehicle travel that consumers would
forego if they had better options and more efficient pricing, which increases total
transportation costs, including costs to businesses. In such circumstances, policies that
reduce vehicle travel can increase productivity and support economic development.
This paper explores this paradox. It discusses ways that accessibility and mobility affect
economic productivity, examines evidence of the relationships between mobility and
economic productivity, and discusses their implications.
How Accessibility and Mobility Affects Productivity This section discusses various ways that mobility affects economic productivity.
Access to Productive Activities
Conventional planning tends to evaluate transport system performance based primarily on
mobility, using indicators of vehicle travel speed and delay such as roadway level-of-
service and average traffic speed. However, mobility is seldom an end in itself, the
ultimate goal of most transportation is access to services and activities (retails,
employment, education, recreation, etc.). Several factors affect accessibility (1, 2):
Motor vehicle travel.
The quality of other modes (walking, cycling, ridesharing, public transport, etc.),
including mobility substitutes such as telecommunications and delivery services.
Transport network connectivity (the quality of connections between paths, roads, and
different modes).
Land use accessibility, which is affected by development density and mix.
Planning decisions often involve trade-offs between these. For example, expanding urban
roadways tends to improve automobile access but creates a barrier that reduces pedestrian
and bicycle access, and therefore public transit access since most transit trips include
walking and cycling links. Similarly, urban fringe locations that are easy to access by
automobile tend to be difficult to access by other modes. As a result, the benefits of
increased mobility are often partly offset by declines in other forms of access, reducing
The Mobility-Productivity Paradox Victoria Transport Policy Institute
3
net efficiency gains. A newer planning paradigm evaluates transport system performance
based on overall accessibility, not just mobility (3, 4). Recent research improves our
understanding of how land use factors affect accessibility:
Kuzmyak found that travelers in more compact neighborhoods experience less congestion
than in more sprawled, suburban neighborhoods due to better travel options, more
connected streets, and shorter trip distances (5).
Levine, et al. found that changes in development density affect the number of jobs and
services available within a given travel time about ten times more than proportional
changes in traffic speed (6).
A study that measured the number of jobs accessible by automobile within certain time
periods for the 51 largest US metropolitan areas found that the five cities with the most
intense congestion (highest Travel Time Index ratings) are among the best for automobile
employment access because their lower traffic speeds are more than offset by higher
employment densities which reduce commute distances (7).
Cortright found that roadway expansions that stimulate sprawl can increase total travel
times because higher traffic speeds are more than offset by longer travel distances (8).
These studies indicate that transport system changes intended to increase vehicle traffic
speeds often reduce overall accessibility thereby reducing the efficiency of other modes
and stimulating more dispersed development.
Certain types of accessibility most directly affect productivity, including commercial
deliveries (freight, service vehicles, etc.), business travel, and commuting to work and
school. Reducing the resource (time, vehicle, fuel) costs of such travel tends to increase
productivity. The magnitude of these impacts varies depending on the type of industry
and conditions. For example, interregional shipping is a major portion of resource and
bulk retail industry costs. Local services, such as plumbers and utilities, are affected by
local travel conditions, including traffic speeds, congestion, and land use accessibility.
Commuting is a major input in service industries (retail, restaurants, hotels, etc.) and
therefore businesses’ ability to attract and retain suitable employees. Changes in these
transport costs can affect those industries’ productivity.
Although most high-value freight is transported by truck, most local services are
distributed by motor vehicle, and most commuting is by automobile, alternative modes,
more accessible land use patterns, and demand management strategies are sometimes the
most cost effective way to improve accessibility, in which case they can provide the
greatest productivity gains. For example, road pricing that gives priority to commercial
and high occupant vehicles on congested roads, more compact and mixed development,
and commute trip reduction programs that shift travel from automobiles to higher
occupant vehicles, can improve accessibility while reducing total vehicle travel.
The Mobility-Productivity Paradox Victoria Transport Policy Institute
4
Economic Efficiency
There are two basic requirements for economic efficiency:
1. Consumer sovereignty, which means that consumers can choose the goods they demand
(for which they are willing to pay marginal costs). As a result, efficiency can increase
with transport system diversity if it allows users to choose the combination of modes,
services and qualities that best meet their needs. There is little reason to maintain options
with minimal demand (for example, cycling facilities or transit services that attract few
users), but transport system efficiency is likely to increase if alternative modes receive at
least as much support as automobile transport, and often more for equity sake (to provide
basic mobility for non-drivers and affordable mobility for lower-income people), and to
help achieve strategic objectives (such as preserving openspace and increasing public
health). For example, if society spends $5.00 on roads and parking facilities to
accommodate an automobile commute it should be willing to devote at least that much
for other commute modes, and often more for equity sake and to achieve other objectives.
2. Efficient pricing, which means that prices (direct costs to users for consuming a good)
reflect the full marginal costs of producing that good, unless a subsidy is specifically
justified. This tests users’ willingness-to-pay for the goods they consume so society does
not spend $2 on a good (including roads and parking facilities) that users only value at
$1. As a result, economic efficiency tends to increase if travelers are charged for the costs
they impose, including congestion, road and parking facilities, accidents, and pollution.
People sometimes assume that policies that make vehicle travel cheaper increase
productivity, but this is only true of true resource savings; economic transfers that
externalize costs tend to reduce productivity. For example, if roads are financed through
general taxes rather than user fees, savings to motorists will be offset by higher costs
elsewhere in the economy, and cheaper vehicle costs are likely to induce additional
vehicle travel that increases total transport costs, including externalities such as traffic
congestion, parking subsidies, accidents, pollution damages, and sprawl-related costs.
Table 1 summarizes various transportation market requirements, distortions, reforms and
their travel impacts. Although these distortions may individually seem modest and
justified, their impacts are cumulative and synergistic (total impacts are greater than the
sum of their individual impacts). For example, planning practices that undervalue active
transport (walking and cycling), by ignoring the parking cost savings and health benefits
they provide, can lead to underinvestment in sidewalks and bike paths, which not only
reduces walking and cycling access, it also reduces public transit access, since most
transit trips include links by these modes. Similarly, underpricing road use (for example,
by financing roads through general taxes rather than user fees) not only increases traffic
congestion and roadway costs, by inducing additional vehicle travel it increases parking
costs, accidents and pollution emissions. Conversely, underpricing parking facility use,
by including them as building costs instead of charging users directly not only increases
the number of parking spaces needed, by inducing additional vehicle travel it also
increases traffic congestion, accidents and pollution costs.
The Mobility-Productivity Paradox Victoria Transport Policy Institute
5
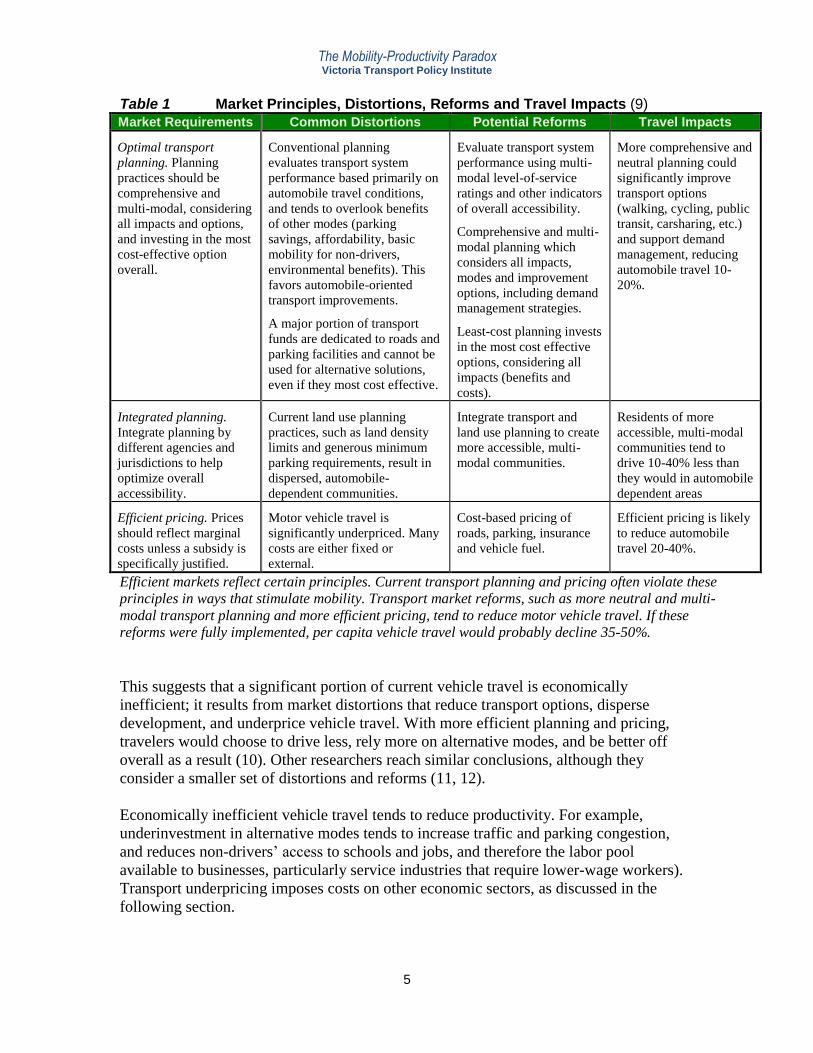
Table 1 Market Principles, Distortions, Reforms and Travel Impacts (9)
Market Requirements Common Distortions Potential Reforms Travel Impacts
Optimal transport
planning. Planning
practices should be
comprehensive and
multi-modal, considering
all impacts and options,
and investing in the most
cost-effective option
overall.
Conventional planning
evaluates transport system
performance based primarily on
automobile travel conditions,
and tends to overlook benefits
of other modes (parking
savings, affordability, basic
mobility for non-drivers,
environmental benefits). This
favors automobile-oriented
transport improvements.
A major portion of transport
funds are dedicated to roads and
parking facilities and cannot be
used for alternative solutions,
even if they most cost effective.
Evaluate transport system
performance using multi-
modal level-of-service
ratings and other indicators
of overall accessibility.
Comprehensive and multi-
modal planning which
considers all impacts,
modes and improvement
options, including demand
management strategies.
Least-cost planning invests
in the most cost effective
options, considering all
impacts (benefits and
costs).
More comprehensive and
neutral planning could
significantly improve
transport options
(walking, cycling, public
transit, carsharing, etc.)
and support demand
management, reducing
automobile travel 10-
20%.
Integrated planning.
Integrate planning by
different agencies and
jurisdictions to help
optimize overall
accessibility.
Current land use planning
practices, such as land density
limits and generous minimum
parking requirements, result in
dispersed, automobile-
dependent communities.
Integrate transport and
land use planning to create
more accessible, multi-
modal communities.
Residents of more
accessible, multi-modal
communities tend to
drive 10-40% less than
they would in automobile
dependent areas
Efficient pricing. Prices
should reflect marginal
costs unless a subsidy is
specifically justified.
Motor vehicle travel is
significantly underpriced. Many
costs are either fixed or
external.
Cost-based pricing of
roads, parking, insurance
and vehicle fuel.
Efficient pricing is likely
to reduce automobile
travel 20-40%.
Efficient markets reflect certain principles. Current transport planning and pricing often violate these
principles in ways that stimulate mobility. Transport market reforms, such as more neutral and multi-
modal transport planning and more efficient pricing, tend to reduce motor vehicle travel. If these
reforms were fully implemented, per capita vehicle travel would probably decline 35-50%.
This suggests that a significant portion of current vehicle travel is economically
inefficient; it results from market distortions that reduce transport options, disperse
development, and underprice vehicle travel. With more efficient planning and pricing,
travelers would choose to drive less, rely more on alternative modes, and be better off
overall as a result (10). Other researchers reach similar conclusions, although they
consider a smaller set of distortions and reforms (11, 12).
Economically inefficient vehicle travel tends to reduce productivity. For example,
underinvestment in alternative modes tends to increase traffic and parking congestion,
and reduces non-drivers’ access to schools and jobs, and therefore the labor pool
available to businesses, particularly service industries that require lower-wage workers).
Transport underpricing imposes costs on other economic sectors, as discussed in the
following section.
The Mobility-Productivity Paradox Victoria Transport Policy Institute
6
Cost Burdens
Motor vehicle travel is relatively costly, including costs for vehicles and fuel, roads and
parking facilities (and therefore land), accident and environmental damages. Other
transport modes also impose costs, but less per passenger-mile. For example, automobile
passengers typically require an order of magnitude more road space than walking, cycling
and public transit, plus space for parking, which increases congestion and facility costs.
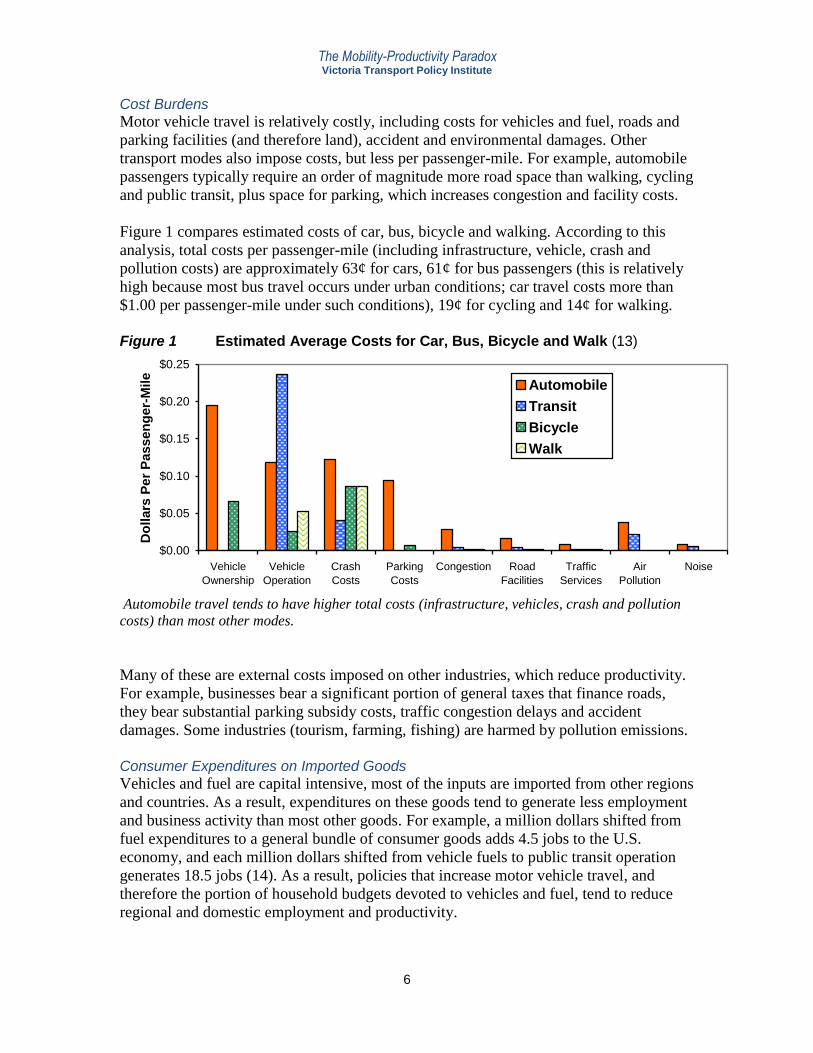
Figure 1 compares estimated costs of car, bus, bicycle and walking. According to this
analysis, total costs per passenger-mile (including infrastructure, vehicle, crash and
pollution costs) are approximately 63¢ for cars, 61¢ for bus passengers (this is relatively
high because most bus travel occurs under urban conditions; car travel costs more than
$1.00 per passenger-mile under such conditions), 19¢ for cycling and 14¢ for walking.
Figure 1 Estimated Average Costs for Car, Bus, Bicycle and Walk (13)
$0.00
$0.05
$0.10
$0.15
$0.20
$0.25
Vehicle
Ownership
Vehicle
Operation
Crash
Costs
Parking
Costs
Congestion Road
Facilities
Traffic
Services
Air
Pollution
Noise
Do
llars
Pe
r P
ass
en
ge
r-M
ile
Automobile
Transit
Bicycle
Walk
Automobile travel tends to have higher total costs (infrastructure, vehicles, crash and pollution
costs) than most other modes.
Many of these are external costs imposed on other industries, which reduce productivity.
For example, businesses bear a significant portion of general taxes that finance roads,
they bear substantial parking subsidy costs, traffic congestion delays and accident
damages. Some industries (tourism, farming, fishing) are harmed by pollution emissions.
Consumer Expenditures on Imported Goods
Vehicles and fuel are capital intensive, most of the inputs are imported from other regions
and countries. As a result, expenditures on these goods tend to generate less employment
and business activity than most other goods. For example, a million dollars shifted from
fuel expenditures to a general bundle of consumer goods adds 4.5 jobs to the U.S.
economy, and each million dollars shifted from vehicle fuels to public transit operation
generates 18.5 jobs (14). As a result, policies that increase motor vehicle travel, and
therefore the portion of household budgets devoted to vehicles and fuel, tend to reduce
regional and domestic employment and productivity.
The Mobility-Productivity Paradox Victoria Transport Policy Institute
7
Productivity Impact Summary
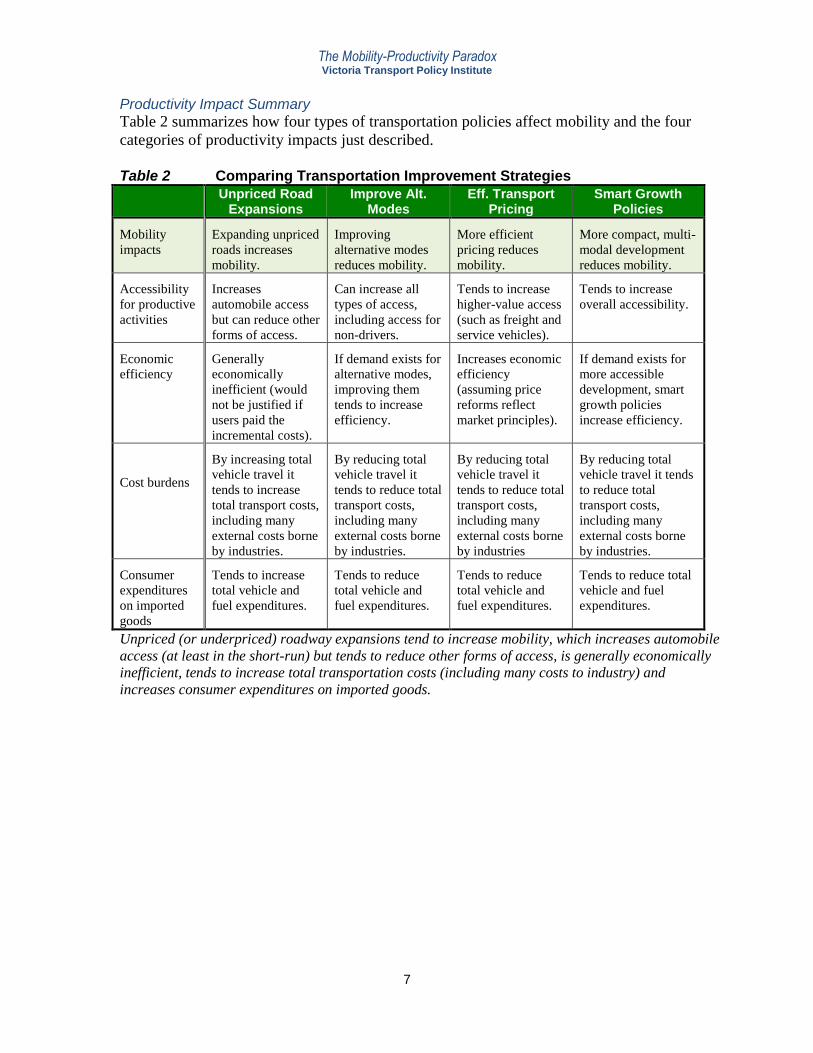
Table 2 summarizes how four types of transportation policies affect mobility and the four
categories of productivity impacts just described.
Table 2 Comparing Transportation Improvement Strategies
Unpriced Road Expansions
Improve Alt. Modes
Eff. Transport Pricing
Smart Growth Policies
Mobility
impacts
Expanding unpriced
roads increases
mobility.
Improving
alternative modes
reduces mobility.
More efficient
pricing reduces
mobility.
More compact, multi-
modal development
reduces mobility.
Accessibility
for productive
activities
Increases
automobile access
but can reduce other
forms of access.
Can increase all
types of access,
including access for
non-drivers.
Tends to increase
higher-value access
(such as freight and
service vehicles).
Tends to increase
overall accessibility.
Economic
efficiency
Generally
economically
inefficient (would
not be justified if
users paid the
incremental costs).
If demand exists for
alternative modes,
improving them
tends to increase
efficiency.
Increases economic
efficiency
(assuming price
reforms reflect
market principles).
If demand exists for
more accessible
development, smart
growth policies
increase efficiency.
Cost burdens
By increasing total
vehicle travel it
tends to increase
total transport costs,
including many
external costs borne
by industries.
By reducing total
vehicle travel it
tends to reduce total
transport costs,
including many
external costs borne
by industries.
By reducing total
vehicle travel it
tends to reduce total
transport costs,
including many
external costs borne
by industries
By reducing total
vehicle travel it tends
to reduce total
transport costs,
including many
external costs borne
by industries.
Consumer
expenditures
on imported
goods
Tends to increase
total vehicle and
fuel expenditures.
Tends to reduce
total vehicle and
fuel expenditures.
Tends to reduce
total vehicle and
fuel expenditures.
Tends to reduce total
vehicle and fuel
expenditures.
Unpriced (or underpriced) roadway expansions tend to increase mobility, which increases automobile
access (at least in the short-run) but tends to reduce other forms of access, is generally economically
inefficient, tends to increase total transportation costs (including many costs to industry) and
increases consumer expenditures on imported goods.
The Mobility-Productivity Paradox Victoria Transport Policy Institute
8
Empirical Evidence This section discusses empirical evidence of the relationships between mobility and economic
productivity.
Evidence of Positive Relationships Between Mobility and Productivity
There is some evidence of a positive relationship between mobility and economic
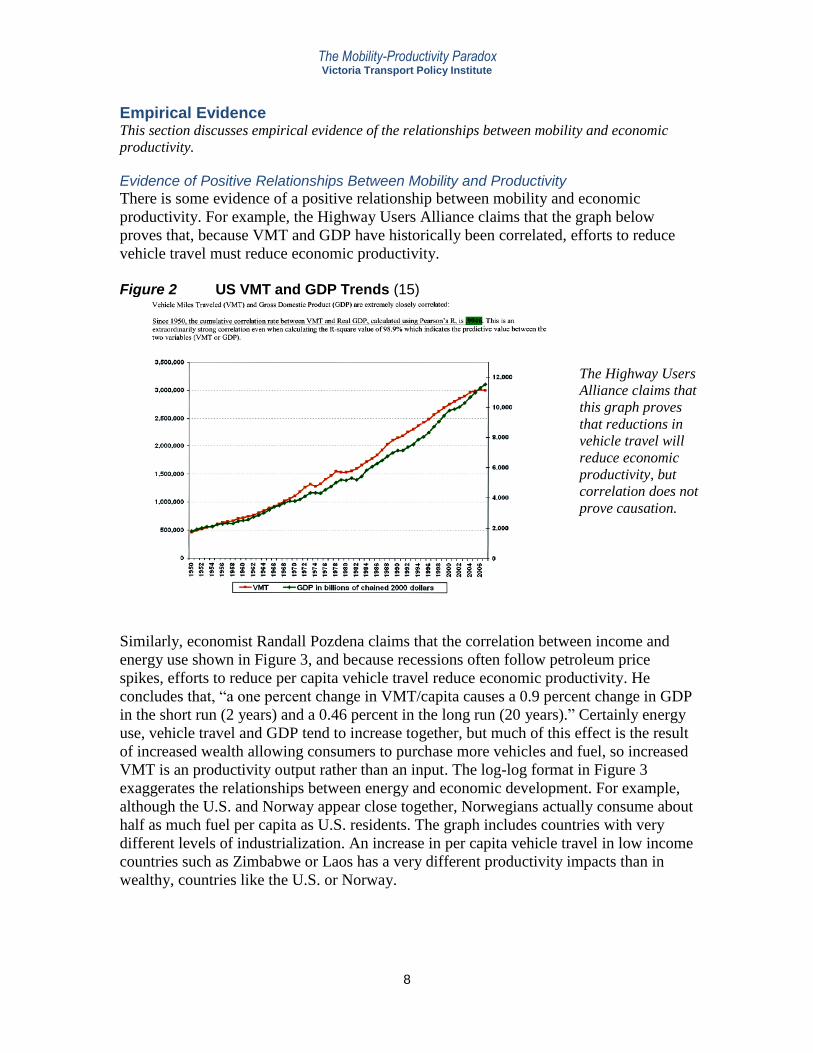
productivity. For example, the Highway Users Alliance claims that the graph below
proves that, because VMT and GDP have historically been correlated, efforts to reduce
vehicle travel must reduce economic productivity.
Figure 2 US VMT and GDP Trends (15)
The Highway Users
Alliance claims that
this graph proves
that reductions in
vehicle travel will
reduce economic
productivity, but
correlation does not
prove causation.
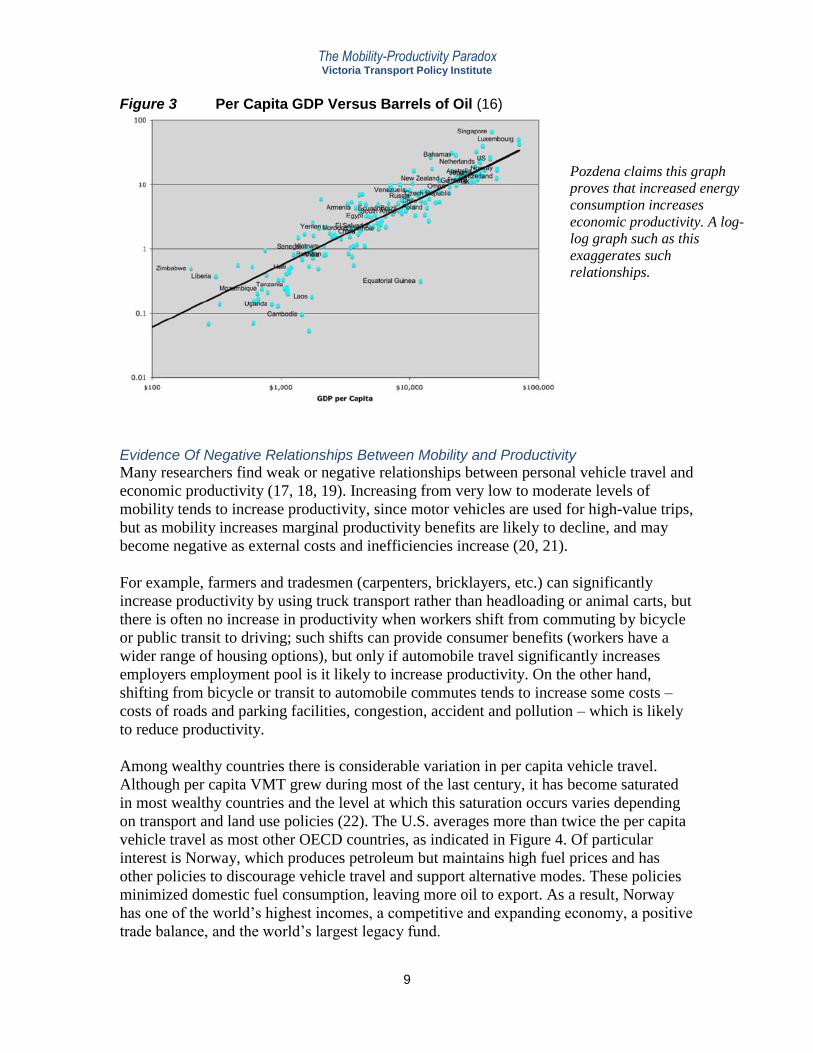
Similarly, economist Randall Pozdena claims that the correlation between income and
energy use shown in Figure 3, and because recessions often follow petroleum price
spikes, efforts to reduce per capita vehicle travel reduce economic productivity. He
concludes that, “a one percent change in VMT/capita causes a 0.9 percent change in GDP
in the short run (2 years) and a 0.46 percent in the long run (20 years).” Certainly energy
use, vehicle travel and GDP tend to increase together, but much of this effect is the result
of increased wealth allowing consumers to purchase more vehicles and fuel, so increased
VMT is an productivity output rather than an input. The log-log format in Figure 3
exaggerates the relationships between energy and economic development. For example,
although the U.S. and Norway appear close together, Norwegians actually consume about
half as much fuel per capita as U.S. residents. The graph includes countries with very
different levels of industrialization. An increase in per capita vehicle travel in low income
countries such as Zimbabwe or Laos has a very different productivity impacts than in
wealthy, countries like the U.S. or Norway.
The Mobility-Productivity Paradox Victoria Transport Policy Institute
9
Figure 3 Per Capita GDP Versus Barrels of Oil (16)
Pozdena claims this graph
proves that increased energy
consumption increases
economic productivity. A log-
log graph such as this
exaggerates such
relationships.
Evidence Of Negative Relationships Between Mobility and Productivity
Many researchers find weak or negative relationships between personal vehicle travel and
economic productivity (17, 18, 19). Increasing from very low to moderate levels of
mobility tends to increase productivity, since motor vehicles are used for high-value trips,
but as mobility increases marginal productivity benefits are likely to decline, and may
become negative as external costs and inefficiencies increase (20, 21).
For example, farmers and tradesmen (carpenters, bricklayers, etc.) can significantly
increase productivity by using truck transport rather than headloading or animal carts, but
there is often no increase in productivity when workers shift from commuting by bicycle
or public transit to driving; such shifts can provide consumer benefits (workers have a
wider range of housing options), but only if automobile travel significantly increases
employers employment pool is it likely to increase productivity. On the other hand,
shifting from bicycle or transit to automobile commutes tends to increase some costs –
costs of roads and parking facilities, congestion, accident and pollution – which is likely
to reduce productivity.
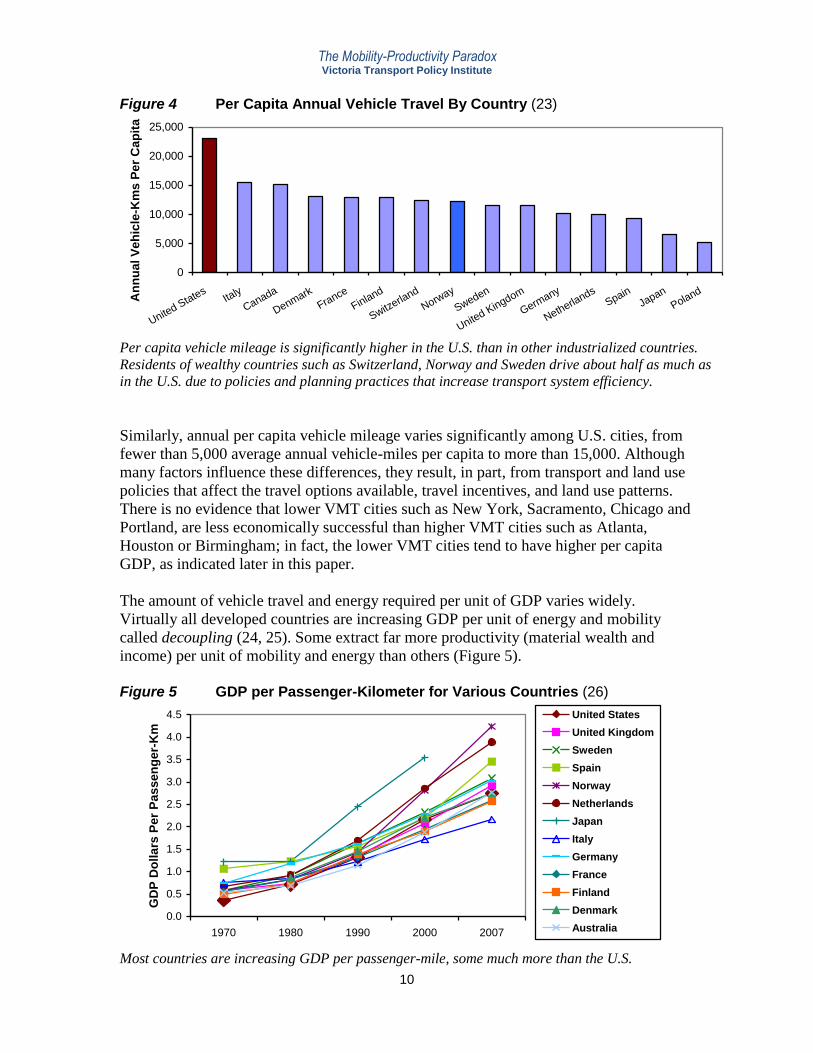
Among wealthy countries there is considerable variation in per capita vehicle travel.
Although per capita VMT grew during most of the last century, it has become saturated
in most wealthy countries and the level at which this saturation occurs varies depending
on transport and land use policies (22). The U.S. averages more than twice the per capita
vehicle travel as most other OECD countries, as indicated in Figure 4. Of particular
interest is Norway, which produces petroleum but maintains high fuel prices and has
other policies to discourage vehicle travel and support alternative modes. These policies
minimized domestic fuel consumption, leaving more oil to export. As a result, Norway
has one of the world’s highest incomes, a competitive and expanding economy, a positive
trade balance, and the world’s largest legacy fund.
The Mobility-Productivity Paradox Victoria Transport Policy Institute
10
Figure 4 Per Capita Annual Vehicle Travel By Country (23)
0
5,000
10,000
15,000
20,000
25,000
United S
tatesIta
ly
Canada
Denmark
France
Finland
Switzerla
nd
Norway
Sweden
United K
ingdom
Germany
Netherlands
SpainJapan
Poland
An
nu
al V
eh
icle
-Km
s P
er
Cap
ita
Per capita vehicle mileage is significantly higher in the U.S. than in other industrialized countries.
Residents of wealthy countries such as Switzerland, Norway and Sweden drive about half as much as
in the U.S. due to policies and planning practices that increase transport system efficiency.
Similarly, annual per capita vehicle mileage varies significantly among U.S. cities, from
fewer than 5,000 average annual vehicle-miles per capita to more than 15,000. Although
many factors influence these differences, they result, in part, from transport and land use
policies that affect the travel options available, travel incentives, and land use patterns.
There is no evidence that lower VMT cities such as New York, Sacramento, Chicago and
Portland, are less economically successful than higher VMT cities such as Atlanta,
Houston or Birmingham; in fact, the lower VMT cities tend to have higher per capita
GDP, as indicated later in this paper.
The amount of vehicle travel and energy required per unit of GDP varies widely.
Virtually all developed countries are increasing GDP per unit of energy and mobility
called decoupling (24, 25). Some extract far more productivity (material wealth and
income) per unit of mobility and energy than others (Figure 5).
Figure 5 GDP per Passenger-Kilometer for Various Countries (26)
0.0
0.5
1.0
1.5
2.0
2.5
3.0
3.5
4.0
4.5
1970 1980 1990 2000 2007
GD
P D
olla
rs P
er
Pas
se
ng
er-
Km
United States
United Kingdom
Sweden
Spain
Norway
Netherlands
Japan
Italy
Germany
France
Finland
Denmark
Australia
Most countries are increasing GDP per passenger-mile, some much more than the U.S.
The Mobility-Productivity Paradox Victoria Transport Policy Institute
11
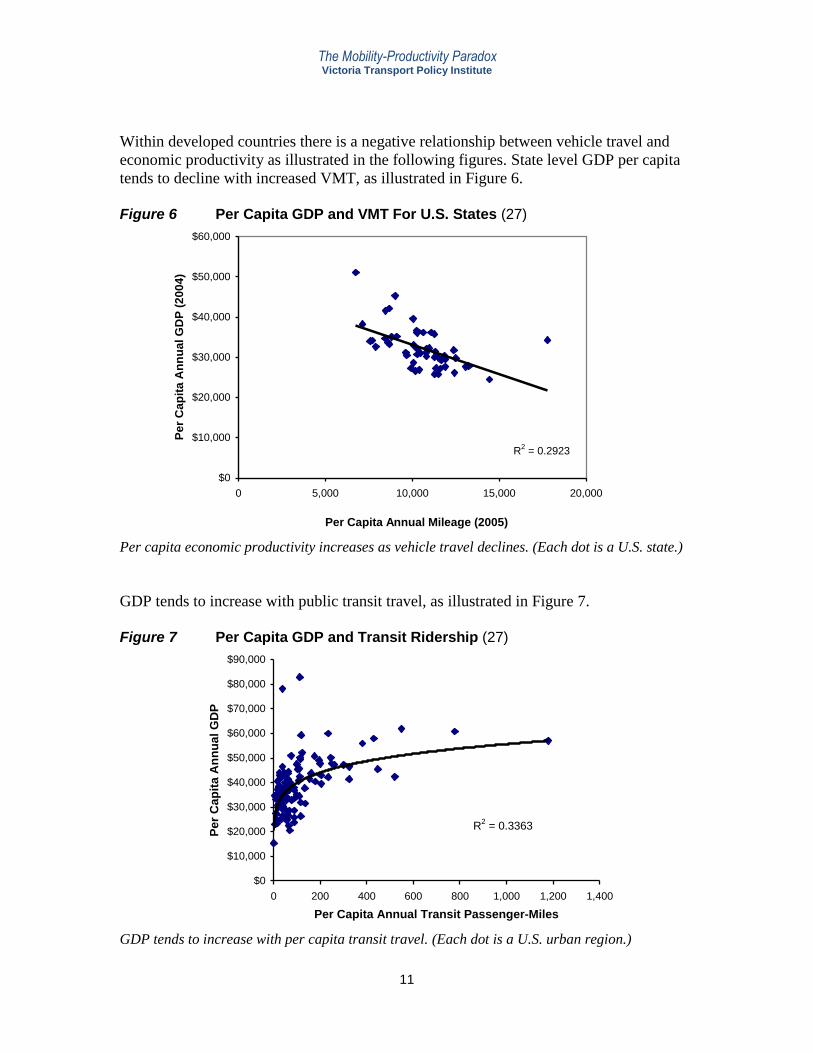
Within developed countries there is a negative relationship between vehicle travel and
economic productivity as illustrated in the following figures. State level GDP per capita
tends to decline with increased VMT, as illustrated in Figure 6.
Figure 6 Per Capita GDP and VMT For U.S. States (27)
R2 = 0.2923
$0
$10,000
$20,000
$30,000
$40,000
$50,000
$60,000
0 5,000 10,000 15,000 20,000
Per Capita Annual Mileage (2005)
Pe
r C
ap
ita
An
nu
al G
DP
(2
00
4)
Per capita economic productivity increases as vehicle travel declines. (Each dot is a U.S. state.)
GDP tends to increase with public transit travel, as illustrated in Figure 7.
Figure 7 Per Capita GDP and Transit Ridership (27)
R2 = 0.3363
$0
$10,000
$20,000
$30,000
$40,000
$50,000
$60,000
$70,000
$80,000
$90,000
0 200 400 600 800 1,000 1,200 1,400
Per Capita Annual Transit Passenger-Miles
Pe
r C
ap
ita
An
nu
al
GD
P
GDP tends to increase with per capita transit travel. (Each dot is a U.S. urban region.)
The Mobility-Productivity Paradox Victoria Transport Policy Institute
12
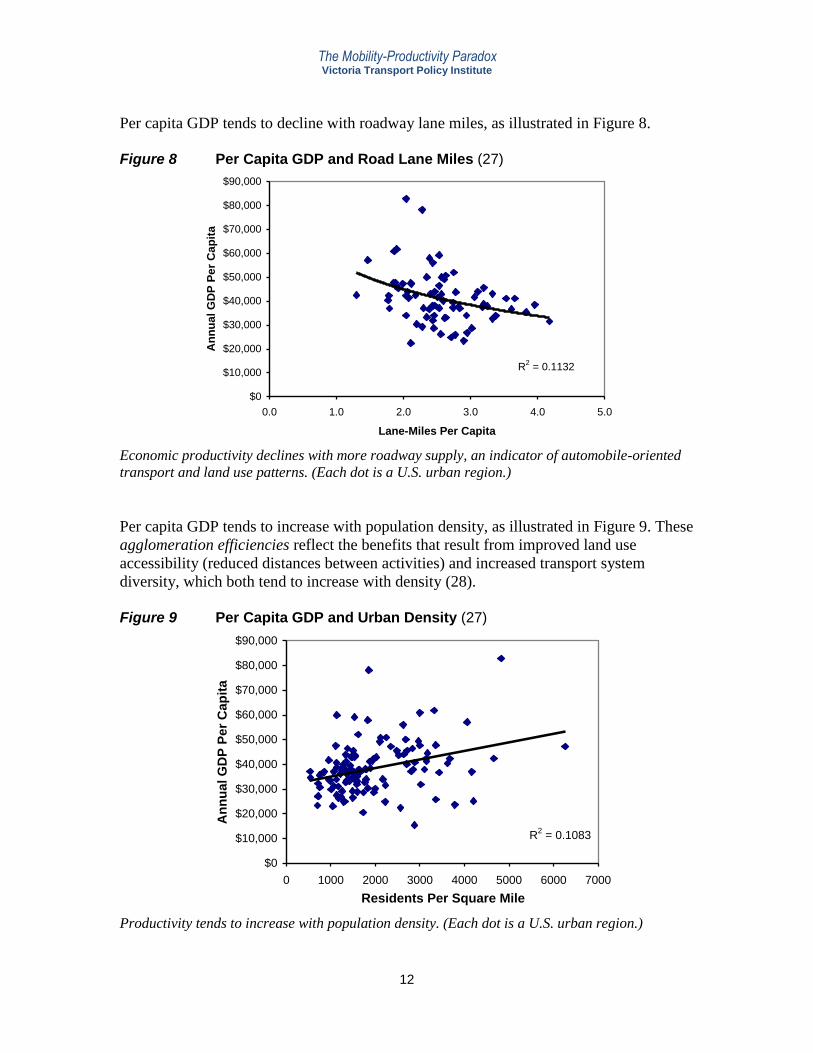
Per capita GDP tends to decline with roadway lane miles, as illustrated in Figure 8.
Figure 8 Per Capita GDP and Road Lane Miles (27)
R2 = 0.1132
$0
$10,000
$20,000
$30,000
$40,000
$50,000
$60,000
$70,000
$80,000
$90,000
0.0 1.0 2.0 3.0 4.0 5.0
Lane-Miles Per Capita
An
nu
al
GD
P P
er
Ca
pit
a
Economic productivity declines with more roadway supply, an indicator of automobile-oriented
transport and land use patterns. (Each dot is a U.S. urban region.)
Per capita GDP tends to increase with population density, as illustrated in Figure 9. These
agglomeration efficiencies reflect the benefits that result from improved land use
accessibility (reduced distances between activities) and increased transport system
diversity, which both tend to increase with density (28).
Figure 9 Per Capita GDP and Urban Density (27)
R2 = 0.1083
$0
$10,000
$20,000
$30,000
$40,000
$50,000
$60,000
$70,000
$80,000
$90,000
0 1000 2000 3000 4000 5000 6000 7000
Residents Per Square Mile
An
nu
al G
DP
Per
Cap
ita
Productivity tends to increase with population density. (Each dot is a U.S. urban region.)
The Mobility-Productivity Paradox Victoria Transport Policy Institute
13
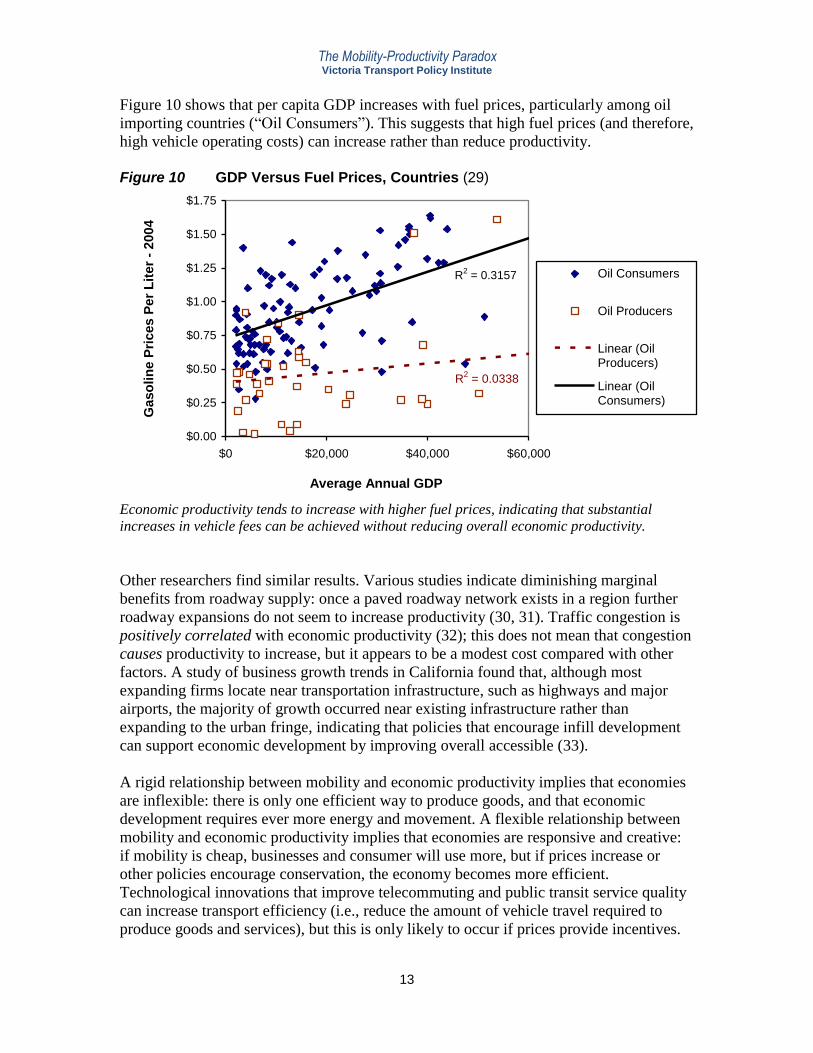
Figure 10 shows that per capita GDP increases with fuel prices, particularly among oil
importing countries (“Oil Consumers”). This suggests that high fuel prices (and therefore,
high vehicle operating costs) can increase rather than reduce productivity.
Figure 10 GDP Versus Fuel Prices, Countries (29)
R2 = 0.0338
R2 = 0.3157
$0.00
$0.25
$0.50
$0.75
$1.00
$1.25
$1.50
$1.75
$0 $20,000 $40,000 $60,000
Average Annual GDP
Ga
so
lin
e P
ric
es
Pe
r L
ite
r -
200
4
Oil Consumers
Oil Producers
Linear (OilProducers)
Linear (OilConsumers)
Economic productivity tends to increase with higher fuel prices, indicating that substantial
increases in vehicle fees can be achieved without reducing overall economic productivity.
Other researchers find similar results. Various studies indicate diminishing marginal
benefits from roadway supply: once a paved roadway network exists in a region further
roadway expansions do not seem to increase productivity (30, 31). Traffic congestion is
positively correlated with economic productivity (32); this does not mean that congestion
causes productivity to increase, but it appears to be a modest cost compared with other
factors. A study of business growth trends in California found that, although most
expanding firms locate near transportation infrastructure, such as highways and major
airports, the majority of growth occurred near existing infrastructure rather than
expanding to the urban fringe, indicating that policies that encourage infill development
can support economic development by improving overall accessible (33).
A rigid relationship between mobility and economic productivity implies that economies
are inflexible: there is only one efficient way to produce goods, and that economic
development requires ever more energy and movement. A flexible relationship between
mobility and economic productivity implies that economies are responsive and creative:
if mobility is cheap, businesses and consumer will use more, but if prices increase or
other policies encourage conservation, the economy becomes more efficient.
Technological innovations that improve telecommuting and public transit service quality
can increase transport efficiency (i.e., reduce the amount of vehicle travel required to
produce goods and services), but this is only likely to occur if prices provide incentives.
The Mobility-Productivity Paradox Victoria Transport Policy Institute
14
Conclusions Motor vehicle transportation contributes to economic productivity in many ways: it
delivers raw materials, distributes final products, and transport employees to worksites.
However, this does not mean that increased motor vehicle travel necessarily increases
productivity; like most economic inputs, there is an optimal level of beyond which
marginal costs exceed marginal benefits.
Automobile transport is relatively costly, including road and parking infrastructure,
vehicles and fuel, congestion impacts, accident risk and pollution emissions. Policies and
planning decisions can affect motor vehicle use: households located in automobile
dependent communities, where most trips are made by automobile, tend to drive about
twice as much, and both bear and impose about twice the transportation costs, as they
would if located in more multi-modal communities where it is common to walk or bike to
local services and commuters often use public transit. Affluent economies can bear the
additional costs of automobile dependency, but they are less productive than if they had
more efficient transport systems.
An efficient transportation system reflects market principles including consumer
sovereignty and marginal-cost pricing. Current planning and pricing are distorted in ways
that tend to favor mobility over other forms of accessibility, and automobile travel over
other modes, resulting in economically excessive mobility. More comprehensive and
neutral planning and more efficient transport pricing tend to reduce motor vehicle travel
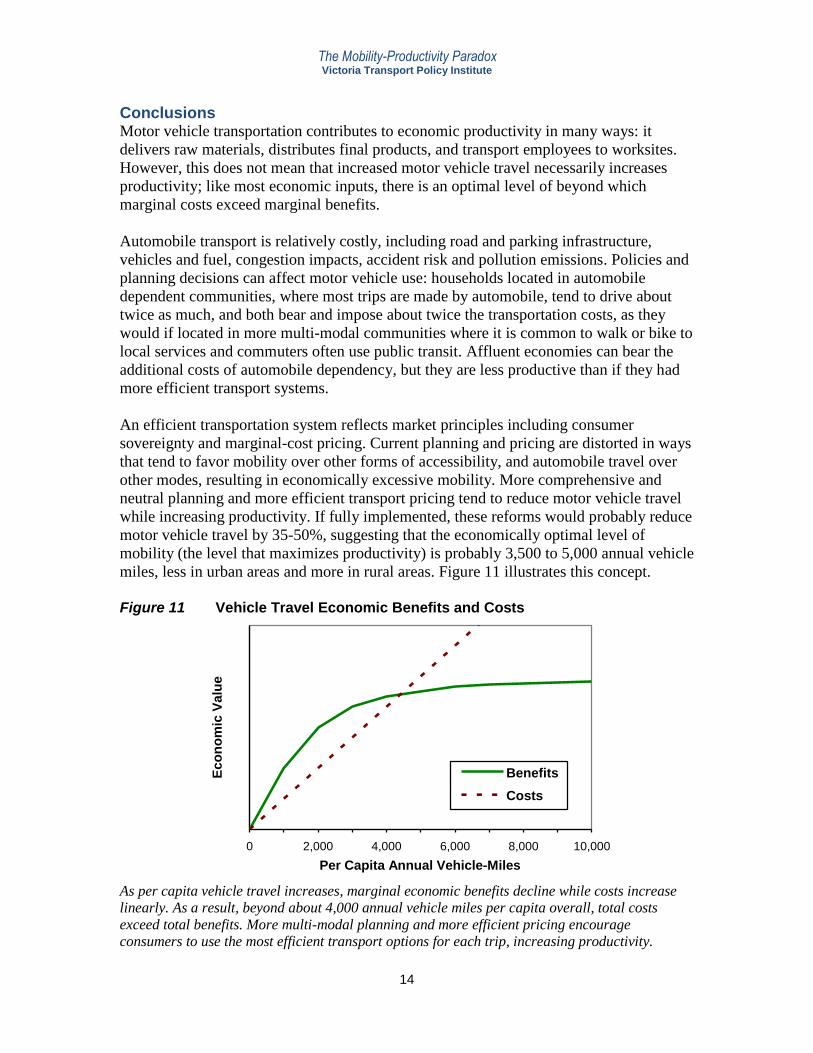
while increasing productivity. If fully implemented, these reforms would probably reduce
motor vehicle travel by 35-50%, suggesting that the economically optimal level of
mobility (the level that maximizes productivity) is probably 3,500 to 5,000 annual vehicle
miles, less in urban areas and more in rural areas. Figure 11 illustrates this concept.
Figure 11 Vehicle Travel Economic Benefits and Costs
0 2,000 4,000 6,000 8,000 10,000
Per Capita Annual Vehicle-Miles
Eco
no
mic
Valu
e
Benefits
Costs
As per capita vehicle travel increases, marginal economic benefits decline while costs increase
linearly. As a result, beyond about 4,000 annual vehicle miles per capita overall, total costs
exceed total benefits. More multi-modal planning and more efficient pricing encourage
consumers to use the most efficient transport options for each trip, increasing productivity.
The Mobility-Productivity Paradox Victoria Transport Policy Institute
15
Empirical evidence supports this conclusion. Claims of a direct positive link between
mobility and economic productivity, which would justify public policies that favor
automobile transportation, are based on weak evidence, such as comparisons between
countries at very different levels of development which primarily reflect the ability of
more affluent consumers to purchase motor vehicle travel. Comparisons between affluent
urban regions show negative relationships between mobility and productivity; in
developed countries, productivity tends to be higher in areas where people drive less, rely
more on alternative modes, and live in more accessible and multi-modal communities.
As a result, policies that increase motor vehicle travel, such as underpriced roads, parking
supply mandates, and planning practices that favor automobile travel over alternatives,
are probably economically harmful overall: they reduce productivity. Such policies may
benefit some industries but harm a larger number of industries. Conversely, improving
resource-efficient modes (walking, cycling, ridesharing and public transport), more
efficient transport pricing, and more compact, multi-modal development, tend to increase
economic productivity and development overall.
This suggests that in most situations, expanding unpriced highways, subsidizing vehicle
parking, and minimizing fuel prices is likely to reduce economic productivity, while
improving resource-efficient modes, transport pricing reforms, smart growth policies, and
transportation demand management programs are likely to increase productivity.
This research is preliminary, based on limited and imperfect data. There is a need for
better vehicle travel, transportation cost, and economic data, collected using consistent
definitions and methods in numerous urban regions around the world, to help researchers
understand the relationships between transport policy and economic productivity.
The Mobility-Productivity Paradox Victoria Transport Policy Institute
16
Endnotes
1 CTS (2010), Measuring What Matters: Access to Destinations, the second research summary from the
Access to Destinations Study, Center for Transportation Studies, University of Minnesota
(www.cts.umn.edu); at www.cts.umn.edu/Publications/ResearchReports/reportdetail.html?id=1948.
2 Todd Litman (2013), Toward More Comprehensive and Multi-modal Transport Evaluation, JOURNEYS
(www.ltaacademy.gov.sg/journeys.htm), September, pp. 50-58; at www.vtpi.org/comp_evaluation.pdf.
3 Todd Litman (2013), “The New Transportation Planning Paradigm,” ITE Journal (www.ite.org), Vol. 83,
June, pp. 20-28; at www.vtpi.org/paradigm.pdf.
4 John LaPlante (2010), “The Challenge of Multi-modalism; Theodore M. Matson Memorial Award,” ITE
Journal (www.ite.org), Vol. 80, No. 10, October, pp. 20-23; at
www.ite.org/membersonly/itejournal/pdf/2010/JB10JA20.pdf.
5 J. Richard Kuzmyak (2012), Land Use and Traffic Congestion, Report 618, Arizona DOT
(www.azdot.gov); at www.azdot.gov/TPD/ATRC/publications/project_reports/PDF/AZ618.pdf.
6 Jonathan Levine, Joe Grengs, Qingyun Shen and Qing Shen (2012), “Does Accessibility Require Density
or Speed?” Journal of the American Planning Association, Vol. 78, No. 2, pp. 157-172,
http://dx.doi.org/10.1080/01944363.2012.677119; at www.connectnorwalk.com/wp-
content/uploads/JAPA-article-mobility-vs-proximity.pdf.
7 David Levinson (2013), Access Across America, Report 13, Access to Destinations Study, Center for
Transportation at the University of Minnesota (www.cts.umn.edu); at
www.cts.umn.edu/Publications/ResearchReports/pdfdownload.pl?id=2280.
8 Joe Cortright (2010), Driven Apart: How Sprawl is Lengthening Our Commutes and Why Misleading
Mobility Measures are Making Things Worse, CEOs for Cities (www.ceosforcities.org); at
www.ceosforcities.org/work/driven-apart.
9 Todd Litman (2006), “Transportation Market Distortions,” Berkeley Planning Journal; issue theme
Sustainable Transport in the United States: From Rhetoric to Reality? (www-dcrp.ced.berkeley.edu/bpj),
Volume 19, 2006, pp. 19-36; at www.vtpi.org/distortions_BPJ.pdf.
10 Todd Litman (2014), Economically Optimal Transport Prices and Markets: What Would Happen If
Rational Policies Prevailed?, presented at I-TED 2014 – International Transportation Economic
Development Conference. Also see, Socially Optimal Transport Prices and Markets, Victoria Transport
Policy Institute; at www.vtpi.org/sotpm.pdf.
11 Elena Safirova, Sebastien Houde and Winston Harrington (2007), Marginal Social Cost Pricing on a
Transportation Network: Comparison of Second-Best Policies, Resources for the Future (www.rff.org); at
www.rff.org/documents/RFF-DP-07-52.pdf.
12 Lei Zhang and Yijing Lu (2012), “Marginal Cost Vehicle Mileage Fee,” Transportation Research Record
2297, Transportation Research Board (www.trb.org), pp. 10-10; at
http://trb.metapress.com/content/q050l35u7r726813.
13 Todd Litman (2009), “Congestion Costs,” Transportation Cost and Benefit Analysis, Victoria Transport
Policy Institute (www.vtpi.org/tca).
14 NRC (2009), Hidden Costs of Energy: Unpriced Consequences of Energy Production and Use, National
Research Council (www.nap.edu/catalog/12794.html).

The Mobility-Productivity Paradox Victoria Transport Policy Institute
17
15 HUA (2009), Contact your Senators and ask them to OPPOSE S. 1036! - Action Alert, Highway Users
Federation (www.highways.org); at http://capwiz.com/highway/issues/alert/?alertid=13480606.
16 Randall J. Pozdena (2009), Driving the Economy: Automotive Travel, Economic Growth, and the Risks of
Global Warming Regulations, Cascade Policy Institute (www.cascadepolicy.org); at
www.cascadepolicy.org/pdf/VMT%20102109.pdf.
17 Liisa Ecola and Martin Wachs (2012), Exploring the Relationship between Travel Demand and
Economic Growth, Federal Highway Administration (www.fhwa.dot.gov); at
www.fhwa.dot.gov/policy/otps/pubs/vmt_gdp/vmt_gdp.pdf.
18 Chuck Kooshian (2011), Recent Trends in the Travel Intensity of the U.S. Economy, World Symposium
on Transport and Land Use Research (http://wstlur.org); at
www.cts.umn.edu/events/wstlur/symposium/2011/agenda/documents/presentations/2-kooshian.pdf.
19 B. Starr McMullen and Nathan Eckstein (2011), The Relationship Between Vehicle Miles Traveled and
Economic Activity, Oregon Transportation Research and Education Consortium (OTREC); at
http://otrec.us/main/document.php?doc_id=3003; summarized in Transportation Research Record 2297,
http://pubsindex.trb.org/view.aspx?id=1128614.
20 Chuck Kooshian and Steve Winkelman (2011), Growing Wealthier: Smart Growth, Climate Change and
Prosperity, Center for Clean Air Policy (www.ccap.org); at www.growingwealthier.info.
21 Jason Zheng, Carol Atkinson-Palombo, Chris McCahill, Rayan O’Hara and Norman Garrick (2011),
“Quantifying the Economic Domain of Transportation Sustainability,” Transportation Research Record
2242, Transportation Research Board (www.trb.org), pp. 19-28; at
http://amonline.trb.org/12koec/12koec/1.
22 Adam Millard-Ball and Lee Schipper (2010), “Are We Reaching Peak Travel? Trends in Passenger
Transport in Eight Industrialized Countries,” Transport Reviews, Vol. 30
(http://dx.doi.org/10.1080/01441647.2010.518291); at http://web.mit.edu/vig/Public/peaktravel.pdf.
23 OECD (2009), OECD Fact Book, Organization for Economic Co-operation and Development
(www.oecd.org); at www.oecd.org/site/0,3407,en_21571361_34374092_1_1_1_1_1,00.html.
24 Rafaa Mraihi (2012), “Transport Intensity and Energy Efficiency: Analysis of Policy Implications of
Coupling and Decoupling,” Energy Efficiency – The Innovative Ways for Smart Energy, the Future
Towards Modern Utilities; at http://dx.doi.org/10.5772/50808.
25 OECD (2006), Decoupling the Environmental Impacts of Transport from Economic Growth,
Organization for Economic Cooperation and Development (www.oecd.org); at
www.oecd.org/env/transportandenvironment/37722729.pdf.
26 OECD (2009).
27 VTPI (2009), Urban Transportation Performance Spreadsheet, Victoria Transport Policy Institute,
(www.vtpi.org/Transit2009.xls).
28 Daniel J. Graham (2007), Agglomeration Economies and Transport Investment, Discussion Paper No.
2007-11, Joint Transport Research Centre, OECD and International Transport Forum, at
http://puck.sourceoecd.org/vl=9745622/cl=32/nw=1/rpsv/cgi-bin/wppdf?file=5kzbxsv5nnjk.pdf.
29 Gerhard Metschies (2009), International Fuel Prices, German Agency for Technical Cooperation
(www.giz.de); at www.gtz.de/en/themen/29957.htm.
The Mobility-Productivity Paradox Victoria Transport Policy Institute
18
30 Piyapong Jiwattanakulpaisarn, Robert B. Noland and Daniel J. Graham (2012), “Marginal Productivity
Of Expanding Highway Capacity,” Journal of Transport Economics and Policy (JTEP), Vol. 46, No. 3,
September, pp. 333-347; summary at http://ideas.repec.org/a/tpe/jtecpo/v46y2012i3p333-347.html.
31 Theofanis Mamuneas and Ishaq Nadiri (2006), “Production, Consumption and Rates of Return to
Highway Infrastructure Capital,” https://editorialexpress.com/cgi-
bin/conference/download.cgi?db_name=IIPF62&paper_id=11.
32 Eric Dumbaugh (2012), “Rethinking the Economics of Traffic Congestion,” Atlantic Cities, 1 June 2012;
at www.theatlanticcities.com/commute/2012/06/defense-congestion/2118.
33 Karen Chapple and Carrie Makarewicz (2010), “Restricting New Infrastructure: Bad for Business in
California?” Access 36 (www.uctc.net/access); Spring, pp. 8-13; at www.uctc.net/access/36/access-
36restrictingnewinfras.pdf.
www.vtpi.org/ITED_paradox.pdf