the national picture
TRANSCRIPT

The National Picture:
First Ever Survey Of Public and Private
Funding for Problem Gambling Services in the
United States
Jeff Marotta, Christopher Armentano,
Mark Vander Linden, & Keith Whyte
Ashley Reynolds, Emma Burick, Gail Calcagno,
Jasmine Marotta-Jaenecke
Presented at the National Conference on Problem Gambling, Seattle WA
July 19, 2013

Acknowledgements
This project would not have been possible without financial support by:
National Council on Problem Gambling
Association of Problem Gambling Service Administrators
Project Executive Team:
Jeff Marotta, Mark Vander Linden, Chris Armentano, & Keith Whyte
Research Assistants:
Ashley Reynolds, Emma Burick, Gail Calcagno, Jasmine Marotta-Jaenecke
APGSA Member Representatives & NCPG Work Group Participants:
Don Feeney, Wily Harwell, Carol O’Hare
Survey Respondents:
We are grateful to all the state agency administrators and NCPG affiliate directors and staff who completed a survey or helped in the gathering of survey information

Survey Methodology
Data Collection Period from February, 2013 – June, 2013
Phase I: Key Informant Survey
APGSA Survey emailed then completed by key informant from one or more government agencies or a designated third party
NCPG Affiliate Survey emailed then completed by key informant
Phase II: Collateral Information Check
Checked for consistent reports between state key informant and affiliate key informant
Web search for information, compared survey reports with reports on web
Phase III: Survey Review Interviews / Verification
Interviews were conducted with survey completers to review information, check for question interpretation accuracy, complete missing items, and gain clarification where inconsistencies were found.

Survey Participation
Information gathered from all 50 U.S. states and D.C.; all active affiliates to the National Council on Problem Gambling
39 states with publicly funded problem gambling services
34 state affiliates to the National Council on Problem Gambling
Information from all data gathering phases from all NCPG affiliates and from all state agencies with public funding for PGS with the following exceptions:
One state (South Dakota) declined to complete survey and declined interview invitations; some survey info gathered from 3rd party sources
Two states (Ohio & Illinois) had limited information available.
One state completed survey and declined interview invitations (South Carolina)
One NCPG affiliate (Arizona) was inactive but held official status as affiliate to the NCPG. As inactive organization, no one to participate in survey.

Problem Gambling Service
Funding Levels
2013 APGSA & NCPG Affiliate Surveys

2013 Per Capita Allocation Problem
Gambling Services Allocation by U.S. States
Note: Includes only funds line itemed for problem gambling services and passing through a state agency. Missing states do not fund problem
gambling services through legislative actions or utilize state agency budgets line itemed for problem gambling services
0
0.2
0.4
0.6
0.8
1
1.2
1.4
1.6
AR
AZ
CA
CO
CT
DE FL
GA IA IL IN KS
LA
MA
MD
ME
MI
MN
MO MS
NC
ND
NE
NJ
NM
NV
NY
OK
OR
PA RI
SC SD TN VT
WA
WI
Per Capita
U.S. Average (.30)
If all 50 State included U.S. Average = $0.23 per capita spending on PGS

2013 Per Capita NCPG State Affiliate Budget
0
0.2
0.4
0.6
0.8
1
1.2
1.4
1.6
1.8
2
AL
CA
CO
CT
DE
FL IL IN KS
KY
LA
MD
MA MI
MN MS
MO
MT
NE
NV NJ
NM
NY
NC
OH
OK
OR
PA RI
TX
VT
VA
WA
WI
Per Capita
U.S. Average (.14)
Note: Four Affiliates operated without any FY13 revenue (MO, NC, RI, TX)

Combined 2013 Per Capita PGS Allocation
by U.S. States and State Affiliates
$0.00
$0.20
$0.40
$0.60
$0.80
$1.00
$1.20
$1.40
$1.60
AL
AZ
AR
CA
CO
CT
DE FL
GA IA IL IN KS
KY
LA
MD
MA
ME
MI
MN MS
MO
MT
NC
ND
NE
NV NJ
NM
NY
OH
OK
OR
PA RI
SC SD TN VT
VA
WA
WI
WV
Per Capita (Affiliate) Per Capita (State)
Note: NCPG Affiliates spending (in red) represents all funds except those derived through contract with state agency.

Comparison between 2010 and 2013: Per Capita Allocation by U.S. States on Problem Gambling Services
0
0.2
0.4
0.6
0.8
1
1.2
1.4
1.6
AR
AZ
CA
CO
CT
DE
FL
GA IA IL IN KS
LA
MA
MD
ME
MI
MN
MO MS
NC
ND
NE
NJ
NM
NV
NY
OK
OR
PA RI
SC SD TN VT
WA
WI
WV
Per capita 2010
Per capita 2013
Note: Includes only funds line itemed for problem gambling services and passing through a state agency
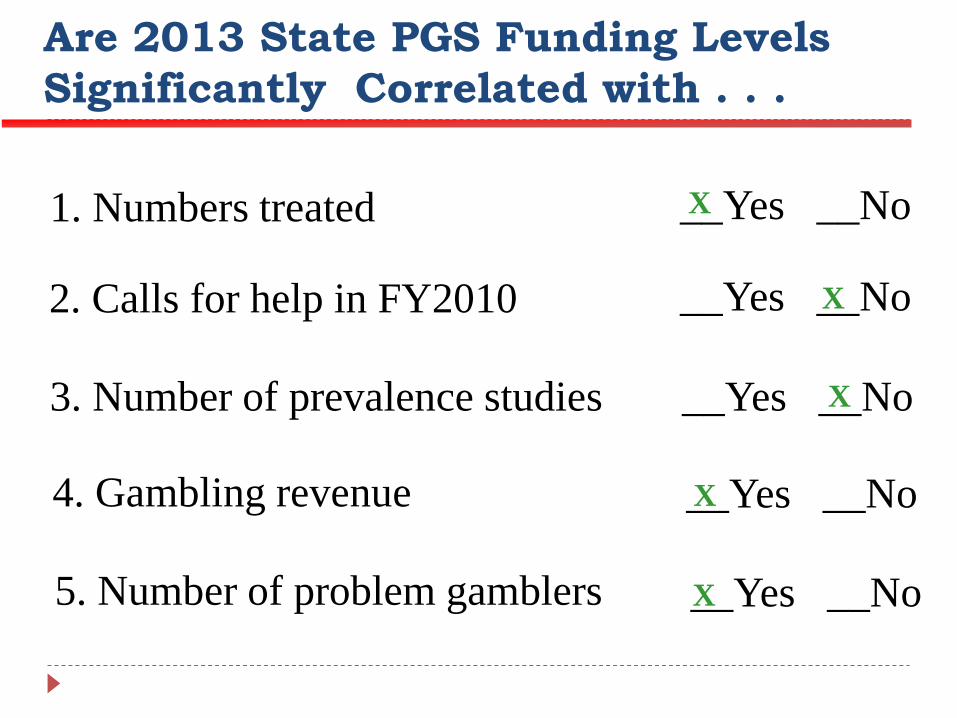
1. Numbers treated __Yes __No
2. Calls for help in FY2010
3. Number of prevalence studies
4. Gambling revenue
__Yes __No
__Yes __No
__Yes __No
X
X
X
X
Are 2013 State PGS Funding Levels
Significantly Correlated with . . .
5. Number of problem gamblers
__Yes __No X

Relationship between No. of PG Gamblers
and FY12-13 funding
$0
$1,000,000
$2,000,000
$3,000,000
$4,000,000
$5,000,000
$6,000,000
$7,000,000
$8,000,000
$9,000,000
$10,000,000
0 100,000 200,000 300,000 400,000 500,000 600,000 700,000
Fu
nd
ing F
Y12
-13
Estimated No. of Problem Gamblers
Relationship is significant, with r=.5204 and p=.0001
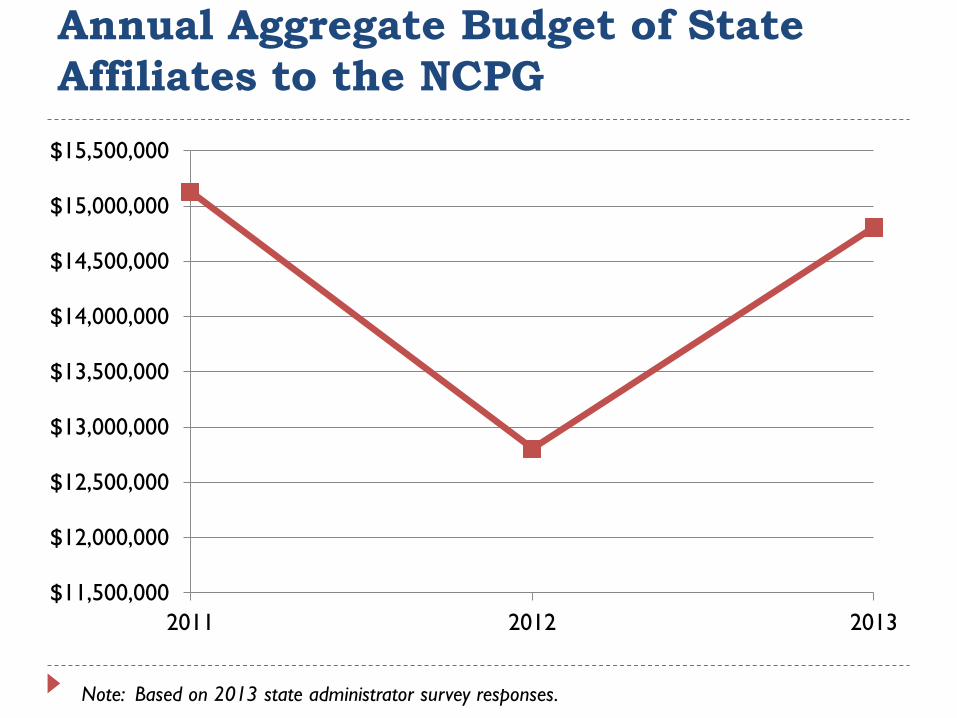
Annual Aggregate Budget of State
Affiliates to the NCPG
$11,500,000
$12,000,000
$12,500,000
$13,000,000
$13,500,000
$14,000,000
$14,500,000
$15,000,000
$15,500,000
2011 2012 2013
Note: Based on 2013 state administrator survey responses.

Annual Aggregate of U.S. State Spending
Dedicated for Problem Gambling Services
Data based on past four APGSA Surveys
$0
$10,000,000
$20,000,000
$30,000,000
$40,000,000
$50,000,000
$60,000,000
$70,000,000
2006 2008 2010 2013
Deviating from an
upward investment
trend from 2006 to
2010, funding for PGS
was relatively flat from
2010 ($58.4M) to
2013 ($58.6M).

Substance Use
Disorders
Gambling
Disorders
U.S. Pop. With Past Year Problem 2
5.3 Million (3.6 times smaller)
2013 Public Funds Invested into Problem Gambling Services4
$58.6 Million (290 times smaller)
U.S. Pop. With Past Year
Problem 1
18.9 Million
2009 Public Funds Invested
into SUD Treatment3
$17 Billion
1 Substance Abuse and Mental Health Services Administration (2012) 2 Williams, R.J., Volberg, R.A. & Stevens, R.M.G. (2012). 3Substance Abuse and Mental Health Services Administration (2013). 4 APGSA & NCPG National Survey (2013) Excludes private insurance payments, client private payments, etc.

Budget Allocations
2013 APGSA & NCPG Affiliate Surveys

Number of States Using Public Funds
for Specific Problem Gambling Services
05
101520253035404550
State Agencies
Affiliates
Note: Includes only funds line itemed for problem gambling services and passing through a state agency. Excludes
information from APGSA SD Survey.

Allocation by Service Category
State Agency Affiliate to NCPG
Admin:
28.60%
Evaluation:
2.52%
Research:
1.48% Helpline:
10.41%
Training:
19.43% Treatment
13.35%
Prevention
15.46%
Media:
9.78%
Other:
18.91%
Admin:
6.84%
Eval:
1.86% Research:
2.06%
Helpline:
10.14%
Training:
14.92%
Treatment 35.04%
Prevent:
19.78%
Media:
13.91%
Other:
11.68%

Number of State Employee FTE
Dedicated to PGS 48 States Reporting
Note: Mississippi and South Dakota did not report
21
4 5
18
0
5
10
15
20
25
0 .1-1 .5-.9 1+
Only 18 states
fund one or more
dedicated
position(s) to
administer
problem gambling
programs.

Number of FTE Dedicated to PGS 34 NCPG Affiliates Reporting
9
11
8
6
0
2
4
6
8
10
12
0 .1 to 1 2 to 5 5+
Note: Some respondents counted volunteer board members as staff, other did not.

Problem Gambling Help Lines
2013 APGSA & NCPG Affiliate Surveys

For service to be included must be operationally standardized. Web=online live chat
0%
10%
20%
30%
40%
50%
60%
70%
80%
90%
100%
% o
f S
tate
s
Helpline Services

Helpline Call Volume
On average, 15% of calls are for help ranging from 4% (MI) to 73% (IA)
0
5,000
10,000
15,000
20,000
25,000
30,000
35,000
AR
AZ
CA
CT
DE FL IA IN KS
KY
LA
MA
MD MI
MN
MO MS
NC
NE
NJ
NM
NV
NY
OH
OK
OR
PA
SC TN VT
WA
WI
WV
Ave
rage
total calls
calls for help

Calls for Help Compared to Tx Enrollments
FY13 Calls for help FY13 Treatment Enrollment
Note: Treatment includes programs that are sponsored by both affiliates and states
0
1,000
2,000
3,000
4,000
5,000
6,000
AZ
CA
CT
DE
FL IA IN KS
KY
LA
MA
MD MI
MN
MO MS
NC
NE
NJ
NM
NV
NY
OK
OH
OR
PA
SC TN VT
WI
WV
In U.S., about four times as
many persons call for help
(37,541) than enroll in
treatment (10,192)

1. Gambling treatment utilization __Yes __No
2. Number of types of gambling
3. Gambling revenue
4. Number of EMGs
__Yes __No
__Yes __No
__Yes __No
X
X
X
X
Are the Number PG Helpline Calls for
Help Significantly Correlated with . . .
5. Number of problem gamblers
__Yes __No X

Relationship between Estimated Number of
Problem Gamblers in a State and Calls for Help
0
1,000
2,000
3,000
4,000
5,000
6,000
0 100,000 200,000 300,000 400,000 500,000 600,000 700,000
# o
f C
alls
for
Help
Estimated # of Problem Gamblers
Relationship statistically significant.

Relationship between Number of Types of
Legalized Gambling and Helpline Call Volume
0
1,000
2,000
3,000
4,000
5,000
6,000
0 1 2 3 4 5 6 7 8
# o
f C
alls
for
Help
# of Types of Legalized Gambling

Treatment System
2013 APGSA & NCPG Affiliate Surveys

Levels of Care
Includes only those states offering publicly funded gambling treatment and reported on levels of care (N = 29)
0%
10%
20%
30%
40%
50%
60%
70%
80%
90%
100%
Min. Inter. Outpatient IOP Residential

FY 2012 Numbers Treated with PG Funds
0
200
400
600
800
1,000
1,200
1,400
1,600
1,800
AR
AZ
CA
CT
DE
FL IA IN KS
LA
MN
MO
MT
NC
ND
NE
NJ
NM
NV
NY
OH
OK
OR
PA RI
TN
WA
WV
# Treated through Affiliates # Treated through Residential # Treated Through Outpatient
Note: MA & IL provide publicly funded gambling treatment, declined to report numbers. WA affiliate provides residential
treatment (n=16)

Enrollment Changes
“Over the past year, has the number of consumers receiving outpatient
publicly funded gambling treatment increased, decreased, stayed the same?”
2010 2013
Increased Decreased Stayed the Same
Total Enrollments 2010 = 10,930 Total Enrollment 2013 = 10,387

1. Calls to Helpline __Yes __No
2. Number of EMGs in state
3. Gambling revenue
4. Number of problem gamblers
__Yes __No
__Yes __No
__Yes __No
X
X
X
X
Are the Number of Persons Treated
Significantly Correlated with . . . . .
5. State PGS Budget __Yes __No X

Relationship between Funding and
Gambling Treatment Utilization
.
0
200
400
600
800
1,000
1,200
1,400
1,600
1,800
$0 $2,000,000 $4,000,000 $6,000,000 $8,000,000 $10,000,000
Nu
mb
ers
Tre
ate
d
Funding FY12-13
Total funding for FY 12-13 is significantly correlated with numbers served, with p=.0008 and r=.6290.
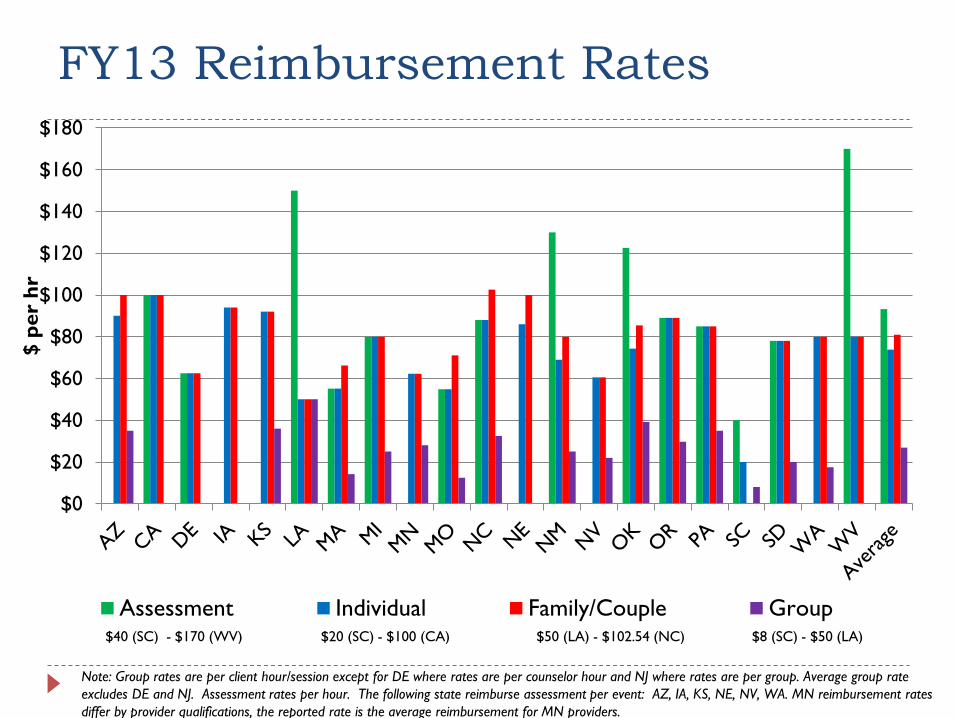
FY13 Reimbursement Rates
Note: Group rates are per client hour/session except for DE where rates are per counselor hour and NJ where rates are per group. Average group rate
excludes DE and NJ. Assessment rates per hour. The following state reimburse assessment per event: AZ, IA, KS, NE, NV, WA. MN reimbursement rates
differ by provider qualifications, the reported rate is the average reimbursement for MN providers.
$0
$20
$40
$60
$80
$100
$120
$140
$160
$180
$ p
er
hr
Assessment Individual Family/Couple Group$40 (SC) - $170 (WV) $20 (SC) - $100 (CA) $50 (LA) - $102.54 (NC) $8 (SC) - $50 (LA)

Cost Containment Measures
2013 Survey of State Agencies Providing Problem Gambling Services; Duration Cap includes only those states reporting a maximum
treatment duration of less than one year.
0%
10%
20%
30%
40%
50%
60%
70%
80%
90%
100%
Must Meet DSM
criteria
Primary
Diagnosis PG
Related
Allows Co-Pays Session Cap Duration Cap

Policy Issues
2013 APGSA & NCPG Affiliate Surveys

Identified Gaps in Services
“What is you state’s largest gap in problem gambling services?”
0% 10% 20% 30% 40% 50% 60% 70% 80% 90% 100%
Inadequate Funding
Poor Public Awareness
Poor Support System
Inadequate Problem Gambling Prevention Effort
Poor Treatment Access
Lack of Useful Research
Poor Service Evaluation System
Other
State Affiliate
32 APGSA responses (7 refusals); 34 NCPG affiliates responses

Infrastructure Needs
0 = no need, 3 = somewhat needed, 5 = critically needed
0.00 1.00 2.00 3.00 4.00
Increase Prevention…
Increase Treatment Providers
Improve Research
Improved IMS
Increase Admin Staff
Improve National…
Increase Technical Assistance
Collaboration with Gaming…
Collaboration with Other…
Improve Admin Structure
Improved HelplineState
Affiliate
Project Sponsors and Contact Information
For more information
about APGSA contact:
For more information
about NCPG contact:
Mark Vander Linden, MSW
Keith Whyte
Primary Investigator:
Jeffrey J. Marotta, Ph.D.
503 706-1197