the national treasury and planning
TRANSCRIPT

THE NATIONAL TREASURY AND PLANNING
PUBLIC DEBT MANAGEMENT REPORT
2020/2021
SEPTEMBER 2021

1
TABLE OF CONTENTS
TABLE OF CONTENTS ................................................................................................................ 1
LIST OF FIGURES ........................................................................................................................ 5
LIST OF TABLES .......................................................................................................................... 6
ACKNOWLEDGEMENT .............................................................................................................. 9
ABBREVIATIONS AND ACRONYMS ..................................................................................... 10
EXECUTIVE SUMMARY .......................................................................................................... 12
CHAPTER ONE ........................................................................................................................... 14
LEGAL AND INSTITUTIONAL SET UP FOR PUBLIC DEBT MANAGEMENT ................. 14
1.1 Legal Framework ...................................................................................................... 14
1.2 Institutional Framework ............................................................................................ 15
1.3 Organizational Structure of Public Debt Management Office .................................. 16
1.4 Relationship of PDMO with other Agencies............................................................. 16
1.5 Human Resources and Capacity Building ................................................................. 17
CHAPTER TWO .......................................................................................................................... 19
DEBT MARKET REFORMS....................................................................................................... 19
2.1 Introduction ............................................................................................................... 19
2.2 Domestic debt market reforms .................................................................................. 19
2.2.1 Enhancement of market infrastructure ............................................................... 19
2.2.2 Enhancement of the market structure ................................................................ 20
2.2.3 Product enhancement initiative .......................................................................... 20
2.3 Cross-cutting reforms in the management of external and domestic debt ................ 20
2.3.1 Government Sinking Fund ................................................................................. 20
2.3.2 Investor Relations Unit (IRU) ............................................................................ 21
CHAPTER THREE ...................................................................................................................... 22
RISK MANAGEMENT FRAMEWORK FOR PUBLIC DEBT ................................................. 22
3.1 Risk management framework ................................................................................... 22
3.2 Risk register............................................................................................................... 22
3.3 Risk assessment ......................................................................................................... 22
3.4 Risk classification ..................................................................................................... 24
CHAPTER FOUR ......................................................................................................................... 25

2
GOVERNMENT FISCAL DEFICIT FINANCING AND PUBLIC DEBT ................................ 25
4.1 Economy.................................................................................................................... 25
4.2 Fiscal Balance ........................................................................................................... 25
4.3 Exchange Rate ........................................................................................................... 27
4.4 Short-term interest rates ............................................................................................ 27
4.5 Total Public Debt ...................................................................................................... 28
4.6 Debt Service .............................................................................................................. 30
4.7 Debt Growth Ratios ................................................................................................... 32
CHAPTER FIVE .......................................................................................................................... 34
DOMESTIC DEBT ....................................................................................................................... 34
5.1 Domestic Debt Stock ................................................................................................. 34
5.2 Domestic Debt by Instrument ................................................................................... 35
5.3 Domestic Debt by Holder .......................................................................................... 35
5.4 Treasury Bills by Holder ........................................................................................... 37
5.5 Treasury Bonds by Holder ........................................................................................ 38
5.6 Treasury Bills and Treasury Bonds by Tenor ........................................................... 38
5.7 Treasury Bills and Bonds by Time to Maturity......................................................... 39
5.8 Average Interest Rates on Treasury Bills .................................................................. 40
5.9 Government Securities Trading ................................................................................ 40
5.10 Government Securities Yield Curve ......................................................................... 41
5.11 Interest Payments on Domestic Debt ........................................................................ 42
CHAPTER SIX ............................................................................................................................. 44
EXTERNAL DEBT ...................................................................................................................... 44
6.1 Public external debt ................................................................................................... 44
6.1.1 Classification of external debt by creditor category .......................................... 44
6.1.2 Classification by Major Creditor ....................................................................... 45
6.1.3 Classification by Currency ................................................................................. 46
6.1.4 Maturity Structure of external debt .................................................................... 46
6.2 External Debt Service................................................................................................ 47
6.3 Average Terms of New External Loan Commitments .............................................. 48
6.4 External Loans Disbursements .................................................................................. 48
6.5 Publicly Guaranteed Debt ......................................................................................... 49

3
CHAPTER SEVEN ...................................................................................................................... 50
PUBLIC NON-GUARANTEED DEBT....................................................................................... 50
7.1 Public sector non-guaranteed debt ............................................................................ 50
7.2 Composition of non-guaranteed Loans ..................................................................... 50
7.3 Stock of non-guaranteed Loans ................................................................................. 51
7.4 Maturity Structure of non-guaranteed loans.............................................................. 52
CHAPTER EIGHT ....................................................................................................................... 53
FISCAL COMMITMENTS AND CONTINGENT LIABILITIES ............................................. 53
8.1 Introduction ............................................................................................................... 53
8.2 Government support measures with potential fiscal risks issued to existing PPP
projects ................................................................................................................................. 53
CHAPTER NINE .......................................................................................................................... 55
ON-LENT LOANS ....................................................................................................................... 55
9.1 Introduction ............................................................................................................... 55
9.2 Stock of On-Lent Loans ............................................................................................ 55
9.3 On-Lent Loans (Arrears) ........................................................................................... 56
9.4 Receipts from On-Lent Loans ................................................................................... 57
CHAPTER TEN............................................................................................................................ 58
DEBT SUSTAINABILITY ANALYSIS ..................................................................................... 58
10.1 Introduction ............................................................................................................... 58
10.2 Assumptions of the Debt Sustainability Analysis ..................................................... 58
10.3 Country Classification ............................................................................................... 58
10.4 Scenario Stress Tests ................................................................................................. 58
10.5 External Debt Sustainability...................................................................................... 59
10.6 Public Debt Sustainability ......................................................................................... 59
10.7 Debt Sustainability Analysis Findings ...................................................................... 59
CHAPTER ELEVEN .................................................................................................................... 61
DEBT MANAGEMENT STRATEGY ........................................................................................ 61
11.1 Introduction ............................................................................................................... 61
11.2 Review of implementation of 2020 MTDS ............................................................... 61
11.3 Cost and risk characteristics of public debt ............................................................... 62
CHAPTER TWELVE ................................................................................................................... 64
OUTLOOK FOR THE MEDIUM TERM .................................................................................... 64
12.1 Public Debt Stock ...................................................................................................... 64

4
12.2 Debt Service .............................................................................................................. 65
ANNEXES .................................................................................................................................... 67
Annex 1: Public Private Partnership (PPP) Projects with effective Project Agreements or
Power Purchase Agreements (PPAs) – Kenya, Government’s Support Measures and
Termination Terms............................................................................................................... 67
Annex 2: List of state owned enterprises with non-guaranteed loans ................................. 77
5
LIST OF FIGURES
Figure 4.2-1: Fiscal deficit, deficit as a percentage of revenue, public debt and GDP ............ 26
Figure 4.3-1 End June Exchange rate of Kenya Shilling against selected Currencies ............ 27
Figure 4.4-1: Comparative short-term interest rates between July 2020 and June 2021 ......... 28
Figure 4.5-1: Kenya’s public and publicly guaranteed debt stock: June 2015-2021 (Kshs
Millions) ................................................................................................................................... 30
Figure 4.6-1: Total Public Debt Service (Kshs million) .......................................................... 32
Figure 4.7-1: Revenue, Debt and Fiscal Deficit as percent of GDP ........................................ 33
Figure 5.2-1: Domestic Debt by Instruments ........................................................................... 35
Figure 5.3-1: Outstanding Domestic Debt Stock by Holders .................................................. 37
Table 5.4-1: Outstanding Stock of Treasury Bills by Holder (Kshs million) .......................... 37
Figure 5.6-1: Government Domestic Debt Securities by Tenor .............................................. 39
Figure 5.7-1: Average Time to Maturity of Treasury Bonds ................................................... 39
Figure 5.8-1: Average Interest Rates and spreads on Treasury Bills: Fiscal Year 2020/21 .... 40
Figure 5.9-1: Annual Treasury Bonds Trading, June 2010-June 2021 .................................... 41
Figure 5.10-1: Government of Kenya Securities Yield Curve, June 2021 .............................. 42
Figure 6.1-1: External Debt by Creditor Type (Kshs Million) ................................................ 45
Figure 6.1-2: Classification by Major Creditors ...................................................................... 45
Figure 6.1-3: Currency composition of External Debt end June 2021 .................................... 46
Figure 7.2-1: Composition of non-guaranteed debt ................................................................. 50
Figure 7.3-1: Stock of non-guaranteed Loans in (Kshs millions) ............................................ 51

6
LIST OF TABLES
Table 3.3-1: Qualitative risk assessment matrix ...................................................................... 23
Table 4.2-1: Kenya Financing Fiscal Balance (Kshs million) ................................................. 26
Table 4.5-1: Trends in Kenya’s Total Public Debt in (Kshs million) ...................................... 29
Table 4.6-1: Total Public Debt Service (Kshs million) ........................................................... 31
Table 4.7-1: Revenue, Debt and Fiscal Deficit as percentages of GDP .................................. 33
Table 5.1-1: Outstanding Domestic Debt (in Kshs million): June 2018 to June 2021 ............ 34
Table 5.3-1: Domestic Debt by Holder (Kshs Million) ........................................................... 36
Table 5.3-2: Outstanding Domestic Debt Stock by Holders (Kshs million) ........................... 36
Table 5.5-1: Outstanding Stock of Treasury Bonds by Holder (Kshs million) ....................... 38
Table 5.11-1: Interest Payments on Domestic Debt (Kshs Million) ........................................ 43
Table 6.1-1: External Debt by Creditor Type (Kshs Million) ................................................. 44
Table 6.1-2: Outstanding External Debt by Maturity Structure (percent) ............................... 47
Table 6.2-1: External Debt Service Payments by Creditor Category (Kshs million) .............. 47
Table 6.3-1: Average terms of new external loan commitments ............................................. 48
Table 6.4-1: External Loans Disbursements (Kshs million) .................................................... 48
Table 6.5-1: Stock of publicly guaranteed external debt by creditor category (Kshs millions)
.................................................................................................................................................. 49
Table 7.4-1: Maturity Structure of non-guaranteed loans ........................................................ 52
Table 8.2-1: Projects Issued with PRGs guaranteed SBLCs, Indemnity agreements .............. 54
Table 9.2-1: Stock of On-Lent Loans (By Sectors) in (Kshs. million) .................................... 55
Table 9.3-1: On-Lent Loans (Outstanding arrears by sectors) as at June 2021 (Kshs. million)
.................................................................................................................................................. 56
Table 9.4-1: Receipts from on-lent loans by End June 2021 (Kshs millions) ......................... 57
Table 10.5-1: External Debt Sustainability .............................................................................. 59
Table 10.6-1: Kenya’s Public debt sustainability .................................................................... 59
Table 11.2-1: MTDS targets against actual borrowing (Percent) ............................................ 62
Table 11.3-1: Kenya: Cost and risk indicators for existing debt, December 2020 .................. 63
Table 12.1-1: Projected Public Debt Stock in (Kshs Million) ................................................. 64
Table 12.2-1: Projected debt service (Kshs million) ............................................................... 66

7
FOREWORD
The preparation of the Annual Public Debt Management Report is underpinned by the legal
framework namely the Constitution and the Public Finance Management Act (PFMA), 2012 that
obligates reporting on public debt. The 2021 Annual Public Debt Management Report provides a
broad analysis of the developments in public debt and borrowing during the fiscal year 2020/2021.
The report covers the legal framework on public debt, public debt market reforms, the level of public
debt, non-guaranteed debt, on-lent loans, status of implementation of the Medium-Term Debt
Management Strategy (MTDS) 2020 and evaluates the outcome of the recent Debt Sustainability
Analysis (DSA). The report includes the movement in structure of public debt and debt service
obligations within the period.
The total public and publicly guaranteed debt increased from Kshs 6.7 trillion in June 2020 to Kshs
7.7 trillion in June 2021 equivalent to 69.3 percent of GDP. As at June 2021, the total Public Debt
comprised of 52.2 percent external and 47.8 percent domestic debt. External debt is majorly from
multilateral creditors on concessional terms. However, analysis of the public debt portfolio shows that
commercial borrowing has adversely affected the cost and risk profile of the current debt. The average
maturity period, grace period and average interest rate on new external loan commitments were 23
years, 7 years and 2.1 percent respectively. The COVID-19 pandemic and containment measures
placed financial strain on the economy and heightened the need for borrowing thus raising public debt
levels. Nevertheless, this was within the country’s sustainable margins and is projected to be better
with the global management of the pandemic. The National Treasury and Planning is further pursuing
a fiscal consolidation policy path that aims at reducing the velocity of debt accumulation.
The National Treasury and Planning is working closely with the Central Bank of Kenya (CBK),
Kenya Bankers’ Association (KBA) and the Capital Markets Authority (CMA) among other
stakeholders in improving operational efficiency within the domestic debt market. Specifically, The
National Treasury and Planning is spearheading the implementation of Over-The-Counter (OTC)
platforms and the establishing a new Central Securities Depositories (CSD) in collaboration with the
Central Bank of Kenya. The CSD is set to improve liquidity in the debt market. Additionally, an
Investor Relations Unit (IRU) has been established within the Public Debt Management Office
(PDMO) which will coordinate the management of investors. The Unit will further increase
transparency and provide accurate market information to investors. The PDMO has further advanced
other reforms in the financial markets that are being implemented in collaboration with other key
stakeholders.

8
The government has further demonstrated its commitment to providing accurate and timely debt
information to the public and as such the contents of this report will provide insights into the size,
structure and dynamics of public debt management in Kenya.
HON. (AMB.) UKUR K. YATTANI, EGH
CABINET SECRETARY/THE NATIONAL TREASURY AND PLANNING
9
ACKNOWLEDGEMENT
The 2021 Annual Public Debt Report prepared by the National Treasury and Planning
presents major developments in Kenya’s public debt for the FY 2020/21.
Prudent public debt management is critical for all economies especially those classified as
developing. Most of these countries have weak institutional arrangements for public debt
management. In 2003, the National Treasury embarked on a reform agenda to strengthen
public debt management by pursuing a 5-year reform program. The reforms involved
streamlining public debt management processes and building capacity to perform functions in
line with international best practice. Progressively, the reforms are bearing fruit and the
government is committed towards achievement of full benefits that are likely to accrue from
the new approach to debt management.
This report is produced for public utility and disseminated to relevant entities. This report
marks the fifteenth issue since the resumption of publication in 2006. The report underscores
the importance of the existing legal and institutional framework for Public Debt
Management. This necessitates fundamental changes in the current structural set up to reflect
legal demands in the Public Finance Management Act 2012. The envisaged changes include
the actualization the delegated authority instrument by the Cabinet Secretary conferring to
PDMO the operational independence as well as establishment of the sinking fund guidelines.
The institutional capacity for public debt management has significantly increased but the
challenge remains how such capacity can be utilised for posterity. Continued capacity
building will be critical in nurturing skills required in the new dispensation so that PDMO is
able to deliver on the expanded mandate of ensuring prudent borrowing by both the Central
and County Governments.
I wish to recognize the role played by the Public Debt Management Office in coordinating
the production of this report. This report and other similar publications on public debt are
available for reference in the National Treasury website: www.treasury.go.ke.
JULIUS MUIA, PhD, CBS
PRINCIPAL SECRETARY/NATIONAL TREASURY
10
ABBREVIATIONS AND ACRONYMS
AfDB African Development Bank
A-I-A Appropriation in Aid
ATM Average Time to Maturity
BPS Budget Policy Statement
CBK Central Bank of Kenya
CBR Central Bank Rates
CI Composite Index
CMA Capital Markets Authority
COB Controller of Budget
COVID-19 Coronavirus Disease 2019
CRA Commission on Revenue Allocation
CSD Central Securities Depositories
CUB Committed Undisbursed Balance
DPO Development Policy Operations
DPS&RM Debt Policy, Strategy and Risk Management Department
DSA Debt Sustainability Analysis
EAPC East African Portland Cement
EAPCC East African Portland Cement
EBR Economic Budget Review
ECF Extended Credit Facility
EFF Extended Fund Facility
FCCL Fiscal Commitments and Contingent Liabilities
FY Financial year
GBP Sterling Pound
GDP Gross Domestic Product
GoK Government of Kenya
IBEC Intergovernmental Budget and Economic Council
IDA International Development Association
IFB Infrastructure Bond
IMF International Monetary Fund
IRU Investor Relations Unit
ISB International Sovereign Bond
JKUAT Jomo Kenyatta University of Advanced Technology
KAA Kenya Airports Authority
KBA Kenya Bankers’ Association
KBC Kenya Broadcasting Corporation
KenGen Kenya Electricity Generating Company
KMC Kenya Meat Commission
KPC Kenya Pipeline Company
KPLC Kenya Power and Lighting Company
KU Kenyatta University
MCDAs Ministries, Counties, Departments and Government Agencies
MSMEs Micro, Small and Medium Enterprises
MTDS Medium Term Debt Management Strategy

11
NBFI Non-Bank Financial Institution
NSE Nairobi Securities Exchange
NSSF National Social Security Fund
OAG Office of the Auditor General
OTC Over-The-Counter
PCK Postal Corporation Of Kenya
PDMO Public Debt Management Office
PFF Project Facilitation Fund
PFMA Public Finance Management Act
PPA Power Purchase Agreements
PPG Public and Publicly Guaranteed
PPP Public Private Partnership
PPPs Public-Private Partnerships
PRG Partial Risk Guarantees
PV Present Value
Q4 Quarter four
QEBR Quarterly Economic Budget Review
SBLC Stand By letter of Credit
SGR Standard Gauge Railway
SLB Securities Lending and Borrowing
SOEs State Owned Enterprises
T-Bills Treasury Bills
TDS Total Debt Service
TEDS Total External Debt Service
TMD Treasury Mobile Direct
UON University of Nairobi
USD United States Dollar

12
EXECUTIVE SUMMARY
The COVID-19 global pandemic has affected Kenya’s economy consequently slowing down
its development prospects. However, amid this global health crisis, the economy has
remained relatively stable moving towards the path to recovery. By March 2020, the
economy had already started feeling the effects of the pandemic. The economy contracted by
0.6 percent in 2020 against a growth of 5.4 percent in 2019.
The outstanding public and publicly guaranteed debt has been growing steadily over the
years. As at end June 2021, the national government debt was Kshs 7,744,383 million rising
from Kshs 6,693,338 million in June 2020. The debt to GDP ratio increased from 65.8
percent in June 2020 to 69.3 percent in June 2021. External debt to GDP ratio rose from 34.4
percent in June 2020 to 36.2 percent in June 2021, while domestic debt as a percentage of
GDP was at 33.1 percent in June 2021 rising from 31.2 percent in June 2020. The ratio of
debt service to revenue increased from 41.4 percent in June 2020 to 50.0 percent in June
2021. Treasury bills and bonds are the main instruments for contracting domestic debt.
Treasury bonds accounted for 77.1 percent of total domestic debt while treasury bills share
was 20.7 percent. Commercial banks are the main holders of domestic debt at 49.1 percent
while non-banking institutions hold 48.5 percent. Reforms in domestic debt market have
improved market liquidity and broadened investor base. Secondary market trading for
government securities rose from Kshs. 513,300 million in June 2020 to Kshs. 637,000 million
in June 2021.
The government is making every effort to minimize the exchange rate exposure on external
debt. The proportion of external debt held in US Dollar (USD) declined from 67.3 percent in
June 2020 to 66.0 percent in June 2021. The share of external debt in Euro rose to 19.4
percent as at end June 2021 from 18.0 percent in June 2020. As at end June 2021, 6.3 percent
of external debt was denominated in Japanese Yen, 5.6 percent in Yuan, 2.5 percent in
Sterling Pounds while other currencies accounted for 0.2 percent.
The stock of on-lent loans increased from Kshs 867,005 million in June 2020 to Kshs
921,930 million as at end June 2021. Public non-guaranteed debt contracted by State Owned
Enterprises (SOEs) was Kshs. 128,929 million as at end December 2020. This comprised
loans obtained from local banks and external creditors.

13
The PDMO is mandated under the PPP Act 2013 to assess the fiscal risks and contingent
liabilities associated with PPP projects. The government is yet to issue any direct debt
guarantees on PPP projects but provides an indemnity agreement to backstop Partial Risk
Guarantees (PRGs). As at end June 2021, the total PRGs covered by indemnity agreements
were Kshs 19,602 million. The government is committed to promoting the PPP mode of
financing to bridge the funding gap in an environment of competing development needs.
The recently conducted Debt Sustainability Analysis (DSA) revised the debt carrying
capacity from strong to medium signifying that the country’s debt remains sustainable but
with heightened risk of debt distress. The government commitment to fiscal consolidation,
implementation of debt reforms and promotion of local exports will improve debt ratios.
The 2020 MTDS set out to reduce refinancing risk by lengthening the maturity profile of debt
and increasing the uptake of concessional external loans. The strategy set the ratio of net
external financing to 60 percent and net domestic borrowing to 40 percent. Domestic
borrowing constitutes more treasury bonds than bills. The implementation of the debt
management strategy resulted in net domestic financing of 65.8 percent of total net financing
while net external borrowing was 34.2 percent as at end June, 2021. The ratio of treasury bills
to bonds was 21:79. Net borrowing to finance the fiscal deficit was Kshs 879.6 billion
comprising Kshs 323.3 billion external borrowing and Kshs 556.6 billion domestic
borrowing.
The PDMO is mandated under the PFMA,2012 to prepare and submit the annual public debt
management report to the Cabinet Secretary. The directorate is organised in three key
departments in accordance with the international best practice. The government has been
implementing reforms towards strengthening the institutional arrangements for public debt by
aligning functions to the relevant departments, promoting development of domestic debt
market and has established Investor Relations Unit to manage and coordinate investor
relations. The Unit will promote debt market transparency, increase investor base and
maintain prudent risk level of debt. Other ongoing reforms include development of Sinking
fund guidelines and partnering with the private sector in PPP initiatives.

14
CHAPTER ONE
LEGAL AND INSTITUTIONAL SET UP FOR PUBLIC DEBT
MANAGEMENT
1.1 Legal Framework
The legal framework for the management of public debt is contained in the Constitution of
Kenya 2010, the Public Finance Management Act (PFMA), 2012 and the PFMA Regulations,
2015. Section 214 (2) of the Constitution defines public debt as all financial obligations
attendant to loans raised or guaranteed and securities issued or guaranteed by the national
government. Section 201 of the Constitution stipulates principles that guide all aspects of
public finance management. The principles which apply to public borrowing and debt
management are as follows:
a) Openness and accountability in borrowing and management of public debt;
b) Promotion of an equitable society;
c) Equitable sharing of the burdens and benefits of the use of resources and public
borrowing between present and future generations;
d) Prudent and responsible use of public money; and
e) Responsible borrowing and management of public debt and accurate fiscal reporting.
The PFMA 2012 mandates the Cabinet Secretary responsible for Finance on behalf of the
national government to borrow or raise money from any reputable source for purposes of
economic management and development of the country. The Act also mandates the Cabinet
Secretary to guarantee loans of government entities and private institutions.
The legal provision in Section 62 of the PFMA 2012 establishes the PDMO within the
National Treasury the Public Debt Management Office with the following objectives. To:
a) Minimise the cost of public debt management and borrowing over the long-term
taking account of risk;
b) Promote the development of the market institutions for Government debt securities;
and,

15
c) Ensure the sharing of the benefits and costs of public debt between the current and
future generations.
The PFMA 2015 regulations require that PDMO prepares the annual debt management report
which shall include outstanding guarantees, outstanding lending and government
on-lending by Government. Other important reports prepared by PDMO include:
a) annual medium-term debt management strategy including debt sustainability analysis
in accordance with regulations;
b) Debt Statistical Bulletins;
c) prepare forecasts on Government debt servicing and disbursements as part of the
yearly budget preparation.
To operationalize key aspects of public debt management, Public Debt and Borrowing Policy
was developed and approved by the Cabinet in March 2020. The policy is anchored in the
Constitution, specifically the principles of public finance. It provides for a strong
accountability framework in borrowing and management of the public debt portfolio. The
policy also seeks to promote the development of the domestic market for Government debt
securities.
1.2 Institutional Framework
The institutional set up for managing public debt and borrowing includes the Parliament, the
Cabinet, the Cabinet Secretary responsible for Finance and the Public Debt Management
Office (PDMO). Parliament stands at the apex of governance structure for public debt
management. The role of parliament includes: enacting laws governing public debt
management; approving Annual Budget Estimates, Budget Policy Statement (BPS) and
MTDS; setting the public debt ceiling; annual government borrowing limit; setting borrowing
thresholds of both levels of government; approving government guarantees and providing
oversight on public debt management.
The Cabinet considers and approves various policy documents which include the public debt
and borrowing policy, the Annual Budget Estimates, BPS, MTDS and new projects in
accordance with the relevant laws and guidelines.
The Cabinet Secretary is mandated to borrow and issue sovereign guarantees on behalf of the
government. The responsibilities of the cabinet secretary are clearly defined in Section 46 of

16
the PFMA, 2012. However, this authority can be delegated to another National Treasury
official as per Sections 49 and 58 of the PFMA, 2012.
Section 62 of the PFMA,2012 establishes PDMO whilst Section 64 provides the operational
independence in the management of public debt and day-to-day operations of the office.
PDMO plays a critical role in the broader macroeconomic context for public policy. It
ensures that both the level and rate of growth in public debt is fundamentally sustainable and
can be serviced under a wide range of circumstances while meeting cost and risk objectives.
Likewise, PDMO provides an enabling environment for implementation of both fiscal and
monetary policy to impact government financing requirements and debt levels.
1.3 Organizational Structure of Public Debt Management Office
PDMO is one of the Directorates of the National Treasury, headed by a Director General who
reports to the Principal Secretary. It is organized in three (3) technical departments namely
the Resource Mobilization Department, Debt Policy, Strategy and Risk Management
Department, and Debt Recording and Settlement Department.
The Resource Mobilization Department is mandated to mobilize external and domestic
resources to bridge the budget deficit, prepare and implement the National Government
borrowing plan, undertake coordination and investor relations activities, process government
guarantees and ensure effective disbursement of borrowed funds.
The Debt Policy, Strategy and Risk Management Department undertakes portfolio analysis,
formulating the MTDS, producing several debt reports to comply with the statutory
requirements, handle fiscal commitments related to Public Private Partnerships (PPPs),
contingent liability management and coordinate domestic debt market development.
The Debt Recording and Settlement Department maintains a reliable debt database, process
debt service, settle debt obligations, reconcile debt records, monitor and report disbursement
of loans and grants, maintain and report public debt register including certification of the
level of the country's indebtedness.
1.4 Relationship of PDMO with other Agencies
PDMO interacts with other agencies in conducting its day-to-day operations. The key
agencies include; Ministries, Counties, Departments and Government Agencies (MCDAs),
lenders, development partners, investors and rating agencies.

17
PDMO monitors County Government debt operations, process guarantee requests and assists
County Governments on debt management and borrowing. The CBK acts as the Fiscal Agent
to the National Treasury, as well as the registrar of government domestic debt securities.
The Office of the Attorney General provides legal clearances and opinions on financial
contracts, framework agreements and Memoranda of Understanding (MOUs) as required by
the relevant laws. MCDAs participate in the loan negotiation process for financing projects
under their mandate and ensure compliance with all relevant laws governing optimal
utilization of proceeds from loans and grants. PDMO assess and advises on fiscal risks and
contingent liabilities associated with PPP projects.
Furthermore, PDMO collaborates with the Capital Market Authority (CMA) in developing a
robust and vibrant domestic debt market for Government securities. PDMO submits the
MTDS to the Commission on Revenue Allocation (CRA) and the Intergovernmental Budget
and Economic Council (IBEC) as required under the relevant laws.
The Office of the Auditor General (OAG) audits all public debt management operations in
accordance with the law. The Controller of Budget (COB) authorizes the withdrawal of funds
for debt management operations.
1.5 Human Resources and Capacity Building
Section 64(1) (c) of the PFMA,2012 states that the Cabinet Secretary shall ensure that the
Public Debt Management Office has the resources and skills to manage the debt and
borrowing according to international best practice.
The government has embarked on reform programs aimed at improving legal and institutional
structures, internal processes and tools to manage the debt portfolio. The National Treasury
commissioned a consultancy assignment to review the Functional Alignment and Institutional
Structure (FIAS) of PDMO to ensure functionality, effectiveness and better service delivery
on debt management matters. The report recommended reorganization of departments and
deployment of staff to relevant units including ensuring that they are properly capacitated.
Staffing and capacity development of PDMO is crucial to ensure it delivers its mandate
effectively. To achieve PDMO’s human resources and capacity development goals, Human
Resource Management is a key administrative function and continuous professional
development and training is essential for better debt management. Further, the evolution and
new developments in public debt management have widened the scope of analysis and

18
increased complexities in the outlook. Staff training and capacity development plans have
been developed to ensure consistency between overall organizational needs and staff
responsibilities and aspirations.

19
CHAPTER TWO
DEBT MARKET REFORMS
2.1 Introduction
The Government through the National Treasury continues to spearhead the implementation of
reforms to improve management of domestic and external debt. The aim is to ensure debt is
contracted at the least possible cost consistent with a prudent degree of risk while at the same
time promoting development of the debt market. The reforms identified for implementation
have been through collaborative partnerships among various stakeholders including
regulators, investors and other market players to support faster market development.
2.2 Domestic debt market reforms
The Government has identified a number of strategic reforms aimed at increasing domestic
market efficiency. The implementation of these reforms is at various stages.
2.2.1 Enhancement of market infrastructure
The purpose of this reform agenda is to automate processes at both primary and secondary
markets, including deployment of a new Central Securities Depository (CSD) system by the
CBK. This will reduce primary market auction cycle, create an efficient payment and
settlement system and provide convenient access to government securities by both
institutional and retail investors.
The National Treasury in collaboration with the CBK has implemented the Treasury Mobile
Direct (TMD) and the M-Akiba bond programs. The roll out of TMD enables retail investors
to bid in an automated platform for ease of accessing government securities. The National
Treasury and the CBK have drafted the auction rules consistent with the new technologies
and once finalized these rules will guide the primary market operations.
Plans are underway to automate the auction process for institutional investors through the
Bloomberg terminals and transfer of funds through internet banking. These efforts will lead
to eventual separation of the retail and institutional investors. Subsequently, institutional
investors will support the development of a strong base for primary dealers to improve
efficiency in the issuance of government securities.

20
2.2.2 Enhancement of the market structure
To increase liquidity, price discovery and transparency, the Over-The-Counter (OTC) trading
platform is being established to complement the exchange trading platform at the Nairobi
Securities Exchange (NSE).
Currently, only Treasury bills are trading OTC in T24 platform at CBK. However, a two-way
quote system is awaiting the procurement and implementation of the new CSD system.
2.2.3 Product enhancement initiative
The objective is to increase liquidity and promote use of government securities in the money
market. This will be achieved through restructuring the interbank repo to provide for transfer
of ownership of securities provided as collateral and introduction of Securities Lending and
Borrowing (SLB). Additionally, the CMA in collaboration with the National Treasury
amended laws and regulations to allow short selling and revised the master repurchase
agreement to allow transfer of ownership of encumbered security. Once the new CSD system
is in place the reform will be fully implemented.
The issuance of fewer but large size benchmark bonds at the primary market will continue to
foster market liquidity and the development of the benchmark yield curve. The Government
has continued to implement the benchmark bond program. The benchmark program becomes
critical as it ensures concentration of liquidity around benchmark bonds and improves the
management of debt portfolio. The benchmark bond program is ongoing and has largely been
successful.
2.3 Cross-cutting reforms in the management of external and domestic debt
2.3.1 Government Sinking Fund
Regulation 206(1) of the Public Finance Management Regulations, 2015, establishes the
Government Sinking Fund to be used for redemption of loans and government securities. The
National Treasury has developed draft guidelines for the operationalization of the Sinking
Fund and subsequently gazetted them. Upon completion of the ongoing public review process
the fund will be implemented by the National Treasury.

21
2.3.2 Investor Relations Unit (IRU)
The government through the National Treasury has initiated sustained engagement forums
with market regulators, investors and market players. These players are instrumental to the
growth of the domestic debt market and enhancement of visibility in the debt capital markets.
In September 2020, an Investor Relations Unit (IRU) was established at PDMO and is
responsible for both Investor Relations and Donor Co-ordination. The IRU is committed to
providing quality and verified information to the general public and financial markets on
government borrowing and debt. The IRU intends to improve communication with investors
through information dissemination, transparency and accountability for better decision
making. The IRU website ([email protected]) provides investors with a single-entry point to
a wide range of information disseminated by the government.

22
CHAPTER THREE
RISK MANAGEMENT FRAMEWORK FOR PUBLIC DEBT
3.1 Risk management framework
The government has made tremendous steps in the management of risks related to public
debt. The National Treasury is in the process of developing a risk management framework
that sets out how risks associated with debt are identified, quantified and mitigated. The
concept of risk management refers to the process of identifying, analysing and mitigating
risks that threaten the achievement of objectives of an institution. It involves maximization
of upside potential and minimizing the consequences of negative events.
There are many types of risks associated with debt which include; operational risk, market
risk, default risk, liquidity risk among others. Other risks may be exogenous and therefore
determined outside the institution.
3.2 Risk register
The National Treasury has proposed to maintain a dynamic risk register which shall be
updated on an ongoing basis. Each functional unit shall be required to maintain a risk register
of risks they are better placed to manage. Every risk shall have a risk owner identified and
recorded in the risk register. The owner will assume ultimate responsibility and
implementation of the proposed actions to minimize adverse effects. In order to develop and
nurture a risk sensitive culture in PDMO, staff will adopt values and norms that are consistent
with the acceptable risk tolerance levels.
3.3 Risk assessment
The criteria to measure risk is computed in terms of impact and probability. This is because
risks arise from uncertain events or actions that lead to non-achievement of the stated
objectives. The risk management framework sets out a clear outline on how risk ratings,
rankings, descriptions and timelines are determined and recommends the actions necessary to
mitigate the adverse effects of the risk.
Risk management and governance are of paramount importance to the National Treasury in
view of the decision criteria that policy makers use in determining the level and magnitude of
debt. The PDMO through the DPS&RM will provide the overall direction to the risk

23
management processes and make periodic reports and recommendations to the Cabinet
Secretary. Table 3.3-1 shows the risk assessment matrix commonly used in qualitative
evaluation.
Table 3.3-1: Qualitative risk assessment matrix
Risk Likelihood Impact Mitigation Plan Limitations
Cost High High Contingent cost variation Set cost variation limits by law
Performance Low High Performance guarantee Issued by non-reputable banks
which may fail to honour its
obligations
Operational Low High Division of labour Too much interdependence
Market Low High Advertising, improve service
delivery to curb competition
Competition from other service
providers
Governance Medium Medium Guiding policies Operationalization of developed
policies
Strategic High High Design new strategy
conforming to new
developments
Operationalization of new strategies
Legal Medium Medium Repeal / amend laws to suit
project
slow adjudication of cases
External
Hazards
Medium High Preparedness and response
actions
management of response strategies
Government losses arising from inadequate operational controls should be managed
according to sound business practices, including well-articulated responsibilities for staff and
clear monitoring and control policies and reporting arrangements. DPS&RM department is
mandated to monitor and review significant operational and enterprise-wide risks associated
with debt operations.
The hallmark of prudent debt management is the existence of an accurate and comprehensive
management information system with proper safeguards. Staff involved in debt management
should be remunerated commensurate with the prevailing risk levels. Likewise, PDMO will
develop sound business recovery procedures manual to be used to streamline and standardise
operations lending debt management activities to audit process which is an essential part of
enhancing debt transparency.

24
3.4 Risk classification
Risk classification is based on the duration of occurrence and hence defined as near term if
they are within one year, medium-term if they occur between one to three years and long-
term if they occur beyond three years. Risks whose potential of occurrence is high should be
identified and suitable measures put in place to alleviate their effects. However, near-term
risks require urgent but careful planning on priority basis compared to either medium or long-
term risks. The likelihood of occurrence of risks therefore becomes a standard yardstick upon
which appropriate mitigation measures are anchored.
For any risk management framework to achieve reliability in debt management operations, it
must adopt a two-thronged approach namely qualitative and quantitative. This is mainly
because of the nature of risks inherent in debt management strategies employed at different
levels. Whereas risks take different forms and magnitude as a result of a common stimuli, it is
necessary to disaggregate the causal effects in order to have a better understanding of the
source of the risk and therefore apply the relevant counter strategies.

25
CHAPTER FOUR
GOVERNMENT FISCAL DEFICIT FINANCING AND PUBLIC
DEBT
4.1 Economy
The COVID-19 pandemic and containment measures have devastated global economies thus
disrupting businesses and livelihoods both internationally and locally. As a result, global
economy is estimated to have contracted by 3.2 percent in 2020 from a growth of 2.8 percent
in 2019. Consequently, Kenya’s economy was estimated to have contracted by 0.6 percent in
2020 against the growth of 5.4 percent in 2019. This was mainly because of the contraction of
the tertiary sector by 3.5 percent.
Year-on-year overall inflation rate remained low, stable and within the government target
range of 5+/-2.5 percent since end of 2017. Similarly, the overall annual average inflation
remained within the government target range at 5.3 percent in June 2021 compared to the 5.5
percent recorded in June 2020.
Short-term interest rates remained relatively low and stable. The Central Bank Rate (CBR)
was retained at 7.0 percent to support lower lending rates in order to facilitate credit access
by borrowers especially the Micro, Small and Medium Enterprises (MSMEs). The money
market was relatively liquid in June 2021 supported by government payments. As such, the
interbank rate remained low improving liquidity in the money market resulting in stable
commercial bank rates.
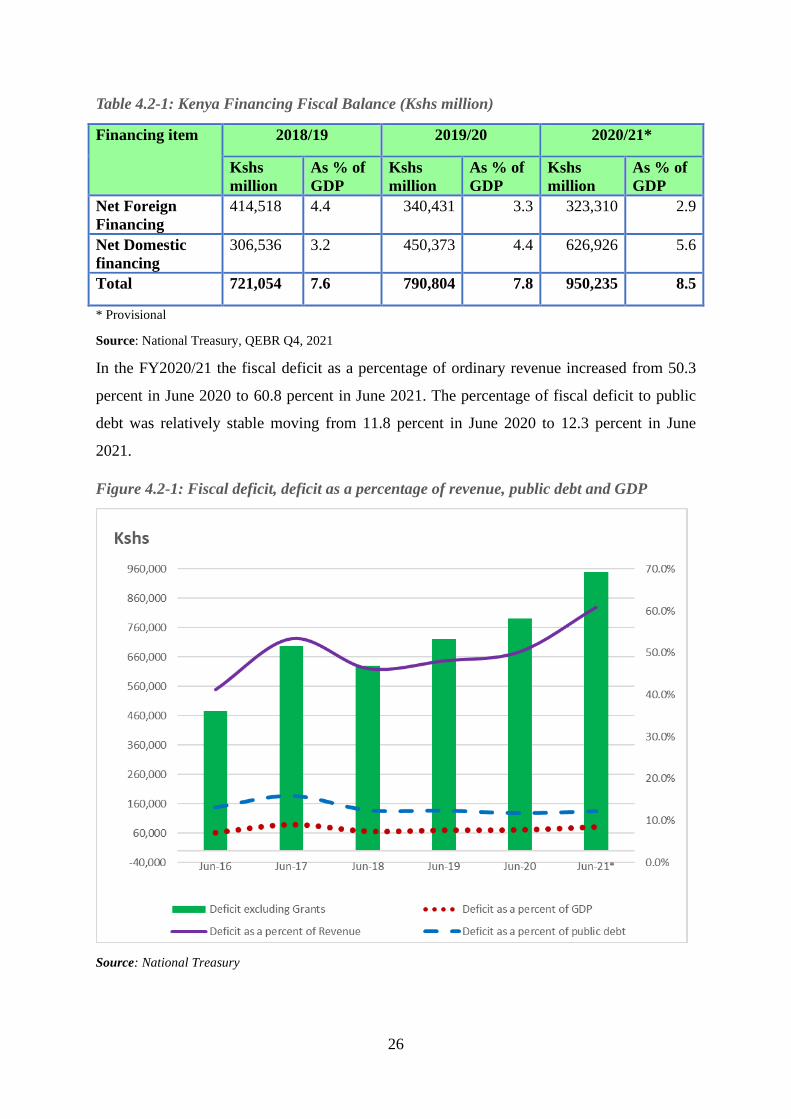
4.2 Fiscal Balance
The actual fiscal balance for the FY 2020/21 amounted to Kshs 950,235 million equivalent to
8.5 percent of GDP against the FY 2019/20 Kshs 790,804 million (7.8 percent of GDP). The
fiscal balance on a commitment basis including grants was below the target deficit of 8.7
percent of GDP (Table 4.2-1). The government is implementing fiscal consolidation which
aims at achieving a deficit of 3.0 percent of GDP in the medium term.
26
Table 4.2-1: Kenya Financing Fiscal Balance (Kshs million)
Financing item 2018/19 2019/20 2020/21*
Kshs
million
As % of
GDP
Kshs
million
As % of
GDP
Kshs
million
As % of
GDP
Net Foreign
Financing
414,518 4.4 340,431 3.3 323,310 2.9
Net Domestic
financing
306,536 3.2 450,373 4.4 626,926 5.6
Total 721,054 7.6 790,804 7.8 950,235 8.5
* Provisional
Source: National Treasury, QEBR Q4, 2021
In the FY2020/21 the fiscal deficit as a percentage of ordinary revenue increased from 50.3
percent in June 2020 to 60.8 percent in June 2021. The percentage of fiscal deficit to public
debt was relatively stable moving from 11.8 percent in June 2020 to 12.3 percent in June
2021.
Figure 4.2-1: Fiscal deficit, deficit as a percentage of revenue, public debt and GDP
Source: National Treasury
27
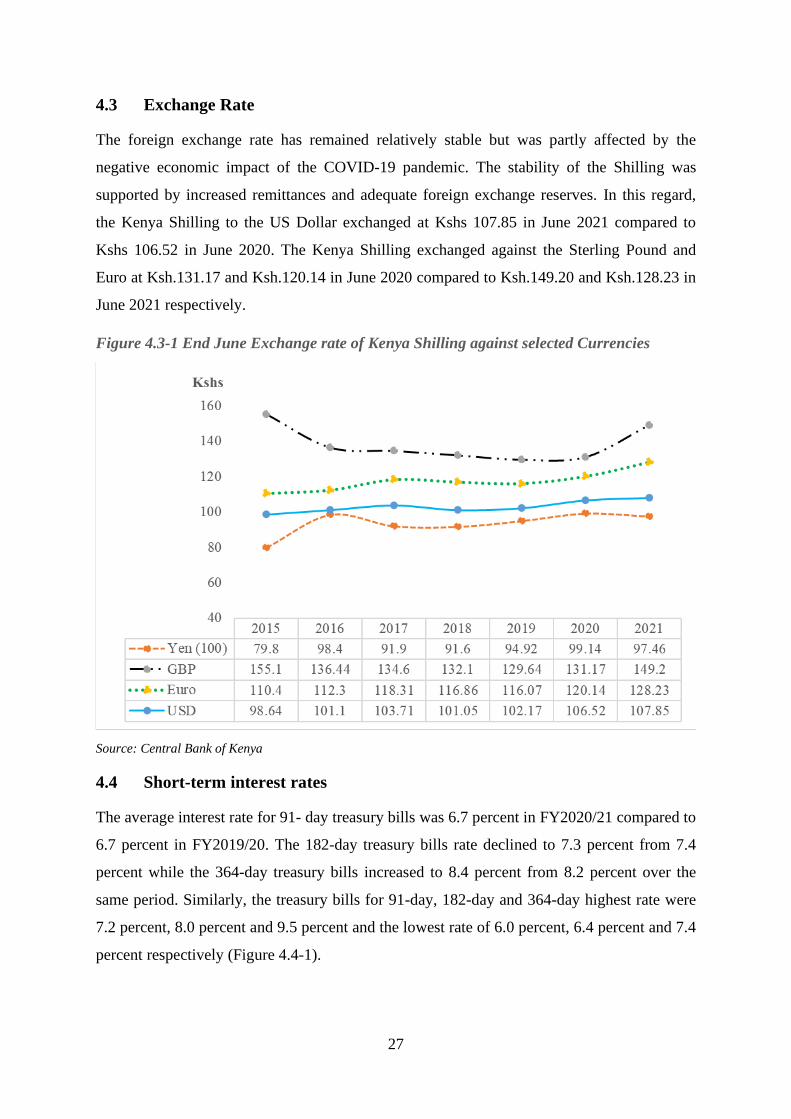
4.3 Exchange Rate
The foreign exchange rate has remained relatively stable but was partly affected by the
negative economic impact of the COVID-19 pandemic. The stability of the Shilling was
supported by increased remittances and adequate foreign exchange reserves. In this regard,
the Kenya Shilling to the US Dollar exchanged at Kshs 107.85 in June 2021 compared to
Kshs 106.52 in June 2020. The Kenya Shilling exchanged against the Sterling Pound and
Euro at Ksh.131.17 and Ksh.120.14 in June 2020 compared to Ksh.149.20 and Ksh.128.23 in
June 2021 respectively.
Figure 4.3-1 End June Exchange rate of Kenya Shilling against selected Currencies
Source: Central Bank of Kenya
4.4 Short-term interest rates
The average interest rate for 91- day treasury bills was 6.7 percent in FY2020/21 compared to
6.7 percent in FY2019/20. The 182-day treasury bills rate declined to 7.3 percent from 7.4
percent while the 364-day treasury bills increased to 8.4 percent from 8.2 percent over the
same period. Similarly, the treasury bills for 91-day, 182-day and 364-day highest rate were
7.2 percent, 8.0 percent and 9.5 percent and the lowest rate of 6.0 percent, 6.4 percent and 7.4
percent respectively (Figure 4.4-1).

28
The interbank rate remained low but increased slightly to 4.6 percent in June 2021 from 3.3
percent in June 2020. The improved liquidity in the money market resulted in stable
commercial bank rates. The average lending rate remained stable at 12.0 percent in June 2021
compared to 11.9 percent in June 2020 while the average deposit rates declined to 6.4 percent
from 6.9 percent over the same period. The CBR was retained at 7.0 percent throughout the
year to maintain low and stable lending rates.
Figure 4.4-1: Comparative short-term interest rates between July 2020 and June 2021
Source: Central Bank of Kenya
4.5 Total Public Debt
The total public debt as at June, 2021 stood at Kshs 7,744,383 million (or 69.3 percent of
GDP) against a debt ceiling of Kshs 9,000,000 million. This is exclusive of Committed
Undisbursed Balance (CUB) of Kshs 1,293,852 million. The government is actively
undertaking debt portfolio management measures to reduce refinancing and settlement risks,
and lower the overall cost of borrowing to create the necessary fiscal space to provide the
much-needed resources without undermining fiscal sustainability. The measures include
reprofiling and repricing debts, borrowing more through treasury bonds with long term
maturities, utilizing treasury bills solely for cash management and setting up and

29
operationalizing the Sinking Fund. The stock of public debt increased by Kshs 1,051,045
million from Kshs 6,693,338 million as at end June 2020.
Total external and domestic debt as a percentage of total debt was 52.2 percent and 47.8
percent as at June 2021 compared to 52.5 percent and 47.5 percent in June 2020 respectively
(Table 4.5-1). The increase in public debt stock was mainly attributed to increased
disbursements geared towards budget support, COVID-19 pandemic containment measures,
financing of ongoing and new development projects and exchange rate fluctuations.
Table 4.5-1: Trends in Kenya’s Total Public Debt in (Kshs million)
DEBT TYPE Jun-15 Jun-16 Jun-17 Jun-18 Jun-19 Jun-20 Jun-21*
DOMESTIC DEBT
Central Bank 63,335 99,856 54,506 110,782 109,607 98,878
87,575
Commercial
Banks
730,419 927,307 1,142,889 1,266,457 1,414,275 1,653,194 1,815,144
Sub-total:
Banks
793,754 1,027,163 1,197,395 1,377,239 1,524,037 1,752,072 1,902,719
Non-Banks 626,690 787,970 915,315 1,101,596 1,261,899 1,425,454 1,795,319
Total Gross
Domestic
1,420,444 1,815,133 2,112,710 2,478,835 2,785,937 3,177,526 3,698,038
As a % of GDP 24.4% 27.1% 27.5% 29.2% 29.7% 31.2% 33.1%
As a % of total
debt
50.0% 50.3% 47.9% 49.1% 48.0% 47.5% 47.8%
EXTERNAL DEBT
Bilateral 405,562 491,864 669,839.70 759,016.70 917,980.46 993,696 1,094,848
Multilateral 680,192 794,797.50 839,721.70 825,298.70 909,791.39 1,316,835 1,655,063
Commercial
Banks
276,937 432,377 634,108.90 830,652.10 1,019,029.88 1,022,402 1,116,001
Suppliers
Credits
16,628 16,628 15,303.10 16,725.20 16,931.81 17,631 17,851
Sub-Total 1,379,319 1,735,667 2,158,973.4 2,431,692.7 2,863,733.54 3,350,564 3,883,763
GUARANTEE DEBT
Bilateral 39,495 56,487 52,728.80 56,371.20 78,078.78 80,562 76,792
Multilateral 4,439 4,044 4,667.00 4,547.30 4,603.42 4,794 4,853
Commercial 0 0 77,783.80 75,787.50 76,723.73 79,892 80,963
Sub-Total 43,934 60,531 135,179.60 136,706 159,405.93 165,248 162,608
Total External
debt
1,423,253 1,796,198 2,294,153 2,568,398.7 3,023,139.47 3,515,812 4,046,370
As a % of GDP 24.4% 26.8% 29.9% 30.2% 32.3% 34.4% 36.2%
As a % of total
debt
50.0% 49.7% 52.1% 50.9% 52.0% 52.5% 52.2%
GRAND
TOTAL
2,843,696 3,611,331 4,406,863 5,047,234 5,809,076 6,693,338 7,744,408
Total debt as a
% of GDP
48.8% 53.8% 57.4% 59.4% 62.0% 65.8% 69.3%
Memorandum item
Nominal GDP
at Market
Price (in Kshs
million)
5,831,528 6,709,671 7,677,228.9 8,500,582.1 9,367,317.4 10,175,225.8 11,168,511.00

30
Source: National Treasury and Central Bank of Kenya
Figure 4.5-1 below depicts rising share of external debt to the total debt as compared to the
domestic debt. By June 2021 the composition of external debt to the total debt was at 52.3
percent while the domestic debt to the total debt was 47.8 percent. The marginal change of
debt composition from the previous year’s distribution is reflective of a conscious effort to
minimise the cost of borrowing.
Figure 4.5-1: Kenya’s public and publicly guaranteed debt stock: June 2015-2021 (Kshs
Millions)
Source: National Treasury and Central Bank of Kenya
4.6 Debt Service
The total public debt service increased from Kshs 651,473 million as at end June 2020 to
Kshs 780,628 million as at end June 2021. As a percentage of total debt service, external debt
service decreased from 34.3 percent as at end June 2020 to 30.1 percent as at June 2021 while
domestic debt service rose from 65.7 percent in June 2020 to 69.9 percent in June 2021.
Table 4.6-1.

31
Table 4.6-1: Total Public Debt Service (Kshs million)
Jun-15 Jun-16 Jun-17 Jun-18 Jun-19 Jun-20 Jun-21*
External Principal 80,214 36,015 35,921 137,645 265,106 101,600 128,278
External Interest 33,330 42,568 58,259 81,574 103,372 121,840 106,312
Total External Debt
Service (TEDS)
113,544 78,583 94,180 219,220 368,478 223,440 234,590
TEDS as a % of Total
Debt Service (TDS)
29.0.% 18.4% 20.6% 36.9% 43.3% 34.3% 30.1%
Domestic Interest 139,727 172,857 212,865 239,497 272,351 315,453 388,830
Treasury bond
Redemption
138,891 176,153 154,722 138,373 209,242 112,580 157,208
Total Domestic Debt
Service
278,618 349,010 367,587 377,870 481,593 428,033 546,038
Domestic Debt
Service as a % of TDS
71.0% 81.6% 79.4% 63.1% 56.7% 65.7% 69.9%
Total Debt Service
(TDS)
392,162 427,593 463,210 598,508 850,071 651,473 780,628
Ordinary Revenue 1,031,819 1,152,544 1,306,568 1,365,063 1,500,482 1,573,732 1,562,015
Export Earnings
(goods only)
524,992 615,125 583,219 544,666 612,900 596,677 680,731
Total Debt Service as
a % of Revenue
38.0% 37.1% 35.5% 43.8% 56.7% 41.4% 50.0%
Total External Debt
Service as a % of
Exports
21.6% 12.8% 16.4% 40.5% 60.1% 37.4% 34.4%
Source: National Treasury and Central Bank of Kenya

32
Figure 4.6-1: Total Public Debt Service (Kshs million)
Source: National Treasury and Central Bank of Kenya
The total debt service as a percentage of ordinary revenue rose from 41.4 percent in FY
2019/20 to 50.0 percent in FY 2020/21. The total external debt service as a percentage of
exports decreased to 34.5 percent in FY 2020/21 against 37.4 percent in FY 2019/20.
The total domestic debt service amounted to Kshs 546,038 million while external debt service
was Kshs 234,590 million as at end June 2021.
4.7 Debt Growth Ratios
Table 4.7-1 below indicates that debt as a percentage of GDP increased from 66 percent in
June 2020 to 69 percent in June 2021. Fiscal deficit as a percentage of GDP increased
marginally over the period with June 2021 recording 9 percent against 8 percent in June
2020. Total Ordinary Revenue as a percentage of GDP rose marginally by one percent from 8
percent in June 2020 to 9 percent in June 2021 (Figure 4.7-1).

33
Table 4.7-1: Revenue, Debt and Fiscal Deficit as percentages of GDP
Jun-16 Jun-17 Jun-18 Jun-19 Jun-20 Jun-21*
Deficit excluding
Grants
474,570 697,217 631,081 721,058 790,804 950,235
GDP (in Kshs
million)
6,709,671 7,658,138 8,845,854 9,510,446 10,196,618 11,168,511
Ordinary revenue 1,152,544 1,306,568 1,365,063 1,500,482 1,573,732 1,562,015
Total public debt 3,611,331 4,406,863 5,047,234 5,809,076 6,693,338 7,744,383
Revenue as a percent
of GDP
17% 17% 15% 16% 15% 14%
Debt as a percent of
GDP
54% 58% 57% 61% 66% 69%
Deficit as a percent of
GDP
7% 9% 7% 8% 8% 9%
*Provisional
Source: National Treasury and Central Bank of Kenya
Figure 4.7-1: Revenue, Debt and Fiscal Deficit as percent of GDP
Source: National Treasury and Central Bank of Kenya

34
CHAPTER FIVE
DOMESTIC DEBT
5.1 Domestic Debt Stock
The stock of domestic debt stood at Kshs. 3,698,662 million as at June 2021 from Kshs.
3,177,526 million in June 2020. The increase was attributed to a net domestic borrowing of
Kshs. 521,136 million during the fiscal year to fund government budget. Treasury bills
reduced to Kshs. 765,375 million in June 2021 from Kshs 887,142 million in June 2020 and
treasury bonds increased to Kshs. 2,849,936 million in June 2021 from Kshs 2,219,444
million in June 2020. The reduction in treasury bills and increase in treasury bonds was in
line with 2020 and 2021 MTDS which intended to lengthen the maturity structure and reduce
rollover risk. The pre-1997 debt reduced to Kshs. 20,564 million in June 2021 from Kshs.
21,674 million as at end June 2020 as a result of repayment of Kshs. 1,110 million (Table
2.1). The Central Bank overdraft to the government increased to Kshs. 59,279 million as at
end June 2021 from Kshs. 47,150 million by end June 2020.
Table 5.1-1: Outstanding Domestic Debt (in Kshs million): June 2018 to June 2021
Instrument June-18 June-19 June-20 June-21
Kshs
% of
stock Kshs
% of
stock Kshs
% of
stock Kshs
% of
stock
Total Domestic Debt (A+B) 2,478,835 100 2,785,483 100 3,177,526 100 3,698,662 100
A Government Securities
(1+2+3)
2,414,388 97.4 2,702,853 97 3,128,260 98.4 3,635,874 98.3
1) Treasury Bills 878,622 35.4 954,250 34.3 887,142 27.9 765,375 20.7
Banking Institutions 502,606 20.3 598,071 21.5 587,684 18.5 452,891 12.2
Others 376,016 15.2 356,179 12.8 299,458 9.4 312,484 8.4
2) Treasury Bonds 1,511,872 61 1,748,603 62.8 2,219,444 69.8 2,849,936 77.1
Banking Institutions 786,361 31.7 842,952 30.3 1,093,517 34.4 1,367,100 37.0
Others 725,511 29.3 905,650 32.5 1,125,927 35.4 1,482,835 40.1
3) Pre-1997 Government Debt 23,894 1 22,229 0.8 21,674 0.7 20,564 0.6
B. Others1 64,447 2.6 60,855 2.2 49,267 1.6 62,788 1.7
Of which CBK Overdraft 56,849 2.3 57,328 2.1 47,150 1.5 59,279 1.6
Source: Central Bank of Kenya
1 Consists of CBK Overdraft to GoK, uncleared items awaiting transfer to PMG, commercial bank advances
and Tax Reserve Certificates

35
5.2 Domestic Debt by Instrument
The total domestic debt by instrument is composed of treasury bills, treasury bonds, pre-1997
and others which include government overdraft. Treasury bonds accounted for 77.1 percent
of the total outstanding domestic debt in June 2021 which was an increase of 7.3 percent
from June 2020. Treasury bills holding declined to 20.7 percent in June 2021 from 27.9
percent in June 2020 (Figure 5.2-1). The proportion of pre-1997 debt declined due to
repayment while the proportion of others (includes government overdraft) increased slightly
during the period under review.
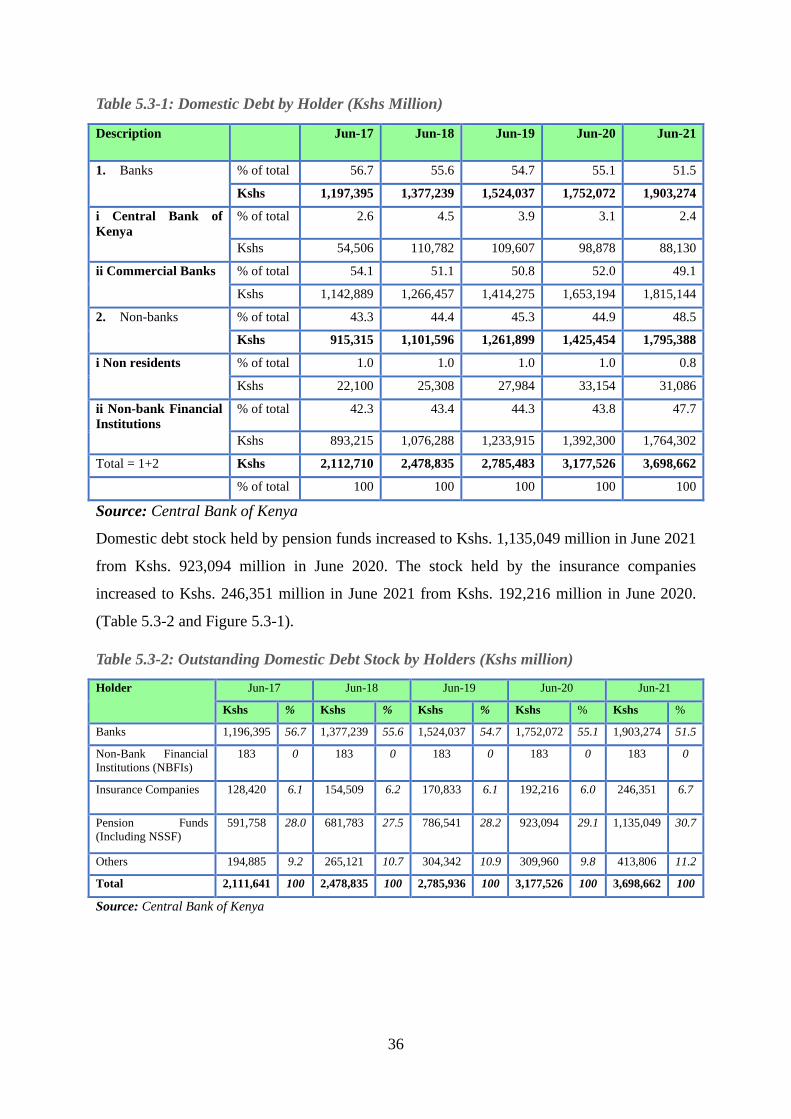
Figure 5.2-1: Domestic Debt by Instruments
Source: Central Bank of Kenya
5.3 Domestic Debt by Holder
Banks holding of government debt securities decreased to 51.5 percent as at end of June
2021, from 55.1 percent in June 2020. The holding of non-bank financial institutions
increased to 47.7 percent as at end June 2021 from 43.8 percent in June 2020 and non-
residents holding declined to 0.8 percent in June 2021 from 1.0 percent in June 2020 (Table
5.3-1).
36
Table 5.3-1: Domestic Debt by Holder (Kshs Million)
Description Jun-17 Jun-18 Jun-19 Jun-20 Jun-21
1. Banks % of total 56.7 55.6 54.7 55.1 51.5
Kshs 1,197,395 1,377,239 1,524,037 1,752,072 1,903,274
i Central Bank of
Kenya
% of total 2.6 4.5 3.9 3.1 2.4
Kshs 54,506 110,782 109,607 98,878 88,130
ii Commercial Banks % of total 54.1 51.1 50.8 52.0 49.1
Kshs 1,142,889 1,266,457 1,414,275 1,653,194 1,815,144
2. Non-banks % of total 43.3 44.4 45.3 44.9 48.5
Kshs 915,315 1,101,596 1,261,899 1,425,454 1,795,388
i Non residents % of total 1.0 1.0 1.0 1.0 0.8
Kshs 22,100 25,308 27,984 33,154 31,086
ii Non-bank Financial
Institutions
% of total 42.3 43.4 44.3 43.8 47.7
Kshs 893,215 1,076,288 1,233,915 1,392,300 1,764,302
Total = 1+2 Kshs 2,112,710 2,478,835 2,785,483 3,177,526 3,698,662
% of total 100 100 100 100 100
Source: Central Bank of Kenya
Domestic debt stock held by pension funds increased to Kshs. 1,135,049 million in June 2021
from Kshs. 923,094 million in June 2020. The stock held by the insurance companies
increased to Kshs. 246,351 million in June 2021 from Kshs. 192,216 million in June 2020.
(Table 5.3-2 and Figure 5.3-1).
Table 5.3-2: Outstanding Domestic Debt Stock by Holders (Kshs million)
Holder
Jun-17 Jun-18 Jun-19 Jun-20 Jun-21
Kshs % Kshs % Kshs % Kshs % Kshs %
Banks 1,196,395 56.7 1,377,239 55.6 1,524,037 54.7 1,752,072 55.1 1,903,274 51.5
Non-Bank Financial
Institutions (NBFIs)
183 0 183 0 183 0 183 0 183 0
Insurance Companies 128,420 6.1 154,509 6.2 170,833 6.1 192,216 6.0 246,351 6.7
Pension Funds
(Including NSSF)
591,758 28.0 681,783 27.5 786,541 28.2 923,094 29.1 1,135,049 30.7
Others 194,885 9.2 265,121 10.7 304,342 10.9 309,960 9.8 413,806 11.2
Total 2,111,641 100 2,478,835 100 2,785,936 100 3,177,526 100 3,698,662 100
Source: Central Bank of Kenya

37
Figure 5.3-1: Outstanding Domestic Debt Stock by Holders
Source: Central Bank of Kenya
5.4 Treasury Bills by Holder
The CBK and commercial banks accounted for 59.2 percent of the treasury bills stock in June
2021 from 66.2 percent in June 2020. Holdings by pension funds increased to 18.9 percent in
June 2021 from 18.1 percent in June 2020 while proportion held by insurance companies
remained at 0.9 percent during the period. Other treasury bill holders comprising of
parastatals, building societies, retail investors and non-residents accounted for 21.0 percent.
(Table 5.4-1).
Table 5.4-1: Outstanding Stock of Treasury Bills by Holder (Kshs million)
Holder
Jun-17 Jun-18 Jun-19 Jun-20 Jun-21
Kshs % Kshs % Kshs % Kshs % Kshs %
Banks2 436,511 58.7 502,606 57.2 598,071 62.7 587,684 66.2 452,891 59.2
NBFIs - - - - - - - - - -
Insurance
companies
13,747 1.8 21,172 2.4 18,225 1.9 7,640 0.9 7,176 0.9
Pensions Funds
(including NSSF)
179,456 24.1 180,140 20.5 170,298 17.8 161,007 18.1 144,434 18.9
2 Banks refer to CBK and commercial banks

38
Others 114,441 15.4 174,705 19.9 167,657 17.6 130,811 14.7 160,874 21.0
Total 744,155 100 878,623 100 954,251 100 887,142 100 765,375 100
Source: Central Bank of Kenya
5.5 Treasury Bonds by Holder
The outstanding stock of Treasury Bonds holdings by Banks declined to 48.0 percent in June
2021 from 49.3 percent in June 2020. Pension funds holding increased to 34.8 percent in June
2021 from 34.3 percent in June 2020 while insurance companies holding was at 8.4 percent
in June 2021 from 8.3 percent in June 2020. Other treasury bond holders had 8.9 percent of
the total in June 2021 (Table 5.5-1).
Table 5.5-1: Outstanding Stock of Treasury Bonds by Holder (Kshs million)
Holder
Jun-17 Jun-18 Jun-19 Jun-20 Jun-21
Kshs % Kshs % Kshs % Kshs % Kshs %
Banks 724,814 54.4 786,361 52 842,952 48.2 1,093,517 49.3 1,367,100 48.0
NBFIs 183 0 183 0 183 0 183 0 183 0.0
Insurance
companies
114,673 8.6 133,337 8.8 152,608 8.7 184,576 8.3 239,174 8.4
Pensions
Funds
(including
NSSF)
412,303 30.9 501,643 33.2 616,243 35.2 762,088 34.3 990,615 34.8
Others 80,887 6.0 90,348 6.0 136,616 7.8 179,080 8.1 252,863 8.9
Total 1,332,860 100 1,511,873 100 1,748,603 100 2,219,444 100 2,849,936 100
Source: Central Bank of Kenya
5.6 Treasury Bills and Treasury Bonds by Tenor
The Treasury bills and bonds with maturity of less than a year accounted for 24.8 percent of
the domestic debt in June 2021 from 35.4 percent in June 2020. This is in line with 2020
MTDS which aimed to reduce the stock of Treasury bills. The proportion of treasury bonds of
between 1-5 years increased from 12.3 percent in June 2020 to 21.5 percent in June 2021.
The share of treasury bonds of between 6-9 years increased to 19.8 percent in June 2021 from
4.4 percent in June 2020. On the other hand, treasury bonds with maturity of more than 10
years decreased to 33.9 percent in June 2021 from 47.9 percent in June 2020 (Figure 5.6-1).

39
Figure 5.6-1: Government Domestic Debt Securities by Tenor
Source: Central Bank of Kenya
5.7 Treasury Bills and Bonds by Time to Maturity
The Average Time to Maturity (ATM) on treasury bonds increased to 8.8 years in June 2021
from 8.0 years in June 2020. This is in line with the objective of lengthening the maturity of
debt.
Figure 5.7-1: Average Time to Maturity of Treasury Bonds
Source: Central Bank of Kenya

40
5.8 Average Interest Rates on Treasury Bills
Overall, average interest rates for the 91-day, 182-day and 364-day Treasury Bills rate were
6.7 percent, 7.4 percent and 8.2 percent per annum in June 2020 as compared to 6.7 percent,
7.3 percent and 8.4 percent in June 2021 respectively (Figure 5.8-1).
Figure 5.8-1: Average Interest Rates and spreads on Treasury Bills: Fiscal Year 2020/21
Source: Central Bank of Kenya
5.9 Government Securities Trading
The annual stock turnover of bonds increased by Kshs 123,700 million in June 2021 to Kshs
637,000 million as compared to Kshs 513,300 million traded in June 2020 (Figure 5.9-1). The
improvement in stock turnover in the secondary market is due to the reforms being
undertaken by the government.

41
Figure 5.9-1: Annual Treasury Bonds Trading, June 2010-June 2021
Source: Central Bank of Kenya
5.10 Government Securities Yield Curve
The government issued treasury bills and bonds to raise resources for financing the Budget as
shown in Figure 5.10-1. The yield curve had a downward shift at the shorter end but shifted
upwards at the medium to long-end. This was attributed to investors shifting their preference
of short-term investments to high yielding long-term securities to lock in higher yield in
relation to the uncertainty of the COVID-19 pandemic effects and the upcoming general
election in 2022.

42
Figure 5.10-1: Government of Kenya Securities Yield Curve, June 2021
Source: National Securities Exchange
5.11 Interest Payments on Domestic Debt
Interest payment on treasury bills reduced from Kshs. 80,517 million in June 2020 to Kshs.
74,903 million in June 2021 while interest payment on treasury bonds increased from Kshs.
228,028 million to Kshs. 308,412 million during the same period. The decline in interest cost
of treasury bills was as a result of reduced stock and interest rates. Meanwhile, the increase in
interest cost of treasury bonds was due to increased stock. The total interest payments and
other charges on the overall domestic debt stood at Kshs 388,834 million as at end June 2021
from Kshs. 315,453 million in June 2020 (Table 5.11-1).
The ratios of domestic interest payments to revenue and GDP continued to grow showing an
increase in domestic debt burden. By end June 2021, the ratios of domestic interest payments
to total revenue and GDP increased to 21.8 percent and 3.5 percent from 18.2 percent and 3.1
percent in June 2020 respectively.

43
Table 5.11-1: Interest Payments on Domestic Debt (Kshs Million)
Type of Debt June June June June June
2017 2018 2019 2020 2021
Treasury Bills 66,270 66,545 81,876 80,517 74,903
Treasury Bonds 144,566 167,030 184,771 228,028 308,412
CBK Commission 3,000 3,000 3,000 3,000 3,000
Pre - 1997 Debt 759 725 707 669 628
Others (Overdraft) 1,270 2,197 1,997 3,239 1,892
Total 212,865 239,497 272,351 315,453 388,834
Ratios (Percent)
Domestic Interest/Revenue 15.2 17.6 16.8 18.2 21.8
Domestic Interest/GDP 2.8 2.7 2.9 3.1 3.5
Source: Central Bank of Kenya

44
CHAPTER SIX
EXTERNAL DEBT
6.1 Public external debt
Public external debt stock increased by 15.9 percent from Kshs 3,350,564 million in June
2020 to Kshs 3,883,763 million in June 2021 (Table 6.1-1). The increase was attributed to
disbursements from multilateral and bilateral creditors. The disputed external commercial
debt (Suppliers’ Credit) is estimated at Kshs 17,851 million which is 0.5 percent of total
external debt as at end June 2021.
Table 6.1-1: External Debt by Creditor Type (Kshs Million)
Creditor type June-15 June-16 June-17 June-18 June-19 June-20 June-21
Bilateral 405,562 491,864 669,840 759,017 917,980 993,696 1,094,848
Multilateral 680,192 794,797 839,721 825,299 909,791 1,316,835 1,655,063
Commercial Banks 276,937 432,377 634,109 830,652 1,019,030 1,022,402 1,116,001
Suppliers’ Credit 16,628 16,628 15,303 16,725 16,932 17,631 17,851
Total 1,379,319 1,735,667 2,158,973 2,431,693 2,863,733 3,350,564 3,883,763
As a percentage of total external debt
Bilateral 29.4 28.3 31.0 31.2 32.1 29.7 28.2
Multilateral 49.3 45.8 38.9 33.9 31.8 39.3 42.6
Commercial Banks 20.1 24.9 29.4 34.2 35.6 30.5 28.7
Suppliers Credits 1.2 1.0 0.7 0.7 0.6 0.5 0.5
Source: National Treasury
6.1.1 Classification of external debt by creditor category
The share of multilateral creditors increased to 42.6 percent in June 2021 from 39.3 percent
in June 2020. The rise of multilateral debt stock is due to government contracting
concessional debt from the World Bank (WB), International Monetary Fund (IMF) and
African Development Bank (AfDB). This is consistent with the 2021 debt management
strategy. The share of debt from bilateral creditors and commercial banks3 decreased from
29.7 percent and 30.5 percent to 28.2 percent and 28.7 percent respectively between June
2020 and June 2021 (Table 6.1-1 and Figure 6.1-1). The stock of suppliers’ credit in absolute
terms remained relatively unchanged as the debt obligation is under dispute. The marginal
increase in suppliers’ credit was attributed to foreign exchange depreciation.
3 Commercial Banks refer to Syndicated Loans and ISB Market

45
Figure 6.1-1: External Debt by Creditor Type (Kshs Million)
29
.4
28
.3 31
.0 33
.9
31
.8
39
.3
42
.6
49
.3
45
.8
38
.9
31
.2
32
.1
29
.7
28
.2
20
.1
24
.9
29
.4
34
.2 35
.6
30
.5
28
.7
1.2
1.0
0.7
0.7
0.6
0.5
0.5
0.0
5.0
10.0
15.0
20.0
25.0
30.0
35.0
40.0
45.0
50.0
J u n e - 1 5 J u n e - 1 6 J u n e - 1 7 J u n e - 1 8 J u n e - 1 9 J u n e - 2 0 J u n e - 2 1
%
Multilateral Bilateral Commercial Banks Suppliers Credits
Source: National Treasury
6.1.2 Classification by Major Creditor
Figure 6.1-2 shows classification by creditors. The major creditors as at end June 2021 are;
International Development Association (IDA), China, International Sovereign Bond (ISB)
holders and syndicated loans, each with weights of 27.5 percent, 20.3 percent, 19.7 percent
and 9.5 percent respectively.
Figure 6.1-2: Classification by Major Creditors

46
Source: National Treasury
6.1.3 Classification by Currency
The proportion of external debt held in US Dollar (USD) declined from 67.3 percent in June
2020 to 66.0 percent in June 2021. The share of external debt in Euro rose to 19.4 percent as
at end June 2021 from 18.0 percent in June 2020. The composition of external debt held in
Japanese Yen was 6.3 percent, Chinese Yuan was 5.6 percent and the Sterling Pound (GBP)
was 2.5 percent while other currencies accounted for 0.2 percent. The government is making
every effort to minimise its external exposure to exchange rate fluctuations by selecting the
optimal risk minimising currency composition of debt. This has been made possible by
decreasing the uptake of debt denominated in USD and promoting exports of goods and
services.
Figure 6.1-3: Currency composition of External Debt end June 2021
6.1.4 Maturity Structure of external debt
Table 6.1-2 shows the outstanding external debt by maturity structure. At the end of the FY
2020/21 debt maturing in less than 4 years, 5-10 years and over 10 years account for 0.1
percent, 17.3 percent and 82.6 percent of total external debt stock respectively. This implies
that a large proportion of external debt is long term.
67.3
18.0
6.6
2.55.4 0.2
Per
cen
tag
e
June 2020

47
Table 6.1-2: Outstanding External Debt by Maturity Structure (percent)
Remaining Maturity Jun-14 Jun-15 Jun-16 Jun-17 Jun-18 Jun-19 Jun-20 Jun-21
1 -4 years 14.7 8.2 11.4 15.4 6.7 2.9 9 0.1
5-10 years 22.9 25.5 24.7 22.5 21.9 20.7 27.8 17.3
Over 10 years 62.4 66.3 63.9 62.1 71.4 76.3 63.1 82.6
Source: The National Treasury
6.2 External Debt Service
Principal and interest payments on external debt amounted to Kshs. 234,590 million in
FY2020/21 from Kshs 223,440 million in FY2019/20 (Table 6.2-1). The increase was on
account of higher repayments on commercial and multilateral debt. Commercial debt service
rose from Kshs 120,377 million in June 2020 to Kshs 138,151 million in June 2021. This
accounted for a large proportion of external debt payments at 58.9 percent which was as a
result of maturing commercial debt obligations. During the FY 2020/21 the government spent
Kshs. 1,813.47 million to pay commitment fees on CUB.
Table 6.2-1: External Debt Service Payments by Creditor Category (Kshs million)
Creditor June-
15
June-
16
June-
17
June-
18
June-
19
June-
20
June-
21
Multilateral Principal 13,349 15,424 15,821 16,205 17,786 18,782 25,122
Interest 4,881 5,641 5,764 6,038 7,422 9,788 15,324
Sub
Total
18,230 21,065 21,585 22,243 25,208 28,571 40,446
Bilateral Principal 13,097 19,789 19,329 21,357 30,119 40,149 37,518
Interest 10,574 15,270 22,613 30,255 33,379 34,344 18,475
Sub
Total
23,671 35,059 41,942 51,613 63,498 74,492 55,993
Commercial Principal 53,768 802 771 100,083 217,201 42,669 65,638
Interest 17,875 21,657 29,882 45,281 62,571 77,708 72,513
Sub
Total
71,643 22,460 30,653 145,364 279,772 120,377 138,151
Grand Total Principal 80,214 36,015 35,921 137,645 265,106 101,600 128,278
Interest 33,330 42,568 58,259 81,574 103,372 121,840 106,312
Total 113,544 78,583 94,180 219,220 368,478 223,440 234,590
As a percentage of total external debt service
Multilateral 16.1 26.8 22.9 10.1 6.8 12.8 17.2
Bilateral 20.8 44.6 44.5 23.5 17.2 33.3 23.9
Commercial 63.1 28.6 32.5 66.3 75.9 53.9 58.9
Total 100 100 100 100 100 100 100
Source: The National Treasury

48
6.3 Average Terms of New External Loan Commitments
The average terms of new external debt commitments are indicated on Table 6.3-1. The
average maturity, grace period and average interest rate on new external loan commitments as
at end of June 2021, were 23.3 years, 7.4 years and 2.1 percent respectively. These terms are
consistent with the objective of lengthening maturity of debt.
Table 6.3-1: Average terms of new external loan commitments
Terms Jun-14 Jun-15 Jun-16 Jun-17 Jun-18 Jun-19 Jun-20 Jun-21
Average Maturity (years) 18.1 21.0 20.3 17.6 20.8 15.3 26.2 23.3
Grace Period (years) 6.2 6.4 6.2 4.5 10.3 5.6 7.4 7.4
Average Interest Rate (%) 2.6 2.5 2.6 2.6 3.9 3.9 0.5 2.1
Source: National Treasury
6.4 External Loans Disbursements
Disbursements on external project loans and A-I-A increased by 5.6 percent to Kshs 467,157
million as at end June 2021 from Kshs 442,403 million in June 2020 mainly due to increase
in disbursements from commercial sources. The disbursements included; Kshs 77,492 million
for project loans revenue, Kshs 95,215 million for project loans A-I-A, Kshs 4,643 million
for Project loans A-I-A in SGR, Kshs 6,871 million for Project loans A-I-A in SGR Phase2A,
Kshs 114,292 million commercial financing and Kshs 168,644 million programme loans
(Table 6.4-1).
Table 6.4-1: External Loans Disbursements (Kshs million)
Type of disbursement June-2016 June-2017 June-2018 June-2019 June-2020 June-2021
Kshs % Kshs % Kshs % Kshs % Kshs % Kshs %
Project Cash Loans 43,654 14.3 30,908 7.3 24,214 5.5 41,681 6.1 47,798 10.8 77,492 16.6
Project loans A-I-A 55,369 18.2 86,322 20.5 162,872 36.9 100,622 14.8 104,525 23.6 95,215 20.4
Project loans A-I-A, SGR
52,357 17.2 111,367 26.4 54,000 12.2 35,201 5.2 12,242 2.8 4,643 1.0
Project loans A-I-A, SGR - Phase 2A
- - - - - - 44,759 6.6 32,569 7.4 6,871 1.5
Commercial Financing 145,031 47.6 186,303 44.2 200,000 45.3 373,712 54.9 5,870 1.3 114,292 24.5
Programme loans 8,574 2.8 6,767 1.6 - - 84,784 12.5 239,399 54.1 168,644 36.1
Total 304,986 100 421,667 100 441,086 100 680,759 100 442,403 100 467,157 100
Source: The National Treasury
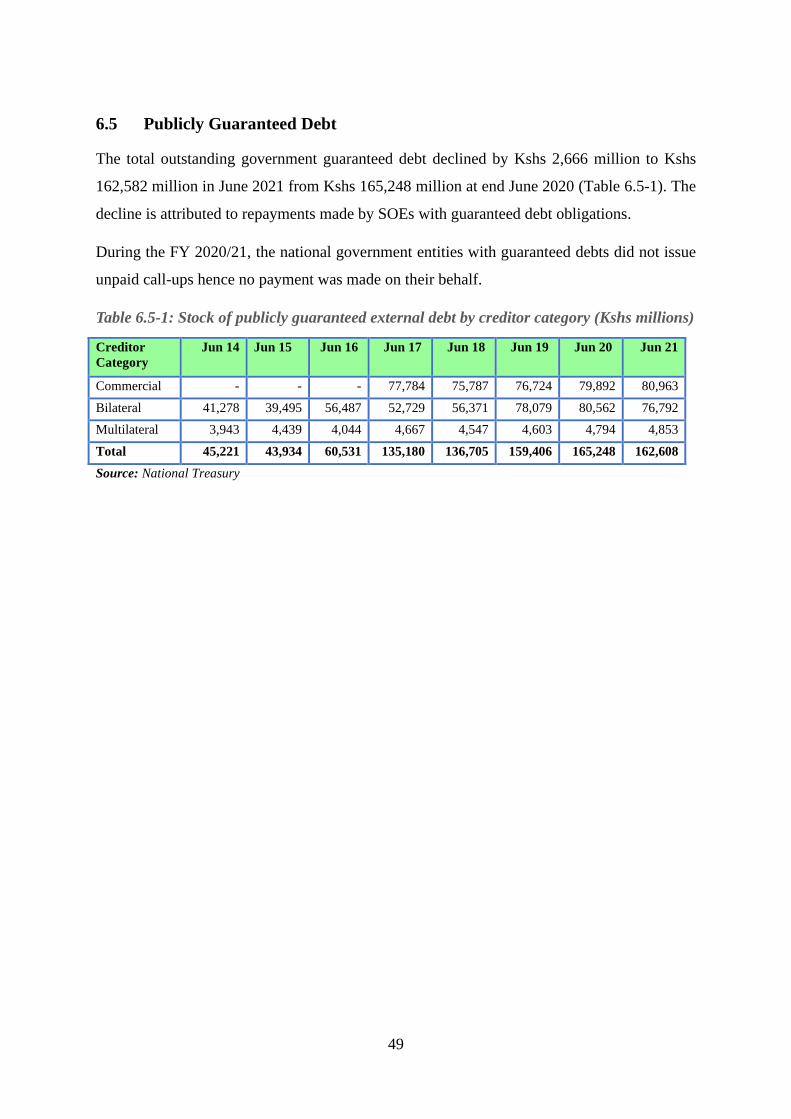
49
6.5 Publicly Guaranteed Debt
The total outstanding government guaranteed debt declined by Kshs 2,666 million to Kshs
162,582 million in June 2021 from Kshs 165,248 million at end June 2020 (Table 6.5-1). The
decline is attributed to repayments made by SOEs with guaranteed debt obligations.
During the FY 2020/21, the national government entities with guaranteed debts did not issue
unpaid call-ups hence no payment was made on their behalf.
Table 6.5-1: Stock of publicly guaranteed external debt by creditor category (Kshs millions)
Creditor
Category
Jun 14 Jun 15 Jun 16 Jun 17 Jun 18 Jun 19 Jun 20 Jun 21
Commercial - - - 77,784 75,787 76,724 79,892 80,963
Bilateral 41,278 39,495 56,487 52,729 56,371 78,079 80,562 76,792
Multilateral 3,943 4,439 4,044 4,667 4,547 4,603 4,794 4,853
Total 45,221 43,934 60,531 135,180 136,705 159,406 165,248 162,608
Source: National Treasury
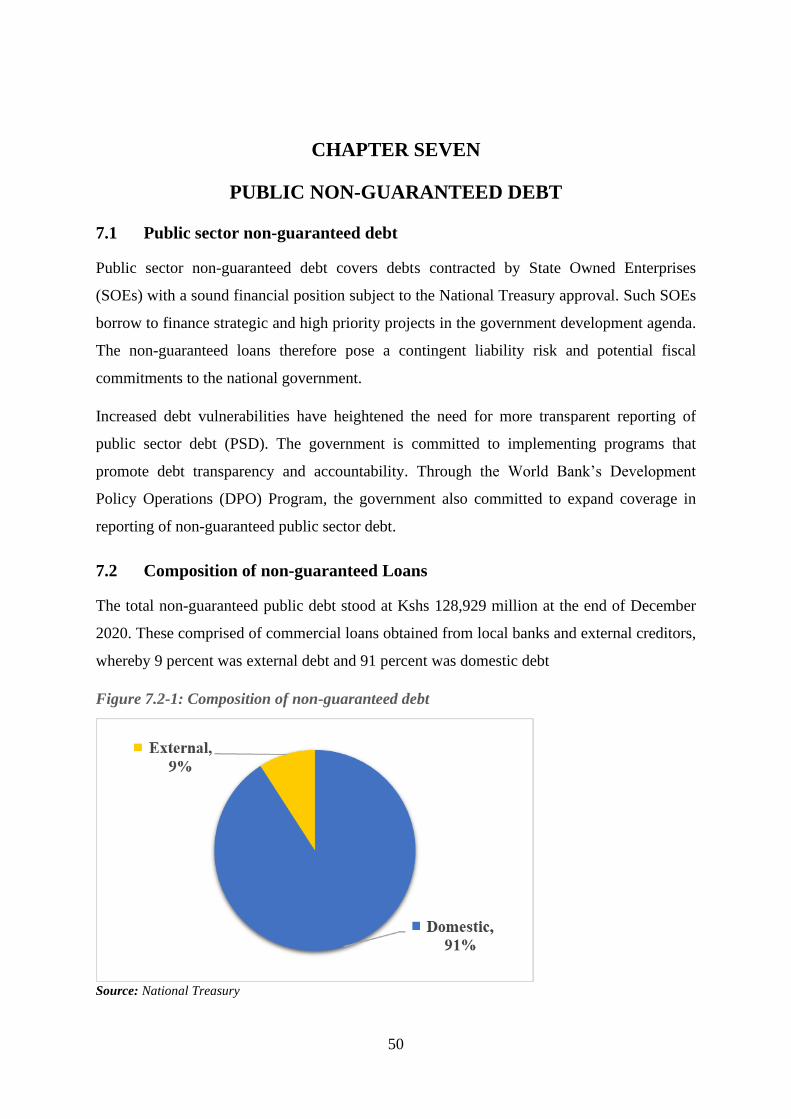
50
CHAPTER SEVEN
PUBLIC NON-GUARANTEED DEBT
7.1 Public sector non-guaranteed debt
Public sector non-guaranteed debt covers debts contracted by State Owned Enterprises
(SOEs) with a sound financial position subject to the National Treasury approval. Such SOEs
borrow to finance strategic and high priority projects in the government development agenda.
The non-guaranteed loans therefore pose a contingent liability risk and potential fiscal
commitments to the national government.
Increased debt vulnerabilities have heightened the need for more transparent reporting of
public sector debt (PSD). The government is committed to implementing programs that
promote debt transparency and accountability. Through the World Bank’s Development
Policy Operations (DPO) Program, the government also committed to expand coverage in
reporting of non-guaranteed public sector debt.
7.2 Composition of non-guaranteed Loans
The total non-guaranteed public debt stood at Kshs 128,929 million at the end of December
2020. These comprised of commercial loans obtained from local banks and external creditors,
whereby 9 percent was external debt and 91 percent was domestic debt
Figure 7.2-1: Composition of non-guaranteed debt
Source: National Treasury
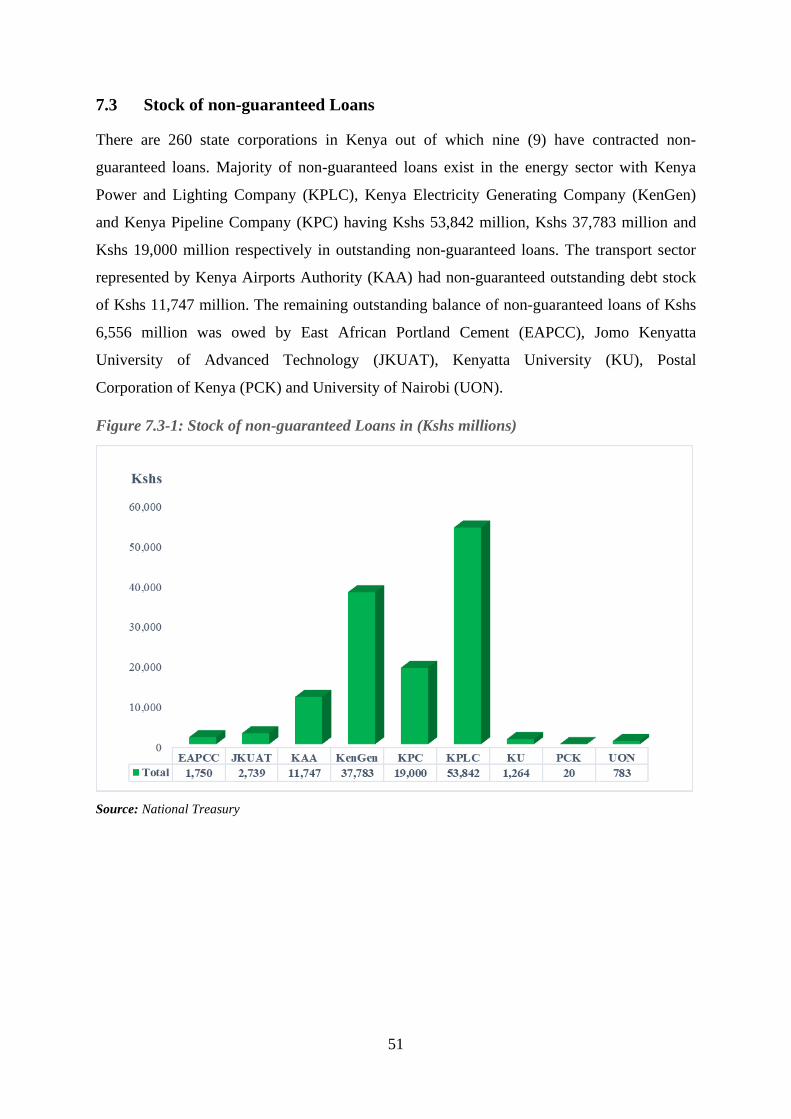
51
7.3 Stock of non-guaranteed Loans
There are 260 state corporations in Kenya out of which nine (9) have contracted non-
guaranteed loans. Majority of non-guaranteed loans exist in the energy sector with Kenya
Power and Lighting Company (KPLC), Kenya Electricity Generating Company (KenGen)
and Kenya Pipeline Company (KPC) having Kshs 53,842 million, Kshs 37,783 million and
Kshs 19,000 million respectively in outstanding non-guaranteed loans. The transport sector
represented by Kenya Airports Authority (KAA) had non-guaranteed outstanding debt stock
of Kshs 11,747 million. The remaining outstanding balance of non-guaranteed loans of Kshs
6,556 million was owed by East African Portland Cement (EAPCC), Jomo Kenyatta
University of Advanced Technology (JKUAT), Kenyatta University (KU), Postal
Corporation of Kenya (PCK) and University of Nairobi (UON).
Figure 7.3-1: Stock of non-guaranteed Loans in (Kshs millions)
Source: National Treasury
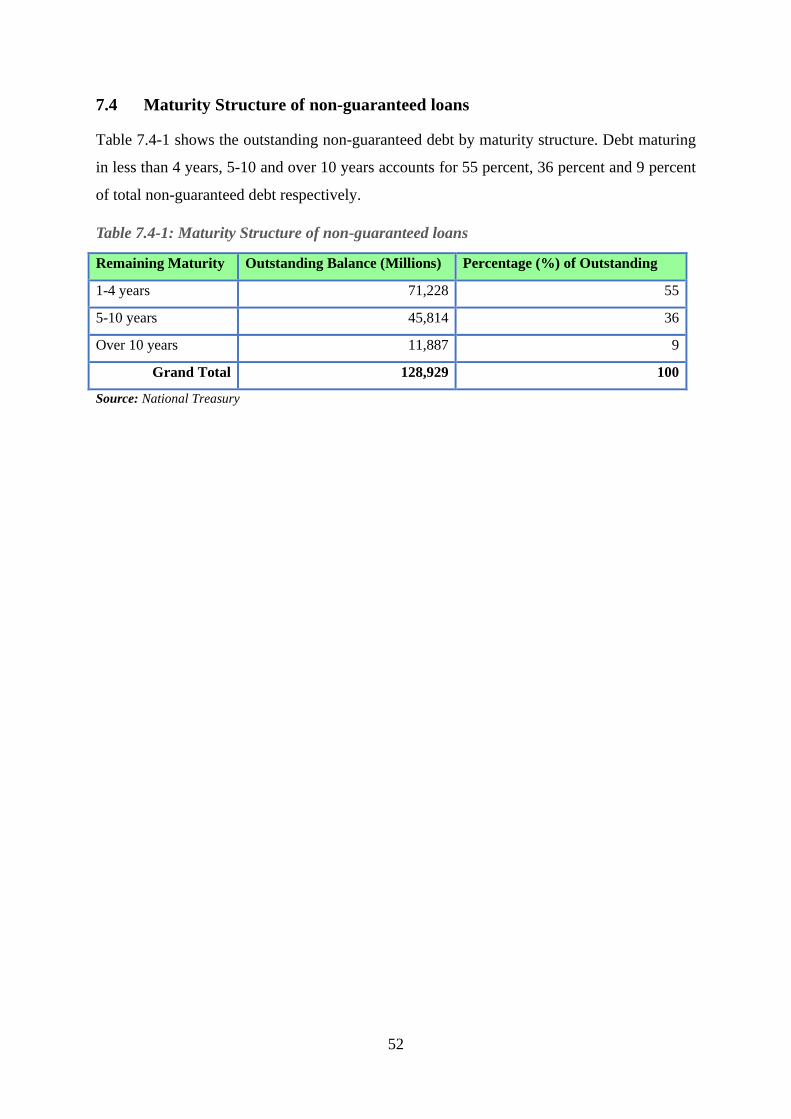
52
7.4 Maturity Structure of non-guaranteed loans
Table 7.4-1 shows the outstanding non-guaranteed debt by maturity structure. Debt maturing
in less than 4 years, 5-10 and over 10 years accounts for 55 percent, 36 percent and 9 percent
of total non-guaranteed debt respectively.
Table 7.4-1: Maturity Structure of non-guaranteed loans
Remaining Maturity Outstanding Balance (Millions) Percentage (%) of Outstanding
1-4 years 71,228 55
5-10 years 45,814 36
Over 10 years 11,887 9
Grand Total 128,929 100
Source: National Treasury

53
CHAPTER EIGHT
FISCAL COMMITMENTS AND CONTINGENT LIABILITIES
8.1 Introduction
Fiscal commitments to PPPs refer to payments made to safeguard against certain risks or
reduce the cost of operation. This includes direct payments made by government to PPP
which arise from PPP contracts such as capital contributions, subsidies and payment for
services. On the other and fiscal commitments that relate to payment commitments whose
occurrence, timing and magnitude depend on some uncertain future event, outside the control
of government are referred to as contingent liabilities. Therefore, the financial obligations
attendant to PPP projects constitutes the Fiscal Commitments and Contingent Liabilities
(FCCLs). PPPs are long-term contracts between a government or a government entity with a
private party to build or acquire an asset, operate it for economic gains and later transfer it to
the government/government entity.
The PPP Act 2013 provides mechanisms of addressing major infrastructure funding gap
which cannot be financed through borrowing due to competing development needs. The Act
allows participation of the private sector in financing, construction and operation or
maintenance of public projects. PPPs are off balance sheet financing that have a potential to
create fiscal risks when contingent government support measures materialise. Sections 35 (2)
and 53 (4) of the PPP Act 2013 mandates PDMO to assess FCCLs’ of proposed PPP projects
after feasibility study and before financial close.
8.2 Government support measures with potential fiscal risks issued to existing
PPP projects
It should be noted that the government has not issued a direct debt guarantee on the existing
PPP projects. Consequently, the existing PPP projects supported by the national government
have potential contingent liabilities. The main instrument of support measures granted by
government is the Letter of Support which covers political risks that affect the operations of a
project. Similarly, it covers termination of payments in case of a political event that renders a
project non-operational. The Letter also covers payment of outstanding debt, equity injected
in to the project and returns together with any breakage costs (see Annex 1 for list of PPP
projects with respective support measures).

54
Another support measure with a potential of creating debt is the Indemnity Agreements
issued by the national government to multilateral agencies backstopping Partial Risk
Guarantees (PRGs). The existing PRGs have been issued by AfDB and World Bank to
provide investor confidence when financing projects. The total PRG’s covered by Indemnity
Agreements amounts to Kshs 19,602 million. This includes the principal PRG amount and
excludes accrued interest that can be drawn in case the guarantee materialises (Table 8.2-1).
Table 8.2-1: Projects Issued with PRGs guaranteed SBLCs, Indemnity agreements
Project description Project cost
Millions
PRG amount
Millions
PRG Kshs
Millions
Issuer
1 87MW Thika thermal power project USD 146 USD 45 4,819 World
Bank
2 83MW Triumph thermal power plant USD 157 USD 45 4,819 World
Bank
3 80MW Gulf thermal power plant USD 108 USD 45 4,819 World
Bank
4 OrPower4’s 36MW Olkaria III USD 212 Cancelled (USD 31) - World
Bank
5 Proposed 300 MW Lake Turkana Wind
Power
Euro 623 Euro 46 5,145 AfDB
6 Rabai Power Plant – 90 MW USD 155
Total 19,602

55
CHAPTER NINE
ON-LENT LOANS
9.1 Introduction
The government through the National Treasury may borrow funds from both external and
domestic sources and on-lend to SOEs within the economy. In the case of external borrowing, the
National Treasury records an external debt liability with subsequent on-lending classified as a
domestic claim. Borrowing can also be done domestically and on-lent to SOEs. This is recorded
by the National Treasury as domestic debt and claim respectively.
The prerequisites taken before any on-lent arrangement is contracted include; the SOEs should be
playing a strategic role in the economy, have a weak balance sheet that cannot attract competitive
funding both domestically and externally and projects being implemented by the SOE should
hold a top-level priority on the development agenda of the government.
9.2 Stock of On-Lent Loans
The cumulative on-lent loans amount as at end of June 2021 was Kshs. 967,344 million while
the cumulative amount repaid or written off during the period was Kshs. 45,414 million. This
brings the outstanding debt stock for all on-lent loans to SOEs to Kshs. 921,930 million as at end
June 2021. This is an increase of Kshs. 54,925 million from Kshs 867,005 million as at end June
2020 and translates to a 6.3 percent increase during the period under review. Table 9.2-1 below
shows the distribution of stock of on lent loans by sectors.
Table 9.2-1: Stock of On-Lent Loans (By Sectors) in (Kshs. million)
Sector Jun-21
Education 231.25
Finance 44,256.38
Water and Irrigation 169,441.98
Tourism 170.00
Energy and Petroleum 218,738.73
Transport and Infrastructure 478,324.90
Planning and Devolution 102.33
Agriculture, Livestock and Fisheries 8,311.19
Trade and Industry 2,354.25
Cooperative -
Total 921,930.32
Source: National Treasury

56
9.3 On-Lent Loans (Arrears)
The total outstanding on-lent loan arrears was Kshs. 74,014 million as at end of June 2021. The
principal and interest arrears were Kshs. 38,033 million and Kshs. 35,981 million respectively. A
large proportion of the arrears were in the transport and infrastructure sector at Kshs. 17,461
million while the least was in the financial sector at Kshs. 125 million.
Majority of the SOEs are facing financial constraints and have applied for consideration of their
loans to be written-off. The Agricultural Settlement Fund and Central Land Board and the
Cooperative Bank of Kenya (Co-op) are consistent in their loan repayments, therefore reducing
their arrears. However, Co-op Bank has indicated that various Co-operative Societies are in
moribund state thereby rendering inability to repay some of the on-lent loans.
The Kenyatta University Hospital constructed through an on-lent loan has since been taken over
and is being managed by the national government to recover the loan amount after non-settlement
of their arrears. Agro-Chemical and Food Co. Ltd and Kenya Meat Commission (KMC) have
been earmarked for privatization. The treatment of their on-lent loans will hence fourth be
addressed under the privatization framework.
Most water works development agencies face financial difficulties and, thus are unable to meet
their on-lent loans obligations. An Inter-Ministerial Committee has been constituted to review all
water sector loans and recommend the mitigation measures to be adopted.
Table 9.3-1 below shows the distribution of outstanding arrears by sectors.
Table 9.3-1: On-Lent Loans (Outstanding arrears by sectors) as at June 2021 (Kshs. million)
Sector Principal Arrears Interest Arrears
Total
Finance 73 52 125
Education 1,508 868 2,377
Tourism 123 601 724
Water- and Irrigation 15,385 7,337 22,723
Energy & Petroleum - - -
Transport & Infrastructure 12,916 4,545 17,461
Trade & Industry 2,401 - 2,401
Planning & Devolution 4,844 10,716 15,559
Agriculture, Livestock & Fisheries 783 11,861 12,644
Total 38,033 35,981 74,014
Source: National Treasury

57
9.4 Receipts from On-Lent Loans
Receipts from on-lent loans by end of the financial year 2020/21 were Kshs. 8,354 million
emanating from 15 SOEs. Out of this, Kshs 6,258.78 million was principal and Kshs 2,095.21
million was interest. (Table 9.4-1).
Table 9.4-1: Receipts from on-lent loans by End June 2021 (Kshs millions)
Organization Principal Receipt Interest receipt Total
Agricultural Finance Corporation 11,080,810.00 - 11,080,810.00
Agricultural Settlement Fund 1,976,592.00 1,165,850.60 3,142,442.60
Athi Water Services Authority - - -
Cooperative Bank Ltd - - -
Eldoret Water & Sewerage Co. Ltd 23,333,333.25 16,625,000.10 39,958,333.35
Equity Bank Ltd. 17,073,755.00 1,389,896.70 18,463,651.70
Faulu Micro-Finance Bank Ltd 39,261,445.50 4,416,912.50 43,678,358.00
Industrial & Commercial Development Cor. 17,592,428.05 6,270,234.95 23,862,663.00
KenGen 5,808,198,051.75 1,953,371,929.55 7,761,569,981.30
KPLC - - -
Kenya Airport Authority 12,742,379.10 - 12,742,379.10
Kenya Civil Aviation Authority 186,020,492.50 80,176,626.15 266,197,118.65
Kenya Utalii College - - -
Kenya Women Micro-Finance Bank Ltd 40,222,388.85 4,525,018.70 44,747,407.55
Lake Victoria North Water Services Board 7,551,834.25 3,102,950.75 10,654,785.00
Nyeri Water & Sewerage 50,417,075.20 14,810,015.80 65,227,091.00
Rafiki Micro-Finance Bank Ltd 18,558,763.80 2,087,860.95 20,646,624.75
Rift Valley Water Services Board 5,000,000.00 4,800,000.00 9,800,000.00
SMEP 19,759,277.80 2,472,997.85 22,232,275.65
Total 6,258,788,627.05 2,095,215,294.60 8,354,003,921.65
Source: National Treasury

58
CHAPTER TEN
DEBT SUSTAINABILITY ANALYSIS
10.1 Introduction
The National Treasury works closely with the World Bank and IMF to publish the annual results
of the to. The scope of the DSA includes; both external and domestic debt incurred or guaranteed
by the central government, stress tests that take into account contingent liabilities of SOEs, PPP
debts and financial market shocks. It excludes legacy debt of the pre-devolution local
governments.
10.2 Assumptions of the Debt Sustainability Analysis
The DSA was done with the assumptions that the economy will rebound from the COVID-19
shock to 6 percent over the medium to long term, supported by the reforms under the proposed
Extended Fund Facility/Extended Credit Facility program. Further, the DSA assumed that the
fiscal deficit is expected to decline to 1.2 percent of GDP in 2023 and reach a primary surplus of
0.5 percent of GDP in the medium term through fiscal consolidation. The government is
committed to fiscal consolidation and tax reforms aimed at broadening the tax revenue base.
In addition, the DSA assumed a resilient performance of the current account supported by
increased exports of tea, horticulture and lower global energy prices. Remittances were expected
to perform well and tourism receipts to contract on account of the COVID-19 crisis.
10.3 Country Classification
The World Bank Composite Indicator (CI) for Kenya debt carrying capacity was revised from
strong to medium due to decline in global economic growth. The carrying capacity determines
external debt indicative thresholds and total public debt benchmark for the public and publicly
guaranteed (PPG) debt.
10.4 Scenario Stress Tests
The DSA was done based on a two-tailored stress tests. The first test is a one-time debt shock that
combines contingent liabilities from SOEs (2 percent of GDP), PPPs (1.1 percent of GDP) and a
need for bank recapitalization (5 percent of GDP). The second stress test is a market financing
shock which is applied to low-income countries with market access, such as Kenya. The scenario
assesses rollover risks resulting from a deterioration in global risk sentiment, temporary nominal
depreciation and shortening of maturities of new external commercial borrowing.

59
10.5 External Debt Sustainability
As indicated in Table 10.5-1, the present value (PV) of external debt-to-export and PPG of debt-
service-to-exports indicators were breached under the baseline and the shock scenario. Both
indicators remained above the thresholds throughout the medium-term projection period. This is
due to Eurobond repayments in 2024 and 2028 and revision of the Kenya’s debt carrying capacity
as a result of the global shock.
Table 10.5-1: External Debt Sustainability
Indicators Thresholds 2020 2021 2022 2023 2024 2025
PV of debt–to-GDP ratio 40 28.7 28.7 28.3 27.3 26.3 25.7
PV of debt-to-exports ratio 180 288.3 255.8 239.2 219.8 204.2 193.6
PPG Debt service-to-exports ratio 15 26.5 19.1 22.7 20.1 29.7 18.4
PPG Debt service-to-revenue ratio 18 15.5 13.0 15.8 14.0 21.0 13.1
Source: IMF Country Report No. 21/72, March 2021
10.6 Public Debt Sustainability
As a share of GDP, the PV of total public debt was above the 55 percent benchmark and
projected to increase through to 2023 exacerbated by the COVID-19 global shock, and later start
declining in the year 2024 (table 6-2).
Table 10.6-1: Kenya’s Public debt sustainability
Indicators Benchmark 2020 2021 2022 2023 2024 2025
PV of debt–to-GDP ratio 55 62.4 63.0 64.2 63.4 62.9 61.1
PV of public debt-to-revenue and
grants ratio
360.0 372.6 370.8 348.7 339.2 324.0
Debt service-to-revenue and grants
ratio
52.2 47.6 61.9 68.3 79.3 72.0
Source: IMF Country Report No. 21/72, March 2021
10.7 Debt Sustainability Analysis Findings
Overall, Kenya’s debt remains sustainable but with a high risk of debt distress. The debt ratios
were worsened by the COVID-19 pandemic. However, debt ratios are projected to improve
though gradually through; sustained fiscal consolidation, gradual recovery of exports and reforms
under the EFF/ECF program aimed at enhancing competitiveness.
Active and effective implementation of the debt management framework through liability
management and refinancing of future maturities on better terms will improve the overall debt
profile. The government also will maximize concessional borrowing to finance investment

60
projects and limit non-concessional financing to projects that have high social and economic
returns. These investments will raise growth and export potential which will in turn support
Kenya’s external debt sustainability. Commitment to fiscal consolidation will reserve social and
development spending, thus reduce risks. Further, implementation of reforms aimed at deepening
of the domestic debt markets to enhance efficiency in the secondary markets and to lower the cost
of government debt securities across the yield curve is encouraged.

61
CHAPTER ELEVEN
DEBT MANAGEMENT STRATEGY
11.1 Introduction
The 2020 MTDS was prepared as per Section 33 of the PFMA to guide borrowing in the fiscal
year 2020/21. The MTDS aimed at setting out the strategy of the national government over the
period 2020/21-2022/23 with respect to the existing stock of debt and in financing the fiscal
deficits as outlined in the 2020 Budget Policy Statement (BPS).
The strategy highlighted; the total stock of debt as at end December 2019, cost and risk
characteristics of alternative financing, structure of debt and guarantees issued, sources of debt as
well as major risks associated with borrowing and guarantees. It outlined the assumptions
underlying the debt management strategy and analysed the sustainability of the existing and
projected debt arising from funding of fiscal deficits.
The 2020 MTDS also focussed on reducing refinancing risk by lengthening the maturity profile
of existing securities. It emphasized a shift of the financing needs to focus on more external
sources with concessional funding. Furthermore, it highlighted gross external financing to
constitute 60 percent and gross domestic borrowing 40 percent. The external borrowing strategy
comprised 26 per cent concessional, 8 per cent semi-concessional and 4 per cent on commercial
terms. Concerning domestic financing strategy, treasury bonds would the main source of funding
while treasury bills were to be used only for cash management purposes and not as a budget
financing instrument. The proportion of treasury bills was projected to decrease consistent with
the strategy of reducing rollover and refinancing risks.
11.2 Review of implementation of 2020 MTDS
Net domestic financing was Kshs 486,201 million (65.8 percent of total net financing) while net
external borrowing was Kshs 252,883 million (34.2 percent of total net financing) as at end June,
2021. On the domestic side, the actual outstanding domestic securities between treasury bills and
bonds was 21 percent and 79 percent respectively.
Net borrowing in the financial year 2020/21 was Kshs. 879.6 billion out of which Kshs 323.3
billion was raised through external borrowing while Kshs 556.3 billion through the domestic debt
market.

62
As shown in Table 11.2-1, overall, there were deviations of actual borrowing mix against the
FY2020/21 MTDS.
Table 11.2-1: MTDS targets against actual borrowing (Percent)
Borrowing source FY2017/18 FY2018/19 FY2019/20 FY2020/21*
External MTDS 60 57 38 28
Actual 55 58 28 23
Deviation 5 -1 10 5
Domestic MTDS 40 43 62 72
Actual 45 42 72 77
Deviation -5 1 -10 -5
*Provisional
Source: National Treasury
The actual external borrowing comprised of 20.16 percent concessional, 0.73 percent semi
concessional and 7.11 percent on commercial terms against 2020 MTDS strategy targets. The
amounts were borrowed majorly from multilateral lenders i.e., IDA and AfDB for Development
Policy Operations and financing of COVID-19 containment measures, all on concessional terms.
A total of USD 1,000 million was also contracted from the international capital market through
issuance of a Sovereign Bond.
11.3 Cost and risk characteristics of public debt
The weighted average interest rate of total debt is 6.9 percent where by the weighted averages of
external debt and domestic debt are 3.1 percent and 10.9 percent respectively. This indicates that
external debt is relatively cheap as compared to domestic debt when considering the debt pricing.
The Average Time to Maturity (ATM) for external debt and domestic debt was 11.2 years and 6.3
years respectively with an average of 9.1 years. The debt maturing in one year was 11 percent of
GDP of which external debt was 1.8 percent while the domestic debt was 9.2 percent. As a
percentage of total debt, debt maturing in one year was 15.5 percent with external debt amounting
to 4.6 percent while domestic was 29.7 percent. This signifies a higher refinancing risk on the
domestic debt compared to the external debt. The Average Time to Refixing (ATR) of the total
debt was at 8.4 years whereby the ATR for external debt was 10 years while domestic debt was
6.3 years.
Debt denominated in foreign currencies constituted 51.2 percent of total debt hence the exposure
to foreign exchange rate risk is moderate. The short-term foreign currency denominated debt
constituted 23 percent of foreign reserves.
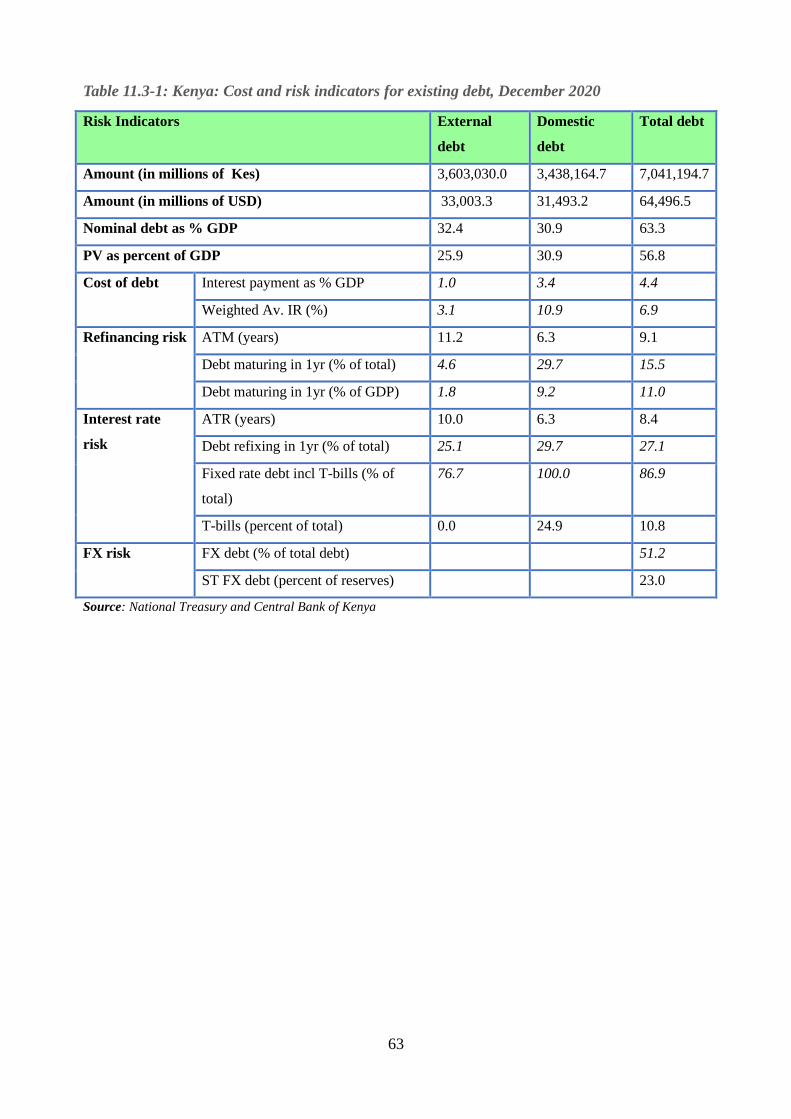
63
Table 11.3-1: Kenya: Cost and risk indicators for existing debt, December 2020
Risk Indicators External
debt
Domestic
debt
Total debt
Amount (in millions of Kes) 3,603,030.0 3,438,164.7 7,041,194.7
Amount (in millions of USD) 33,003.3 31,493.2 64,496.5
Nominal debt as % GDP 32.4 30.9 63.3
PV as percent of GDP 25.9 30.9 56.8
Cost of debt Interest payment as % GDP 1.0 3.4 4.4
Weighted Av. IR (%) 3.1 10.9 6.9
Refinancing risk ATM (years) 11.2 6.3 9.1
Debt maturing in 1yr (% of total) 4.6 29.7 15.5
Debt maturing in 1yr (% of GDP) 1.8 9.2 11.0
Interest rate
risk
ATR (years) 10.0 6.3 8.4
Debt refixing in 1yr (% of total) 25.1 29.7 27.1
Fixed rate debt incl T-bills (% of
total)
76.7 100.0 86.9
T-bills (percent of total) 0.0 24.9 10.8
FX risk FX debt (% of total debt) 51.2
ST FX debt (percent of reserves) 23.0
Source: National Treasury and Central Bank of Kenya
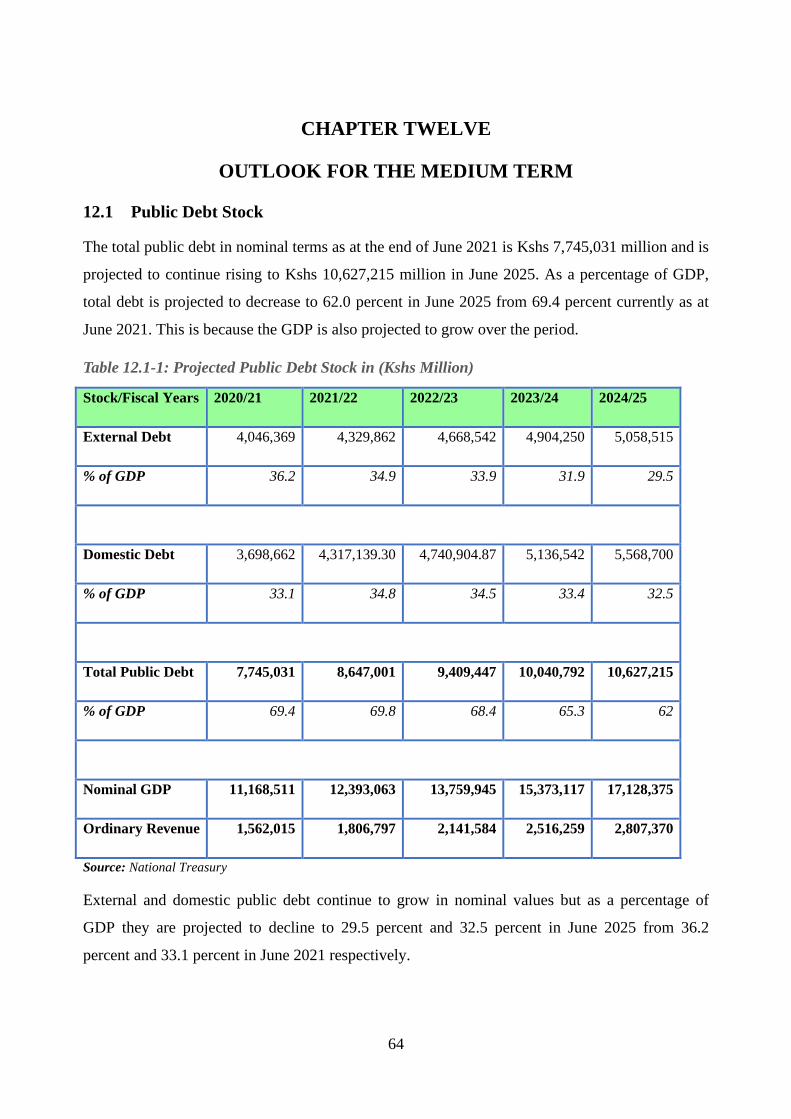
64
CHAPTER TWELVE
OUTLOOK FOR THE MEDIUM TERM
12.1 Public Debt Stock
The total public debt in nominal terms as at the end of June 2021 is Kshs 7,745,031 million and is
projected to continue rising to Kshs 10,627,215 million in June 2025. As a percentage of GDP,
total debt is projected to decrease to 62.0 percent in June 2025 from 69.4 percent currently as at
June 2021. This is because the GDP is also projected to grow over the period.
Table 12.1-1: Projected Public Debt Stock in (Kshs Million)
Stock/Fiscal Years 2020/21 2021/22 2022/23 2023/24 2024/25
External Debt 4,046,369 4,329,862 4,668,542 4,904,250 5,058,515
% of GDP 36.2 34.9 33.9 31.9 29.5
Domestic Debt 3,698,662 4,317,139.30 4,740,904.87 5,136,542 5,568,700
% of GDP 33.1 34.8 34.5 33.4 32.5
Total Public Debt 7,745,031 8,647,001 9,409,447 10,040,792 10,627,215
% of GDP 69.4 69.8 68.4 65.3 62
Nominal GDP 11,168,511 12,393,063 13,759,945 15,373,117 17,128,375
Ordinary Revenue 1,562,015 1,806,797 2,141,584 2,516,259 2,807,370
Source: National Treasury
External and domestic public debt continue to grow in nominal values but as a percentage of
GDP they are projected to decline to 29.5 percent and 32.5 percent in June 2025 from 36.2
percent and 33.1 percent in June 2021 respectively.

65
12.2 Debt Service
As at June 2021, the total debt service was Kshs 623,419 million and is projected to continue
increasing in nominal terms to Kshs 1,061,794 million in the FY 2024/25. As a proportion of
revenue, the debt service is projected to decrease to 37.8 percent in FY2024/25 from 39.9 percent
in FY2020/21 due to a project increase in revenue. Likewise, debt service as a percentage of
GDP, is projected to increase to 6.2 percent in FY 2024/25 from 5.6 percent in FY 2020/21.
Despite the upward trend on overall nominal interest payments as a percent of GDP and revenue
in the medium term, the same is expected to remain relatively constant at an average of 4.6
percent and 30.2 percent respectively.
Domestic interest is projected to increase to Kshs 614,956 million in FY 2024/25 from Kshs
388,829 million in FY 2020/21.However, as a percentage of revenue, domestic interest is
projected to decrease to 21.9 percent in FY 2024/25 from 24.9 percent in the period under review.
As a ratio of GDP, domestic interest will decrease to 32.5 percent in FY 2024/25 from 33.1
percent in FY2020/21.
Interest on external debt is projected to increase to Kshs 152,072 million in FY 2024/25 from
Kshs 106,312 million in FY 2020/21. As a ratio of GDP and revenue, external interest will fall to
29.5 percent and 5.4 percent in FY 2024/25 from 36.2 percent and 6.8 percent in FY 2020/21
respectively.
Principal repayments on external debt are projected to increase from Kshs 128,277 million in
FY2020/21 and peak to Kshs. 493,007 million in FY2023/24 due to the Eurobond repayments
before falling to Kshs 294,765 million in FY2024/25. As a ratio of GDP and revenue, the external
repayments will peak to 3.2 percent and 19.6 percent in FY 2023/24 from 1.1 percent and 8.2
percent in FY 2020/21 before decreasing to 1.7 percent and 10.5 percent FY 2024/25
respectively.

66
Table 12.2-1: Projected debt service (Kshs million)
Debt
Service
Fiscal years 2020/21 2021/22 2022/23 2023/24 2024/25
Domestic
interest
Amount
(Kshs
Million)
388,829 459,776 515,160 563,340 614,956
% of GDP 33.1 34.8 34.5 33.4 32.5
% of
Revenue
24.9 25.4 24.1 22.4 21.9
External
Interest
Amount
(Kshs
Million)
106,312 130,858 144,059 156,410 152,072
% of GDP 36.2 34.9 33.9 31.9 29.5
% of
Revenue
6.8 7.2 6.7 6.2 5.4
Total
Interest
payments
Amount
(Kshs
Million)
495,141 590,634 659,219 719,750 767,028
% of GDP 4.4 4.8 4.8 4.7 4.5
% of
Revenue
31.7 32.7 30.8 28.6 27.3
External
Principal
Repayments
Amount
(Kshs
Million)
128,277 210,173 250,020 493,007 294,765
% of GDP 1.1 1.7 1.8 3.2 1.7
% of
Revenue
8.2 11.6 11.7 19.6 10.5
Total Debt
service
Amount
(Kshs
Million)
623,419 800,807 909,240 1,212,758 1,061,794
% of
Revenue
39.9 44.3 42.5 48.2 37.8
% of GDP 5.6 6.5 6.6 7.9 6.2
Ordinary
Revenue
Amount
(Kshs
Million)
1,562,015 1,806,797 2,141,584 2,516,259 2,807,370
Nominal
GDP
Amount
(Kshs
Million)
11,168,511 12,393,063 13,759,945 15,373,117 17,128,374
Source: National Treasury

67
ANNEXES
Annex 1: Public Private Partnership (PPP) Projects with effective Project Agreements or Power Purchase Agreements (PPAs)
– Kenya, Government’s Support Measures and Termination Terms
No. Project Name Project Description Term
(Years)
Project
Value
($ Mn)
Status Type/Value/
Government
Support Measure
Amount of Termination Payment
(Default by GOK)
Call on
Government
Support
Measure
(Y/N)
1 LOT 33 of the Road
Annuity Programme
Construction and
rehabilitation to bitumen
standards the roads in Lot
33 (90.55km) Ngong-
Kiserian-Isinya and
Kajiado-Mashuru-Isara.
This is being done under a
Finance, Design, Build,
Maintain and Transfer PPP
arrangement
10 98.8 Date of contract
execution:
16th November
2016
Financial Close:
February 2018
Status:
Construction was
completed.
Operations
commenced on 1st
November 2020.
Letter of Support
covering political
risks issued on 4th
August 2017
-Debt Due
-The NPV and
-Sub-Contractor Costs
Y
2 Nairobi Expressway Construction of the
Mlolongo – JKIA- South
C- Uhuru Highway –
Westlands- James Gichuru
30 667.8 Date of contract
execution:
15th October 2019
Letter of Support
covering political
risks issued on 20th
August 2020.
-Debt Due
-The NPV and
Y
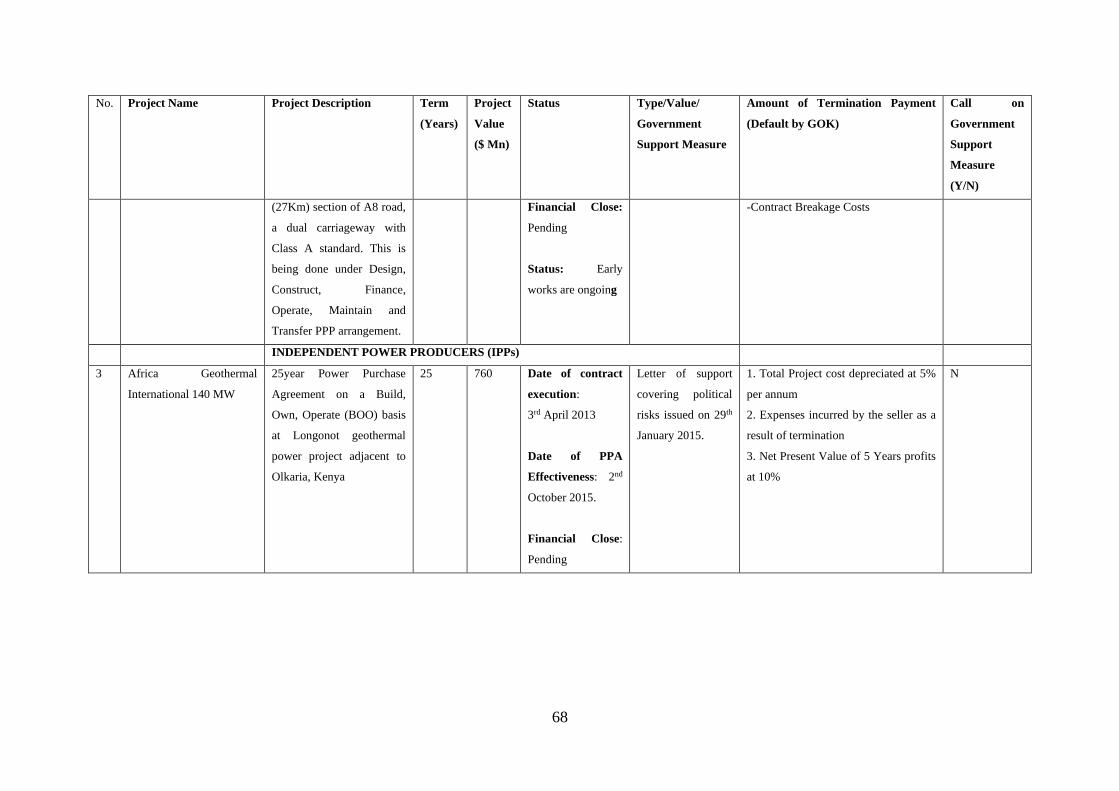
68
No. Project Name Project Description Term
(Years)
Project
Value
($ Mn)
Status Type/Value/
Government
Support Measure
Amount of Termination Payment
(Default by GOK)
Call on
Government
Support
Measure
(Y/N)
(27Km) section of A8 road,
a dual carriageway with
Class A standard. This is
being done under Design,
Construct, Finance,
Operate, Maintain and
Transfer PPP arrangement.
Financial Close:
Pending
Status: Early
works are ongoing
-Contract Breakage Costs
INDEPENDENT POWER PRODUCERS (IPPs)
3 Africa Geothermal
International 140 MW
25year Power Purchase
Agreement on a Build,
Own, Operate (BOO) basis
at Longonot geothermal
power project adjacent to
Olkaria, Kenya
25 760 Date of contract
execution:
3rd April 2013
Date of PPA
Effectiveness: 2nd
October 2015.
Financial Close:
Pending
Letter of support
covering political
risks issued on 29th
January 2015.
1. Total Project cost depreciated at 5%
per annum
2. Expenses incurred by the seller as a
result of termination
3. Net Present Value of 5 Years profits
at 10%
N
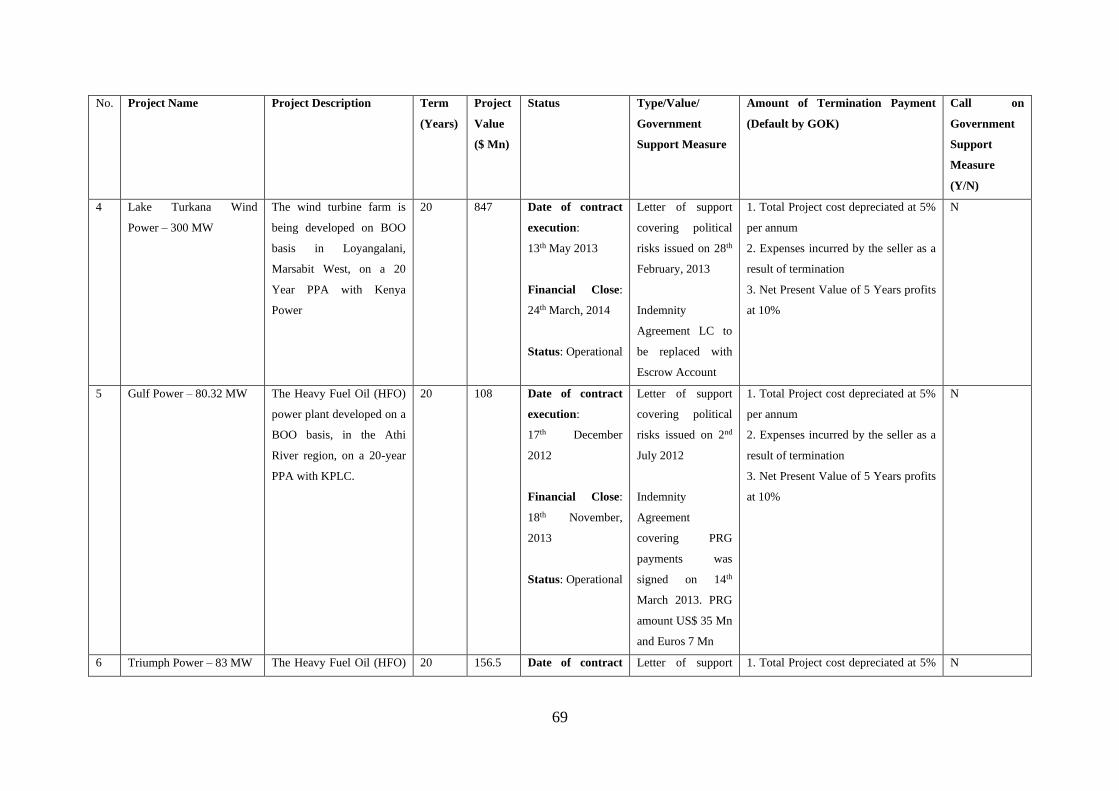
69
No. Project Name Project Description Term
(Years)
Project
Value
($ Mn)
Status Type/Value/
Government
Support Measure
Amount of Termination Payment
(Default by GOK)
Call on
Government
Support
Measure
(Y/N)
4 Lake Turkana Wind
Power – 300 MW
The wind turbine farm is
being developed on BOO
basis in Loyangalani,
Marsabit West, on a 20
Year PPA with Kenya
Power
20 847 Date of contract
execution:
13th May 2013
Financial Close:
24th March, 2014
Status: Operational
Letter of support
covering political
risks issued on 28th
February, 2013
Indemnity
Agreement LC to
be replaced with
Escrow Account
1. Total Project cost depreciated at 5%
per annum
2. Expenses incurred by the seller as a
result of termination
3. Net Present Value of 5 Years profits
at 10%
N
5 Gulf Power – 80.32 MW
The Heavy Fuel Oil (HFO)
power plant developed on a
BOO basis, in the Athi
River region, on a 20-year
PPA with KPLC.
20 108 Date of contract
execution:
17th December
2012
Financial Close:
18th November,
2013
Status: Operational
Letter of support
covering political
risks issued on 2nd
July 2012
Indemnity
Agreement
covering PRG
payments was
signed on 14th
March 2013. PRG
amount US$ 35 Mn
and Euros 7 Mn
1. Total Project cost depreciated at 5%
per annum
2. Expenses incurred by the seller as a
result of termination
3. Net Present Value of 5 Years profits
at 10%
N
6 Triumph Power – 83 MW The Heavy Fuel Oil (HFO) 20 156.5 Date of contract Letter of support 1. Total Project cost depreciated at 5% N

70
No. Project Name Project Description Term
(Years)
Project
Value
($ Mn)
Status Type/Value/
Government
Support Measure
Amount of Termination Payment
(Default by GOK)
Call on
Government
Support
Measure
(Y/N)
power plant developed on a
BOO basis, at Kitengela
near the Athi River area of
Mavoko, on a 20- year PPA
with KPLC.
execution:
14th June 2012
Financial Close:
7th August 2013
Status: Operational
covering political
risks issued on 2nd
July 2012
Indemnity
Agreement
covering PRG
payments was
signed on 5th
December 2012.
PRG Amount US$
45 Mn
per annum
2. Expenses incurred by the seller as a
result of termination
3. Net Present Value of 5 Years profits
at 10%
7 Thika Power - 87MW The Heavy Fuel Oil (HFO)
power plant is being
developed on a BOO basis,
at located near Thika town
in Kiambu County, on a
20- year PPA with KPLC.
20 146 Date of contract
execution: 2nd July
2012
Financial Close:
11th October 2012
Status: Operational
from August 2013
Letter of support
covering political
risks issued on 2nd
July 2012
Indemnity
Agreement
covering PRG
payments was
signed on 28th
August 2014. PRG
1. Total Project cost depreciated at 5%
per annum
2. Expenses incurred by the seller as a
result of termination 3. Net Present
Value of 5 Years profits at 10%
N
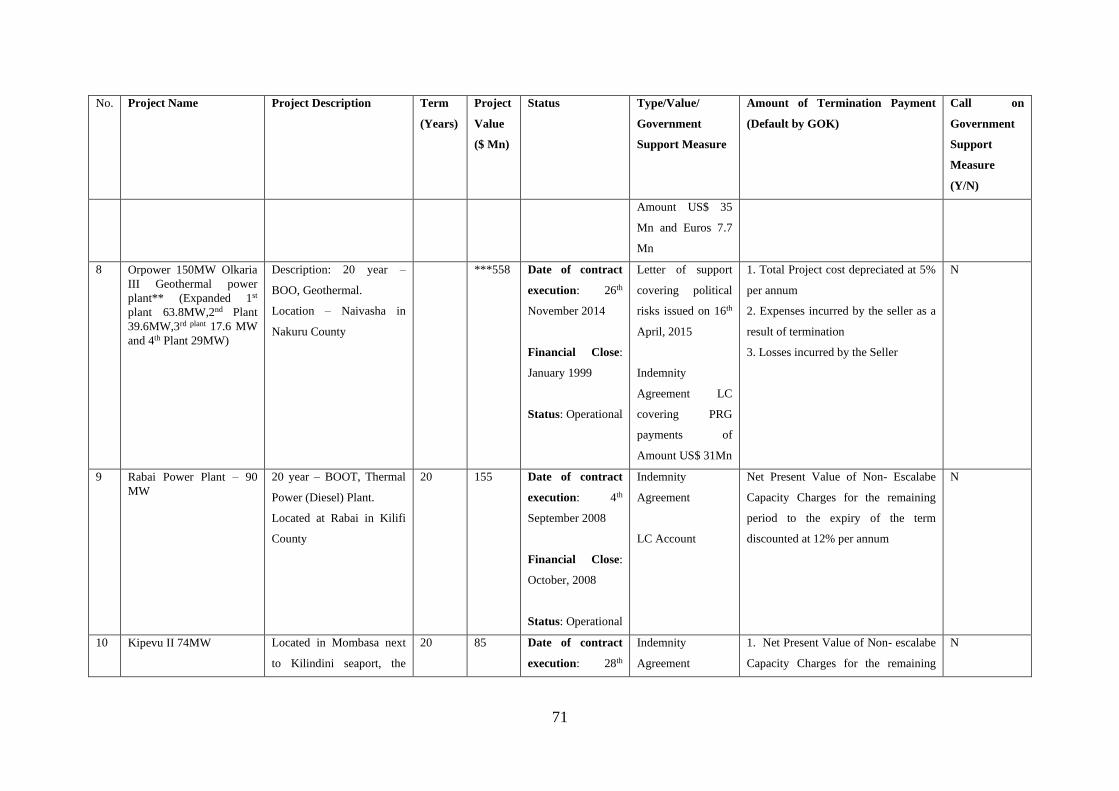
71
No. Project Name Project Description Term
(Years)
Project
Value
($ Mn)
Status Type/Value/
Government
Support Measure
Amount of Termination Payment
(Default by GOK)
Call on
Government
Support
Measure
(Y/N)
Amount US$ 35
Mn and Euros 7.7
Mn
8 Orpower 150MW Olkaria
III Geothermal power
plant** (Expanded 1st
plant 63.8MW,2nd Plant
39.6MW,3rd plant 17.6 MW
and 4th Plant 29MW)
Description: 20 year –
BOO, Geothermal.
Location – Naivasha in
Nakuru County
***558 Date of contract
execution: 26th
November 2014
Financial Close:
January 1999
Status: Operational
Letter of support
covering political
risks issued on 16th
April, 2015
Indemnity
Agreement LC
covering PRG
payments of
Amount US$ 31Mn
1. Total Project cost depreciated at 5%
per annum
2. Expenses incurred by the seller as a
result of termination
3. Losses incurred by the Seller
N
9 Rabai Power Plant – 90
MW
20 year – BOOT, Thermal
Power (Diesel) Plant.
Located at Rabai in Kilifi
County
20 155 Date of contract
execution: 4th
September 2008
Financial Close:
October, 2008
Status: Operational
Indemnity
Agreement
LC Account
Net Present Value of Non- Escalabe
Capacity Charges for the remaining
period to the expiry of the term
discounted at 12% per annum
N
10 Kipevu II 74MW Located in Mombasa next
to Kilindini seaport, the
20 85 Date of contract
execution: 28th
Indemnity
Agreement
1. Net Present Value of Non- escalabe
Capacity Charges for the remaining
N

72
No. Project Name Project Description Term
(Years)
Project
Value
($ Mn)
Status Type/Value/
Government
Support Measure
Amount of Termination Payment
(Default by GOK)
Call on
Government
Support
Measure
(Y/N)
Heavy Fuel Oil (HFO)
power plant is on BOO
basis over a 20-year period
January 2000
Financial Close:
Sept, 1999
Status: Operational
period to the expiry of the term
discounted at 10% per annum.
2. Expenses incurred by the Seller as
a result of termination.
3. The value of the stock of fuel and
other consumables and spare parts at
the Plant
11 Imenti tea Factory Limited
0.28MW
Feed in Tariff Hydro Power
Plant on a BOO basis
PPA period – 20 years
Location – Meru County
20 1.11 Date of contract
execution: 1st
September 2009
Status: Operational
None None N
12 Power Technology
Solutions Ltd. Gikira
Kianjora Small Hydro
Power Stations 0.514MW
Feed in Tariff, Hydro
Power Plant on a BOO
basis
PPA period -20 years
Location – Nyeri County
20 2.01 Date of contract
execution: 12th
June 2013
Status: Operational
None None N
13 1050 MW Lamu Power
Project
Located in Manda Bay, the
Lamu Coal Power Plant is
on a BOO basis over a 20-
year period
25 2,000 Date of contract
execution: 4th
August 2017
Status: PPA not
yet effective
Letter of support
covering political
risks issued on 4th
August, 2017
1. Total amount outstanding and unpaid to all Financing Parties – Debt & Equity
2. NPV of 5 years profits at 10%
discount rate
3. Redundancy payments/ Termination & Breakage costs 4. Value of unpaid construction works as at
N

73
No. Project Name Project Description Term
(Years)
Project
Value
($ Mn)
Status Type/Value/
Government
Support Measure
Amount of Termination Payment
(Default by GOK)
Call on
Government
Support
Measure
(Y/N)
termination
14 100 MW Kipeto Wind Power
Feed in Tariff, Wind Power
Plant on a BOO basis
PPA period – 20 years
Location - Kajiado County
20 323 Date of contract
execution:
17th June 2016
Status: Plant
commissioning
underway
Letter of support
covering political
risks issued on 4th
August 2017.
1. Total amount outstanding and unpaid to all Financing Parties – Debt & Equity
2. NPV of 5 years’ profits at 10%
discount rate
3. Redundancy payments/ Termination & Breakage costs 4. Value of unpaid construction works as at termination
N
15 35MW Geothermal Quantum Power Project
Located in Nakuru County,
the Quantum Geothermal
Power project is based on
BOO arrangement over 20
years
25 90 Date of contract
execution: 30th
October 2014
Status: Financial
Close pending
Letter of support
covering political
risks issued
1. Total amount outstanding and
unpaid to all Financing Parties – Debt
& Equity
2. NPV of 5 years profits at 10%
discount rate
4. Redundancy payments/ Termination
& Breakage costs
3. Value of unpaid construction works
as at termination
N
16 40 MW Cedate Solar Power
Feed in Tariff Power Plant
on a BOO basis
PPA period – 20 years
Location – Uasin Gishu
County
20 77 Date of contract
execution: 5th
June 2017
Status:
Commissioning
Letter of support
covering political
risks issued on 4th
August 2017.
1. The total project costs as derived
from the audited Selenkei/Cedate
Financial Model depreciated at 5% per
annum.
2. The compensation amount to
N

74
No. Project Name Project Description Term
(Years)
Project
Value
($ Mn)
Status Type/Value/
Government
Support Measure
Amount of Termination Payment
(Default by GOK)
Call on
Government
Support
Measure
(Y/N)
underway
Cedate/ Selenkei shall be limited in
aggregate to an amount equal to net
present value calculated at 10%
discount rate of the audited profit of
Selenkei for the last 5 years for the loss
of return on equity.
17 40 MW Selenkei Solar Power
Feed in Tariff Power Plant
on a BOO basis
PPA period – 20 years
Location – Uasin Gishu
County
20 84 Date of contract
execution: 5th June
2017
Status:
Commissioning
underway
Letter of support
covering political
risks issued on 4th
August 2017.
N
18 40 MW Malindi Solar Power Project
Feed in Tariff Power Plant
on a BOO basis
PPA period – 20 years
Location – Kilifi County
20 82 Date of contract
execution: 5th June
2017
Status: Under
construction
Letter of support
covering political
risks issued.
1. Total amount total amount outstanding and unpaid to all Financing Parties – Debt & Equity
2. NPV of 5 years profits at 10%
discount rate
3. Redundancy payments/ Termination & Breakage costs 4. Value of unpaid construction works as at termination
N
19 40 MW Alten Solar Power Project
Feed in Tariff Power Plant
on BOO basis
PPA period – 20 years
20 105 Date of contract
execution: 5th June
2017
Letter of support
covering political
risks issued on 14th
1. The total project costs as derived from the audited Financial Model depreciated at 5% per annum. The compensation amount to Alten shall be limited in aggregate to amount equal to
N

75
No. Project Name Project Description Term
(Years)
Project
Value
($ Mn)
Status Type/Value/
Government
Support Measure
Amount of Termination Payment
(Default by GOK)
Call on
Government
Support
Measure
(Y/N)
Location – Uasin Gishu
County
Status: Review of
Interconnection
Facility designs
underway.
December 2017. net present value calculated at 10% discount rate of the audited profit of Alten for the last complete five (5) Contract Years prior to the date of termination of the PPA
20 Chania Green 50MW Wind Power Plant
Feed in Tariff Wind Power
Plant on a BOO basis
PPA period – 20 years
Location – Kajiado County
20 102 Date of contract
execution: 24th
August 2017
Status:
Construction
ongoing
Letter of support
covering political
risks issued on 26th
January 2018.
1.Total amount Total amount outstanding and unpaid to all Financing Parties – Debt & Equity
2. All amounts paid to Seller by way of
subscription in Seller capital, less
dividends and other distribution made
to shareholders of Seller
3. Redundancy payments/ Termination & Breakage costs 4. Value of unpaid construction works as at termination
N
21 Biojoule 2MW
Feed in Tariff, Biogas,
2MW Power Plant on a
BOO basis
PPA period – 20 years
Location – Nakuru County
20 6 Date of contract
execution: 25th
January 2016
Status: Operational
Monthly Liquidated Damages, until the operating year when the agreement would have terminated by effluxion of
time, an amount equivalent to the average monthly revenue which the seller would have earned.
N

76
No. Project Name Project Description Term
(Years)
Project
Value
($ Mn)
Status Type/Value/
Government
Support Measure
Amount of Termination Payment
(Default by GOK)
Call on
Government
Support
Measure
(Y/N)
22 Regen Terem Feed in Tariff Power Plant
5.0MW on a BOO basis
PPA period – 20 years
Location – Bungoma
County
20 20 Date of contract
execution: 28th
January 2014
Status: Operational
- Total project costs incurred by the Seller as at the time of termination, less 5% depreciation for every year of service from the Full Commercial Operation Date.
N
23 Chania Power 0.5MW
Feed in Tariff Hydro Power
Plant on a BOO basis
PPA period – 20 years
Location – Murang’a
County
20 1.4 Date of contract
execution: 25th
May 2017
Status: under
Commissioning
- Total project costs incurred by the Seller as at the time of termination, less 5% depreciation for every year of service from the Full Commercial Operation Date. However, Seller and Buyer may agree on alternative arrangements.
N
24
Gura (KTDA), 2.8MW
Feed in Tariff, Hydro
Power Plant on a BOO
basis
PPA period – 20 years
Location – Nyeri County
20 12 Date of contract
execution: 25th
May 2017
Status: Operational
- All amounts owed between the parties shall be paid upon termination
N

77
Annex 2: List of state owned enterprises with non-guaranteed loans
STATE CORPORATION SOE CREDITOR NAME CREDITO
R
CATEGO
RY
LOAN
CURREN
CY
LOAN
AMOUNT
PURPOSE MATURI
TY
YEAR2
OUTSTANDING
BALANCE KSHS
Kenya Airports Authority (KAA) KAA Agence Francaise De Developpement
(AFD)
External USD
93,000,000.00
Expansion
and
upgrade of facilities
project at
JKIA - Constructio
n of Terminal
IA and a
multi-storey car
park
5-10 years
6,610,352,490.00
Kenya Airports Authority (KAA) KAA Agence Francaise De Developpement
(AFD)
External USD
66,000,000.00
AFD –
MIA
Over 10
years
5,136,860,705.40
Jomo Kenyatta University of Advanced Technology
(JKUAT)
JKUA
T
KCB Bank Domestic KSH
1,897,777,000.00
JKUAT
Towers
5-10 years
1,456,388,000.00
Jomo Kenyatta University of Advanced Technology
(JKUAT)
JKUA
T
KCB Bank Domestic KSH
1,800,000,000.00
Kenyatta
Road 1
1-4 years
901,676,000.00
Jomo Kenyatta University of Advanced Technology
(JKUAT)
JKUA
T
KCB Bank Domestic KSH
750,000,000.00
Kenyatta
Road 2
1-4 years
380,976,000.00
Kenyatta University (KU) KU Co-operative Bank Domestic KSH
820,000,000.00
Term loan -
infrastructural
developme
nts
1-4 years
564,000,000.00
Kenyatta University (KU) KU Equity Bank Domestic KSH
700,000,000.00
Overdraft
facility
/Term Loan - for
running the
operations
of the
University
(Kshs. 450 million -
term loan
and Kshs. 250
million-
overdraft)
1-4 years
700,000,000.00
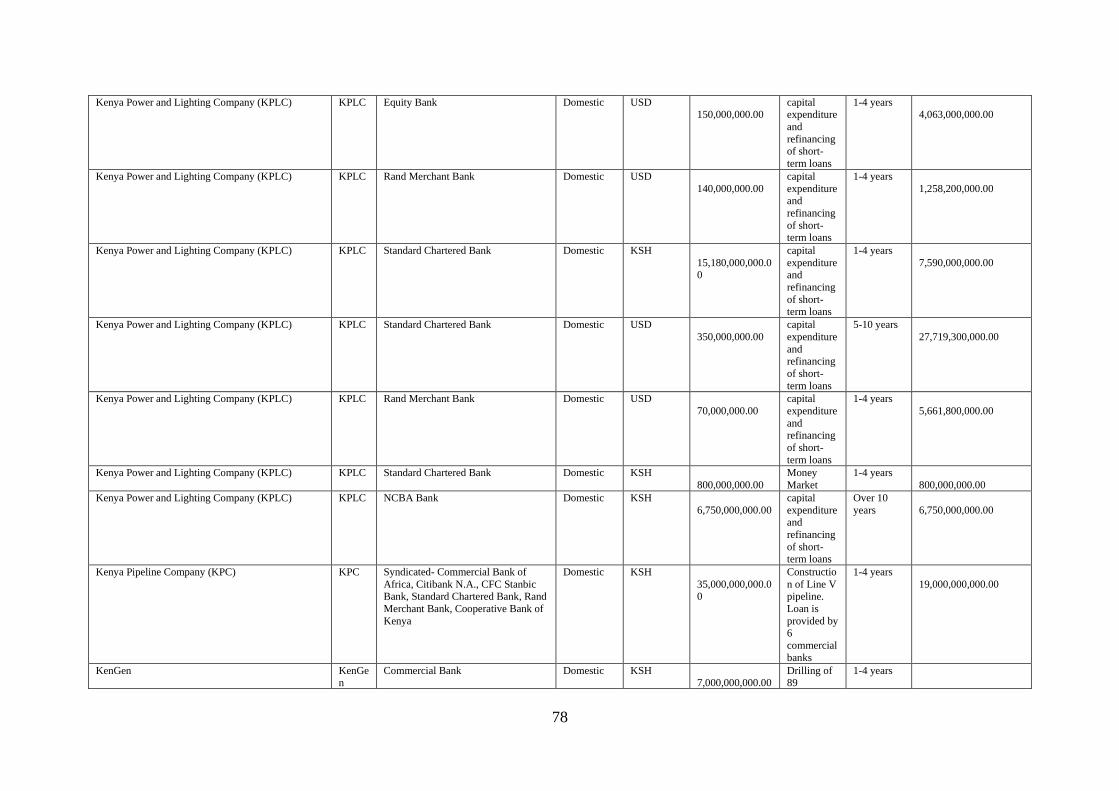
78
Kenya Power and Lighting Company (KPLC) KPLC Equity Bank Domestic USD 150,000,000.00
capital expenditure
and
refinancing of short-
term loans
1-4 years 4,063,000,000.00
Kenya Power and Lighting Company (KPLC) KPLC Rand Merchant Bank Domestic USD
140,000,000.00
capital
expenditure and
refinancing
of short-term loans
1-4 years
1,258,200,000.00
Kenya Power and Lighting Company (KPLC) KPLC Standard Chartered Bank Domestic KSH
15,180,000,000.00
capital
expenditure and
refinancing
of short-term loans
1-4 years
7,590,000,000.00
Kenya Power and Lighting Company (KPLC) KPLC Standard Chartered Bank Domestic USD
350,000,000.00
capital
expenditure
and refinancing
of short-
term loans
5-10 years
27,719,300,000.00
Kenya Power and Lighting Company (KPLC) KPLC Rand Merchant Bank Domestic USD
70,000,000.00
capital
expenditure
and refinancing
of short-
term loans
1-4 years
5,661,800,000.00
Kenya Power and Lighting Company (KPLC) KPLC Standard Chartered Bank Domestic KSH
800,000,000.00
Money
Market
1-4 years
800,000,000.00
Kenya Power and Lighting Company (KPLC) KPLC NCBA Bank Domestic KSH
6,750,000,000.00
capital
expenditure and
refinancing
of short-term loans
Over 10
years
6,750,000,000.00
Kenya Pipeline Company (KPC) KPC Syndicated- Commercial Bank of
Africa, Citibank N.A., CFC Stanbic Bank, Standard Chartered Bank, Rand
Merchant Bank, Cooperative Bank of
Kenya
Domestic KSH
35,000,000,000.00
Constructio
n of Line V pipeline.
Loan is
provided by 6
commercial
banks
1-4 years
19,000,000,000.00
KenGen KenGen
Commercial Bank Domestic KSH 7,000,000,000.00
Drilling of 89
1-4 years

79
Geothermal Wells
KenGen KenGe
n
Commercial Bank Domestic KSH
25,000,000,000.0
0
Various
Projects
Project Term Loan
1-4 years
23,340,000,000.00
KenGen KenGe
n
Commercial Bank Domestic USD
100,000,000.00
Well heads 5-10 years
9,225,017,100.00
KenGen KenGen
Commercial Bank Domestic USD 39,000,000.00
Olkaria II 3rd Unit
1-4 years
KenGen KenGe
n
Commercial Bank Domestic USD
34,000,000.00
Purchase of
Rigs
1-4 years
3,253,319,640.00
KenGen KenGen
Commercial Bank Domestic USD 20,000,000.00
Olkaria II 3rd Unit
AFD
1-4 years 1,965,092,400.00
University of Nairobi (UON) UON ABSA Bank Domestic KSH 950,000,000.00
ABSA BANK
5-10 years 783,000,000.00
Postal Corporation Of Kenya (PCK) PCK CBA Bank Domestic KSH
250,000,000.00
Working
capital
Loan (i) to improve
payment
services (KShs. 150
million);
(ii) to
improve
Kisumu office
(KShs. 50
million); (iii) to
improve
agency business
(KShs. 50
million).
5-10 years
20,000,000.00
East African Portland Cement (EAPCC) EAPCC
KCB Bank Domestic KSH 6,600,000,000.00
The company
had Kshs.
6.6Bn. loan with KCB
which was
partially liquidated -
by Kshs.
4.85B - through the
1-4 years 1,750,000,000.00

80
sale of land.
128,928,982,335.40

81