the net effects of the project network return-to-work … security bulletin Ł vol. 63 Ł no. 1 Ł...
TRANSCRIPT
Social Security Bulletin � Vol. 63 � No. 1 � 200012
The Net Effects of the Project NetWork Return-to-WorkCase Management Experiment on Participant Earnings,Benefit Receipt, and Other Outcomesby Robert Kornfeld and Kalman Rupp*
Summary
The Social Security Administration (SSA)initiated Project NetWork in 1991 to test casemanagement as a means of promoting employ-ment among persons with disabilities. Thedemonstration, which targeted Social SecurityDisability Insurance (DI) beneficiaries andSupplemental Security Income (SSI) appli-cants and recipients, offered intensiveoutreach, work-incentive waivers, and casemanagement/referral services. Participation inProject NetWork was voluntary. Volunteerswere randomly assigned to the �treatment�group or the �control� group. Those as-signed to the treatment group met individuallywith a case or referral manager who arrangedfor rehabilitation and employment services,helped clients develop an individual employ-ment plan, and provided direct employmentcounseling services. Volunteers assigned tothe control group could not receive servicesfrom Project NetWork but remained eligible forany employment assistance already availablein their communities. For both treatment andcontrol groups, the demonstration waivedspecific DI and SSI program rules consideredto be work disincentives. The experimentalimpact study thus measures the incrementaleffects of case and referral managementservices.
The eight demonstration sites weresuccessful in implementing the experimentaldesign roughly as planned. Project NetWorkstaff were able to recruit large numbers of
participants and to provide rehabilitation andemployment services on a substantial scale.Most of the sites easily reached theirenrollment targets and were able to attractvolunteers with demographic characteristicssimilar to those of the entire SSI and DIcaseload and a broad range of moderate andsevere disabilities. However, by manymeasures, volunteers were generally more�work-ready� than project eligibles in thedemonstration areas who did not volunteer toreceive NetWork services.
Project NetWork case managementincreased average annual earnings by $220per year over the first 2 years followingrandom assignment. This statisticallysignificant impact, an approximate 11-percentincrease in earnings, is based on administra-tive data on earnings. For about 70 percent ofsample members, a third year of followup datawas available. For this limited sample, theestimated effect of Project NetWork onannual earnings declined to roughly zero inthe third followup year. The findings suggestthat the increase in earnings may have beenshort-lived and may have disappeared by thetime Project NetWork services ended.
Project NetWork did not reduce relianceon SSI or DI benefits by statistically signifi-cant amounts over the 30�42 month followupperiod. The services provided by ProjectNetWork thus did not reduce overall SSI andDI caseloads or benefits by substantialamounts, especially given that only about 5
The article summarizes theresults of a major socialexperiment initiated by theSocial Security Administra-tion to test case managementas a tool of promotingemployment among personswith moderate to severedisabilities. This comprehen-sive analysis shows thebenefits of using an experi-mental design to deriverealistic net outcome esti-mates. While the resultscannot be generalized toother case managementinterventions, they arenevertheless instructive forplanning new initiatives.
* The authors are, respec-tively, from Abt Associates, Inc.,and the Office of Research,Evaluation, and Statistics, Officeof Policy, Social SecurityAdministration.
Social Security Bulletin � Vol. 63 � No. 1 � 2000 13
percent of the eligible caseload volunteered to participate inProject NetWork.
Project NetWork produced modest net benefits to personswith disabilities and net costs to taxpayers. Persons withdisabilities gained mainly because the increases in theirearnings easily outweighed the small (if any) reduction inaverage SSI and DI benefits. For SSA and the federal govern-ment as a whole, the costs of Project NetWork were notsufficiently offset by increases in tax receipts resulting fromincreased earnings or reductions in average SSI and DIbenefits. The modest net benefits of Project NetWork topersons with disabilities are encouraging. How such benefitsof an experimental intervention should be weighed againstcosts to taxpayers depends on value judgments ofpolicymakers.
Because different case management projects involvedifferent kinds of services, these results cannot be directlygeneralized to other case management interventions. Theyare nevertheless instructive for planning new initiatives.Combining case and referral management services withvarious other interventions, such as longer term financialsupport for work or altered provider incentives, could producedifferent results. The effects of case and referral managementservices could also be sensitive to numerous site-specificfactors, such as the implementation process, labor marketconditions, and the availability of local services for personswith disabilities.
I. Introduction
This article, one of a series of papers, summarizes the keyoutcomes of Project NetWork, a return-to-work program forpersons with severe disabilities.1 The Social Security Admin-istration (SSA) initiated Project NetWork in 1991 to test thefeasibility and effects of outreach and case and referralmanagement services for beneficiaries of Social SecurityDisability Insurance (DI) and applicants for and recipients ofSupplemental Security Income (SSI). From 1992 to 1994,members of the target population in eight demonstration siteswere recruited to volunteer to receive Project NetWorkservices. A comprehensive evaluation component wasincluded in the demonstration design, including the randomassignment of 8,248 volunteers to a �treatment� groupreceiving case management services or to a �control� group ofpersons who did not receive case management services butwho could obtain services on their own. To increase theincentive to work, volunteers in both the treatment and controlgroups were also offered waivers of SSI and DI program rulesconsidered to act as work disincentives. The evaluation ofProject NetWork is thus a rigorous study of the effects of casemanagement services to encourage persons with disabilities toobtain work, a high-priority public policy issue.
The comprehensive evaluation design included severalmajor study components:
� Process study of implementation of the demonstrationat all eight sites;
� Participation analysis focusing on targeting and self-selection among eligibles, including comparisons of thecharacteristics of volunteers who participated in thedemonstration and the characteristics of eligible personswho did not volunteer;
� An experimental study based on the random assignmentof volunteering participants to treatment and controlstatus to measure the net incremental effect of casemanagement on the receipt of DI and SSI disabilitybenefits, earnings, and other outcomes during the post-randomization followup period;
� Supplemental statistical analysis to measure possiblewaiver effects on both treatment and control cases; and
� An analysis of the overall costs and benefits of ProjectNetWork from the perspective of disabled studyparticipants, taxpayers, and various levels ofgovernment.
This article focuses on the �net outcomes� (or net impacts)of the Project NetWork demonstration. The phrase netoutcomes connotes ultimate results, such as the longer termeffects on earnings, benefit receipt, and other outcomes.However, from a broader perspective there are other outcomesof interest that also relate to process or intermediate variables.For example, the implementation outcomes are of interest inassessing the feasibility of implementing a complex demonstra-tion design in different organizational and institutionalsettings. Likewise, the selection of participants among projecteligibles is an intermediate outcome of great interest in its ownright, and the intermediate outcome of service receipt isrelevant for the interpretation of net outcomes, and directlyenters the calculation of the overall benefits and costs of thedemonstration.
The evaluation is based in part on an extensive databaseobtained from both administrative records and personalsurveys. Basic demographic data on both the 8,248 volunteersand the 138,613 eligible nonparticipants who lived in thedemonstration areas but who did not volunteer for the demon-stration were compiled from SSA administrative records basedon a simulation of program eligibility rules.2 These data serveas a basis for analyzing the decision to volunteer for ProjectNetWork. SSI and DI benefit information for the monthsimmediately before and during the followup period wereobtained from administrative records. Annual data on earningscovered by Social Security were compiled from the MasterEarnings File (MEF) data system. In addition, baseline surveyinterviews of 3,439 randomly selected eligible nonparticipantsand treatment and control group members took place near thestart of the demonstration. Followup survey interviews of1,521 treatment and control group members took place 2�3years after random assignment. The surveys obtainedinformation on issues such as health and well-being andattitudes toward Project NetWork.
The article is organized as follows. The key features of theProject NetWork demonstration and implementation aresummarized in section II. Section III provides information on
Social Security Bulletin � Vol. 63 � No. 1 � 200014
the selection of participants who volunteered for the demon-stration. This sets the stage for the analysis of net impactssince the impact results are conditional on the characteristics ofthe participants who volunteered for the demonstration. Thenext section presents a discussion of the data sources andmethodology for the net impact analysis. Section V summarizesthe estimated experimental net impacts of case management onearnings, the receipt of DI and SSI benefits, and other out-comes. Section VI provides the results of subgroup analyses ofnet case management impacts by demographic and program-matic variables. A summary of the results of the analysis ofcosts and benefits from various perspectives is presented insection VII. Section VIII details the key lessons learned fromthe Project NetWork experiment for the design and implementa-tion of future demonstration evaluations. Lessons learned fromthe demonstration and a discussion of implications for newinitiatives are presented in section IX.
II. Demonstration Design
The Project NetWork demonstration was designed to test theefficacy of case management services in facilitating employmentamong severely disabled DI beneficiaries and SSI recipients andapplicants who responded to the program�s intensive outreach.This outreach to all members of this large target group wasrooted in the belief that the traditional vocational rehabilitation(VR) system did not have the resources to serve many severelydisabled beneficiaries, and that the program should insteadreach out to the full range of disability beneficiaries. It wasbelieved that many persons with severe disabilities are goodcandidates for employment intervention if the appropriate mix ofservices is provided. Case management was seen as a tool forfacilitating employment-oriented interventions customized foreach individual, given that persons with disabilities face a rangeof barriers to work. It was hoped that these services would leadto increased earnings and reduced receipt of benefits. Thedemonstration tested whether these services could be imple-mented on a large scale.
Voluntary participation was another important feature of thisdemonstration and in many similar employment and trainingexperiments. On a smaller scale, a similar voluntary model hasbeen used for the previous Transitional Employment TrainingDemonstration at SSA (Decker and Thornton 1995), whichtested these services for SSI recipients who have mentalretardation. The voluntary model is thought to facilitate thesuccess of the intervention by providing services for only aself-selected group of motivated persons with disabilities. Thevoluntary model also responded to ethical and operationalconsiderations that are important in setting up fair and workabledemonstrations of alternatives to the status quo. Volunteerswho participated were offered work-incentive waivers tofacilitate the demonstration. Both the voluntary nature of thedemonstration and the work-incentive provisions must beconsidered in interpreting the net outcome results.
For the demonstration volunteers, case managers provided avariety of services, such as intake, face-to-face contact with
clients, and the direct provision of job search assistance. Theyordered and evaluated vocational assessments, referredvolunteers to other service providers for job search assistance,classroom training, psychological counseling, physical therapy,business skills training, and other services. Most important,they were supposed to work with beneficiaries one-on-one. Asubstantial portion of their work was based on informalcontacts, sometimes generating job leads. Often, case manag-ers helped their clients to deal with several complex personalproblems as well.
The demonstration used four alternate delivery systems(models) to provide these case and referral managementservices. The four models had the same overall features,including identical outreach procedures and waiver provisions,but they differed somewhat in the implementation of the casemanagement intervention. Each of the four models of casemanagement was implemented in two of the eight demonstra-tion sites. The first three models differed only in the nature ofthe organizational role and experiences of the case manager. Inthe SSA Case Manager Model (Dallas and Fort Worth), casemanagement was provided by SSA staff. In the Private Contrac-tor Model (Phoenix/Las Vegas and Minneapolis), case manage-ment was provided by private rehabilitation organizations. Inthe VR Outstationing Model (New Hampshire and Richmond),case managers came from state VR agencies and were �out-stationed� in local SSA offices. The fourth model, the �SSAReferral Manager Model� (Tampa and Spokane/Coeurd�Alene), was designed to be less intensive and lower in cost:the focus was on referrals to other providers as opposed todirect services to clients.
Project NetWork thus provided three principal bundles ofservices: outreach, waivers, and case management. It isimportant to note that these three types of services targeteddifferent sets of DI beneficiaries and SSI applicants andrecipients. The outreach component of the demonstrationtargeted the broadest of the three groups, while waivers wereapplied to a narrower subset, and case management to an evensmaller, randomly selected subset. Understanding the relation-ship between these three groups is important for properlyidentifying the different evaluation questions that apply to thethree groups and for interpreting the evaluation results.
(1) For intensive outreach purposes, approximately 150,000DI beneficiaries and SSI recipients and applicants livingin the demonstration areas (�project eligibles�) wereinvited to participate without regard to the nature ofdisabilities. Outreach mailings targeted beneficiarieswho were on the rolls during the demonstration withoutregard to their potential employability or interest involunteering. Essentially this included all DI beneficia-ries and SSI recipients aged 16 to 65 who were on therolls. Similarly, all SSI applicants aged 16 to 65 whoapplied during the demonstration period were targetedfor outreach.
(2) Work-incentive waivers were offered to 8,248 participantswho volunteered for the demonstration. The 8,248participants included two randomly assigned subgroups:
Social Security Bulletin � Vol. 63 � No. 1 � 2000 15
treatment and control cases. (The randomization wasperformed off-site by an independent evaluationcontractor, Abt Associates, Inc.) The waivers weredesigned to facilitate work activity by project partici-pants. Waivers (a) allowed referrals to public andprivate rehabilitation services in addition to state VRagencies only as required by current law; (b) providedthat work performed for up to 12 months while in theproject for purposes of determining a trial work period(TWP) or substantial gainful activity (SGA) not becounted; (c) provided that continuing disability reviews(CDRs) not be counted when an SSI participant movesinto 1619 status. The most important waiver was tostop the TWP clock for 12 months among DI beneficia-ries. The waivers were less significant for the SSIgroup (for more detail, see McManus, Rupp, and Bell1993).
(3) Finally, case management services were offered to 4,160persons randomly assigned to the treatment group. Asdescribed earlier, case managers performed a variety ofemployment-related services directly or through outsidevendors.
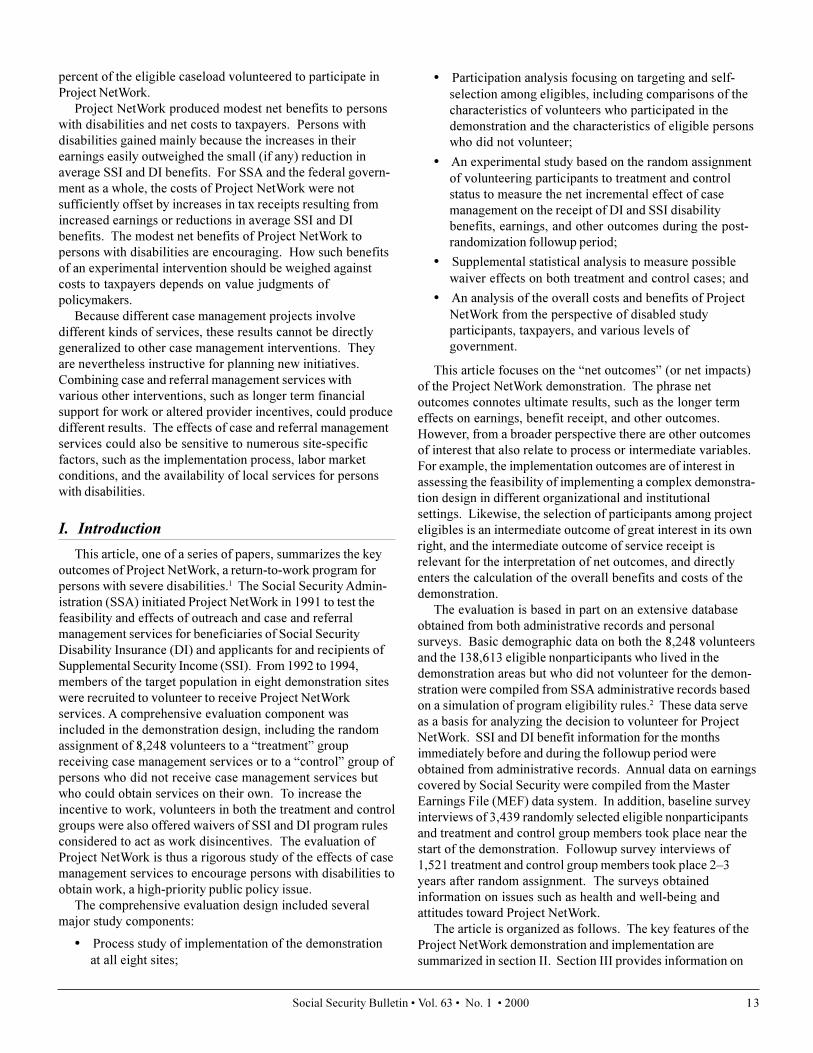
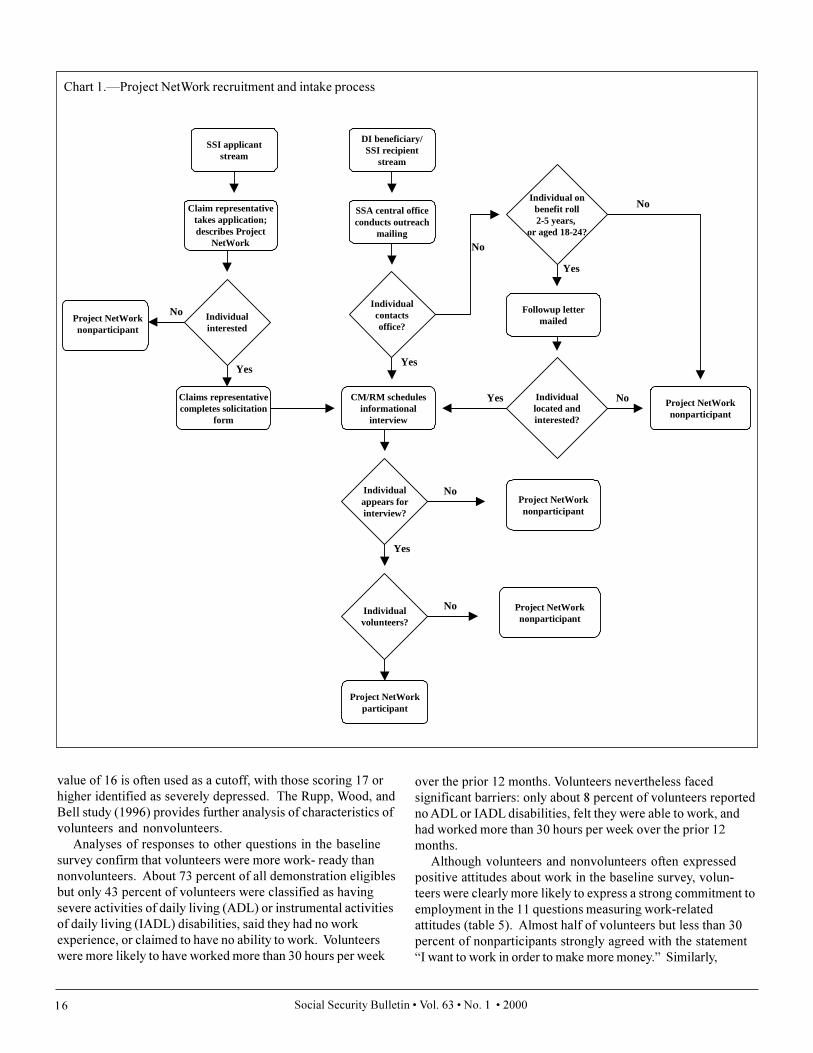
The Project NetWork recruitment and intake process isshown in chart 1. The two boxes on the top of the chartrepresent the two separate streams of persons subject tooutreach: the applicant stream refers to SSI applicants whowere informed of the opportunity to volunteer for ProjectNetWork by case managers; the beneficiary stream representspersons already on the DI or SSI disability rolls who wereinformed through an outreach mailing effort. The flowchartshows that identifying participants was a multi-step processstarting out with the individual expressing interest (pre-application) and ending up with an informed decision jointlymade with the case manager to sign up after receiving moredetailed information about the project. The box on the bottomrepresents the Project NetWork participants who volunteeredfor the demonstration. These participants were randomlyassigned to treatment and control status with a 50-percentchance of assignment to each group. This randomization tookplace immediately after signing up for participation.
The process study showed that all of the demonstrationmodels were able to recruit large numbers of participants andto provide rehabilitation and employment on a substantialscale. The massive outreach targeting about 150,000 personsliving in the demonstration areas through mailings to beneficia-ries and field office referrals of new SSI applicants wassuccessfully conducted, as was the implementation of all fourcase management models. The enrollment targets for volun-tary participation were met: a total of 8,284 persons�98.6percent of SSA�s goal of 8,400�volunteered for the demon-stration. Most participants completed assessment andemployment planning and received some employment-relatedservices in all models. The demonstration convincinglyshowed that broad-based return-to-work services can beimplemented on a large scale in a variety of institutionalarrangements.
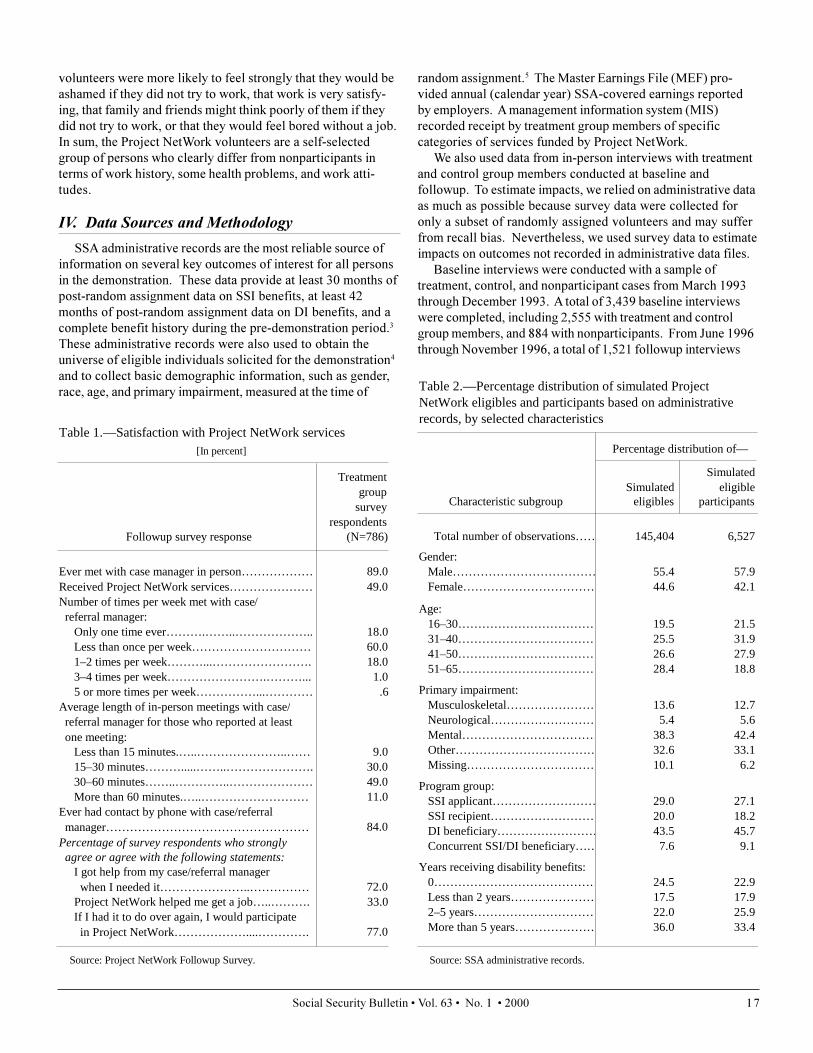
Most treatment group members who responded to thefollowup survey recall having met with their case/referralmanagers and had positive opinions of the helpfulness ofProject NetWork (table 1). The intensity of interactions withcase managers varied somewhat, although the vast majorityreported that they met with a case/referral manager at leastonce. It is notable that about 3 of 4 respondents reportedpositive experiences with the case managers, but only about 1of 3 reported that Project NetWork helped them to get a job.According to the management information system that kepttrack of services purchased for clients by case/referral manag-ers, about 45 percent of treatment group clients receivedpurchased rehabilitation services. This figure is roughly similarto the 49 percent of treatment group members who reportedreceiving Project NetWork services in the followup survey.
III. Participant Selection
The analysis of the Project NetWork outreach and self-selection process (Rupp, Wood, and Bell 1996; and Burstein,Roberts, and Wood 1999) showed that Project NetWorkoutreach successfully attracted persons with demographiccharacteristics similar to those of the entire SSI and DIcaseload and with a diverse range of disabilities. As one mightexpect, volunteers were generally more �work-ready� thannonvolunteers. These findings are shown in tables 2�5.
The general demographic characteristics of Project Networkvolunteers and the universe of all Project NetWork eligibles arevery similar (table 2). These findings are based on administra-tive records from SSA. Somewhat more than half are male, andabout half are aged 40 or younger. About 40 percent havemental impairments, 13 percent have musculoskeletal disabili-ties, about 5 percent have neurological problems, and aboutone-third have other types of primary impairments. Somewhatmore than half received DI benefits, while the rest eitherreceived SSI benefits or had attempted to apply for benefits.Several years of prior dependence on both DI and SSI benefitsis clearly common.
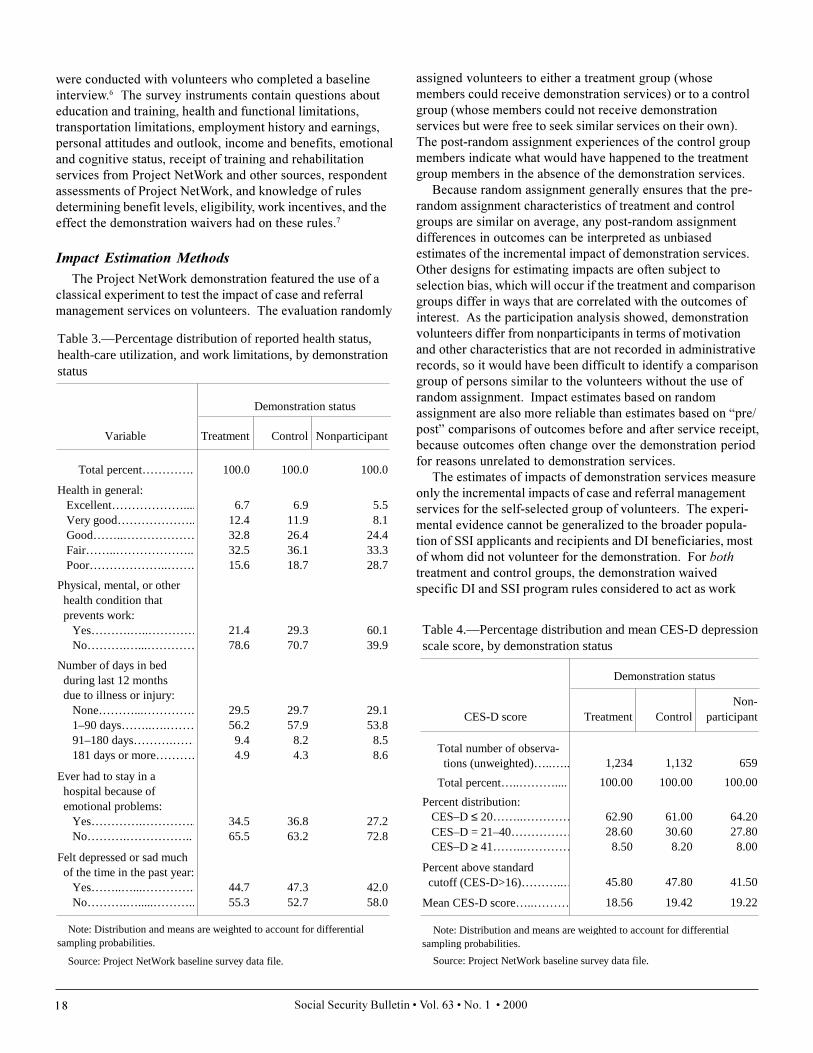
Some larger differences between volunteers andnonvolunteers emerge when we examine measures of healthstatus and work limitations reported by Project NetWorkeligibles who responded to the baseline survey. Nonvolun-teers are more likely than volunteers (treatment and controlgroup members) to report that they are in poor health or thatthey have a physical, mental, or other condition that preventswork (table 3). Nevertheless, volunteers still faced significanthealth problems. Volunteers and nonvolunteers reportedspending about the same number of days in bed because ofillness or injury, and volunteers were actually more likely tohave stayed in a hospital because of emotional problems or tohave felt depressed for much of the previous year.
A substantial number of volunteers and nonvolunteers wereclassified as depressed, according to the Center for Epidemio-logical Studies depression screener (CES-D, table 4). Thiswidely used screener is based on responses to 20 questionsabout the respondent�s emotional state, with possible scoresranging from zero (least depressed) to 60 (most depressed). A
Social Security Bulletin � Vol. 63 � No. 1 � 200016
value of 16 is often used as a cutoff, with those scoring 17 orhigher identified as severely depressed. The Rupp, Wood, andBell study (1996) provides further analysis of characteristics ofvolunteers and nonvolunteers.
Analyses of responses to other questions in the baselinesurvey confirm that volunteers were more work- ready thannonvolunteers. About 73 percent of all demonstration eligiblesbut only 43 percent of volunteers were classified as havingsevere activities of daily living (ADL) or instrumental activitiesof daily living (IADL) disabilities, said they had no workexperience, or claimed to have no ability to work. Volunteerswere more likely to have worked more than 30 hours per week
over the prior 12 months. Volunteers nevertheless facedsignificant barriers: only about 8 percent of volunteers reportedno ADL or IADL disabilities, felt they were able to work, andhad worked more than 30 hours per week over the prior 12months.
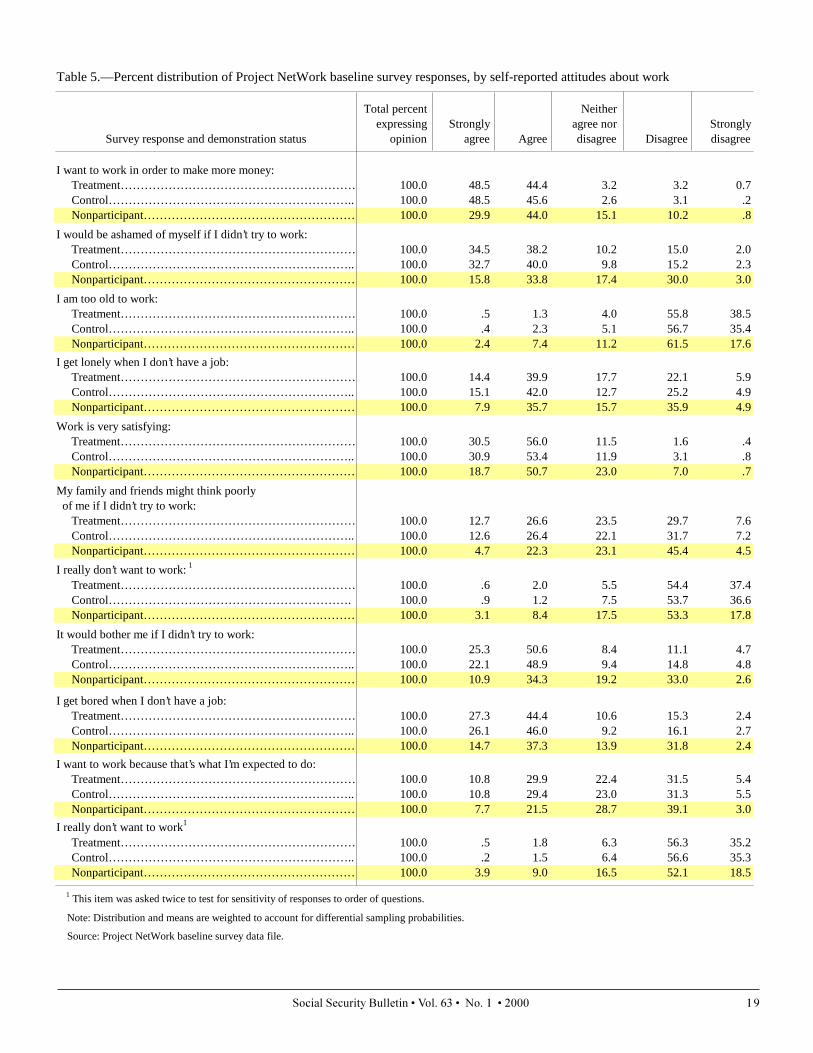
Although volunteers and nonvolunteers often expressedpositive attitudes about work in the baseline survey, volun-teers were clearly more likely to express a strong commitment toemployment in the 11 questions measuring work-relatedattitudes (table 5). Almost half of volunteers but less than 30percent of nonparticipants strongly agreed with the statement�I want to work in order to make more money.� Similarly,
Chart 1.�Project NetWork recruitment and intake process
SSI applicantstream
DI beneficiary/SSI recipient
stream
Claim representativetakes application;describes Project
NetWork
SSA central officeconducts outreach
mailing
Individualinterested
No
Claims representativecompletes solicitation
form
Project NetWorknonparticipant
Individualcontactsoffice?
YesYes
CM/RM schedulesinformational
interview
Individual onbenefit roll2-5 years,
or aged 18-24?
Followup lettermailed
Individuallocated andinterested?
Project NetWorknonparticipant
Individualappears forinterview?
Individualvolunteers?
Project NetWorkparticipant
Project NetWorknonparticipant
Project NetWorknonparticipant
No
Yes
No
Yes No
No
Yes
No
Social Security Bulletin � Vol. 63 � No. 1 � 2000 17
volunteers were more likely to feel strongly that they would beashamed if they did not try to work, that work is very satisfy-ing, that family and friends might think poorly of them if theydid not try to work, or that they would feel bored without a job.In sum, the Project NetWork volunteers are a self-selectedgroup of persons who clearly differ from nonparticipants interms of work history, some health problems, and work atti-tudes.
IV. Data Sources and Methodology
SSA administrative records are the most reliable source ofinformation on several key outcomes of interest for all personsin the demonstration. These data provide at least 30 months ofpost-random assignment data on SSI benefits, at least 42months of post-random assignment data on DI benefits, and acomplete benefit history during the pre-demonstration period.3
These administrative records were also used to obtain theuniverse of eligible individuals solicited for the demonstration4
and to collect basic demographic information, such as gender,race, age, and primary impairment, measured at the time of
random assignment.5 The Master Earnings File (MEF) pro-vided annual (calendar year) SSA-covered earnings reportedby employers. A management information system (MIS)recorded receipt by treatment group members of specificcategories of services funded by Project NetWork.
We also used data from in-person interviews with treatmentand control group members conducted at baseline andfollowup. To estimate impacts, we relied on administrative dataas much as possible because survey data were collected foronly a subset of randomly assigned volunteers and may sufferfrom recall bias. Nevertheless, we used survey data to estimateimpacts on outcomes not recorded in administrative data files.
Baseline interviews were conducted with a sample oftreatment, control, and nonparticipant cases from March 1993through December 1993. A total of 3,439 baseline interviewswere completed, including 2,555 with treatment and controlgroup members, and 884 with nonparticipants. From June 1996through November 1996, a total of 1,521 followup interviews
Table 2.—Percentage distribution of simulated ProjectNetWork eligibles and participants based on administrativerecords, by selected characteristics
Percentage distribution of—
SimulatedSimulated eligible
Characteristic subgroup eligibles participants
Total number of observations…… 145,404 6,527
Gender: Male……………………………… 55.4 57.9 Female…………………………… 44.6 42.1
Age: 16–30……………………………… 19.5 21.5 31–40……………………………… 25.5 31.9 41–50……………………………… 26.6 27.9 51–65……………………………… 28.4 18.8
Primary impairment: Musculoskeletal…………………… 13.6 12.7 Neurological……………………… 5.4 5.6 Mental……………………………… 38.3 42.4 Other……………………………… 32.6 33.1 Missing…………………………… 10.1 6.2
Program group: SSI applicant……………………… 29.0 27.1 SSI recipient……………………… 20.0 18.2 DI beneficiary……………………… 43.5 45.7 Concurrent SSI/DI beneficiary…… 7.6 9.1
Years receiving disability benefits: 0…………………………………… 24.5 22.9 Less than 2 years………………… 17.5 17.9 2–5 years…………………………… 22.0 25.9 More than 5 years………………… 36.0 33.4
Source: SSA administrative records.
[In percent]
Treatmentgroup
surveyrespondents
Followup survey response (N=786)
Ever met with case manager in person……………… 89.0Received Project NetWork services………………… 49.0Number of times per week met with case/ referral manager: Only one time ever……….……..……………….. 18.0 Less than once per week………………………… 60.0 1–2 times per week………...……………………. 18.0 3–4 times per week…………………….………... 1.0 5 or more times per week……………...………… .6Average length of in-person meetings with case/ referral manager for those who reported at least one meeting: Less than 15 minutes.…..…………………..…… 9.0 15–30 minutes……….....……..…………………. 30.0 30–60 minutes……..…………..………………… 49.0 More than 60 minutes.…..……………………… 11.0Ever had contact by phone with case/referral manager…………………………………………… 84.0
agree or agree with the following statements: I got help from my case/referral manager when I needed it…………………..…………… 72.0 Project NetWork helped me get a job…..………. 33.0 If I had it to do over again, I would participate in Project NetWork………………....…………. 77.0
Source: Project NetWork Followup Survey.
Table 1.—Satisfaction with Project NetWork services
Percentage of survey respondents who strongly
Social Security Bulletin � Vol. 63 � No. 1 � 200018
assigned volunteers to either a treatment group (whosemembers could receive demonstration services) or to a controlgroup (whose members could not receive demonstrationservices but were free to seek similar services on their own).The post-random assignment experiences of the control groupmembers indicate what would have happened to the treatmentgroup members in the absence of the demonstration services.
Because random assignment generally ensures that the pre-random assignment characteristics of treatment and controlgroups are similar on average, any post-random assignmentdifferences in outcomes can be interpreted as unbiasedestimates of the incremental impact of demonstration services.Other designs for estimating impacts are often subject toselection bias, which will occur if the treatment and comparisongroups differ in ways that are correlated with the outcomes ofinterest. As the participation analysis showed, demonstrationvolunteers differ from nonparticipants in terms of motivationand other characteristics that are not recorded in administrativerecords, so it would have been difficult to identify a comparisongroup of persons similar to the volunteers without the use ofrandom assignment. Impact estimates based on randomassignment are also more reliable than estimates based on �pre/post� comparisons of outcomes before and after service receipt,because outcomes often change over the demonstration periodfor reasons unrelated to demonstration services.
The estimates of impacts of demonstration services measureonly the incremental impacts of case and referral managementservices for the self-selected group of volunteers. The experi-mental evidence cannot be generalized to the broader popula-tion of SSI applicants and recipients and DI beneficiaries, mostof whom did not volunteer for the demonstration. For bothtreatment and control groups, the demonstration waivedspecific DI and SSI program rules considered to act as work
were conducted with volunteers who completed a baselineinterview.6 The survey instruments contain questions abouteducation and training, health and functional limitations,transportation limitations, employment history and earnings,personal attitudes and outlook, income and benefits, emotionaland cognitive status, receipt of training and rehabilitationservices from Project NetWork and other sources, respondentassessments of Project NetWork, and knowledge of rulesdetermining benefit levels, eligibility, work incentives, and theeffect the demonstration waivers had on these rules.7
Impact Estimation MethodsThe Project NetWork demonstration featured the use of a
classical experiment to test the impact of case and referralmanagement services on volunteers. The evaluation randomly
scale score, by demonstration status
Demonstration status
CES-D score Treatment ControlNon-
participant
Total number of observa- tions (unweighted)…..….. 1,234 1,132 659
Total percent…..……….... 100.00 100.00 100.00
Percent distribution: CES–D ≤ 20……..………… 62.90 61.00 64.20 CES–D = 21–40…………… 28.60 30.60 27.80 CES–D ≥ 41……..………… 8.50 8.20 8.00
Percent above standard cutoff (CES-D>16)………..… 45.80 47.80 41.50
Mean CES-D score…..……… 18.56 19.42 19.22
sampling probabilities.
Table 4.—Percentage distribution and mean CES-D depression
Source: Project NetWork baseline survey data file.
Note: Distribution and means are weighted to account for differential
Table 3.—Percentage distribution of reported health status,health-care utilization, and work limitations, by demonstrationstatus
Demonstration status
Variable Treatment Control Nonparticipant
Total percent…………. 100.0 100.0 100.0
Health in general: Excellent……………….... 6.7 6.9 5.5 Very good……………….. 12.4 11.9 8.1 Good……..……………… 32.8 26.4 24.4 Fair……..……………….. 32.5 36.1 33.3 Poor………………..……. 15.6 18.7 28.7
Physical, mental, or other health condition that prevents work: Yes……….…..………… 21.4 29.3 60.1 No……….…...………… 78.6 70.7 39.9
Number of days in bed during last 12 months due to illness or injury: None………...…………. 29.5 29.7 29.1 1–90 days……..….……… 56.2 57.9 53.8 91–180 days……….…… 9.4 8.2 8.5 181 days or more………. 4.9 4.3 8.6
Ever had to stay in a hospital because of emotional problems: Yes………….………….. 34.5 36.8 27.2 No……….…………….. 65.5 63.2 72.8
Felt depressed or sad much of the time in the past year: Yes……..…...………….. 44.7 47.3 42.0 No……….….....……….. 55.3 52.7 58.0
Note: Distribution and means are weighted to account for differential sampling probabilities.
Source: Project NetWork baseline survey data file.
Social Security Bulletin � Vol. 63 � No. 1 � 2000 19
Table 5.—Percent distribution of Project NetWork baseline survey responses, by self-reported attitudes about work
Total percent Neitherexpressing Strongly agree nor Strongly
Survey response and demonstration status opinion agree Agree disagree Disagree disagree
I want to work in order to make more money: Treatment…………………………………………………… 100.0 48.5 44.4 3.2 3.2 0.7 Control…………………………………………………….. 100.0 48.5 45.6 2.6 3.1 .2 Nonparticipant……………………………………………… 100.0 29.9 44.0 15.1 10.2 .8
I would be ashamed of myself if I didn’t try to work: Treatment…………………………………………………… 100.0 34.5 38.2 10.2 15.0 2.0 Control…………………………………………………….. 100.0 32.7 40.0 9.8 15.2 2.3 Nonparticipant……………………………………………… 100.0 15.8 33.8 17.4 30.0 3.0
I am too old to work: Treatment…………………………………………………… 100.0 .5 1.3 4.0 55.8 38.5 Control…………………………………………………….. 100.0 .4 2.3 5.1 56.7 35.4 Nonparticipant……………………………………………… 100.0 2.4 7.4 11.2 61.5 17.6
I get lonely when I don’t have a job: Treatment…………………………………………………… 100.0 14.4 39.9 17.7 22.1 5.9 Control…………………………………………………….. 100.0 15.1 42.0 12.7 25.2 4.9 Nonparticipant……………………………………………… 100.0 7.9 35.7 15.7 35.9 4.9
Work is very satisfying: Treatment…………………………………………………… 100.0 30.5 56.0 11.5 1.6 .4 Control…………………………………………………….. 100.0 30.9 53.4 11.9 3.1 .8 Nonparticipant……………………………………………… 100.0 18.7 50.7 23.0 7.0 .7
My family and friends might think poorly of me if I didn’t try to work: Treatment…………………………………………………… 100.0 12.7 26.6 23.5 29.7 7.6 Control…………………………………………………….. 100.0 12.6 26.4 22.1 31.7 7.2 Nonparticipant……………………………………………… 100.0 4.7 22.3 23.1 45.4 4.5
I really don’t want to work: 1
Treatment…………………………………………………… 100.0 .6 2.0 5.5 54.4 37.4 Control……………………………………………………. 100.0 .9 1.2 7.5 53.7 36.6 Nonparticipant……………………………………………… 100.0 3.1 8.4 17.5 53.3 17.8
It would bother me if I didn’t try to work: Treatment…………………………………………………… 100.0 25.3 50.6 8.4 11.1 4.7 Control…………………………………………………….. 100.0 22.1 48.9 9.4 14.8 4.8 Nonparticipant……………………………………………… 100.0 10.9 34.3 19.2 33.0 2.6
I get bored when I don’t have a job: Treatment…………………………………………………… 100.0 27.3 44.4 10.6 15.3 2.4 Control…………………………………………………….. 100.0 26.1 46.0 9.2 16.1 2.7 Nonparticipant……………………………………………… 100.0 14.7 37.3 13.9 31.8 2.4
I want to work because that’s what I’m expected to do: Treatment…………………………………………………… 100.0 10.8 29.9 22.4 31.5 5.4 Control…………………………………………………….. 100.0 10.8 29.4 23.0 31.3 5.5 Nonparticipant……………………………………………… 100.0 7.7 21.5 28.7 39.1 3.0
I really don’t want to work1
Treatment…………………………………………………… 100.0 .5 1.8 6.3 56.3 35.2 Control…………………………………………………….. 100.0 .2 1.5 6.4 56.6 35.3 Nonparticipant……………………………………………… 100.0 3.9 9.0 16.5 52.1 18.5
1 This item was asked twice to test for sensitivity of responses to order of questions.
Note: Distribution and means are weighted to account for differential sampling probabilities.
Source: Project NetWork baseline survey data file.
Social Security Bulletin � Vol. 63 � No. 1 � 200020
disincentives, so the experimental impact analysis cannotisolate the effect of these waivers. A nonexperimentalanalysis (Burstein, Beecroft, Hiller, and Wood 1999)showed no clear evidence of waiver effects on earningsand benefits.
Impacts were estimated by comparing the outcomes of thetreatment and control groups, using standard tests of statisticalsignificance to determine the level of confidence we can havethat the estimated impact represents a real effect, rather than adifference that could be expected on the basis of chance alone.In this analysis, any estimated impact that is larger than whatcould be expected on the basis of chance alone 90 percent ofthe time is deemed evidence of a real effect. To adjust forchance differences between the treatment and control groupsand thereby provide more precise impact estimates, treatment/control differences in outcomes have been adjusted by regres-sion analysis wherever possible to account for any chancedifferences in the measured baseline characteristics of the twogroups.
The results of these standard hypothesis tests should beinterpreted with care. Whenever an estimated impact is notstatistically significant, two explanations are possible. The firstis that Project NetWork truly had no effect on the outcome. Thesecond is that Project NetWork really had an impact, but thesize of the true impact is too small to detect given the availablesample size. Another potential problem with these tests, whichare intended to identify effects that have a probability of lessthan 10 percent of occurring by chance alone, is that there isalso a 10-percent chance that a single estimate will be statisti-cally significant by chance alone, even when the true effect iszero. At least a few of these false positives are bound to appearwhenever we examine a large number of impact estimates formany outcomes and subgroups.
V. Experimental Analysis of Net Impacts
Impacts on Receipt of Services
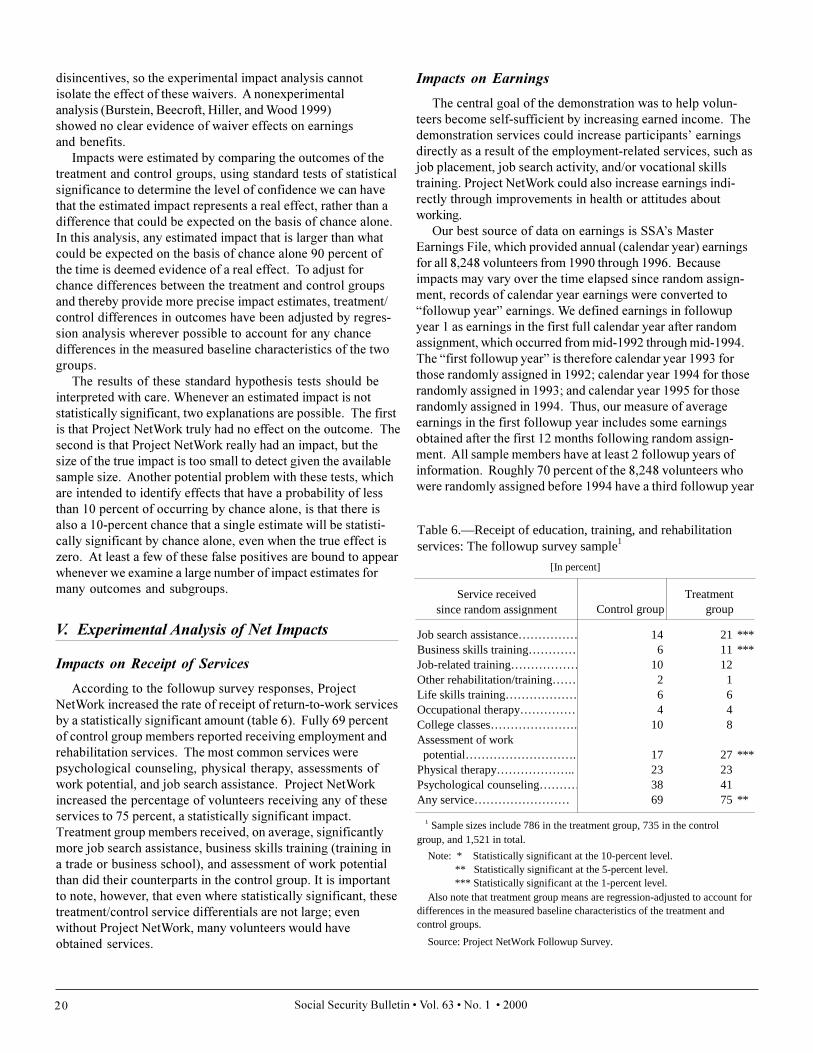
According to the followup survey responses, ProjectNetWork increased the rate of receipt of return-to-work servicesby a statistically significant amount (table 6). Fully 69 percentof control group members reported receiving employment andrehabilitation services. The most common services werepsychological counseling, physical therapy, assessments ofwork potential, and job search assistance. Project NetWorkincreased the percentage of volunteers receiving any of theseservices to 75 percent, a statistically significant impact.Treatment group members received, on average, significantlymore job search assistance, business skills training (training ina trade or business school), and assessment of work potentialthan did their counterparts in the control group. It is importantto note, however, that even where statistically significant, thesetreatment/control service differentials are not large; evenwithout Project NetWork, many volunteers would haveobtained services.
Impacts on Earnings
The central goal of the demonstration was to help volun-teers become self-sufficient by increasing earned income. Thedemonstration services could increase participants� earningsdirectly as a result of the employment-related services, such asjob placement, job search activity, and/or vocational skillstraining. Project NetWork could also increase earnings indi-rectly through improvements in health or attitudes aboutworking.
Our best source of data on earnings is SSA�s MasterEarnings File, which provided annual (calendar year) earningsfor all 8,248 volunteers from 1990 through 1996. Becauseimpacts may vary over the time elapsed since random assign-ment, records of calendar year earnings were converted to�followup year� earnings. We defined earnings in followupyear 1 as earnings in the first full calendar year after randomassignment, which occurred from mid-1992 through mid-1994.The �first followup year� is therefore calendar year 1993 forthose randomly assigned in 1992; calendar year 1994 for thoserandomly assigned in 1993; and calendar year 1995 for thoserandomly assigned in 1994. Thus, our measure of averageearnings in the first followup year includes some earningsobtained after the first 12 months following random assign-ment. All sample members have at least 2 followup years ofinformation. Roughly 70 percent of the 8,248 volunteers whowere randomly assigned before 1994 have a third followup year
Table 6.—Receipt of education, training, and rehabilitation
Service received Treatment since random assignment Control group group
Job search assistance…………… 14 21 ***Business skills training………… 6 11 ***Job-related training……………… 10 12Other rehabilitation/training…… 2 1Life skills training……………… 6 6Occupational therapy…………… 4 4College classes…………………. 10 8Assessment of work potential………………………. 17 27 ***Physical therapy……………….. 23 23Psychological counseling………… 38 41Any service…………………… 69 75 **
1 Sample sizes include 786 in the treatment group, 735 in the controlgroup, and 1,521 in total.
Note: * Statistically significant at the 10-percent level. ** Statistically significant at the 5-percent level. *** Statistically significant at the 1-percent level. Also note that treatment group means are regression-adjusted to account fordifferences in the measured baseline characteristics of the treatment andcontrol groups.
Source: Project NetWork Followup Survey.
services: The followup survey sample1
[In percent]
Social Security Bulletin • Vol. 63 • No. 1 • 2000 21
of information. To protect confidentiality, all means andstandard deviations of annual earnings for treatment andcontrol group members were calculated by SSA staff. Theseestimates were used to estimate impacts and test their statisticalsignificance without the use of regression adjustment.
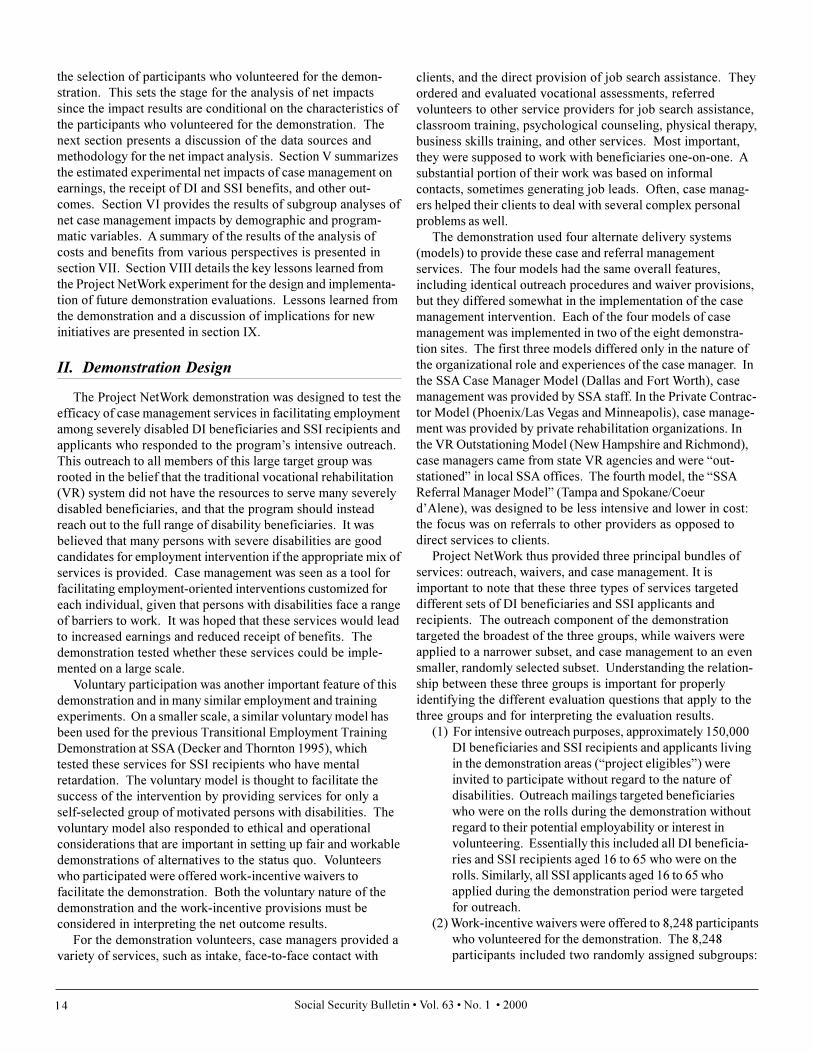
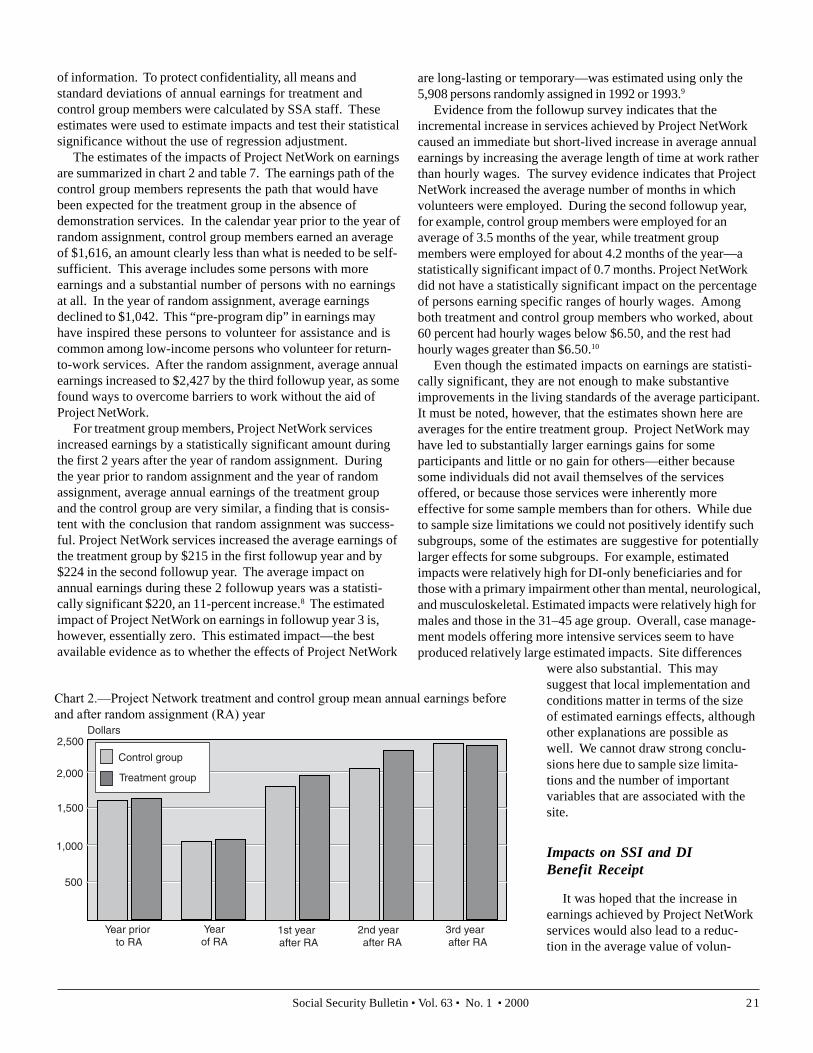
The estimates of the impacts of Project NetWork on earningsare summarized in chart 2 and table 7. The earnings path of thecontrol group members represents the path that would havebeen expected for the treatment group in the absence ofdemonstration services. In the calendar year prior to the year ofrandom assignment, control group members earned an averageof $1,616, an amount clearly less than what is needed to be self-sufficient. This average includes some persons with moreearnings and a substantial number of persons with no earningsat all. In the year of random assignment, average earningsdeclined to $1,042. This “pre-program dip” in earnings mayhave inspired these persons to volunteer for assistance and iscommon among low-income persons who volunteer for return-to-work services. After the random assignment, average annualearnings increased to $2,427 by the third followup year, as somefound ways to overcome barriers to work without the aid ofProject NetWork.
For treatment group members, Project NetWork servicesincreased earnings by a statistically significant amount duringthe first 2 years after the year of random assignment. Duringthe year prior to random assignment and the year of randomassignment, average annual earnings of the treatment groupand the control group are very similar, a finding that is consis-tent with the conclusion that random assignment was success-ful. Project NetWork services increased the average earnings ofthe treatment group by $215 in the first followup year and by$224 in the second followup year. The average impact onannual earnings during these 2 followup years was a statisti-cally significant $220, an 11-percent increase.8 The estimatedimpact of Project NetWork on earnings in followup year 3 is,however, essentially zero. This estimated impact—the bestavailable evidence as to whether the effects of Project NetWork
are long-lasting or temporary—was estimated using only the5,908 persons randomly assigned in 1992 or 1993.9
Evidence from the followup survey indicates that theincremental increase in services achieved by Project NetWorkcaused an immediate but short-lived increase in average annualearnings by increasing the average length of time at work ratherthan hourly wages. The survey evidence indicates that ProjectNetWork increased the average number of months in whichvolunteers were employed. During the second followup year,for example, control group members were employed for anaverage of 3.5 months of the year, while treatment groupmembers were employed for about 4.2 months of the year—astatistically significant impact of 0.7 months. Project NetWorkdid not have a statistically significant impact on the percentageof persons earning specific ranges of hourly wages. Amongboth treatment and control group members who worked, about60 percent had hourly wages below $6.50, and the rest hadhourly wages greater than $6.50.10
Even though the estimated impacts on earnings are statisti-cally significant, they are not enough to make substantiveimprovements in the living standards of the average participant.It must be noted, however, that the estimates shown here areaverages for the entire treatment group. Project NetWork mayhave led to substantially larger earnings gains for someparticipants and little or no gain for others—either becausesome individuals did not avail themselves of the servicesoffered, or because those services were inherently moreeffective for some sample members than for others. While dueto sample size limitations we could not positively identify suchsubgroups, some of the estimates are suggestive for potentiallylarger effects for some subgroups. For example, estimatedimpacts were relatively high for DI-only beneficiaries and forthose with a primary impairment other than mental, neurological,and musculoskeletal. Estimated impacts were relatively high formales and those in the 31–45 age group. Overall, case manage-ment models offering more intensive services seem to haveproduced relatively large estimated impacts. Site differences
were also substantial. This maysuggest that local implementation andconditions matter in terms of the sizeof estimated earnings effects, althoughother explanations are possible aswell. We cannot draw strong conclu-sions here due to sample size limita-tions and the number of importantvariables that are associated with thesite.
Impacts on SSI and DIBenefit Receipt
It was hoped that the increase inearnings achieved by Project NetWorkservices would also lead to a reduc-tion in the average value of volun-
Chart 2.—Project Network treatment and control group mean annual earnings beforeand after random assignment (RA) year
Year prior to RA
1,000
500
1,500
2,000
2,500
Treatment group
Control group
Year of RA
1st year after RA
Dollars
2nd year after RA
3rd year after RA
Social Security Bulletin • Vol. 63 • No. 1 • 200022
teers’ monthly SSI and DI benefits. This reduction in averagebenefits would reduce the costs borne by SSA, perhapsenough to offset the costs of Project NetWork services. Giventhe recent growth in the number of persons receiving disabilitybenefits, it is of interest to know whether services of the typeprovided in the demonstration could decrease caseloads and/orlower benefit costs.
Because we have monthly data on benefits, we define the“first followup year” as the 12 months immediately after themonth of random assignment. Because random assignmentoccurred between mid-1992 and mid-1994, these followupperiods usually do not correspond to calendar years, and theyvary depending on the month of random assignment. Benefitsare expressed in terms of 1996 dollars. To adjust for any chancedifferences between treatment and control groups and toimprove the precision of our estimates, we have estimatedimpacts by employing standard regression adjustment tocontrol for measurable characteristics defined at or beforerandom assignment.11
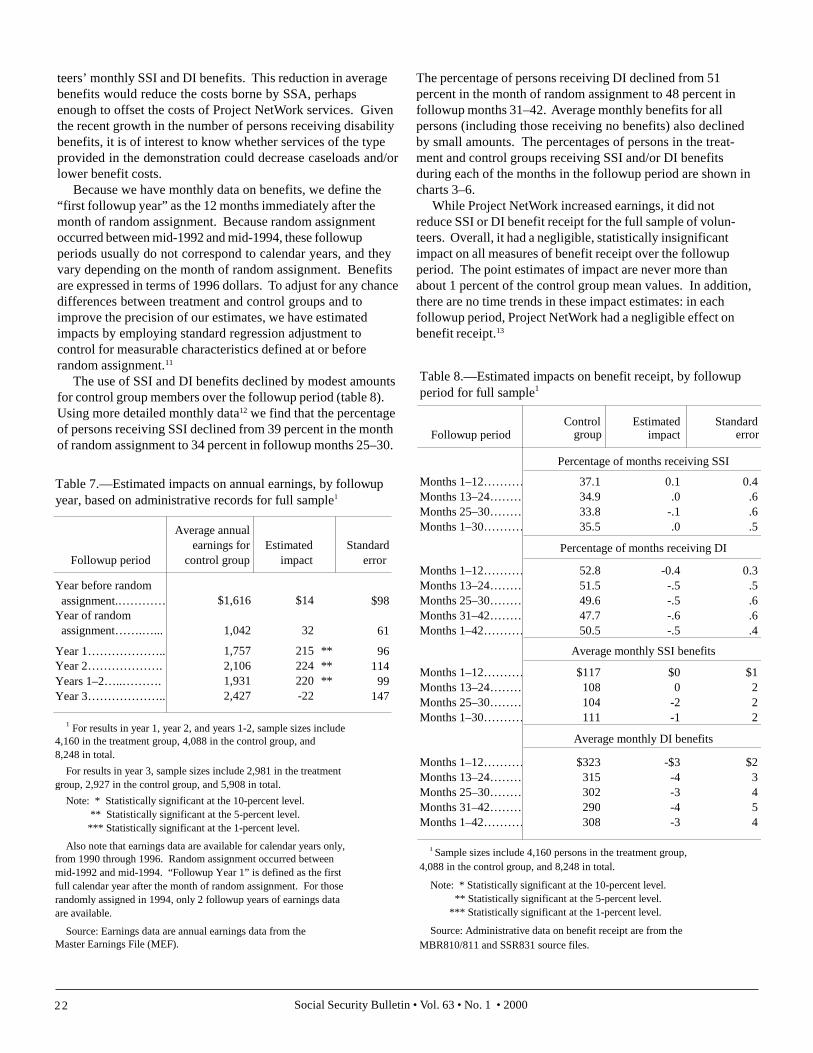
The use of SSI and DI benefits declined by modest amountsfor control group members over the followup period (table 8).Using more detailed monthly data12 we find that the percentageof persons receiving SSI declined from 39 percent in the monthof random assignment to 34 percent in followup months 25–30.
The percentage of persons receiving DI declined from 51percent in the month of random assignment to 48 percent infollowup months 31–42. Average monthly benefits for allpersons (including those receiving no benefits) also declinedby small amounts. The percentages of persons in the treat-ment and control groups receiving SSI and/or DI benefitsduring each of the months in the followup period are shown incharts 3–6.
While Project NetWork increased earnings, it did notreduce SSI or DI benefit receipt for the full sample of volun-teers. Overall, it had a negligible, statistically insignificantimpact on all measures of benefit receipt over the followupperiod. The point estimates of impact are never more thanabout 1 percent of the control group mean values. In addition,there are no time trends in these impact estimates: in eachfollowup period, Project NetWork had a negligible effect onbenefit receipt.13
Table 8.—Estimated impacts on benefit receipt, by followup period for full sample1
Control Estimated StandardFollowup period group impact error
Percentage of months receiving SSI
Months 1–12………… 37.1 0.1 0.4Months 13–24……… 34.9 .0 .6Months 25–30……… 33.8 -.1 .6Months 1–30………… 35.5 .0 .5
Percentage of months receiving DI
Months 1–12………… 52.8 -0.4 0.3Months 13–24……… 51.5 -.5 .5Months 25–30……… 49.6 -.5 .6Months 31–42……… 47.7 -.6 .6Months 1–42………… 50.5 -.5 .4
Average monthly SSI benefits
Months 1–12………… $117 $0 $1Months 13–24……… 108 0 2Months 25–30……… 104 -2 2Months 1–30………… 111 -1 2
Average monthly DI benefits
Months 1–12………… $323 -$3 $2Months 13–24……… 315 -4 3Months 25–30……… 302 -3 4Months 31–42……… 290 -4 5Months 1–42………… 308 -3 4
1 Sample sizes include 4,160 persons in the treatment group, 4,088 in the control group, and 8,248 in total.
Note: * Statistically significant at the 10-percent level. ** Statistically significant at the 5-percent level. *** Statistically significant at the 1-percent level.
Source: Administrative data on benefit receipt are from theMBR810/811 and SSR831 source files.
Table 7.—Estimated impacts on annual earnings, by followup year, based on administrative records for full sample1
Average annualearnings for Estimated Standard
Followup period control group impact error
Year before random assignment.………… $1,616 $14 $98Year of random assignment…….…... 1,042 32 61
Year 1……………….. 1,757 215 ** 96Year 2………………. 2,106 224 ** 114Years 1–2…..………. 1,931 220 ** 99Year 3……………….. 2,427 -22 147
4,160 in the treatment group, 4,088 in the control group, and 8,248 in total.
For results in year 3, sample sizes include 2,981 in the treatment group, 2,927 in the control group, and 5,908 in total.
Note: * Statistically significant at the 10-percent level. ** Statistically significant at the 5-percent level. *** Statistically significant at the 1-percent level.
from 1990 through 1996. Random assignment occurred betweenmid-1992 and mid-1994. “Followup Year 1” is defined as the firstfull calendar year after the month of random assignment. For those randomly assigned in 1994, only 2 followup years of earnings data are available.
Master Earnings File (MEF).
Also note that earnings data are available for calendar years only,
Source: Earnings data are annual earnings data from the
1 For results in year 1, year 2, and years 1-2, sample sizes include
Social Security Bulletin � Vol. 63 � No. 1 � 2000 23
Impacts on Measures of Health and Well-Being
Project NetWork helped participants obtain several types ofservices�physical therapy, occupational therapy, and psycho-logical counseling�that could improve the health of partici-pants and help them gain a more positive outlook. The
measures of health and well-being we use are based onrespondents� answers to a series of questions about self-assessed health, disabilities, work limitations, and cognitiveand emotional state. The meaning of many questions is lessclear-cut than questions about earnings; phrases such as�good health� and �difficulty hearing or speaking� could mean
different things to different respon-dents. These reporting errors willincrease the variance of the outcomemeasures and thus increase the size ofimpact estimates we can detect asstatistically significant. Because of thisproblem and because of the limitedavailable sample of survey respon-dents, we can only detect fairly largeeffects as statistically significant;smaller but genuine impacts that mayhave occurred will be statisticallyinsignificantly different from zero. Toimprove the precision of the impactestimates, we use regression adjust-ment to control for baseline character-istics obtained from administrative dataand the baseline survey.
We find that Project NetWork�s caseand referral management servicesgenerally did not have statisticallysignificant effects on the measures ofhealth and well-being collected in thefollowup survey (table 9). ProjectNetWork did increase by about 5percentage points the proportion ofrespondents who stated that theywere better off at the interview datethan a year before, as well as theproportion anticipating improvementduring the next year. This impact,however, was not corroborated byimprovements in more objectivemeasures of health and well-being,including average scores on the MiniMental State Examination (MMSE),which measures cognitive impairment,and average scores on the MentalHealth Inventory (MHI).14
These survey responses alsoconfirm that Project NetWork volun-teers continue to face serious barriersto gainful employment. Only about 19percent of treatment group membersrated their health as excellent or verygood, and a substantial numberreported having three or more func-tional limitations or life skills limita-tions. About 35 percent said their
75
80
85
90
95
100
Treatment means
Control means
30282624222018161412108642
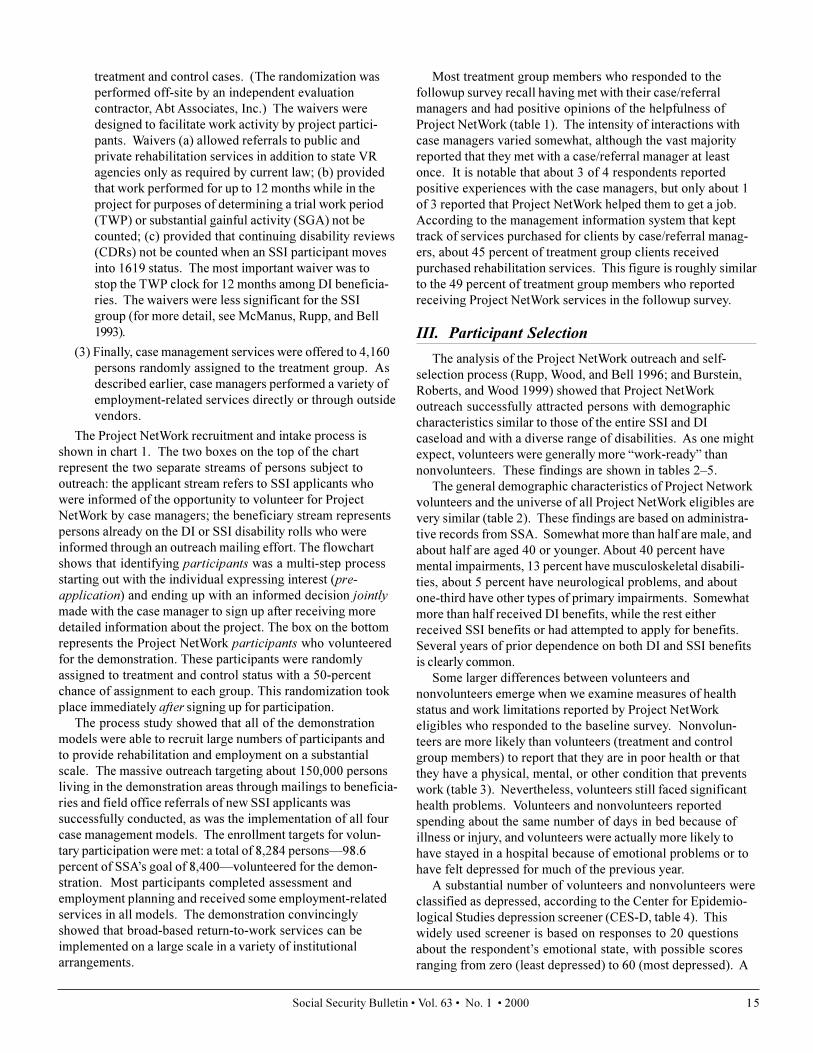
Chart 3.—Impacts on SSI participation rates for those receiving only SSI at random assignment, by experimental group assignment
Percent
Month
Treatment means
Control means
75
80
85
90
95
100
44424036343230282624222018161412108642
Chart 4.—Impacts on DI participation rates for those receiving only DI at random assignment, by experimental group assignment
Percent
Month
Social Security Bulletin � Vol. 63 � No. 1 � 200024
health condition prevented them from working at all, 27percent said their disability prevented full-time work, andover 40 percent reported transportation problems thatlimited their ability to work. Many participants continuedto face severe emotional problems. Almost two-thirds feltsad, blue, or depressed for at least 2 weeks over the previousyear.
VI. Experimental Analysis of Net Impactson Key Subgroups
In an effort to understand whether Project NetWork hadlarger effects on some persons in our sample, we estimatedimpacts for several subgroups of interest. Interpreting esti-mated impacts for subgroups requires caution. Whenever we
analyze impacts for subgroups, thesample size declines, and thestandard errors of estimates formany of the subgroups becomequite large, so that only largeimpacts could be detected asstatistically significant. We alsohave to be concerned about �falsepositives� with a large number ofsubgroup impact estimates becausethere is some chance that any givenestimate will be statistically signifi-cant by chance alone, even whenthe true effect is zero. Finally, evenwhen we do find statisticallysignificant impacts for subgroupsthat we believe are real effects, theinterpretation of these findings isoften unclear.
Title of EligibilityVolunteers who received SSI
only, DI only, both SSI and DI(concurrent recipients), or neitherbenefit in the month of random
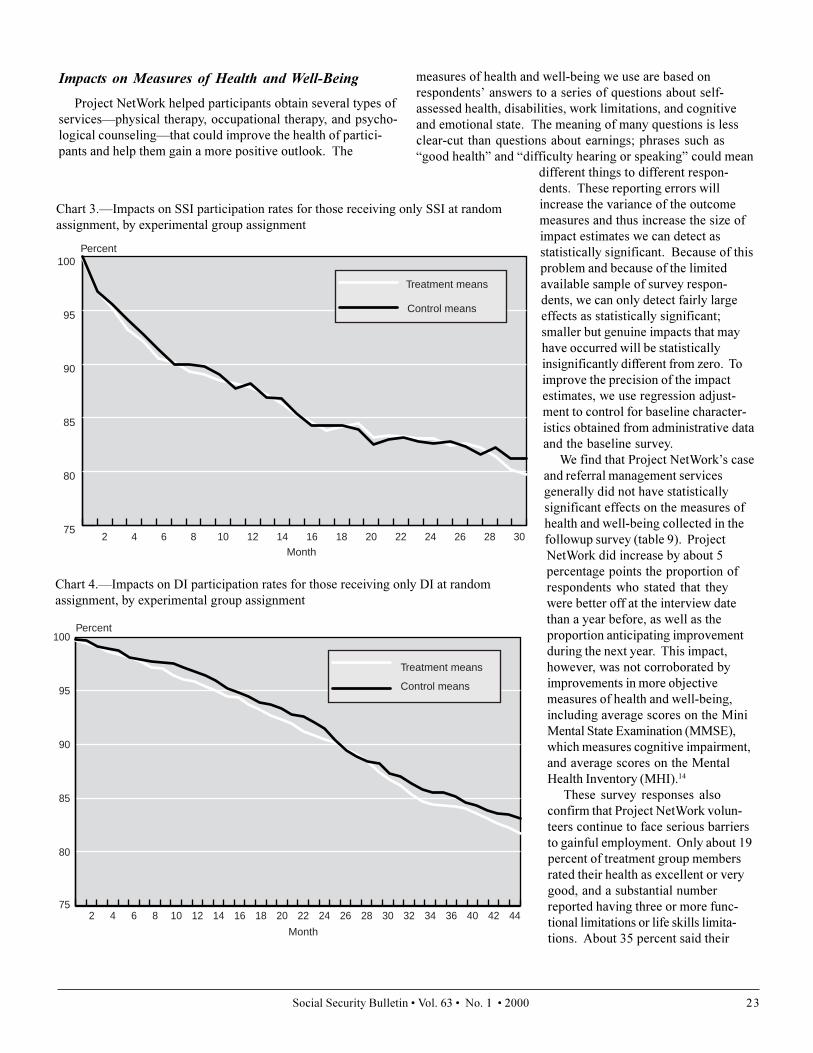
assignment could have very differentcharacteristics. DI beneficiaries musthave prior work experience to qualifyfor DI benefits, while SSI recipientstend to have relatively less workexperience. Those receiving neitherbenefit at random assignment includeseveral groups who may be verydifferent from ongoing SSI and DIparticipants. Some were new SSIapplicants who were recruited byProject NetWork. Also included arepersons recruited from other pro-grams, such as mental healthservices, and persons who hadreceived either SSI or DI just beforerandom assignment and then leftthese programs. The estimates ofimpacts on these �title of eligibility�subgroups are shown in charts 3�6and in table 10.
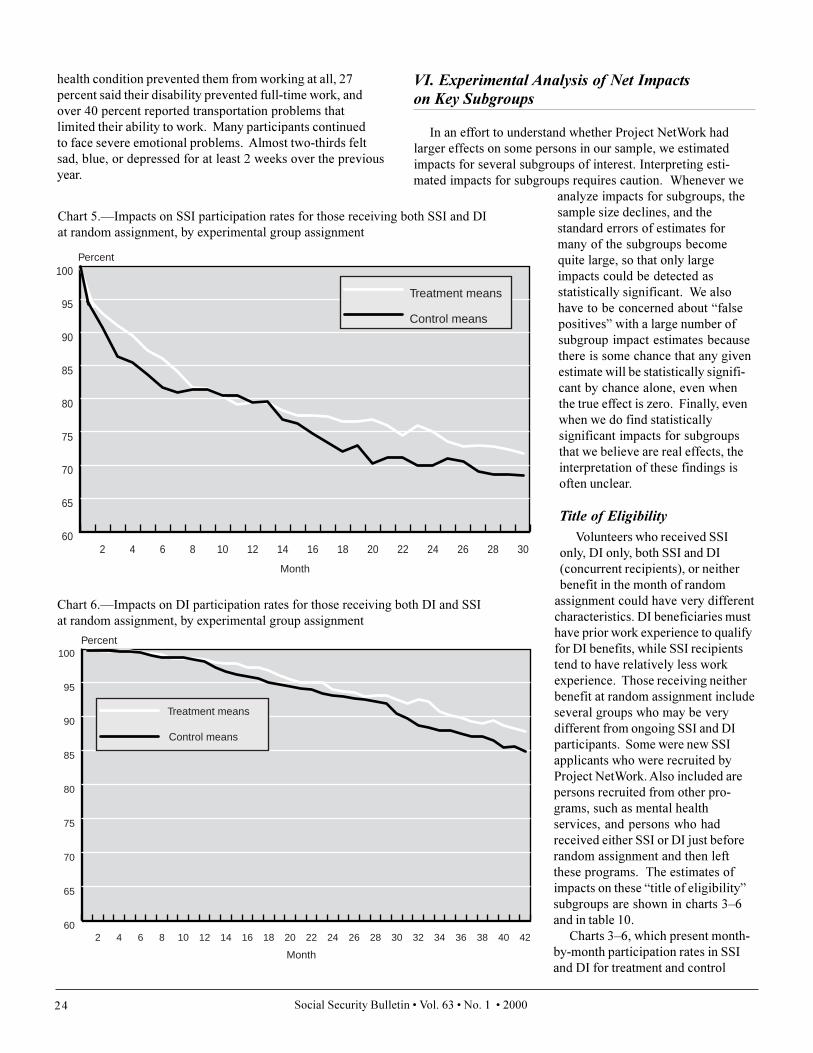
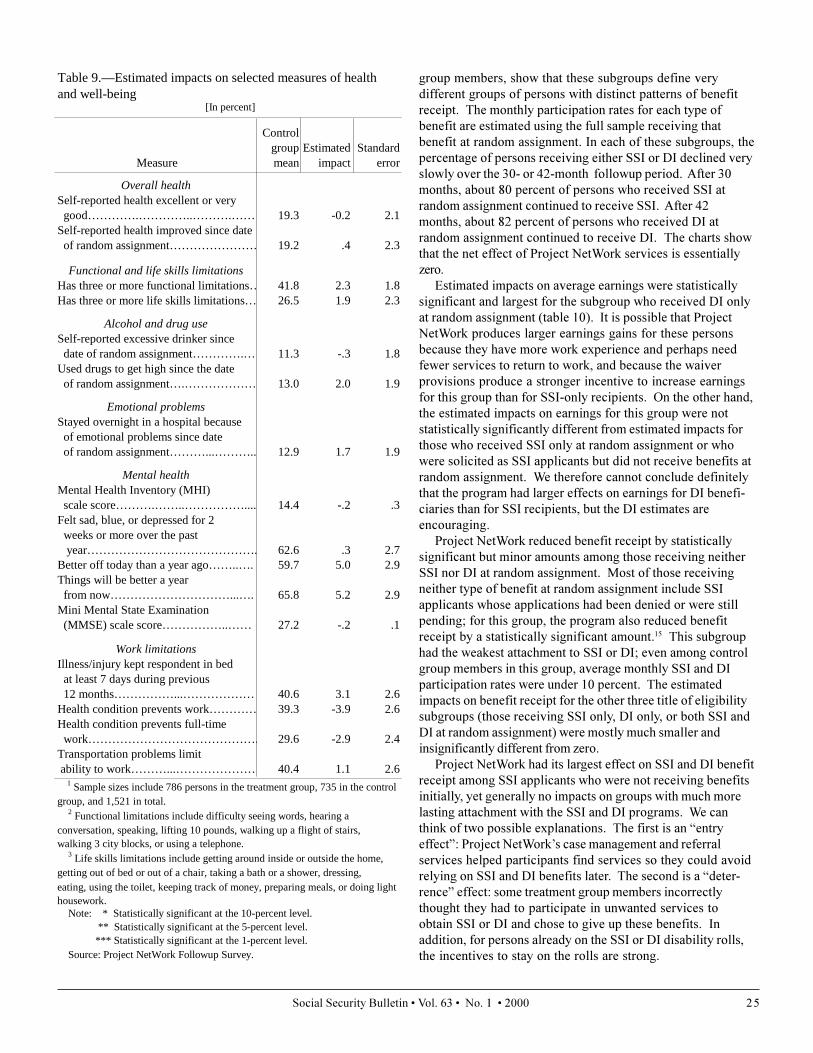
Charts 3�6, which present month-by-month participation rates in SSIand DI for treatment and control
60
65
70
75
80
85
90
95
100
30282624222018161412108642
Treatment means
Control means
Chart 5.—Impacts on SSI participation rates for those receiving both SSI and DI at random assignment, by experimental group assignment
Percent
Month
60
65
70
75
80
85
90
95
100
42403836343230282624222018161412108642
Chart 6.—Impacts on DI participation rates for those receiving both DI and SSI at random assignment, by experimental group assignment
Treatment means
Control means
Percent
Month
Social Security Bulletin � Vol. 63 � No. 1 � 2000 25
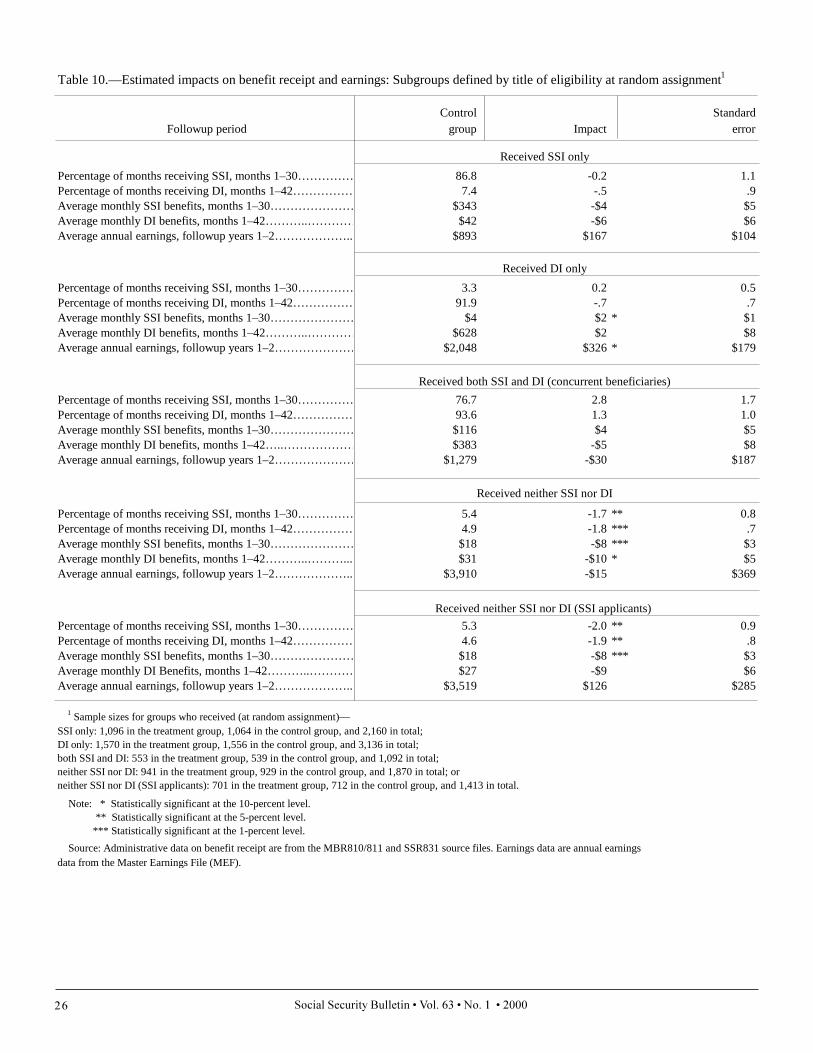
group members, show that these subgroups define verydifferent groups of persons with distinct patterns of benefitreceipt. The monthly participation rates for each type ofbenefit are estimated using the full sample receiving thatbenefit at random assignment. In each of these subgroups, thepercentage of persons receiving either SSI or DI declined veryslowly over the 30- or 42-month followup period. After 30months, about 80 percent of persons who received SSI atrandom assignment continued to receive SSI. After 42months, about 82 percent of persons who received DI atrandom assignment continued to receive DI. The charts showthat the net effect of Project NetWork services is essentiallyzero.
Estimated impacts on average earnings were statisticallysignificant and largest for the subgroup who received DI onlyat random assignment (table 10). It is possible that ProjectNetWork produces larger earnings gains for these personsbecause they have more work experience and perhaps needfewer services to return to work, and because the waiverprovisions produce a stronger incentive to increase earningsfor this group than for SSI-only recipients. On the other hand,the estimated impacts on earnings for this group were notstatistically significantly different from estimated impacts forthose who received SSI only at random assignment or whowere solicited as SSI applicants but did not receive benefits atrandom assignment. We therefore cannot conclude definitelythat the program had larger effects on earnings for DI benefi-ciaries than for SSI recipients, but the DI estimates areencouraging.
Project NetWork reduced benefit receipt by statisticallysignificant but minor amounts among those receiving neitherSSI nor DI at random assignment. Most of those receivingneither type of benefit at random assignment include SSIapplicants whose applications had been denied or were stillpending; for this group, the program also reduced benefitreceipt by a statistically significant amount.15 This subgrouphad the weakest attachment to SSI or DI; even among controlgroup members in this group, average monthly SSI and DIparticipation rates were under 10 percent. The estimatedimpacts on benefit receipt for the other three title of eligibilitysubgroups (those receiving SSI only, DI only, or both SSI andDI at random assignment) were mostly much smaller andinsignificantly different from zero.
Project NetWork had its largest effect on SSI and DI benefitreceipt among SSI applicants who were not receiving benefitsinitially, yet generally no impacts on groups with much morelasting attachment with the SSI and DI programs. We canthink of two possible explanations. The first is an �entryeffect�: Project NetWork�s case management and referralservices helped participants find services so they could avoidrelying on SSI and DI benefits later. The second is a �deter-rence� effect: some treatment group members incorrectlythought they had to participate in unwanted services toobtain SSI or DI and chose to give up these benefits. Inaddition, for persons already on the SSI or DI disability rolls,the incentives to stay on the rolls are strong.
and well-being[In percent]
Controlgroup Estimated Standard
Measure mean impact error
Overall healthSelf-reported health excellent or very good………….…………..……….…… 19.3 -0.2 2.1Self-reported health improved since date of random assignment…………………… 19.2 .4 2.3
Functional and life skills limitationsHas three or more functional limitations… 41.8 2.3 1.8Has three or more life skills limitations… 26.5 1.9 2.3
Alcohol and drug useSelf-reported excessive drinker since date of random assignment………….… 11.3 -.3 1.8Used drugs to get high since the date of random assignment….……………… 13.0 2.0 1.9
Emotional problemsStayed overnight in a hospital because of emotional problems since date of random assignment………...……….. 12.9 1.7 1.9
Mental healthMental Health Inventory (MHI) scale score……….……..…………….... 14.4 -.2 .3Felt sad, blue, or depressed for 2 weeks or more over the past year……………………………………. 62.6 .3 2.7Better off today than a year ago……..…. 59.7 5.0 2.9Things will be better a year from now…………………………...…. 65.8 5.2 2.9Mini Mental State Examination (MMSE) scale score……………..…… 27.2 -.2 .1
Work limitationsIllness/injury kept respondent in bed at least 7 days during previous 12 months……………...……………… 40.6 3.1 2.6Health condition prevents work………… 39.3 -3.9 2.6Health condition prevents full-time work……………………………………. 29.6 -2.9 2.4Transportation problems limit ability to work………...………………… 40.4 1.1 2.6
1 Sample sizes include 786 persons in the treatment group, 735 in the control group, and 1,521 in total. 2 Functional limitations include difficulty seeing words, hearing a conversation, speaking, lifting 10 pounds, walking up a flight of stairs, walking 3 city blocks, or using a telephone. 3 Life skills limitations include getting around inside or outside the home,getting out of bed or out of a chair, taking a bath or a shower, dressing,eating, using the toilet, keeping track of money, preparing meals, or doing light housework. Note: * Statistically significant at the 10-percent level. ** Statistically significant at the 5-percent level. *** Statistically significant at the 1-percent level. Source: Project NetWork Followup Survey.
Table 9.—Estimated impacts on selected measures of health
Social Security Bulletin � Vol. 63 � No. 1 � 200026
Control Standard Followup period group Impact error
Received SSI only
Percentage of months receiving SSI, months 1–30…………… 86.8 -0.2 1.1Percentage of months receiving DI, months 1–42……………. 7.4 -.5 .9Average monthly SSI benefits, months 1–30………………… $343 -$4 $5Average monthly DI benefits, months 1–42………..………… $42 -$6 $6Average annual earnings, followup years 1–2………………... $893 $167 $104
Received DI only
Percentage of months receiving SSI, months 1–30…………… 3.3 0.2 0.5Percentage of months receiving DI, months 1–42……………. 91.9 -.7 .7Average monthly SSI benefits, months 1–30………………… $4 $2 * $1Average monthly DI benefits, months 1–42………..………… $628 $2 $8Average annual earnings, followup years 1–2………………… $2,048 $326 * $179
Received both SSI and DI (concurrent beneficiaries)
Percentage of months receiving SSI, months 1–30…………… 76.7 2.8 1.7Percentage of months receiving DI, months 1–42……………. 93.6 1.3 1.0Average monthly SSI benefits, months 1–30………………… $116 $4 $5Average monthly DI benefits, months 1–42…..……………… $383 -$5 $8Average annual earnings, followup years 1–2………………… $1,279 -$30 $187
Received neither SSI nor DI
Percentage of months receiving SSI, months 1–30…………… 5.4 -1.7 ** 0.8Percentage of months receiving DI, months 1–42……………. 4.9 -1.8 *** .7Average monthly SSI benefits, months 1–30………………… $18 -$8 *** $3Average monthly DI benefits, months 1–42………..………... $31 -$10 * $5Average annual earnings, followup years 1–2………………... $3,910 -$15 $369
Received neither SSI nor DI (SSI applicants)
Percentage of months receiving SSI, months 1–30…………… 5.3 -2.0 ** 0.9Percentage of months receiving DI, months 1–42……………. 4.6 -1.9 ** .8Average monthly SSI benefits, months 1–30………………… $18 -$8 *** $3Average monthly DI Benefits, months 1–42………..………… $27 -$9 $6Average annual earnings, followup years 1–2………………... $3,519 $126 $285
1 Sample sizes for groups who received (at random assignment)—SSI only: 1,096 in the treatment group, 1,064 in the control group, and 2,160 in total;DI only: 1,570 in the treatment group, 1,556 in the control group, and 3,136 in total; both SSI and DI: 553 in the treatment group, 539 in the control group, and 1,092 in total;neither SSI nor DI: 941 in the treatment group, 929 in the control group, and 1,870 in total; orneither SSI nor DI (SSI applicants): 701 in the treatment group, 712 in the control group, and 1,413 in total.
Note: * Statistically significant at the 10-percent level. ** Statistically significant at the 5-percent level. *** Statistically significant at the 1-percent level.
Source: Administrative data on benefit receipt are from the MBR810/811 and SSR831 source files. Earnings data are annual earningsdata from the Master Earnings File (MEF).
Table 10.—Estimated impacts on benefit receipt and earnings: Subgroups defined by title of eligibility at random assignment1
Social Security Bulletin � Vol. 63 � No. 1 � 2000 27
Types of Primary ImpairmentsPersons with different types of impairments face different
barriers to employment and self-sufficiency. Accordingly, weexamined the impacts of Project NetWork on benefit receiptamong persons grouped in four major categories of primaryimpairment.
(1) Mental impairments including psychoses, mooddisorders, neuroses, schizophrenia, and mentalretardation
(2) Neurological impairments, which are diseases of thecentral nervous system
(3) Musculoskeletal impairments(4) Other impairments16
The demonstration generally did not produce statisticallysignificant impacts on measures of benefit receipt or earningswithin these primary impairment subgroups. The only statisti-cally significant effect on benefit receipt over the followupperiod as a whole was among those with impairments affectingthe musculoskeletal system, for whom Project NetWorkreduced the percentage of persons receiving DI benefits by anaverage of 2.1 percentage points.
The only subgroup for which earnings impacts were eversignificantly different from zero was the subgroup with �otherimpairments.� This group showed an average annual earningsgain of $347 over the first 2 followup years, a 17-percent gain.However, an F-test indicates that the estimated impact for thosewith �other� impairments is not statistically significantlydifferent from the estimated impact for the combined sample ofthose with mental and musculoskeletal impairments. Therefore,we cannot definitely conclude that Project NetWork producedgreater effects on this subgroup than on persons with mental ormusculoskeletal impairments, but the results are suggestive ofpossibly relatively large effects on the subgroup with �otherimpairments.�
VII. Project NetWork Costs and Benefits
The benefit/cost analysis17 asks whether key groups weremade better off or worse off as a result of the demonstration.The key groups are the demonstration volunteers, the SocialSecurity Administration, the federal government as a whole, andstate governments. We compare benefits and costs of thetreatment group and the control group.
The definition of �costs� and �benefits� differs for each ofthe key groups.18 From the perspective of the persons withdisabilities who volunteered for the demonstration, the benefitsof Project NetWork include mainly increases in earnings net oftaxes paid, while costs include mainly the reductions in benefitsfrom SSI, DI, and other programs. From the perspective of SSA,reductions in SSI and DI payments are a benefit, and directexpenditures on the demonstration, which were all incurred bythe agency, are a cost. From the perspective of the entirefederal government, any reductions in food stamps or Medicaidpayments and any increases in federal income or payroll taxesare an additional benefit. The perspective of state and local
government captures Project NetWork�s impacts on stateincome taxes, Medicaid expenditures, and state VR agencycosts, which were reduced because Project NetWork fundedthese services.19
Project NetWork Expenses
Based on the administrative data from the MIS file onservices purchased under Project NetWork, the averagetotal Project NetWork expenditure per treatment groupmember was $3,660, which includes $2,397 for site operations(management and some direct service provision), $264 forassessment services, $212 for central administration, $625 foremployment and training services, $63 for medical treatments,and $99 for other services. These costs varied considerablyby site. The highest costs, in Richmond ($5,305 per treatmentgroup member) and Dallas ($4,326), were about twice theaverage cost in Tampa ($2,129) and Spokane ($2,180), whichrelied primarily on referrals to other programs that providedservices at no cost to the demonstration rather than directservice provision.20
Non-NetWork Expenses
The benefit/cost analysis must take into considerationexpenditures on the treatment group made by all outsideorganizations, even if Project NetWork did not reimburse theseexpenditures. In some cases, the receipt of such services wasthe result of referrals and other arrangements made by site staff.In other instances, Project NetWork participants found theseservices on their own. The control group was also free toreceive non-NetWork services. Thus, it was necessary tomeasure non-NetWork costs for both the treatment and thecontrol groups, using survey data on receipt of services andstate VR data on unit cost.21
As one might expect, the estimated non-NetWork expendi-tures for the control group were higher than for the treatmentgroup. The cost of non-NetWork services is estimated to be$326 per treatment group member and $1,779 per control groupmember. As a result, there is an estimated non-NetWork costsaving of $1,453 per treatment group member, which offsetsabout 40 percent of the direct cost of the Project NetWorkdemonstration. Most of this estimated saving reflects thehigher use of non-NetWork physical therapy, counseling, jobsearch assistance, and other job-related training services bycontrol group members, along with the non-NetWork assistancewith transportation and other needs.
The full cost of the services received by the treatment groupwas $3,986, including $3,660 in direct Project NetWork costsand $326 for non-NetWork expenditures. This is the gross costof the Project NetWork treatment. This means that the net costof the Project NetWork treatment was $3,986 (the gross cost ofservices provided to treatment group members) minus $1,779(the cost of the services they would have received in theabsence of Project NetWork), which is $2,207. The net cost forRichmond, $3,826 per treatment member, was the highest among
Social Security Bulletin � Vol. 63 � No. 1 � 200028
the eight demonstration sites. In contrast, the net costs for theSpokane and Tampa sites were less than $1,000. These were thetwo sites that relied primarily on referrals to other programs,rather than direct service provision.
Earnings, Fringe Benefits, and Tax Payments
The net present value of earnings gains over theevaluation�s observation period, which lasted from randomassignment through calendar year 1996, was $509 per treatmentgroup member for the full sample.22 The compensation ofindividuals also included fringe benefits, notably legallyrequired benefits, employer-paid health and life insurance,pension contributions, and workers� compensation. Based onnational data obtained from the U.S. Census Bureau,23 thesebenefits were estimated to be 15 percent of earnings, or $69 pertreatment group member, lifting the overall compensation gainfor the full sample to $585.
Because of Project NetWork�s impact on earnings, there wasa small increase of $18 in the taxes paid by the eligible popula-tion, estimated as the change in federal and state income taxes,Social Security taxes, and state sales and excise taxes paid bymembers of the treatment group. Federal and state tax rules ineffect in 1994�including rules for tax credits such as the federalEarned Income Tax Credit (EITC)�have been applied to theearnings and (where appropriate) SSI and DI payments ofindividuals in the treatment and control groups during theobservation period. Social Security payroll taxes increased by$39 per treatment group member. There was a net reduction of$31 in federal income taxes because Project NetWork�s earnings
gain led to an average increase in the EITC, which was largerthan the increase in income taxes. The estimated increase instate income and sales taxes was only $10 per treatment groupmember because increases in these taxes due to earnings gainswere partly offset by reductions due to SSI and DI paymentreductions.
Transfer Payments and Administrative Costs
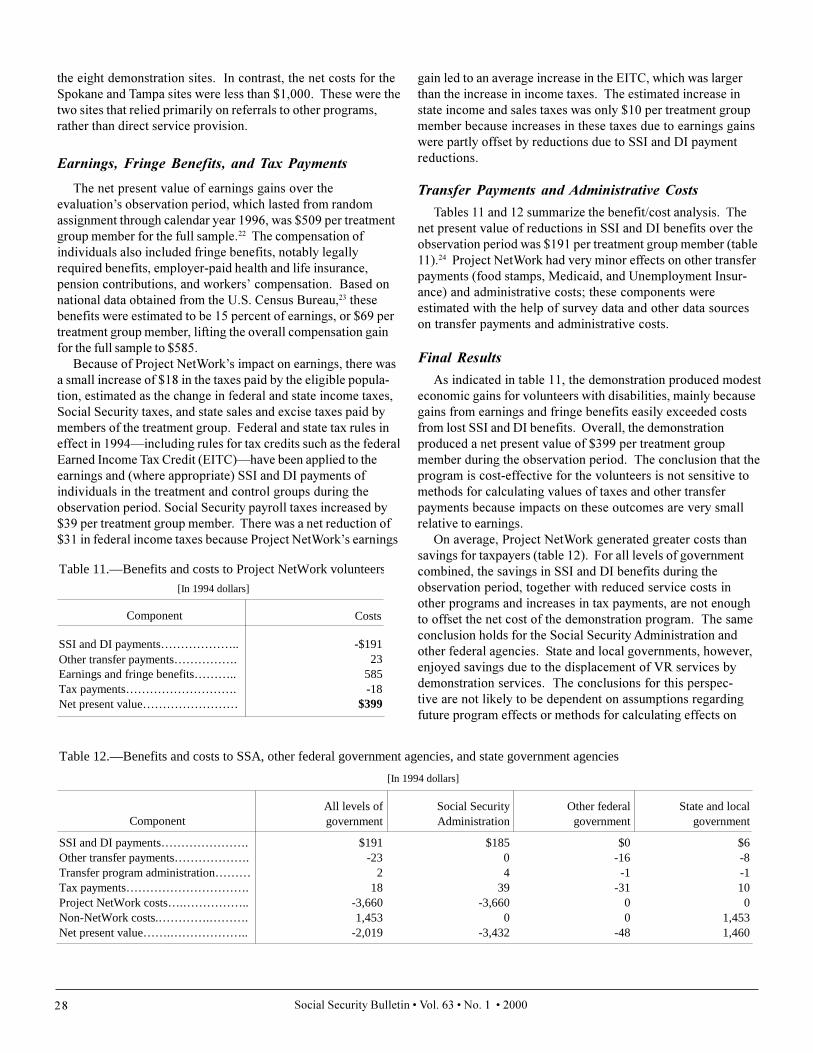
Tables 11 and 12 summarize the benefit/cost analysis. Thenet present value of reductions in SSI and DI benefits over theobservation period was $191 per treatment group member (table11).24 Project NetWork had very minor effects on other transferpayments (food stamps, Medicaid, and Unemployment Insur-ance) and administrative costs; these components wereestimated with the help of survey data and other data sourceson transfer payments and administrative costs.
Final Results
As indicated in table 11, the demonstration produced modesteconomic gains for volunteers with disabilities, mainly becausegains from earnings and fringe benefits easily exceeded costsfrom lost SSI and DI benefits. Overall, the demonstrationproduced a net present value of $399 per treatment groupmember during the observation period. The conclusion that theprogram is cost-effective for the volunteers is not sensitive tomethods for calculating values of taxes and other transferpayments because impacts on these outcomes are very smallrelative to earnings.
On average, Project NetWork generated greater costs thansavings for taxpayers (table 12). For all levels of governmentcombined, the savings in SSI and DI benefits during theobservation period, together with reduced service costs inother programs and increases in tax payments, are not enoughto offset the net cost of the demonstration program. The sameconclusion holds for the Social Security Administration andother federal agencies. State and local governments, however,enjoyed savings due to the displacement of VR services bydemonstration services. The conclusions for this perspec-tive are not likely to be dependent on assumptions regardingfuture program effects or methods for calculating effects on
Table 11.—Benefits and costs to Project NetWork volunteers
[In 1994 dollars]
Component Costs
SSI and DI payments……………….. -$191Other transfer payments……………. 23Earnings and fringe benefits……….. 585Tax payments………………………. -18Net present value…………………… $399
Table 12.—Benefits and costs to SSA, other federal government agencies, and state government agencies
[In 1994 dollars]
All levels of Social Security Other federal State and localComponent government Administration government government
SSI and DI payments…………………. $191 $185 $0 $6Other transfer payments………………. -23 0 -16 -8Transfer program administration……… 2 4 -1 -1Tax payments…………………………. 18 39 -31 10Project NetWork costs….…………….. -3,660 -3,660 0 0Non-NetWork costs.………….………. 1,453 0 0 1,453Net present value…….……………….. -2,019 -3,432 -48 1,460
Social Security Bulletin � Vol. 63 � No. 1 � 2000 29
taxes. How the benefits to participants should be weighedagainst costs to others involves a value judgment policymakersmust make.
VIII. Lessons for the Design and Implementationof Future Demonstration Evaluations
The Project NetWork demonstration has shown thatrigorous evaluation�featuring experimental impact analysis ofrandomly assigned treatment and control groups supplementedby careful process studies and analyses of program participa-tion�can be implemented and can provide a great deal ofuseful information about the effects of social programs. Caseand referral managers successfully maintained separate policiesfor treatment and control groups in the same small geographicareas. The experimental net impact estimates provided convinc-ing evidence about program effects but did not answer allimportant questions. The process study was necessary todescribe program implementation in detail and to show whetherimplementation was successful. The analysis of the decision toparticipate was needed to show that Project NetWork partici-pants were substantially different from eligible nonparticipantsin many ways, so that the experimental impact findings cannotbe generalized to all eligibles. At the same time, the processstudy alone may have provided an overly optimistic assess-ment of the effects of Project NetWork services. Only byreading all of these studies together can we get a full sense ofwhat happened under Project NetWork.
The experimental net impact estimates clearly provided amore realistic impression of the effects of the program thannonexperimental methods. For example, �pre/post� compari-sons that ignore the experiences of the control group wouldhave greatly overstated the incremental effect of case andreferral management services on earnings. From the year beforerandom assignment to the second year after random assign-ment, average annual earnings of treatment group membersincreased by about $700. The experimental estimate of the netimpact on earnings in the second year after random assignmentwas only about $200. Similarly, average benefits receiveddeclined over the followup period, but the experimental estimateof the impact on benefit receipt was essentially zero. Theexperimental estimates accounted for the changes over time inoutcomes that would have occurred even in the absence ofcase management services�the control group experience.
Another valuable lesson is that the SSA national administra-tive records database was a useful, cost-effective tool in thisevaluation. It was feasible to use these records to simulate thepool of 138,613 nonparticipating eligibles based on theserecords and some knowledge of the outreach process. Thissimulation (summarized in Rupp, Driessen, Kornfeld, and Wood1999) enabled us to analyze the participation decision bycomparing nonparticipating eligibles with participants and alsoplayed a key role in a nonexperimental analysis of the effects ofthe waivers, which were given to both treatment and controlgroups. Administrative records provide accurate information
on benefit receipt, demographic characteristics, impairments,and annual SSA-covered earnings. These data could beobtained for large samples and indefinite followup periods atminimal marginal cost. In contrast, personal surveys cover onlya small subset of the sample of eligibles and are far moreexpensive to obtain. Nevertheless, personal surveys provideadditional, important details on income sources, jobs, healthconditions, attitudes, and service receipt.
IX. Implications for New Initiatives
Since the early nineties when Project NetWork was initiated,a number of new approaches have been proposed and imple-mented to assist disability beneficiaries to successfullytransition from benefit recipiency status to work and self-sufficiency. Probably the most important recent initiative hasbeen the Ticket to Work and Work Incentives Improvement Actof 1999.
The results of the Project NetWork demonstration are notdirectly generalizable to more recent initiatives because thebundle of interventions is substantially different for eachinitiative. In this respect it is useful to distinguish betweenservice provision changes (changes in the services offered) andsystem changes (changes in the incentives that alter theenvironment in which such services are offered). For example,dramatically altering provider incentives, as envisioned by theTicket program, or substantially modifying beneficiary incen-tives ($1 for $2 benefit reduction demonstration envisioned bythe 1999 Ticket legislation) alters the service provision environ-ment. As a result, these changes may alter the potentialbenefits of case management services if they are offered underthe new Ticket/$1 for $2 schemes.
Section 101 of the Ticket to Work and Work IncentivesImprovement Act of 1999 instructs the program manager toassure access to a range of services, including case manage-ment, under the Ticket program. While the net outcomes ofcase management under Project NetWork were modest in termsof earnings and disappointing in terms of reduction of benefits,this does not necessarily imply that the same results wouldapply under the Ticket program where case managementbecomes part of a different bundle of services under verydifferent incentive structures and service delivery mechanisms.
Project NetWork offers a number of lessons in a variety ofareas, such as the design of case management interventions,outreach, and the management information system requirementsof successfully implementing new interventions. However, itsuggests caution in the design of case management interven-tions that is cognizant of the substantial costs of case manage-ment services and the need to target case management wiselyto achieve positive outcomes. The language of the Ticketlegislation is wise in allowing, but not requiring, case manage-ment. This may provide the needed flexibility. The Ticketstructure implies strong incentives, at least initially, for provid-ers to target the most job-ready among SSA beneficiaries. Casemanagement services may not be needed for this population.However, the legislation envisions an increase in the aggregate
Social Security Bulletin � Vol. 63 � No. 1 � 200030
proportion of persons going through some type of services(vocational rehabilitation, employment, or other supportservices). As services are extended to this less job-readypopulation, the need for some kind of case managementbecomes likely and may be successful if employment networksoperate within a well-designed system.
The Project NetWork net outcome results suggest that theleast intensive intervention tested�referral manager model�appeared to be the least successful in producing positive netoutcomes for beneficiaries (Kornfeld and others 1999). Thissuggests that if case management is to be used, it has to be welltargeted toward less job-ready candidates who neverthelesshave a potential for successful work outcomes. The fact thatProject NetWork net earnings outcomes declined to zero after 2years also suggests that some beneficiaries may need ongoingsupport to maintain initially positive outcomes. The serviceproviders, who under the Ticket program have a financialinterest for their clients staying off the rolls for 60 months, aregiven an incentive to provide such ongoing support as needed.
In addition to case management, Project NetWork includedoutreach services and the provision of work-incentive waivers.There are several lessons from these components of thedemonstration that are relevant and go beyond the narrowerfocus on case management.
The preamble to the Ticket to Work and Work IncentivesImprovement Act of 1999 envisions the doubling of successfulreturn to work among beneficiaries. The provisions of SubtitleC of Title I are important in providing for intensive outreach andthe dissemination of accurate work-incentive information.Project NetWork provides some useful information with respectto both.
Project NetWork included a combination of extensiveoutreach through mailings and other means covering DIbeneficiaries and SSI applicants and recipients, and moreintensive, one-on-one direct contact with interested beneficia-ries to provide oral explanations of work-incentive provisions toassure that volunteers participated in the demonstration basedon accurate information. This combination of extensiveoutreach and direct contact with beneficiaries was successful inincreasing participation in this employment-oriented interven-tion. This is an important lesson, since providers under theTicket program face incentives to serve the most job-ready, butif the legislation is to be successful both in terms of overallobjectives and net outcomes, it will be necessary to havesuccessful outreach to a broad array of potentially interestedapplicants and beneficiaries. Given the financial incentives, wewould assume that the employment networks would activelypursue beneficiaries and provide them with explanations ofwork-incentive provisions.
The Project NetWork experience suggests that combiningextensive outreach with direct phone and/or face-to-facebeneficiary contact may be essential to increase beneficiaryparticipation and to provide accurate information. The mailingsto beneficiaries were useful to provide a low-cost method ofidentifying potential candidates for employment interventionthrough self-screening. However, the case studies indicated
that those who received the mailings often ignored or misinter-preted the content of the written information. For example,some people thought they would lose benefits if they did notvolunteer. The face-to-face contact was useful to reduce suchmisinformation. The Project NetWork survey information alsoindicated possible misunderstanding and misinformation ofSSA work-incentive provisions, even after direct contact ofSSA staff with volunteers.
The new Ticket system will provide new opportunities andpotential challenges in this respect. Since most new providersare envisioned to be private organizations, it is likely thatoutreach will team with advocacy and take on more of amarketing approach. While such an approach would beexpected to reduce beneficiaries� fears and possibly increasetheir expectation for success, it may also reduce the controlSSA has over the content of the information provided. It willthus be important for SSA to work with service providers andassist them in developing mechanisms to provide accurateinformation. Increasing the accuracy of work-incentiveinformation is also critical for the $1 for $2 benefit reductiondemonstration. Simply put, if beneficiaries do not receiveaccurate information on the alternative work-incentive regimesto be tested, that in itself could result in the finding of noimpact of �One-for-Two.�
Another lesson relates to the management informationsystem requirements of implementing new interventions. TheProject NetWork experience indicated that the successfulimplementation of a new employment initiative requiressubstantial advance planning and the implementation of MISsystems and other system changes necessary for implementingthe new intervention. These activities are necessary not onlyfor the evaluability of the intervention but for the efficient andconsistent implementation of the intervention as well.
Project NetWork was successful in creating a workable MISsystem. However, the lack of system changes resulted inpotentially important problems in implementation and alsolimited the evaluation. Most importantly, the overall SSArecord system for beneficiaries was not changed to fullyimplement in an automated fashion the waiver provisions of thedemonstration. The evaluation suggested that relying onmanual systems alone in implementing waiver provisions mayhave resulted in incomplete implementation of waiver provi-sions.
Since the changes initiated by the Ticket program and alsothe $1 for $2 demonstration are much more far-reaching thanthose that have been included in Project NetWork, appropriateattention to the need to implement changes in SSA datasystems is very important. Without accurate system-widetracking of beneficiaries (including those who move to otherstates), it may not be possible for SSA to carry out responsibili-ties to Ticket providers, to report accurate information to theCommissioner so that a review and recalibration of thepercentages that form the basis of the Ticket payment systemcan be made, or to convey accurate information with respect topotential legal disputes concerning payments to providers.
Finally, the Project NetWork experience indicated the
Social Security Bulletin � Vol. 63 � No. 1 � 2000 31
feasibility and importance of designing and implementing acomplex evaluation, including a credible method of implement-ing a net outcome evaluation. It showed that it was feasible touse experimental methods of evaluation and to use availableSSA records to track annual covered earnings, SSI payments,and DI benefits.
Notes
Acknowledgments: The authors wish to thank Larry Orr, MichelleWood, David Long, and Nancy Burstein of Abt Associates for theirassistance. John Blomquist, formerly of Abt Associates, also assistedin the impact analysis. Stephen Bell, currently at the Urban Institute,guided the initial design of the impact study and cost/benefit analysis.Extensive guidance and support for the study was provided by LeoMcManus, co-project officer, of the Social Security Administration(along with Kalman Rupp). Among the many staff members at SSA�sOffice of Research, Evaluation, and Statistics who assisted in thisstudy are Jeff Shapiro, Steve Sandell, Charlie Scott, Russell Hudson,Mary Barbour, Joel Packman, and Larry Wilson. The authors aregrateful for the efforts of Dianne Driessen, Young Park, Lori Ramsey,and Susie Brenner at Fu Associates, Ltd., for their work in developingthe SSI and DI benefit data files. We are thankful for review com-ments by Howard Iams, Leo McManus, Paul O�Leary, and Jane Ross.The authors also would like to acknowledge the commitment of localstaff in the eight demonstration sites. Lastly, Robert Kornfeldacknowledges additional funding from Abt Associates for contributingto the preparation of this article.
1 Previous publications provided reviews of the demonstrationdesign (Bell and others 1994; McManus, Rupp, and Bell 1993; andRupp, Bell, and McManus 1994), an analysis of self-selection andtargeting for participation based on survey and case study data(Rupp, Wood, and Bell 1996), and an initial summary of the processanalysis results (Leiter, Wood, and Bell 1997). The development ofthe Project NetWork administrative records database and eligibilitysimulation is summarized in Rupp, Driessen, Kornfeld, and Wood(1999). A series of reports from Abt Associates, the firm chosen toevaluate the demonstration, provide detailed summaries of the finalprocess analysis (Wood, Leiter, McInnis, and Bell 1996), the analysisof participation (Burstein, Roberts, and Wood 1999), the experimentalimpact and benefit/cost analyses (Kornfeld, Wood, Orr, and Long1999), and the nonexperimental analysis of the effects of the waivers(Burstein, Beecroft, Hiller, and Wood 1999). Staff at Fu Associatesprovided valuable assistance with the development of the ProjectNetWork database, and staff at Lewin-ICF (now the Lewin Group)assisted with the design of the surveys.
2 As described in detail in Rupp and others (1999), the eligibilitysimulation is based on a deterministic model applying ProjectNetWork eligibility rules to the relevant variables from SSA�sadministrative record database. There is no statistical imputationinvolved in the procedure.
3 For all individuals solicited to participate in Project NetWork, wehave monthly SSI benefit data from January 1990 through December1996, and monthly DI benefit information from January 1990 throughDecember 1997. In addition, the file contains information on the totalnumber of months of eligibility for SSI and DI benefits prior toJanuary 1990, and the month and year in which persons were firsteligible for SSI or DI. These data were taken from the MBR810/811and SSR831 files and were created through a collaborative process
between SSA/ORES staff, Abt Associates, and Fu Associates. Thefile creation process is documented in two reports prepared by FuAssociates (1998a, 1998b).
4 Electronic records of the solicitation process for a period of timeafter the demonstration started were not kept for the evaluation, so itwas necessary to recreate the universe of Project NetWork eligiblesusing information about the schedule for mail solicitation in eachdemonstration site, the timing of solicitation of new SSI applicants,and administrative data on the receipt of SSI and DI benefits.Specifically, the analysis sample was constructed by includingindividuals who, according to administrative records, applied for SSIduring the sample intake period or were receiving SSI or DI benefits inthe month prior to the scheduled mail solicitation (Rupp and others1999). These procedures used to obtain the sample of solicitedpersons and their demographic characteristics are documented in areport produced by Abt Associates (1998).
5 The Case Management Control System (CMCS) was used totrack volunteers who were randomly assigned. The CMCS is also asource of information on years of education and marital status. Weused the CMCS to impute a small number of observations of baselinedemographic variables that were missing from SSA�s administrativefiles.
6 The baseline survey response rates were 87 percent for partici-pants, 53 percent for existing beneficiaries and recipients sampled asnonparticipants, and 49 percent for new SSI applicants sampled asnonparticipants. Interviews were attempted with all treatment andcontrol group cases who completed a baseline interview and who wererandomly assigned on or after June 1, 1993, to ensure that the recallperiod between random assignment and the interview would be nomore than 36 months. The followup survey response rate was 83percent. Across the two waves of interviews of volunteers, then, thecombined response rate for participants was 72 percent.
7 The baseline survey was designed by Lewin-ICF (now the LewinGroup), and the followup survey was designed by Abt Associates. Allinterviews were in-person, and most occurred in the respondent�shome. Interviewers administered electronic survey questionnairesusing laptop computers and computer-assisted personal interviewing(CAPI) techniques. Most questions required a simple limited-choiceanswer (for example, yes/no, or �choose one of the following�); onlyin a few instances were respondents required to provide short-answerresponses (for example, type of occupation). Each respondentreceived $20 upon completion of the interview. SSA was verysensitive to the physical limitations of the population being surveyed.Flash cards listing response categories were used in all interviews.Signers facilitated the interview process for those with hearingimpairments, Braille flashcards were used for those with sightimpairments, and a Spanish version of the instrument was developedfor respondents speaking Spanish as a first language (interpreterswere provided as needed for respondents who spoke neither Englishnor Spanish). In addition, the respondent could make use of a proxy(for example, family member or friend) to assist with their responses.
8 These impacts are smaller in magnitude than those found in theTransitional Employment and Training Demonstration (Decker andThornton 1994). In that test of employment services for SSIrecipients with a diagnosis of mental retardation, an experimentalevaluation found earnings gains of $714 per year, or 73 percent, over a6-year followup period.
9 However, the observed decline in estimated impacts from thesecond to the third followup year is partly caused by the change in
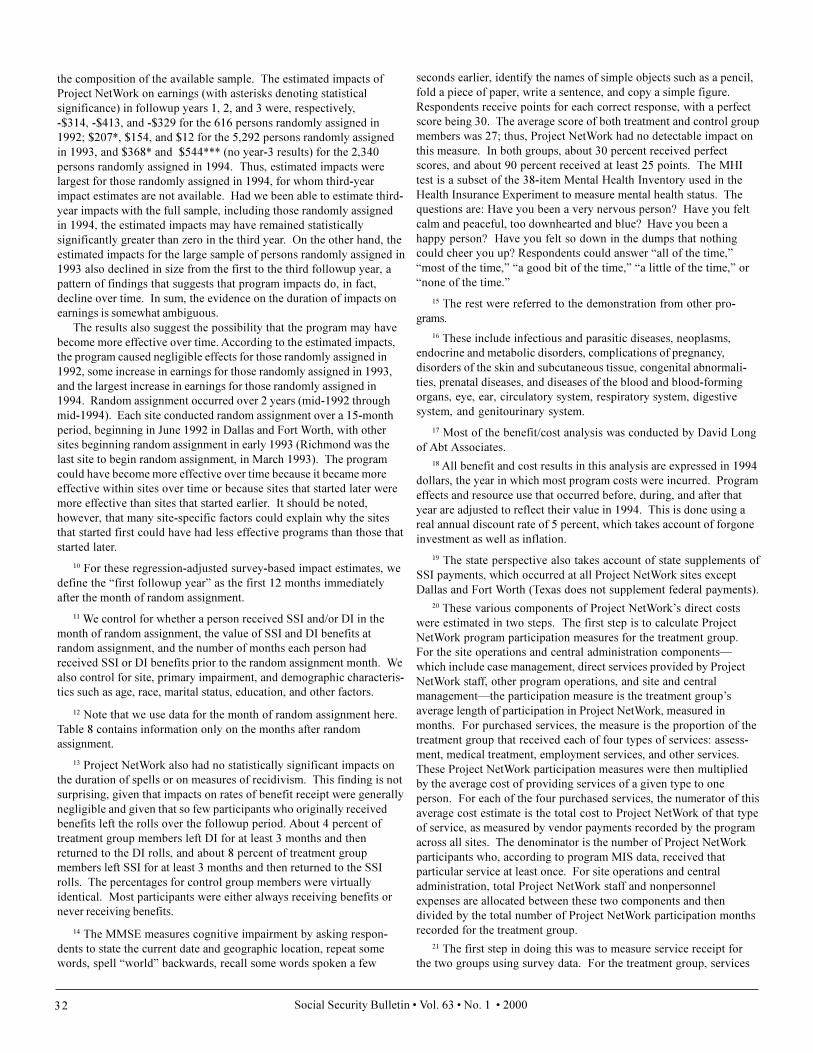
Social Security Bulletin � Vol. 63 � No. 1 � 200032
the composition of the available sample. The estimated impacts ofProject NetWork on earnings (with asterisks denoting statisticalsignificance) in followup years 1, 2, and 3 were, respectively,-$314, -$413, and -$329 for the 616 persons randomly assigned in1992; $207*, $154, and $12 for the 5,292 persons randomly assignedin 1993, and $368* and $544*** (no year-3 results) for the 2,340persons randomly assigned in 1994. Thus, estimated impacts werelargest for those randomly assigned in 1994, for whom third-yearimpact estimates are not available. Had we been able to estimate third-year impacts with the full sample, including those randomly assignedin 1994, the estimated impacts may have remained statisticallysignificantly greater than zero in the third year. On the other hand, theestimated impacts for the large sample of persons randomly assigned in1993 also declined in size from the first to the third followup year, apattern of findings that suggests that program impacts do, in fact,decline over time. In sum, the evidence on the duration of impacts onearnings is somewhat ambiguous.
The results also suggest the possibility that the program may havebecome more effective over time. According to the estimated impacts,the program caused negligible effects for those randomly assigned in1992, some increase in earnings for those randomly assigned in 1993,and the largest increase in earnings for those randomly assigned in1994. Random assignment occurred over 2 years (mid-1992 throughmid-1994). Each site conducted random assignment over a 15-monthperiod, beginning in June 1992 in Dallas and Fort Worth, with othersites beginning random assignment in early 1993 (Richmond was thelast site to begin random assignment, in March 1993). The programcould have become more effective over time because it became moreeffective within sites over time or because sites that started later weremore effective than sites that started earlier. It should be noted,however, that many site-specific factors could explain why the sitesthat started first could have had less effective programs than those thatstarted later.
10 For these regression-adjusted survey-based impact estimates, wedefine the �first followup year� as the first 12 months immediatelyafter the month of random assignment.
11 We control for whether a person received SSI and/or DI in themonth of random assignment, the value of SSI and DI benefits atrandom assignment, and the number of months each person hadreceived SSI or DI benefits prior to the random assignment month. Wealso control for site, primary impairment, and demographic characteris-tics such as age, race, marital status, education, and other factors.
12 Note that we use data for the month of random assignment here.Table 8 contains information only on the months after randomassignment.
13 Project NetWork also had no statistically significant impacts onthe duration of spells or on measures of recidivism. This finding is notsurprising, given that impacts on rates of benefit receipt were generallynegligible and given that so few participants who originally receivedbenefits left the rolls over the followup period. About 4 percent oftreatment group members left DI for at least 3 months and thenreturned to the DI rolls, and about 8 percent of treatment groupmembers left SSI for at least 3 months and then returned to the SSIrolls. The percentages for control group members were virtuallyidentical. Most participants were either always receiving benefits ornever receiving benefits.
14 The MMSE measures cognitive impairment by asking respon-dents to state the current date and geographic location, repeat somewords, spell �world� backwards, recall some words spoken a few
seconds earlier, identify the names of simple objects such as a pencil,fold a piece of paper, write a sentence, and copy a simple figure.Respondents receive points for each correct response, with a perfectscore being 30. The average score of both treatment and control groupmembers was 27; thus, Project NetWork had no detectable impact onthis measure. In both groups, about 30 percent received perfectscores, and about 90 percent received at least 25 points. The MHItest is a subset of the 38-item Mental Health Inventory used in theHealth Insurance Experiment to measure mental health status. Thequestions are: Have you been a very nervous person? Have you feltcalm and peaceful, too downhearted and blue? Have you been ahappy person? Have you felt so down in the dumps that nothingcould cheer you up? Respondents could answer �all of the time,��most of the time,� �a good bit of the time,� �a little of the time,� or�none of the time.�
15 The rest were referred to the demonstration from other pro-grams.
16 These include infectious and parasitic diseases, neoplasms,endocrine and metabolic disorders, complications of pregnancy,disorders of the skin and subcutaneous tissue, congenital abnormali-ties, prenatal diseases, and diseases of the blood and blood-formingorgans, eye, ear, circulatory system, respiratory system, digestivesystem, and genitourinary system.
17 Most of the benefit/cost analysis was conducted by David Longof Abt Associates.
18 All benefit and cost results in this analysis are expressed in 1994dollars, the year in which most program costs were incurred. Programeffects and resource use that occurred before, during, and after thatyear are adjusted to reflect their value in 1994. This is done using areal annual discount rate of 5 percent, which takes account of forgoneinvestment as well as inflation.
19 The state perspective also takes account of state supplements ofSSI payments, which occurred at all Project NetWork sites exceptDallas and Fort Worth (Texas does not supplement federal payments).
20 These various components of Project NetWork�s direct costswere estimated in two steps. The first step is to calculate ProjectNetWork program participation measures for the treatment group.For the site operations and central administration components�which include case management, direct services provided by ProjectNetWork staff, other program operations, and site and centralmanagement�the participation measure is the treatment group�saverage length of participation in Project NetWork, measured inmonths. For purchased services, the measure is the proportion of thetreatment group that received each of four types of services: assess-ment, medical treatment, employment services, and other services.These Project NetWork participation measures were then multipliedby the average cost of providing services of a given type to oneperson. For each of the four purchased services, the numerator of thisaverage cost estimate is the total cost to Project NetWork of that typeof service, as measured by vendor payments recorded by the programacross all sites. The denominator is the number of Project NetWorkparticipants who, according to program MIS data, received thatparticular service at least once. For site operations and centraladministration, total Project NetWork staff and nonpersonnelexpenses are allocated between these two components and thendivided by the total number of Project NetWork participation monthsrecorded for the treatment group.
21 The first step in doing this was to measure service receipt forthe two groups using survey data. For the treatment group, services
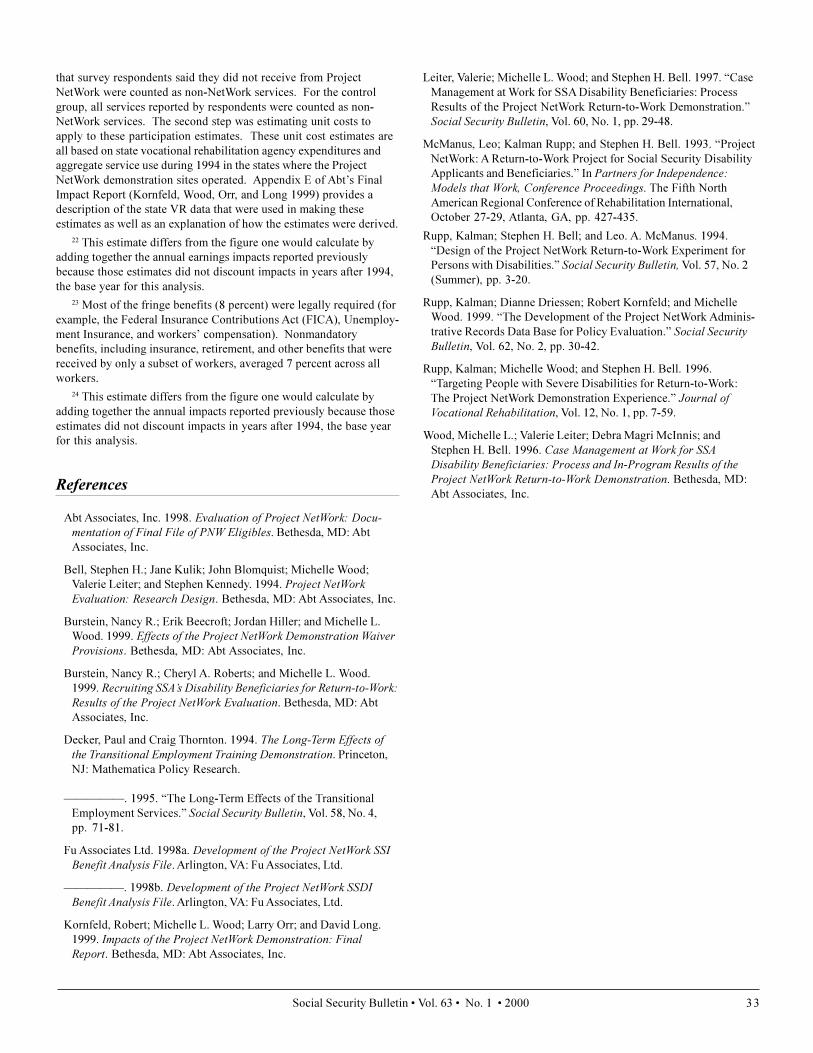
Social Security Bulletin � Vol. 63 � No. 1 � 2000 33
that survey respondents said they did not receive from ProjectNetWork were counted as non-NetWork services. For the controlgroup, all services reported by respondents were counted as non-NetWork services. The second step was estimating unit costs toapply to these participation estimates. These unit cost estimates areall based on state vocational rehabilitation agency expenditures andaggregate service use during 1994 in the states where the ProjectNetWork demonstration sites operated. Appendix E of Abt�s FinalImpact Report (Kornfeld, Wood, Orr, and Long 1999) provides adescription of the state VR data that were used in making theseestimates as well as an explanation of how the estimates were derived.
22 This estimate differs from the figure one would calculate byadding together the annual earnings impacts reported previouslybecause those estimates did not discount impacts in years after 1994,the base year for this analysis.
23 Most of the fringe benefits (8 percent) were legally required (forexample, the Federal Insurance Contributions Act (FICA), Unemploy-ment Insurance, and workers� compensation). Nonmandatorybenefits, including insurance, retirement, and other benefits that werereceived by only a subset of workers, averaged 7 percent across allworkers.
24 This estimate differs from the figure one would calculate byadding together the annual impacts reported previously because thoseestimates did not discount impacts in years after 1994, the base yearfor this analysis.
References
Abt Associates, Inc. 1998. Evaluation of Project NetWork: Docu-mentation of Final File of PNW Eligibles. Bethesda, MD: AbtAssociates, Inc.
Bell, Stephen H.; Jane Kulik; John Blomquist; Michelle Wood;Valerie Leiter; and Stephen Kennedy. 1994. Project NetWorkEvaluation: Research Design. Bethesda, MD: Abt Associates, Inc.
Burstein, Nancy R.; Erik Beecroft; Jordan Hiller; and Michelle L.Wood. 1999. Effects of the Project NetWork Demonstration WaiverProvisions. Bethesda, MD: Abt Associates, Inc.
Burstein, Nancy R.; Cheryl A. Roberts; and Michelle L. Wood.1999. Recruiting SSA�s Disability Beneficiaries for Return-to-Work:Results of the Project NetWork Evaluation. Bethesda, MD: AbtAssociates, Inc.
Decker, Paul and Craig Thornton. 1994. The Long-Term Effects ofthe Transitional Employment Training Demonstration. Princeton,NJ: Mathematica Policy Research.
�����. 1995. �The Long-Term Effects of the TransitionalEmployment Services.� Social Security Bulletin, Vol. 58, No. 4,pp. 71-81.
Fu Associates Ltd. 1998a. Development of the Project NetWork SSIBenefit Analysis File. Arlington, VA: Fu Associates, Ltd.
�����. 1998b. Development of the Project NetWork SSDIBenefit Analysis File. Arlington, VA: Fu Associates, Ltd.
Kornfeld, Robert; Michelle L. Wood; Larry Orr; and David Long.1999. Impacts of the Project NetWork Demonstration: FinalReport. Bethesda, MD: Abt Associates, Inc.
Leiter, Valerie; Michelle L. Wood; and Stephen H. Bell. 1997. �CaseManagement at Work for SSA Disability Beneficiaries: ProcessResults of the Project NetWork Return-to-Work Demonstration.�Social Security Bulletin, Vol. 60, No. 1, pp. 29-48.
McManus, Leo; Kalman Rupp; and Stephen H. Bell. 1993. �ProjectNetWork: A Return-to-Work Project for Social Security DisabilityApplicants and Beneficiaries.� In Partners for Independence:Models that Work, Conference Proceedings. The Fifth NorthAmerican Regional Conference of Rehabilitation International,October 27-29, Atlanta, GA, pp. 427-435.
Rupp, Kalman; Stephen H. Bell; and Leo. A. McManus. 1994.�Design of the Project NetWork Return-to-Work Experiment forPersons with Disabilities.� Social Security Bulletin, Vol. 57, No. 2(Summer), pp. 3-20.
Rupp, Kalman; Dianne Driessen; Robert Kornfeld; and MichelleWood. 1999. �The Development of the Project NetWork Adminis-trative Records Data Base for Policy Evaluation.� Social SecurityBulletin, Vol. 62, No. 2, pp. 30-42.
Rupp, Kalman; Michelle Wood; and Stephen H. Bell. 1996.�Targeting People with Severe Disabilities for Return-to-Work:The Project NetWork Demonstration Experience.� Journal ofVocational Rehabilitation, Vol. 12, No. 1, pp. 7-59.
Wood, Michelle L.; Valerie Leiter; Debra Magri McInnis; andStephen H. Bell. 1996. Case Management at Work for SSADisability Beneficiaries: Process and In-Program Results of theProject NetWork Return-to-Work Demonstration. Bethesda, MD:Abt Associates, Inc.