the noaa ship the noaa ship okeanos explorerokeanos explorer · 2018-01-09 · theme: why do we...
TRANSCRIPT

THEME: WHY DO WE EXPLORE Key Topic Inquiry: Climate Change
1
The NOAA Ship Okeanos ExplorerThe NOAA Ship Okeanos Explorerwww.oceanexplorer.noaa.gov
An essential component of the NOAA Office of Ocean Exploration and
Research mission is to enhance understanding of science, technology,
engineering, and mathematics used in exploring the ocean, and build
interest in careers that support ocean-related work. To help fulfill this
mission, the Okeanos Explorer Education Materials Collection is
being developed to encourage educators and students to become personally
involved with the voyages and discoveries of the Okeanos Explorer—
America’s first Federal ship dedicated to Ocean Exploration. Leader’s
Guides for Classroom Explorers focus on three themes: “Why Do We
Explore?” (reasons for ocean exploration), “How Do We Explore?”
(exploration methods), and “What Do We Expect to Find?” (recent
discoveries that give us clues about what we may find in Earth’s largely
unknown ocean). Each Leader’s Guide provides background information,
links to resources, and an overview of recommended lesson plans on
the Ocean Explorer Web site (http://oceanexplorer.noaa.gov). An
Initial Inquiry Lesson for each of the three themes leads student inquiries
that provide an overview of key topics. A series of lessons for each theme
guides student investigations that explore these topics in greater depth.
In the future additional guides will be added to the Education Materials
Collection to support the involvement of citizen scientists.
This lesson guides student inquiry into the key topic of Climate Change
within the “Why Do We Explore?” theme. Optionally, this lesson may
be extended to include an inquiry into the concept of proxies using
conductivity and salinity as an example.
FocusArctic climate change
Grade Level7-8 (Earth Science)
Focus QuestionHow is the climate of the Arctic region changing, and what
impacts are expected from these changes?
NOAA Ship Okeanos Explorer: America’s Ship for Ocean Exploration. Image credit: NOAA. For more information, see the following Web site:http://oceanexplorer.noaa.gov/okeanos/welcome.html
Where Have All the Glaciers Gone?(adapted from the 2005 Hidden Ocean Expedition)

2
The NOAA Ship Okeanos Explorer Why Do We Explore? Key Topic Inquiry: Climate Change oceanexplorer.noaa.gov
Learning Objectives• Students will be able to describe how climate change is
affecting sea ice, vegetation, and glaciers in the Arctic region.
• Students will be able to explain how changes in the Arctic
climate can produce global impacts, and will be able to
provide three examples of such impacts.
• Students will be able to explain how a given impact resulting
from climate change may be considered “positive” as well as
“negative”, and will be able to provide at least one example of
each.
Materials• Copies of Arctic Climate Change Inquiry Guide, one copy for
each student or student group
• (Optional) Copies of Arctic Climate Impact Assessment (ACIA)
Highlights and Climate Change, the Arctic and the United Kingdom:
Directions for Future Research; see Learning Procedure, Step 1
• (Optional) Materials for constructing photocubes; the
following quantities are for one photocube; kits of these
materials are available from http://www.chicaandjo.com/
ourstore/
– 8 - 1.5” wooden cubes
– 8 - 3” x 3” photos printed on thin photo-quality paper such
as HP Bright White Inkjet Paper
– 2 - 3” x 6” photos, printed on paper described above
– 2 - 8” x 11” sheets of double-sided tape (“red liner tape”)
– Black felt tip marker
– Scissors or paper trimmer
– Sandpaper, 150 grit or finer
Audiovisual Materials• None
Teaching TimeOne or two 45-minute class periods, plus time for student
research
Seating ArrangementClassroom style if students are working individually, or groups of
two to four students
Maximum Number of Students No limit, if students work individually

3
The NOAA Ship Okeanos Explorer Why Do We Explore? Key Topic Inquiry: Climate Change oceanexplorer.noaa.gov
Key Words and ConceptsArctic Ocean
Canada Basin
Climate change
Greenhouse gas
Permafrost
Sea ice
Sea level
Sympagic
Polynya
Background InformationWithin the world scientific community there is broad consensus
that:
• Earth’s climate is undergoing a significant warming trend
that is beyond the range of natural variability;
• The major cause of most of the observed warming is rising
levels of carbon dioxide;
• The rise in carbon dioxide levels is the result of burning
fossil fuels;
• If carbon dioxide levels in the atmosphere continue to rise
over the next century the warming will continue; and
• The climate change that is expected to result from these
conditions represents potential danger to human welfare
and the environment.
The consensus on these points is supported by a huge amount
of data from many places on Earth. A brief summary of some
of the key data is provided in Appendix A; for more details, see
references listed under “Other Resources.”
Since the late 1800’s, average global surface temperatures have
increased by about 0.74°C. The word “average” is very important,
because some parts of Earth (including the southeastern United
States and parts of the North Atlantic) have cooled slightly
during this period. The greatest warming has been observed in
Eurasia and North America between latitude 40° and 70° N.
Some confusion about the warming trend has recently been
generated by assertions that Earth’s temperature has been
dropping for the last ten years. These statements are based on
the fact that 1998 was abnormally hot due to the strongest El
Nino event in the last century. The years following 1998 were
indeed cooler than 1998, but the long-term trend still shows
continued warming. There are many factors that affect global
temperatures in a single year, and it is not surprising that one
The black and white photograph of Muir Glacier was taken on August 13, 1941; the color photograph was taken from the same vantage on August 31, 2004. Between 1941 and 2004 the glacier retreated more than twelve kilometers (seven miles) and thinned by more than 800 meters (875 yards). Ocean water has filled the valley, replacing the ice of Muir Glacier; the end of the glacier has retreated out of the field of view. The glacier’s absence reveals scars where glacier ice once scraped high up against the hillside. In 2004, trees and shrubs grew thickly in the foreground, where in 1941 there was only bare rock. Image credit: National Snow and Ice Data Center, W. O. Field, B. F. Molnia. http://nsidc.org/data/glacier_photo/repeat_photog-raphy.html
4
The NOAA Ship Okeanos Explorer Why Do We Explore? Key Topic Inquiry: Climate Change oceanexplorer.noaa.gov
year might be cooler than the preceding year. But the global
warming trend is a matter of decades, not just one or two years.
The long-term trend is still clear: Seven of the eight warmest
years on record have occurred since 2001, and the ten warmest
years on record have all occurred since 1995.
These changes are particularly dramatic in the Arctic, where
temperature is increasing at nearly twice the rate of increase
occurring in the rest of the world. The Arctic Ocean is the most
inaccessible and least-studied of all the Earth’s major oceans. Its
deepest parts (5,441 m; 17,850 ft), known as the Canada Basin,
are particularly isolated and unexplored because until recently
they were covered by ice for the entire year. To a large extent,
the Canada Basin is also geographically isolated by the largest
continental shelf of any ocean basin (average depth about 50
meters) bordering Eurasia and North America. The Chukchi
Sea provides a connection with the Pacific Ocean via the Bering
Strait, but this connection is very narrow and shallow, so most
water exchange is with the Atlantic Ocean via the Greenland Sea.
This isolation makes it likely that unique species have evolved in
the Canada Basin.
The 2002 Ocean Exploration expedition to the Arctic Ocean
focused specifically on the biology and oceanography of the
Canada Basin. Three distinct biological communities were
explored:
• The Sea-Ice Realm, which includes plants and animals that
live on, in, and just under the ice that floats on the ocean’s
surface;
• The Pelagic Realm, which includes organisms that live in
the water column between the ocean surface and the bot-
tom; and
• The Benthic Realm, which is composed of organisms that
live on the bottom, including sponges, bivalves, crustaceans,
polychaete worms, sea anemones, bryozoans, tunicates, and
ascidians.
These realms are linked in many ways, and food webs in each
realm interact with those of the other realms.
Sea ice provides a complex habitat for many species that are
called sympagic, which means “ice-associated.” The ice is riddled
with a network of tunnels called brine channels that range
in size from microscopic (a few thousandths of a millimeter)
to more than an inch in diameter. Diatoms and algae inhabit
these channels and obtain energy from sunlight to produce
biological material through photosynthesis (a process called

5
The NOAA Ship Okeanos Explorer Why Do We Explore? Key Topic Inquiry: Climate Change oceanexplorer.noaa.gov
“primary production”). Bacteria, viruses, and fungi also inhabit
the channels, and together with diatoms and algae provide an
energy source (food) for flatworms, crustaceans, and other
animals. In the spring, melting ice releases organisms and
nutrients that interact with the ocean water below the ice. Large
masses of algae form at the ice-seawater interface and may form
filaments several meters long. On average, more than 50% of
the primary production in the Arctic Ocean comes from single-
celled algae that live near the ice-seawater junction.
The ice-seawater interface is critical to the polar marine
ecosystem, providing an energy source (food) for many
organisms, as well as protection from predators. Arctic cod use
the interface area as nursery grounds, and in turn provide an
important food source for many marine mammals and birds.
The ice also provides migration routes for polar bears. In the
spring, the solid ice cover breaks into floes of pack ice that can
transport organisms, nutrients, and pollutants over thousands of
kilometers. Partial melting of sea ice during the summer months
produces ponds on the ice surface called polynyas that contain
their own communities of organisms. Because only 50% of this
ice melts in the summer, ice floes can exist for many years and
can reach a thickness of more than 2 m (6 ft).
When sea ice melts, more sunlight enters the sea, and algae grow
rapidly since the sun shines for 24 hours a day during the summer.
These algae provide energy for a variety of pelagic organisms,
including floating crustaceans and jellyfishes called zooplankton,
which are the energy source for larger pelagic animals including
fishes, squids, seals, and whales. When pelagic organisms die, they
settle to the ocean bottom, and become the energy source for
inhabitants of the benthic realm. These animals, in turn, provide
energy for bottom-feeding fishes, whales, and seals.
The 2005 Hidden Ocean expedition focused on additional
explorations of these realms. A key objective was to help establish
a marine life inventory and map the physical and chemical
environment of the sea-ice, pelagic, and benthic ecosystems
of the Canada Basin. This kind of exploration is increasingly
urgent, because the Arctic environment is changing at a
dramatic rate. One visible result is rapid loss of glaciers and
sea ice. Less visible are the impacts on living organisms that
depend upon glaciers and sea ice for their habitat. Melting sea
ice can also have direct effects on human communities. The
Greenland Ice Sheet, for example, holds enough water to raise
global sea levels by as much as 7 meters. Sea level increases at

6
The NOAA Ship Okeanos Explorer Why Do We Explore? Key Topic Inquiry: Climate Change oceanexplorer.noaa.gov
this magnitude would be sufficient to flood many coastal cities,
including most of the city of London.
This lesson guides a student inquiry into some of the impacts
that are expected to result from a warmer Arctic climate.
Learning Procedure1. To prepare for this lesson:
• If you have not previously done so, review introductory
information on the NOAA Ship Okeanos Explorer at http://
oceanexplorer.noaa.gov/okeanos/welcome.html. You may
also want to consider having students complete some or
all of the Initial Inquiry Lesson, To Boldly Go… (http://
oceanexplorer.noaa.gov/okeanos/edu/leadersguide/
media/09toboldlygo.pdf).
• To become more familiar with the 2005 Hidden Ocean
expedition, you may want to visit the expedition’s Web page
(http://oceanexplorer.noaa.gov/explorations/05arctic/
welcome.html) for an overview of the expedition and
background essays.
• Review ACIA Highlights and Climate Change, the Arctic and
the United Kingdom: Directions for Future Research (http://
amap.no/acia/Highlights.pdf and http://www.scribd.com/
doc/42980/Arctic, respectively). You may want to download
and copy these documents if students will not be using the
internet to complete their assignment.
• Review questions on the Arctic Climate Change Inquiry Guide.
• Decide whether you want to have student groups make
photocubes to show changes in glaciers. These objects
can be used very effectively as visual aids for student
presentations about climate change to other audiences
(other groups of students, parents, etc.); see Learning
Procedure, Step 4 and Photocube Construction Guide.
2. If you have not previously done so, briefly introduce the
NOAA Ship Okeanos Explorer, emphasizing that this is the
first Federal vessel specifically dedicated to exploring Earth’s
largely unknown ocean. Lead a discussion of reasons that
ocean exploration is important, which should include further
understanding of climate change. Show students a graph
of global surface temperature trends (e.g., http://www.
pewclimate.org/docUploads/images/global-surface-temp-
trends.gif), and ask them if they can recognize any trend in
the data. Data are variable prior to about 1910, but thereafter
there is a distinct trend of increasing temperature. Ask
students whether the drop in surface temperature between
1935 and 1945 cancels out the overall trend. Students should

7
The NOAA Ship Okeanos Explorer Why Do We Explore? Key Topic Inquiry: Climate Change oceanexplorer.noaa.gov
realize that year-to-year fluctuations do not negate trends over
longer periods of time.
Briefly review the geography of the Arctic Ocean,
highlighting the location of the Canada Basin and the
activities of the 2005 Hidden Ocean expedition. Do not
discuss Arctic climate change at this point. Tell students that
their assignment is to answer questions on the Arctic Climate
Change Inquiry Guide. Provide copies of the reports cited
above, or direct students to the appropriate Web sites.
3. Lead a brief discussion of students’ responses to worksheet
questions. The discussion should include the following
points:
a. The extent of Arctic sea ice has decreased by 5% in the last
20 years (8% in the last 30 years). In some areas, sea ice
thickness has decreased by 40%.
b. The Arctic climate is warming more rapidly than elsewhere
on Earth. Reasons for this include:
– Reduced surface reflectivity caused by snow- and ice-melt
allows more solar energy to be absorbed by the Earth’s
surface;
– More of the trapped energy goes directly to warming
rather than to providing heat for evaporation;
– Less heat is required to warm the atmosphere over the
Arctic because the Arctic atmosphere is thinner than
elsewhere;
– With less sea ice, the heat absorbed by the ocean in
summer is more easily transferred to the atmosphere in
winter; and
– Changes in atmospheric and oceanic circulation can
cause heat to be retained in the Arctic region.
c. Ice in the Greenland Ice Sheet contains enough water to
raise global sea levels by 7 meters.
d. Sea ice is melting at an increasing rate over the Greenland
Ice Sheet.
e. Global average sea level has risen by about 8 cm during the
past 20 years.
f. The melting trend on the Greenland Ice Sheet was
interrupted in 1992 when ash from the Mt. Pinatubo volcano
reduced the amount of sunlight reaching the Earth’s surface,
resulting in a short-term global cooling event.
g. Changes in snow, ice, and vegetation lower the reflectivity
of Arctic land and ocean surfaces, causing more solar
energy to be absorbed and thus accelerate global warming.
h. Rising sea level and reduced sea ice allow stronger waves

8
The NOAA Ship Okeanos Explorer Why Do We Explore? Key Topic Inquiry: Climate Change oceanexplorer.noaa.gov
and storm surges to reach shore, increasing coastal erosion;
particularly where melting permafrost has weakened the
soil structure.
i. The Arctic is believed to hold about one-fourth of the
world’s undiscovered petroleum resources.
j. While warmer temperatures were the trend for most of the
Arctic region between 1966 and 1995, a cooling trend took
place in the northernmost portions of the Arctic during this
period.
k. At present, primary Arctic industries are fishing, timber
production, mineral mining, and petroleum production.
In addition, tourism and renewable energy are growing in
importance.
l. Ultraviolet radiation in the Arctic is increasing due to deple-
tion of stratospheric ozone.
m. Glaciers are shrinking throughout the Arctic region.
n. Woody plants and scrub vegetation are becoming more
widely distributed and are replacing tundra-type vegetation.
o. Permafrost is thawing at an increasing rate, causing un-
stable ground conditions that damage roads, pipelines, and
building foundations.
p. Travel across ice is being restricted because thinning ice is
less stable.
q. Warmer climates could cause significant quantities of water,
methane, and carbon dioxide to be released from the
Arctic. The result of these releases would be rising sea level,
and increasingly warm temperatures due to the “green-
house effect” of methane and carbon dioxide.
r. Because many activities in the Arctic are presently ham-
pered by sea ice, reduction in the extent of sea ice could be
a stimulus to commercial development. Increased eco-
nomic development could have serious negative impacts
on wilderness areas, environmental quality, and indigenous
cultures.
s. Major reductions in Arctic sea ice could make the Arctic
Ocean the shortest sea route between North America and
Asia.
Students should recognize that whether an impact is “positive”
or “negative” often depends upon an individual’s perspective. If
you like polar bears and seals, or belong to an indigenous Arctic
culture, then many of the changes resulting from a warmer Arctic
climate are devastating. On the other hand, if you are involved
in international shipping or petroleum industries, then the same
changes could be seen as providing new opportunities.

9
The NOAA Ship Okeanos Explorer Why Do We Explore? Key Topic Inquiry: Climate Change oceanexplorer.noaa.gov
Students should also understand that while greenhouse gas
emissions from human activities are not the sole cause of
climate change, they play a significant role in these changes
(the ACIA says these emissions “have now become the
dominant factor”). Be sure students realize that atmospheric
concentrations of greenhouse gases will remain elevated
for centuries even if emissions were completely eliminated,
but the rate and extent of warming can be reduced if future
emissions are sufficiently lowered.
4. (optional) Tell students that communication is an essential
element of the scientific process. Visual aids, particularly
if they are three-dimensional, can greatly enhance the
interest of an audience and make presentations much more
memorable. Provide each student or student group with a
copy of the Photocube Construction Guide, and materials listed
in the Guide. You may also want to suggest the following Web
site which contains images of glaciers that show changes
caused by a warmer climate: http://nsidc.org/cgi-bin/
glacier_photos/glacier_photo_search.pl?collection=repeat.
This link opens the Search page for the National Snow and
Ice Data Center’s collection of repeat glacier photography.
Click the “Search” button and a new page will open showing
thumbnails of the photographs.
The BRIDGE Connectionwww.vims.edu/bridge/ – Scroll over “Ocean Science Topics,”
then click “Atmosphere” for links to resources atmosphere and
climate change.
The “Me” ConnectionHave students write a brief essay describing how they might be
personally affected by climate change in the Arctic.
Connections to Other SubjectsBiology, English/Language Arts, Geography
AssessmentStudents’ responses to Inquiry Guide questions and class
discussions provide opportunities for evaluation.
Extensions1. Follow events aboard the Okeanos Explorer at http://
oceanexplorer.noaa.gov/okeanos/welcome.html.
The 2006 Tracking Narwhals in Greenland Expedition used satellite-linked time-depth-temperature recorders to track whale movements, diving behavior, and ocean temperature structure during the fall narwhal migration from north Greenland to Baffin Bay. This information is needed to help understand how Arctic climate change may affect the deep-ocean thermohaline circulation, sometimes known as the “global conveyor belt.” Image credit: Mads Peter Heide-Jorgensen.http://oceanexplorer.noaa.gov/explorations/06arctic/background/hires/male_narwhals_hires.jpg

10
The NOAA Ship Okeanos Explorer Why Do We Explore? Key Topic Inquiry: Climate Change oceanexplorer.noaa.gov
2. Visit http://earthednet.org/Ocean_Materials/Mini_Studies/
Index.html for links to Mini Studies from Earth Education
Online, including Greenhouse Gases and Human Influenced
Climate Change.
Other Relevant Lesson Plans from the Ocean Exploration Program
Frozen out
http://oceanexplorer.noaa.gov/explorations/06arctic/back-
ground/edu/media/frozenout.pdf
(10 pages, 296 kb) (from the 2006 Tracking Narwhals in
Greenland Expedition)
Focus: Impacts of climate change on Arctic predators (Life
Science/Earth Science)
In this activity, students will be able to explain the concepts
of indicator species and microhabitats; compare and contrast
average regional conditions with site-specific conditions;
and explain at least three examples of the impacts of climate
change on top predators in the Arctic.
Climate, Corals, and Change
http://oceanexplorer.noaa.gov/explorations/05stepstones/
background/education/ss_2005_climate.pdf
(14 pages, 441k) (from the North Atlantic Stepping Stones
2005 Expedition)
Focus: Paleoclimatology (Physical Science)
In this activity, students will be able to explain the concept
of “paleoclimatological proxies” and describe at least two
examples, describe how oxygen isotope ratios are related
to water temperature, and interpret data on oxygen isotope
ratios to make inferences about the growth rate of deep-sea
corals. Students will also be able to define “forcing factor”,
describe at least three forcing factors for climate change and
discuss at least three potential consequences of a warmer
world climate.
meet the arCtiC Benthos
http://oceanexplorer.noaa.gov/explorations/02arctic/
background/education/media/arctic_benthos.pdf
(8 pages, 492k) (from the 2002 Arctic Exploration
Expedition)

11
The NOAA Ship Okeanos Explorer Why Do We Explore? Key Topic Inquiry: Climate Change oceanexplorer.noaa.gov
Focus: Benthic invertebrate groups in the Arctic Ocean (Life
Science)
In this activity, students will be able to recognize and identify
major groups found in the Arctic benthos, describe common
feeding strategies used by benthic animals in the Arctic
Ocean, and discuss relationships between groups of animals
in Arctic benthic communities. Students will also be able to
discuss the importance of diversity in benthic communities.
Other ResourcesThe Web links below are provided for informational purposes only. Links out-
side of Ocean Explorer have been checked at the time of this page’s publication,
but the linking sites may become outdated or non-operational over time.
http://oceanexplorer.noaa.gov – Web site for NOAA’s Ocean
Exploration Program
http://celebrating200years.noaa.gov/edufun/book/welcome.
html#book – A free printable book for home and school
use introduced in 2004 to celebrate the 200th anniversary
of NOAA; nearly 200 pages of lessons focusing on the
exploration, understanding, and protection of Earth as a
whole system
http://www.ncdc.noaa.gov/oa/climate/globalwarming.html
– “Global Warming Frequently Asked Questions,” from
NOAA’s National Climatic Data Center
http://www.ipcc.ch/ – Home page for the Intergovernmental
Panel on Climate Change
http://www.unep.org/climatechange/ – United Nations
Environment Programme Climate Change Web page
http://www.epa.gov/climatechange/ – U. S. Environmental
Protection Agency Climate Change Web page
National Science Education StandardsContent Standard A: Science As Inquiry
• Abilities necessary to do scientific inquiry
• Understandings about scientific inquiry
Content Standard B: Physical Science• Motions and forces

12
The NOAA Ship Okeanos Explorer Why Do We Explore? Key Topic Inquiry: Climate Change oceanexplorer.noaa.gov
Content Standard C: Life Science• Interdependence of organisms
Content Standard D: Earth and Space Science• Energy in the Earth system
Content Standard E: Science and Technology• Understandings about science and technology
Content Standard F: Science in Personal and Social Perspectives• Natural resources
• Environmental quality
• Natural and human-induced hazards
• Science and technology in local, national, and global
challenges
Ocean Literacy Essential Principles and Fundamental ConceptsEssential Principle 1. The Earth has one big ocean with many features.
Fundamental Concept b. An ocean basin’s size, shape and features
(such as islands, trenches, mid-ocean ridges, rift valleys) vary due
to the movement of Earth’s lithospheric plates.
Fundamental Concept h. Although the ocean is large, it is finite and
resources are limited.
Essential Principle 5. The ocean supports a great diversity of life and ecosystems.
Fundamental Concept c. Some major groups are found exclusively
in the ocean. The diversity of major groups of organisms is much
greater in the ocean than on land.
Fundamental Concept d. Ocean biology provides many unique
examples of life cycles, adaptations and important relationships
among organisms (such as symbiosis, predator- prey dynamics
and energy transfer) that do not occur on land.
Fundamental Concept e. The ocean is three-dimensional, offering
vast living space and diverse habitats from the surface through
the water column to the seafloor. Most of the living space on
Earth is in the ocean.
Fundamental Concept f. Ocean habitats are defined by environmen-
tal factors. Due to interactions of abiotic factors such as salinity,
temperature, oxygen, pH, light, nutrients, pressure, substrate
and circulation, ocean life is not evenly distributed temporally
or spatially, i.e., it is “patchy.” Some regions of the ocean support
more diverse and abundant life than anywhere on Earth, while
much of the ocean is considered a desert.

13
The NOAA Ship Okeanos Explorer Why Do We Explore? Key Topic Inquiry: Climate Change oceanexplorer.noaa.gov
Essential Principle 6. The ocean and humans are inextricably interconnected.
Fundamental Concept b. From the ocean we get foods, medicines,
and mineral and energy resources. In addition, it provides
jobs, supports our nation’s economy, serves as a highway for
transportation of goods and people, and plays a role in national
security.
Fundamental Concept c. The ocean is a source of inspiration, recre-
ation, rejuvenation and discovery. It is also an important element
in the heritage of many cultures.
Fundamental Concept e. Humans affect the ocean in a variety of
ways. Laws, regulations and resource management affect what
is taken out and put into the ocean. Human development and
activity leads to pollution (such as point source, non-point
source, and noise pollution) and physical modifications (such as
changes to beaches, shores and rivers). In addition, humans have
removed most of the large vertebrates from the ocean.
Fundamental Concept g. Everyone is responsible for caring for the
ocean. The ocean sustains life on Earth and humans must live in
ways that sustain the ocean. Individual and collective actions are
needed to effectively manage ocean resources for all.
Essential Principle 7. The ocean is largely unexplored.
Fundamental Concept a. The ocean is the last and largest
unexplored place on Earth—less than 5% of it has been
explored. This is the great frontier for the next generation’s
explorers and researchers, where they will find great
opportunities for inquiry and investigation.
Fundamental Concept b. Understanding the ocean is more than a
matter of curiosity. Exploration, inquiry and study are required
to better understand ocean systems and processes.
Fundamental Concept c. Over the last 40 years, use of ocean
resources has increased significantly, therefore the future
sustainability of ocean resources depends on our understanding
of those resources and their potential and limitations.
Fundamental Concept d. New technologies, sensors and tools are
expanding our ability to explore the ocean. Ocean scientists
are relying more and more on satellites, drifters, buoys, subsea
observatories and unmanned submersibles.
Fundamental Concept f. Ocean exploration is truly interdisciplinary.
It requires close collaboration among biologists, chemists,
climatologists, computer programmers, engineers, geologists,
meteorologists, and physicists, and new ways of thinking.

14
The NOAA Ship Okeanos Explorer Why Do We Explore? Key Topic Inquiry: Climate Change oceanexplorer.noaa.gov
Send Us Your FeedbackWe value your feedback on this lesson, including how you use it
in your formal/informal education setting.
Please send your comments to: [email protected]
For More InformationPaula Keener-Chavis, Director, Education Programs
NOAA Ocean Exploration Program
Hollings Marine Laboratory
331 Fort Johnson Road, Charleston SC 29412
843.762.8818 843.762.8737 (fax)
AcknowledgmentsThis lesson plan was produced by Mel Goodwin, PhD, The
Harmony Project, Charleston, SC for the National Oceanic
and Atmospheric Administration. If reproducing this lesson,
please cite NOAA as the source, and provide the following URL:
http://oceanexplorer.noaa.gov

15
The NOAA Ship Okeanos Explorer Why Do We Explore? Key Topic Inquiry: Climate Change oceanexplorer.noaa.gov
Arctic Climate Change Inquiry Guide
The following questions are intended to introduce you to some basic
information about climate change in the Arctic.
a. What has happened to Arctic sea ice in the last 20 years?
b. How do climate trends in the Arctic compare with similar trends
elsewhere on Earth?
c. How could water in the Greenland Ice Sheet affect global sea levels?
d. What is happening to sea ice in the Greenland Ice Sheet?
e. What has happened to global average sea level during the past 20 years?
f. What happened in 1992 that interrupted the pattern of change on the
Greenland Ice Sheet?
g. How could changes in snow, ice, and vegetation in the Arctic affect global
warming?

16
The NOAA Ship Okeanos Explorer Why Do We Explore? Key Topic Inquiry: Climate Change oceanexplorer.noaa.gov
Arctic Climate Change Inquiry Guide - Page 2
h. How could a warmer Arctic climate affect coastal erosion?
i. How significant are Arctic petroleum reserves?
j. Are climatic trends the same for the entire Arctic region?
k. At present, what are the major industries in the Arctic?
l. What is happening to ultraviolet radiation levels in the Arctic region?
m. What is happening to glaciers in the Arctic region?
n. How are vegetation patterns changing in the Arctic region?
o. How are changes in permafrost affecting human activities?
p. What changes are taking place in travel across Arctic ice?

17
The NOAA Ship Okeanos Explorer Why Do We Explore? Key Topic Inquiry: Climate Change oceanexplorer.noaa.gov
Arctic Climate Change Inquiry Guide - Page 3
q. Warmer climates could cause significant releases of what substances from
the Arctic. What might be some of the consequences of these releases?
r. What positive and negative impacts might result from a reduction in
Arctic sea ice?
s. What changes in sea transportation might result from major reductions
in Arctic sea ice?

18
The NOAA Ship Okeanos Explorer Why Do We Explore? Key Topic Inquiry: Climate Change oceanexplorer.noaa.gov
Photocube Construction Guide - Page 1
These directions are adapted from “Create your own “magic” folding wooden
photo cubes” (http://www.chicaandjo.com/2008/05/08/magic-folding-
wooden-photo-cubes/), and are used with permission.
Materials• 8 - 1.5” wooden blocks
• 8 - 3” x 3” photos printed on thin photo-quality paper such as HP Bright
White Inkjet Paper
• 2 - 3” x 6” photos, printed on paper described above
• 2 - 8” x 11” sheets of double-sided tape (“red liner tape”)
• Black felt tip marker
• Scissors or paper trimmer
• Sandpaper, 150 grit or finer
1. Locate images of glaciers that you want to use for your photocube. There
is a great collection at http://nsidc.org/cgi-bin/glacier_photos/glacier_
photo_search.pl?collection=repeat. This link opens the Search page for
the National Snow and Ice Data Center’s collection of repeat glacier
photography. Click the “Search” button and a new page will open showing
thumbnails of the photographs.
Select images that can be shown side-by-side in a 3” x 3” space or a 3” x 6”
space. You will need a total of eight 3” x 3” image sets and two 3” x 6” image
sets. Arrange the images in your photo editor and print them onto thin
photo-quality paper.
If the printed images aren’t as bright as you’d like, try specifying “Photo/
Glossy paper” in your Print dialogue box instead of ordinary paper. This
causes your printer to apply more ink, making much bolder images.
2. Cut each image about 1/8” larger on each side than the specified
dimensions. You will cut out 8 photos measuring 3 1/8” x 3 1/8” and 2
photos measuring 3 1/8” x 6 1/8”.
3. Back each image with double-sided adhesive. Peel off one side of the
backing and lay the sheet down, sticky side up. Attach the images to the
sticky surface so that the back of each photo is completely covered. Trim
the adhesive sheets to match the images. Don’t peel off the other adhesive
backing layer yet!

19
The NOAA Ship Okeanos Explorer Why Do We Explore? Key Topic Inquiry: Climate Change oceanexplorer.noaa.gov
Photocube Construction Guide - Page 2
4. Arrange the images as indicated in the diagram. Use a paper trimmer or
scissors to cut each photo into squares or rectangles as
indicated. Keep the pieces for each image together so
they don’t get mixed up! Don’t throw out the scraps.
5. You will need a spacer to fill the space between
blocks that will eventually be taken up by photos. To
make a spacer, use the leftover scraps of photo paper
and double-sided tape sheets. Start with three pieces of
adhesive about 3” long and 1/2” wide. Peel the backing
off of both sides of each piece and stack them together.
Cover the top and bottom with scraps of your photo
paper. Trim the sides to get rid of overhanging edges.
6. Check the edges of all eight cubes. If they are rough, use the sandpaper to
smooth them. Using a black felt tip marker, color the edges of the blocks,
otherwise, they may show up in the finished product.
7. Begin assembling your photocube by lining up four wooden blocks in a
square. Remove the adhesive backing from the four pieces of image #1 and
stick them onto the cubes.
8. Line up the remaining four wooden blocks in a square. Slide your spacer
strip between the blocks, so that it sticks out as shown in the diagram. Then
stick your two rectangles onto the blocks as shown.
9. Turn over the set of four blocks with image #1 on them as shown below.
10. Place the four blocks with image #2 on them on top of the four you just
flipped as shown.
#1 #2
#3
#4
#5 #6
#7 #8
#9 #10
#2#2
SPACER
Step 8.
Step 4.
#1Step 9.
Step 10.
#1

20
The NOAA Ship Okeanos Explorer Why Do We Explore? Key Topic Inquiry: Climate Change oceanexplorer.noaa.gov
Photocube Construction Guide - Page 3
11. Put your hands on the left and right side of your cube,
grabbing 4 blocks with each. Lift the sides up so that the
top (image #2) folds in on itself, as seen at left, with the
pivot being the dotted line in the diagram. The result will
be all eight blocks laying in a rectangle.
12. Apply the pieces of image #3 to the tops of the eight blocks, taking care to
use the spacer whenever covering a span of two blocks, as indicated below.
13. Fold the top four blocks down and the bottom four blocks up, with the pivot
on the dotted line in the diagram. Your new image #3 that you just attached
will fold in on itself and become hidden inside. You’ll end up with eight
blocks showing in a rectangle.
14. Apply the pieces of image #4 to the tops of the eight blocks, taking care to
use the spacer whenever covering a span of two blocks, as indicated below.
(You will not need the spacer where image #3 has been placed.)
#2
Step 11.
Step 12.
Step 13.
Step 14.
#3
Use Spacer HereUse Spacer Here
#3
#3
#4
Use Spacer Here Use Spacer Here
Use Spacer Here Use Spacer Here

21
The NOAA Ship Okeanos Explorer Why Do We Explore? Key Topic Inquiry: Climate Change oceanexplorer.noaa.gov
Photocube Construction Guide - Page 4
15. Fold the two leftmost blocks and two rightmost blocks up towards the
center, pivoting on the dotted lines in the diagram. Your new image #4
that you just attached will become hidden inside. You’ll end up with a cube
shape.
16. Apply the pieces of image #5 to the tops of the four blocks. You do NOT
need the spacer from here on, because the blocks underneath will already
have photos attached to them.
17. Rotate the entire cube to the left, so that image #5 moves from the top side
to the left side. You will expose a new surface with no image on it.
18. Apply the pieces of image #6 to the tops of the four blocks.
19. Rotate the entire cube to the left, so that image #6 moves from the top side
to the left side (and #5 is now face-down on the table). You will expose a
new surface with no image on it.
Step 15.
Step 16.
Step 17.
Step 18.
Step 19.
#5
#5#5 #5
#6
#6#6 #6
22
The NOAA Ship Okeanos Explorer Why Do We Explore? Key Topic Inquiry: Climate Change oceanexplorer.noaa.gov
Photocube Construction Guide - Page 5
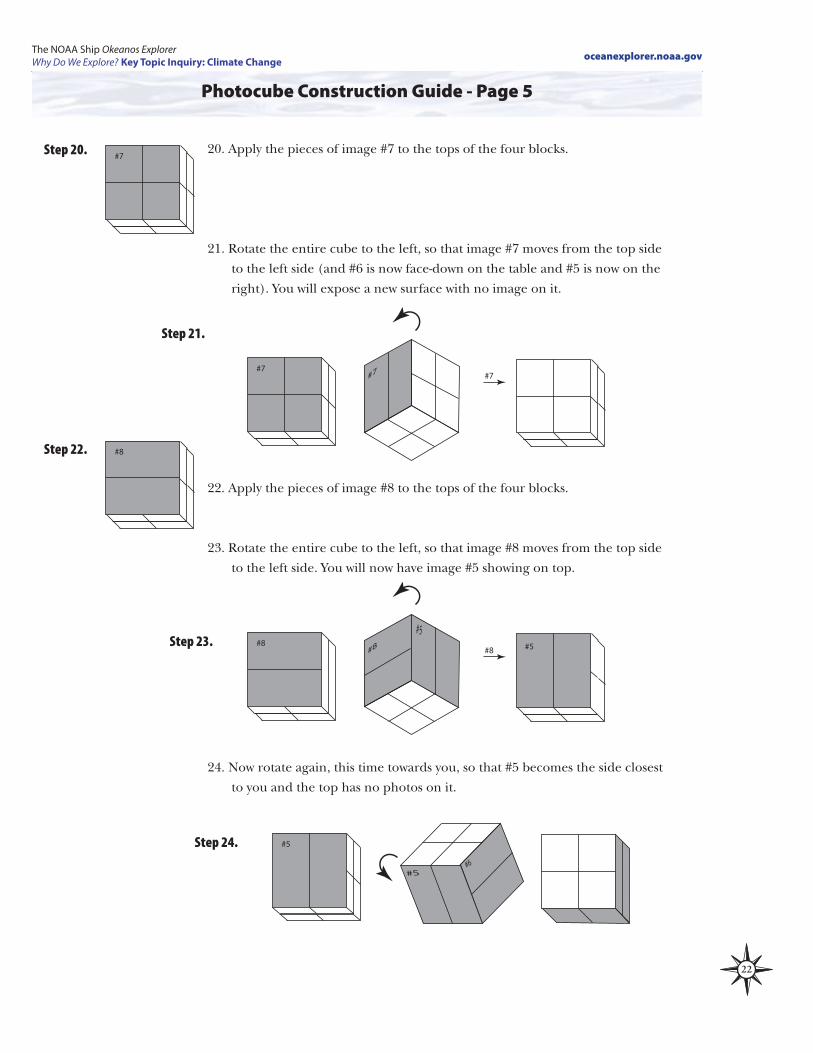
20. Apply the pieces of image #7 to the tops of the four blocks.
21. Rotate the entire cube to the left, so that image #7 moves from the top side
to the left side (and #6 is now face-down on the table and #5 is now on the
right). You will expose a new surface with no image on it.
22. Apply the pieces of image #8 to the tops of the four blocks.
23. Rotate the entire cube to the left, so that image #8 moves from the top side
to the left side. You will now have image #5 showing on top.
24. Now rotate again, this time towards you, so that #5 becomes the side closest
to you and the top has no photos on it.
#7#7 #7
#8
#8#8 #8
#5#5
#5
#5#6
Step 21.
Step 22.
Step 23.
Step 24.
Step 20. #7

23
The NOAA Ship Okeanos Explorer Why Do We Explore? Key Topic Inquiry: Climate Change oceanexplorer.noaa.gov
Photocube Construction Guide - Page 6
25. Apply the pieces of image #9 to the tops of the four blocks.
26. Rotate the entire cube towards you, so that image #9 moves from the top
side to the side closest to you. You will now have image #7 showing on top.
Now rotate again, towards you, so that #7 becomes the side closest to you
and the top has no photos on it.
27. Apply the pieces of image #10 to the tops of the four blocks.
You’re done! To view all the images, just fold and unfold the cube,
revealing a new side with every twist. You can display the cube with any of the images showing.
#9#6
#9 #7
#7
#7#6#7
#6
#10
Step 26.
Step 27.
Step 25. #9

24
The NOAA Ship Okeanos Explorer Why Do We Explore? Key Topic Inquiry: Climate Change oceanexplorer.noaa.gov
Appendix A
A Brief Review of Some Key Data Concerning Global Climate Change
Within the world scientific community, there is a broad consensus that:
• Earth’s climate is undergoing a significant warming trend that is beyond
the range of natural variability;
• The major cause of most of the observed warming is rising levels of
carbon dioxide;
• The rise in carbon dioxide levels is the result of burning fossil fuels;
• If carbon dioxide levels in the atmosphere continue to rise over the next
century the warming will continue; and
• The climate change that is expected to result from these conditions
represents potential danger to human welfare and the environment.
The scientific consensus on these points is supported by a huge amount of
data from many places on Earth. Following is a brief review of a few key points.
Climate Warming Trend Since the late 1800’s, average global surface temperatures have increased
by about 0.74°C. The word “average” is very important, because some parts
of Earth (including the southeastern United States and parts of the North
Atlantic) have cooled slightly during this period. The greatest warming has
been observed in Eurasia and North America between latitude 40° and 70° N.
You may have heard statements such as “Earth’s temperature has been
dropping for the last ten years. These statements are based on the fact that
1998 was abnormally hot due to the strongest El Nino event in the last century.
The years following 1998 were indeed cooler than 1998, but the long-term
trend still shows continued warming. There are many factors that affect global
temperatures in a single year, and it is not surprising that one year might be
cooler than the preceding year. But the global warming trend is a matter of
decades, not just one or two years. The long-term trend is still clear: Seven
of the eight warmest years on record have occurred since 2001, and the ten
warmest years on record have all occurred since 1995.
Cause of the Observed Warming Earth’s climate is affected by a number of factors, including changes in
Earth’s orbit, solar variability, volcanoes, and the greenhouse effect. But the
only factor that coincides with the warming trend of the last century is the
observed increase in greenhouse gases, particularly carbon dioxide. There is
no scientific debate about this: Since the start of the Industrial Revolution,
atmospheric carbon dioxide concentrations have increased from 280 parts per

25
The NOAA Ship Okeanos Explorer Why Do We Explore? Key Topic Inquiry: Climate Change oceanexplorer.noaa.gov
Appendix A - Page 2
million (ppm) to 380 ppm. Today, the global concentration of carbon dioxide
is significantly higher than the natural range over the last 650,000 years of 180
– 300 ppm.
Cause of Increasing Atmospheric Carbon DioxideThere is also no scientific debate about the source of increased atmospheric
carbon dioxide. Humans burning fossil fuels release billions of tons of carbon
into the atmosphere every year, and the quantity of fuels burned has been
increasing for over 150 years (see, for example, http://cdiac.ornl.gov/trends/
emis/tre_glob.html).
What about volcanoes? Scientists estimate that volcanoes (including
underwater volcanoes) emit 145-255 million tons carbon dioxide into the
atmosphere each year. Emissions of carbon dioxide from human activities is
estimated at about 30 billion tons per year. So, the amount of carbon dioxide
from human activities is more than 100 times greater than the amount of
carbon dioxide emitted by volcanoes (http://volcano.oregonstate.edu/
education/gases/man.html). Further, if volcanoes had a significant impact,
we should see “spikes” on graphs of atmospheric carbon dioxide every time a
volcano erupts; but such spikes are not present on these graphs.
What about increases in atmospheric carbon dioxide that happened during
pre-human times? It is true that carbon dioxide rose and fell by over 100 ppm
at various times in Earth’s history, but these rises took place over 5,000 to
20,000 years; the present increase of 100ppm has happened in only 150 years.
Additional evidence implicating human activities comes from isotope analyses
of the carbon and oxygen atoms that make up atmospheric carbon dioxide
molecules. These analyses show that the oxygen atoms in some of these
molecules are much younger than the carbon atoms in the same molecule.
Older carbon could only come from fossil fuel deposits, and the only way
these deposits could become airborne is through combustion.
Effect of Continued Increase in Atmospheric Carbon Dioxide If atmospheric carbon dioxide concentrations continue to increase, global
temperatures are also expected to increase by 2° to 5°C. So, the minimum
expected temperature increase under these conditions is nearly three times
the increase that has already been observed. The actual increase could be
much greater, depending upon the influence of feedbacks. For example,
decreasing ice and snow in polar regions means that less solar radiation will be
reflected away from Earth’s surface. This would result in more radiation being
absorbed at the surface, and increased warming.

26
The NOAA Ship Okeanos Explorer Why Do We Explore? Key Topic Inquiry: Climate Change oceanexplorer.noaa.gov
Appendix A - Page 3
Warmer temperatures in the Arctic could also trigger another feedback
process. Methane hydrates are a type of ice that contains methane molecules
surrounded by a cage of frozen water molecules. Most methane hydrates are
believed to exist in ocean sediments, but some are also found in high latitude
soils called permafrost. If these soils become warm enough, methane hydrates
could melt and release methane gas to the atmosphere. Since methane is a
powerful greenhouse gas, and decomposes to form carbon dioxide, increased
atmospheric methane could results in an increased greenhouse effect and
additional warming of Earth’s climate.
A warmer atmosphere could also mean warmer temperatures in Earth’s ocean.
Since the solubility of carbon dioxide decreases as temperature rises, warmer
temperatures could decrease carbon dioxide absorption by the ocean creating
yet another feedback mechanism. Temperature has an opposite effect on the
atmosphere’s capacity for water vapor: Increased temperature can result in
increased atmospheric water vapor. Since water vapor is also a greenhouse gas,
additional warming might result from a strengthened greenhouse effect. The
latter feedback, however, might be moderated if increased atmospheric water
vapor caused an increase in cloud cover that could reduce the amount of solar
radiation reaching Earth’s surface.
Increasing atmospheric carbon dioxide is also having a serious effect on ocean
pH. Each year, the ocean absorbs approximately 25% of the CO2 added to the
atmosphere by human activities. When CO2 dissolves in seawater, carbonic acid
is formed, which raises acidity. Ocean acidity has increased by 30% since the
beginning of the Industrial Revolution, causing seawater to become corrosive
to the shells and skeletons of many marine organisms as well as affecting the
reproduction and physiology of others. See Off Base (http://oceanexplorer.
noaa.gov/explorations/09lophelia/background/edu/media/09offbase.pdf)
for additional discussion and references.
Impacts of Expected Climate Change if Trends ContinueThe Intergovernmental Panel on Climate Change (the leading provider of
scientific advice to global policy makers) has produced a report on some of
the impacts that are occurring as a results of climate change as well as impacts
that are anticipated if present trends continue (http://www.ipcc.ch/publica-
tions_and_data/publications_ipcc_fourth_assessment_report_wg2_report_im-
pacts_adaptation_and_vulnerability.htm). These impacts include:
• Decreased water resources in semi-arid areas such as the Mediterranean
Basin, western USA, southern Africa and north-eastern Brazil;
• Decreased availability of fresh water due to sea-level rise;
• Ecosystems such as tundra, boreal forest, mountains, mangroves, salt

27
The NOAA Ship Okeanos Explorer Why Do We Explore? Key Topic Inquiry: Climate Change oceanexplorer.noaa.gov
Appendix A - Page 4
marshes, coral reefs, and sea-ice are highly vulnerable, and are virtually
certain to experience species extinctions and major changes;
• A global intensification and expansion of wildfires is likely, as tempera-
tures increase and dry spells become more frequent and more persistent;
• Increased risk of coastal flooding in low-lying areas due to sea-level rise
and more intense coastal storms;
• Surface ocean pH is very likely to decrease by as much as 0.5 pH units
by 2100, and is very likely to impair shell or exoskeleton formation in
marine organisms such as corals, crabs, squids, marine snails, clams and
oysters.
Resourceshttp://www.ncdc.noaa.gov/oa/climate/globalwarming.html – “Global
Warming Frequently Asked Questions,” from NOAA’s National Climatic
Data Center
http://www.ipcc.ch/ – Home page for the Intergovernmental Panel on
Climate Change
http://www.unep.org/climatechange/ – United Nations Environment
Programme Climate Change Web page
http://www.epa.gov/climatechange/ – U. S. Environmental Protection
Agency Climate Change Web page