the organizational design of high-tech startups and...
TRANSCRIPT

IAB Discussion PaperArticles on labour market issues
1/2018
Christoph GrimpeMartin MurmannWolfgang Sofka
ISSN 2195-2663
The Organizational Design of High-Tech Startups and Product Innovation
IAB-Discussion Paper 1/2018 1
The Organizational Design of High-Tech Startups and Product Innovation
Christoph Grimpe (Copenhagen Business School and ZEW Mannheim) Martin Murmann (ZEW Mannheim, IAB Nuremberg, and University of Zurich) Wolfgang Sofka (Copenhagen Business School and University of Liverpool Management School)
Mit der Reihe „IAB-Discussion Paper“ will das Forschungsinstitut der Bundesagentur für Arbeit den Dialog mit der externen Wissenschaft intensivieren. Durch die rasche Verbreitung von Forschungsergebnissen über das Internet soll noch vor Drucklegung Kritik angeregt und Qualität gesichert werden.
The “IAB-Discussion Paper” is published by the research institute of the German Federal Em-ployment Agency in order to intensify the dialogue with the scientific community. The prompt publication of the latest research results via the internet intends to stimulate criticism and to ensure research quality at an early stage before printing.
IAB-Discussion Paper 1/2018 2
Content
Abstract .................................................................................................................... 3
Zusammenfassung ................................................................................................... 3
1 Introduction .......................................................................................................... 4
2 Therory and Hypotheses ...................................................................................... 6
2.1 Innovation opportunities and decision making ................................................... 6 2.2 Hypotheses ....................................................................................................... 7
3 Data and Methods ............................................................................................. 11
3.1 Data................................................................................................................. 11 3.2 Variables ......................................................................................................... 13 3.3 Estimation approach and identification ............................................................ 15
4 Results .............................................................................................................. 16
4.1 Robustness checks ......................................................................................... 18
5 Discussion ......................................................................................................... 19
6 Concluding remarks ........................................................................................... 22
References ............................................................................................................. 22
Tables .................................................................................................................... 27
Appendices ............................................................................................................ 30
Appendix A: Tables and figures .............................................................................. 30
Appendix B: Entropy balancing ............................................................................... 34
IAB-Discussion Paper 1/2018 3
Abstract
We investigate whether appointing a middle management level affects startups’ inno-vation performance. Additional hierarchical levels are often suspected to restrict inno-vative activities. However, founders’ capacities for information processing and re-source allocation are usually strongly limited while, at the same time, R&D decisions are among the most consequential choices of startups. We argue that middle man-agement is positively related to introducing product innovations because it improves the success rates from recombining existing knowledge as well as managing R&D personnel. In addition, we suggest that the effectiveness of these mechanisms de-pends on the riskiness of a startup’s business opportunity. Based on a sample of German high-tech startups, we find support for our conjectures.
Zusammenfassung
In der vorliegenden Studie untersuchen wir, ob die Einführung einer mittleren Füh-rungsebene die Innovationsleistung von Startups beeinflusst. Hierarchische Struktu-ren stehen oft im Verdacht, innovative Aktivitäten in Unternehmen zu hemmen. Die Kapazitäten, die Unternehmensgründer für Informationsverarbeitung und Ressour-cenallokation aufbringen können, sind in der Regel jedoch stark begrenzt, während gleichzeitig Entscheidungen im Bereich von Forschung und Entwicklung (FuE) zu den folgenreichsten in Startups gehören. Wir argumentieren daher, dass die Einführung einer mittleren Führungsebene in Startups positiv mit der Einführung von Produktin-novationen zusammenhängt, da dadurch die Wahrscheinlichkeit, vorhandenes Wis-sen erfolgreich zu rekombinieren, erhöht und das Management von FuE-Personal verbessert wird. Darüber hinaus argumentieren wir, dass die Wirksamkeit dieser Me-chanismen vom Risikograd der Geschäftsidee eines Startups abhängt. Diese Hypo-thesen werden durch Auswertungen umfangreicher Daten zu einer Stichprobe deut-scher High-Tech-Startups gestützt.
JEL-Klassifikation: L26, M13, M12, M51, L22, L23, J21
Keywords: Middle management, innovation performance, R&D, startups, organiza-tional design, R&D management.
IAB-Discussion Paper 1/2018 4
1 Introduction Launching innovative products onto the market is a central element in the strategies of most startups in high-technology sectors (Wiklund and Shepherd, 2003). Having discovered an entrepreneurial opportunity, many startups find themselves in a race to realize that opportunity and to introduce new products ahead of competitors or before their funding runs out (Venkataraman, 1997; Shane, 2000). Opportunities are realized when startups decide to act upon them by deploying resources and investments in the pursuit of perceived opportunities (Shane and Venkataraman, 2000; Eckardt and Shane, 2003; Shane, 2003). An important part of this process are decisions on re-search and development (R&D) activities that are challenging since technologies and market conditions are by definition novel and uncertain (Amit, Glosten, and Muller, 1990) while funding sources are limited (Hall, 2005). While we learn from existing literature how demanding and error prone R&D decisions are for the management of established firms (Koput, 1997; Katila, 2002), we know comparatively little about the management of R&D in startups. Faced with many competing demands for attention, the burden on startup management, often times the founder or founding team, to eval-uate many technological alternatives and to arrive at the most promising ones is high (Dencker and Gruber, 2015).
In this study, we investigate whether startups can improve the likelihood for successful innovation by altering their organizational design through the introduction of a middle management. We expect a startup’s middle management to allow for better managing competing demands for attention and processing information related to R&D and technology development in order to successfully realize innovation. We draw theoret-ical mechanisms from the literature on how middle managers increase a startup’s information processing capacity as well as free up attention of founders (Colombo and Grilli, 2013) and integrate them into models of R&D decision making. We reason that startups with middle management will increase their innovation performance in gen-eral, but also indirectly by re-using existing knowledge bases of the startup and man-aging R&D personnel more effectively. Further, we hypothesize that the latter will be more beneficial for startups with risky business opportunities while the former effects occur when opportunities are comparatively less risky. We test our theoretical reason-ing using a unique sample of almost 3,700 firm-year observations of 1,708 high-tech startups founded in Germany between 2005 and 2012. The information on these firms stems from linked employer-employee data that merges firm data from a panel survey with official register data on the employees who work in these firms. The results broadly confirm our theoretical expectations.
Our theoretical model addresses a gap in existing literatures that are on the one hand rather critical of the effects of added hierarchical levels on innovation performance for the average firm (Burns and Stalker, 1961) but on the other hand recognize the es-tablishment of middle management as a crucial milestone in the maturing of startups (Colombo and Grilli, 2013). Intuitively, we would associate middle management with
IAB-Discussion Paper 1/2018 5
a higher level of formalization and bureaucracy, a more “mechanistic” and less “or-ganic” organizational structure that facilitates control and productivity but often stifles creativity and innovation (e.g., Burns and Stalker, 1961; Thompson, 1965; Dess, Lumpkin, and McKee, 1999; Shane and Venkataraman, 2000; Ireland, Covin, and Kuratko, 2009; Foss, Lyngsie, and Zahra, 2015). More recently, however, scholars have begun to argue for the benefits of formal structure to realize opportunities. Ire-land and Webb (2009) suggest that centralization allows unambiguous resource allo-cation decisions and facilitates monitoring and control. Foss et al. (2015) find that both decentralization and formalization help opportunity discovery and realization. Yet most research in this area assumes an established firm while scant attention has been paid to organizational structure in startups. Moreover, while Sine, Mitsuhashi and Kirsch (2006) show that startups with higher founding team formalization, specializa-tion, and administrative intensity perform better than those with more organic struc-tures, we know little about the relationship between organizational structure and in-novation, a central outcome of opportunity realization.
In that sense, we advance existing literature in two important ways. First, entrepre-neurship literature has largely acknowledged that startups adjust their organizational design while they mature (Baron, Burton, and Hannan, 1999; Colombo and Grilli, 2013) through a process of professionalization (Hellmann and Puri, 2002). However, we know comparatively little about how these changes in organizational design affect their innovation performance, arguably a core strategic goal of most high-tech startups. Our theoretical model introduces information processing and monitoring mechanisms from existing middle management literature into models of R&D decision making, thereby providing a basis for future theorizing. What is more, existing litera-ture that investigates innovation outcomes of high-tech startups but ignores its organ-izational design, particularly the presence of an additional hierarchical level, is likely to suffer from biased results.
Second, an active stream in the strategic entrepreneurship literature focusses on how the internal organization of startups interacts with industry characteristics such as the business opportunities in an industry. These theoretical models largely equate the management capacity of a startup with its founder. Prior knowledge and experience of founders are assumed to be the primary source of success for startups and these effects are contingent on the startups’ business opportunity (e.g., Dencker and Gruber, 2015). We extend this contingency perspective to the organizational design choices of a startup by arguing that (a) a startup’s capacity for R&D decision making is not limited to its founder but can be extended through middle management and (b) the positive effects of these organizational design choices are contingent on the startup’s business opportunity. Our theoretical model can be a pathway for future the-orizing on how the effectiveness of other organizational design choices of startups (apart from middle management) is contingent on their business opportunities.
These academic insights have immediate implications for decision making in startups. Our results provide evidence for how the establishment of a middle management level
IAB-Discussion Paper 1/2018 6
increases the odds for innovation success in high-tech startups. This evidence can alleviate concerns among startup founders and/or owners about whether the intro-duction of a middle management makes startups more bureaucratic and less innova-tive. Our results show the opposite. These insights are also valuable to investors, consultants or government agencies advising high-tech startups. We show that the innovativeness of a high-tech startup is not merely a function of its technological de-cisions but also whether it puts an organization design in place that increases the management capacities for making these decisions.
2 Therory and Hypotheses 2.1 Innovation opportunities and decision making New technologies have long been characterized as a basis for the creation of new products, new processes, new markets, or new ways of organizing (Schumpeter, 1934), and entrepreneurs must discover and identify opportunities in which such new technologies could be used (e.g., Venkataraman, 1997; Shane, 2000; Dencker and Gruber, 2015). Opportunities are realized when entrepreneurs decide to act upon them through a process of resource acquisition and organization (Shane, 2003). As a consequence, opportunity realization in entrepreneurial ventures depends often times on the founder or founding team and the decision to engage in identified opportunities. Following previous studies, we will refer to the founder(s) as the startup’s highest management level making these strategic decisions (e.g. Dencker and Gruber, 2015), given that very few startups hire professional top managers early in their life cycle. Our terminology assumes that the hierarchical level below the founders (i.e. top man-agement) is the middle management.
Our theoretical reasoning is concerned with the realization of innovation opportunities.
In other words, we predict the likelihood with which startups manage to introduce
product innovations built from new technologies or the recombination of existing ones.
The introduction of new products allows firms to alter current patterns of competition
and cooperation, facilitate market entry, and gain market share based on a superior
offering compared to incumbent firms (Venkataraman, 1997; Wiklund and Shepherd,
2003). However, the realization of such opportunities puts considerable demands on
decision makers because investments in R&D have to be made, forcing deciders in
startups to dedicate attention to the recombination of existing resources and the ac-
quisition of new ones.
While successful product innovations create important benefits for startups, making the necessary investment decisions is challenging for two primary reasons. First, the outcomes of investments in R&D are uncertain (Amit et al., 1990). On the technolog-ical side, experimentation with novel or untested materials and procedures is by na-ture error prone and likely to fail. Even technologically feasible solutions often fail commercially due to a lack of customer acceptance (Gourville, 2006). Second, large
IAB-Discussion Paper 1/2018 7
parts of R&D expenditures consist of salaries for scientists and engineers or invest-ments in specialized, non-fungible laboratories (Hall, 2005). Accordingly, firms are constrained in the available financing for R&D to equity capital or cash flows since external lenders find it difficult to finance uncertain investments with little collateral. Decision making in innovation activities is therefore particularly crucial for new ven-tures lacking the internal funds for sustaining innovation failures.
Decision making in innovation activities can be conceptualized as a search process in which firms make heterogeneous decisions about which technologies to select or combine (Katila and Ahuja, 2002). Some of these choices lead to higher innovation performance than others. The quality of these technology choices depends on the amount of attention that a firm can devote to screening potential alternatives (Koput, 1997). A lack of attention results in erroneous technology choices, missing out on important trends or spreading existing screening capacities too thinly. Management attention has often been described as one of the most important resources of the firm (Ocasio, 1997), but startups, in particular, are challenged to commit sufficient atten-tion to realizing innovation opportunities.
2.2 Hypotheses Startup decision making is typically dominated by the founders whose decisions have vital influence on the firm (Wasserman, 2012). As a consequence, prior literature has extensively studied the role of founder knowledge and experience in facilitating the recognition of entrepreneurial opportunities and startup performance (e.g., Shane, 2000, 2003; Dencker and Gruber, 2015). Since founder decision making is not only concerned with the startup’s innovation domain but encompasses all kinds of related and unrelated activities that are crucial for the survival of the firm, it is likely that ca-pacity constraints impede the recognition and exploitation of innovation opportunities. We reason that startups can alleviate capacity constraints of the founders and facili-tate innovation through organizational design choices. Organizational structure, in that sense, allocates the authority to make decisions, to deploy resources, and to select the opportunities to pursue (e.g., Galbraith, 1977). Specifically, we argue that startups with a middle management possess higher information processing capacities compared to startups without such a hierarchical level, leading to better opportunity recognition and realization.
The term middle management originates from the perspective that firms consist of at least two levels, i.e. a top management and line workers (Rajan and Wulf, 2003). The typical startup starts with these two levels, and the introduction of a hierarchical level in between, i.e. the middle management, constitutes a major organizational design change (Colombo and Grilli, 2013). Middle managers are managerial or administrative specialists with delegated decision rights (Baron et al., 1999). They can reduce the ambiguity about the organization of work in a firm and thereby improve coordination and efficiency (Sine et al., 2006).
IAB-Discussion Paper 1/2018 8
Since all individuals are naturally limited in their capacity to acquire, store, process and transmit information (Simon, 1948), the establishment of a middle-management level can improve the information processing capacity of startups (Colombo and Grilli, 2013). The middle management of an organization allows it to handle a given amount of information more efficiently by enabling parallel information processing in which middle managers share information processing tasks with top management (Radner, 1993).
Besides, the establishment of a middle management level allows firms to use existing information processing capacities more efficiently. Garicano (2000) conceptualizes the hierarchical decision making in firms based on the knowledge that is available to each employee for solving problems. Organizational hierarchies emerge because some employees are better equipped than others to deal with particularly hard prob-lems. Line workers can deal with regular problems based on their own knowledge and turn to middle managers for increasingly exceptional or difficult problems. Middle man-agers turn to top management only if their knowledge is insufficient to deal with a particular problem. Hence, a middle management level frees up top management to focus on the most challenging problems of the organization.
Moreover, middle management allows an organization to predict more accurately when problems or projects have reached a scope that benefit from organization-wide solutions (Harris and Raviv, 2002). The latter are most effectively addressed by top management since they have the broadest set of knowledge about the organization while lower level projects or problems do not require top management attention. In sum, middle management increases the information processing capacity of startups by enabling parallel processing and allowing decision making of its founders to focus on strategic and higher-value decisions while other decisions can be delegated to middle managers.
We conjecture that the improvement in startup’s information processing capacity from introducing middle managers can be extended to improving decision making in R&D. R&D decisions are particularly complex and uncertain, requiring management atten-tion and thorough decision making. Middle managers allow founders to specialize in solving more strategic problems and to use their skills and competences more pro-ductively. Since innovation is a domain of strategic importance for successfully enter-ing markets and gaining market share, middle management is therefore likely to im-prove a startup’s ability to innovate and position its offering vis-à-vis the incumbents in the market. As a result, our first hypothesis reads:
Hypothesis 1: Startups with middle management are more likely to intro-
duce product innovations.
Existing literature has frequently highlighted that startups are differentially endowed with resources upon market entry, including prior technological knowledge, invested capital, or managerial, entrepreneurial and industry experience of the founder (e.g.,
IAB-Discussion Paper 1/2018 9
Shane, 2000; Dencker and Gruber, 2015). We focus on a startup’s prior technological knowledge base because the recombination of existing knowledge is a central deter-minant of a firm’s ability to innovate (Rosenkopf and Nerkar, 2001; Katila and Ahuja, 2002). We suggest that startups with a middle management will be more effective in recombining existing knowledge.
Literature describing innovation performance based on the re-use of a firm’s existing technologies (i.e. deep search) summarizes its advantages across the dimensions of reliability, predictability and efficiency (Katila and Ahuja, 2002). We reason that new ventures with middle management will experience advantages across all three dimen-sions. First, the added information-processing capacity decreases the likelihood of errors and false starts when using the same knowledge elements repeatedly so that search becomes more reliable (Levinthal and March, 1993). Second, middle manage-ment can be assumed to render the startup’s search more predictable because it en-ables a better understanding of the requirements that need to be met for successful innovation. Higher information processing capacity facilitates an understanding of how product development tasks can be decomposed into manageable sub-problems, how recombination activities should be sequenced, and what elements are unneces-sary and can thus be disregarded. Third, middle management allows for a deeper understanding of the existing knowledge base which increases a startup’s ability to identify valuable knowledge elements that may not have been obvious to the founder. In sum, our second hypothesis reads:
Hypothesis 2: Startups with middle management are more likely to intro-
duce product innovations, and this likelihood increases with the size of the
startup’s existing knowledge base.
Apart from the positive influence of middle management on a startup’s ability to re-combine existing knowledge, we argue that middle management can further influence current knowledge production by reducing the span of control for a startup’s employ-ees. Tighter spans of control imply that the plans of an organization can be imple-mented more quickly if workers receive instructions from their managers more effec-tively (Keren and Levhari, 1979). These theoretical models rest on the assumption that the goals and incentives of the owners and the employees of a firm differ, requir-ing monitoring or incentive alignments to overcome principal-agent problems from employees following their self-interests (Calvo and Wellisz, 1978; Qian, 1994).
Jensen and Meckling (1995) suggest that the agency problems are especially pro-nounced when employees possess specific knowledge that is difficult to transfer. The R&D activities of startups create such conditions. Given that R&D evolves around experimentation with novel and untested procedures and materials, it is difficult to codify and monitor. Many R&D outcomes occur as tacit knowledge in the understand-ing of R&D personnel and would be costly to codify comprehensively (Agrawal, Cock-burn, and McHale, 2006). Besides, the knowledge from failed experiments is rarely codified but may be as valuable for eventually identifying promising R&D trajectories.
IAB-Discussion Paper 1/2018 10
The motivations of scientists and engineers for their work have also been found to differ from the goals of their firms (Gambardella, Ganco, and Honoré, 2015): R&D decisions of individuals can be driven by curiosity, an interest in learning about or confidence in particular technologies. This can lead to biased decision making of R&D personnel. One of the best documented biases of R&D personnel is the systematic negative bias about the quality or usability of knowledge from external sources (“not invented here syndrome”) (Katz and Allen, 1982; Antons and Piller, 2015). In the ab-sence of a middle management, it falls on the startup’s founders to monitor the tech-nological choices of its R&D personnel and ascertain that these choices are aligned with the overall goals of the startup. We reason that middle managers can share this management task either by supervising R&D personnel directly or freeing up founder capacities from monitoring other startup activities.
We acknowledge that hierarchical layers can constrain the information flow between knowledge production and top management of organizations since the transfer of in-formation rests on aggregation with potential losses of important details (Keren and Levhari, 1989; Stein, 2002). However, we suggest that on balance middle manage-ment will be particularly helpful for effectively managing R&D personnel because it can provide direction, set priorities and correct mistakes. Based on the added moni-toring capacity, market opportunities can be more reliably identified and evaluated so that R&D personnel can be focused on them. Monitoring by middle management al-lows for the targeted provision of resources in order to increase the likelihood of inno-vations. As a consequence, our third hypothesis reads as follows:
Hypothesis 3: Startups with middle management are more likely to intro-
duce product innovations, and this likelihood increases with the size of the
startup’s R&D personnel.
Finally, Dencker and Gruber (2015) shed light on the business opportunity itself that a startup seeks to exploit and suggest that its riskiness will not only directly influence firm performance but also condition the role of the founder’s industry and managerial experience. Miller (1992, 1993) relates the risk of a business to the dynamics of its environment, e.g. changes in input prices, competitor behavior, etc. On the one hand, such risks increase the odds of a startup’s failure (Miller, 1992). On the other hand, riskier businesses enable startups to find dissatisfied customers or niche markets that are not served by incumbent firms (Wiklund and Shepherd, 2003). Dencker and Gruber (2015), based on the intuitive assumption of a positive risk-return relationship, find that riskier opportunities are associated with greater startup performance above and beyond the characteristics of the founder. Accordingly, we reason that the bene-fits that middle managers bring to the management of prior knowledge and R&D in startups are conditioned by the riskiness of a startup’s business opportunity.
Risky business opportunities affect the R&D decision making of startups in two ways. First, they aggravate the consequences of failing innovations, e.g. due to a lack of
IAB-Discussion Paper 1/2018 11
reliability or desired functionality, for the startup. Startups with risky business oppor-tunities may not have the financial resources and goodwill from customers, investors or suppliers to sustain a failed innovation. Accordingly, screening technologies and predicting success rates requires comparatively more attention from founders. Sec-ond, risky business opportunities imply that the technological and market demands for successful innovation are comparatively less predictable. Hence, they benefit from increasingly intense testing and adapting. The latter requires more intensive manage-ment of current R&D activities. In sum, risky business opportunities tax the attention of founders especially with decision making in current R&D activities. As a conse-quence, startups with risky business opportunities are also particularly likely to expe-rience positive effects from middle management in directing current R&D activities and personnel. We propose:
Hypothesis 4a: Startups with middle management are more likely to intro-
duce product innovations, and the effect of middle management on the
startup’s R&D personnel is stronger for risky business opportunities.
Conversely, startups with comparatively less risky business opportunities benefit from more predictable environments. Technological and market conditions can be ana-lyzed more reliably, creating opportunities for exploiting existing technologies. Within such settings, the benefit from involving middle management emerges from increased information processing capacities for identifying unrealized market potentials of exist-ing technologies. We predict:
Hypothesis 4b: Startups with middle management are more likely to intro-
duce product innovations, and the effect of middle management on the prior
knowledge base is stronger for comparatively less risky business opportu-
nities.
3 Data and Methods 3.1 Data We construct a dedicated dataset combining multiple data sources to test our hypoth-eses. It rests on a linked employer-employee panel dataset that matches firm-level data from the KfW/ZEW Startup Panel with the official employment statistics provided by the German Federal Employment Agency. The KfW/ZEW Startup Panel is a survey of German startups of the cohorts 2005-2012. It was established in 2008 as a joint project of the Centre for European Economic Research (ZEW), the KfW Banken-gruppe (Germany’s and the world’s largest state-owned promotional bank), and Creditreform (Germany’s largest credit rating agency). The KfW/ZEW Startup Panel is a stratified random sample of legally independent new ventures drawn from the Mannheim Enterprise Panel (Mannheimer Unternehmenspanel - MUP). The MUP contains basic information such as addresses, year of startup, sector of activity, and legal form, for almost all German firms (see Bersch et al., 2014, for a detailed descrip-tion). The sample of the KfW/ZEW Startup Panel is drawn from almost all sectors of
IAB-Discussion Paper 1/2018 12
the MUP population (the primary sector, the energy sector, and the public sector are not included) and stratified according to three criteria: (i) the year of a firm’s formation, (ii) the industry, and (iii) whether or not a firm has received financial support from KfW. Stratification is controlled for by including dummy variables for the stratification cells in all regressions.
When drawn into the sample firms are allowed to be not older than three years. Sub-sidiary businesses and ventures that resulted from merger activities are excluded. Startups that participate once in the survey are subsequently followed for up to seven successive years (i.e. until they are eight years old. See Fryges, Gottschalk, and Kohn, 2010, for a detailed description). Data are collected using computer-assisted telephone interviews. In the present study, the survey data provide information about the founders’ characteristics (i.e. educational background and managerial and entre-preneurial leadership experience) and venture characteristics (including innovation and R&D activities).
We match the firm-level information with employee-level information from the official employment statistics provided by the Federal Employment Agency. The employment statistics contain person-specific register data on all employees subject to social se-curity contributions in Germany.1 This dataset is a rich source of employee records and allows us, most importantly, to identify middle managers and R&D personnel based on occupation codes (see variable description below). Moreover, the employ-ment statistics also provide details regarding further employee characteristics for the purpose of the present study.
As there is no common identifier in the two data sets, we matched startups from the KfW/ZEW Startup Panel using a text search algorithm via startup names and ad-dresses. The text search algorithm is described in detail in the Appendix B of Czarnitzki et al. (2015) and has proven to deliver very reliable results in various set-tings.
We were able to match about 90 percent of the startups from the KfW/ZEW-Startup Panel that self- reported to have employees who are subject to social security contri-butions (during a telephone interview) with one or more establishments from the offi-cial employment statistics. Firms that self-reported to have employees subject to so-cial security contributions, but which were not found in the official employment statis-tics, were removed from the sample. In addition, we adjusted for the possibility of
1 In addition to regular full-time and part-time employees, this includes apprentices, interns,
and marginally employed personnel. All notifications on employment and unemployment spells of an individual can be linked with the aid of a unique person-specific identifier thereby obtaining the complete employment history of each employee. A further identifier makes it possible to match the employees to establishments. The data are reported by the employing establishment and are collected by the social security agencies. Reporting data about the employees is mandatory for the employing establishments in order to cal-culate the contributions to the social security system.
IAB-Discussion Paper 1/2018 13
incorrect matches or erroneous data in either dataset by excluding matches in the 1st and 100th percentiles of the difference between employment sizes reported during telephone interviews and to the social security agencies. To assess the quality of the matches in the resulting firm-year panel dataset, we calculated the correlation coeffi-cient between the numbers of employees reported in the KfW/ZEW-Startup Panel and the numbers of employees reported in the official employment statistics. The correla-tion is slightly above 0.95 which makes us confident that the matching procedure led to reliable results.
We obtain information from 3,407 startups that operate in knowledge-intensive indus-tries and have at least one employee.2 Because we apply a one year time lag between independent and dependent variables (see details below), we are able to draw on 3,699 observations from 1,708 startups in the panel dataset that we use for estima-tions.
3.2 Variables Dependent variable Our hypotheses predict the likelihood with which startups introduce product innova-tions. Accordingly, we create a dummy variable for the introduction of a product inno-vation in a given year. Product innovations can have various degrees of novelty. We require that a startup’s new product is new to the market, not just new to the startup itself.
Explanatory variables Our main variables of interest on the right-hand side of our estimation equation are whether or not a firm employs at least one employee who is appointed with delegated decision making authority (“middle manager”), the size of the existing knowledge stock of a firm, the number of R&D employees, and the riskiness of the business opportunity a firm exploits.
We construct our binary indicator for the presence of a middle manager from occupa-tion codes available in the employment statistics of the German Federal Employment Agency. In the individual level data, occupations are coded using the five-digit occu-pation code KldB2010 (the German adaption of ISCO-08, devised by the Federal Em-ployment Agency) which allows identifying employees with supervisory or executive competences.3 We classify such employees as “middle managers”. Analogously, we
2 “Knowledge-intensive industries” include “cutting-edge” and high-technology manufactur-
ing, technology-intensive services, software supply and consultancy, and skill-intensive services in line with Fryges et al. (2010).
3 Employees with supervisory or executive competences are identified by a “9” as fourth digit of the five-digit KldB2010 occupation code.
IAB-Discussion Paper 1/2018 14
construct the number of R&D employees by summing up those employees that have occupation codes relating to R&D occupations.4
We approximate a firm’s existing knowledge stock by the number of patents the founder(s) of a firm held prior to the registration of the firm. We retrieve this information from the survey data of the KfW/ZEW Startup Panel.
Following Dencker and Gruber (2015), we measure the riskiness of the business op-portunity of a firm using the average credit rating score of all other German firms of the same age in the same three-digit NACE industry. Credit rating scores reach from 100 (best) to 600 (worst, indicating default) and are retrieved from the credit rating agency Creditreform. The measure reflects the average likelihood of failure of com-parable firms. Since information about startups is typically scarce, the probability of failure of comparable firms oftentimes determines the financing conditions and the financial pressure a new venture faces and hence measures the inherent riskiness of its business opportunity. Dencker and Gruber (2015) argue that this measure reflects the risk-return potential inherent in opportunities. Risk ratings, in that sense, proxy for the likelihood of insolvency in a given industry, and higher risk ratings should therefore also provide the basis for building high-performing startups (Stinchcombe, 1965; Dencker and Gruber, 2015).
We control for a number of factors that have frequently been shown to be associated with the likelihood to innovate (Ahuja, Lampert, and Tandon, 2008). Details on the construction of all variables are provided in Table 4 in Appendix A. We control for the resource availability of the startup by controlling for the number of founders and em-ployees as well as for R&D in particular by including R&D expenditures (scaled by startup sales). Besides, we control for the quality of the startup’s human capital by including a dummy variable if at least one of the founders had tertiary education as well as the share of employees with tertiary education. Besides, founder experience has been found to impact startup performance (Colombo, Delmastro, and Grilli, 2004; Colombo and Grilli, 2005). We capture these effects with two dummy variables indi-cating whether the founder had managerial or entrepreneurial experience as well as the number of years of industry experience of the founder.
Taking into consideration structural differences among startups, we control for the startup’s age and whether it is incorporated (limited liability). We further add three industry dummies for technology intensive services, software supply and consultancy as well as skill-intensive services. High-tech manufacturing startups will serve as our reference group.
4 We apply the definition of R&D occupations of the German Federal Statistical Offices
(https://www.klassifikationsserver.de/klassService/jsp/variant/variantList.jsf)
IAB-Discussion Paper 1/2018 15
3.3 Estimation approach and identification Since our dependent variable is binary, we choose probit estimates with standard errors robust to clustering at the startup level as our main estimation method. In our analyses, we estimate a series of interaction effects. The interpretation of interaction effects in nonlinear models, such as probit or logit models, is not straightforward (Ai and Norton, 2003; Greene, 2010). Therefore, we first re-calculated all interaction ef-fects following Ai and Norton (2003). In addition, we double-checked all results with linear probability models as a robustness check. We did not find qualitative differences to the reported marginal effects in both checks.
Endogeneity is a potential issue in our empirical setting. A first source of endogeneity might stem from simultaneity/omitted variable bias. It seems plausible to assume that startups of higher quality might simultaneously have a higher probability of doing both, hiring a middle manager and introducing an innovation. If we cannot control for startup quality adequately, we might spuriously attribute changes in innovation propensity to the introduction of a middle management. We address this problem by a two-step strategy: We first pre-balance our sample with respect to firm-year observations with middle management and those without over a large number of indicators for firm qual-ity that are determined before a startup introduces a middle management (and poten-tially confounds the measures). Second, we control for a wide range of contemporary or one period lagged indicators for firm quality directly in all estimated models.
We apply entropy balancing to implement the pre-balancing empirically. Entropy bal-ancing achieves balance over specified moments of selected covariates by deriving sample weights. The retrieved weights are then used in subsequent weighted estima-tions (Hainmueller, 2011; Hainmueller and Xu, 2013). Intuitively, this can be under-stood as the creation of a synthetic control group, where the observations in the con-trol group are reweighted so that their specified sample moments mimic those of the treatment group as closely as possible (cf. Abadie, Diamond, and Hainmueller, 2010). In contrast to other related methods, for instance propensity score matching, entropy balancing induces covariate balance directly, and not as the result of a propensity score matching procedure (which requires iterated re-specifications of the propensity score estimation to achieve covariate balance). Entropy balancing has been applied for sample balancing in several recent studies (e.g., Bansak, Hainmueller, and Hangartner, 2016; Malesky and Taussig, 2016; Satyanath, Voigtländer, and Voth, 2017). Technical details on the derivation of the entropy balancing weights are pro-vided in Appendix B.
Our choice of indicators for startup quality that we use in the balancing exercise fol-lows the results of Colombo and Grilli (2013) who analyze the antecedents of the emergence of a middle management layer in Italian high-tech startups. We balance on the full-time equivalent employment size of the startup at the time of foundation including founders, whether the firm was incorporated with limited liability at the time of foundation, industry dummies, whether the firm reported to have equity investors in the first interview, the number of patents a firm founder held at the time of firm
IAB-Discussion Paper 1/2018 16
foundation, and measures for founder human capital (whether the founder has tertiary education, the founder’s years of industry experience, whether the founder had started a firm before, and whether the founder has experience as a manager in de-pendent employment).5 The data show that, as expected, startups with middle man-agement clearly outperform those without middle management with respect to nearly all firm quality indicators. After balancing, though, original differences are leveled en-tirely (see Table 5 in Appendix A for results).
A second, closely related, source of endogeneity might arise from direct reverse cau-sality, when firms appoint a middle manager in response to the introduction of a mar-ket novelty. We use only lagged values of middle management to reduce the potential bias caused.
To assess the robustness of our identification strategy, we re-estimate our main mod-els and instrument the presence of a middle manager by two measures that we regard as plausibly exogenous to a startup’s innovation performance: (1) the number of ex-ecutives in firms that filed bankruptcy in the same district and one-digit NACE industry in a given year and (2) the propensity that other firms in the sample, which operate in the same one-digit NACE industry and are in the same size category, have a middle management.6 The first instrument introduces exogenous variation due to a local sup-ply shock of potential candidates for middle management positions. The second in-strument introduces exogenous variation in the firms’ demands for middle managers.
Because our IV model is over-identified (i.e., we use more instruments than endoge-nous regressors we instrument for) we use a (pooled) GMM approach to estimate the IV model and adjust the GMM weighting matrix and the standard errors for a potential clustering at the firm level. We find the proposed instruments to be valid and our iden-tification strategy to be supported by the results of IV regressions (see results section for details).
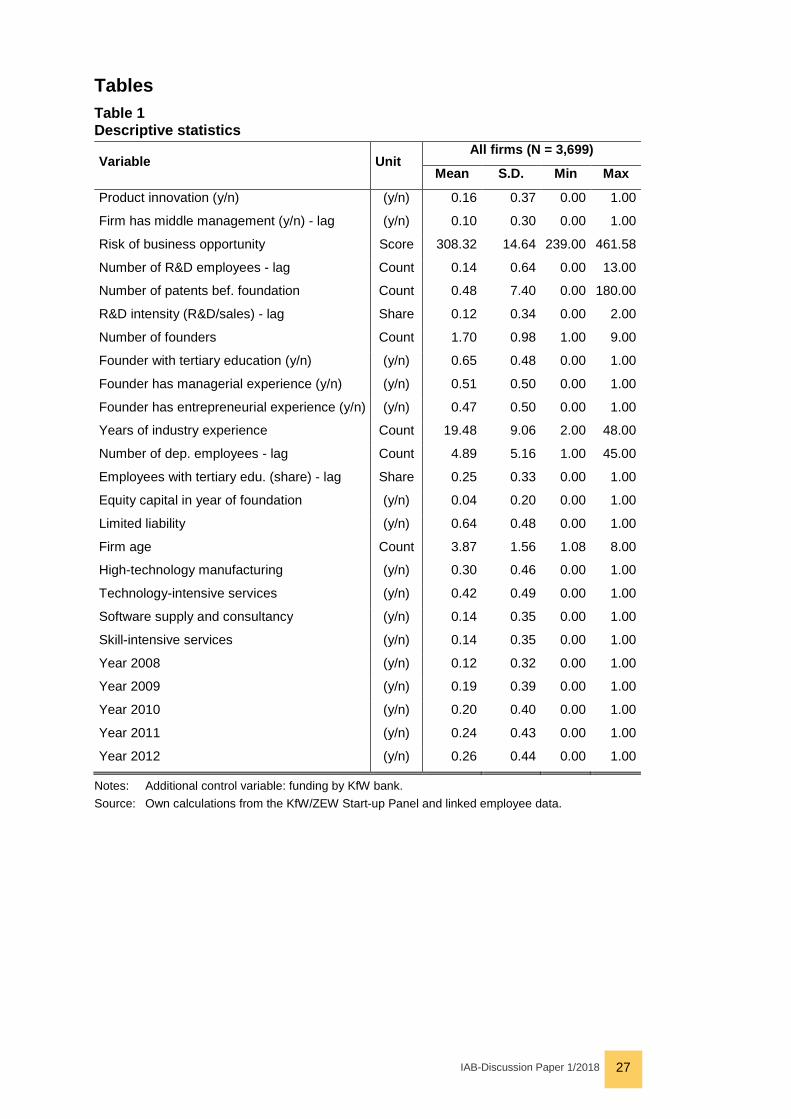
4 Results Summary statistics and a table of pairwise correlations are provided in Table 1 and Table 2. We learn from the descriptive statistics that 16 percent of startups in our sample report product innovations which gives some indication that achieving inno-
5 For founding teams we use information on the founder with the highest education/most
experience in the team. For improving the precision of the balancing of continuous varia-bles (i.e. startup size and number of founder patents), we require that the first three mo-ments of these variables are balanced, i.e. mean, variance and skewness.
6 According to existing research, the necessity to introduce a hierarchical structure de-pends crucially on industry and firm size (Rajan and Zingales, 2001). However, the prob-ability that other firms hire a middle manager should not directly influence a focal firm’s probability to launch an innovation on the market. For the generation of the instrument, we defined six size categories to achieve an as uniform as possible distribution of obser-vations over size categories: (1) 1 employee, (2) 2 employees, (3) 3 or 4 employees, (4) 5 to 7 employees, (5) 8 to 14 employees, (6) more than 14 employees.
IAB-Discussion Paper 1/2018 17
vation success is challenging for the average high-tech startup. Startups are on aver-age 3.87 years old, have 1.7 founders and employ 4.89 employees. They spend 12 percent of sales on R&D and employ 0.14 R&D employees, albeit with a substantial standard deviation. The number of R&D employees provides some indication that R&D positions are difficult to finance for startups. Similarly, founders hold 0.48 patents when creating the startup but also with a large standard deviation.
Most of the startups operate in service sectors, especially technology-intensive ser-vices (42 percent). Thirty percent of startup operate in high-tech manufacturing sec-tors which typically have higher entry barriers, e.g. from necessary fixed capital in-vestments. The riskiness of the business opportunities of startups in our sample is at an intermediate level at 308 on the scale between 100 and 600. Most startups are incorporated as limited liability companies (64 percent) but few have equity investors from the start (4 percent). Moreover, 10 percent of startups in our sample have a middle management. Hence, a sizable number of startups makes this organizational design choice but the majority of startups does not. This indicates that the introduction of a middle management has the potential to be a strategic decision differentiating startups from their peers.
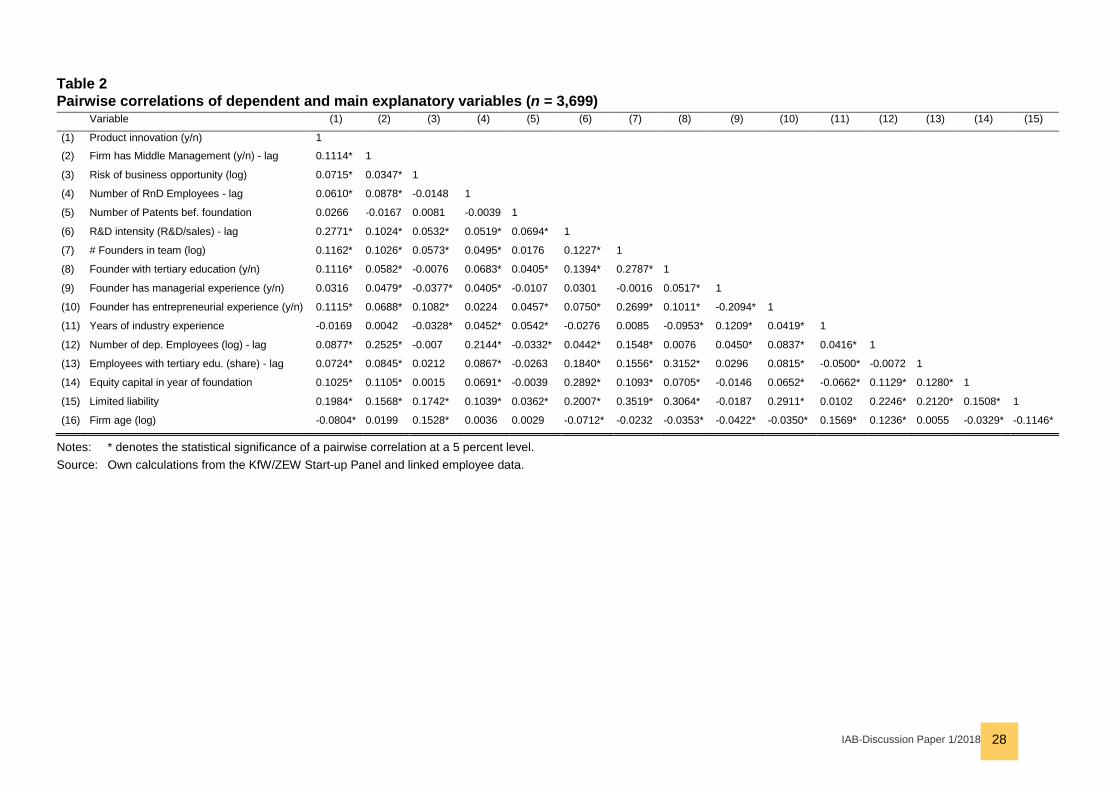
None of the correlations between the explanatory variables reach levels that indicate collinearity problems. This is supported by the variance inflation factor (VIF) that has an average value of 1.45 for our main models. The VIF is far below usually applied critical levels of 10 (Belsley, Kuh, and Welsh, 1980).
------ Table 1 about here ------
------ Table 2 about here ------
In line with Hypothesis 1, our main multivariate regression estimates from weighted Probit models reveal a significant and positive relationship between middle manage-ment and a startup’s likelihood to introduce a product innovation (Column A of Table 3; see Column A of Table 6 in Appendix A for results of the unbalanced/non-weighted model). Employing at least one middle manager increases the likelihood to introduce a market novelty by 7.2 percentage points. Given that the average propensity to in-troduce a market novelty in the sample is 16 percent, this effect size stands for a substantial increase.
------ Table 3 about here ------
The marginal effects of the wide range of included control variables show the ex-pected signs. Most noteworthy, the R&D intensity has a positive and significant effect, as does the size of the existing knowledge stock (patents at time of foundation), the number of R&D employees, and the share of employees with tertiary education.
We apply interaction and split sample analyses, to test the moderating effects on the relationship between middle management and innovation performance that we pro-posed in Hypotheses 2 to 4b (Table 3; Column B-F). In support of Hypothesis 2, we
IAB-Discussion Paper 1/2018 18
find a positive and significant interaction effect between the presence of a middle management level and a startups’ existing knowledge stock. Hence, middle manage-ment seems to become especially effective in managing innovation when middle man-agers can draw on larger stocks of existing knowledge. In addition, it seems reason-able to assume that middle managers help startups to translate inventions into mar-ketable innovations and hence facilitate the commercialization of previously recog-nized opportunities. In contrast, our data does not support Hypothesis 3: The interac-tion effect between middle management and the number of R&D employees is posi-tive but insignificant in the full sample. As we will show in the following, understanding the relationship between middle management, the number of R&D employees, and innovation requires a more nuanced explanation.
To assess how the riskiness of a firm’s business opportunity influences the moderat-ing effects of the prior knowledge stock and the R&D personnel (Hypotheses 4a and 4b), we split our sample at the industry median of the riskiness of the business oppor-tunity.7 In support of Hypothesis 4a, we find that the interaction between middle man-agement and the number of R&D employees is only positive and significant for firms that exploit risky opportunities. In contrast, and in support of Hypothesis 4b, the inter-action term between middle management and the size of a startup’s prior knowledge stock is only positive and significant for less risky business opportunities. These re-sults support the hypothesized rationale that in highly risky businesses, which need to adapt to their business environment constantly and keep the cost of these adap-tions under control, middle management plays an important role in supporting the founders in monitoring ongoing R&D. In contrast, in less risky but more stable envi-ronments that allow recombining a startup’s existing knowledge stock middle man-agement seems to facilitate innovation by rendering the search for innovation through the recombination of existing technologies more efficiently and reliably.
4.1 Robustness checks As described before, we apply an instrumental variables approach as a robustness check (Table 7 in Appendix A). In a first step, we instrument lagged middle manage-ment to replicate our main analyses (i.e. we replicate Table 3, Column A). Both instru-ments have a positive and statistically significant impact on the probability to employ a middle manager in the first stage of the IV regression. The joint first stage F-statistics of the instruments is 10.45. As a rule of thumb, first stage F-statistics of 10 and below indicate critically weak instruments. The Hansen-J test for over-identification has a p-
7 We split the sample at the industry medians of the industries used for the stratification of
the KfW/ZEW Startup Panel. We control for these stratification industries by industry fixed effects in all models. Since the opportunity risk measure is generated on a three-digit NACE level, this procedure implies that we compare “more risky” opportunities to oppor-tunities that are less risky but generally comparable.
IAB-Discussion Paper 1/2018 19
value of 0.106: over-identification and the validity of our instruments cannot be re-jected at a 10 percent significance level. When instrumented, the effect of middle management remains positive and significant.
In a second step, we re-run the IV model but use contemporary (and not lagged) explanatory variables. Since the effect of middle management is identified by exoge-nous variation in the IV model, a specification without lags yields unbiased estimates. However, the precision of the estimates should increase due to the increase in the sample size. This allows us to provide some evidence whether the fact that the coef-ficient and the standard error of middle management become somewhat inflated in the lagged IV specification can be attributed to the rather week instruments. As in the first specification, both instruments have a significantly positive relationship with the propensity to employ a middle manager in the first stage. The power of the instru-ments is higher with a first stage F-statistic of 20.75 and a p-value of the Hansen-J test for over-identification of 0.511. As a consequence of the stronger instruments, the inflation of the estimated coefficient for middle management decreases consider-ably (to 0.247). Hence, we conclude that overall the IV specifications support a causal interpretation of our results.
As a second robustness check, we increase the level of detail of the included industry fixed effects. We do so to assure that our estimates are not driven by industry differ-ences in the propensity to innovate we do not control for. The industry controls in our main models reflect the stratification criteria of the KfW/ZEW-Startup Panel and are included on the level of stratification to control for firms’ probabilities to be drawn into the sample. When we increase the level of detail of the industry fixed effects up to the two digit NACE level, the marginal effect of middle management changes only slightly (see Columns C and D of Table 6 in Appendix A). Hence, we are confident that con-trolling for industry differences at the level of the industry stratification of the sample yields unbiased results.
5 Discussion Do middle managers help startups to introduce innovative products to the market? And if so, when are middle managers most effective? Our research addresses a fun-damental puzzle in the literature on organizational design. On the one hand, middle management is typically associated with a higher level of formalization and bureau-cracy and therefore bears the risk of hampering creativity and innovation in the aver-age firm (e.g., Burns and Stalker, 1961; Thompson, 1965). On the other hand, organ-izational structure such as a middle management level can help firms to allocate re-sources, to facilitate monitoring and control, and therefore to realize opportunities (Ireland and Webb, 2009; Foss et al. 2015).
Our research provides a number of compelling findings to address this gap in existing research for a high-tech startup context. Based on a unique sample of almost 3,700 firm-year observations between 2005 and 2012, we find that high-tech startups with middle management have a higher likelihood of introducing product innovations. We
IAB-Discussion Paper 1/2018 20
attribute this finding to the fact that the establishment of middle management leads to increased information processing and monitoring capacity in the startup (Colombo and Grilli, 2013). Middle management frees up founders to focus on the most chal-lenging problems of the organization. It also allows an organization to predict more accurately when problems or projects require organization-wide solutions (Harris and Raviv, 2002). In that sense, middle management enables parallel processing and al-lows decision making of its founders to focus on strategic and higher-value decisions while other decisions can be delegated to middle managers. This should be particu-larly true for decision making in R&D. Since R&D decisions are complex and uncer-tain, they require management attention and thorough decision making. Middle man-agers allow founders to focus on these decisions and therefore improve a startup’s ability to innovate.
Moreover, we find evidence that middle managers facilitate the recombination of ex-isting knowledge, a central determinant of a firm’s ability to innovate (Rosenkopf and Nerkar, 2001; Katila and Ahuja, 2002). Middle managers, through the added infor-mation-processing capacity, apparently decrease the likelihood of errors and false starts when using the same knowledge elements repeatedly so that search becomes more reliable (Levinthal and March, 1993). They also make the search for innovation more predictable due to a better understanding of the requirements that need to be met for successful innovation. The increased information processing capacity helps understand how product development tasks can be decomposed into manageable sub-problems, how they should be sequenced, and which elements to disregard.
Contrary to our expectations, we do not find a positive and significant interaction effect between middle management and the size of a startup’s current R&D personnel. We had expected middle management to be of value in directing and focusing current knowledge production and technology development by reducing the span of control for a startup’s employees, leading to quicker implementation of plans because of tighter spans of control (Keren and Levhari, 1979). However, our results indicate that this relationship is more complex and requires an understanding of the riskiness of the startup’s business opportunity. Splitting the sample into two groups with below and above median riskiness reveals that the interaction between middle management and current R&D personnel is positive and significant for firms that operate in indus-tries with risky business opportunities. However, there is no significant interaction ef-fect for less risky opportunities. In contrast, the interaction term between middle man-agement and the startup’s existing knowledge is only positive and significant in indus-tries with less risky business opportunities. These results support our expectations that startups in highly risky businesses need to continuously adapt and dedicate man-agement attention which is why middle management is particularly helpful in support-ing founders. In more stable environments, middle managers help with recombining a startup’s existing knowledge stock.
IAB-Discussion Paper 1/2018 21
Taken together, our findings advance academic research along two dimensions. First, existing entrepreneurship literature emphasizes how startups mature and profession-alize through their organizational design choices (Baron et al., 1999; Colombo and Grilli, 2013; Hellmann and Puri, 2002). Our theoretical model focusses on one partic-ular organizational design choice, i.e. the establishment of a middle management layer in a startup, and links it to innovation performance, arguably one of the most crucial strategic outcomes for high-tech startups. We integrate mechanisms on infor-mation processing and monitoring from existing middle management literature into models of R&D decision making. On the one hand, this provides a basis for future studies to theorize about how middle management affects other strategic outcomes of startups, e.g. internationalization. On the other hand, it highlights a weakness in existing literature investigating innovation outcomes of high-tech startups. Studies ig-noring the hierarchical levels are likely to suffer from biased results.
Second, recent research in strategic entrepreneurship emphasizes how the riskiness of a startup’s business opportunity conditions the value of founder knowledge and experience for startup success (e.g., Dencker and Gruber, 2015). We find that this contingency effect of a startup’s business opportunity is not limited to founder char-acteristics. Instead, we show how middle management can extend the management capacities of a startup for making R&D decisions and that the effects differ depending on the riskiness of the startup’s business opportunities. Our theoretical model can be a pathway for future theorizing on how the effectiveness of other organizational design choices of startups (apart from middle management) is contingent on their business opportunities.
Apart from these academic contributions, our findings have relevance for decision making in startups. We provide evidence of the benefits of middle management for startups and outline conditions under which the establishment of a middle manage-ment level is most effective. These insights translate into direct recommendations for the management of startups. They suggest that startups should hire middle managers as soon as the startup finances allow to do so (Michelacci and Quadrini, 2005) in order to improve the realization of opportunities. There is a particularly strong case for the establishment of middle management in high-tech startups that have a strong technological base and whose prior knowledge offers numerous opportunities for re-combination. Moreover, high-tech startups that continue to invest into R&D because the business opportunity they exploit features high-risk and return prospects also ben-efit from middle managers. Founders should critically question their own information processing capabilities and to what extent they can dedicate attention to innovation. Similarly, startup advisors such as investors, consultants or government agencies should take these mechanisms into account. We show that the likelihood for innova-tion success of a startup is not limited to technological decisions of its founders but includes organizational design choices which will make it more likely that the startup will have the information processing and monitoring capacities in place to arrive at promising R&D decisions.
IAB-Discussion Paper 1/2018 22
6 Concluding remarks We have argued theoretically and shown empirically that establishing a middle man-agement layer can help startups to introduce product innovations. The positive effects of middle management seem to arise through improved capabilities for information processing, monitoring and decision making. These improvements help startups pri-oritize between the creation of new knowledge and the exploitation of existing knowledge, dependent on the riskiness of a startup’s business opportunity.
Nevertheless, our research is not without limitations. First, our research investigates only an individual organizational design choice and seeks to isolate its effect on inno-vation. However, the organizational structure of startups can be characterized by sev-eral other dimensions that may interact with the establishment of a middle manage-ment level. Future research should therefore also consider other design choices and study their interrelationships. Second, while our research design allows us to capture the effect of middle management across a number of startups and industries, smaller scale and/or qualitative studies may be better positioned to delineate communication and coordination patterns by which middle managers and founders interact in their R&D decisions. Finally, while we use panel data that enables us to control for a large number of firm- as well as individual-specific factors in our models and to use one period lagged explanatory variables to reduce the risk of reverse causality, the re-maining time dimension in our panel dataset is not large enough to estimate mean-ingful fixed effects specifications. Hence there may be some remaining unobserved heterogeneity in individual or firm characteristics that can offer alternative explana-tions for our empirical results. However, since we are able demonstrate the robust-ness of our results by using different methods of identification, including a pre-balanc-ing of our sample and instrumental variables models, we consider the potential re-maining bias to be very small at most.
References Abadie A, Diamond A, Hainmueller J. 2010. Synthetic Control Methods for Compar-ative Case Studies: Estimating the Effect of California’s Tobacco Control Program. In: Journal of the American Statistical Association 105(490): 493-505.
Agrawal A, Cockburn L, McHale J. 2006. Gone but Not Forgotten: Knowledge Flows, Labor Mobility, and Enduring Social Relationships. In: Journal of Economic Geography 6(5): 571-591.
Ahuja G, Lampert CM, Tandon V. 2008. Moving Beyond Schumpeter: Management Research on the Determinants of Technological Innovation. In: Academy of Man-agement Annals 2: 1-98.
Ai C, Norton EC. 2003. Interaction Terms in Logit and Probit Models. In: Economics Letters 80: 123-129.
Amit R, Glosten L, Muller E. 1990. Entrepreneurial Ability, Venture Investments, and Risk Sharing. In: Management Science 36(10): 1232-1245.
Antons D, Piller FT. 2015. Opening the Black Box of "Not Invented Here": Attitudes, Decision Biases, and Behavioral Consequences. In: Academy of Management Per-spectives 29(2): 193-217.
IAB-Discussion Paper 1/2018 23
Bansak K, Hainmueller J, Hangartner D. 2016. How Economic, Humanitarian, and Religious Concerns Shape European Attitudes toward Asylum Seekers. In: Science 354(6309): 217-222.
Baron JN, Burton MD, Hannan MT. 1999. Engineering Bureaucracy: The Genesis of Formal Policies, Positions, and Structures in High-Technology Firms. In: Journal of Law, Economics and Organization 15(1): 1-41.
Belsley DA, Kuh E, Welsh RE. 1980. Regression Diagnostics: Identifying Influential Data and Sources of Collinearity: New York.
Bersch J, Gottschalk S, Müller B, Niefert M. 2014. The Mannheim Enterprise Panel (Mup) and Firm Statistics for Germany. , ZEW Centre for European Economic Re-search Discussion Paper.
Burns T, Stalker GM. 1961. The Management of Innovation (3 ed.). Oxford Univer-sity Press: Oxford.
Calvo GA, Wellisz S. 1978. Supervision, Loss of Control, and the Optimum Size of the Firm. In: Journal of Political Economy 86(5): 943-952.
Colombo MG, Delmastro M, Grilli L. 2004. Entrepreneurs' Human Capital and the Start-up Size of New Technology-Based Firms. In: International Journal of Industrial Organization 22(8): 1183-1211.
Colombo MG, Grilli L. 2005. Founders’ Human Capital and the Growth of New Tech-nology-Based Firms: A Competence-Based View. In: Research Policy 34(6): 795-816.
Colombo MG, Grilli L. 2013. The Creation of a Middle-Management Level by Entre-preneurial Ventures: Testing Economic Theories of Organizational Design. In: Jour-nal of Economics and Management Strategy 22(2): 390-422.
Czarnitzki D, Doherr T, Hussinger K, Schliessler P, Toole AA. 2015. Individual Ver-sus Institutional Ownership of University-Discovered Inventions, ZEW Centre for Eu-ropean Economic Research Discussion Paper.
Dencker JC, Gruber M. 2015. The Effects of Opportunities and Founder Experience on New Firm Performance. In: Strategic Management Journal 36(7): 1035-1052.
Dess GG, Lumpkin GT, McKee JE. 1999. Linking Corporate Entrepreneurship to Strategy, Structure, and Process: Suggested Research Directions. In: Entrepreneur-ship Theory and Practice 23(3): 85-103.
Eckardt JT, Shane SA. 2003. Opportunities and Entrepreneurship. In: Journal of Management 29: 333-349.
Foss NJ, Lyngsie J, Zahra SA. 2015. Organizational Design Correlates of Entrepre-neurship: The Roles of Decentralization and Formalization for Opportunity Discovery and Realization. In: Strategic Organization 13(1): 32-60.
Fryges H, Gottschalk S, Kohn K. 2010. The Kfw/Zew Start-up Panel: Design and Research Potential. In: Journal of Applied Social Science Studies (European Data Watch) 130: 117-131.
Galbraith J. 1977. Organizational Design. Addison Wesley: Reading, MA.
Gambardella A, Ganco M, Honoré F. 2015. Using What You Know: Patented Knowledge in Incumbent Firms and Employee Entrepreneurship. In: Organization Science 26(2): 456-474.
IAB-Discussion Paper 1/2018 24
Garicano L. 2000. Hierarchies and the Organization of Knowledge in Production. In: Journal of Political Economy 108(5): 874-904.
Gourville JT. 2006. Eager Sellers and Stony Buyers: Understanding the Psychology of New-Product Adoption. Harvard Business Review 84(6): 3-10.
Greene WH. 2010. Testing Hypotheses About Interaction Terms in Nonlinear Mod-els. In: Economics Letter 107(2): 291-296.
Hainmueller J. 2011. Entropy Balancing for Causal Effects: A Multivariate Re-weighting Method to Produce Balanced Samples in Observational Studies. In: Politi-cal Analysis 20(1): 25-46.
Hainmueller J, Xu Y. 2013. Ebalance: A Stata Package for Entropy Balancing. Jour-nal of Statistical Software 54(7)
Hall BH. 2005. The Financing of Innovation. In S Shane (Ed.), The Handbook of Technology and Innovation Management. Blackwell: Oxford: 409-430.
Harris M, Raviv A. 2002. Organization Design. Management Science 48(7): 852-865.
Hellmann T, Puri M. 2002. Venture Capital and the Professionalization of Start-up Firms: Empirical Evidence. In: The Journal of Finance 57(1): 169-197.
Ireland RD, Covin JG, Kuratko DF. 2009. Conceptualizing Corporate Entrepreneur-ship Strategy. In: Entrepreneurship Theory and Practice 33(1): 19-46.
Ireland RD, Webb JW. 2009. Crossing the Great Divide of Strategic Entrepreneur-ship: Transitioning between Exploration and Exploitation. In: Business Horizons 52(5): 469-479.
Jensen MC, Meckling WH. 1995. Specific and General Knowledge, and Organiza-tional Structure. In: Journal of Applied Corporate Finance 8(2): 4-18.
Katila R. 2002. New Product Search over Time: Past Ideas in Their Prime? In: Acad-emy of Management Journal 45: 995-1010.
Katila R, Ahuja G. 2002. Something Old, Something New: A Longitudinal Study of Search Behavior and New Product Introduction. In: Academy of Management Jour-nal 45(6): 1183-1194.
Katz R, Allen TJ. 1982. Investigating the Not Invented Here (Nih) Syndrome. A Look at the Performance, Tenure, and Communication Patterns of 50 R&D Project Groups. In: R&D Management 12: 7-19.
Keren M, Levhari D. 1979. The Optimum Span of Control in a Pure Hierarchy. In: Management Science 25(11): 1162-1172.
Keren M, Levhari D. 1989. Decentralization, Aggregation, Control Loss and Costs in a Hierarchical Model of the Firm. In: Journal of Economic Behavior & Organization 11(2): 213-236.
Koput KW. 1997. A Chaotic Model of Innovative Search: Some Answers, Many Questions. In: Organization Science 8(5): 528-542.
Levinthal DA, March JG. 1993. The Myopia of Learning. In: Strategic Management Journal 14: 95-112.
Malesky E, Taussig M. 2016. The Danger of Not Listening to Firms: Government Responsiveness and the Goal of Regulatory Compliance. Academy of Management Journal forthcoming
IAB-Discussion Paper 1/2018 25
Michelacci C, Quadrini V. 2005. Borrowing from Employees: Wage Dynamics with Financial Constraints. In: Journal of the European Economic Association 3(2/3): 360-369.
Miller KD. 1992. A Framework for Integrated Risk Management in International Busi-ness. In: Journal of International Business Studies 23(2): 311–331.
Miller KD. 1993. Industry and Country Effects on Managers' Perceptions of Environ-mental Uncertainties. In: Journal of International Business Studies 24(4): 693-714.
Ocasio W. 1997. Towards an Attention-Based View of the Firm. In: Strategic Man-agement Journal 18: 187-206.
Qian Y. 1994. Incentives and Loss of Control in an Optimal Hierarchy. In: The Re-view of Economic Studies 61(3): 527-544.
Radner R. 1993. The Organization of Decentralized Information Processing. In: Econometrica 61(5): 1109-1146.
Rajan R, Wulf J. 2003. The Flattening Firm: Evidence from Panel Data on the Changing Nature of Corporate Hierarchies. National Bureau of Economic Research Working Paper Series No. 9633
Rajan R, Zingales L. 2001. The Firm as a Dedicated Hierarchy: A Theory of the Ori-gins and Growth of Firms. In: The Quarterly Journal of Economics 116(3): 805-851.
Rosenkopf L, Nerkar A. 2001. Beyond Local Search: Boundary-Spanning, Explora-tion, and Impact in the Optical Disc Industry. In: Strategic Management Journal 22(4): 287-306.
Satyanath S, Voigtländer N, Voth HJ. 2017. Bowling for Fascism: Social Capital and the Rise of the Nazi Party. In: Journal of Political Economy 125(2): 478-526.
Schumpeter JA. 1934. Theory of Economic Development. Harvard University Press: Cambridge, MA.
Shane SA. 2000. Prior Knowledge and the Discovery of Entrepreneurial Opportuni-ties. In: Organization Science 11(4): 448-469.
Shane SA. 2003. A General Theory of Entrepreneurship: The Individual-Opportunity Nexus. Edward Elgar: Aldershot.
Shane SA, Venkataraman S. 2000. The Promise of Entrepreneurship as a Field of Research. In: Academy of Management Review 25: 217-226.
Simon HA. 1948. Administrative Behavior. A Study of Decision-Making in Adminis-trative Organizations: New York.
Sine WD, Mitsuhashi H, Kirsch DA. 2006. Revisiting Burns and Stalker: Formal Structure and New Venture Performance in Emerging Economic Sectors. In: Acad-emy of Management Journal 49(1): 121-132.
Stein JC. 2002. Information Production and Capital Allocation: Decentralized Versus Hierarchical Firms. In: The Journal of Finance 57(5): 1891-1921.
Stinchcombe AL. 1965. Social Structures and Organizations. In JG March (Ed.), Handbook of Organizations. In: Rand McNally: Chicago: 142-193.
Thompson VA. 1965. Bureaucracy and Innovation. In: Administrative Science Quar-terly 10(1): 1-20.

IAB-Discussion Paper 1/2018 26
Venkataraman S. 1997. The Distinctive Domain of Entrepreneurship Research: An Editor’s Perspective. In JN Katz, R Brockhaus (Eds.), Advances in Entrepreneur-ship, Firm Emergence, and Growth. JAI Press: Greenwich: 119-138.
Wasserman N. 2012. The Founder's Dilemmas: Anticipating and Avoiding the Pit-falls That Can Sink a Startup. Princeton University Press: Princeton, NJ.
Wiklund J, Shepherd D. 2003. Aspiring for, and Achieving Growth: The Moderating Role of Resources and Opportunities. In: Journal of Management Studies 40(8): 1919-1941.
IAB-Discussion Paper 1/2018 27
Tables Table 1 Descriptive statistics
Variable Unit All firms (N = 3,699)
Mean S.D. Min Max
Product innovation (y/n) (y/n) 0.16 0.37 0.00 1.00
Firm has middle management (y/n) - lag (y/n) 0.10 0.30 0.00 1.00
Risk of business opportunity Score 308.32 14.64 239.00 461.58
Number of R&D employees - lag Count 0.14 0.64 0.00 13.00
Number of patents bef. foundation Count 0.48 7.40 0.00 180.00
R&D intensity (R&D/sales) - lag Share 0.12 0.34 0.00 2.00
Number of founders Count 1.70 0.98 1.00 9.00
Founder with tertiary education (y/n) (y/n) 0.65 0.48 0.00 1.00
Founder has managerial experience (y/n) (y/n) 0.51 0.50 0.00 1.00
Founder has entrepreneurial experience (y/n) (y/n) 0.47 0.50 0.00 1.00
Years of industry experience Count 19.48 9.06 2.00 48.00
Number of dep. employees - lag Count 4.89 5.16 1.00 45.00
Employees with tertiary edu. (share) - lag Share 0.25 0.33 0.00 1.00
Equity capital in year of foundation (y/n) 0.04 0.20 0.00 1.00
Limited liability (y/n) 0.64 0.48 0.00 1.00
Firm age Count 3.87 1.56 1.08 8.00
High-technology manufacturing (y/n) 0.30 0.46 0.00 1.00
Technology-intensive services (y/n) 0.42 0.49 0.00 1.00
Software supply and consultancy (y/n) 0.14 0.35 0.00 1.00
Skill-intensive services (y/n) 0.14 0.35 0.00 1.00
Year 2008 (y/n) 0.12 0.32 0.00 1.00
Year 2009 (y/n) 0.19 0.39 0.00 1.00
Year 2010 (y/n) 0.20 0.40 0.00 1.00
Year 2011 (y/n) 0.24 0.43 0.00 1.00
Year 2012 (y/n) 0.26 0.44 0.00 1.00
Notes: Additional control variable: funding by KfW bank. Source: Own calculations from the KfW/ZEW Start-up Panel and linked employee data.
IAB-Discussion Paper 1/2018 28
Table 2 Pairwise correlations of dependent and main explanatory variables (n = 3,699)
Variable (1) (2) (3) (4) (5) (6) (7) (8) (9) (10) (11) (12) (13) (14) (15)
(1) Product innovation (y/n) 1
(2) Firm has Middle Management (y/n) - lag 0.1114* 1
(3) Risk of business opportunity (log) 0.0715* 0.0347* 1
(4) Number of RnD Employees - lag 0.0610* 0.0878* -0.0148 1
(5) Number of Patents bef. foundation 0.0266 -0.0167 0.0081 -0.0039 1
(6) R&D intensity (R&D/sales) - lag 0.2771* 0.1024* 0.0532* 0.0519* 0.0694* 1
(7) # Founders in team (log) 0.1162* 0.1026* 0.0573* 0.0495* 0.0176 0.1227* 1
(8) Founder with tertiary education (y/n) 0.1116* 0.0582* -0.0076 0.0683* 0.0405* 0.1394* 0.2787* 1
(9) Founder has managerial experience (y/n) 0.0316 0.0479* -0.0377* 0.0405* -0.0107 0.0301 -0.0016 0.0517* 1
(10) Founder has entrepreneurial experience (y/n) 0.1115* 0.0688* 0.1082* 0.0224 0.0457* 0.0750* 0.2699* 0.1011* -0.2094* 1
(11) Years of industry experience -0.0169 0.0042 -0.0328* 0.0452* 0.0542* -0.0276 0.0085 -0.0953* 0.1209* 0.0419* 1
(12) Number of dep. Employees (log) - lag 0.0877* 0.2525* -0.007 0.2144* -0.0332* 0.0442* 0.1548* 0.0076 0.0450* 0.0837* 0.0416* 1
(13) Employees with tertiary edu. (share) - lag 0.0724* 0.0845* 0.0212 0.0867* -0.0263 0.1840* 0.1556* 0.3152* 0.0296 0.0815* -0.0500* -0.0072 1
(14) Equity capital in year of foundation 0.1025* 0.1105* 0.0015 0.0691* -0.0039 0.2892* 0.1093* 0.0705* -0.0146 0.0652* -0.0662* 0.1129* 0.1280* 1
(15) Limited liability 0.1984* 0.1568* 0.1742* 0.1039* 0.0362* 0.2007* 0.3519* 0.3064* -0.0187 0.2911* 0.0102 0.2246* 0.2120* 0.1508* 1
(16) Firm age (log) -0.0804* 0.0199 0.1528* 0.0036 0.0029 -0.0712* -0.0232 -0.0353* -0.0422* -0.0350* 0.1569* 0.1236* 0.0055 -0.0329* -0.1146*
Notes: * denotes the statistical significance of a pairwise correlation at a 5 percent level. Source: Own calculations from the KfW/ZEW Start-up Panel and linked employee data.
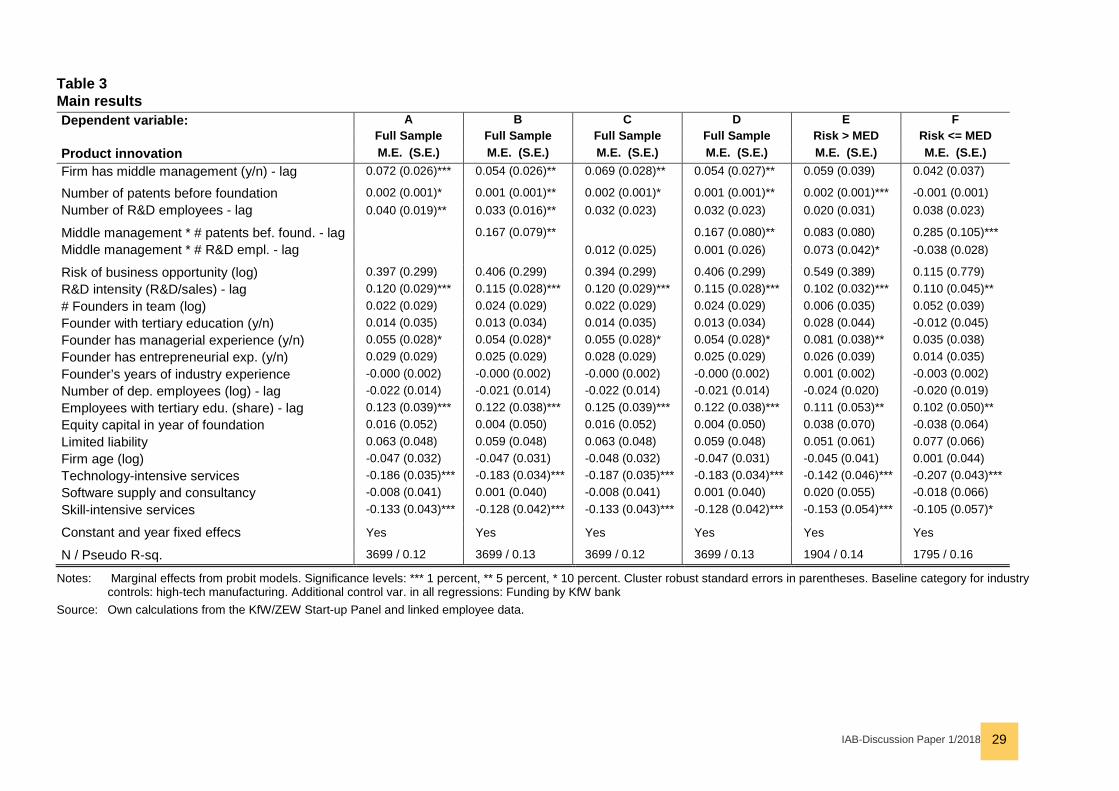
IAB-Discussion Paper 1/2018 29
Table 3 Main results Dependent variable: A B C D E F
Full Sample Full Sample Full Sample Full Sample Risk > MED Risk <= MED Product innovation M.E. (S.E.) M.E. (S.E.) M.E. (S.E.) M.E. (S.E.) M.E. (S.E.) M.E. (S.E.) Firm has middle management (y/n) - lag 0.072 (0.026)*** 0.054 (0.026)** 0.069 (0.028)** 0.054 (0.027)** 0.059 (0.039) 0.042 (0.037)
Number of patents before foundation 0.002 (0.001)* 0.001 (0.001)** 0.002 (0.001)* 0.001 (0.001)** 0.002 (0.001)*** -0.001 (0.001) Number of R&D employees - lag 0.040 (0.019)** 0.033 (0.016)** 0.032 (0.023) 0.032 (0.023) 0.020 (0.031) 0.038 (0.023)
Middle management * # patents bef. found. - lag 0.167 (0.079)** 0.167 (0.080)** 0.083 (0.080) 0.285 (0.105)*** Middle management * # R&D empl. - lag 0.012 (0.025) 0.001 (0.026) 0.073 (0.042)* -0.038 (0.028)
Risk of business opportunity (log) 0.397 (0.299) 0.406 (0.299) 0.394 (0.299) 0.406 (0.299) 0.549 (0.389) 0.115 (0.779) R&D intensity (R&D/sales) - lag 0.120 (0.029)*** 0.115 (0.028)*** 0.120 (0.029)*** 0.115 (0.028)*** 0.102 (0.032)*** 0.110 (0.045)** # Founders in team (log) 0.022 (0.029) 0.024 (0.029) 0.022 (0.029) 0.024 (0.029) 0.006 (0.035) 0.052 (0.039) Founder with tertiary education (y/n) 0.014 (0.035) 0.013 (0.034) 0.014 (0.035) 0.013 (0.034) 0.028 (0.044) -0.012 (0.045) Founder has managerial experience (y/n) 0.055 (0.028)* 0.054 (0.028)* 0.055 (0.028)* 0.054 (0.028)* 0.081 (0.038)** 0.035 (0.038) Founder has entrepreneurial exp. (y/n) 0.029 (0.029) 0.025 (0.029) 0.028 (0.029) 0.025 (0.029) 0.026 (0.039) 0.014 (0.035) Founder’s years of industry experience -0.000 (0.002) -0.000 (0.002) -0.000 (0.002) -0.000 (0.002) 0.001 (0.002) -0.003 (0.002) Number of dep. employees (log) - lag -0.022 (0.014) -0.021 (0.014) -0.022 (0.014) -0.021 (0.014) -0.024 (0.020) -0.020 (0.019) Employees with tertiary edu. (share) - lag 0.123 (0.039)*** 0.122 (0.038)*** 0.125 (0.039)*** 0.122 (0.038)*** 0.111 (0.053)** 0.102 (0.050)** Equity capital in year of foundation 0.016 (0.052) 0.004 (0.050) 0.016 (0.052) 0.004 (0.050) 0.038 (0.070) -0.038 (0.064) Limited liability 0.063 (0.048) 0.059 (0.048) 0.063 (0.048) 0.059 (0.048) 0.051 (0.061) 0.077 (0.066) Firm age (log) -0.047 (0.032) -0.047 (0.031) -0.048 (0.032) -0.047 (0.031) -0.045 (0.041) 0.001 (0.044) Technology-intensive services -0.186 (0.035)*** -0.183 (0.034)*** -0.187 (0.035)*** -0.183 (0.034)*** -0.142 (0.046)*** -0.207 (0.043)*** Software supply and consultancy -0.008 (0.041) 0.001 (0.040) -0.008 (0.041) 0.001 (0.040) 0.020 (0.055) -0.018 (0.066) Skill-intensive services -0.133 (0.043)*** -0.128 (0.042)*** -0.133 (0.043)*** -0.128 (0.042)*** -0.153 (0.054)*** -0.105 (0.057)*
Constant and year fixed effecs Yes Yes Yes Yes Yes Yes
N / Pseudo R-sq. 3699 / 0.12 3699 / 0.13 3699 / 0.12 3699 / 0.13 1904 / 0.14 1795 / 0.16
Notes: Marginal effects from probit models. Significance levels: *** 1 percent, ** 5 percent, * 10 percent. Cluster robust standard errors in parentheses. Baseline category for industry controls: high-tech manufacturing. Additional control var. in all regressions: Funding by KfW bank
Source: Own calculations from the KfW/ZEW Start-up Panel and linked employee data.
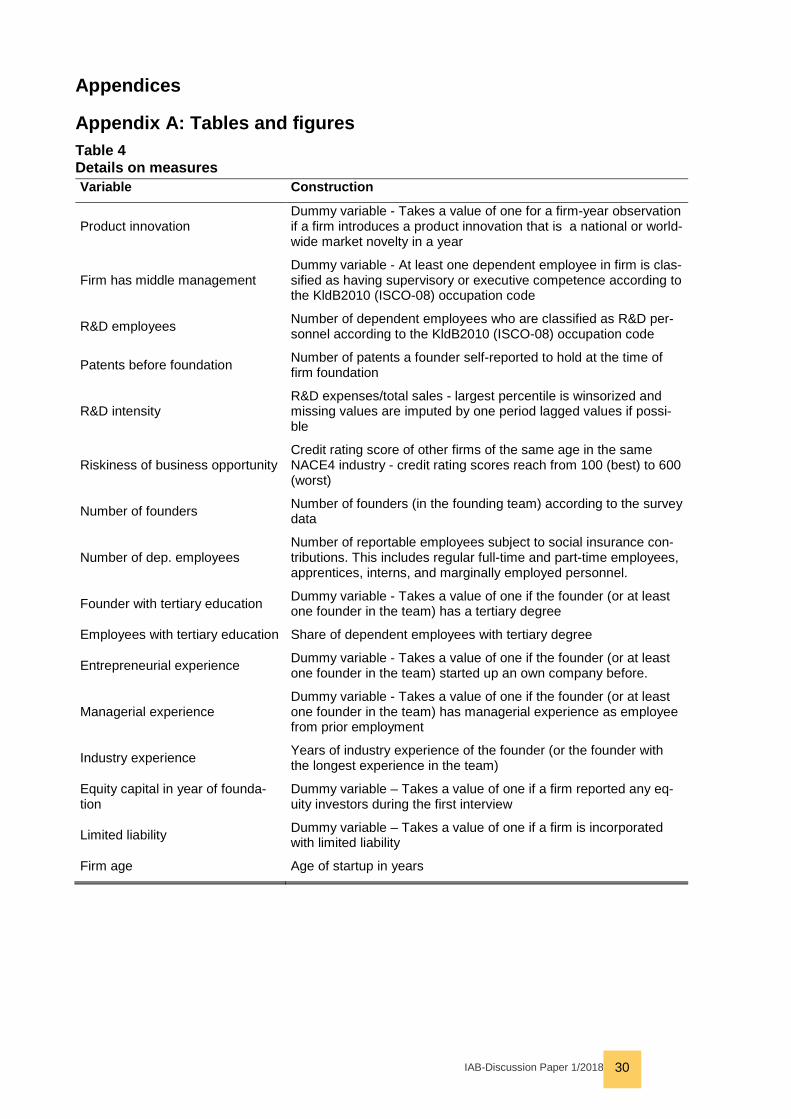
IAB-Discussion Paper 1/2018 30
Appendices
Appendix A: Tables and figures Table 4 Details on measures Variable Construction
Product innovation Dummy variable - Takes a value of one for a firm-year observation if a firm introduces a product innovation that is a national or world-wide market novelty in a year
Firm has middle management Dummy variable - At least one dependent employee in firm is clas-sified as having supervisory or executive competence according to the KldB2010 (ISCO-08) occupation code
R&D employees Number of dependent employees who are classified as R&D per-sonnel according to the KldB2010 (ISCO-08) occupation code
Patents before foundation Number of patents a founder self-reported to hold at the time of firm foundation
R&D intensity R&D expenses/total sales - largest percentile is winsorized and missing values are imputed by one period lagged values if possi-ble
Riskiness of business opportunity Credit rating score of other firms of the same age in the same NACE4 industry - credit rating scores reach from 100 (best) to 600 (worst)
Number of founders Number of founders (in the founding team) according to the survey data
Number of dep. employees Number of reportable employees subject to social insurance con-tributions. This includes regular full-time and part-time employees, apprentices, interns, and marginally employed personnel.
Founder with tertiary education Dummy variable - Takes a value of one if the founder (or at least one founder in the team) has a tertiary degree
Employees with tertiary education Share of dependent employees with tertiary degree
Entrepreneurial experience Dummy variable - Takes a value of one if the founder (or at least one founder in the team) started up an own company before.
Managerial experience Dummy variable - Takes a value of one if the founder (or at least one founder in the team) has managerial experience as employee from prior employment
Industry experience Years of industry experience of the founder (or the founder with the longest experience in the team)
Equity capital in year of founda-tion
Dummy variable – Takes a value of one if a firm reported any eq-uity investors during the first interview
Limited liability Dummy variable – Takes a value of one if a firm is incorporated with limited liability
Firm age Age of startup in years
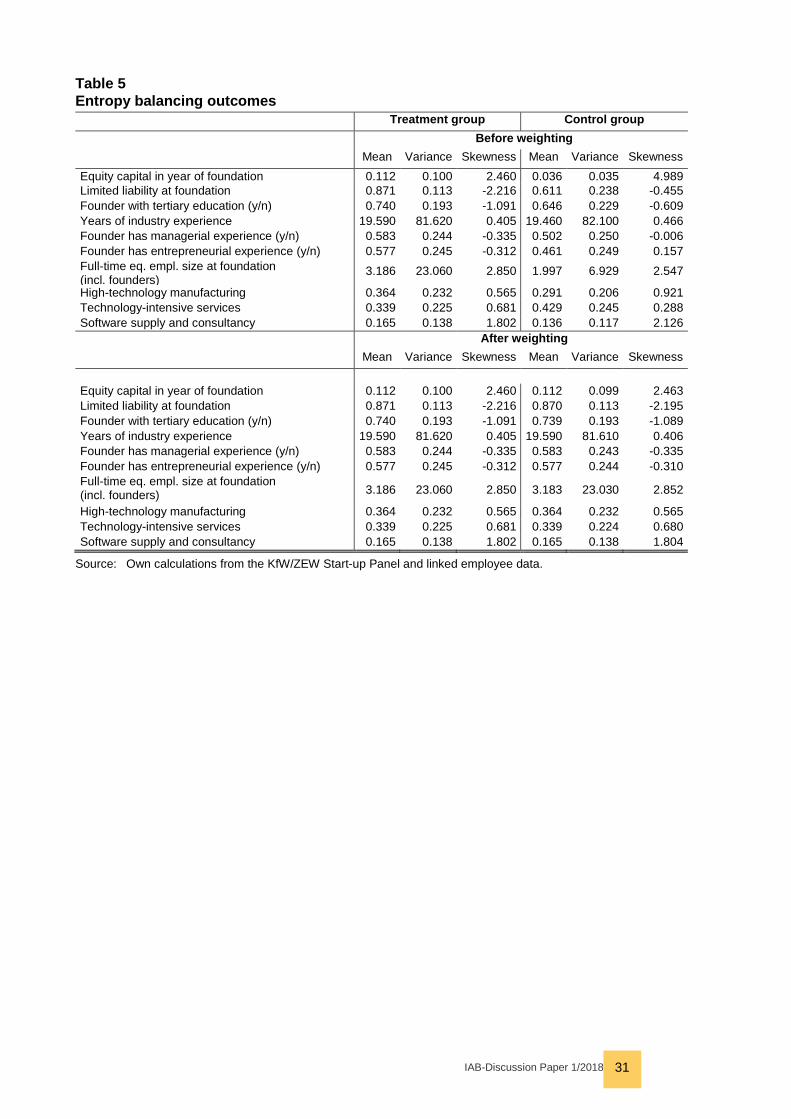
IAB-Discussion Paper 1/2018 31
Table 5 Entropy balancing outcomes Treatment group Control group Before weighting Mean Variance Skewness Mean Variance Skewness Equity capital in year of foundation 0.112 0.100 2.460 0.036 0.035 4.989 Limited liability at foundation 0.871 0.113 -2.216 0.611 0.238 -0.455 Founder with tertiary education (y/n) 0.740 0.193 -1.091 0.646 0.229 -0.609 Years of industry experience 19.590 81.620 0.405 19.460 82.100 0.466 Founder has managerial experience (y/n) 0.583 0.244 -0.335 0.502 0.250 -0.006 Founder has entrepreneurial experience (y/n) 0.577 0.245 -0.312 0.461 0.249 0.157 Full-time eq. empl. size at foundation (incl. founders)
3.186 23.060 2.850 1.997 6.929 2.547
High-technology manufacturing 0.364 0.232 0.565 0.291 0.206 0.921 Technology-intensive services 0.339 0.225 0.681 0.429 0.245 0.288 Software supply and consultancy 0.165 0.138 1.802 0.136 0.117 2.126 After weighting Mean Variance Skewness Mean Variance Skewness
Equity capital in year of foundation 0.112 0.100 2.460 0.112 0.099 2.463 Limited liability at foundation 0.871 0.113 -2.216 0.870 0.113 -2.195 Founder with tertiary education (y/n) 0.740 0.193 -1.091 0.739 0.193 -1.089 Years of industry experience 19.590 81.620 0.405 19.590 81.610 0.406 Founder has managerial experience (y/n) 0.583 0.244 -0.335 0.583 0.243 -0.335 Founder has entrepreneurial experience (y/n) 0.577 0.245 -0.312 0.577 0.244 -0.310 Full-time eq. empl. size at foundation (incl. founders) 3.186 23.060 2.850 3.183 23.030 2.852
High-technology manufacturing 0.364 0.232 0.565 0.364 0.232 0.565 Technology-intensive services 0.339 0.225 0.681 0.339 0.224 0.680 Software supply and consultancy 0.165 0.138 1.802 0.165 0.138 1.804
Source: Own calculations from the KfW/ZEW Start-up Panel and linked employee data.
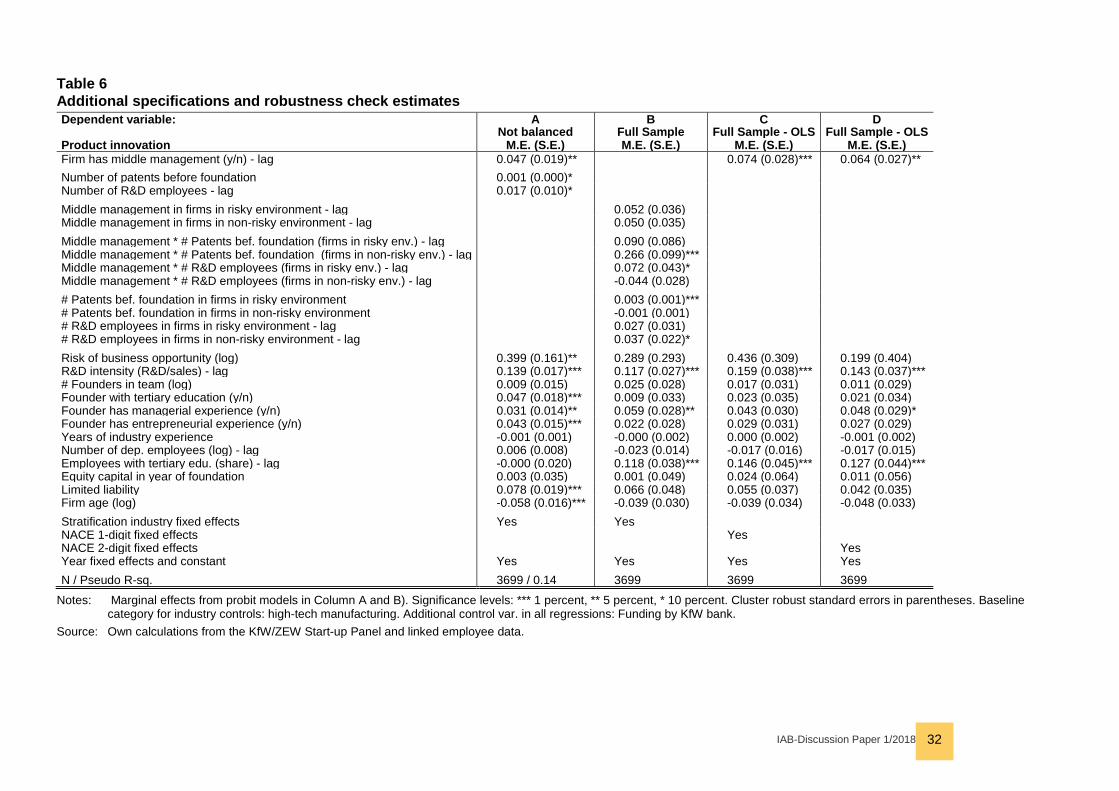
IAB-Discussion Paper 1/2018 32
Table 6 Additional specifications and robustness check estimates Dependent variable: A B C D
Not balanced Full Sample Full Sample - OLS Full Sample - OLS Product innovation M.E. (S.E.) M.E. (S.E.) M.E. (S.E.) M.E. (S.E.) Firm has middle management (y/n) - lag 0.047 (0.019)** 0.074 (0.028)*** 0.064 (0.027)** Number of patents before foundation 0.001 (0.000)* Number of R&D employees - lag 0.017 (0.010)* Middle management in firms in risky environment - lag 0.052 (0.036) Middle management in firms in non-risky environment - lag 0.050 (0.035) Middle management * # Patents bef. foundation (firms in risky env.) - lag 0.090 (0.086) Middle management * # Patents bef. foundation (firms in non-risky env.) - lag 0.266 (0.099)*** Middle management * # R&D employees (firms in risky env.) - lag 0.072 (0.043)* Middle management * # R&D employees (firms in non-risky env.) - lag -0.044 (0.028) # Patents bef. foundation in firms in risky environment 0.003 (0.001)*** # Patents bef. foundation in firms in non-risky environment -0.001 (0.001) # R&D employees in firms in risky environment - lag 0.027 (0.031) # R&D employees in firms in non-risky environment - lag 0.037 (0.022)* Risk of business opportunity (log) 0.399 (0.161)** 0.289 (0.293) 0.436 (0.309) 0.199 (0.404) R&D intensity (R&D/sales) - lag 0.139 (0.017)*** 0.117 (0.027)*** 0.159 (0.038)*** 0.143 (0.037)*** # Founders in team (log) 0.009 (0.015) 0.025 (0.028) 0.017 (0.031) 0.011 (0.029) Founder with tertiary education (y/n) 0.047 (0.018)*** 0.009 (0.033) 0.023 (0.035) 0.021 (0.034) Founder has managerial experience (y/n) 0.031 (0.014)** 0.059 (0.028)** 0.043 (0.030) 0.048 (0.029)* Founder has entrepreneurial experience (y/n) 0.043 (0.015)*** 0.022 (0.028) 0.029 (0.031) 0.027 (0.029) Years of industry experience -0.001 (0.001) -0.000 (0.002) 0.000 (0.002) -0.001 (0.002) Number of dep. employees (log) - lag 0.006 (0.008) -0.023 (0.014) -0.017 (0.016) -0.017 (0.015) Employees with tertiary edu. (share) - lag -0.000 (0.020) 0.118 (0.038)*** 0.146 (0.045)*** 0.127 (0.044)*** Equity capital in year of foundation 0.003 (0.035) 0.001 (0.049) 0.024 (0.064) 0.011 (0.056) Limited liability 0.078 (0.019)*** 0.066 (0.048) 0.055 (0.037) 0.042 (0.035) Firm age (log) -0.058 (0.016)*** -0.039 (0.030) -0.039 (0.034) -0.048 (0.033) Stratification industry fixed effects Yes Yes NACE 1-digit fixed effects Yes NACE 2-digit fixed effects Yes Year fixed effects and constant Yes Yes Yes Yes N / Pseudo R-sq. 3699 / 0.14 3699 3699 3699
Notes: Marginal effects from probit models in Column A and B). Significance levels: *** 1 percent, ** 5 percent, * 10 percent. Cluster robust standard errors in parentheses. Baseline category for industry controls: high-tech manufacturing. Additional control var. in all regressions: Funding by KfW bank.
Source: Own calculations from the KfW/ZEW Start-up Panel and linked employee data.
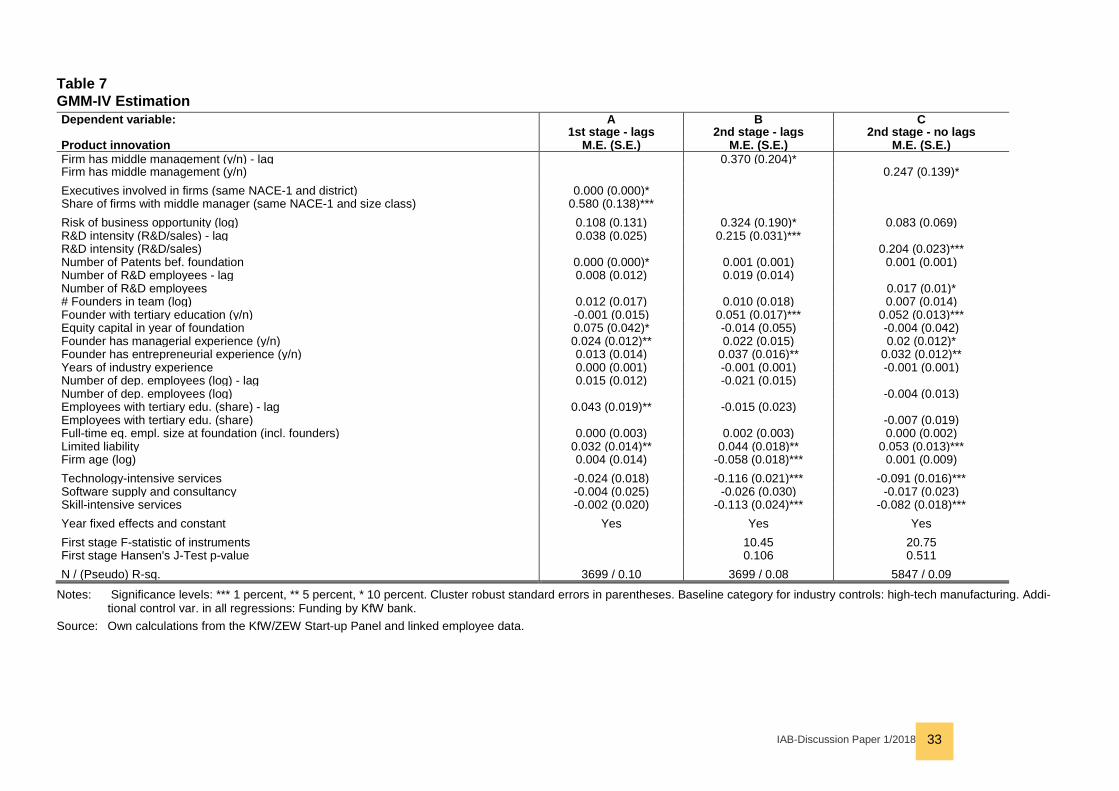
IAB-Discussion Paper 1/2018 33
Table 7 GMM-IV Estimation Dependent variable: A B C
1st stage - lags 2nd stage - lags 2nd stage - no lags Product innovation M.E. (S.E.) M.E. (S.E.) M.E. (S.E.) Firm has middle management (y/n) - lag 0.370 (0.204)* Firm has middle management (y/n) 0.247 (0.139)* Executives involved in firms (same NACE-1 and district) 0.000 (0.000)*
Share of firms with middle manager (same NACE-1 and size class) 0.580 (0.138)***
Risk of business opportunity (log) 0.108 (0.131) 0.324 (0.190)* 0.083 (0.069) R&D intensity (R&D/sales) - lag 0.038 (0.025) 0.215 (0.031)***
R&D intensity (R&D/sales) 0.204 (0.023)*** Number of Patents bef. foundation 0.000 (0.000)* 0.001 (0.001) 0.001 (0.001) Number of R&D employees - lag 0.008 (0.012) 0.019 (0.014)
Number of R&D employees 0.017 (0.01)* # Founders in team (log) 0.012 (0.017) 0.010 (0.018) 0.007 (0.014) Founder with tertiary education (y/n) -0.001 (0.015) 0.051 (0.017)*** 0.052 (0.013)*** Equity capital in year of foundation 0.075 (0.042)* -0.014 (0.055) -0.004 (0.042) Founder has managerial experience (y/n) 0.024 (0.012)** 0.022 (0.015) 0.02 (0.012)* Founder has entrepreneurial experience (y/n) 0.013 (0.014) 0.037 (0.016)** 0.032 (0.012)** Years of industry experience 0.000 (0.001) -0.001 (0.001) -0.001 (0.001) Number of dep. employees (log) - lag 0.015 (0.012) -0.021 (0.015)
Number of dep. employees (log) -0.004 (0.013) Employees with tertiary edu. (share) - lag 0.043 (0.019)** -0.015 (0.023)
Employees with tertiary edu. (share) -0.007 (0.019) Full-time eq. empl. size at foundation (incl. founders) 0.000 (0.003) 0.002 (0.003) 0.000 (0.002) Limited liability 0.032 (0.014)** 0.044 (0.018)** 0.053 (0.013)*** Firm age (log) 0.004 (0.014) -0.058 (0.018)*** 0.001 (0.009) Technology-intensive services -0.024 (0.018) -0.116 (0.021)*** -0.091 (0.016)*** Software supply and consultancy -0.004 (0.025) -0.026 (0.030) -0.017 (0.023) Skill-intensive services -0.002 (0.020) -0.113 (0.024)*** -0.082 (0.018)*** Year fixed effects and constant Yes Yes Yes First stage F-statistic of instruments 10.45 20.75 First stage Hansen's J-Test p-value 0.106 0.511 N / (Pseudo) R-sq. 3699 / 0.10 3699 / 0.08 5847 / 0.09
Notes: Significance levels: *** 1 percent, ** 5 percent, * 10 percent. Cluster robust standard errors in parentheses. Baseline category for industry controls: high-tech manufacturing. Addi-tional control var. in all regressions: Funding by KfW bank.
Source: Own calculations from the KfW/ZEW Start-up Panel and linked employee data.
IAB-Discussion Paper 1/2018 34
Appendix B: Entropy balancing
In contrast to other related methods, for instance propensity score weighting, entropy balancing induces covariate balance directly, and not as the result of a propensity score matching procedure, which requires iterated re-specifications of the propensity score estimation to achieve covariate balance. The sampling weights are chosen as the solution to the minimization problem
min𝑤𝑤𝑖𝑖
𝐻𝐻(𝑤𝑤) = � ℎ(𝑤𝑤𝑖𝑖){𝑖𝑖|𝐷𝐷=0}
Under the constraints that
∑ 𝑤𝑤𝑖𝑖𝑐𝑐𝑟𝑟𝑖𝑖(𝑋𝑋𝑖𝑖) = 𝑚𝑚𝑟𝑟�𝑖𝑖�𝐷𝐷 = 0� with 𝑟𝑟 ∈ 1, …𝑅𝑅 and
∑ 𝑤𝑤𝑖𝑖 = 1�𝑖𝑖�𝐷𝐷 = 0� and
𝑤𝑤𝑖𝑖 ≥ 0 for all 𝑖𝑖 such that 𝐷𝐷 = 0
𝑤𝑤𝑖𝑖 denotes the weights for each observation from the control group. ℎ(𝑤𝑤𝑖𝑖) is a dis-tance measure which measures the distance between the chosen weights and a set of base weights. 𝑤𝑤𝑖𝑖𝑐𝑐𝑟𝑟𝑖𝑖(𝑋𝑋𝑖𝑖) = 𝑚𝑚𝑟𝑟 denotes the balance constraints for the R moments to balance for each covariate (for further details we refer to Hainmueller, 2011; Hainmueller and Xu, 2013). Entropy balancing therefore induces covariance balance directly and explicitly minimizes the weight given to each observation from the control group.
IAB-Discussion Paper 1/2018 35
Recently published
No. Author(s) Title Date
20/2017 Wanger, S. What makes employees satisfied with their work-ing time?
6/17
21/2017 Kropp, P. Schwengler, B.
Stability of functional labour market regions 7/17
22/2017 Brunow, S. Hammer, A. Mc Cann, P.
Innovation and location in German knowledge in-tensive business service firms
7/17
23/2017 Gehrke, B. Weber, Enzo
Identifying asymmetric effects of labor market re-forms
7/17
24/2017 Brunow; S. externe
Creative and science oriented employees and firm innovation: A key for Smarter Cities?
8/17
25/2017 Brixy, U. Brunow, S. extern
Ethnic diversity in start-ups and its impact on in-novation
8/17
26/2017 Broszeit, S. Laible, M.-Ch.
Examining the Link Between Health Measures, Management Practices and Es-tablishment Per-formance
8/17
27/2017 Gehrke, B. Hochmuth, B.
Counteracting unemployment in crises - non-lin-ear effects of short-time work policy
9/17
28/2017 Carbonero, F. Weber, E. extern
The Fall of the Labour Income Share: the Role of Technological Change and Imperfect Labour Markets
9/17
29/2017 Weber, E. Zimmert, F.
The creation and resolution of working hour dis-crepancies over the life course
9/17
30/2017 Dauth, W. externe
German Robots – The Impact of Industrial Ro-bots on Workers
10/17
31/2017 Peters, C. Quantifying the effect of labor market size on learning externalities
10/17
32/2017 Hutter, C. Weber, E.
The Effects of Skill-Biased Technical Change on Productivity Flattening and Hours Worked
11/17
33/2017 Rebien, M. Stops, M. extern.
Formal Search and Referrals from a Firm’s Per-spective
11/17
34/2017 Schierholz, M. Kreuter, F. externe
Learning from Mouse Movements: Improving Questionnaire and Respondents’ User Experi-ence through Passive Data Collection
12/17
35/2017 Fedorets, A. Stops, M. Lottmann, F.
Job Matching on Connected Regional and Occu-pational Labor Markets
12/17
As per: 2017-12-19
For a full list, consult the IAB website http://www.iab.de/de/publikationen/discussion-paper.aspx
Imprint
IAB-Discussion Paper 01/20184 January 2018
Editorial addressInstitute for Employment Research of the Federal Employment AgencyRegensburger Straße 104D-90478 Nuremberg
Editorial staffRicardo Martinez Moya, Jutta Palm-Nowak
Technical completionRenate Martin
All rights reservedReproduction and distribution in any form, also in parts, requires the permission of IAB Nuremberg
Websitehttp://www.iab.de
Download of this Discussion Paperhttp://doku.iab.de/discussionpapers/2018/dp0118.pdf
ISSN 2195-2663 For further inquiries contact the author:
Martin MurmannPhone +49.911.179.7936E-mail [email protected]