the philippines in the 1980s: a review of national and urban level
TRANSCRIPT

TWURD WP #l
URBAN DEVELOPMENT DIVISION TRANSPORTATION, WATER, AND URBAN DEVELOPMENT DEPARTMENT
ENVIRONMENTALLY SUSTAINABLE DEVELOPMENT THE WORLD BANK
The Philippines in the 1980s: A Review of National and Urban Level Economic Reforms
Orville Solon and
Maria S. Floro
February 1993
WORKING PAPER
The TWURD Working Papers present preliminary research findings and are intended for internal review and discussion. The views and interpretations in these Working Papers are those of the author(s) and should not be attributed to the World Bank, to its affiliated organizations or to any individual acting on their behalf.

0 1993 The World Bank Washington, D.C.
All Rights Reserved First Printing February 1993
This is a document published informally by the World Bank. In order that the information contained in it can be presented with the least possible delay, the typescript has not been prepared in accordance with the procedures appropriate to formally printed texts, and the World Bank accepts no responsibility for errors.
The World Bank does not accept responsibility for the views expressed herein, which are those of the author and should not be attributed to the World Bank or to its affiliated organizations. The findings, interpretations, and conclusions are results of research supported by the Bank; they do not necessarily represent official policy of the Bank. The designation employed, the presentation of material, and any maps used in the document are purely for the convenience of the reader and do not imply the expression of any opinion whatsoever on the part of the World Bank or its affiliates concerning the legal status of any country, territory, city, area, or of its authorities, or concerning the delimitations of its boundaries or national affiliation.
This paper was prepared by Orville Solon, Univ. of the Philippines, and Maria S. Floro; consultant to the Urban Development Division.
The Philippines in the 1980s: A Review of National and Urban Level Economic Reforms
Orville Solon and
Maria S. Floro
WORKING PAPER

INTRODUCTION
This paper is one of a number of economic and social policy background papers written as part of the research project on “Urban Poverty and Social Policy in the Context of Adjustment” being undertaken by the Urban Development Division of the World Bank in Ecuador; Hungary, the Philippines and Zambia.
The purpose of this paper is to describe the economic reforms in the Philippines during the period 1980-1991. The review identifies and examines change at the macro level as well as the urban level. The paper intentionally uses both World Bank and other sources, many from the Philippines itself, to present different perspectives on the Philippines’ economic reform process during the past decade. It focuses on the important economic changes and their potential impacts on urban low-income communities during the period of reform.
There are three parts to this paper. The first section examines the overall structure of the economy as well as pertinent economic, demographic and social indicators. Section Two carefully examines the origins of the economic crisis in the early eighties and traces the reform path embarked on by the Philippine government since the first structural adjustment loan in 1980. Since the adjustment process is shaped by historical factors, the direction as well as pace of adjustment is linked to the initial conditions described in the first section. The third section provides a detailed description of the national and urban level changes as a result of the macroeconomic reform process undertaken by the Philippine government.
TABLE OF CONTENTS
I. STRUCTURE OF THE ECONOMY AND MACROECONOMIC PERFORMANCE
Resource Endowments Sectoral Composition of the Economy System of Ownership Economic and Social Indicators
II. ECONOMIC REFORM AND ADJUSTMENT
Period of Economic Growth (1970-79) 7 Early Period of Structural Adjustment (1980-82) 8 The Crisis Period (1983-85) 10 Period of Economic Recovery (1986-89) 12 Macroeconomic Developments (1989-90) 13
III. MESO-LEVEL TRENDS: CHANGES IN MARKETS AND SOCIAL INFRASTRUCTURES
Labor Force Participation Trends Employment Patterns
Unemployment and underemployment Changes in Real Earnings and Labor Market Flexibility Changes in Prices of Consumption Goods Changes in the Level and Composition of Public Expenditures Conclusions
REFERENCES
ANNEX A: Table Al. Minimum wage fixed in the Philippines by industry and by year of activity
1
1 2 3 4
7
17
17 19 19 20 22 22 24
25
29
ANNEX B: Maps, Tables, and Figures 31

I. STRUCTURE OF THE ECONOMY AND MACROECONOMIC PERFORMANCE
Resource Endowments
1.1 The Philippines is a country with a land area‘of approximately 300,000 square kilometers, 92.3 percent of which is located within the eleven largest islands. Much can be said about the country’s geographical features: an extensive coastline stretching 34,000 kilometers, the longest in the world; a diverse topography with high mountains and numerous valleys; and major lowland plains provide the arable land that makes the Philippines a basically agricultural country. Local air currents (NE and SE monsoon), the position of the islands, and the usual storm tracks affect the Philippine climate. At certain times of the year small streams swell up to three. times their size during rainy months causing damage to human life and crops. Still, the country remains dependent on agriculture as the main source of employment.
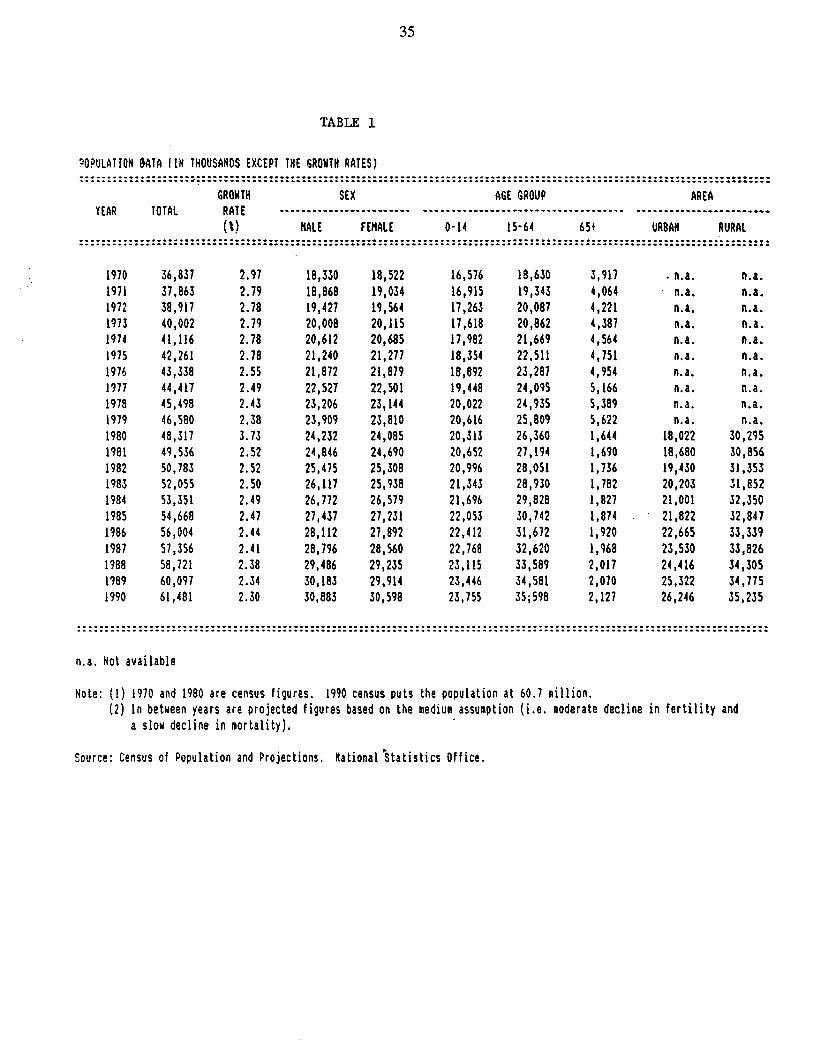
1.2 The Philippines has one of the fastest growing populations in the world, averaging 2.75 percent between 1970 and 1980 and slowing down but still at a relatively high average of 2.4 percent between 1980 and 1990 (see Table 1). Total population in 1990 stood at 60.7 million, almost double the 1970 figure of 36.8 million.’ By sex, the female population was greater than that of the male from 1970 to 1976, but the reverse was true thereafter. The female-male population ratio declined slightly from 1 .Ol in 1970 to 0.99 in 1980 and is projected to remain the same in the 1990s.
1.3 The rural-urban ratio was estimated to decline from 1.68 in 1980 to 1.34 in 1990. Rural- urban migration continues unabated as the total population in Metro Manila increased from 5 million in 1970 to 7.93 million in 1990, and that of nearby Region IV from 5.2 million to 8.3 million during the same period (see map attached).
1.4 The population of the Philippines is relatively young. The age cohort under 15 years of age comprised nearly 39 percent of the population while the age cohort 15-64 years represented nearly 58 percent of the population in 1990 (see Table 1).
1.5 In both urban and rural areas, the dependency ratio is inversely related to the household income (Hakim, 1991).* The dependency ratio for the bottom decile of the poiiulation distribution is 4.2 compared to 2.5 for the top decile (see Table 2). In the rural areas the corresponding ratios are 4.6 and 2.5. According to Hakim 199 1, the relatively high dependency ratio of poor households results from the combination of two elements: relatively large household sizes and the smaller number of employed household members.
1. The population count is taken from the Census of Population and Housing, May 1990, Manila.
2. Dependency ratio refers to the number of household members per employed individual in the family.

2
Sectoral Composition of the Economy
1.6 The growth trends in the agricultural, industrial, and service sectors were quite varied during the last two decades. Throughout the 1970s and the early 198Os, there had been a strong expansion of the modem industrial activity with agriculture lagging behind. However, growth rates in the industrial sector began to decline in 1984, falling from 38 percent in 1984 to 34 percent in 1987. This can be attributed to the economic crises of the early 1980s which primarily hit the manufacturing sector. During the period 1983-1985, there was a sharp contraction in the manufacturing sector growth. It declined from 32 percent in 1983 to 10 percent in 1984, and slipped further to 7.9 percent in 1985. This was due to the shortage of imported inputs and lack of access to capital. These factors, combined with the slump in demand brought about a build up in inventories which led to a contraction in production. Since the decline in manufacturing growth was faster than that of the service sector, the latter became the most dominant sector by the mid-eighties due to its largest percent contribution to total production despite output declines in 1984 and 1985.
1.7 The pattern of sectoral composition is not reflected in the trends in sectoral employment. The agriculture sector consistently accounted for at least 50 percent of total employment in the 1970s. The second biggest employer was the services sector, whose share in total employment increased over the years especially during the 1980s. This can be attributed to the expansion of government services in the 1970s and informal sector services during the crisis years of 1983-1985. Industrial employment reflected the capital intensive nature of rapid industrialization as the sector only accounted for 14-l 5 percent of total employment.
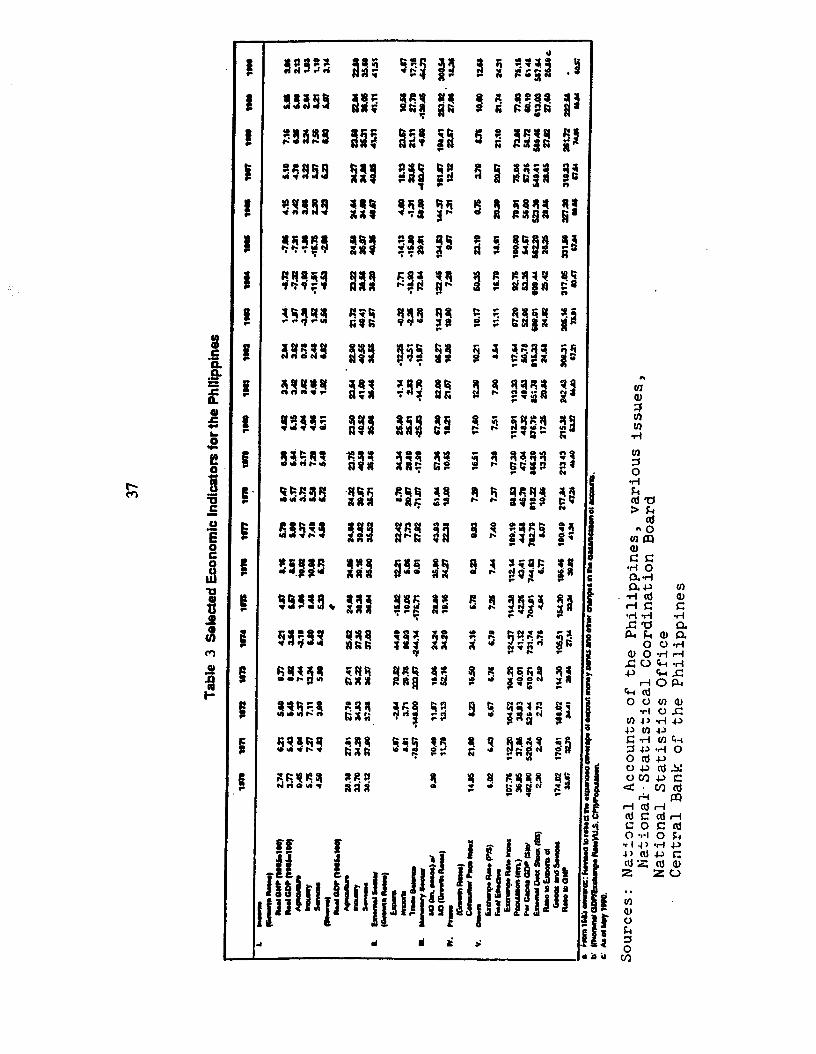
1.8 The level and composition of the trade sector also varied during the past two decades. In the 1970s and 198Os, the growth of total exports ranged between -15 and 70 percent (see Table 3). The growth of exports dropped sharply in 1982 and 1984, to 12 percent and 14 percent respectively. However, this subsector recovered by 1988 when the growth rate climbed to 23.7 percent.
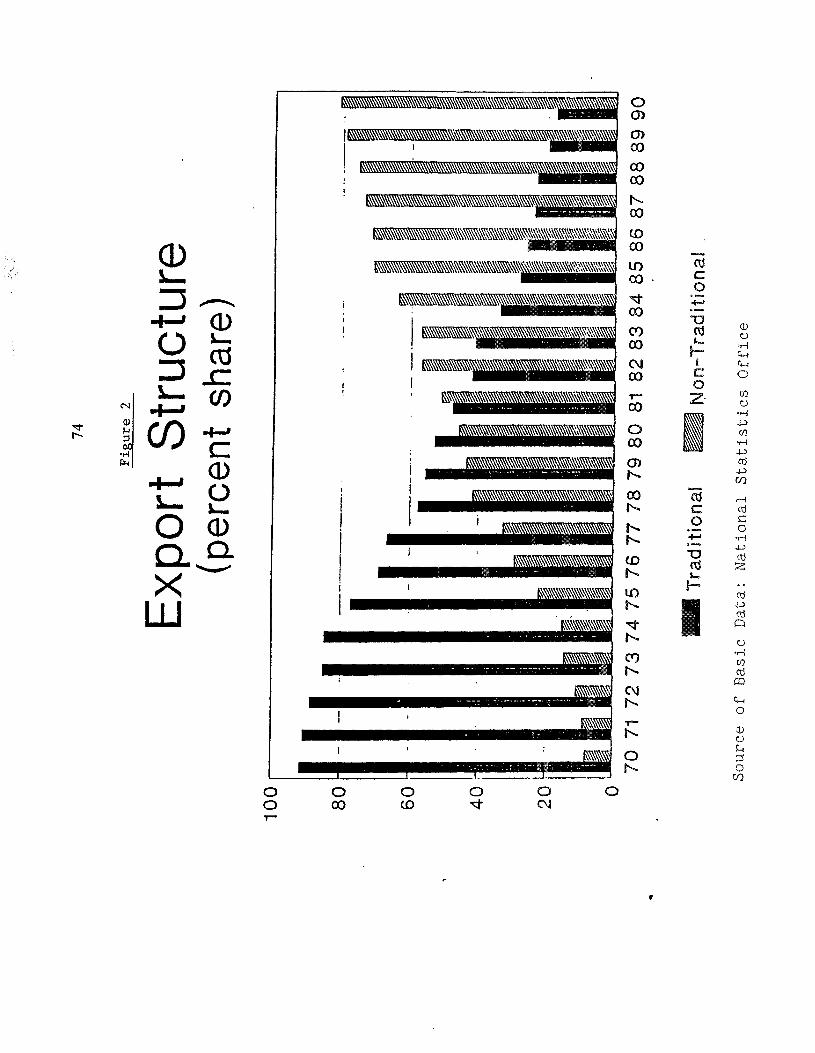
1.9 Despite the seemingly inconclusive performance of total exports, its components demonstrate a shift from traditional exports such as sugar, coconuts, and logs in the 1970s to non-traditional exports such as light manufactures in the 1980s (see Table 4 and Figure 2). The annual growth in traditional exports has been consistently lower than that of non-traditional exports during the period 1970-1990.
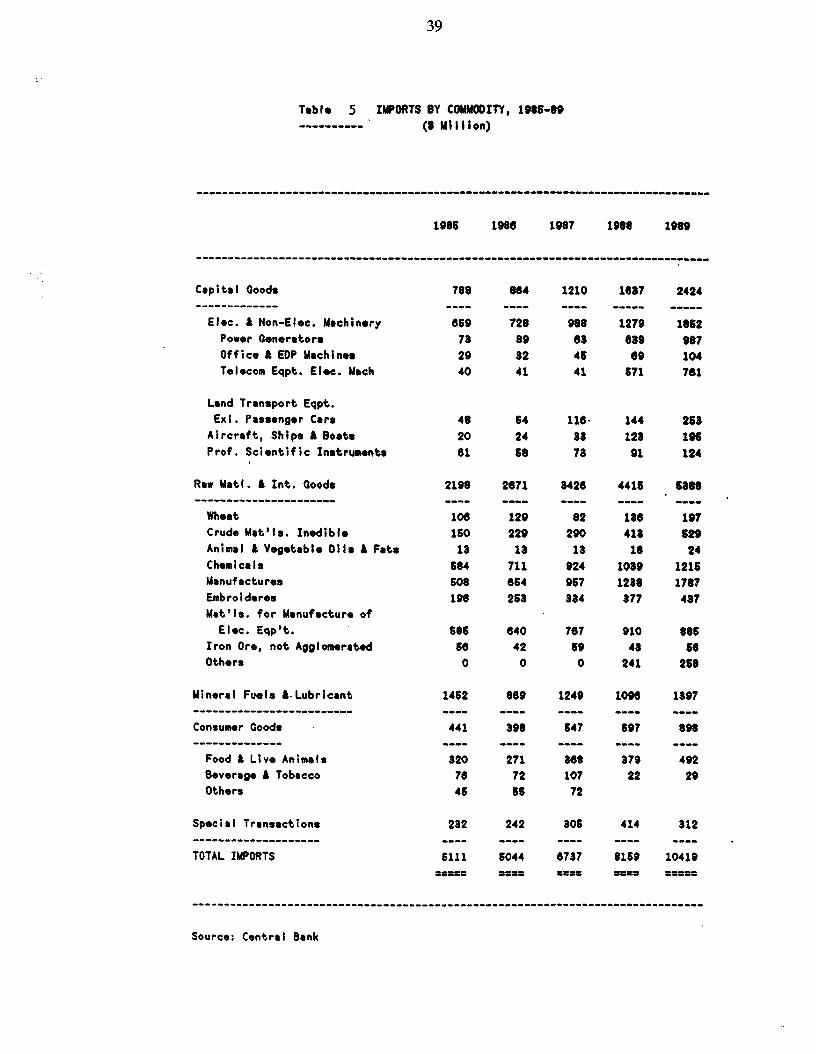
1.10 The imports sector, which posted declining growth during 198 l-l 985 is dominated by the raw materials category (see Table 5 and Figure 3). Its share to total imports had been over 33 percent in the past two decades. Imports of capital goods, especially electric and non-electric machinery ranked second. The early 1980s showed the rise in the share of imports of mineral fuels and lubricants. However, by the late 198Os, the share of imports of raw materials slowly began rising again. Consumer goods remained the least important category, having a share not exceeding 14 percent in two decades.

3
System of Ownership
1.11 The Philippine system of ownership is primarily based on private property rights, although in parts of the rural areas where cultural minorities live as well as in the Muslim South, the communal system still prevails. Property rights, however, remain ill-defined especially in the rural areas where only 50 percent of the private agricultural land has been under cadastral survey. The current distribution of land, moreover, has consistently been highly skewed (see Table 6). Over half of the farms occupy only 16 percent of the land area; two-thirds of the poor farmers are full or partial tenants. In addition, there is a growing number of landless workers (estimated conservatively at 1.5 million families) who lack access to land, particularly in the sugar growing areas. Increased concentration of land has accompanied the growing phenomenon of landlessness, despite the implementation of various land reform programs during the period 1956-1984 to address this problem. As rural poverty continues to worsen, there is heightened pressure for agrarian reform. The Presidential Executive Orders (E.O. 228) which was signed in 1988 outlined a comprehensive agrarian reform program (CARP).3
1.12 The majority of the enterprises in the Philippines operate in the private sector. In the last two decades, with the promotion of foreign investment, there has been increased participation of foreign capital in commercial agriculture as well as in the industrial and financial sectors. The domestic private sector includes tens of thousands of small-factory owners and entrepreneurs and a few dozen large domestic organizations. The former have traditionally served as the backbone of the consumer goods sector, producing textiles, clothing, shoes, processed food, and other items. Operating on small margins, they have been highly vulnerable to the tariff reforms and other trade liberalization measures. The larger conglomerates have their roots in Chinese capital and grew rapidly during the import-substitution period of the 1950s and early 1960s.
1.13 During the last two decades, the operation of transnational enterprises has dramatically grown in significance (Kunio, 1985). Their rise had reduced the role of the domestic private sector, particularly the small enterprises by the early 198Os, either through competition or through acquisition under joint ventureship. They dominate the food processing industries, certain export crops, pharmaceutical, petroleum, banking and investment houses, metals, machinery and equipment.
3. The Republic Act No. 6,657 which was signed in June 1988, defines more fully the scope and priorities of the program including: the distribution of foreclosed and sequestered land, sugar and coconut lands and giving titles to squatters on public lands; the retention limits; exceptions and exclusions; basis for land valuation; the privileges granted to multinationals and commercial firms; and administrative mechanisms. Under this agrarian reform program, rice and corn landowners would be compensated through ten-year bonds with market interest rates. If there are no strong contests by landowners and no major loopholes, a fully implemented CARP could cover 4.4 million hectares of which 3.3 million are coconut and sugar lands.

Economic and Social Indicators
1.14 In the 197Os, GDP grew by at least 5 percent except in 1970 and 1974 when it grew by approximately 4 percent. Real per capita GDP averaged $680 during this period. The 1980s showed a rather uneven performance of the economy as GDP growth ranged from -7 percent in 1984 and 1985 to 6 percent in 1988. During the first five years of the 1980s there was a chronic deterioration in economic performance as 1984 and 1985 posted negative growth. The second half of the 1980s showed increases in growth until 1990. Per capita GDP for 1980-1982 averaged $848. From 1983 to 1990, however, per capita GDP tapered off to $587 mainly due to the combined effects of the deterioration in exchange rate as well as slow growth in output production.
1.15 The availability and easy access of relatively low-interest external credit during the 1970s and the country’s heavy reliance on foreign funds for financing its growth strategies before 1983 resulted in a sharp rise in the overall level of external debt. The Philippines today ranks as one of the world’s most heavily indebted countries. Total debt rose from $13 billion at the end of 1979 to $29 billion at the end of 1989. After reaching a peak of 42 percent of exports of goods and services in 1982, debt service was 30 percent in 1989 (see Table 7). This was largely the result of a series of official and private rescheduling reached over the past three years.4
1.16 Table 8 presents selected social indicators for the period 1965-1990. According to the World Bank estimates, more than two-thirds of the population have access to health care which is slightly higher than the average for lower middle income countries. The infant mortality rate has been drastically reduced from 60 percent in 1970 to 45.1 percent in 1980 and it was estimated to be 30.1 percent in 1988. It is believed that this is largely a result of improved health practices. As Table 8 also indicates, female life expectancy at birth continues to increase and is above the overall rate. Average-daily calorie intake per person in the Philippines is approximately 2,200.
1.17 In terms of educational attainment, the Philippines has one of the highest literacy rates among developing countries. More than 85 percent of the population are literate and this is true for both males and females. This makes the Philippines not only well-endowed in natural resources but in human capital resources as well.
1 .18 Despite the relative abundance of resource endowments, nearly half of the Philippine population live below the poverty line? Based on Table 9, the official estimates of the incidence
4. The Philippines obtained rescheduling in 1984 and 1986 from the Paris Club, totalling about $1.2 billion in relief. A third rescheduling agreement in 1989 amounted to approximately $2 billion over 1989-92.
5. There are several calculations of poverty lines in the Philippines. This suggests that to some extent, their estimation method is chosen somewhat arbitrarily and that great caution must be exerted in their application. The offkial poverty line calculated by the Technical Working Group on Poverty, which includes functionaries from three institutions namely: National Economic Development Authority (NEDA), National Statistics Office (NSO), and the
5
of poverty rose from 49 percent to 58 percent between 1971 and 1985.6 Using the 1985 and 1988 family income and expenditure surveys (FIES) survey data, Hakim (1991) estimated that the poverty incidence in terms of the number of households fell during the period 1985-88. For rural households, it dropped from 63 percent to 55 percent and for urban households, from 5 1.2 percent to 38.7 percent (see Table 10). The figures suggest that poverty was still concentrated in the rural areas. In terms of the number of people, poverty incidence has fallen from 64 percent to 54 percent for the population as a whole during the same period. The fact that poverty incidence is higher in terms of individuals than households indicates that poor households tend to be larger than the average Filipino household.
1.19 Comparing the age structure of households in various income categories in both rural and urban areas, Hakim (1991) found that poorer families tend to be younger and more likely to have all of their children within the same household.’ The more wealthy families are relatively older with some of their children having formed their own nuclear families. In the urban areas, the number of family members less than 15 years old decreases when income per capita increases. The same pattern is repeated in the rural areas, where households in the lowest income group have on average two household members aged less than 15 years old, representing 30 percent of the household size, compared to 0.68 persons or 16 percent of household size in the top tenth decile.
1.20 The poverty profile by geographical region shows that the highest poverty incidence, among urban families, occurs in Eastern Samar, followed by the Visayas, Bicol and Western Mindanao (see Table 10). In terms of the absolute number of poor households, the National Capital Region (Metro Manila) accounts for the highest proportion with over 20 percent of the urban poor. But in terms of the rate of decline in the number of poor households, the national capital region (Metro Manila) shows the largest rate of decline, almost twice the national average.
1.21 The households with incomes below the poverty line do not constitute a homogeneous group. Table 11 presents some characteristics for each per capita quartile group. First, the poverty level is related to household size and dependency ratios (number of persons in the family per employed member). The larger the family, and the higher its dependency ratio, the poorer it is. Second, wage income is inversely related to poverty level, the poorer the family, the smaller its share of wage income, and the larger its share of self-employed income. This is true as well for
Food and Nutrition Research Institute (FNRI) has been adopted here as the threshold defining who is poor and who is not. Income is used as the relevant variable to determine whether a family is poor or not.
6. The World Bank estimates, however, show an increase in urban poverty incidence and no change in the rural areas (World Bank, 1988b). Poverty incidence for the country as a whole remains unchanged due to the shift of population from rural to urban areas.
7. Hakim’s study utilized the Family Income and Expenditure Surveys (FIES) conducted by the National Statistics Office for 1985 and 1988. The two surveys have the same sampling design which made it suitable for comparative purposes. The sample size of the 1985 and 1988 FIES consists of 17,495 and 19,897 families respectively.

6
the number of wage workers in the household. The poorer families tend to have proportionally fewer members engaged in wage activities. Third, there is a clear inverse relation between the degree of poverty and the amount of schooling. Only 8 percent of the household heads had educational training above high school. This proportion increases continuously with the level of income and in the fourth quartile becomes 18 percent.
1.22 Poverty in the Philippines is not only a reflection of low average incomes but also a result of a highly unequal distribution of income. Although income distribution improved over the 1971-85 period, the ilippines is still among the most unequal of middle income countries. Table 12 shows that the average real incomes of the lowest five deciles increased slightly over the period, 1971-1985 while there was a drop in the average income of the highest deciles. In spite of these changes, by 1985, the top decile of the population had more than 15’ times the income of the lowest decile. Since then, the overall income distribution as measured by the Gini coefficient, has changed only marginally from 0.446 in 1985 to 0.441 in 1988.* The coefficient is higher in the urban areas indicating a much worse income distribution (see Table 13). However, the incidence of poverty in the rural areas is much higher. Over the last twenty-five years, rural incomes represented only 47 percent of the average urban income, compared to 40 percent in 1961. National poverty incidence declined slightly although the number of families increased.
8. The National Statistics Office (NSO) calculated the Gini coefficients using grouped data. Hakim’s (1991) independent estimation is based on integrating a parametized Lorenz curve. The parameters in this case were obtained from a regression on the full sample, not on grouped data. His calculations yielded a Gini index of 0.4567 in 1988 compared to 0.4596 in 1985.

II. ECONOMIC REFORMS AND ADJUSTMENT
2.1 The trends in the Philippine economic performance for 1980-1990 can be analyzed in the context of various external and internal “shocks” in foreign exchange availability and the response of the government by way of macroeconomic reforms. This entails subdividing the last decade into five sub-periods namely: a) period of economic growth (1970-79); b) early period of structural adjustment (198082); c) the crisis period and the concomitant stabilization attempts (1983-85); d) the period of economic recovery (1986-89); and e) recent macroeconomic developments (1989-90). A summary of external and internal shocks and the corresponding policy responses is presented in Table 14.
Period of Economic Growth (1970-79)
2.2 The decade of the 1970s started off with a major economic crisis. The Philippines faced its first debt crisis accompanied by a balance of payments deterioration which started in 1968. These problems eventually brought about a 50 percent devaluation of the peso and double digit inflation never before experienced in Philippine history.
2.3 During the first half of the 197Os, GDP grew by approximately 5 percent. The moderate growth performance was a result of the export promotion strategy adopted by the Marcos government which got its boost from the flow of foreign investment into the country. At the same time, however, there was accelerated inflation caused mainly by the devaluation and the first oil price hike. Inflation was further fueled by expansionary monetary and fiscal policies. It was also during this period in 1972 that martial law was declared.
2.4 There was a quick turnaround in the economy’s performance during the 1975-1979 period. The Philippines then attained an average growth rate of 6.2 percent which was largely a result of the very high growth in the industrial sector, particularly in the manufacturing (8.48 percent) and construction (20.72 percent) subsectors.
2.5 During this period, industrial development was largely based on a protectionist incentive structure under the import substitution program and massive support from public investment in infrastructure and energy. A supply-led external finance boom followed, financed largely by low- interest, short-term foreign loans mainly from commercial creditors. By 1979, the external debt stood at $13.35 M almost tripling from $4.9 M in 1975. The ratio of external debt to GNP reached 45.18 percent in 1979 from 25.52 percent in 1974.
2.6 Influenced by the dramatic rise of the neighboring newly industrialized countries (NICs) and by the heavy sector support of multilateral agencies (the World Bank in particular), specific government support programs were also set up to promote non-traditional manufactured exports resulting in the success of a few branches of industry (i.e., garments and electronics). Combined shares of garments and electronics to total exports grew from nil in 1970 to 18 percent in 1979. As mentioned earlier, there had been a shift from traditional to non-traditional exports, and this decade showed signs of transition (see Figure 2).
2.7 The plummeting commodity prices (especially of sugar) in 1974 could well have been a blessing in disguise since it provided further incentive for the economy to shift to non-traditional manufactured exports. Overall, exports grew at an average rate of 12.4 percent annually between 1975-79. Although achieving partial success, the export diversification strategy of the Marcos government, which centered around garments and electronics, had a fundamental shortcoming in that they were highly import dependent for their intermediate inputs. This, coupled with the high import content of the non-tradables where most investments had been channeled, resulted in an even higher growth for imports surpassing the record high growth of exports in 1974. As a result, the country faced a trade deficit with levels averaging $616.7 M for the 1970s.
2.8 In addition to the deteriorating terms of trade, double-digit inflation rates dominated the 1970s. It started off at 14.85 percent in 1970 peaking at 34.16 percent in 1974 during the oil crisis. With a relatively high growth during the 1975-1979 period, inflation was trimmed down to single-digit levels averaging at 8.31 percent from 1975-1978 until 1979 when it shot up to 16.5 1 percent.
2.9 In sum, the country experienced rapid economic growth during the 1970s. This was accompanied, however, by a development strategy that produced severe distortions in the pattern of incentives and in the existing mwkets (World Bank, 1991b). The growth pattern emphasized capital-intensive, import-substitution activities and discouraged agricultural and export development. Moreover, the economy became heavily dependent on imports, foreign capital and foreign loans. As a result, the high growth of the 1970s has been associated with declining real wages and growing levels of poverty and unemployment.
Early Period of Structural Adjustment (198tb1982)
2.10 Given the evolving market distortions and structural rigidities created in the 197Os, the economy did not adjust well to the severe external shocks of the post-1979 period. These included the high oil prices (after the second oil price hike), the steep increase in the world interest rates, the declining export prices, the recession in industrialized countries and the additional short-term loan supply shock.’
2.11 In addition, there was an internal shock resulting from the previous period’s external finance boom and the financial crisis which arose from the excessive financial leverage of public and private firms in 198 1. The government’s attempt to selectively bail out favored and distressed firms led to a severe loss of private investment and massive private capital outflows.
2.12 In 1980, the Philippine economy began to experience the main symptoms of an economic crisis, namely:
9. Similar to the start of the previous decade, the 1980’s commenced with another crisis-the lag effects of the second oil shock in 1979-1980 which slowed down external finance as restrictive monetary policies in developed countries brought the sharp rise in interest rates.
9
l Declining growth rates.
l Deteriorating terms of trade.
l Rising inflation.
l Growing Balance of Payments deficit.
l Accumulating large external debt.
2.13 In particular, the economy slowed down during the period 1980-l 982 to an average growth of 3.57 percent. Real GNP growth rate dropped from 4.62 percent in 1980 to 2.84 percent in 1982. There was also a decline in net factor income from abroad as real GDP growth fell from 5.15 percent in 1980 to 3.62 percent in 1982.
2.14 During that year, a stand-by arrangement with the International Monetary Fund (IMF) and the first Structural Adjustment Loan (SAL I) amounting to $200 million were obtained by the Philippine government. As a result, several measures were adopted to move the Philippine economy towards a more market-oriented one. These included:
l Liberalization of interest rates to reflect market conditions.
l Lowering of tariff levels from an average of 43 percent to 28 percent.
l Removal of many trade restrictions.
l Removal of price controls on agricultural output and inputs.
l Elimination of direct government investment in capital intensive industries.
l Adoption of a market-oriented exchange rate.
2.15 Launched in 1981, the restructuring of the trade sector started with the implementation of the tariff reform program. This was to be completed with the lifting of quantitative restrictions (QRs) on imports and the abolition of all export taxes except on logs. It also called for the reduction of tariff rates from a maximum of 100 percent to only a peak of 50 percent and a floor rate of 10 percent by 1985.
2.16 The period 1980-1982 was crucial to the financial sector as well. Together with the implementation of trade reforms was the adoption of the financial liberalization policy. One particular feature was an offshoot of a joint IMF-World Bank Report on the financial sector of the economy that introduced a new type of banking called universal banking or unibanks for short. The unibanks were allowed to perform both investment and banking functions. Interest rate

10
liberalization which began in 1981 was completed in 1983 with the lifting of the ceilings on interest rates on short-term loans.
2.17 In 1981, the financial system was shaken by the fleeing of a rich financial tycoon leaving millions of dollars in debt in various Philippine banks. This generated panic among money market investors and depositors and led to massive withdrawals. The financial panic eventually brought many investment houses, off-shore banking units and commercial banks into trouble.
2.18 From the point of view of the World Bank, however, this early period of structural adjustment was characterized mainly by a gradual removal of major controls and distortions affecting factor and commodity prices. While progress was not always smooth, nor without some temporary back-tracking, the incentive structure was laid as the basis for a better pattern of growth.
The Crisis Period (1983-W)
2.19 The Philippine economy reached a crisis situation in 1983. Although GNP and exports were rapidly expanding during the 197Os, the underlying structural weaknesses in the economy persisted, such as:
l Manufacturing expansion largely occurred in highly protected sectors.
l The incentive system was not conducive to a broad-based export expansion.
l Increased government participation in productive activities.
l Increased government reliance on external sources of finance with external debt increasing from 5 billion in 1975 to 24 billion in 1982.
2.20 The assassination of Senator Benign0 Aquino (a key leader of the opposition) in August 1983 hastened the slide of the economy into recession. The imminent political and economic unrest finally erupted along with the stoppage of medium and long-term loans in 1983.
2.21 A major balance of payments crisis thus emerged during this period with the fall in the terms of trade and the contraction of available external financing. Growing import requirements were not met with higher export receipts. Growing fiscal deficits persisted. Following the Aquino assassination, the external debt problem came into the open as commercial lenders refused to roll over short-term credits or extend new loans. External debt rose to $28.4 M in 1983 from $24.5 M in 1982. The capital flight that followed the political crisis further exacerbated the balance of payments problem.
2.22 The government was thus forced to declare a moratorium on its debt payments and agreed to undertake an IMF-World Bank stabilization program. In 1983, the Philippines received its second SAL amounting to $302.3 million as well as its second stand-by arrangement with the
11
IMF, to be followed a year later by an agricultural sector loan of $150 million and a third stand- by arrangement. The main instruments for stabilization included drastic cuts in public expenditures and restrictive monetary policies. In addition, there was a devaluation of the peso and a sharp increase in interest rates.
2.23 The economy began to contract with a decline in GNP of 8.7 percent and 7.1 percent in 1984 and 1985, respectively. The hardest hit was the industrial sector which decelerated at 11.5 percent and 15.8 percent in 1984 and 1985, respectively. Real per capita GDP dipped to $562 in 1985 from $877 in 1980. The growth of money supply (M3) went down to 7.8 and 9.9 percent in 1984, and 1985, respectively, from around 20 percent in 1982. Government expenditures which were heavily cut, were offset to some extent by increased transfers to poorly performing public enterprises. This period gave way to a shattered political regime as its supporters broke-apart due to the economic recession, which particularly affected the manufacturing industry.
2.24 The crisis also caused a series of devaluations from 1983- 1985. To further discourage imports and arrest capital flight, the peso was devalued three times between June 1983 and June 1984. This series of devaluations, along with contractionary fiscal policies, helped boost export growth.
2.25 Although the country had a trade deficit during the 1982-1984 period, the gap narrowed from $2,646 M in 1982 to $679 M in 1984. The narrowing of the trade gap was largely the result of immediate policy responses of the government. Contrary to World Bank recommendations, stringent foreign exchange restrictions and wide ranging import controls were adopted. These included the creation of a foreign pool for priority import payments by requiring banks to sell 100 percent of their foreign exchange receipts to the Central Bank and the setting up of priorities in the allocation of foreign exchange.
2.26 Deceleration in the growth of imports began in 1982 and peaked at 18.9 percent in 1984, with import of capital goods having the largest contraction at 32.3 percent. On the other hand, total exports grew in 1984 at 7.7 percent. This can be attributed to the 25.3 percent growth in the exports of non-traditional manufactures. The level of growth in exports more than offset the degree of deceleration in imports, and the trade balance, although still in deficit, grew to a record high of 72.6 percent in 1984.
2.27 In 1984, a high interest rate policy was officially instituted to check exchange rate movements and bring back private savings from abroad. This mainly affected the production costs as the inflation rate accelerated from about 10 percent in 1982 to 50.35 percent and 23.1 percent in 1984 and 1985, respectively.
2.28 The recession was especially hard on the poor. A World Bank study showed that 59 percent of Filipino families lived below poverty levels in 1985. This, as the World Bank Country Economic Memorandum indicates, was due to increasing underemployment, inflation and overvaluation of the exchange rate. If the adjustment had been undertaken before, and if the stabilization had been done through a greater reliance on the exchange rate and supply enhancing
12
policies, the income of the poor could have been sheltered from this drop in production activity. The impact of such adjustment on the poor could have been minimized if there was an accompanying set of social safety net measures to mitigate the impact, and if the drop in government expenditures had been accompanied by a drastic change in the composition of public expenditures. The latter were largely benefitting higher income groups because of the type of social services and investment projects in which the government was involved.
2.29 In sum, the negative macroeconomic developments for 1983-85 were as follows:
l Decline in GNP of 6.8 percent in 1984 and 3.8 percent in 1985.
l Total investment also dropped from 27.1 percent of GNP to 16.5 percent in 1985 with public investment down to 3.6 percent from 7.7 percent and private investment down by 6.8 percent of GNP.
l Inflation surged from 10 percent in 1983 to 50 percent in 1984.
l Real interest rates went up from 7 percent in 1982 to 21 percent in 1985.
l External debt rose by 8 percent of GNP.
l Increase in poverty due to the sharp increase in underemployment and a decline in real GDP to 1975 levels.
Period of Economic Recovery (1986439)
2.30 During 1986-89, the economy recovered across a broad front.
l GDP grew steadily.
l Consumption and investment grew.
l Inflation was controlled at an average of 4.5 percent over 1986-88.
l Current account deficit and the fiscal deficit were reduced to earlier levels.
l The bulk of debt repayments was postponed to 1992 and about $1.6 billion of the debt was retired, which led to a reduction of the external debt by about 17 percent of GNP.
l Moreover, poverty was reduced from 59 percent to 49 percent of all households.
13
2.31 Demand-led economic recovery characterized the 19861989 period. With the toppling of the Marcos regime, confidence was slowly setting in. From an average decline in GNP of 4.7 percent for the previous period, the economy recovered to a 5.1 percent growth in 1986-1990. From 1986 to 1989, real per capita GDP had inched its way to $613 in 1989 from $523 in 1986. However, in 1990, it dipped to $587 mainly because of the combined effects of low growth in 1990 (2 percent) and the steep devaluation of the official exchange rate.
2.32 The recovery and its consolidation was attributed by the World Bank to sound economic management and a bold series of reforms undertaken by the government. These included:
l Tight fiscal policies which increased taxes and reduced government expenditures.
l Tight monetary policy which limited growth of money supply.
l Responsible external debt management initiatives in the form of commercial and Paris Club rescheduling and debt-equity swaps.
2.33 These achievements were considered by the World Bank to be impressive; among the indebted countries, the adjustment performance of the Philippines ranks near the top. Its growth has been relatively high and stable compared to Argentina, Brazil, and Mexico. Its fiscal adjustment has been deeper and more consistent, its inflation lower and less volatile, and its external debt reduction faster.
2.34 Interestingly however, Filipino economic analysts attributed the economic recovery to a short-term expansion of consumption, fed by current government spending and to a lesser extent, real private income growth with increasing wages and very low inflation (0.8 percent in 1986 and 3.8 percent in 1987). Recovery was supported by the euphoria of a new administration, the restoration of business confidence, and increasing support of bilateral and multilateral donors.
2.35 In addition, a favorable external economic environment helped boost imports and industrial growth as world prices for crude oil fell in late 1987, coconut prices recovered, and the U.S. sugar quota to the Philippines was increased in 1986. However, by 1988 the economy had reached its full capacity and supply bottlenecks emerged. The inflation rate rose from 3.8 percent in 1987 to 12.7 percent in 1990.
Macroeconomic Developments in 1989-90
2.36 Macroeconomic performance since 1989 has been disappointing compared to the achievements of 1986-88. Some of the more disturbing trends are the following:
l Fiscal deficit rose from 3.1 percent of GDP in 1988 to 5 percent by the first half of 1990.

14
l Current account deficit rose from 1 percent of GDP to almost 5 percent of GDP by 1990.
l GDP growth slowed down from 6.4 percent in 1988 to less than 3 percent in 1990.
l Inflation increased from 8.8 percent in 1988 to 13 percent in 1990.
l Domestic debt rose from 19 percent of GDP in 1985 to 24.6 percent in 1989.
2.37 Despite significant fiscal adjustment, these macroeconomic problems surfaced, according to the assessment of the World Bank, as a result of:
l Limited access to external finance.
l Low yield of the public revenue system.
l Increased expenditures on social services to address pressing infrastructure and poverty problems.
l Appreciation of the exchange rate relative to its key competitors.
l Decreased market share in the developed countries’ markets.
2.38 In addition, there were exogenous shocks. A prolonged drought lasting over the winter and spring months of 1989-90 substantially reduced crop output. The drought was also partly responsible for shortages in power availability which in turn reduced growth in industrial output. A strong earthquake in July of 1990 caused considerable damage in Central Luzon. Turmoil in the Middle East caused the price of oil to jump by almost 50 percent. More recently, a major volcanic eruption in June 1991 wrought extensive damage in several thousand acres of forest, farmland, cities, infrastructure, and U.S. bases in Luzon.
2.39 The government recently revised its adjustment program and endorsed various measures to deal with these trends. They included:
l Raising tax and non-tax revenues on:
. “sin” products (e.g. tobacco and alcohol) as well as soft drinks;
. real estate transfers; * purchases of luxury items; - forestry charges; * business income tax; and . other fees and charges of selected government agencies.

15
. Reducing expenditures by:
. cuts in administrative expenses; s personnel hiring freezes in most departments (except education, health
and revenue collection); . wage and salary freeze for the public sector; * 8 percent cap on the increases in the wage bill; . substantial reduction of capital outlays under the comprehensive
agrarian reform program (CARP).
l Eliminating the oil price stabilization fund and deregulate oil prices.
l Reducing interest rates by adopting a more competitive exchange rate policy, reducing financial intermediation taxes and increasing competition in the T-Bill auction system.
l Increasing economic efficiency by rendering the trade regime more open vis-a- vis.
l Eliminating of the remaining quantitative restrictions on imports; and
l Reducing the level and dispersion of tariff rates.
l Improving investment incentives by:
. significantly reducing the number of business categories in which foreign investment is prohibited;
. re-opening of debt-equity swap facilities (the availability of such facilities was responsible for much of the increase in foreign investment observed in 1988 and 1989).
l Improving export promotion by:
* providing incentives to a wider range of exporters, including indirect exporters as well as those who export a small proportion of their total production;
. improving export financing facilities by introducing foreign currency loan schemes to finance imported inputs;
. improving the export policy and program coordination.
l Rationalizing the public sector by:
. accelerating the privatization program;

16
. reducing tax exemptions and subsidies presently enjoyed by some public corporations;
. improving management in public corporations; * deregulating entry, routes, and rates in inter-island shipping and road
transport; * lifting import restrictions on equipment and spare parts.
III. MESO-LEVEL TRENDS: CHANGES IN MARKETS AND SOCIAL INFRASTRUCTURE
Labor Force Participation Trends
3.1 The labor force has been growing rapidly since the 197Os, averaging 4.2 percent during the period 197&1980 and 4.5 percent from 198&90. In absolute terms, the total labor force more than doubled in two decades, from 11.6 million in 1970 to around 25 million in 1990, reflecting a fast growing young population (see Table 15). While the overall population growth rate was around 2.5 percent, the working age population grew at 2.8 percent. Between 1970 and 1990, the population group O-14 years grew at an average of 2.2 percent while the 15-64 group grew at an average of 4.6 percent. Labor force growth below 25 years of age averaged 3.6 percent from 1971 to 1990. In terms of age distribution, approximately 80 percent of the labor force belong to the 15-44 age category while 20 percent are 45 years and over (see Table 16).
3.2 The male-female labor force ratio has declined from 2.1 in 1970 to around 1.7 in 1990 (see Table 16). This is not surprising since the female labor force grew by an average of 6.4 percent while the male labor force grew by only 4.1 percent during 1970-90. However, the average labor force participation rate for males is still higher than that for females: 75.4 percent versus 40.2 between 1970 and 1987.
3.3 Another salient feature of the Philippine labor force is the increasing percentage of workers with partial and completed secondary education; for example between 1976 and 1987, it increased from 21.9 percent to 29.9. This is probably due to the efforts of government to provide low-cost education and skills training programs. In addition, competition from a surplus of labor and stringent requirements of employers have encouraged workers to acquire more training and education.
3.4 The trend of rapid labor force expansion, accompanied by low labor productivity began to show their cumulative effect in the 1980s and were further exacerbated by the drop in domestic activity. Although GDP continued to expand at above 3 percent annually, it dropped by more than 10 percent in the adjustment period. As the next subsection will show, open unemployment in 1986, as a result, reached 11.1 percent and underemployment 16.5 percent. The labor force growth rate diminished somewhat during the recession. In particular, the participation rates of females and young workers dropped.
3.5 Total employment grew from only 10.7 million in 1970 to around 23 million in 1990, growing at an annual average of 5.4 percent (see Table 15). The employment rate averaged 91.7 percent during the past two decades. The acceleration in the growth of agriculture and the expansion of the services sector allowed for the higher rate of absorption in the early 1970s. However, the highly capital-intensive nature of the industrial sector limited employment generation especially in the manufacturing sector.
3.6 The Philippines remains a predominantly agricultural economy in terms of population and labor force. The bulk of employed is in the agricultural sector (around 50 percent) although its

18
share to the total had been declining (see Table 17). However, the shift in employment has been more towards the relatively low-productivity, low-value added services sector whose share grew from 28.2 percent in 1976 to 36.6 percent in 1987. The limited capacity of the industrial sector to absorb more labor kept its share at around 15 percent. Job creation in this sector was slow during the 1970s and practically zero in the eighties.
3.7 One of the interesting features of the labor market is the importance of seasonal employment, not only in the rural areas but in the urban areas as well (Hakim 1991). One observation by Hakim 1991 is that even in the urban areas and especially among the poor. Using the FIES survey data, Hakim concluded that most of the wage income in the urban areas comes from non-agricultural activities and it is here that a high incidence of seasonal employment is observed. One plausible explanation is that during periods of economic instability and recession, firms may rely on hiring workers on a temporary basis as a means of responding quickly to an uncertain environment.
3.8 Hakim’s study (1991) study shows that in the urban areas, poor households are generally employed in small-sized, low-paying firms. Using 1983 Census of Establishments’ data, he argued that urban poverty and low wages go hand in hand. Low wages are determined by low levels of skill and productivity, which is in turn related to low levels of capital per worker.
3.9 Next to wage employment, the second most important source for livelihood by the urban poor is self-employment. In fact, self-employment expanded faster than wage and salary employment during the 198&86 period. Employment in trade and services, which typically includes informal activities, grew at 8.5 percent and 12.2 percent per year respectively during the period (see Table 18). The number of self-employed households (excluding urban farmers) is about the same across various income categories, varying between 8 and 12 percent of the total number of households in each decile (see Tables 19 and 20).” The income structure of the self- employed also remains fairly stable as one moves across deciles, with income from self- employment ranging from 76 to 81 percent of total household income.
3.10 International labor migration has surged in the last decade. The increased demand for highly skilled labor abroad has brought about a high rate of external migration as many Filipinos were attracted by better job opportunities abroad at the time when the domestic labor market could not offer competitive and remunerative employment. Table 21 shows that overseas employment has been growing steadily since 1979. The total number of processed contract workers increased dramatically particularly after the economic crisis of 1983-85, rising by 22.9 percent between 1986 and 1988. This migration has particularly affected the market for skilled labor from construction workers to nurses and engineers, in addition to that for domestic help.
10. The self-employed families are those that derive more than half of their income from self-employment. This would include those households in which the head is a wage earner but may not be the principal income earner in the household.

19
3.11 In terms of sectoral employment, agriculture has the largest labor absorption capacity accounting for about 50 percent of total employment (see Table 22). The next largest employer group is the wholesale and retail trade service sector. Employment generation in the manufacturing industry has remained limited throughout the decade with only 9-12 percent of total employment. This can be attributed not only to the slump in production but also to the structure of production in many of the industries. With the exception of garments and textile industries, the manufacturing sector tended to be capital-intensive in nature.
3.12 The level of employment in the public sector has risen faster than that in the private sector during the period 1988-l 991. Nonetheless, the public sector employment amounted to less than 6 percent of the labor force (see Table 23). In terms of distribution across the ministries (departments) within the public sector, education was the largest employer accounting for 40-42 percent between 1982 and 1986. This was followed by the defense sector and the production related sector.
3.13 Much of the increase in public sector employment seemed to be merely of an accounting nature since it reflects the regularization of a large number of persons previously listed as contract or temporary workers. The Aquino administration regularized the status of these employees in order to promote fairness in the award of pensions and fringe benefits.
Employment Patterns
Unemployment and underemployment
3.14 Unemployment and underemployment remain important problems in the Philippines despite the period of economic recovery. Every year, over 700,000 new entrants join the existing labor force which already includes five million under or unemployed workers. The unemployment rate averaged 8.3 percent during the last two decades, peaking at 12.5 percent in 1985 (see Table 15). On a quarterly basis, the highest recorded was 14.7 percent in April 1978. It remained at two digit levels during the 1983-1987 crisis years although it has been declining since then.
3.15 According to the 1988 World Bank Report on poverty, two sets of distortions adversely affected the employment content of economic growth. One set refers to the sectoral composition of output and those that have increased the relative cost of labor. Trade restrictions have fostered the expansion of import competing industries at the expense of agriculture. Internal price policies which have kept the price of food down, have also discriminated against agricultural growth. Policies also have made the cost of capital artificially cheap and at the same time increased the relative cost of labor. In addition, the spate of calamities and other global events which occurred during the past two years, e.g., the Gulf conflict, July 1990 earthquake, the Mt. Pinatubo eruption, and the Ormoc tragedy contributed to the slowdown in employment growth as the economy struggled to contain its losses.
3.16 Most of the unemployed, whether male or female, are young (15-24 years) (see Table 24). While national unemployment is 11 percent, it is 13 percent for those under 24 years of age and

20
23 percent for the same age group in urban areas (see Table 25). A typical unemployed female tends to be younger than her male counterpart. Almost 70 percent of the unemployed have a high school education or have low educational attainment, suggesting a mix of skilled and unskilled among the unemployed. They are concentrated in the agriculture and production sectors, although towards the middle of the 198Os, the share of production workers outpaced that of agricultural workers suggesting that the former group was the hardest hit by the economic crisis.
3.17 Underemployment averaged 15 percent during the 1970s but started climbing in the 1980s from 26 percent in 1980 and peaking at 40.3 percent in July 1984 (see Table 15). By 1986, the figure had declined slightly below the level in 1980, about 25 percent on average. By 1990, underemployment dropped to 22.4 percent. With respect to sex distribution, the problem of underemployment is more serious for men than for women (see Table 26). .
3.18 Urban underemployment is higher among less educated and older people (see Table 27). In general, the family of the average underemployed person lives below the poverty line. The problem of underemployment remains pervasive in rural areas where female and child labor employment is common. It is also prevalent among agricultural and production workers who have low educational attainment.
3.19 The above-mentioned labor-market trends explain a large part of the growing poverty problem. Higher under and unemployment, combined with declining real wages and labor earnings, seriously affect the incidence of poverty in terms of labor income. Table 28 presents a cross-sectional picture of poverty in the labor force. It shows that poverty is concentrated in agricultural, self-employed and unskilled workers. In urban areas, most of the poor are in trade, transportation and services. The poorest families are usually headed by unskilled workers. Overall, poverty is worse among own-account workers in agriculture and services.
Changes in Real Earnings and Labor Market Flexibility
3.20 One interesting feature of urban poor household income is the relative importance of wages as a source of income. In fact, during period 1985-89, wage income increased faster than total income, thus increasing its share from 50 percent of total income to 54 percent, with self- employment stable at around 25 percent, and other income falling from 26 to 21 percent (Hakim, 1991). The importance of wage income, in fact, seems to be greater for poor households than for typical urban Filipino households.
3.21 Even as nominal wages are adjusted periodically in response to the clamor of the workers, real wages remain low. In fact, real wages fell continuously between 1960 and 1980 for both urban skilled and unskilled workers, at a rate of about 3 percent annually. Rural wages, although falling, did not drop as fast as urban wages since labor absorption in agriculture was more dynamic than in manufacturing and industry (see Table 29). After 1980 and before the economic crisis, there was a slight real wage recovery, when services accounted for most of the employment creation. However, this negligible recovery in real wages did not reverse the long-
21
term decline. In fact, the 1986 real wage for skilled workers dropped to only 60 percent of the 1972 level, while for unskilled workers, it dropped to 73 percent of the 1972 level.
3.22 In terms of geographical variation, real wage in the non-agricultural sector tended to be generally lower in Metro Manila because of the lower cost of living in the regions. In 1988, real wages in the private sector increased over that of the previous year. This was largely due to the relatively higher nominal wage rate and the single digit inflation rate. As far as compensation levels for public employees are concerned, the recent upward adjustments (the personnel bill of the government has grown by 24 percent between 1987 and 1990) follow several years. of declining real levels of compensation.
3.23 The study by Hakim (1991) shows that during the period of economic recovery (1985--88), the importance of permanent wage income remained constant in the urban areas. The fact that wages per worker are lower at the bottom of the distribution might not entirely be due to differential wage rates or skills, but also to significant differences in the number of hours or days worked as wage earners. Wages per worker in the low-income brackets could be increased by a shift from seasonal to permanent employment, holding the number of workers and the wage rate constant.
3.24 One important labor market institution in the Philippines that has gained significance since the late 1970s is labor unions. This is largely in response to accommodating legislation introduced by the Aquino administration. Union membership has increased in recent years, in both the private sector and public sectors. In the public sector, the World Bank estimation is that it has increased by 30 percent in 1990 to a level of 77,500 members. In the private sector, union membership is estimated to be around 2.9 million persons or 12 percent of the total work force, having risen by about 800,000 in 1989 alone (World Bank, 1990).
3.25 The Philippines also has a wage-setting mechanism, at least legally speaking. Annex A chronicles the minimum wage legislation in the Philippines for the period 195 l-76. In December 1987, the minimum wage law provision was revised to increase the minimum wage for both agricultural and non-agricultural workers by 10 pesos.” In addition, a two-step integration of the cost of living allowance (COLA) into the basic pay was also mandated. Public sector employees also received upward salary adjustments starting March 1, 1987. These adjustments contributed to the increase in the compensation index by 25.6 percent in the manufacturing sector.
3.26 With the creation of the regional tripartite wages and productivity board (RTWPB) in 1990, minimum wage rates in the private sector were increased on a regional basis. The wage increases affected ranged from a high of 17 pesos in the national capital region (Metro Manila) to only 8 pesos for Region VII in retail and service establishments employing less than 10
11. Two months before, in October 1987, 266,800 workers staged a week long general strike to demand the 10 peso/day increase.
22
workers. In lieu of a wage adjustment, the cost of living allowance (COLA) for workers in Regions II, V, and VI were increased (see Map attached).
3.27 Workers in Metro Manila, Region I, IV and CAR were supposed to receive increases in their minimum wages and cost of living allowances during the first semester of 1991. In the NCR, the minimum wage of non-agricultural workers earning 142 pesos per day was increased to 154 pesos. However, a World Bank report pointed out that minimum wages in the Philippines have not in fact been a binding factor in the generation of more employment (World Bank, 1988b). In fact, they seem to have followed a pattern similar to non-regulated wages in the rest of the economy (see Table 30). The minimum wage was, on average, about 70 percent of unskilled wages. The expansion in underemployment in the mid-1980s was driven not so much by the enforcement of the legal minimum wage as by the depressed demand conditions.
3.28 The ratio of non-wage cost to total wages increased from 13 percent in 1976 to 30 percent in 1987, basically as a result of the introduction of the cost of living allowance (COLA). In addition, the real unit cost of labor constantly declined in the 1971-1985 period. Hence, even if one takes the COLA into account, the hourly cost of a manufacturing worker is quite low, equivalent to US $0.60 per hour. This drop in the real unit labor cost for manufacturing is illustrated in Table 3 1 S
Changes in Prices of Consumption Goods
3,29 Prices remained unstable and vulnerable to shocks in the economy throughout most of the eighties. Inflation rates remained at two-digit levels (except for the periods 1975-78, 1983 and 1986-88) averaging 14.7 percent (see Table 32). The highest inflation rate, 50.3 percent was in 1984 at the height of the balance of payments crisis and the lowest at 0.8 percent in 1986 with the euphoria over the ouster of the Marcos government.
3.30 Generally, the price index is lower in areas outside of Metro Manila, although there are regions in the Visayas and Mindanao (Western Visayas and Northern Mindanao) where it is usually higher than the national average (see Table 32). The consumer price index for cereals and cereal preparations which include rice and corn has been relatively stable except for the years 1974, 1980-81, and in 1984 when it grew by 56.5 percent.
Changes in the Level and Composition of Public Expenditures
3.3 1 Both the level and the composition of government expenditures have been fluctuating over the years. In terms of social services, however, the Philippines has consistently spent less than half of what other lower middle income countries spend on social services, partly because of the significant participation of the private sector, particularly in the health and education sectors (see Table 33). Lower middle income countries allocate roughly 6.6 percent of GNP to social expenditures compared to 3.6 percent of GNP by the Philippines.
23
..-
3.32 Moreover, the structure of public expenditure has been affected by the internal and external debt problem confronting the Philippine government. Because of its liberal issuance of guarantees, the government assumed 80 percent of total external debt obligations of the country” Debt service as a proportion of total government expenditures has climbed sharply from 5 percent in 1975 to a high of 45 percent in 1987, then slightly dipping to 43 percent in 1989 (see Tables 34 and 35). Economic services’* has been the most adversely affected category as real per capita expenditure decreased from a high of 300 pesos in 1981 to only 177 pesos in 1990 (see Table 36). As a share of total expenditure in current terms, this category comprised 47 percent in 1975 and only 22 percent in 1990.
3.33 The share of social services’” in total national government expenditures has averaged about 18 percent in recent years (see Tables 34 and 35). There was a serious drop .during the period 1982-86 when they declined to 2.4 percent of GNP and real per capita expenditures in social services in 1986 were still below 1983 levels (see Table 36 and Figure 4). This reduction represented important cuts in the maintenance and operating expenditures in health, education, and other important subsectors. The increase in social expenditures of over 45 percent in real terms in 1987 was still inadequate to meet the demand although it helped restore the level back to 1983 rates.
3.34 Within the social sectors, education continued to receive the largest budgetary share in the 1980-84 period. There was also a significant increase in the allocated budget for housing and community development between 1979 and 1983 following the establishment of a provident fund for the financing of home mortgages and the implementation of the shelter program. After 1983, however, there was a decrease in public sector housing services, which was consistent with the new emphasis on privatization and with the acknowledged assessment that they were mainly benefitting the higher income families.
3.35 The health subsector received an almost constant share of the government budget in the 1980s despite the implementation of the primary health care program In 1980. Furthermore, national government transfers to highly specialized hospitals were also regressive. Social security, welfare and other services continued to receive diminished budgetary shares, particularly during 1980-83.
3.36 On the other hand, public provision of social services was more or less steady with real per capita expenditure reaching a high in 1990. The benefits of this development may not be as straightforward as it appears however since the number of services in this category have expanded over the years and very little assessment has been made of who the actual beneficiaries were.
12. Economic services include agriculture and natural resources, trade and industry, tourism, power and energy, water resources development and flood control, communications, roads and other transportation.
13. Social services include education, health, social security and labor welfare and land distribution, housing and community development.
24
Conclusions
3.37 The preceding discussion illustrates the likely effects of public expenditure cuts on the poor, unemployment and underemployment, declining real wages and inflation on the welfare of the population as a whole and on low-income households in particular. The development of an appropriate social policy to protect the vulnerable groups during the period of continued macroeconomic reforms becomes an imperative task.

Alburo, F., R. Bautista, et al. 1986. Recovery and Long-run Growth: Agenda for Reforms. Makati: Philippine Institute for Development Studies.
Bautista, R. M. 1988. “Foreign Borrowing as Dutch Disease: A Quantitative Analysis of the Philippines.” International Economic Journal, 2, No. 3.
Boyce, J. K. and L. Zarsky. 1988. “Capital Flight from the Philippines, 1962-1986,” Journal of Philippine Development, 15, No. 2.
Boyce, J. K. 1990. The Political Economy of External Indebtedness: A Case Study of the Philippines. Monograph Series No. 12. Manila: PIDS.
De Dios, E. S. (ed.) 1984. An Analysis of the Philippine Economic Crisis. Quezon City: University of the Philippines.
De Dios, E. S. and L. G. Villamil (eds.). 1990. Plans, Markets and Relations: Studies for a Mixed Economy. Manila: Kalikasan Press.
Dohner, R. and P. S. Intal. 1989. “The Marcos Legacy: Economic and Foreign Debt in the Philippines.” in J. Sachs (ed.) Developing Country Debt and Economic Performance. Volume 3: Country Studies. Chicago: University of the Chicago Press.
Fabella, R. V. 1990. “The Role of Exchange Rate Protectionism in Development Success: Implications for the Philippines,” in Studies in Economic Policy and Institutions: The Philippines, edited by D. B. Canlas and H. Sakai. Tokyo: Institute of Developing Economies.
Hakim, Guillermo. 1991. “Economic Recovery and Poverty Alleviation: The Case of the Philippines 1985-88.” Draft. Washington, D.C.: The World Bank.
Hooley, R. 1985. Productivity Growth in Philippine Manufacturing: Retrospect and Future Prospects. Monograph Series No. 9. Manila: PIDS.
Kunio, Yoshihara. 1985. Philippine Industrialization: Foreign and Domestic Capital, Oxford University Press, New York.
Lamberte, M. B., et al. 1985. “A Review and Appraisal of the Government Response to the 1983-84 Balance-of-Payments Crisis.” PIDS Monograph Series No. 8. Makati: Philippine Institute for Development Studies.
Lamberte, M. B., J. Y. Lim, et al. (forthcoming). External Finance and Domestic Resource Mobilization in the Philippines, 1970-1990. Makati: Philippine Institute for Development Studies.
26
Manasan, R. G. 1990. “An Assessment of Fiscal Policy in the Philippines, 198688,” PZDS Working Paper, Series No. 90-06. (January).
Medalla, E. M. 1990. “An Assessment of Trade and Industrial Policy, 1986-1988,” PZDS Working Paper, Series No. 90-07 (January).
Montes, M. F. 1989. “Philippine Structural Adjustments, 1970-87,” in M. F. Montes and H. Sakai (eds.) Philippine Macroeconomic Perspective: Developments and Policies. Tokyo: Institute of Developing Economies.
World Bank. 199 1 a. Social Indicators of Development 1990. Washington D.C.
-. 1991 b. Trends in Developing Economies. Washington, D.C.
-. 1991~. World Debt Tables 1991-92; External Debt of Developing Countries, (Vols 1 and 2). Washington, D.C.
-. 1991d. World Development Report. New York: Oxford University Press.
-. 1991e. World Tables 1991. Baltimore: John Hopkins University Press.
-. 1990. “The Philippines Country Economic Memorandum: Issues in Adjustment and Competitiveness.” Report No. 8933-PH. October 31.
-. 1989. “Report and Recommendation of the President of the International Bank for Reconstruction and Development to the Executive Directors on a Proposed Loan in an Amount Equivalent to US$300 Million to the Republic of the Philippines for a Financial Sector Adjustment Program.” Report No. P-5002-PH. April 6.
-. 1988a. “Report and Recommendation of the President of the International Bank for Reconstruction and Development to the Executive Directors on a Proposed Loan in an Amount Equivalent to US$200 Million to the Republic of the Philippines for a Reform Program For Government Corporations.” Report No. P-4469-PH. May 20.
-. 1988b. “Philippines The Challenge of Poverty.” Report No. 7144-PH. October 17.
-. 1987. “Report and Recommendation of the President of the International Bank for Reconstruction and Development to the Executive Directors on Two Proposed Loans in an Amount Equivalent to US$310 Million to the Republic of the Philippines for an Economic Recovery Program.” Report No. P-4466-PH. February 23.
-. 1986. “Recent Trends in Poverty, Employment and Wages: Philippines.” Report No. 5456.

27
-. 1985. “Program Performance Audit Report-Philippines First and Second Structural Adjustment Loans (Loans 1903-PH and 2266-PH).“ Report No. 5813. July 31.
-. 1983. “Report and Recommendation of the President of the International Bank for Reconstruction and Development to the Executive Directors on a Proposed Loan in an Amount Equivalent to US$302.3 million to the Republic of the Philippines for a Second Structural Adjustment Loan.” Report No. P-3389-PH. April 1.
Yap, J. T. 1990. “An Assessment of the External Debt Management in the Philippines,” PIPS Working Paper, Series No. 90-04. January.

ANNEX A
Table Al. Minimum wage fixed in the Philippines by industry and by year of affectivity
Legislative Act and Wage Order Affectivity Date Industry Sector Covered
1. Minimum Wage Law (RA 602)
2. Agricultural Land Reform Code (RA 3844)
3. Minimum Wage Order No. 1 Bureau of Labor Standards
4. Minimum Wage Law Amendment (RA 4180)
5. Minimum Wage Amendment (RA 6129)
6. Minimum Wager Order No. 1 Wage Commission
7. Minimum Wage order No. 2 Wage Commission
8. Minimum Wage Order No. 3 Wage Commission
9. Minimum Wage Order No. 4
10. Minimum Wage Law (PD 928)
Aug. 4, 1951 Agricultural Non-Agricultural
Aug. 8, 1%3 Agricultural
March 17. I%4 Sugar Industry (a) Agricultural (b) Industrial
April 21, 1965
June 17, 1970
April 9, 1972
August 2,1972
Sept. 16, 1972
Feb. 10, 1973
May 1, 1976
Agricultural Industrial
Agricuhural Industrial
Jeepney Transportation Industry in Greater Manila Area
Desiccated Coconut Industry
Sugar Industry a) Agricultural
(multiple) wage rates
b) Industrial
Coconut Oil Milling & Related Products Industry
Agricultural P7.00 for plantation and organized agriculture
P6.00 for all other types of farm workers P 10.00 Metro Manila
P.900 Outside Metro Manila
Source: Mangubat, Benjamin. “Histcny of Ihe Minimum Wage Law,” PHILIPPINE JOURNAL OF LABOR AND INDUSTRIAL RELATIONS, 1990, I2( 1).

ANNEX B
Maps, Tables, and Figures

33

34
35
TABLE 1
?O?ULATION RATA IIN THOUSANDS EXCEPT THE GROWTH RATES) ~:~~,f:::~~:~:~::~:~ii”‘:““:‘:‘:::~:::::::::::::~:::::::::::::::~::::::::::~:::::::::~:::::::::::::::::~::::::::::::::::~:::::::::::
GROWTH SEX AGE GROUP AREA YEAR TOTAL RATE ____-_.____-__----______ ____--_-__-__-_--------.-----------. ------___--__--___-_----
01 flALE FEHALE o-14 IS-64 65+ URBAN RURAL _.___.._.____._.._..-.-.----_-.I..--_..-._.._..-.-._.--_...-__---.--.-.-.-.-.-.--.-.-.----.-.----.-.-----.-..--.._~__.__..1- ~_~~...-.~.--.~-.~.---.-~--.~-.---.~~~.~~~-..~~.~~.~~~~....~~.-...--.--...--...-...-----.-.-.-.--.-.---..~~~.~~..~.~~~~.~~..
1970 36,837 2.97 18,330 18,522 16,576 18,630 3,917 . n.a. 1971 37,863 2.19 18,868 19,034 16,915 19,343 4,064 n.a. 1972 38,917 2.18 19,427 19,564 17,263 20,087 4,221 n.a. 1973 40,002 2.79 20,008 20,115 17,618 20,862 4,387 n.a. 1974 41,116 2.78 20,612 20,685 17,982 21,669 4,564 n.a. 1975 42,261 2.18 21,240 21,277 18,354 22,511 4,751 n.a. 1975 43,338 2.55 21,872 21,879 18,892 23,287 4,954 n.a. 1977 44,417 2.49 22,527 22,501 19,448 24,095 S,lb6 n.a. 1978 45,498 2.43 23,206 23,144 20,022 24,935 5,389 n.a. 1979 46,580 2.38 23,909 23,810 20,616 25,809 5,622 n.a. 1980 48,317 3.73 24,232 24,085 20,313 26,360 1,644 18,022 1981 49,536 2.52 24,846 24,690 20,652 27,194 1,690 18,680 1982 SO, 783 2.52 25,475 25,308 20,996 28,051 1,736 19,430 1983 52,055 2.50 26,117 25,938 21,343 28,930 1,782 20,203 1984 53,351 2.49 26,172 26,579 21,696 29,828 1,827 21,001 1985 54,668 2.47 27,431 27,231 22,053 30,742 1,874 21,822 1986 56,004 2.44 28,112 27,892 22,412 31,672 1,920 22,665 1987 57,356 2.41 28,796 28,560 22,768 32,620 1,968 23,530 1988 58,721 2.38 29,486 29,235 23,115 33,589 2,017 24,416 1989 60,097 2.34 30,183 29,914 23,446 34,581 2,070 25,322 1990 61,481 2.30 30,883 30,598 23,755 35;598 2,127 26,246
n.a. n.a. n.a. n.a. n.a. n.a. n.a. n.a. n.a.
30:;ti 30,856 31,353 31,852 32,350 32,841 33,339 33,826 34,305 34,775 35,235
n.a. Not available
Note: (I) 1970 and 1980 are census figures. 1990 census puts the population at 60.7 million. (2) In between years are projected figures based on the medium assumption (i.e. aoderate decline in fertility and
a slow decline in mortality).
Source: Census of Population and Projections. National Statistics Office.

36
FamilySize Employed DependencyRatio
Table 2 DependencyRatiosbyDeciles,1988
I II Ill IV v VI VII VIII IX X
6.26 5.98 5.61 5.52 5.35 5.21 5.08 4.73 4.56 4.01 1.51 1.57 1.54 1.59 1.61 1.71 1.72 1.69 1.70 1.62 4.16 3.81 3.64 3.47 3.32 3.05 295 2.80 2.68 2.48
Age Hhld. Head
Lsssthan30 3049 over 49
Total
TableNo.6:AgeCohortsbyDeciles,1988
I II Ill Iv V VI VII VIII IX X
11.2% 12.4% 14.3% 13.4% 11.4% 11.9% 10.8% 13.0% 10.4% 10.6% 56.1% 55.9% 54.0% 60.2% 51.3% 47.9% 46.2% 46.1% 47.1% 43.4% 30.7% 31.7% 31.7% 36.4% 37.2% 40.3% 43.0% 38.9% 42.5% 45.9%
100% 100% .lOO% 100% 100% 100% 100% 100% 100% 100%
Source: Hakim (1991)

38
Table 4 EXPORTS BY COMMODITY -------v (8 Million)
1986 1988 1987 1988 1989
Coconut Products 469 470 661 682
Sugrr Producta 186 103 71 74
641 2
113
Fruits b Vegetrbles 136 137 160 aoe 319
Other Agro-b8sad Products 661 602 686 480 464
Foreat Product8 199 201 243 281 197
Miner8 I Producta 243 267 224 764 829
Potrolsum Producta 39 83 88 182 96
M8nut8cturer 2766 2879 3042 4338 6192
Electronics
O8rments
Texti Ia
Footwer r
Tr8ne/Ooodr I: H8ndbrga
Wood M8nut8ctures .
Furniture-Fixtures Chemfc8ls
Non-mstrilic Miner81
M8chinery & Trlnsport Equipment
Procerted Food & Beverrgo8
Others
1066 919 1119 1476 1761
623 761 1098 1317 1676 39 31 31 77 98. 10 12 16 22 41 43 49 62 79 88 04 89 130 184 204
160 243 246 266 279 24 18 22 33 46 30 46 78 64 116
106 116 128 184 208 661 662 647 686 706
Spoei8l fr8nw8ctiona 12 8 7 27 10
Re-exporta 40 112 149 80 71
Tot81 Export8 4629 4842 6720 7674 7821
Source: Centrrl 88nk.
39
feblo 5 IMPORYS BY COMMODITY, 1986-89 ---w-w---- (8 Ylllion)
1986 1986 1987 1988 1989
--------------------------------------------------------------------------------
Cepitel Goode 788 ------------- -a--
Elec. & Non-Elec. Meehinory 869
Power Generators 78
Office & EDP Meehinoe 29 Teleeom Eqpt. Elee. Meeh 40
Lend Treneport Eqpt. Exl . Peeeengor Cere
Aircreft, Ships I Boete
Prof. Scientific Instruments
48 64 116% 144 268 20 24 aa 128 198 81 68 7a 91 124
Rew Metl. & Int. Goode ----------------_-----
Wheet
Crude Met’le. Inedible
Animel & Ve9etebIe 011s & Fete
Chemicele
Menufecturee
Embroideree
Met’le. for Menufecturo of
Else. Eqp’t.
Iron Ore, not AggIomer8ted
Others
2198 2671 a426 4416 6888 -w-s w-w- w-m- w--a m-w- -
108 129 82 188 197
160 229 290 4ia 629
la la la 18 24
684 711 924 1088 1216
608 684 987 12as 1787
198 26a aa a77 487
686 640 767 910 886
66 42 69 48 66
0 0 0 241 268
Minerel Fuels &-Lubrieent 1462 ------------------------- -w-w
Consumer Goode 441 -w------------ w-w-
Food & Live Animele a20 Beverege & fobecco 78 Others 46
Spociel treneectlone --------------------
TOTAL IMPORTS
2a2 242 a06 414 a12 s-w- w-m- -w-w w-s- a-w-
6111 6044 6737 8169 10419 50rzs ttPt WWWW SW05 Httt
884 1210 1867 2424 -w -w -s-s -..-Mm --s-w
728 988 1279 1862 89 63 889 987 a2 46 69 104 41 41 671 701
869 1249 -v-m -w-m
a98 647 w-m- -w-v
271 a68 72 107 86 72
1096 la97 mm-- -m-w
697 898 a--- v--w
a79 492
22 29
--------------------------------------------------------------------------------
Source: Centrel Benk

40
Table 6 SIZE DISTRIBUTION OF FARMS, 1980
Size of Farm (ha) Percent of Farms Percent of Land
co.50 0.50 to 0.99 1.00 to 1.99 2.00 to 2.99 3.00 to 4.99 5.00 to 7.00 7.01 to 9.99
10.00 to 24.99 >25 .oo
8.5 0.7 14.2 3.1 28.2 12.2 18.0 13.7 17.2 21.3 *
8.3 16.6 2.2 6.5 3.0 14.5 0.4 11.5
Source: Derived from 1980 Census of Agriculture, in World Bank Report 6779-PK.
!Y From World Bank Report No.79-PH. Comparisons of land ownership are difficult because of differences in land quality. However, these figures are based on estimates by land operators rather than owners and probably underestimate the concentration of ownership.
Source: World Bank (1988) Report No. 7144-N.
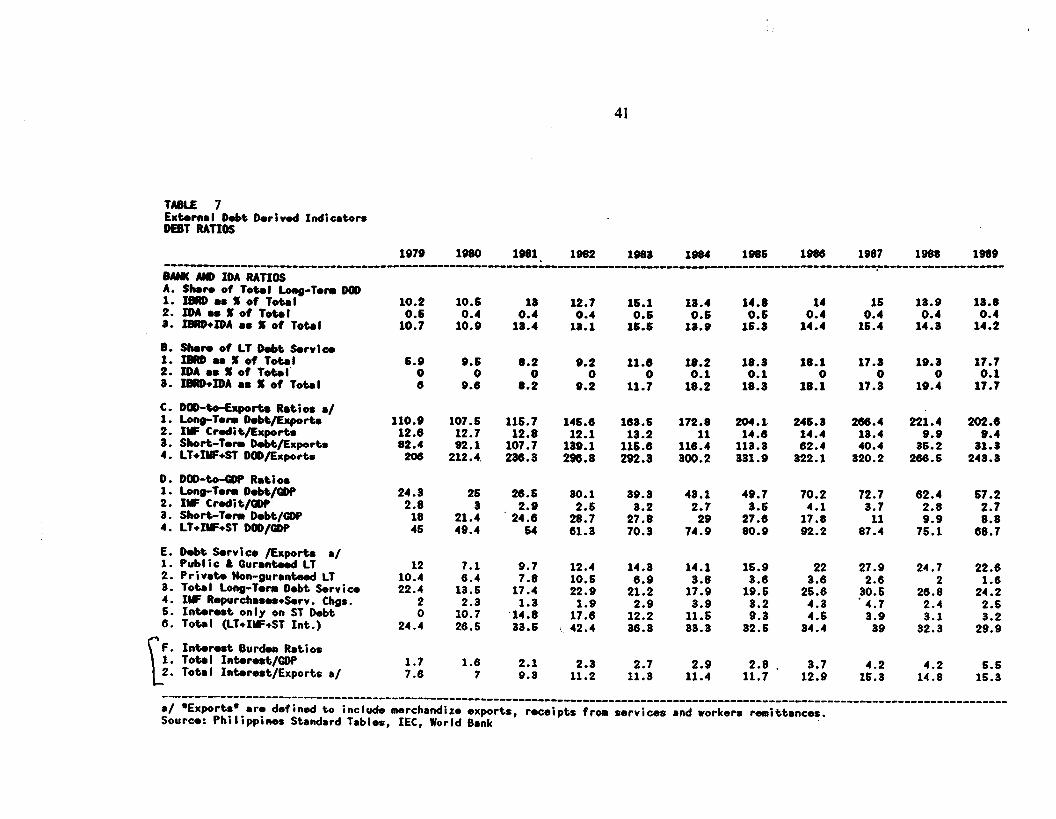
41
TABLE 7 Exkmal D8bt Dwi vod Indicators DEBT RATIOS
1979 1960 1961 1992 1963 1994 1986 1966 1987 1998 1969 """"""""""'-------------"---------------------------------------------------------------------------~------------------ BAMCAHDIDARATIDS A. Shon of Total Long-Tom DDD 1. I8110 •~ I of Total
IDA 08 X of Total ::
8.
:: 8.
C.
:: a. 4.
0. 1. 2. a. 4.
E.
:: 3. 4. 6. 0.
F.
c ;:
10.2 10.6
1::; 1::: of:
1a.4
12.7
1:::
16.1 18.4 0.6 0.6
16.6 13.9
14.8 14 16 18.9 13.8
1::: 1::: 1::: 1::: 1::: I8RD*IDA 88 % of Tokl
Sham of CT D8bt S8rvic8 IRRDuXotTotal IDA 8s I of Total’ IBRD*IDA as X of Tot.1
DDD-to-Export.8 Rotio8 Loq~-T8m Dobt/Exportx
a/
IY Crodit/Exportx Short-Tom D&t/Export8 LT+IMf+ST DDDfixpork
DOD-to-GDP Rati 08 Long-T8m Dobt/cDQ IY Crodi t/GDP Short-T8m D8bt/GDP LT+IV+ST DW/Wt'
D8bt S8tvic8 /EXpOrt8 x/ Public & Gur8nt88d LT Privak Won-Durantmd LT Total Long-Tom D8bt !%rvica fU: WOpIJrCh888868rv. Chgs. Intmr88t only on ST D8bt Total (LT+IMF+ST Ink)
Interest Burdmn Ratioe Total Interest/ODQ Total Interest/Exports I)/
6.9 0 8
9.6
9.8
6.2 9.2 0 0
8.2 9.2
11.8 18.2 18.3 18.1 17.3
11.; 1::; 1::: 18.: 17.:
110.9 107.6 116.7 146.8 183.6 12.8 12.7 12.8 12.1 13.2 62.4 92.1 107.7 139.1 116.8
208 212.4 238.3 296.8 292.8
172.8
lls!: 300.2
204.1 246.3 288.4 14.8 14.4 13.4
113.3 82.4 40.4 331.9 322.1 320.2
24.3 2.6
18 46
26
21.: 49.4
28.6 2.9
24.8 64
30.1
2::; 81.3
89.3
2;:: 70.3
43.1 2.7
74::
49.7
23:x 80.9
70.2 72.7 82.4 67.2 4.1 3.7 2.8 2.7
17.8 11 9.9 8.8 92.2 87.4 76.1 88.7
12 7.1 10.4 8.4 22.4 13.6
: 1::: 24.4 28.6
9.7 7.8
17.4 1.3
'14.8 33.6
12.4 10.6 22.9
1;:: 42.4
14.3
2:::
1::: 38.3
14.1
1s::
1::: 33.3
16.9 3.8
19.6
22 3.8
26.8 4.3 4.6
34.4
1.7 1.8 2.1 2.3 2.7 2.9 7.6
2.8 . 3.7 7 9.3 11.2 11.3 11.4 11.7 12.9
19.3 0
19.4
17.7
1;:;
221.4
3x:x 288.6
202.8 9.4
31.3 243.3
27.9 24.7
$2 2s.: 4.7 2.4 3.9 3.1 39 32.3
22.8
2::: 2.6
2:::
4.2 4.2 6.6 16.3 14.8 16.3
c-------------------_______________^____--------------------------------------------------------------------------------------------
L/ ‘Exports’ 8ro d8f ined to include uerchandit8 8xports, Sourc8: Philippimx Standard fabl8s, IEC, World Bank
r8c8ipt8 from o8rvic88 and worker8 remittanc8s.

42
TABLE 8: Selected Social Indicators
IS-20
?gs
3% . .
?is 4.0
. .
. .
SE
59.-i 60.7
+J
328
22 . .
31.2
108 . .
375 34i 24.6 23.2
. .
. . . . . .
:z
% 13s -1.6 50.0
. .
. .
300
$q
112 -1.8 520
#I:8
Same rrgion I income group
41.6 6.80
. .
. .
. .
11.7 724
g.i .
#j
33:7
. .
37.x 25.1
. .
. .
300
#
170 4.3
. .
. .
. .
unil of mcpIioc
:‘, D8torml;r;aip d populetlen grewtb F&lit
CN CbiSth”te 2 Total feail$y mtc contn~vepnv8knce
chiIiI4) / wamll(15-49) ntios
RUd M-W Crudedcath$e
!iiti!zx~ late tdtynte life expzctmcy rt birth: ycvc
L&u force w-64
30.0 3.87 %
. . . .
244 159 . . . .
30.5 30.7
IllillhS %dktptforce
*
FT2i per lwm*s Pt&tion mte: Fv
. . . . 38.i 38.7 226 23.5
Educ.8tleMl l uAlnmellt dkber force sdlocd yc8n omplct$d: zw
NATURiLRESQURCFS
bz A8l$xlwalrud. kiZ%W& Defonstatior~ mte (net)
*!!zn..” wder Runl
ye?” . . . . . . . .
I
330 Population growth Infant mortality Primary school enrollment
Source: World Bank (1991 Social Indicators of Development 1990

43
605 5,010 38 - il 454 3,759 58 iE
ii I
Total 500 4,140 52 e i
Estimates i’%i; 485 6,042 (48.0) 37 363 4,132 (63.0) 56
I Total 400 4,764 49 (58.0) 5 .-
TABLE 9 POVERTY LINES AND POVERTY INCIDENCE: 1971-85 (1978 pesos)
iC ii
ouirce: Medium Term Plan, NEDA; World Bank 29840PR; staff calculations.
otes: (a) Numbers in parentheses use the official 1985 poverty line and deflates them back to 1971 using the food price index. (b) Population weights change during the period: in 1971, urban families represented 30.14 percent of the total; in 1985 this proportion had increased to 37.84 percent.
Source: World Bank (1988) Report No. 7144-PH
0 .

44
Table 10 Poverty by Region, 1985 and 1988
TEGION
NCR llocos Cagayan Central Luzon S. Tagafog Bicol W. Visayas C. Visayas E. Samar W. Mindanao N. Mindanao S. Mindanao C. Mindanao
Philippines 51.24 100% 62.94 100% 38.74 100% 54.64 100%
1985 1988 Urban Rural Urban Rural
~““1Zk~~
38. 54. 53. 42. 49. 67. 65. 68. 75. 68. 68. 61. 64.
26.7% 4.6% 1.8% 8.8%
12.7% 4.8% 8.3% 8.9% 4.8% 2.8% 5.2% 7.9% . 2.6%
0.0% 23.9 6.7% 51.2 5.7% 43.8 6.0% 30.1
11.6% 39.9 10.6% 58.4 12.1% 60.1 10.9% 55.6
8.9% 68.2 7.1% 58.5 7.4% 50.3 7.2% 40.3 5.9% 48.3
22.3% 4.7% 1.8% 8.5%
11.5% 5.9%
10.3% 9.5% 5.9% 3.4% 5.1% 7.0% 2.6%
0.0% 6.1% 4.7% 6.1%
12.0% 11.2% 11.8% 11.0%
8.6% 6.9% 7.0% 7.2% 5.5%
Average rate of change in
Source: Fies Tapes, 1985 and 1988 Hakim (1991) .

45
I Table II Drrferences Among the Poor, by quartiles, 1988
I Urban Poor
Income up to No. of Family No. of Depend. % of 46 of % living HS grad wage wkrs Per Capit Size Employed ratio wages self-emp. in NCR % % Income
1 st quartile 6.5 1.5 4.2 47.1% 30.1% 10.2% 92.2% 42.4% 2507 2nd quartile 6.1 1.6 3.9 51.4% 27.7% 17.9% 90.0% 48.0% 3647 3rd quartile 5.8 1.5 3.8 55.5% 23.6% 27.9% 07.2% 53.3% 5078 4th quartile 5.6 1.6 3.6 57.1% 22.0% 33.2% 82.0% 52.5% 6221
All Urban Poor 6.0 1.6 3.9 53.8% 25.0% 22.3% 87.9% 49.1% 4459
Rural Poor Income up to No. of
Family No. of Depend. % of % of % living HS grad wage wkrs Per Capit Size Employed ratio wages self-emp. in NCR % 46 Income
1 st quartile 6.6 1.5 4.5 24.4% 49.4% NA 98.9% 19.0% 1737 2nd quartile 6.1 1.5 4.0 29.6% . 47.0% NA 97.9% 25.0% 2610 3rd quartile 5.5 1.6 3.4 32.4% 44.6% NA 96.2% 27.6% 3362 4th quartile 5.3 1.6 3.4 35.7% 41.8% NA 95.2% 31.8% 4204
All Rural Poor 5.9 1.6 3.8 31.5% 45.0%. NA 97.1% 25.9% 2978
Source: Hakim (1991) a
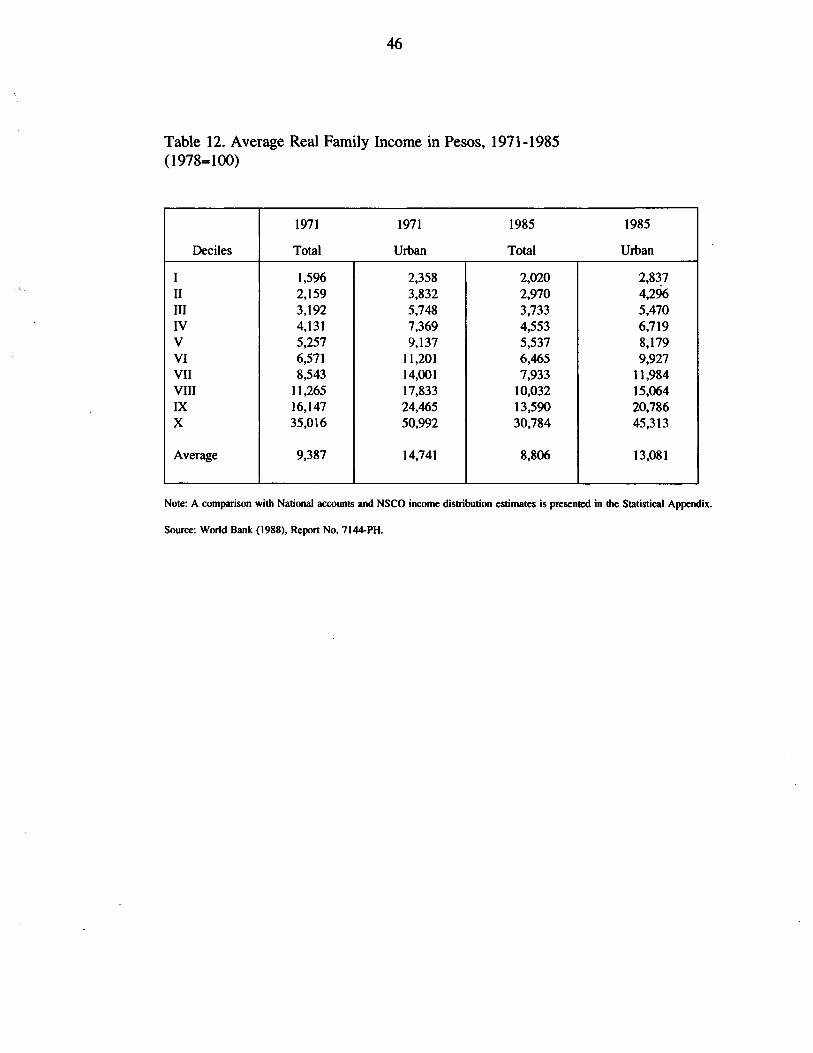
46
Table 12. Average Real Family Income in Pesos, 19’71-1985 (1978-100)
Deciles
I II III IV V VI VII VIII IX X
Average
1971 1971 1985 1985
Total U&ill Total Urban
1,596 2,358 2,020 2,837 2,159 3,832 2,970 4,256 3,192 5,748 3,733 5,470 4,131 7,369 4,553 6,719 5,257 9,137 5,537 8,179 6,571 I 1,201 6,465 9,927 8,543 14,001 7,933 11,984
11,265 17,833 10,032 15,064 16,147 24,465 13,590 20,786 35,016 50,992 30,784 45,313
9,387 14,741 8,806 13,081
Note: A comparison with National accounts and NSCO income distribution estimates is presented in the Statistical Appendix.
Source: World Bank (1988). Report No. 7146PH.

47
Table 13 INCOME DISTRIBUTION 1961-1985
1961 /a 1971 1985 /b
Urban Top 20%
Bottom 30% Gini Coefficient /c
Rural Top 20% Bottom 30% Gini Coefficient /c
Total Top 20% Bottom 30% Gini Coefficient /c
Memo : xral/urban ratio (X)
56.9 51.2 6.6 8.1 0.52 0.46 *
48.1 51.5 45.7 10.3 8.2 11.6 0.42 0.46 0.37
56.5 54.5 51.1 8.0 7.4 9.9 0.51 0.49 0.43
40.5 48.0 47.4
50.5 9.7 0.43
/a UN (1981). Ti; Staff calculations. E The Gini coefficients measures income inequality, with zero representing
perfect equality and one representing perfect inequality.
Data taken from: Family Income and Expenditure Survey.
Source: World Bank (1988), No. 7144-PH

48
WaJor Economte Shocks eniJ Pdt IFy Rcrpanscr fn the Phl t IpplnerJ
75-79 80-82 83-85
1970-85 Table 14:
Chenp iorclgn olt price credit Inflow shock
Storpnge of forelgn debt lnftou
Pcrlod 70-74
Externnl forclgn debt Shock erlsls
86-90
Rcgotlrtcd debt re- whedui Ing
Resvned auttltaterat and bllsteral
torn tnftour
comnodl ty pr Ice boom
lncrcnrcd forelgn Investment
Recesslon abroad
of I price ahock betcrlorst Ing terms of trade
High world Intcreat rates
Wet resource outftou due to debt pay-
ment
t Rcrtrlcted forelgn credlt
rwm~atlc Rlsc nf strong shock nnt Innnt Iqt
movcmcnt Hnrt tnl tfiu decleratlon
Dewy Dee f lnnnclat crlsls
Axsnxrtnntlon of Aqulno
trkeover of Aqulno gov- erment
Expanslonnry In InI t 1st years; tight ulth hlgh Interest rates
leter yearr
Monetary fight due to Pot Icy Inflntlonery
prensures from dcvntuntlon
Expnnnlonnry Subsldlted credlt to prlorlty areas
Highly expnnslonnry 6 countercyctltat f lnnnclet tlberelltrtlon
Restrlctlve 6 deflationary htgh lntereet rrtes .
More expsnr I onnry In 1973 end 1974
I
Contract lonsry, concentrated en
F Iscal Pot Icy
tight due to Expansfonary, lnftntlonary pnrtlculerly on prcasures govcrmtent from devnluntlon lnves tment
More cxpnnxlonnry In 1913 and 1974
CountercycLIcal Initlelly : expnnr I onary, tight In toter yews ulth cwentratlon on . domest lc borrowings and tart reform3
Trade ~lberatltstfon, alowly depreclrtl peso In 1990
debt eervlce rind bnlt-out of government corporations
trnde nnd bevnluntlon, Export prwnotlon I ntlux t ry Export promotIon Cant lnued
Pot Icy protcetlon of Import wbstltute sector fnlled p(an for hcnvy Induatrlallzatlon
geglnnlng of rcmoval’of QR1s
Suspension of trsde Ilberellrntlon, tnxntlon of trndcnbtcs, rrtlonlng of foreign exchange,
devsluoton
Econunle ryeover) up to 1989 Inererslng eurrec recomt dcflclts. etow grwth In l!
Comblncd Illgh growth, High growth, shift Effects hlgh Inflstlon to nontredltlonel
exports
Stow growth lnftrtlon
Deep econanl c r~ecsslon Hlgh fnftatlon

49
Table '14 (cont’dj
Pet pd 70-n
Prlvnte favornblc, hlgh Response lnvrstmentr
forclgn Cnutlon In Investors t9?0 to 1972
RISpOllSC favorrbte and high tnvetmentr startlng 1973
Rllntcmt Sth*tnntlal rind Wul tl- Incrennc In old Internl and loans Response
foreign Conmrclrl bank Comnerclrl Iendlng beglnr ellnkr to lncrrrse In Response 1974
15-79
favornble, high snvlngr nnd Investments
fnvornble, hlgh Investments especlety In non- tradltlonsl export sector
Contlnuad Increrw In Inflou of loans and old, partlculsrly In support of energy and Infrastructure
Rapid snd massive
80-82
Unfwornbl c, reduced snvlngs,
* cnpltnl fl lght but continued investments spurred by govermwnt purp-pr lming
Cnutlon end lower growth rate of forelgn investments
Inpositlon of structurnl adJustmcnt progrnms portlculsrly trade llberallratlon and f lnenclel Ilberalitatlon
Hlgh verloble Inflow of eomnerclal Interest rates for IOIM short-term commercial
lonna; move from mediun end long term loans to short-term loans
.
83-85
Collnpse of buslncxs conf ldence
Reduced Investments, higher ulthdrsurls
Inposi tion of IHF. stnbll ltetlon program
Stopege of mediun and long-term loans due to debt morrtorlus
86-90
Renewed conf ldcnce Inltlelly, Erratic
bahavlor tn lstrr years
Cnutlon In the beglnnlng, stepped up Inflows In 19aB to 1989; reduced Investments In 1990
Reswy7tlon of losns and srd: strlngcnt condltlons In 1989 end 1990 on fmneter and fiscal targets
Reschedul lng of principal payments of loans \n 1987: Wcu money ($700 . mllllon) end kry- back scheme In
January 1990 a
Source: Lamberte, Lim, et.al. (1991)

50
TABLE 15 LABOR FORCE;.EHPL6YHLNT, UNEltPLOYllENT AN0 UNDEREflPLOYliENT (IN TNOUSANDS) . . . . . . . . . . . . . . . . . . . . . . . . . . . . . . . . . . . . . . . . . . . . . . . . . . . . . . . . . . . . . . . . . . . . . . . . . . . . . . . . . . . . . . . . . . . . . . . . . . . . . . . . . . . . . . . . . . . . . . . . . . . . . . . . . . . . . . . . . . . . . . . . . . . . . . . . . . . . . . . . . . . . . . . . . . . . . . . . . . . . . . . . . . . .
EHPLOYED UNEtlPLOYEO UNDEREHPLDYED LABOR . . . . . . . . . . . . . . . . . ..I. . ..I................. . . . . . . . . . . . .._......I
FORCE Level Rate Level Rate Level Rate . . . . . . . . . . . . . . . . . . . . . . . . . . . . . . . . . . . . . . . . . . . . . . . . . . . . . . . . . . . . . . . ..I............................ . . . . . . . . . . . . . . . . . . . . . . . . . . . . . . . . . . . . . . . . . . . . . . . . . . . . . . . . . . . . . . . . . . . . . . . . . . . . . . . . . . . . . . . . . . . . . .
Ilay 1970 (Census) 11566 10734 92.8 032 7.2 IA .
Harch 1971 11732 11101 94.6 631 5.4 1986 17.9 Hay 1971 12223 11624 95.1 599 4.9 1890 16.3 August 1971 12324 11680 94.0 644 5.2 179s 15.4 Novesber 1971 12607 11931 94.6 676 5.4 177s 14.9
1971.Average 12?21.50 11584 94.0 637.5 5.2 1861.50 16.1
February 1972 13172 12244 93.0 920 7.0 1740 14.2 Hay 1972 13140 12176 92.7 964 7.3 1753 14.4 August 1972 12778 11983 93.0 795 6.2 1467 12.2 November 1972 12657 11961 94.5 696 5.5 1550 13.0
1972.Average 12936.75 12091 93.5 845.75 6.5 1627.50 13.5
February 1973 12843 12169 94.0 674 5.2 1570 12.9 liay 1973 13016 12407 95.3 609 4.7 1534 12.4 August 1973 13835 13107 94.7 728 5.3 1925 14.7 November 1973 13024 13141 95.1 603 4.9 1674 12.7
1973.Average 13379.5 12706 95.0 673.5 5.0 1675.75 13.2
February 1974 13466 12897 95.8 569 4.2 1462 11.3 Hay 1974 14024 13324 95.0 700 5.0 1465 11.0 August 1974 13545 12975 95.8 570 4.2 1319 10.2 November 1974 13564 13117 96.7 447 3.3 1416 10.8
1974.Average 13649.75 13078.25 95.0 571.5 4.2 1415.50 10.8
February 1975 13598 13090 96.3 508 3.7 1377 10.5 August 1975 14434 13795 95.6 639 4.4 1925 14.0
1975.Average 14016 13442.5 95.9 573.5 4.1 1651 12.3
August 1976 15460 14662 94.0 790 5.2 1633 11.1 October 1976 14776 1384 1 93.7 935 6.3 AI .
1976.Average 15118 14251.5 94.3 866.5 5.7 1633 11.5
October 1977 1459s 13267 90.9 1328 9.1 2490 18.8
January 1978 14903 13763 92.4 1140 7.6 1571 11.4 April 1978 16387 13982 85.3 2405 14.7 1809 11.2 July 1978 16368 15011 91.7 1357 8.3 3153 21.0 October 1978 16428 15256 92.9 1172 7.1 3612 23.7
1978.Average 16021. S 14503 90.5 1518.5 9.5 2536.25 17.5
January 1979 17135 15920 92.9 1215
October 1980 16855 15491 91.9 1364
7.1
8.1
Al
3437
.
22.2
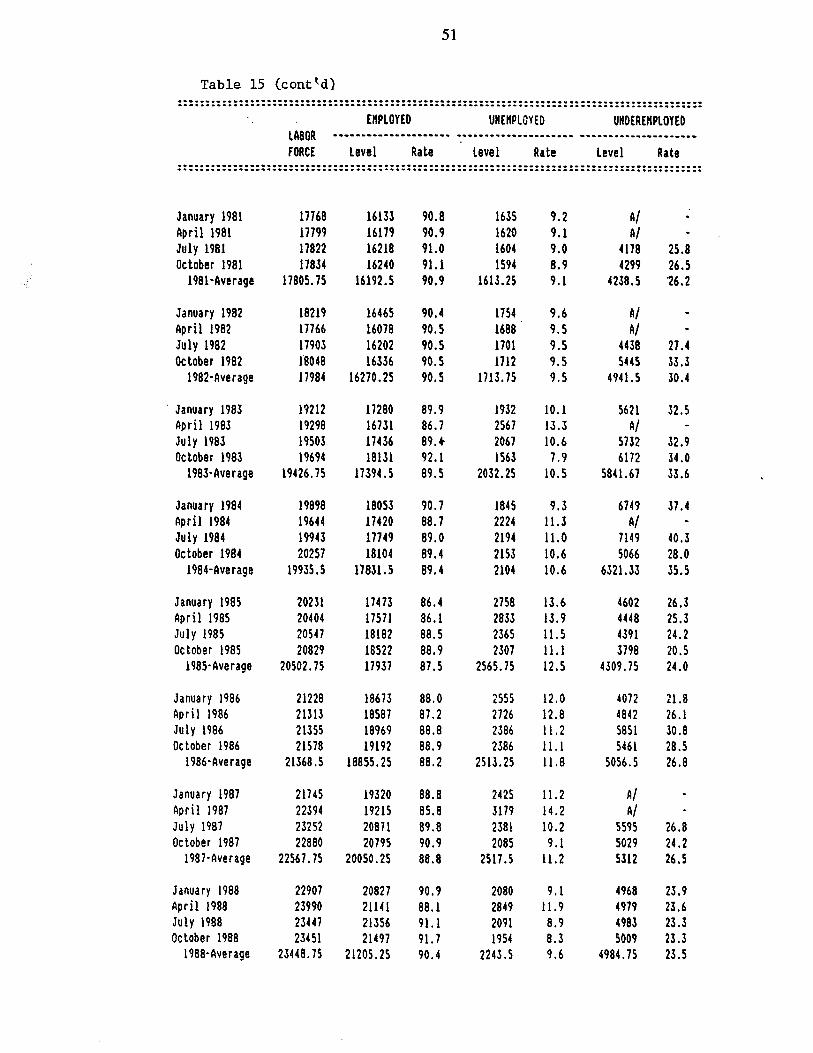
51
Table 15 (cant ‘d) ~.~..~.~...I~..----.-.--.-.-----....--.-.-------.-.--.---.~--.~-.~.-~~.~..~....*~..~~~.~.~.~~. ___...-__...__.-..----.-.-..-----.-.---------------.---------.----.------..----...-.-..-.--.--
EnPlOY ED UNEtiPLOYED UNOEREHPLOY ED ll8OR _--_-__-_-__-_---__.- __-----_-_-__--_.____ -I-----_____-_-__-_-_ FORCE level Rate ’ level Rate Level Rate
--_.-..._-_-._-.-..-..-.-...-.---.-.-.-..---------.--.-.-.-.------.-.-..-.--.--.-.----.-..-.-- -.-.-_..___-___I.--_-.-.--..--.--.----..-.-.--.-.--.-.-.-...-------------.---..----.-..------.
January 1981 17768 16133 90.8 1635 9.2 A! s
April 1981 17799 16179 90.9 1620 9.1 A/ m
July 1981 17822 16218 91.0 1604 9.0 4178 25.8 October 1981 17834 lb240 91.1 1594 8.9 4299 26.5
1981~Average 17805.75 16192.5 90.9 1613.25 9.1 4238.5 26.2
January 1982 18219 16465 90.4 1754 9.6 a/ April 1982 17766 16078 90.3 1688 9.5 Al July 1982 17903 16202 90.5 1701 9.5 4438 October 1982 18048 16336 90.5 1712 9.5 5445
1982~Average 17984 16270.25 90.5 1713.75 9.5 4941.5
- e
27.4 33.3 30.4
January 1983 April 1983 July 1983 October 1983
1983.Average
19212 17280 89.9 1932 10.1 5621 32.5 19298 16731 86.7 2567 13.3 a/ - 19503 17436 89.4 2067 10.6 5732 32.9 19694 18131 92.1 1563 7.9 6172 34.0
19426.75 17394.5 89.5 2032.25 10.5 5841.67 33.6
January 1984 19898 18053 90.7 1845 9.3 6749 37.4 hpril 1984 19644 17420 88.7 2224 11.3 A/ - July 1984 19943 17749 89.0 2194 11.0 7149 40.3 October 1984 20257 18104 89.4 2153 10.6 5066 28.0
1984~Average 19935.5 17831.5 89.4 2104 10.6 6321.33 35.5
January 1985 20231 17473 86.4 2758 13.6 4602 26.3 Clpril 1985 20404 17571 86.1 2833 13.9 4448 25.3 July 1985 20547 18182 88.5 2365 11.5 4391 24.2 October 1985 20829 16522 88.9 2307 11.1 3798 20.5
1985-Average 20502,75 17937 87.5 2565.75 12.5 4309.75 24.0
January 1986 21228 18673 88.0 255s 12.0 4072 21.8 Rpril 1986 21313 18587 87.2 2726 12.8 4842 26.1 July 1986 21355 18969 88.8 2386 11.2 5851 30.8 October 1986 21578 19192 88.9 2386 11.1 5461 28.5
1986~Average 21368.5 18855.25 88.2 2513.25 11.8 5056.5 26.8
January 1987 21745 19320 88.8 2425 11.2 Al fipril 1987 22394 19215 85.8 3179 14.2 A/ July 1987 23252 20871 89.8 2381 10.2 5595 October 1987 22880 20795 90.9 2085 9.1 SO29
1987~Average 22567.75 20050.25 88.8 2517.5 11.2 5312
. 26.8 24.2 26.5
January 1988 22907 20827 90.9 2080 9.1 4968 23.9 Rpril 1988 23990 21141 88.1 2849 11.9 4979 23.6 July 1988 23447 21356 91.1 2091 8.9 4983 23.3 October 1988 23451 21497 91.7 1954 8.3 5009 23.3
1988.Average 23448.75 21205.25 90.4 2243.5 9.6 4984.75 23.5
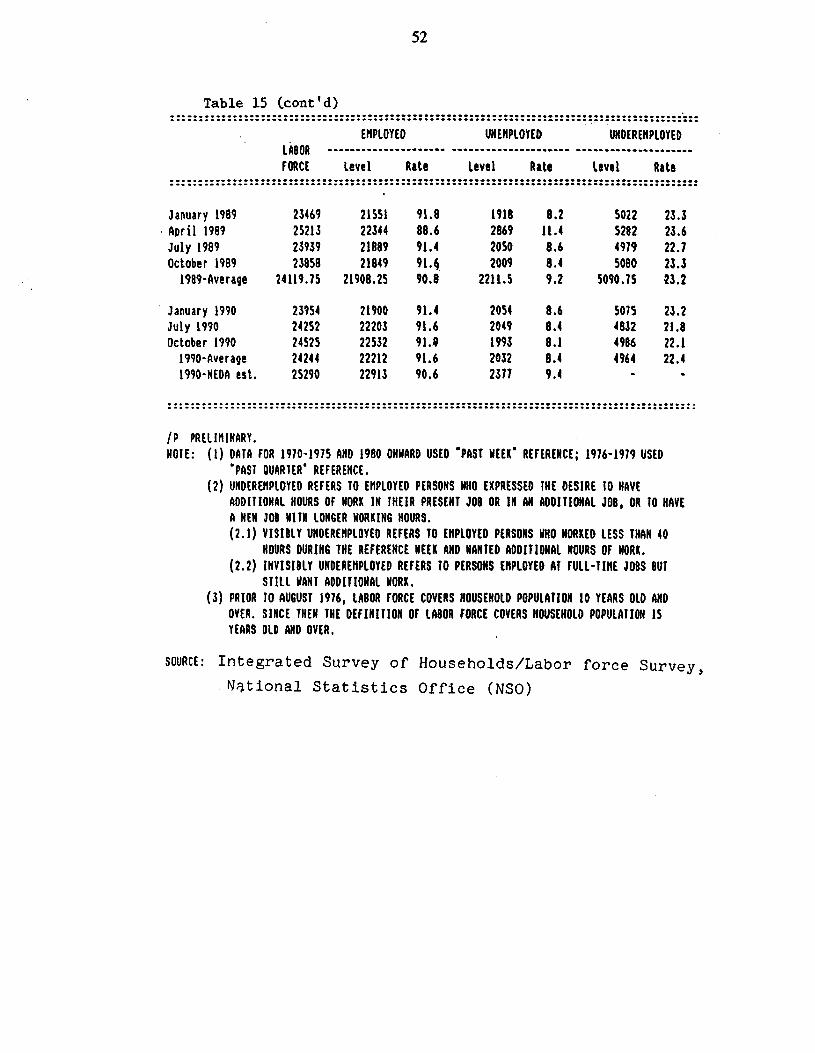
52
Table 15 (cant ‘d) -.._._---..-....1...--.........-- -.-.....-.....-.......-.-..-.-....--...-.....---.-.-.....~-- _-._-_...___._.--.-.-..-------.---.-... --.-.....-.-.-..--.--..----.-..---.-..----.-.-..-..-..- UIPLOY ED UNEHPLOYED UNDEREHPLOYED
1;980R ______-__.-_._-_.-___ --.-.-.-_.-__--_.-.__ ---.-_-_-I_.___-_-.-. FORCE level Rate level flab level Rate
~.~~.~.~.~.-.~..I...-~.....--~.-~-..-....-.....-....--.----......-.-....-....-....~....~..~-.. ____._._.__.._._.._.-.--.-....-.--.---- . . . . . . ..-..*...._._--..--.-..-..-..-------.-.-..-.-....
January 1989 23469 21551 91.8 1918 8.2 5022 23.3 . &vi1 1989 25213 22314 88.6 2869 11.4 5282 23.6
July 1989 23939 21889 91.4 2050 0.6 4919 22.1 October 1989 23858 21849 91.4 2009 0.4 5080 23.3
1989~Average 24119.15 21908.25 90.8 2211.5 9.2 3090.75 23.2
January 1990 23954 21900 91.4 2054 8.6 5015 23.2 July 1990 24252 22203 91.6 2049 0.4 4832 21.8 October 1990 24525 22532 91..9 1993 8.1 4986 22.1
1990-Average 21244 22212 91.6 2032 8.4 4964 22.4 1990-NEOA est. 25290 22913 90.6 2371 9.4 e .
/P PRElItllNARY. NOIE: (1) DAIA FOR 1970-1975 AND 1980 ONWARD USED ‘PAST WEEK’ REFERENCE; 1976-1979 USED
“PAST WARIER’ REFERENCE. (2) UNDEREHPLOYED REFERS 10 EtlPlOYED PERSONS NH0 EXPRESSED THE DESIRE IO HAVE
ADDITIONAl HOURS OF WORK IN THEIR PRESENT JO8 OR IN AN ADDIlIONAl J08, OR 10 HAVE A HEN JO8 WITH 10N6ER WORKING HOURS. (2.1) VISIBLY UNDEREHPLOYED REFERS TO EflPlOYED PERSONS WHO WORKED LESS THAN 40
HOURS DURING THE REFERENCE WEEK AND WANlED ADOIIIONAL HOURS OF HORK. (2.2) INVISIBLY UNDEREHPLOYED REFERS 10 PERSONS EflPLOYED AI FULL-TItlE JOBS BUT
STILL WANT ADDIIIONAl WORK. (3) PRIOR TO AUGUST 1976, lll8OR FORCE COVERS HOUSEHOLD POPULATION 10 YEARS 010 AND
OVER. SINCE THEN THE DEFINIIION OF LABOR FORCE COVERS NOUSEHOLO POPULATION 15 YEARS OLD AND OVER.
SOURCE: Integrated Survey of Households/Labor force Survey, Mqtional Statistics Office (NSO)
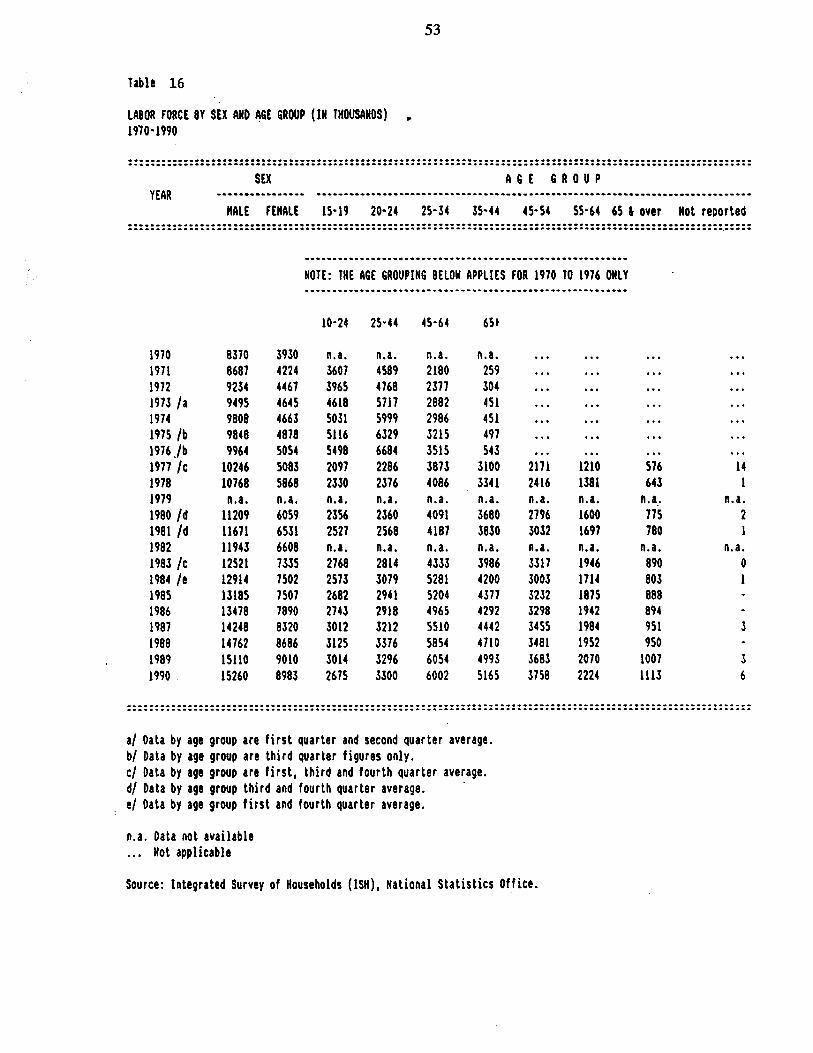
53
Table 16
LABOR FORCE BY SEX AND A61 GROUP (IN THOUSANDS) , 1970-1990
..--_-...-.I..-.-.........-...----.--.-.....-.--.*.--..----------.---..--....-.--....-.-.-..-..----.-.--..------ -.--.____--_--_-...-.--..--..---.---.----.------.--...--.---.-.----.-.--.-....----.--..--------....---.-..--...- SEX A6E GROUP
YEAR -~-~.~.~~~-~-~~- _-_--_-.--.__-._-------------------..-----..------------.----..-------.-------
EIALE: FMALL IS-19 20-21 25-34 35-44 45-54 55-64 65 6 over Not reported _-.--__.-_----_-_-I_.-.--..-..-.-.-----.-.----.-.----.-..------------...--.--.....----..--....--.-...-..--.-.-.- _-_--.-_____-._.__.-.-----..-.-.--.---..--.-..-------- -.-_----.._-_...-_-.--.-------*---..-.--------.-.--------.
NOTE: THE A6E 6ROUPIN6 BELOW APPLIES FOR 1970 10 1976 ONCY .
1970 1971 1972 1973 la 1974 1975 /b 1976 ./b 1977 /c 1978 1979 1900 /d 1901 /d 1902 1983 /c 1904 /e 190s 1906 1907 1900 1909 1990
8370 3930 0607 4224 9234 4467 949s 4645 9000 4663 9040 4070 9964 SOS1
10246 so03 10760 5060
3,:; 3965 4610 so31 5116 5490 2097 2330
n.a. 4509 4760 5717 5999 6329 6604 2206 2376
Ki 2377 2002 2906 3215 351s 3073 4006
n.a. 259 304 451 451 497 543
3100 3341
3nigai 3030
9;;; 4200 4377 4292 4442 4710 4993 5165
. . .
. . .
. . .
. . .
. . .
. . .
. . . 2171 2416
2nigai 3032 n.a.
. . . *.. *..
. . .
. . .
. . .
. . .
. . .
. . .
. . .
. . .
. . .
. . . *.. . . . 576 643
. . .
. . .
1K 11671 11943 12521 12914 1310s 13470 14240 14762 IS110 15260
ii:; 6531 6600 733s 7502 7507 7090 0320 0606 9010 0903
11& 2527 :;;a
2573 2602 2713 3012 3125 3014 2675
9iii 2560 n.a. 2014 3079 2941 2910 3212 3376 3296 3300
1;:; 4107 n.a. 4333 5201 5204 4965 5510 sas4 6054 6002
..* 1210 1301 n.a. 1600 1697 n.a.
n . a.. 77s 700
n.a.
. . . 14 1
n.a. 2 I
n.a. 0 I
3317 1946 090 3003 1714 003 3232 107s 800 3290 1942 094 345s 1901 951 3481 1952 950 3603 2070 1007 3750 2224 1113
___---..------..I-_---...-..--..-.-.-.-------.---.---.--.---- --._.__-.--_-__-.._..-----.-.-.-----.-.-----.-- -._._-..__-_.--_.._.---.--.--..--..-------..-----.--.--.----- .__--_-...____._._...---.---*-.---...-.-----..-
a/ Oata by age group are first quarter and second quarter average. b/ Data by age group are third quarter figures only. c/ Data by age group are first, third and fourth quarter average. d/ Data by age group third and fourth quarter average. e/ Data by age group first and fourth quarter average.
10-24 25-44 45-64 65,
3 6
--.v - . - .
n.a. Data not available . . . Not applicable
Source: Integrated Survey of Households (NH), National Statistics Office.

54
Table .I7 SECTOBAL SBABES IN OUTPUT AND EMPLOYMENT - PHILIPPINES COMPARED TO COUNTRIES AT SIMILAR LEVELS OF DEVELOPMENT, 1984
Industry Agriculture Overall Manufacturing Service
Philippines output Employment
Fifteen Countries with Similar Levels of Per Capita Income
output
25 34 23 41 52 16 9 33
24 29 19 46 62 13 1.5 25
Cited in: World Bank, World Development Report, 1986, and ILO, International Labor Statistics.
Source: World Bank Ilp.z.T\ .-. -, ?.e>Ort Z?o. :/144-PH . . c

55
. Table 18 PHILIPPINES: EMPLOYMENT BY INBUSTBIES (000’S)
1980 1982 1984 Growth rate
1986 1980-86
Wage and Salary 7,720 7,484 8,702 8,958
Agriculture Mining Manufacturing Electricity,
Gas and Water Construction Trade Transportation Financing Sewices
1,474 1,480 2,149 2,102 6.09 81 64 106 103 4.09
1,249 1,228 1,240 1,267 0.24
52 59 65 60 2.41 587 598 682 615 0.78 390 433 506 641 8.63 599 573 717 645 1.24 310 295 341 315 0.27
2,546 2,753 2,891 3,210 3.9p
6,325 6,974 7,590 8,235 4.50 Own Account
Agriculture Mining Manufacturing Electricity,
Gas and Water Construction Trade Transportation Financing Services
4,405 4,735 4,957 5,154 2.65 36 10 22 45 3.79
425 490 487 530 3.75
3 2 1 5 13 16 32
1,118 1,284 1,619 120 155 160
19 25 28 188 257 279
6.99 28.31
8.5.2 9.51
12.73 12.24
58 1,826
207 39
376
Unpaid Family Workers 3,559 4,158 3,075 3,732 0.79
Cite in: NCSO (Integrated Household Survey). ,c--- - - ’ y-c-;< zar--.‘tr ;l;cF> -- - -‘ ?e.port No. 7144-PH.
. ‘.

56
Urban Areas I*
I II 111 Iv v VI VII VIII IX X
Number of HhkJ. heeds self-employed 46
Self-Emptoyed Income . (share)
Self-Employed Income per worker (pesos)
11% 12% 10% 11% 9% 10% 9% 8% 946 1196.
80% 79% 80% 80% 78% 78% 78% 79% 77% 81% .
19885 18787 19895 22334 28182 30475 37030 45879 82983 la1 548
I* Excludes urban farmers
- .. I Teble 20 Self-Employed Households, by Decile end Household Heed Occupation
Urban Areas
I II . Ill IV V VI VII VIII IX X
Self-employed workers 83% 88% 81% 80% 88% 81% 83% 90% 81% 80% Without employees 82% 84% 74% 73% 78% 75% 88% 88% 59% 37% Hire Labor 1% 2% 8% 7% a% 8% 17% 22% 22% 43%
Other Occupetions 17% 14% 19% 20%’ 14% 19% 17%* 10% 19% 20%
Total 100% 100% 100% 100% 100% 100% 190% 100% 100% 100%
Source: FIES 1988 Tapes I I
Source: Hakim (1991)

57
OVERSEAS EMPLOYMENT, 1972-1991
YEAR Total Land-Based Sea-based -*t--===~==---=--===----===========~==~======~~===
1972 ., 14,366 1973 36,418 1974 33,157 1975 36,035 1976 47,835 1977 70,375 1978 88,241 1979 137,337 1980 214;590 1981 266,243 1982 314,284 1983 434,207 1984 425,081 1985 389,200 1986 414,461 1987 449,271 1988 471,030 1989 458,626 1990 446,095 1991 /a 546,897
12,501 23,534 19,221 28,614. 36,376 33,699 50,961 37,2,80 92,519 44,818
157,394 57,196 210,936 55,307 250,115 64,169 380,263 53,944 371,065 54,016 337,754 51,446 357,687 56,774 382,229 67,042 385,117 85,913 355,346 103,280 334,883 111,212 431,426 115,471
u---------------=--------=-------------------------- - - - - - - - -w- - -B- - - - - - - - - - - ---------------------m-m-s
a/ As of November.
Note: Data from 1972 to 1986 refers to processed workers, while the data from 1987 onwards refers to deployed workers.
Source: Current Labor Statistics, Bureau of Labor and Employment Statistics.

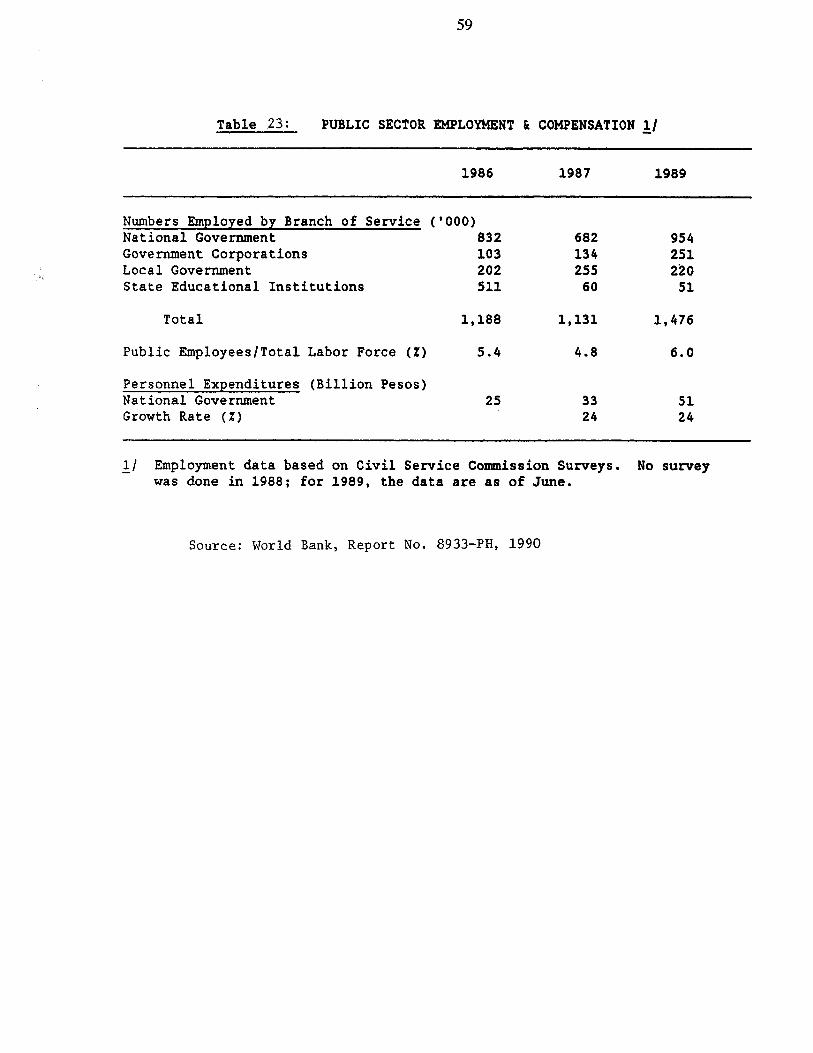
59
Table 23: PUBLIC SECTOR EMPLOYMENT h COMPENSATION L/
1986 1987 1989
Numbers Employed by Branch of Service ('000) National Government 832 Government Corporations 103 Local Government 202 State Educational Institutions 511
Total 1,188 1,131 1,476
Public Employees/Total Labor Force (2) 5.4 4.8 6.0
Personnel Expenditures (Billion Pesos) National Government Growth Rate (X)
25
682 954 134 251 255 2'20
60 51
33 51 24 24
L/ Employment data based on Civil Service Commission Surveys. No survey was done in 1988; for 1989, the data are as of June.
Source: World Bank, Report No. 8933-PH, 1990

60
TABLE 24
WGCEHI DISlRlBUlIDH OF UNEHPLDVED PERSONS KY St1 RHO R6E GROUP
. . . ..___._.__............~...........................~.~...~..................--..---...--....--...“.-----...--.--....~.~.“...”~”.~.”~.~~~”“““~~““..””...
: 1918 I 1980 f 1981 t 1912 I 1983 : ! kae Group :Both Sexes Hale Female 110th Sexes Hale Female !Both Sexes Hale female !Both Sexes Hale foale :Botb Sexes lhlc Farlc :
I ’ lS-19 : 22.2 26.9 : 10-16 ; 21.1 31.4 : IS-34 ; 23.6 19.1 ! JS-64 ; 12.1 1.9 : 41-54 : 1.3 5.9 ! IS-b4 : 5.0 6.1 I65 and over: 2.0 2.5 4 I
t
. . . . . . . . . . . . . . . . . . . . . . . . . . . . . . . . . . . . . . . . . . . . . . . . . . . . . . . . . . . . . . . . . . . . . . . . . . . . . . . . . . . . . ..“.~..“.“.....~.“.“.“““~.“~““““~..
I I I I : 19.1 I 23.6 30.1 18.7 f 22.2 26.9 19.1 i 23.6 30.1 18.1 ) 11.4 21.0 11.1 : 23.2 ; 30.5 32.1 29.0 ; 21.1 32.4 21.2 I 30.5 32.1 29.0 ; 32.6 3b.3 JO.0 f 25.1 I 22.3 11.1 25.4 1 23.6 19.1 25.1 I 22.3 11.7 25.4 I 142 21.1 lb.3 : IS.4 I 11.1 1.8 14.4 ; 12.1 5.9 15.4 I 11.1 Y 1.8 14.4 I 10.1 8.2 ; 11.1 8.1 : 1.2 5.0 8.1 ; 1.3 5.9 8.1 1 1.2 3.0 8.1 ; b.5 6.8 b.3 ; 4.1 : 3.3 3.9 2.9 ) 5.0 6.1 4.2 : 3.3 3.9 2.9 ( 3.9 4.0 3.9 ;
1.8 ; 1.4 2.1 0.9 ; 2.0 2.5 1.8 i 1.4 2.2 0.9 I 1.3 2.1 0.8 : 1 I i I I I
--.-----.-.----.---f....................-.....................-......-...........................................~““....
----.-.---.-....-...______________f_____...........“..........-......-......................................................”
I I : 1984 ; 1985 I 1986 I 1981 : i Aae Group :Both Sexes Hale Feuale iBoth Sexes Hale feeale 180th Sexes Hale Feeale :Both Sexes Bale Feuafa ) --.------...--.~-.........................................................~....................~...~..~.........~~.“.~..“.... I I I I I I I .
I 15-19 ; 17.9 18.3 17.3 : 20.9 20.1 21.1 : 11.5 18.0 17.1 : 19.8 lb.8 21.4 i ;
( 20-24 ; 26.5 24.2 30.4 ; 32.4 32.1 32.1 : 32.b 31.3 33.8 ( 22.1 28.9 32.9 : - : 25-34 f lb.2 26.3 26.0 ; 21.6 21.1 17.5 ) 28.4 28.3 28.4 : 15.4 lb.2 11.9 ; : 35-44 ; 11.3 12.1 9.9 I 11.1 10.8 11.1 ; 11.1 10.0 12.1 ; 10.3 11.6 9.2 : : 45-14 ; 8.5 9.3 1.2 : 5.2 4.9 1.1 ; 6.0 6.1 5.4 ; 1.1 8.0 Lb ; ( 51-64 : 1.3 5.8 4.5 ] 2.0 2.1 i.9 f 2.9 3.1 2.3 ; 5.9 5.2 2.3 i !bS and over! 4.3 4.2 4.3 1 0.8 1.1 0.5 I 1.4 1.8 1.0 I 4.6 4.9 3.9 I
0 I I I I 0 I I
----..-.-----..--..............................................................................~....................~~..“....
Source: Oecartaeat of labor, Yearbook of labor Statistics, various issues. NCSD, Integrated Survey of Households (Unpublished).
f
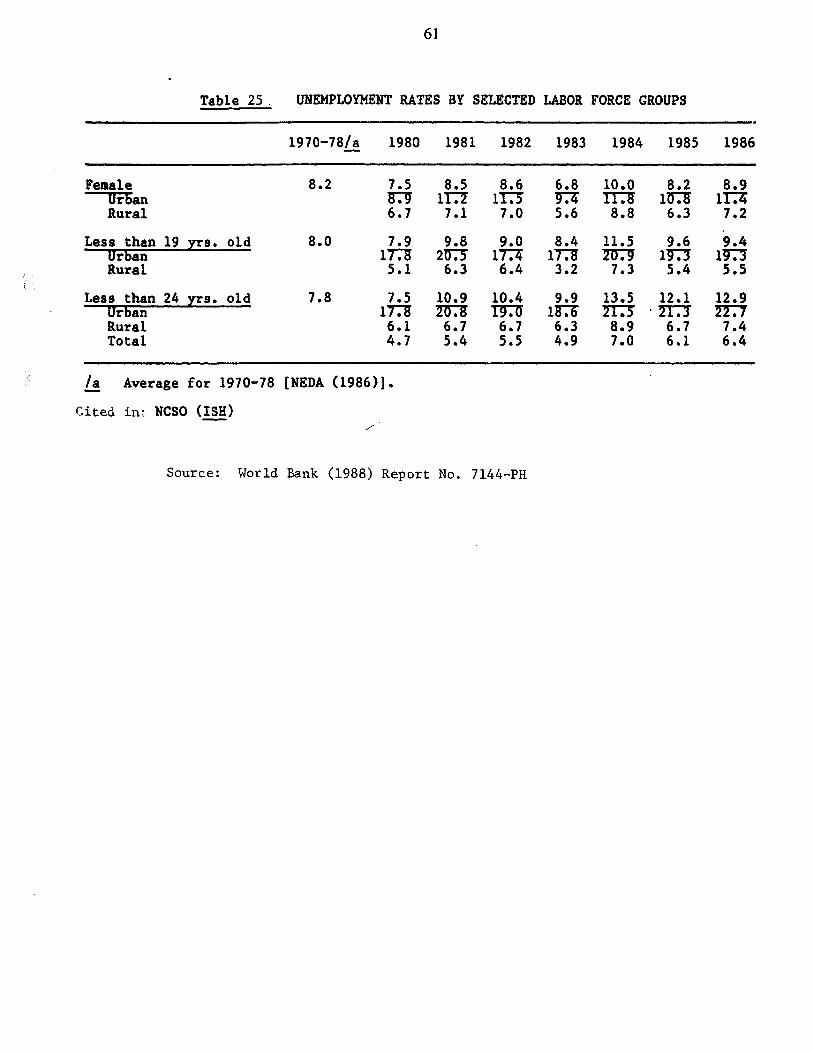
61
Table 25 UNEMPLOYMENT RATES BY SELECTED LABOR FORCE GROUPS
1970-78/a 1980 1981 1982 1983 1984 1985 1986
Female 8.2 Uri)an
f&l G 8& 8&
Rural 7.1 7.0 5.6 8.8 6.3 7:2
Less than 19 yrs. old 8.0 Urban
7& 29& 9&
Rural 5:l 6:3 6:4
8& p& 9.& 9&
3:2 7:3 5:4 5:5
Less than 24 yrs. old 7.8 Urban
7& y& +o& 9& +3& l2& y&
Rural 2: ;:i $2 t:; 8.9 6.7 Total 7.0 6.1 ;::
/a Average for 1970-78 [NEDA (198611.
Cited in: NCSO (ISH) /-
Source: World Bank (1988) Report No. 7144-PH

62
TABLE 26
LJNDEREMPLOYMENT RATE BY SEX, 1971-15’87 (In %)
_---___-----__----------------------------------------------------------
Year UNDEREMPLOYMENT RATE Total Male Female
________----________----------------------------------------------------
1371 15 1.5.8 13.3 1972 13.3 14.7 10.1 1373 12.1 12.9 8 ..9 1974 10.1 11.1 8.1 1375 13.3 14.4 7.5 1376 10.6 11.8 8 .2 137 7 17.4 18.6 14.8 1978 19.6 20.9 17.2 1380 20.3 22.6 17.6 1981 23.9 26.3 19.7 1322 25.5 28 21 1383 29.8 32.2 25.9 L384 36.4 39.3 31.5 1985 22.2 24.9 17.5 1986 28.4 31.5 23.2 1987 24.2 27.2 18.9
Source: NEDA (1986), Compendium of Philippine Social Statistics. NSD, Integrated Survey of Households, various issues
(Unpublished).

63
Table 27 PHILIPPINES: URBAN UNDEREMPLOYMENT BY SCHOOLING LEVELS /a AND EARNINGS /b
(percentages and con&an?-1985 pesos)
1980 1981 1982 1983 1984 1985 1986
100 100 (2,770) (3,080)
Total Underemployment
Earnings 100 100 100 100 100
(4,650) (4,502) ci,124) cgiti) 3,070
No schooling 4.3 2.9 1.9 2.6 2.3 0.9 2.3
Elementary 47.8 43.5 44.8 Earnings (2,900) (3,440) (3,940)
44.6 45.5 42.9 38.6 (3,460) (2,005) (2,012) (2,070)
High School 31.9 Earnings (4,060)
34.5 36.4 (4,430) (4,470)
34.1 37.2 37.4 39.8 (4,700) (2,970) (2,600) (2,510)
College . Undergrad. (5 ,%
12.0 10.9 12.2 (5,160) (5,600) (5,200)
11.6 12.5 (4,170) (4,250)
College Graduates t8,%
/a z
Highest degree completed. Figures indicate the number of persons in each group expressed as a proportion of the total number of urban underemployed in each group. The total average family per capita income of each group in 1985 pesos is shown in parentheses.
Cited in: World Bank (1988) Source: World Bank (1988) Report No, 7144-PH.
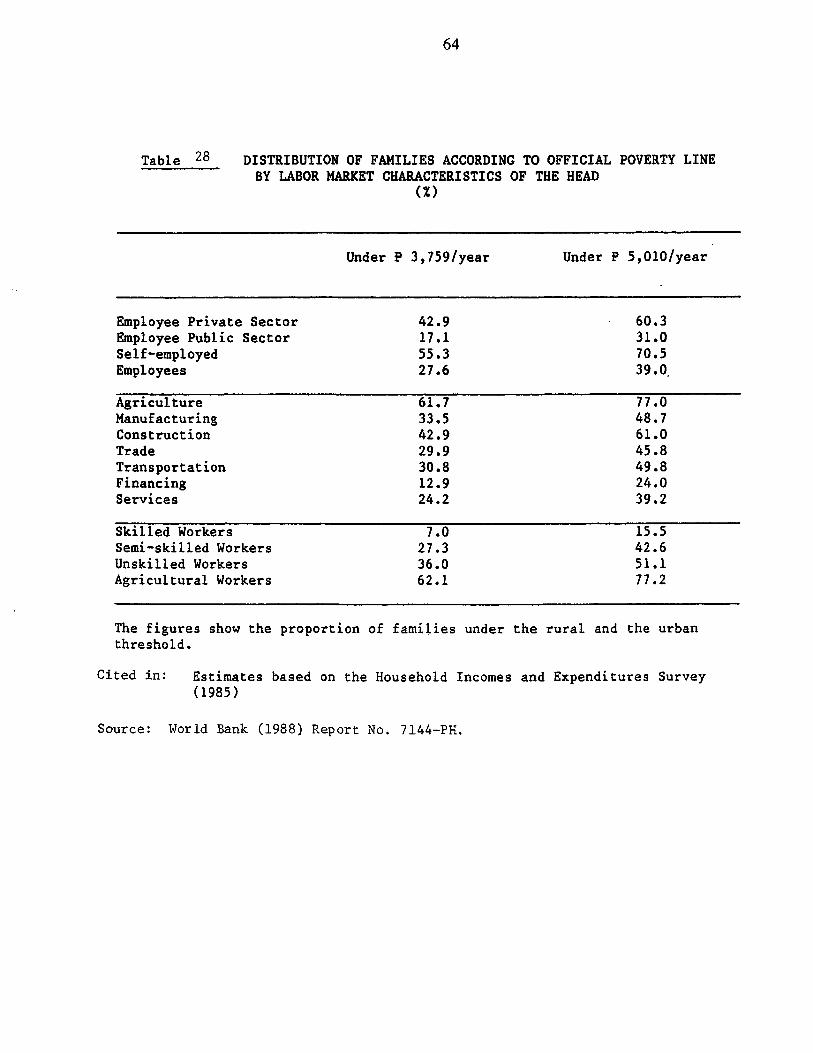
64
Table 28 DISTRIBUTION OF FAMILIES ACCORDING TO OFFICIAL POVERTY LINE BY LABOR MARKET CHARACTERISTICS OF THE HEAD
(%I
Under P 3,759/year Under P S,OlO/year
Employee Private Sector 42.9 60.3 Employee Public Sector 17.1 31.0 Self-employed 55.3 70.5 Employees 27.6 39.0.
Agriculture 61.7 77.0 Manufacturing 33.5 48.7 Construction 42.9 61.0 Trade 29.9 45.8 Transportation 30.8 49.8 Financing 12.9 24.0 Services 24.2 39.2
Skilled Workers 7.0 15.5 Semi-skilled Workers 21.3 42.6 Unskilled Workers 36.0 51.1 Agricultural Workers 62.1 77.2
The figures show the proportion of families under the rural and the urban threshold.
Cited in: Estimates based on the Household Incomes and Expenditures Survey (1985)
Source: World Bank (1988) Report No. 7144-PH.

65 . .
Table 29. PHILIPPINES: HEAL WAGE INDEXES (1972 = 100)
(1) (2) Skilled Workers Unskilled Workers
(3) Agricultural Workers
1960 133.4 107.9 144 1965 115.2 102.7 127 1970 114.4 111.6 102 1975 72.7 72.9 107 1980 63.7 60.7 92 1981 68.4 65.4 90 1982 76.8 71.3 97 1983 87.1 72.6 104 1984 69.5 75.1 89 1985 66.6 75.7 89 1986 60.3 73-S 98
Cited.%n$ Columns (1) & (2), Central Bank and staff estimates; (3) La1 (1983) (1960-701, and staff estimates with data provided by the Bureau of Agricultural Economics, Ministry of Agriculture and Food.
,$ource: World Bank (1988) RepPot :io. 71&:.-Z?:,
. . . .

66
Table 30 LABOR COMPENSATION MEASURES A/ (Annual Growth Rates, Percent)
1985. 1986 1987 1988 1989
1. Real Compensation Per Employee
2. Real Minimum Wages (1978 prices)
A. Non-Agricultural NCR -2.5 ONCR -4.4
B. Agricultural Plantation -4.8 Non-Plantation -3.5
3. Daily Real Wages
4. Daily Real Wages in Manuf. A. Skilled -11.4 B. Unskilled -3.7
12.8 21 7.2 10.5 21
-5.0 -4.4 8.1 9.0 0.2 -1.0 11.7 7.9
0.2 -1.1 0.1 -0.8
5.1 4.8
-1.8 6.6 -5.0 -1.2
13.2 11.1 19.0 5.8
6.8
I/ Compensation includes all earnings in cash and in kind and employers' contribution to social security. Daily wages on Line 3 are based on National Wages Council definition, those on line 4 refer to Metro Manila only.
2/ Increase between first and fourth quarter. 3J Data refers to the third quarter.
Source: Current Labor Statistics (DOLE, BLES), March 1990, Edna Reyes and Ma. Teresa C. Sanchez: An Assessment to Labor and Employment Policies in the Philippines, 1986-88, Manila: PIDS, Working Paper No, 90-09, pp. 22-23 and National Wages Council. International Labor Office, cf. in Gysbert and Papola, p. 39.
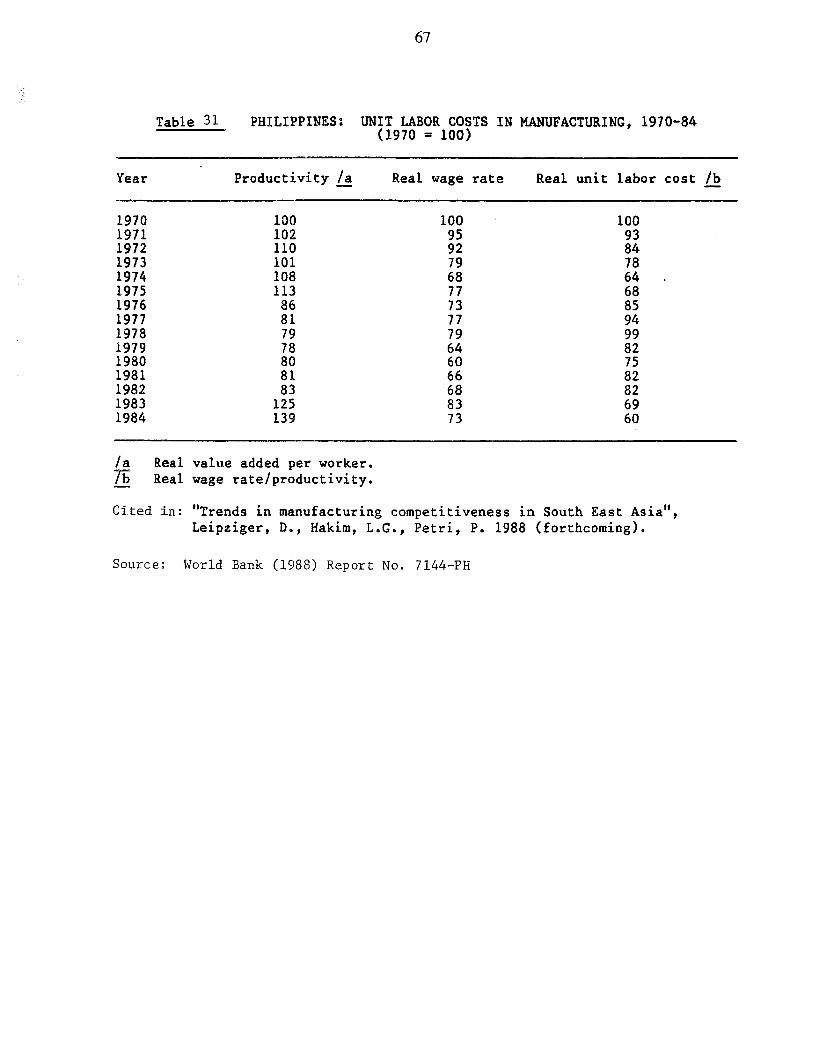
67
Table 31 PHILIPPINES: UNt;,~,,;C;TS IN MANUFACTURING, 1970-84
Year Productivity /a Real wage rate Real unit labor cost /b
1970 1971 1972 1973 1974 1975 1976 1977 1978 1979 1980 1981 1982 1983 1984
100 102 110 101 108 113
86 81 79
ii: 81
1:; 139
100
8;
ii 77 73
:;
:: 66 68 83 73
82 75
t2’ 69 60
/a Real value added per worker. E Real wage rate/productivity. -
Cited in: "Trends in manufacturing competitiveness in South East Asia", Leipziger, D., Hakim, L.G., Petri, P. 1988 (forthcoming).
Source: World Bank (1988) Report No. 7144-PH
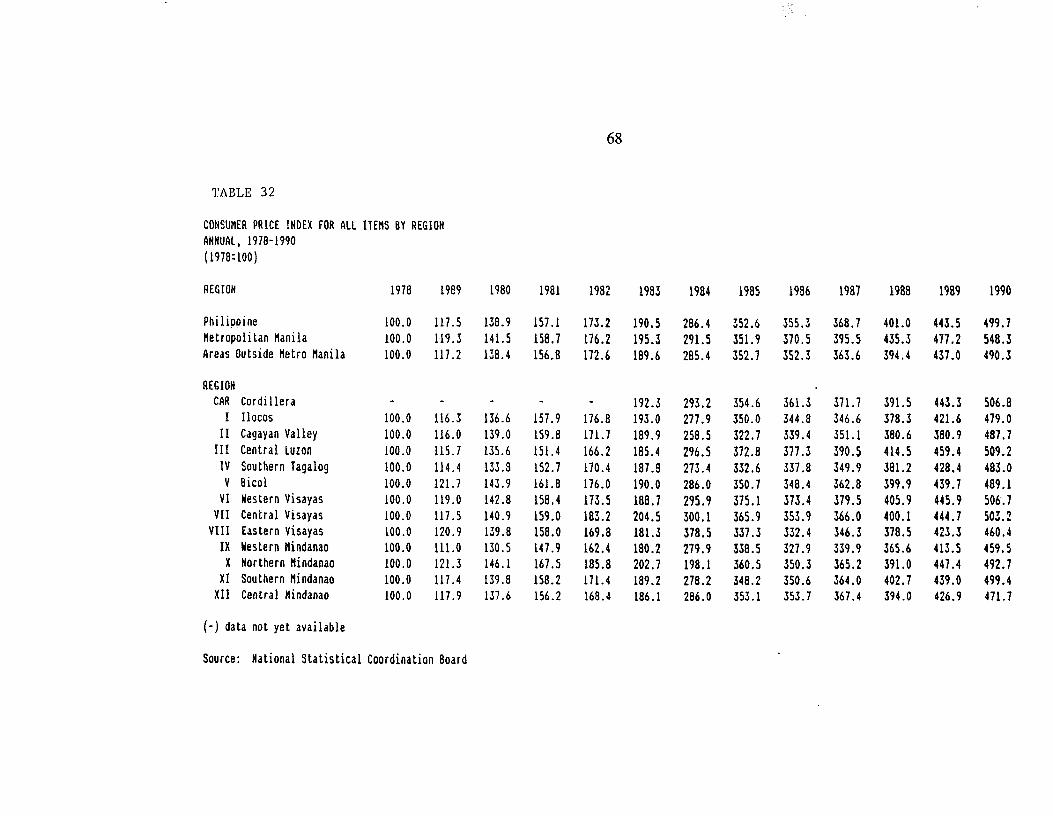
68
TABLE 32
CONSUMER PRICE INDEX FOR ALL ITEM 8Y REGION ANNUAL, 1978-1990 (1978:100)
REGION 1978 19e9 1980 1981 1982 1933 1984 1985 1986 1987 1988 1989 1990
Philippine 100.0 117.5 138.9 157.1 173.2 190.5 286.4 352.6 355.3 368.7 401.0 443.5 499.7 Hetropolitan Manila 100.0 119.3 141.5 158.7 176.2 195.3 291.5 351.9 370.5 395.5 435.3 477.2 548.3 Areas Outside Metro Manila 100.0 117.2 138.4 156.8 172.6 189.6 205.4 352.7 352.3 363.6 394.4 437.0 490.3
REGION CAR Cordillera
I Ilocos II Cagayan Valley
III Central Luzon IV Southern Tagalog V Bicol
VI Western Visayas VII Central Visayas
VIII Eastern Visayas IX Western blindanao X Northern Mindanao
XI Southern Hindanao XII Central Jlindanao
-
100.0 100.0 100.0 100.0 100.0 100.0 100.0 100.0 100.0 100.0 100.0 100.0
- - - -
116.3 136.6 157.9 176.8 116.0 139.0 159.8 171.7 115.7 135.6 151.4 166.2 114.4 133.9 152.7 170.4 121.7 143.9 161.8 176.0 119.0 142.8 158.4 173.5 117.5 140.9 159.0 183.2 120.9 139.8 158.0 169.8 111.0 130.5 147.9 162.4 121.3 146.1 167.5 185.8 117.4 139.8 158.2 171.4 117.9 137.6 156.2 168.4
192.3 293.2 354.6 361.3 371.7 391.5 443.3 193.0 277.9 350.0 344.8 346.6 370.3 421.6 189.9 258.5 322.7 339.4 351.1 380.6 380.9 135.4 296.5 372.8 377.3 390.5 414.5 459.4 187.9 273.4 332.6 337.3 349.9 381.2 428.4 190.0 286.0 350.7 348.4 362.8 399.9 439.7 188.7 295.9 375.1 373.4 379.5 405.9 445.9 204.5 300.1 365.9 353.9 366.0 400.1 444.7 181.3 378.5 337.3 332.4 346.3 378.5 423.3 180.2 279.9 330.5 327.9 339.9 365.6 413.5 202.7 198.1 360.5 350.3 365.2 391.0 447.4 189.2 278.2 348.2 350.6 364.0 402.7 439.0 186.1 286.0 353.1 353.7 367.4 394.0 426.9
506.3 479.0 487.7 509.2 483.0 489.1 506.7 503 2 . 460.4 459.5 492.7 499.4 471.7
(-) data not yet available
Source: National Statistical Coordination 8oard

69
Table 33 SOCIAL SPENDING: PHILIPPINES AND LOWER MIDDLE INCOME COUNTRIES, 1985
(X of GNP)
Philippines Government Total
Lower middle income countries
Government Total
Education Health-care Nutrition Social Security Housing
1.8 n-a. 3.7 n.a. 0.6 2.5 1.0 d.a. 0.06 n.a. 0.7 0.7 2.5 0.4 3.7 1.9 n.a,
Total 3.6 6.6
Source: World Bank (1988) Report No. 7144-PH.
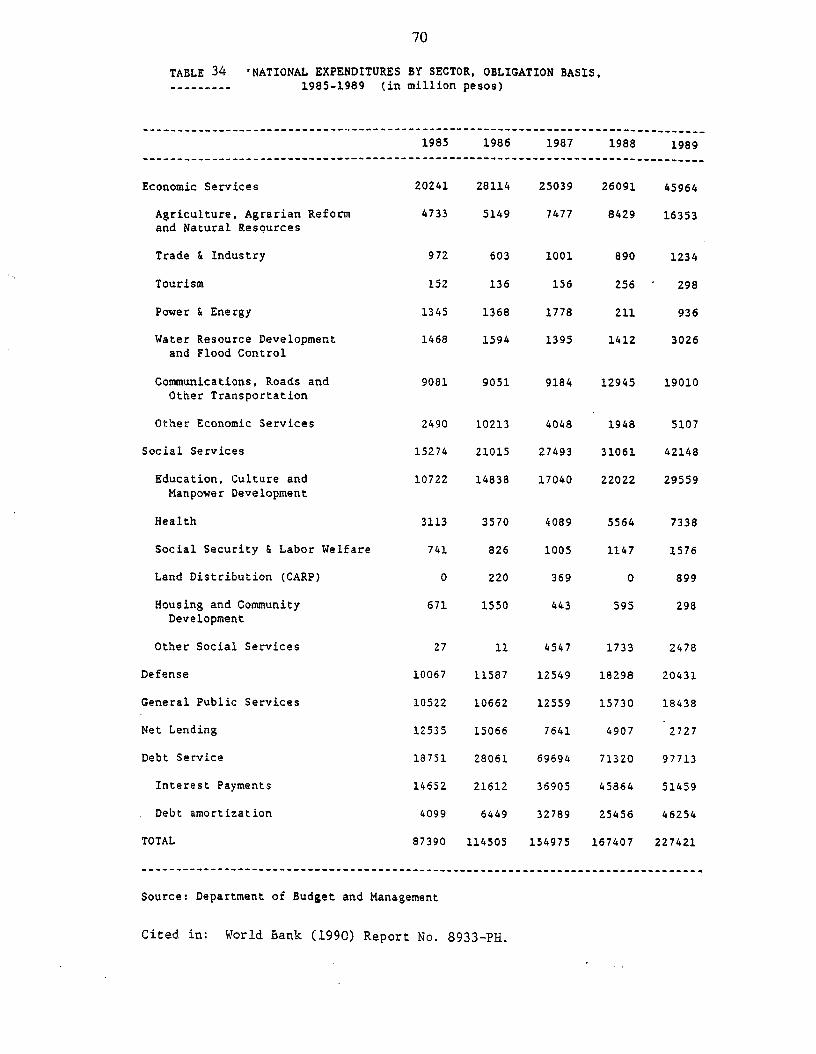
70
TABLE 34 'NATIONAL EXPENDITURES BY SECTOR, OBLIGATION BASIS, -----a--- 1985-1989 (in million pesos)
-_---"-------------------- ___"__------_------------------------------------------ 1985 1986 1987 1988 1989
------__----_--------~-------- _--_-----------------------------------------------
Economic Services
Agriculture, Agrarian Reform and Natural Resources
Trade & Industry
Tourism
Power & Energy
Water Resource Development and Flood Control
Communications, Roads and Other Transportation
Other Economic Services
Social Services
Education, Culture and Manpower Development
Health
Social Security & Labor Welfare
Land Distribution (CARP)
Housing and Community Development
Other Social Services
Defense
General Public Services
Net Lending
Debt Service
Interest Payments
Debt amortization
TOTAL
20241
4733
28114 25039 26091 45964
5149 7477 8429 16353
972 603 1001 890 1234
152 136 156
1345 1368 1778
1468 1594 1395
256 298
211 936
1412 3026
9081 9051 9184 1294s 19010
2490 10213
15274 21015
1948
31061
10722 14838
4048
27493
17040 22022
5107
42148
29559
3113 3570 4089 5564 7338
741
0
1005
369
1147
0
671
826
220
1550 443 595
1576
899
298
27
10067
10522
12535
11
11587
10662
15066
4547
12549
12559
1733 2478
la298 20431
18751
14652
28061
21612
6449
7641
69694
36905
32789
154975
15730
4907
71320
45864
18438
4099
87390
25456
114505 167407
2727
97713
51459
46254
227421
Source: Department of Budget and Management
Cited in: World bank (199C) Report No. 8933-PH.
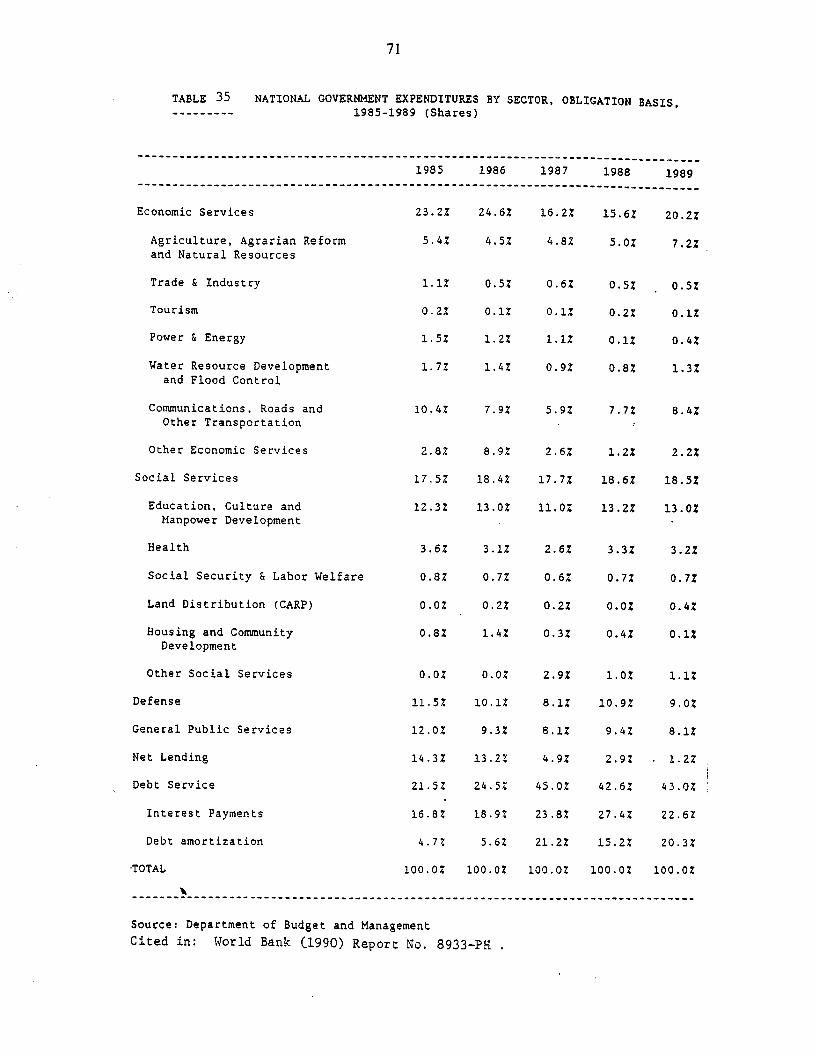
71
TABLE 35 NATIONAL GOVERNMENT EXPENDITURES --------- 1985-1989 (Shares)
BY SECTOR, OBLIGATION BASIS,
1985 1986 1987 1988 1989
Economic Services
Agriculture, Agrarian Reform and Natural Resources
Trade & Industry
Tourism
Power b Energy
Water Resource Development and Flood Control
Communications, Roads and Other Transportation
Other Economic Services
Social Services
Education, Culture and Manpower Development
Health
Social Security & Labor Welfare
Land Distribution (CARP)
Housing and Community Development
Other Social Services
Defense
General Public Services
Net Lending
Debt Service
Interest Payments
Debt amortization
.TOTAL
23.2%
5.4%
1.1%
0.2%
1.5%
1.7%
10.4%
2.8%
17.5%
12.3%
3.6%
0.8%
0.0%
0.8%
0.0%
11.5%
12.0%
14.3%
21.5%
16.8%
4.7%
100.0:
24.6%
4.5%
0.5%
0.1%
1.2%
1.42
7.9%
8.9%
18.4%
13.0%
3.1%
0.7%
0.2%
1.4%
0.0%
10.1%
9.3%
13.2%
24.5::
18.92
5.6%
100.0%
16.2%
4.8%
0.6%
0.1%
1.1%
0.9%
5.9%
2.6%
17.7%
11.0%
2.6%
0.6%
0.2%
0.3%
2.9%
8.1%
8.1%
4.9%
45.0%
23.8%
21.2%
100.0%
15.62
5.0%
0.5%
0.2%
0.1%
0.8%
7.7%
1.2%
18.6%
13.2%
3.3%
0.7%
0.0%
0.4%
1.0%
10.9%
9.4%
2.9%
42.6%
27.4%
15.2%
100.0%
0.5%
0.1%
0.4%
1.3%
8.4%
2.2%
18.5%
13.0%
3.2%
0.7%
0.4%
0.1%
1.1%
9.0%
8.1%
. 1.22 ,
43.0% ;
22.6%
20.3%
100.0%
\ ---------------------------------------------------------------------------------
Source: Department of Budget and Management Cited in: World Bank (1990) Report No. 8933-PE .

72
Table 36 Real Per Capita Expenditure
on Economic and Social Services, Obligation Basis
1975-1990 T------- -------------------------------------------- ___^_-__-------------------------------------------- Expenditure Social
____---_---------- ----"'----p---------'------'-'--' 1975 276.41 104.48 1976 277.60 114.59 1977 230.91 105.89 1976 264.23 121.96. 1979 273.43 134.45 1960 247.33 126.77 1981. 3OO.OO 135.39 1962 278.20 131.06 1963 251.1.0 132.04 1964 176.90 82.86 1985 169.00 77.92 1966 207.67 126.57 1987 157.67 113.89 1.988 140.60 127.08 1989 155.63 147.11 1990 176.68 167.06 _____-___--__--------------------------------------- _____________---------------------------------------
Source of Basic Data: Department of Rudget and Management