the phonetics of register in takhian thong...
TRANSCRIPT

The Phonetics of Register in Takhian Thong Chong
Christian T. DiCanio∗
University of California, Berkeley
Abstract
The language Chong uses a combination of different acoustic correlates to distinguish among its fourcontrastive phonation types (registers). Electroglottographic and acoustic data were examined fromoriginal fieldwork on the Takhian Thong dialect. EGG data shows high open quotient (OQ) values forthe breathy-modal register, low OQ values for the modal-tense register, intermediate OQ values for themodal register, and rapidly changing high to low OQ values for the breathy-tense register. Acousticcorrelates indicate that H1-A3 and H1-A2 best distinguish between breathy and non-breathy phonationtypes, but measures like H1-H2 and pitch are necessary to discriminate between tense and non-tensephonation types. A comparison of spectral tilt and OQ measures shows the greatest correlation betweenOQ and H1-H2, suggesting that changes in the relative amplitude of formants are not directly relatedto changes in the open period of the glottal cycle. OQ is best correlated with changes in the degree ofglottal tension.
1 Introduction
Chong is an Austroasiatic language (Mon-Khmer: Pearic) spoken in Chanthaburi province, Thailand and innorthwestern Cambodia (Choosri 2002). This study investigates the phonetics of register in the dialect ofChong spoken in the Takhian Thong community. The term register is used in the Southeast Asian linguisticliterature with reference to a collection of contrastive suprasegmental properties like phonation type, pitch,vowel quality, intensity and vowel duration (Henderson 1952, 1985). A register language is distinct from atone language because contrastive phonation type typifies the former while the contrastive pitch typifies thelatter. Phonation type is to a register language what tones are to a tone language.
Most register languages contrast only two phonation types, e.g. Middle-Khmer (Jacob 1968) and Wa(Watkins 2002). Those which contrast three are quite rare, but do exist, e.g. Jalapa Mazatec (Kirk,Ladefoged & Ladefoged 1993) and Bai (Edmondson and Esling 2006), and, of course, languages with a 4-way phonation-type contrast are extremely rare. Only two languages in the world have been found to usethis number of contrasts: Chong (Thongkum 1991) and !Xoo (Traill 1985). Chong contains both dynamic(contour) and level registers. There is a modal register, a modal-tense register, a breathy-modal register, anda breathy-tense register. While the temporal dynamics of pitch is considered significant in the productionand perception of tone (Bao 1999, Gordon 2001, Avelino 2003, Liu & Samuel 2004, Khouw & Ciocca 2007,etc.), there are very few studies that have focused on the temporal dynamics of phonation type with respectto register.1 This is understandable as both tone and tonal contours are much more common in languagesof the world than register and register contours are. However, the existence of such patterns necessitates aphonetic analysis of how they are produced for both research in phonetic typology and research investigating
∗Data in this paper come from the author’s fieldwork. I would like to acknowledge Suwilai Premsrirat and Sompop Ngammasat Mahidol University for their generous help in making research with Chong speakers possible. I would also like to acknowledgeKeith Johnson and Reiko Kataoka for comments on this paper. A special thanks is given to Sam Tilsen for providing a Matlabscript for EGG data extraction. This work was supported by a block grant from the Social Sciences Division at University ofCalifornia, Berkeley.
1Thongkum 1988 (on Chong) and Esposito 2004 (on Zapotec) are notable exceptions.
UC Berkeley Phonology Lab Annual Report (2007)
459
the acoustic and articulatory manifestation of distinct glottal states. The notion of a tonal contour is well-known to most phonologists, where a single prosodic unit may have two or more suprasegmental specificationsgiven an autosegmental representation (Goldsmith 1976). However, the presence of phonation-type contoursimplies that multiple laryngeal specifications may be present on a single prosodic unit. Phonation maybehave prosodically like tone in its representation in the phonology of a language.
Apart from describing the phonetics of a typologically rare contrast, this study investigates changes inphonation type along the duration of Chong vowels contrasting the different registers. Both electroglotto-graphic (EGG) and acoustic recordings were used to analyze the differences among the registers. A numberof spectral tilt measures and F0 were compared using linear discriminant analysis (LDA). These measuresare compared to the articulatory data from the EGG signal. The results suggest that changes in H1-H2 arecorrelated more closely with changes in open quotient (OQ) derived from the EGG signal than mid-bandspectral slope measures like H1-A2 and H1-A3 are. While a number of parameters are predicted to signifi-cantly contrast the four registers, H1-A3 and H1-A2 significantly distinguishes the breathy registers from thenon-breathy ones while H1-H2 significantly distinguishes registers with increased glottal tension from thoselacking it.
2 Background
2.1 Chong Segmental Phonology
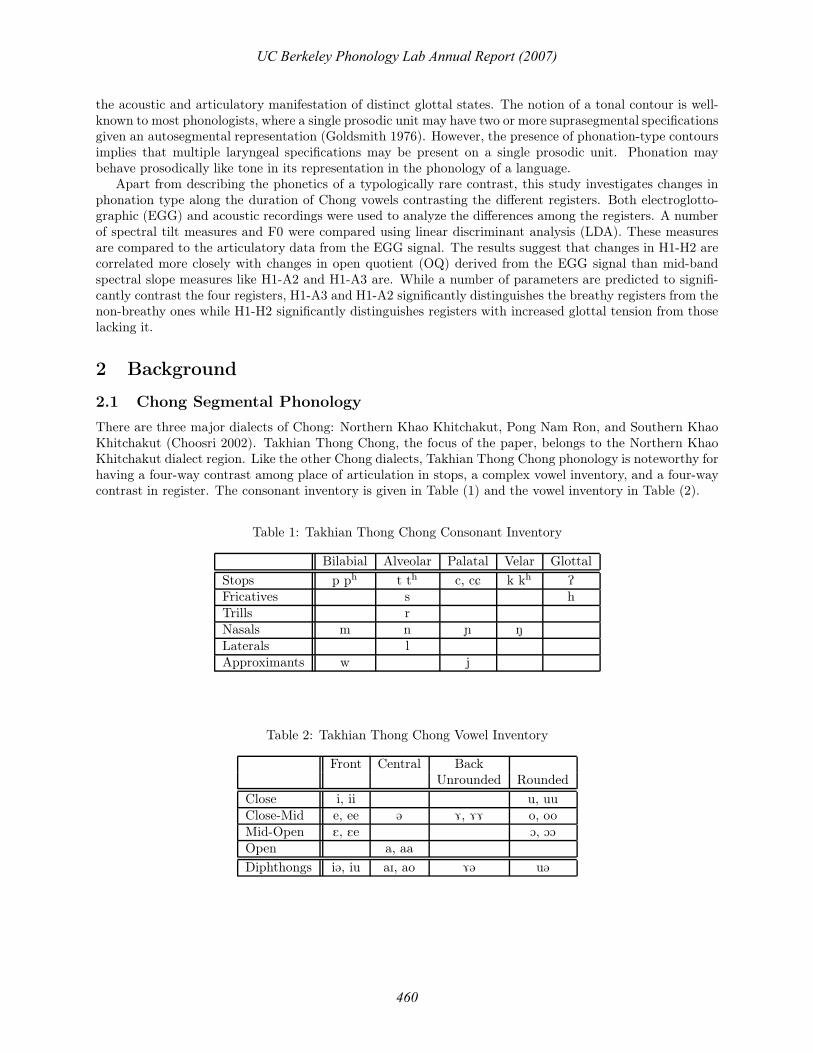
There are three major dialects of Chong: Northern Khao Khitchakut, Pong Nam Ron, and Southern KhaoKhitchakut (Choosri 2002). Takhian Thong Chong, the focus of the paper, belongs to the Northern KhaoKhitchakut dialect region. Like the other Chong dialects, Takhian Thong Chong phonology is noteworthy forhaving a four-way contrast among place of articulation in stops, a complex vowel inventory, and a four-waycontrast in register. The consonant inventory is given in Table (1) and the vowel inventory in Table (2).
Table 1: Takhian Thong Chong Consonant Inventory
Bilabial Alveolar Palatal Velar Glottal
Stops p ph t th c, cC k kh P
Fricatives s hTrills rNasals m n ñ ŋLaterals lApproximants w j
Table 2: Takhian Thong Chong Vowel Inventory
Front Central BackUnrounded Rounded
Close i, ii u, uuClose-Mid e, ee @ 7, 77 o, ooMid-Open E, Ee O, OO
Open a, aa
Diphthongs i@, iu aI, ao 7@ u@
UC Berkeley Phonology Lab Annual Report (2007)
460

All consonant phonemes given in Table (1) may occur as the onset of a syllable with any of the vowels.Most of these same consonants can occur as codas, with the exception of the aspirated stops, /s/, and /r/.Glottal consonants /h/ and /P/ may also occur as coda consonants, but only on modal and breathy-modalregisters. All registers may occur on closed syllables containing both long and short vowels, with sonorantor stop codas. I show this in Table (3), but I was unable to elicit CVN (short vowel + sonorant coda) formsfor the breathy-modal register during fieldwork. Only the modal and breathy register may occur on opensyllables. For instance, the word /tu
¨u¨/ to escape is breathy while the word /hOO/ dinner, food is modal.
Aspirated stops have a restricted distribution in Takhian Thong Chong. They occur only as the onsetsof modal vowels, e.g. /thoh/ breast and /phat/ tail. This is different than the nearby dialect of Khlong PhluChong which maintains the aspiration distinction on all registers, but similar to the Wang Kraphrae dialectwhich has lost many of the aspirated stops in these environments (Ungsitipoorporn 2001).2 It is possible thatthe lost aspirated stops have conditioned or merged with the register on the following vowel. The patternwhereby aspiration conditions register is called registrogenesis and has been described for many languages inthe Mon-Khmer family (Haudricourt 1954, Ferlus 1979, Wayland & Jongman 2002). However, it is an openquestion as to whether this has also occurred in Chong.
There is an effect of register on vowel quality in Chong. This is most noticeable on the non-closed vowels.In general, vowels occurring on the breathy or breathy-tense register are higher than those occurring on themodal or modal-tense register. The open-mid vowels (/E/, /EE/, /O/, or /OO/) never occur on each of theseregisters. Furthermore, the vowel /a/ is realized with a slightly higher variant when it occurs on the breathyor breathy-tense register. Thongkum (1991) found a similar effect measuring vowels on different registers.This effect is most noticeable on words with a long vowel in the breathy-tense register because the vowelquality as well as the voice quality changes throughout the course of the vowel. So, a word like /pa
¨a˜j/ “two"
is realized as [p2¨
a˜j] where the initial duration of the long vowel is more closed. The correlation between
breathiness and vowel-raising has been mentioned in the previous literature on Chong (Ungsitipoorporn2001) and is a well-established phenomena within Mon-Khmer languages as a source of sound change (Ferlus1979).
2.2 Chong Register
The register contrast in Takhian Thong Chong includes a modal register, a modal-tense register, a breathy-modal register, and a breathy-tense register. The hyphen here indicates that there is a movement from onephonation type to another over the vowel’s duration. Thus, the breathy-tense register consists of breathyvoice following the release of the onset consonant, with a change in voice quality towards more tense orpressed phonation. This description of the Chong register system follows that of Thongkum (1988), thoughI think that tense is a better term to use than creaky as it more accurately describes the phonation-typefound in Takhian Thong Chong. Examples of each register are given in table (3).
2.3 Phonation Type
2.3.1 Production Aspects
While there are a number of possible laryngeal configurations, linguistically-constrastive phonation typesfall within relatively few categories : creaky voice, tense voice, modal voice, lax voice, and breathy voice.These distinct phonation types lie along a continuum that is defined in terms of the aperture between thearytenoid cartilages where creak has the least aperture and breathiness the greatest (Ladefoged 1971, Gordon& Ladefoged 2001). While the aperture between the vocal folds is an important articulatory parameter,laryngeal tension and aerodynamic conditions are also relevant to the characterization of phonation type.We may define each phonation type with these parameters.
Modal phonation is characterized by neither broadband spectral energy in the upper harmonics norirregular vocal fold vibration where the arytenoid cartilages are neither pulled apart nor pushed together (NíChasaide & Gobl, 1997, Ladefoged & Maddieson, 1996). During the production of modal phonation, there
2Aspirated palatal stops occur before all registers and are an apparent exception to this pattern.
UC Berkeley Phonology Lab Annual Report (2007)
461

Table 3: Takhian Thong Chong Registers
Word Register Gloss Syllable Structure
lOON modal ‘stride’ CVVNceet modal ‘to sharpen wood’ CVVTtON modal ‘house’ CVNphat modal ‘tail’ CVTlO˜O˜n modal-tense ‘navel’ CVVN
ce˜e˜t modal-tense ‘deer’ CVVT
pa˜j modal-tense ‘palm’ CVN
cCo˜k modal-tense ‘pig’ CVT
ra¨a¨j breathy-modal ‘ten’ CVVN
pa¨
a¨t breathy-modal ‘peel’ CVVT
p@¨t breathy-modal ‘to fan’ CVT
pa¨
a˜j breathy-tense ‘two’ CVVN
cCO¨O˜N breathy-tense ‘Chong’ CVVN
k@ta¨a˜
k breathy-tense ‘bean’ CVVTtu¨
N breathy-tense ‘squash’ CVNph7
¨t breathy-tense ‘rattan’ CVT
is moderate adductive tension and medial compression of the vocal folds (Laver, 1979). There is adequatesubglottal pressure present to overcome vocal fold impedance. As a result, sustained voicing with regularperiodicity characterizes this phonation type.
Both lax and breathy phonation involve an increase in the aperture between the vocal folds, such thatthe posterior portion to the midline of one vocal fold never comes in contact with the other fold (Laver1979, Pennington 2005). The vocal folds have minimal adductive tension, weak medial compression, andlittle longitudinal tension (ibid). The required transglottal pressure differential is allowably smaller sincethe vocal folds have less impedance. Because of this and the increased aperture, the glottal wave is moresinusoidal for both these phonation types. What distinguishes lax from breathy phonation though is thedegree of vocal fold tension and the amount of aperiodic noise that dominates the upper spectrum. Breathyphonation contains substantial broadband spectral energy that arises due to greater vocal fold aperture. Laxphonation does not contain substantial high amplitude noise components (Pennington 2005).
Creaky and tense phonation are similar in that both involve decreased aperture between the vocal folds.The vocal folds are mostly closed for this phonation type, vibrating mainly at the ligamental portion be-tween the arytenoids. Both phonation types are characterized with increased adductive tension and medialcompression (Ní Chasaide & Gobl, 1997). However, while tense phonation is characterized with mostly peri-odic vocal fold vibration, creaky phonation contains substantial frequency modulation (jitter) and amplitudemodulation (shimmer) (Pennington 2005). The cause of this may arise from the adduction of the ventricularfolds during the production of creaky phonation. Adduction of the false vocal folds produces contact betweentheir inferior surfaces and the superior surfaces of the true vocal folds. This would result in a compressedand thick structure that would inhibit voicing (Laver, 1979). While ventricular fold bracing may be morecommon with creaky phonation than with tense phonation, Edmondson & Esling (2006) and Tumtavitikul(2005) found that the ventricular folds are also used during the production of tense voice. Aerodynamically,conditions for sustained voicing are similar for both phonation types where the required transglottal pressuredifferential must be must be larger since the vocal folds have increased impedance. Similar to lax and breathyphonation type, tense and creaky phonation type may only differ in their degree of vocal fold tension anddegree of modulation.
These articulatory descriptions of phonation type bear directly on the utility of articulatory measureslike open quotient (OQ) or closed quotient (CQ) in distinguishing register in Chong. The open quotient is
UC Berkeley Phonology Lab Annual Report (2007)
462

the percentage of the glottal period where the vocal folds are not in contact. This comprises the portionof the glottal wave between the abduction of the vocal folds at their upper margin until adduction occursalong their lower or central margins (Rothenberg 1981, Titze & Talkin 1981, Childers & Krishnamurthy1985, Childers & Lee 1991, Michaud 2004). The CQ measure is simply derived from the OQ measure (1-OQ= CQ). Assuming that subglottal pressure remains constant, the impedance of the vocal folds is directlyrelated to the closed quotient, where an increased impedance due to strong adductive tension and medialcompression of the vocal folds leads to longer closed periods in the glottal cycle. The subglottal pressuremust build up over a longer duration in these cases. Conversely, low impedance on glottal airflow due to weakadductive tension between the vocal folds will lead to shorter closed periods in the glottal cycle. In suchcases, it is possible that low impedance may also prevent full closure from being reached during a glottalperiod. Accordingly, it is possible to use OQ as a measure of phonation type since it correlates with glottaltension.
2.3.2 Acoustic Measures
Apart from examining the glottal source directly, a number of acoustic measures are useful correlates ofphonation type (Ladefoged, Maddieson, & Jackson 1988, Ní Chasaide & Gobl 1997, Pennington 2005,Kreiman, Gerratt, & Antoñanzas-Barroso 2007). An examination of power spectra often reveals differ-ences between phonation types. The theory behind this method is that the increased closing velocity of thevocal folds that occurs with greater adductive tension (as found in tense or creaky phonation) causes anexcitation of higher harmonics. Slower vocal fold closure which occurs with less adductive vocal fold tension(as found in breathy phonation) does not excite the upper harmonics and causes a lowering of the harmonics’amplitude (Ladefoged, Maddieson, and Jackson 1988, Ni Chasaide and Gobl 1997, Pennington 2005). Thus,one measures the amplitude of higher harmonics to see, albeit indirectly, how tense the vocal folds are duringtheir vibration.
Spectral tilt measures can be divided into those which compare low-range, mid-range, and high-rangeregions of the spectrum. Low range measures like H1-H2 have a close correlation to OQ values and aretherefore good measures of the degree of glottal tension present in different phonation types (Stevens &Hanson 1995, Holmberg et al. 1995, Sundberg et al. 1999). H1-H2 successfully distinguishes modal frombreathy (and creaky) phonation in a variety of languages, e.g. !Xoo (Traill & Jackson 1987), Gujarati(Fisher-Jørgensen 1967, Pennington 2005), Tsonga (Ladefoged & Antoñanzas-Barroso 1985), Wa (Watkins2002), Jalapa Mazatec (Blankenship 2002, Pennington 2005), Chanthaburi Khmer (Wayland & Jongman2003), and Fuzhou, Green Hmong, White Hmong, Santa Ana del Valle Zapotec, San Lucas Quiaviní Za-potec, and Tlacolula Zapotec (Esposito 2006). Ladefoged and Maddieson (1985) mention that H1-H2 valueswere greater for lax syllables3 than for tense syllables in Jingpho, Hani, Yi, and Wa. Kreiman, Gerratt,& Antoñanzas-Barroso (2007) examined 78 different spectral measures of voice quality within a principalcomponents analysis where the first factor accounting for the most variance between different glottal waveshapes corresponded to H1-H2. While substantial evidence supports the use of this measure in distinguishingcertain phonation types, both Blankenship (2002) and Esposito (2006) report that it does not distinguish thebreathy-modal from modal register in Chong, Mon, and Tamang (incidentally all Mon-Khmer languages).Blankenship (2002) examined the modal and breathy-modal registers in Chong with power spectra at 25 ms.intervals throughout the vowels. She found that H1-A2 is a more reliable indicator of the difference betweenthese two registers than H1-H2. Contra Edmondson (1997), Blankenship (2002) also found that the breathyregister has gradually increasing breathiness (and therefore should have increasing glottal airflow). Thesespecific findings will be re-evaluated in light of the data in this paper.
Mid range measures of spectral tilt include H1-A1, H1-A2, H1-A3, and A1-A3. Each of these measuresinvolve a calculation of the amplitude of the different formants, i.e. A1 = amplitude of F1, A2 = amplitudeof F2, etc. Accordingly, changes in vowel quality will alter formant frequency. Since radiation impedanceis approximately proportional to frequency, the wide-band spectral slope is approximately -6 dB/octave formodal phonation (Klatt 1980, Pennington 2005). Shifts in the center formant frequency due to vowel quality
3The authors are specifically referring to a lax laryngeal setting here.
UC Berkeley Phonology Lab Annual Report (2007)
463

changes will affect these measures. So, given a vowel [i] with a high F2 frequency value and a vowel [u]with a low F2 frequency value, the H1-A2 calculation for these vowels will be substantially different even ifphonation type parameters remain constant. This has caused some researchers to question the validity ofusing mid range measures of spectral tilt. However, such measures have been used to reliably distinguishphonation type in a variety of languages. Esposito (2006) shows that H1-A1, H1-A2, and H1-A3 distinguishbreathy from modal phonation in a variety of languages including Chong, concluding that the most successfulmeasure of spectral tilt is H1-A3. Blankenship (2002) found that H1-A2 and H1-A3 distinguished creakyand modal phonation type in Jalapa Mazatec but these same measures did poorly distinguishing breathyfrom modal voice. Yet, Traill & Jackson (1987) found that H1-A2 is a strong correlate that distinguishesthe same phonation types in Tsonga. The acoustic importance of mid range spectral tilt measures seems tobe dependent on both particular languages and particular phonation types.
Research on phonation type has also found that there is an interaction between the degree of glottalaperture and pitch (Hombert 1978, Ladefoged & Maddieson 1985, Thongkum 1988, Gordon and Ladefoged2001). The claim of these authors is that increased glottal tension causes pitch raising while decreased glottaltension causes pitch lowering. It is possible that speakers who raise their larynx during the production of tensevoice (see section (2.3.1)) may concomitantly trigger pitch raising as well. If this is true, then pitch-raisingin tense phonation is best explained articulatorily. For breathy voice, the pitch effect is purely aerodynamic:increased glottal airflow lowers subglottal pressure which then lowers pitch (Hombert 1978). The connectionbetween increased pitch and phonation type holds for previous studies of Chong. Thongkum (1988, 1991)finds that the modal-tense register has the highest F0 value, appearing with a rise-fall F0 contour in mostcases, while the breathy register is realized with the lowest F0.
Apart from pitch and spectral tilt, researchers have also found that nonmodal phonation types oftenhave longer duration than modally-phonated vowels in a variety of languages, but not universally (Gordon &Ladefoged 2001). Corresponding with this pattern are languages which only permit nonmodal phonation tooccur on stressed syllables, as in Quileute (Powell & Woodruff 1976) and Coatzospan Mixtec (Gerfen 1999).Thongkum (1991) found that duration is not a strong correlate of the register contrast in Chong, with theexception of the breathy-tense register which is often shorter than the other registers. She finds no differencein vowel duration among the other registers.
Thongkum (1991) used H1-A1 as a measure of spectral tilt on the different registers. However, hermeasurements did not distinguish the registers because both the inconsistency in the position of F1 and thedynamic nature of the registers caused problems for the measure. Unfortunately, Thongkum only measuredH1-A1 from one position on each vowel. Since Chong has register contours, spectral tilt measures at a singlelocation on the vowel are not suitable for distinguishing the acoustic difference between the phonation typeson each register. Rather, measures must be taken at several points across the duration of the vowel. Thisdynamic method for investigating phonation type is explicitly used in Edmondson’s (1997) analysis of Chong.Edmondson briefly investigated glottal airflow throughout the duration of selected tokens of the differentregisters. He found that the breathy-modal and breathy-tense registers have high amplitude glottal airflowat the onset of the vowel while the modal-tense and breathy-tense registers have a marked low amplitudeglottal airflow pulses during the second half of their duration, with some concomitant irregularity in the pulseamplitude. This suggests that the registers with breathiness have more airflow mainly during the beginningof the vowel while the tense registers have increased tension and lower airflow over the latter portion of thevowel. This finding agrees with the observation in Thongkum (1991) that glottal tension is timed towardthe end of the vowel.
Both Blankenship (2002) and Edmondson (1997) used a dynamic measure over the duration of the vowelswhich allowed them to accurately distinguish between Chong registers using different acoustic measures. Thepresent study also examines trajectories of acoustic measures of phonation type data over vowels producedin the four registers of Chong. In addition to spectral tilt measures, pitch, and duration4 the study useslaryngographic data as a comparison to the acoustic measures of each register.
4There are a number of other significant acoustic measures which may be used to distinguish phonation type, including jitter,shimmer, HNR (harmonic to noise ratio), H1 amplitude, high range spectral tilt measures, and aspiration noise (Pennington2005). However, these particular measures were not used in this study.
UC Berkeley Phonology Lab Annual Report (2007)
464

3 Laryngographic Data
3.1 Method
Electroglottographic (EGG) data was acquired using a Laryngograph R© model portable electroglottographwhich was connected to one channel of an M-Audio R© USB audio interface. A microphone was connected toanother channel’s input. The audio interface was connected to an Apple R© iBook G3 computer where bothchannels were synchronously acquired using Praat 4.2 (Boersma & Weenink, 2007). Subjects were given allinstructions in Thai with the help of an interpreter (S.N.). Either the interpreter or I gave the Thai wordwhich was translated into Chong by the speakers.
EGG data from 7 speakers (4 female, 3 male), age 30-76, was elicited. Due to the loss of electrode-neckcontact for many of their tokens, two speaker’s data (1 female, 1 male) were not included in this investigation.In total, 39 words each repeated 5 times were elicited from each speaker. The word-list was designed to bebalanced so that each register would appear in multiple syllable types on short and long vowels. Upon laterinvestigation, some of the words that I elicited turned out to contain long vowels rather than short ones. Asa result, there is a balanced list for all registers with long vowels followed a coda sonorant (N). Three wordscontaining a long vowel and sonorant coda are analyzed for each register, with the modal register containingfour such words. One word containing a long vowel and a stop coda for each register were analyzed as well.In sum, 13 words x 5 repetitions x 5 subjects = 330 tokens included in the analysis, shown in table (4).
Table 4: Words used in EGG analysis
Word Register Gloss Word Register Gloss
tOON modal six ra¨a¨j breathy-modal ten
lOON modal stride lO¨O¨N breathy-modal husband
ceew modal to go cu¨
u¨n breathy-modal to send
Paaw modal day
tO˜O˜N modal-tense fear pa
¨a˜j breathy-tense two
lO˜O˜n modal-tense navel cCO
¨O˜N breathy-tense Chong
pe˜e˜w modal-tense dinner ro
¨o˜j breathy-tense melon
Electroglottography (EGG) involves the use of electrical current to determine the degree of abductionor adduction between the vocal folds. EGG peak maxima correspond to the moment of maximum contactbetween the vocal folds while peak minima correspond to the moment of minimum contact between thevocal folds (Childers & Krishnamurthy 1985, Childers & Lee 1991, Heinrich et al. 2004). Both the OQ andthe CQ were extracted from the derivative of the EGG signal (DEGG). These measures require an accurateestimation of the moment of vocal fold separation. Since the EGG peaks do not correspond to the closingor opening instants of the vocal folds, the DEGG signal is used (Childers & Krishnamurthy 1985, Childers& Lee 1991, Heinrich et al. 2004, Michaud 2004). An EGG and its corresponding DEGG signal is shown inFigure 1.
The vowel portions within each EGG data file were segmented and labelled using Praat 4.6 (Boersma& Weenink 2007). The data was then analyzed using a peak detection script in Matlab (version 7.5).Within the script, the original 44.1 kHz EGG signal was band-pass filtered from 5-1200 Hz to eliminate lowfrequency DC components and any high frequency peaks unrelated to the opening or closing phases of vocalfold vibration. The signal was then smoothed with a third order Butterworth filter (-18 dB/octave) witha 0.054 normalized cutoff frequency. Peak maxima or minima that were less than 10% of the amplitudeof the highest amplitude maxima or minima, respectively, were considered erroneous. Wherever the scriptdetected two consecutive minima or maxima, the one with greater amplitude was chosen. The output file ofthe script provided the EGG signal maxima and minima, the DEGG maxima and minima, period durations,and CQ & OQ values calculated from the DEGG signal. The output files were then visually inspected forremaining erroneous peaks. If more than three OQ values showed a greater than 10% rise or fall from an
UC Berkeley Phonology Lab Annual Report (2007)
465

Figure 1: Example of Filtered EGG (top) and DEGG (bottom) signal
adjacent value, the token was omitted. If there were three or fewer erroneous OQ values, these data pointswere replaced with NA values. The output OQ data was then time-normalized using R (2007) to allow for aproportional comparison between the different speakers and tokens. OQ was averaged over 12 even intervalsof the token’s vowel.
3.2 Results
The results of the OQ measures are shown in Figure 2 along with 95% confidence intervals. Individualspeakers’ OQ data is given in Table 5. Confidence intervals are wider at time index 12 because the scriptwas unable to calculate OQ accurately for some tokens, resulting in a smaller sample size. For all registers,there is a declination in OQ throughout the duration of the vowel, with the breathy-tense register showingthe sharpest decline in OQ. The breathy-modal register shows the highest OQ value which gradually declinestoward the endpoint of the vowel while the modal-tense register shows the lowest OQ value which similarlydeclines. The modal register does not show substantial declination in OQ, lying between the values forthe breathy-modal register and the modal-tense register. At time index 1, the breathy-tense register showsoverlap in OQ value with the breathy-modal register, but at time index 10-12, it shows overlap with themodal-tense register.
Results from a two-way ANOVA at each time index show a significant effect of register on OQ valueat each point (p < 0.001***), with results in Table (12). However, there was a more significant effect ofspeaker on OQ value than register. There was a small interaction of register X speaker at every time index.Examining the data in Table 5, we notice that the modal and modal-tense register have different OQ valuesfor speakers s1, s3, s5, and s6, but not for s2. There is also some variability in where certain OQ valuesdiffer between the modal and breathy-modal registers. For all speakers, there is a decrease in OQ value forthe breathy-tense register, but its magnitude varies by speaker as well. While register has a strong effect onOQ value for all speakers, the speaker effect comes from individual differences in the timing and magnitudeof changes in OQ.
Given that OQ values correlate with glottal aperture, we can conclude that the registers in TakhianThong Chong are at least partly distinguished by differences in glottal aperture. The modal-tense registeroccurs with a smaller glottal opening than the modal register which occurs with a smaller glottal openingthan the breathy-modal register. The breathy-tense register occurs with a quick change in glottal aperturesize across the duration of the vowel.
UC Berkeley Phonology Lab Annual Report (2007)
466

Figure 2: Open Quotient and OQ Slope Data for 5 speakers(Modal = solid, Breathy-Modal = dots, Modal-Tense = dashes, Breathy-Tense = dash-dot)
Table 5: OQ Values at Selected Time Points, by Speaker
Modal Modal - Tenset2 t5 t8 t11 t2 t5 t8 t11
s1 0.525 0.503 0.501 0.506 0.468 0.433 0.419 0.414s2 0.467 0.443 0.433 0.432 0.448 0.439 0.416 0.413s3 0.564 0.566 0.559 0.553 0.452 0.448 0.441 0.459s5 0.582 0.618 0.591 0.603 0.614 0.627 0.583 0.559s6 0.452 0.435 0.421 0.419 0.510 0.414 0.401 0.390
Breathy - Modal Breathy - Tenset2 t5 t8 t11 t2 t5 t8 t11
s1 0.542 0.534 0.541 0.549 0.517 0.456 0.422 0.412s2 0.517 0.478 0.450 0.445 0.502 0.437 0.396 0.363s3 0.550 0.535 0.536 0.549 0.580 0.527 0.506 0.510s5 0.637 0.599 0.613 0.602 0.617 0.598 0.562 0.500s6 0.552 0.535 0.505 0.496 0.545 0.424 0.390 0.368
UC Berkeley Phonology Lab Annual Report (2007)
467

4 Acoustic Data
4.1 Method
Acoustic data was acquired using the same setup described in section (3.1) with the same speakers. However,all 7 speakers’ acoustic data was usable. Acoustic recordings were originally sampled at 44.1 kHz. butdownsampled to 16 kHz before analysis. A script was written to extract F0, H1-H2, H1-A1, H1-A2, and H1-A3 measures at 12 even time indices along the duration of each vowel along with its total duration. Spectraltilt was acquired by first calculating the position of F1, F2, and F3 with an LPC analysis. Maximumamplitude peaks were then extracted from ranges in a power spectrum within 10% of the frequency of aparticular formant, i.e. if F2 = 2000 Hz., peak maxima were extracted from the 1800-2200 Hz. range. Theamplitude value of the highest amplitude harmonic within these ranges corresponds to A1, A2, or A3. Twosets of formant reference values were used depending on the speaker’s gender. For males, these referencevalues were F1 500 Hz., F2 1485 Hz., and F3 2475 Hz. For females the values were F1 550 Hz., F2 1650Hz., and F3 2750 Hz. H1 and H2 were determined by taking the highest amplitude peak to within 10% ofthe fundamental and twice the fundamental, respectively. Data from all subjects were grouped together andstatistically analyzed using R (2007).
Linear discriminant analysis (LDA) was performed on linear models containing 5 predictor variables forregister at each time index: F0, H1-H2, H1-A1, H1-A2, and H1-A3. A two-way ANOVA determined thateach of these measures was significant at each time index prior to their inclusion in the discrminant model.Wilk’s Lambda and canonical correlations were calculated to determine the goodness of the discriminantmodel at each time index.
4.2 Spectral Tilt Results
The results of the LDA are shown in Table 6. The first two predictors correspond to the measures in the firstlinear discriminant model that account for the most variance. The LD Proportion of Trace is the proportionof between group variance that the first linear discriminant explains with respect to the total between groupvariance. Canonical Correlation is the percentage of variance in the data that is explained by the predictorvariables. Wilk’s lambda tests at each time index are given in Appendix A. All discriminant models weresignificant at each time index.
Table 6: Results of Linear Discriminant Analysis on Spectral Measures of Register
Time Index Predictor 1 Coefficient Predictor 2 Coefficient LD Proportion Canonicalof Trace Correlation
1 H1-A3 0.078 H1-A2 0.064 76.7% 0.8492 H1-A2 0.085 H1-A3 0.084 82.2% 0.8483 H1-A3 0.084 H1-A2 0.079 78.5% 0.8404 H1-A3 0.083 H1-A2 0.062 74.9% 0.8345 H1-A3 0.076 H1-A2 0.068 72.1% 0.8256 H1-A3 0.082 H1-A2 0.065 72.9% 0.8127 H1-A3 0.073 H1-A2 0.057 74.1% 0.7858 H1-A3 0.077 H1-H2 0.069 75.4% 0.7849 H1-H2 0.091 H1-A3 0.077 74.8% 0.77610 H1-A2 0.079 H1-A3 0.078 69.4% 0.76711 H1-A2 0.067 H1-H2 0.063 64.7% 0.72712 H1-A2 0.083 H1-A1 0.060 68.0% 0.722
Table 6 shows that the H1-A2 and H1-A3 spectral tilt measures are the best discriminators of register inTakhian Thong Chong. These account for the most variance within the first linear discriminant and were
UC Berkeley Phonology Lab Annual Report (2007)
468

Figure 3: H1-A2 (left) and H1-A3 (right) spectral tilt measures(Modal = solid, Breathy-Modal = dots, Modal-Tense = dashes, Breathy-Tense = dash-dot)
strongly correlated throughout the first half of the vowels’ durations with adjusted R2 values of 0.59, 0.56,0.48, 0.44, 0.33, and 0.29 for the first six time indices. By comparison, there was little correlation betweenH1-A3 and H1-H2 at any point, reflected by a maximum adjusted R2 value of 0.09. The predictor with thelowest coefficient at 7 time points was H1-A1. This particular measure was a poor predictor of the registercontrast. The first linear discriminant accounts for a large proportion of the variance in register throughoutthe vowel duration. At each time index, the canonical correlation lies between 0.72 - 0.85, so the discriminantmodel can explain between 72% and 85% of the variance between the registers.
Plots of the H1-A3 and H1-A2 measures are shown in Figure 3 along with 95% confidence intervals. Inboth figures we observe that the breathy-modal register has a steeper spectral slope throughout its durationthan any of the other registers. The modal and tense registers have very similar H1-A2 and H1-A3 valuesthroughout the duration of the vowel. The breathy-tense register begins with steep spectral slope but rapidlybecomes more tense throughout its duration. While the H1-A2 measure shows some change in spectral slopefor the breathy-modal register, no such change is apparent in the H1-A3 measure.
A two-way ANOVA was performed on H1-A3 with register, speaker, and vowel as factors, shown in table(7. The results show the most significant effect for register at all time indices, followed by significant effectsof both speaker and vowel quality. There were also significant interactions between all these factors (notshown) at a p < 0.01 level at every time index. These results suggest that the strongest factor determiningH1-A3 value is the vowel’s register. While both speaker identity and vowel quality influence the formantposition, these factors were not as strong. Individual differences between the different registers’ H1-A3 valueswere determined via Welch two-sample t-tests, shown in the appendix. Results from these tests show thatthe each of the registers are distinct from one another except for the modal-tense and the modal register.The breathy-tense register does not significantly differ from the breathy register at time index 2 while it doesnot significantly differ from the modal-tense or modal register at time index 11.
Even though H1-A3 and H1-A2 are significant measures distinguishing register in Takhian Thong Chong,they do not distinguish between the modal and the modal-tense register. Rather, it seems that these spectraltilt measures best distinguish the phonation types which contrast in terms of breathiness. The results ofthe LDA show that both H1-H2 and H1-A1 account for the least overall variance as spectral tilt measures.However, these particular measures may show some differences between the registers that are not accounted
UC Berkeley Phonology Lab Annual Report (2007)
469

Table 7: Results of Two-way ANOVA on H1.A3 with selected predictors.All are significant at a p < 0.001 level unless otherwise noted.
Time Index Register Speaker Vowel
1 F(3, 317) = 422.8 F(6, 317) = 98.7 F(5, 317) = 34.72 F(3, 367) = 415.9 F(6, 367) = 148.2 F(5, 367) = 50.93 F(3, 367) = 392.6 F(6, 367) = 150.1 F(5, 367) = 99.74 F(3, 367) = 386.8 F(6, 367) = 146.9 F(5, 367) = 146.95 F(3, 367) = 287.4 F(6, 367) = 134.4 F(5, 367) = 151.06 F(3, 367) = 267.4 F(6, 367) = 131.3 F(5, 367) = 152.67 F(3, 367) = 251.9 F(6, 367) = 126.4 F(5, 367) = 163.08 F(3, 367) = 243.1 F(6, 367) = 113.1 F(5, 367) = 169.79 F(3, 367) = 197.5 F(6, 367) = 98.2 F(5, 367) = 132.110 F(3, 367) = 199.4 F(6, 367) = 86.4 F(5, 367) = 136.311 F(3, 355) = 149.6 F(6, 355) = 69.6 F(5, 355) = 125.312 F(3, 305) = 92.8 F(6, 305) = 29.9 F(5, 305) = 89.7
for in the other measures. Both H1-A1 and H1-H2 are shown in Figure 4.From the H1-A1 data, we observe that spectral slope on the modal register is not as steep as on the modal-
tense register. Instead, the modal register occupies an intermediate position with respect to the spectralslope values of both the breathy register and the modal-tense register. From the H1-H2 data, we observethat the spectral slope values given for the modal register are lower (flatter) than those of the breathy-modalregister at time index 1-4, but overlap with those of the breathy-modal register from time index 5-12. Thetense-modal and breathy-tense registers overlap in H1-H2 value for a majority of their duration, but not attime index 1. Both the H1-A1 and H1-H2 measures show a distinction between the modal-tense and modalregisters. This is most clear in the H1-H2 measure, where registers with glottal tension group togetherwhile those lacking glottal tension do not. While we observed that the H1-A3 and H1-A2 measures wereclosely correlated, this was not found for the H1-H2 and H1-A1 measures. The maximum adjusted R2 =0.21, where R2 < 0.05 at most of the time indices. Individual differences between the different registers’H1-H2 values were determined via Welch two-sample t-tests, shown in the appendix. These tests show thatthe H1-H2 measure significantly distinguishes between modal-tense and modal register, the modal-tense andbreathy register, the breathy-tense and modal register, and the breathy-tense and breathy-modal register.The breathy-modal/modal and tense/breathy-tense contrasts do not significantly vary with respect to theH1-H2 measure.
4.3 Summary of Spectral Tilt Data
The results from the LDA show that both H1-A3 and H1-A2 are the best predictors of the register con-trast within the first linear discriminant. Overall spectral tilt differences between registers were of greatermagnitude with these measures than with measures like H1-H2 and H1-A1. However, there is an interestingdivision of labor between distinct spectral tilt measures. The H1-A3 and H1-A2 measure distinguish reg-isters containing breathiness, which are not distinguished using the H1-H2 or H1-A1 measure. The H1-H2measure distinguishes registers containing glottal tension which are not distinguished using the H1-A3 orH1-A2 measure.
UC Berkeley Phonology Lab Annual Report (2007)
470

Figure 4: H1-A1 (left) and H1-H2 (right) spectral tilt measures(Modal = solid, Breathy-Modal = dots, Modal-Tense = dashes, Breathy-Tense = dash-dot)
4.4 Pitch and Duration Results
4.4.1 Pitch
Pitch data from Takhian Thong Chong is given in Figure 5.5 The modal-tense register is realized with ahigh rising-falling pitch contour that is approximately 30 Hz. higher than the other registers’ pitch valuesthroughout its duration. The other registers are all within about 20 Hz. of each other. The breathy-tenseregister has higher overall pitch than the breathy-modal and modal registers. The modal register has thelowest overall pitch. These results are similar to the findings in Thongkum (1988) for the Thung Kabindialect where the modal-tense and breathy-tense register have higher pitch while the breathy-modal andmodal registers have a lower pitch.
Table 8: Results of Two-way ANOVA on Pitch.All are significant at a p < 0.001 level unless otherwise noted.
Time Index Register Speaker Register X Speaker
2 F(3, 416) = 114.8 F(6, 416) = 99.3 F(18, 416) = 3.45 F(3, 416) = 182.6 F(6, 416) = 117.4 F(18, 416) = 5.48 F(3, 416) = 163.7 F(6, 416) = 139.9 F(18, 416) = 5.011 F(3, 404) = 47.2 F(6, 404) = 83.5 F(18, 404) = 2.9
The results from a two-way ANOVA at four time intervals (2, 5, 8, 11) reveal a significant effect of registeron pitch at all time points with p < 0.001. These results are given in Table 8. There was a strong effectof speaker on pitch along with an interaction between speaker and register. Individual differences betweenthe different registers’ pitch values were determined via Welch two-sample t-tests, shown in the appendix.
5Except for the modal register, each register is realized with a rising-falling pitch contour. This may originate from therecording context where tokens were elicited in isolation. However, the frequency and magnitude of the pitch contours isdistinct.
UC Berkeley Phonology Lab Annual Report (2007)
471

Figure 5: Pitch (left) and Duration (right)(Modal = solid, Breathy-Modal = dots, Modal-Tense = dashes, Breathy-Tense = dash-dot)
These data show that each register is significantly different from the modal-tense register in pitch throughoutthe vowel. The modal register is significantly different from the breathy-tense register throughout the vowelduration, but only significantly different from the breathy-modal register at time indices 2 and 5 (the firsthalf of the vowel). The breathy-modal and breathy-tense registers are not significantly different in terms ofpitch.
4.4.2 Duration
From the duration data in Figure 5, we observe that both breathy-tense and modal tense vowels have shorterduration than breathy-modal and modal vowels. However, vowel duration can be influenced by other factors,such as coda type and vowel quality (Keating 1985). Since other factors that may cause a change in vowelduration, we must determine how much register plays a role compared to them. Results from a two-wayANOVA with register, speaker, and vowel quality as factors on vowel duration demonstrated a significanteffect of register, F(3, 365) = 141.2, p < 0.001 ***; speaker, F(6, 365) = 351.9, p < 0.001 ***; and vowelquality, F(4, 365) = 6.8, p < 0.001 ***. There were also significant interactions between each of these onvowel duration: register X vowel quality, F(4, 365) = 28.5, p < 0.001 ***; register X speaker, F(18, 365)= 5.8, p < 0.001 ***; and vowel quality X speaker, F(24, 365) = 7.7, p < 0.001 ***. Finally there wasan interaction between all three factors, F(19, 365) = 7.2, p < 0.001 ***. While speaker is the strongestfactor accounting for the variance in duration, register was also strongly significant. Interestingly, the effectof vowel quality on vowel duration was not very strong. This is probably due to the fact that most vowels inthe data set are mid or low vowels. We might expect a vowel quality effect on duration to be more noticeableif the data set had contained more words with high vowels, as they tend to have the greatest influence onduration (Keating 1985).
4.5 Summary of Pitch and Duration Data
While the best predictors of register in the LDA were those relating to spectral tilt, pitch also significantlyvaried with respect to register. In general, the modal-tense register is realized with substantially higher pitchthan the other registers throughout its duration while the modal register is realized with the lowest pitch.
UC Berkeley Phonology Lab Annual Report (2007)
472
The breathy-tense and breathy-modal registers have intermediate pitch values that are significantly differentfrom both the modal and modal-tense registers, but not significantly different from each other. The durationdata show that the registers containing glottal tension occur with shorter vowels than those registers lackingglottal tension.
5 Analysis and Discussion
5.1 Spectral Tilt and Open Quotient Correlation
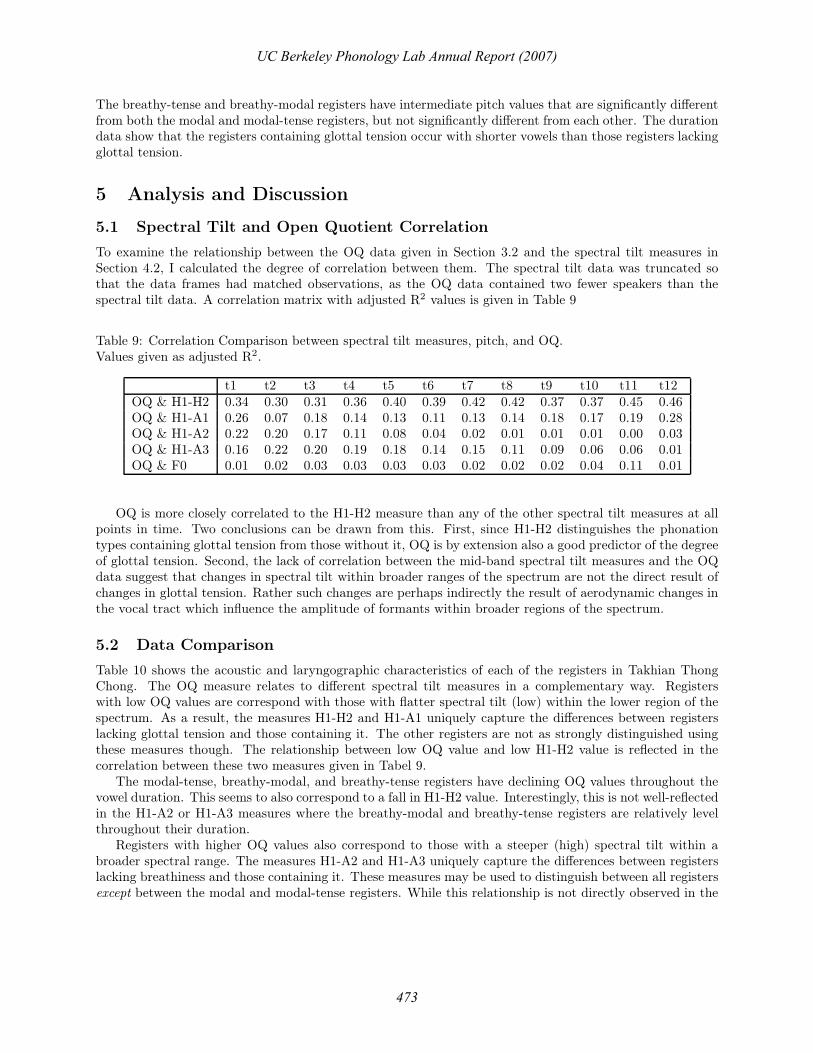
To examine the relationship between the OQ data given in Section 3.2 and the spectral tilt measures inSection 4.2, I calculated the degree of correlation between them. The spectral tilt data was truncated sothat the data frames had matched observations, as the OQ data contained two fewer speakers than thespectral tilt data. A correlation matrix with adjusted R2 values is given in Table 9
Table 9: Correlation Comparison between spectral tilt measures, pitch, and OQ.Values given as adjusted R2.
t1 t2 t3 t4 t5 t6 t7 t8 t9 t10 t11 t12OQ & H1-H2 0.34 0.30 0.31 0.36 0.40 0.39 0.42 0.42 0.37 0.37 0.45 0.46OQ & H1-A1 0.26 0.07 0.18 0.14 0.13 0.11 0.13 0.14 0.18 0.17 0.19 0.28OQ & H1-A2 0.22 0.20 0.17 0.11 0.08 0.04 0.02 0.01 0.01 0.01 0.00 0.03OQ & H1-A3 0.16 0.22 0.20 0.19 0.18 0.14 0.15 0.11 0.09 0.06 0.06 0.01OQ & F0 0.01 0.02 0.03 0.03 0.03 0.03 0.02 0.02 0.02 0.04 0.11 0.01
OQ is more closely correlated to the H1-H2 measure than any of the other spectral tilt measures at allpoints in time. Two conclusions can be drawn from this. First, since H1-H2 distinguishes the phonationtypes containing glottal tension from those without it, OQ is by extension also a good predictor of the degreeof glottal tension. Second, the lack of correlation between the mid-band spectral tilt measures and the OQdata suggest that changes in spectral tilt within broader ranges of the spectrum are not the direct result ofchanges in glottal tension. Rather such changes are perhaps indirectly the result of aerodynamic changes inthe vocal tract which influence the amplitude of formants within broader regions of the spectrum.
5.2 Data Comparison
Table 10 shows the acoustic and laryngographic characteristics of each of the registers in Takhian ThongChong. The OQ measure relates to different spectral tilt measures in a complementary way. Registerswith low OQ values are correspond with those with flatter spectral tilt (low) within the lower region of thespectrum. As a result, the measures H1-H2 and H1-A1 uniquely capture the differences between registerslacking glottal tension and those containing it. The other registers are not as strongly distinguished usingthese measures though. The relationship between low OQ value and low H1-H2 value is reflected in thecorrelation between these two measures given in Tabel 9.
The modal-tense, breathy-modal, and breathy-tense registers have declining OQ values throughout thevowel duration. This seems to also correspond to a fall in H1-H2 value. Interestingly, this is not well-reflectedin the H1-A2 or H1-A3 measures where the breathy-modal and breathy-tense registers are relatively levelthroughout their duration.
Registers with higher OQ values also correspond to those with a steeper (high) spectral tilt within abroader spectral range. The measures H1-A2 and H1-A3 uniquely capture the differences between registerslacking breathiness and those containing it. These measures may be used to distinguish between all registersexcept between the modal and modal-tense registers. While this relationship is not directly observed in the
UC Berkeley Phonology Lab Annual Report (2007)
473

Table 10: Significant Articulatory and Acoustic Correlates of Register
Modal Modal-Tense Breathy-Modal Breathy-TenseOQ Value Intermediate Low High High to Low
Level Declining Declining DecliningH1-A3 Low Low High High to Low
Slight rise Slight rise Level FallingH1-A2 Low Low High High to Low
Rising Rising Falling FallingH1-A1 Intermediate Low High High to Low
Level Slight rise Initial Fall FallingH1-H2 High Low High High to Low
Level Falling Initial Fall FallingPitch Low Intermediate Intermediate High
Slight rise Rising-Falling Rising-Falling Rising-FallingDuration Longer Shorter Longer Shorter
correlation matrix in Table 9, increasing OQ may have the indirect result of changing aerodynamic conditionswhich causes a decrease in amplitude of formants within the spectrum.
Certain spectral tilt measures seem to vary significantly with respect to pitch. At selected time indices(2, 5, 8, 11) across the vowel duration, two-way ANOVAs were performed with spectral tilt measures asfactors. The results in Table 11 show that each spectral tilt measure varies somewhat with pitch, but noparticular measure seems to correlate closely with pitch at all time points. For instance, the modal-tenseregister is produced with a decreasing OQ values and spectral tilt at the end of the vowel, yet these values areuncorrelated with the higher overall pitch and pitch contour present with this register. We may conclude thatpitch can be influenced slightly by changes in phonation type but the pitch contours present with differentregisters are not simply byproducts of changes in glottal aperture.
Table 11: Results of Two-way ANOVA on Pitch with Spectral Tilt Factors
Time Index H1-H2 H1-A1 H1-A2 H1-A32 F(1, 428) = 20.1 F(1, 428) = 2.3 F(1, 428) = 10.2 F(1, 428) = 64.4
p < 0.001 *** p = 0.13 p < 0.005 ** p < 0.001 ***5 F(1, 428) = 51.8 F(1, 428) = 34.2 F(1, 428) = 0.3 F(1, 428) = 14.3
p < 0.001 *** p < 0.001 *** p = 0.61 p < 0.001 ***8 F(1, 428) = 60.4 F(1, 428) = 42.6 F(1, 428) = 0.4 F(1, 428) = 5.9
p < 0.001 *** p < 0.001 *** p = 0.53 p < 0.05 *11 F(1, 416) = 2.5 F(1, 416) = 9.1 F(1, 416) = 5.3 F(1, 416) = 2.8
p = 0.11 p < 0.005 ** p < 0.05 * p = 0.10
5.3 Discussion
The results from the comparison between OQ and spectral tilt suggest that there is a one to many interactionbetween the proportion of the glottal cycle that is open and its acoustic consequences on the speech signal inChong. The acoustic correlates of Chong register include mid-band and narrow-band spectral slope, changesin spectral slope, pitch, and to a lesser degree, duration. Registers with increased glottal tension, or lowOQ, are best distinguished from the other registers with narrow-band spectral slope (H1-H2), pitch, and
UC Berkeley Phonology Lab Annual Report (2007)
474

duration. Registers with breathiness, or high OQ, are best distinguished from the others with mid-bandspectral slope measures and changes in spectral slope. These findings are in agreement with Blankenship(2002) and Esposito (2006) who found that H1-H2 was a poor discriminator of the modal and breathyregisters in Chong. The results of a LDA reveal that H1-A3 and H1-A2 better discriminate among allregisters in the language, including breathy-modal and modal registers. Whereas the previous studies didnot address the utility of different measures in distinguishing all four registers in the language, this studyhas attempted to do so while also comparing spectral tilt measures to changes in the vibratory cycle of thevocal folds.
The breathy-tense and the breathy-modal registers are realized with increased OQ values after the onsetconsonant release in Chong while the breathy-tense and modal-tense registers are realized with decreasedOQ values at the end of the vowel. These findings agree with Edmondson (1997) who found greater glottalairflow at the beginning of the breathy registers which gradually diminished and low amplitude glottal airflowat the end of tense register vowels. Thongkum (1991) makes a similar prediction regarding increasing glottaltension on these registers. Contra Blankenship (2002), breathiness does not increase on the breathy-modalvowels.
The increased correlation between OQ and H1-H2 and the lack of correlation between OQ and otherspectral tilt measures suggests that EGG methods may only be useful for distinguishing between two glottalstates: tense and non-tense. As many register languages contain only two phonation types, EGG analysis isprobably useful for them. However, in a language like Chong, with four phonation types, differences amongall registers may not be directly observable from the EGG signal. H1-A3 and H1-A2 are strong discriminatorsof register in Chong. However, if amplitude differences calculated from these measures are not correlatedwith OQ, some other mechanism must be responsible for the decreases in harmonic amplitude present inbreathy-modal and breathy-tense phonation. The decreased excitation of resonance present with larger OQvalues may not explain decreased formant amplitude. Instead, the presence of broadband spectral energymay be more responsible for causing substantial differences in H1-A2 and H1-A3.
The pitch data here suggests a weak association between phonation type and pitch. We might expecta close correlation between increased glottal tension and pitch as both may involve laryngeal raising. Themodal-tense register is, in fact, realized with the highest pitch of all the registers, similar to findings byThongkum (1988) for Thung Kabin Chong. However, on this register and others, changes in the pitch do notcorrespond to changes in glottal aperture. While the modal-tense register occurs with a rising-falling pitchcontour, OQ values decrease throughout its duration. The same is true for the other registers. The H1-H2values are the most closely correlated with the pitch changes, as shown in Figure 11. This is in agreementwith Esposito (2006) who mentions that pitch tends to most closely correlate with H1-H2. However, thereare substantial differences between the pitch contours and the H1-H2 contour. While the breathy-tense andmodal-tense registers virtually overlap in H1-H2 value, the modal-tense register is realized with substantiallyhigher pitch than the breathy-tense register. The contour of each register’s pitch resembles its H1-H2trajectory, however the relative pitch level seems unrelated to H1-H2 values.
Phonation type influences pitch in many languages (Silverman 1997a), so we would expect changes in voicequality to correlate with changes in pitch. However, the presence of pitch that is uncorrelated with phonationtype in Chong suggests that pitch changes are not simply phonetic by-products of phonation type. Whilethese pitch contours may be phonologically associated with particular registers, they are distinct phoneticcorrelates of the register contrast.
While the phonological vowel length contrast must be a strong predictor of observed phonetic vowelduration, register is also significant. While Thongkum (1988) does not find vowel duration to be a correlateof the register contrast in Thung Kabin Chong, it distinguishes the registers with glottal tension in TakhianThong Chong from those lacking it. Both modal-tense and breathy-tense vowels have a similar shorterduration than the modal or breathy-modal vowels. Fischer-Jørgensen (1967) and Kirk et al. (1984) mentionthat breathy vowels in Gujarati and Jalapa Mazatec have longer duration than modal or creaky phonation.Gordon and Ladefoged work (2001) mention that the overall duration of vowels with non-modal phonationis longer than those with modal phonation. An explanation for this pattern is given in Silverman (1997b)which states that breathy vowels in languages are longer so that speakers have additional time to perceive
UC Berkeley Phonology Lab Annual Report (2007)
475

the voice quality on the vowel.However, there is perhaps a historical reason for the development of longer phonetic duration on breathy
vowels and shorter phonetic duration on tense vowels. Breathy vowels often derive from historically aspiratedinitial stops. In these cases, the loss of the duration of aspiration following the stop may cause the vowelto undergo compensatory lengthening. As a result, a longer vowel occurs with breathy phonation. Onthe other hand, glottal tension often derives from a historical glottal stop at the end of the vowel. Finalglottal stops may cause vowel shortening if the vowel is shorter before voiceless stops as a general phonetictrend. This is true in a variety of languages (Chen 1970). Rather than suggesting that vowel duration ofnon-modally phonated vowels is synchronically-related to some active parameter of enhancement, it may bedirectly motivated by its historical origin.
6 Conclusion
The fact that Chong has a 4-way contrast in register makes it exceptional from a typological viewpoint.The results of both an EGG and an acoustic phonetic analysis of the register distinction in this languageadd support to the view that the specific timing relationship of laryngeal configurations across the syllableis relevant in marking phonological distinctions in languages of the world. The findings show that H1-H2best correlates with changes in open quotient, while mid-band spectral tilt measures do not. In a complexregister language like Chong, a number of acoustic parameters distinguish the different registers. H1-H2 wasfound to distinguish between the presence and absence of increased glottal tension while H1-A3 distinguishedbetween the presence and absence of breathiness.
References
[1] Avelino, H. (2003) Categorical Perception of Phonemic Tone in Yalálag Zapotec, Proceedings of the 15th
International Congress of the Phonetic Sciences, Barcelona.
[2] Bao, Z. (1999) The Structure of Tone, Oxford, Oxford University Press.
[3] Blankenship, B. (2002) The timing of nonmodal phonation in vowels, Journal of Phonetics, 30:163-191.
[4] Boersma, P. and P. Weenink (2007) Praat: doing phonetics by computer, (Version 4.423), [ComputerProgram].
[5] Catford, J. C. (1977) Fundamental Problems in Phonetics. Bloomington: Indiana University Press.
[6] Chen, M. (1970) Vowel length variation as a function of the voicing of the consonant environment.Phonetica 22: 129-159.
[7] Childers, D. G. & A. K. Krishnamurthy (1985) A Critical Review of Electroglottography, CRC Critical
Reviews in Biomedical Engineering, 12(2) 131-161.
[8] Childers, D. G. & C. K. Lee (1991) Vocal quality factors: Analysis, synthesis, and perception. Journal
of the Acoustical Society of America 90(5), 2394-2410.
[9] Choosri, I. (2002) Dialects of Chong, Mon-Khmer Studies 32:55-70.
[10] Edmondson, J. (1997) Voice qualities and inverse filtering in Chong, Mon-Khmer Studies, 26:107-116.
[11] Edmondson, J. and J. Esling (2006) The valves of the throat and their functioning in tone, vocal register,
and stress: laryngoscopic case studies. ms.
[12] Esposito, C. (2004) Santa Ana del Valle Zapotec Phonation, UCLA Working Papers in Phonetics, 103,71-105.
UC Berkeley Phonology Lab Annual Report (2007)
476

[13] Esposito, C. (2006) The Effects of Linguistic Experience on the Perception of Phonation, PhD Disser-tation, UCLA.
[14] Ferlus, M. (1979) Formation des Registres et Mutations Consonantiques dans les langues Mon-Khmer,Mon-Khmer Studies, 8, 1-76.
[15] Fischer-Jørgensen, E. (1967) Phonetic analysis of breathy (murmured) vowels in Gujarati, Indian Lin-
guistics, 28:71-139.
[16] Fourcin, A. (2002) Precision Stroboscopy, Voice Quality, and Electrolaryngograpy, Laryngograph Ltd.ms.
[17] Gerfen, Chip (1999) Phonology and phonetics in Coatzospan Mixtec. Dordrecht & Boston : Kluwer.
[18] Goldsmith, J. (1976) Autosegmental Phonology, PhD Thesis, MIT.
[19] Gordon, M. (2001) A Typology of Contour Tone Restrictions, Studies in Language, 25(3), 423-462.
[20] Gordon, M. and P. Ladefoged (2001) Phonation Types: a cross-linguistic overview, Journal of Phonetics,29:383-406.
[21] Haudricourt, A.-G. (1954) De l’origine des tons en Viênamien. Journal Asiatique, 242, 69-82.
[22] Heinrich, N., C. D’Alessandro, B. Doval, & M. Castellengo (2004) On the use of the derivative ofelectroglottographic signals for characterization of nonpathological phonation. Journal of the Acoustical
Society of America, 115(3), 1321-1332
[23] Henderson, Eugénie J.A. (1952) The Main Features of Cambodian Pronunciation, Bulletin of the School
of Oriental and African Studies, 14, 1:149-174.
[24] Henderson, Eugénie J.A. (1985) Feature Shuffling in Southeast Asian Languages, in Southeast Asian
Linguistic Studies presented to Andre-G. Haudricourt, (S. Ratanakul, D. Thomas, S. Premsrirat; edi-tors), Mahidol University. 1-22.
[25] Holmberg, E. B., Hillman, R. E., Perkell, J. S., Guiod, P., and Goldman, S. L. (1995). Comparisonsamong aerodynamic, electroglottographic, and acoustic spectral measures of female voice. Journal of
Speech and Hearing Research 38, 1212-1223.
[26] Hombert, J.-M. (1978) Consonant types, Vowel quality, and Tone. In V. Fromkin (Ed.) Tone: A Lin-
guistic Survey, NY: Academic Press, 77-111.
[27] Hombert, J.-M., J. J. Ohala, and W. G. Ewan (1979) Phonetic explanations for the development oftones, Language, 55, 1:37-58.
[28] Huffman, F. E. (1985) The Phonology of Chong, a Mon-Khmer language of Thailand, in Southeast
Asian Linguistic Studies presented to Andre-G. Haudricourt, (S. Ratanakul, D. Thomas, S. Premsrirat;editors), Mahidol University. 355-388.
[29] Jacob, J. (1968) Introduction to Cambodian. Oxford University Press, London.
[30] Keating, P. (1985) Universal Phonetics and the Organization of Grammars, in Phonetic Linguistics:
Essays in Honor of Peter Ladefoged, (V. Fromkin, editor), Academic Press.
[31] Khouw E. & V. Ciocca (2007) Perceptual Correlates of Cantonese Tones, Journal of Phonetics, 35,104-117.
[32] Kirk, P. L., P. Ladefoged, J. Ladefoged (1984) Using a spectrograph for measures of phonation types ina natural language, in UCLA Working Papers in Phonetics 59, 102-113.
UC Berkeley Phonology Lab Annual Report (2007)
477

[33] Kirk, P.L., P. Ladefoged, J. Ladefoged (1993) Quantifying acoustic properties of modal, breathy, andcreaky vowels in Jalapa Mazatec, in American Indian Linguistics and Ethnography in honor of Lawrence
C. Thompson. (A. Mattina and T. Montler; editors), University of Michigan, Ann Arbor, 435-450.
[34] Klatt, D.H. (1980) Software for a Cascad/Parallel Formant Synthesizer. Journal of the Acoustical Society
of America 67, 971-995.
[35] Kreiman, J., B. Gerratt, and N. Antoñanzas-Barroso (2007) Measures of the Glottal Source Spectrum.Journal of Speech, Language, and Hearing Research, 50, 595-610.
[36] Ladefoged, P. (1971) Preliminaries to Linguistic Phonetics. Chicago, University of Chicago.
[37] Ladefoged, P. & N. Antoñanzas-Barroso (1985) Computer Measures of Breathy Phonation. UCLA Work-
ing Papers in Phonetics, 61, 79-86.
[38] Ladefoged, P., & I. Maddieson (1985) Tense and lax in four minority languages of China. Journal of
Phonetics, 13, 433-454.
[39] Ladefoged, P., I. Maddieson, and M. Jackson (1988) Investigating Phonation Types in Different Lan-guages, in Vocal Physiology: voice production, mechanisms and functions. (O. Fujimura, editor), RavenPress, Ltd., New York, 297-317.
[40] Laver, J. (1979) The Description of Voice Quality in General Phonetic Theory, in The Gift of Speech:
Papers in the Analysis of Speech and Voice, 1991, Edinburgh University Press.
[41] Laver, J. (1980) The Phonetic Description of Voice Quality. Cambridge.
[42] Liu, S. & A. Samuel (2004) Perception of Mandarin Lexical Tones when F0 Information is Neutralized,Language and Speech, 47(2), 109-138.
[43] Michaud, A. (2004) Final Consonants and Glottalization: New Perspectives from Hanoi Vietnamese,Phonetica, 61:119-146.
[44] Ni Chasaide, A. and C. Gobl (1997) Voice Source Variation, in The Handbook of Phonetic Sciences, (W.Hardcastle and J. Laver, editors), Blackwell.
[45] Pennington, M. (2005) The Phonetics and Phonology of Glottal Manner Features, PhD Dissertation,Indiana University.
[46] Powell, J. & F. Woodruff (1976). Quileute dictionary. Moscow, Idaho: University of Idaho.
[47] Premsrirat, S. and D. Malone (2003) Language development and Language revitalization in Asia ms,SIL International, Mahidol University.
[48] R Development Core Team (2007). R: A language and environment for statistical computing. R Founda-tion for Statistical Computing, Vienna, Austria. ISBN 3-900051-07-0, URL http://www.R-project.org.
[49] Rothenberg, M. Some relations between glottal air flow and vocal fold contact area, Proceedings of the
Conference on Assessment of Vocal Pathology. Ludlow, C.L. and Hart, M.O. (eds.) ASHA Report No.11, 88.
[50] Silverman, D. (1997a) Phasing and Recoverability. Phd Dissertation, Garland Publishing.
[51] Silverman, D. (1997b) Laryngeal complexity in Otomanguean vowels, Phonology, 14:235-261.
[52] Stevens, K. N., and Hanson, H. M. (1995). Classification of glottal vibration from acoustic measurements.In O. Fujimura and M. Hirano (Editors), Vocal fold physiology: voice quality control. Singular PublishingGroup, San Diego, California.
UC Berkeley Phonology Lab Annual Report (2007)
478

[53] Story, B. H. and I. R. Titze (2002) A preliminary study of voice quality transformation based onmodifications to the neutral vocal tract area function, Journal of Phonetics, 30:485-509.
[54] Sundberg, J., Andersson, M., and Hultqvist, C. (1999). Effects of subglottal pressure variation onprofessional baritone singers’ voice sources. Journal of the Acoustical Society of America 105, 1965-1971.
[55] Thongkum, T. (1988) Phonation Types in Mon-Khmer Languages, in Vocal Physiology: voice produc-
tion, mechanisms and functions. (O. Fujimura, editor), Raven Press, Ltd., New York, 319-333.
[56] Thongkum, T. (1991) An Instrumental Study of Chong Registers, in Essays in Mon-Khmer Linguistics
in honor of H.L. Shorto. (J. Davidson, editor), London: School of Oriental and African Studies. 141-160.
[57] Titze, I. R. (1994) Principles of Voice Production, Englewood Cliffs, NJ: Prentice-Hall.
[58] Titze, I. R. & D. Talkin (1981) Simulation and interpretation of glottographic waveforms, Proceedings
of the Conference on Assessment of Vocal Pathology. Ludlow, C.L. and Hart, M.O. (eds.) ASHA ReportNo. 11, 48.
[59] Traill, A. (1985) Phonetic and Phonological Studies of the !Xoo Bushman. Helmut Buske Verlag, Ham-burg.
[60] Traill, A. & M. Jackson (1987) Speaker Variation and Phonation Types in Tsonga nasals. UCLA Working
Papers in Phonetics, 67, 1-29.
[61] Watkins, J. (2002) The Phonetics of Wa: Experimental phonetics, Phonology, Orthography, and Soci-
olinguistics, Pacific Linguistics, 531.
[62] Wayland, R. & A. Jongman (2003) Acoustic Correlates of Breathy and Clear Vowels: the case of Khmer.Journal of Phonetics, 31, 181-201.
[63] Ungsitipoonporn, S. (2001) A Phonological Comparison between Khlong Phlu Chong and Wang Kraphrae
Chong. M.A. Thesis, Institute of Language and Culture for Rural Development, Mahidol University.
UC Berkeley Phonology Lab Annual Report (2007)
479

Appendices
Table 12: Open Quotient StatisticsTime Index Effect of Register Effect of Speaker Speaker X Registert1 F(3, 264) = 52.7 F(4, 264) = 20.1 F(12, 264) = 2.9
p < 0.001 *** p < 0.001 *** p < 0.005 **t2 F(3, 272) = 30.8 F(4, 272) = 43.8 F(12, 272) = 4.7
p < 0.001 *** p < 0.001 *** p < 0.001 ***t3 F(3, 274) = 23.3 F(4, 274) = 64.3 F(12, 274) = 4.5
p < 0.001 *** p < 0.001 *** p < 0.001 ***t4 F(3, 272) = 27.9 F(4, 272) = 86.8 F(12, 272) = 6.8
p < 0.001 *** p < 0.001 *** p < 0.001 ***t5 F(3, 275) = 43.7 F(4, 275) = 125.7 F(12, 275) = 8.1
p < 0.001 *** p < 0.001 *** p < 0.001 ***t6 F(3, 274) = 63.8 F(4, 274) = 146.9 F(12, 274) = 6.7
p < 0.001 *** p < 0.001 *** p < 0.001 ***t7 F(3, 275) = 73.5 F(4, 275) = 175.4 F(12, 275) = 7.8
p < 0.001 *** p < 0.001 *** p < 0.001 ***t8 F(3, 273) = 82.6 F(4, 273) = 170.2 F(12, 273) = 7.5
p < 0.001 *** p < 0.001 *** p < 0.001 ***t9 F(3, 273) = 74.6 F(4, 273) = 138.9 F(12, 273) = 6.1
p < 0.001 *** p < 0.001 *** p < 0.001 ***t10 F(3, 272) = 69.2 F(4, 272) = 110.8 F(12, 272) = 4.8
p < 0.001 *** p < 0.001 *** p < 0.001 ***t11 F(3, 232) = 71.6 F(4, 232) = 99.2 F(12, 232) = 3.8
p < 0.001 *** p < 0.001 *** p < 0.001 ***t12 F(3, 118) = 35.2 F(4, 118) = 66.7 F(12, 118) = 1.8
p < 0.001 *** p < 0.001 *** p < 0.05 *
UC Berkeley Phonology Lab Annual Report (2007)
480

Table 13: Wilk’s Lambda
Time Index Wilk’s Value F-Statistic Significance1 0.28 F(3, 384) = 41.0 p < 0.001 ***2 0.28 F(3, 440) = 46.9 p < 0.001 ***3 0.29 F(3, 440) = 44.7 p < 0.001 ***4 0.31 F(3, 440) = 43.2 p < 0.001 ***5 0.32 F(3, 440) = 40.9 p < 0.001 ***6 0.34 F(3, 440) = 38.4 p < 0.001 ***7 0.38 F(3, 440) = 33.3 p < 0.001 ***8 0.39 F(3, 440) = 33.0 p < 0.001 ***9 0.40 F(3, 440) = 31.8 p < 0.001 ***10 0.41 F(3, 437) = 30.3 p < 0.001 ***11 0.47 F(3, 428) = 24.5 p < 0.001 ***12 0.48 F(3, 372) = 20.7 p < 0.001 ***
Table 14: T-tests of H1-A3 Differences at selected time indices.
Comparison t2 t5 t8 t11modal vs. tense t = -0.27 t = 0.14 t = -0.66 t = -1.98
p = 0.78 p = 0.89 p = 0.51 p = 0.05modal vs. breathy t = -12.8 t = -10.6 t = -10.5 t = -8.6
p < 0.001 *** p < 0.001 *** p < 0.001 *** p < 0.001 ***modal vs. br-tense t = -14.6 t = -8.0 t = -5.1 t = -1.1
p < 0.001 *** p < 0.001 *** p < 0.001 *** p = 0.27tense vs. breathy t = -11.4 t = -9.4 t = -8.5 t = -6.3
p < 0.001 *** p < 0.001 *** p < 0.001 *** p < 0.001 ***tense vs. br-tense t = -12.5 t = -6.7 t = -3.6 t = 0.78
p < 0.001 *** p < 0.001 *** p < 0.001 *** p = 0.44breathy vs. br-tense t = 0.75 t = 3.9 t = 5.6 t = 7.0
p = 0.45 p < 0.001 *** p < 0.001 *** p < 0.001 ***
Table 15: T-tests of H1-H2 Differences at selected time indices.
Comparison t2 t5 t8 t11modal vs. tense t = 2.7 t = 5.0 t = 6.2 t = 4.3
p < 0.01 ** p < 0.001 *** p < 0.001 *** p < 0.001 ***modal vs. breathy t = -2.1 t = -0.47 t = -0.46 t = 0.19
p = 0.04 p = 0.64 p = 0.64 p = 0.85modal vs. br-tense t = 2.0 t = 6.1 t = 6.3 t = 5.2
p = 0.05 p < 0.001 *** p < 0.001 *** p < 0.001 ***tense vs. breathy t = -4.7 t = -4.7 t = -5.8 t = -3.7
p < 0.001 *** p < 0.001 *** p < 0.001 *** p < 0.001 ***tense vs. br-tense t = -0.08 t = 1.2 t = -0.66 t = 0.48
p = 0.93 p = 0.21 p = 0.51 p = 0.63breathy vs. br-tense t = 3.6 t = 5.8 t = 5.7 t = 4.4
p < 0.001 *** p < 0.001 *** p < 0.001 *** p < 0.001 ***
UC Berkeley Phonology Lab Annual Report (2007)
481

Table 16: T-tests of Pitch Differences at selected time indices.
Comparison t2 t5 t8 t11modal vs. tense t = -11.2 t = -12.4 t = -11.2 t = -6.9
p < 0.001 *** p < 0.001 *** p < 0.001 *** p < 0.001 ***modal vs. breathy t = -4.3 t = -3.1 t = -1.2 t = 1.3
p < 0.001 *** p < 0.005 ** p = 0.23 p = 0.19modal vs. br-tense t = -5.9 t = -7.0 t = -4.7 t = -0.34
p < 0.001 *** p < 0.001 *** p < 0.001 *** p = 0.73tense vs. breathy t = 6.4 t = 8.4 t = 8.4 t = 6.9
p < 0.001 *** p < 0.001 *** p < 0.001 *** p < 0.001 ***tense vs. br-tense t = 5.7 t = 6.8 t = 7.0 t = 5.2
p < 0.001 *** p < 0.001 *** p < 0.001 *** p < 0.001 ***breathy vs. br-tense t = -1.1 t = -2.6 t = -2.4 t = -1.3
p = 0.27 p < 0.01 ** p = 0.017 ns p = 0.18
UC Berkeley Phonology Lab Annual Report (2007)
482