the power of partnership - rofin.de€¦ · investment profile the vision & mission. light,...
TRANSCRIPT

THE POWER OF PARTNERSHIP
Annual ReportGeschäftsbericht
2013

ROFIN-SINAR TECHNOLOGIES INC.INVESTMENT PROFILE
The Vision & Mission.Light, when used as a manufacturing tool, is fascinating; it offers a virtually infinite potential of applications in materials processing. At ROFIN, our mission is to create sustainable value by pioneering key innovative technologies and production solutions.
The Company.For more than 35 years, our focus has been to develop advanced production methods for a wide variety of industrial applications. Over this time, ROFIN has become one of the leading global players in the industrial laser material processing sector and possesses one of the industry’s broadest product and technology portfolios. Headquartered in Plymouth, MI, and Hamburg, Germany, our Company maintains more than 20 production facilities in the US, Europe and Asia as well as an extensive global sales and service network. Innovative laser technology from ROFIN is currently being used in many traditional and emerging industries worldwide.
The Strengths.With a steady focus on our core competencies, we offer our clients both standard and customized production solutions based on a comprehensive range of products and technologies. Our in-depth technology and applications know-how benefits our large and diverse customer base in numerous end-markets. Close cooperation with our clients provides us with sector-specific market insight and essential expertise in the requirements and developments of each market. ROFIN has a highly esteemed brand name and a current installed base of more than 49,000 laser units. Our well-structured sales and service network ensures that our clients around the world receive the best possible support. The ROFIN management team has extensive international experience and ROFIN’s highly qualified employees are committed to our and our customers’ success.
The Growth Strategy.The core objectives of our growth strategy are to expand into new industries and applications, driving new laser products through technological innovation, broadening our customer footprint, and leveraging cross-selling opportunities among our business units. Acquisitions of select complementary business segments, technologies or product portfolios provide an additional channel of growth.
The Shares.ROFIN’s shares trade on the NASDAQ Global Select Market under the symbol RSTI and are listed in Germany in the “Prime Standard” segment of the Frankfurt Stock Exchange under ISIN US7750431022. ROFIN is part of the Standard & Poor’s SmallCap 600 Index and the Russell 2000 Index.

ROFIN-SINAR TECHNOLOGIES INC.INVESTMENTPROFIL
Die Vision & Zielsetzung.Licht als „Werkzeug“ ist faszinierend: es bietet ein nahezu unbegrenztes Anwendungspotential in der Material-bearbeitung. Unser Ziel ist die Schaffung nachhaltiger Werte durch die Entwicklung neuer Schlüsseltechnologien und Produktionslösungen.
Das Unternehmen.Seit über 35 Jahren konzentriert sich unser Unternehmen auf die Entwicklung fortschrittlicher Fertigungsmethoden für eine Vielzahl industrieller Anwendungen. In dieser Zeit hat ROFIN sich zu einem der führenden Global Player im Bereich der Lasermaterialbearbeitung entwickelt und besitzt eines der breitesten Produkt- und Technologieportfolios im Markt. Mit Hauptsitzen in Plymouth, MI (USA), und Hamburg verfügen wir über mehr als 20 Produktionsstätten in den USA, Europa und Asien sowie über ein umfangreiches Vertriebs- und Servicenetz rund um den Globus. Innovative Lasertechnologie von ROFIN wird heute weltweit in vielen etablierten Industrien und Wachstumsbranchen genutzt.
Die Stärken.Wir fokussieren uns konsequent auf unsere Kernkompetenzen und bieten standardisierte und kundenspezifische Produktionslösungen auf breiter Produkt- und Technologiebasis. Von unserem tief greifenden Technologie- und Applikationswissen profitiert ein großer Kundenstamm in vielen diversifizierten Endmärkten. Eine enge Ko-operation mit unseren Kunden gewährleistet die Marktnähe, die für eine fundierte Kenntnis der Marktbedürfnisse und -entwicklungen notwendig ist. ROFIN ist eine Marke mit sehr hoher globaler Akzeptanz und einer derzeit installierten Laserbasis von über 49.000 Einheiten. Unser gut strukturiertes Vertriebs- und Servicenetzwerk garantiert unseren Kunden in aller Welt die bestmögliche Betreuung. ROFIN hat ein international sehr erfahrenes Management sowie ein hoch qualifiziertes Mitarbeiterteam, das sich für unseren und den Erfolg unserer Kunden engagiert.
Die Wachstumsstrategie.Die Kernziele unserer Wachstumsstrategie liegen in der Eröffnung neuer Industrien und Anwendungen, der Entwicklung neuer Laserprodukte durch technologische Innovation, der Erweiterung unserer Kundenbasis sowie der Nutzung der Cross-Selling-Effekte in den verschiedenen Geschäftsbereichen. Die Akquisition ausgewählter komplementärer Geschäftsfelder, Technologien oder Produktportfolios bietet zusätzliches Wachstumspotenzial.
Die Aktie.Die ROFIN-Aktie ist am NASDAQ Global Select Market unter dem Kürzel RSTI und im Prime Standard der Frankfurter Wertpapierbörse unter der ISIN US7750431022 notiert. ROFIN wird u.a. im Standard & Poor’s SmallCap 600 und im Russell 2000 Index geführt.

FACTS & FIGURES | ZAHLEN & FAKTEN
OVERVIEW | ÜBERBLICK
TECHNOLOGIES | TECHNOLOGIEN
SALES STRATEGY | VERTRIEBSSTRATEGIE
LASERS & LASER SYSTEMS WITH THE ROFIN BRAND | LASER & LASERSYSTEME DER MARKE ROFIN
ADDITIONAL GROUP BRANDS FOR LASERS & COMPONENTS | WEITERE MARKEN DER GRUPPE FÜR LASER & KOMPONENTEN
In addition to the ROFIN brand, the Group’s laser business includes other brands such as PRC, Lee Laser, DILAS and NELC, and is also complemented by the component business, which comprises diodes and diode laser components, fibers, fiber laser components, optics, beam deliveries and power supplies, that are marketed under additional Group brands such as DILAS, Nufern, Corelase or Optoskand.
Weitere Marken des ROFIN-Konzerns im Bereich Laser umfassen PRC, Lee Laser, DILAS und NELC. Die Geschäftsaktivitäten im Laserbereich werden durch das Komponentengeschäft ergänzt, welches u. a. Dioden, Diodenlaserkomponenten, Fasern und Faserlaserkomponenten, Optiken, Strahlführungssysteme sowie Netzgeräte umfasst, die unter den Marken DILAS, Nufern, Corelase und Optoskand vertrieben werden.
MACRO
MACRO MICRO
MICRO
MARKING
MARKING
PRIMARY MARKETS | HAUPTMÄRKTE
Headquartered in Plymouth, MI, and Hamburg (Germany) | Hauptsitze in Plymouth, MI (USA) und HamburgWorldwide > 2,250 employees | Weltweit > 2.250 MitarbeiterOver 4,000 customers worldwide | Über 4.000 Kunden in aller WeltGlobal sales & service network | Globales Vertriebs- & ServicenetzwerkInstalled base of laser units: > 49,000 | Installierte Basis an Lasereinheiten: > 49.000Revenues from service & spare parts > 25% of turnover | Umsatz mit Service & Ersatzteilen > 25% des Gesamtumsatzes
Gas Lasers | GaslaserCO2 lasers | CO2-Laser
Solid-State Lasers | FestkörperlaserFiber lasers | FaserlaserLamp- and diode-pumped lasers | Lampen- und diodengepumpte Laser
Semiconductor Lasers | HalbleiterlaserDiode lasers | Diodenlaser
OEMMachine tool | Maschinenbau
Cutting | SchneidenWelding | SchweißenSurface Treatment | Oberflächenbearbeitung
Fine Cutting | FeinschneidenFine Welding | FeinschweißenMicro Structuring | MikrostrukturierenPerforating | Perforieren
Vector Marking | Vektorbeschriftung
Jewelry, Photovoltaics, Packaging | Schmuck, Photovoltaik, Verpackung
Smart cards, Labels | Chipkarten, Label
Machine tool Maschinenbau
Automotive & Sub-Suppliers
Automobilbau & Zulieferer
Medical device Medizingeräte
Flexible packaging Verpackungs- industrie
Jewelry | Schmuck
Others | Andere
Photovoltaics Photovoltaik
Semiconductor Halbleiter
Consumer electronics Unterhaltungs-elektronik
Medical device,Consumer goods, Semicon &Electronics | Medizintechnik,
Konsumgüter, Halbleiter & Elektronik
Polymers, Tool & Die, Glass & Displays, Surfaces |
Kunststoff, Werkzeug- und Formenbau,Glas & Displays, Oberflächen
Automotive & Sub-Suppliers, Electronics |
Automobilbau &Zulieferer, Elektronik
37%
28% 27% 8%

Key Items
Kernpunkte
FACTS & FIGURES | ZAHLEN & FAKTEN
REVENUES | UMSÄTZE
GROWTH STRATEGY | WACHSTUMSSTRATEGIE
Fiscal Year 2013 | Geschäftsjahr 2013: USD 560.1 millionFiscal Year 2012 | Geschäftsjahr 2012: USD 540.1 million
SPLIT PER APPLICATION | VERTEILUNG NACH ANWENDUNG SPLIT PER REGION | VERTEILUNG NACH REGIONEN
Focus on new markets andapplications | Eröffnung neuer Märkte
und Anwendungen
Acquire complementarybusiness operations, products or
technologies | Erwerb neuer Geschäfts- bereiche, Technologien
oder Produkte
Offer customized solutions based onstandard platforms | Bereitstellung
kundenspezifischer Lösungen basierendauf Standardplattformen
Capitalize on global footprint to attractnew customers | Nutzung der weltweitenPräsenz zum Ausbau der Kundenbasis
Develop new laser products throughtechnological innovation | Entwicklung
neuer Laserprodukte durch technologischeInnovation
Continue expansion in emergingregions | Weitere Expansion in
Wachstumsregionen
Macro Micro & MarkingComponents | Komponenten Asia | Asien Europe | EuropaNorth America | Nordamerika
38% 35%
13% 20%
49% 45%

CORPORATE INFORMATION | INFORMATIONEN ZUM UNTERNEHMEN
BOARD OF DIRECTORS INVESTOR CONTACT | INVESTORENKONTAKT
AUDITORS | WIRTSCHAFTSPRÜFER
TRANSFER AGENTS AND REGISTRAR | REGISTER- UND TRANSFERSTELLE
SHARE INFORMATION | INFORMATIONEN ZUR AKTIE
Carl F. BaaselMember of the Board of Directors
of Scanlab AG, Germany
Chairman of the Board of Trustees
of the Fraunhofer Institute
for Laser Technology, Germany
Gary K. WillisDirector of Plug Power Corporation
Director of Middlesex Health Services, Inc.
Director of Zygo Corporation
Dr. Stephen D. FantonePresident of Optikos Corporation
Director of Zygo Corporation
Director and Treasurer of the
Optical Society of America
Director of The Hertz Foundation
Chairman and Director of The Pioneer Institute
Ralph E. Reins
Daniel J. Smoke
Dr. Peter WirthChairman of the Board of Directors
USA40984 Concept Dr.
Plymouth, MI 48170
Tel.: +1-734-416-0206
Fax: +1-734-455 2741
Germany | DeutschlandBerzeliusstr. 87
22113 Hamburg
Tel.: +49-(0)-40-7 33 63-4256
Fax: +49-(0)-40-7 33 63 4138
Deloitte & Touche LLP
Detroit, Michigan, USA
Computershare
250 Royall Street
Canton, MA 02021, USA
ROFIN-SINAR Technologies Inc. trades on the NASDAQ Global Select Market System under
the symbol RSTI and in the “Prime Standard” segment of the Frankfurt Stock Exchange under
ISIN US7750431022.
Die Aktie von ROFIN-SINAR Technologies ist am NASDAQ Global Select Market unter dem
Kürzel RSTI notiert und wird am Prime Standard der Frankfurter Wertpapierbörse unter der
ISIN US7750431022 gehandelt.
Günther BraunChief Executive Officer
President

KEY FINANCIALS | FINANZKENNZAHLEN
RESULTS OF OPERATIONS | GESCHÄFTSERGEBNISSE
BALANCE SHEET | BILANZ
NET SALES | UMSATZERLÖSE
NET INCOME | JAHRESÜBERSCHUSS
(in thousands, except per share data and employees) 2009 2010 2011 2012 2013
Net Sales | Umsatzerlöse $ 349,579 $ 423,570 $ 597,763 $ 540,121 $ 560,068
Gross Profit* | Bruttoergebnis* $ 132,047 $ 166,254 $ 232,079 $ 196,352 $ 196,509
Income from Operations* | Betriebsergebnis* $ 8,082 $ 43,959 $ 83,663 $ 50,381 $ 49,216
Net Income (attributable to RSTI) | Jahresüberschuss $ 9,163 $ 29,840 $ 60,032 $ 34,530 $ 34,755
Net Income per Share (diluted) | Gewinn pro Aktie (verwässert) $ 0.31 $ 1.02 $ 2.06 $ 1.20 $ 1.22
Number of Employees | Mitarbeiteranzahl 1,726 1,822 2,108 2,213 2,265
Sales per Employee | Umsatz pro Mitarbeiter $ 203 $ 232 $ 284 $ 244 $ 247
Order Entry | Auftragseingang $ 293,700 $ 474,900 $ 612,100 $ 533,900 $ 531,100
Order Backlog | Auftragsbestand $ 87,600 $ 138,900 $ 153,200 $ 147,000 $ 118,000
(in thousands | in tausend) 2009 2010 2011 2012 2013
Total Assets | Vermögen, gesamt $ 539,507 $ 558,192 $ 653,946 $ 652,532 $ 699,910
Total Liabilities* | Verbindlichkeiten, gesamt* $ 117,813 $ 140,716 $ 175,329 $ 158,613 $ 156,492
Stockholders’ Equity* | Eigenkapital* $ 421,694 $ 417,476 $ 478,617 $ 493,919 $ 543,418
(in thousands | in tausend) 2009 2010 2011 2012 2013
$ 349,579 $ 423,570 $ 597,763 $ 540,121 $ 560,068
(in thousands | in tausend) 2009 2010 2011 2012 2013
$ 9,163 $ 29,840 $ 60,032 $ 34,530 $ 34,755
Fiscal year ends September 30th | Geschäftsjahr endet am 30. September
* Figures for 2009 reflect changes in financial presentation for comparison purposes | Werte für 2009 berücksichtigen Ausweisänderungen zu Vergleichszwecken

Dear Shareholders, Business Partners & Employees Looking back at 2013, ROFIN had a successful fiscal year. We realized most of the key strategic goals that we set out to achieve, enhanced our competitiveness and technological leadership and delivered solid financial and operational performance. Once again we were able to strengthen our position in the market as a competent and reliable partner and were able to convey this position positively to our customers.
Financial & Operational Performance Review Net sales for the fiscal year were in line with our November 2012 guidance, increasing by 4% to $560.1 million compared to $540.1 million in the prior year. Net income for the reporting period totaled $34.8 million, representing 6% of sales. The diluted earnings per share accounted for $1.22 based upon 28.4 million weighted-average common shares outstanding. Fiscal year 2013 was a year of transition for ROFIN, not only with regard to technology but also financial performance. Gross profit for the twelve-month period amounted to $196.5 million, reaching almost the same level as in 2012. In terms of percentage of net sales, however, this represented a decline of 1.3 percentage points to 35.1%. The major reasons for the reduced gross profit margin were on one hand an unfavorable product mix with a higher sales portion of lower margin products, and on the other hand an imbalance in the current cost structure of our fiber laser portfolio. During fiscal year 2014, we should see our gross profit level gradually improve along with the introduction of the communicated technology steps and the completion of all planned cost reduction measures in our fiber laser production, as well as the realization of better fixed cost absorption in this area along with higher sales volumes.
In fiscal year 2013, we shipped a record high of 5,380 laser units from our various production sites to customers around the world, of which 2,125 units were delivered for MACRO applications and 3,255 units for MICRO & MARKING applications. Annual turnover in our MACRO business increased by $9.2 million to $214.6 million over the prior fiscal year and net sales in our MICRO & MARKING business rose by $0.5 million to $272.7 million. In our COMPONENT business, which has gained importance both as a significant part of our vertical integration strategy, and as a growing contributor to the Group's revenues, sales grew by 16% to $72.8 million year-over-year. The turnover in components contributed the remaining 13% to the Group’s overall net sales in fiscal year 2013. On a geographical basis, Europe – with $250.3 million, or 45% of net sales – again contributed the lion's share to our annual turnover. However, many of our products that are sold to customers within Europe, are in fact destined for Asia. Direct sales to Asian countries rose by 7% to $194.9 million and accounted for 35% of annual turnover, whereas North American sales decreased by 3%, totaling $114.9 million, contributing 20% to total net sales. While the dynamics were

quite different in each of the geographic markets that we serve, we experienced weaker order entry across most geographical regions, especially during the fourth quarter. Although European orders improved slightly quarter-on-quarter, they could not fully compensate for the reduction in other regions. Order entry for the year amounted to $531.1 million, with the fourth quarter contributing only $123.5 million, which resulted in an order backlog of $118.0 million at September 30, 2013, providing a challenging start to the new fiscal year. However, based upon current sales projects, new product introductions, and the growing number of processing applications, we believe that we will see an improved book-to-
bill ratio in fiscal year 2014. During fiscal year 2013, we were able to generate $57.0 million cash from operating activities, and ROFIN's balance sheet continues to be strong. Our strong financial setup provides a solid basis for future growth, satisfying our need for technology prospects, working capital, and potential acquisitions. Depending on our net cash as well as any allocation for acquisitions, we will continue to monitor the potential for additional share buyback programs. In fiscal year 2013, we used a portion of our cash to complete our third share buyback program repurchasing approximately 0.7 million shares for a total of $14.8 million. At year end, stockholders' equity amounted to 78% of total assets.
Technological Achievements & Growth Opportunities In order to further strengthen our competitive technological edge, we allocated $43.0 million net of $2.4 million grants, or 7.7% of net sales, to research and development. This is within our typical range of expenses for this area. In addition to the ongoing development of our comprehensive product portfolio, we continue to focus our research and development efforts on further complementing our fiber laser portfolio and expanding output power classes, for example in the high-power range of up to 6 kW lasers. Along with the Company’s vast fiber laser product spectrum in the low- and medium-power range, this represents one of the broadest portfolios for this technology in the market. Another major research and growth initiative is the further advancement of our ultrashort pulse laser product lines for so-called “cold material processing”. Laser material pro-cessing by means of ultrashort laser pulse
lengths is said to be athermal or “cold” as it relies on extremely fast material vaporization, which avoids any undesired side effects such as burrs or micro cracks. Material treatment with ultrashort pulse lasers is one of the most promising new technologies for high-precision cutting, structuring, and drilling of almost all kinds of material without any thermal damage. For this reason, it is ideal for the manufacturing of bio-absorbable polymer stents in the medical device industry or the high-speed scribing of transparent materials like sapphire wafers for LED separation. ROFIN's new offerings of femto- or picosecond laser systems are especially designed for applications in industrial ma-terial processing, which require the highest precision with minimal thermal input. We believe that ROFIN is one of the few suppliers in the laser space that is ideally positioned to benefit from growth opportunities across the entire spectrum of key technologies used in industrial laser materials processing.

Capitalizing on Strengths & Benefiting from the Power of Partnership One of ROFIN’s strengths and something that distinguishes us from other market participants, is our reputation and commitment to being an independent and reliable consultant to our customers in the industrial laser space. We are proud to have long-lasting relationships with our business partners, to whom we provide specific and appropriate solutions that include, but are not limited to, consultation, planning, installation, commissioning, and mainte-nance. Our large and diverse customer base in numerous end markets benefits, not only from being able to choose the most suitable technology from ROFIN’s vast technology portfolio, but also from the in-depth technology and applications know-how that ROFIN has acquired over the past three decades. Close cooperation with our clients provides us with sector-specific market insight and essential expertise in the requirements and developments of each market. Our specialized regional and industry sales engineers strive to ensure that our customers around the globe receive optimal
advice and support. Knowing that our work enables others to develop and manufacture high-quality products and supports them in their daily work, motivates us to innovate and helps us to provide excellent service every day. From questions about machine operation, carrying out maintenance work, to the selection of laser parameters, our highly-skilled members of service staff help to optimize production processes on-site, thus increasing efficiency and reducing costs of parts. In addition, our customers may profit from special training courses in operation, maintenance, software, and application, which are supplemented and enhanced by practical exercises, thus enabling them to perform some basic maintenance work by themselves. We are not aiming to become an industrial laser commodity supplier, but we will continue to focus on our strength in applications and laser source and systems know-how to demonstrate to our customers that they can get the best offering from ROFIN.
Industry Trends & Growth Potential In fiscal year 2013, we benefited once again from our specific industry know-how and the technological expertise that we have gained in the industry sectors in which we have been involved over the past three decades. Some of the markets we serve are highly cyclical, but the broad diversity of our end markets prevents our Company from be-
coming overly dependent on any single sector. Two typically cyclical industries are the consumer electronics and semiconductor markets. Together with the photovoltaic and smart card industries, these sales accounted for 27% of annual laser-related revenues of $343.2 million, which exclude turnover in service, training, and spare parts.
Consumer Electronics – A Healthy Business Level The consumer electronics business is generally driven by new product intro-
ductions that in turn trigger investment activity. In fiscal year 2013, we benefited

from a healthy business level in the consumer electronics sector as well as from a good project base. As manufacturers are constantly innovating in terms of tech-nological developments, in their design, and the materials they use for the latest generation of communication devices, applications have to be developed at the same pace in order to translate those innovations into efficient and economic production processes. ROFIN’s ample expertise and vast technology portfolio offers all the prerequisites for the development of such applications. This way new laser products evolve and are sold to EMS companies or directly to communication device manufacturers. One recent example is the laser cutting of sapphire glass – a highly scratch-resistant material – which on top of its use in camera lenses in today’s portable devices, could also soon replace entire glass touchscreen displays. Although the cutting of
glass and other brittle materials is already widely in use, this opens up further potential for laser cutting applications in consumer electronics and also other industries. The same holds true for laser patterning or micro-structuring of carrier materials, an application that can be successfully used wherever ultra-fine conductor structures are required in the mass production of displays. Such laser-patterned carrier materials, such as ITO-coated glass for example, are a key enabler for flat panel and touch panel display devices. This market is growing significantly with the adoption of flat panel displays for portable communication devices, such as smart-phones or tablet PCs, and it is expected to grow even further with the upcoming adoption of touch screen displays for laptops and PCs. Since the laser ensures a cost-effective, high-quality manufacturing solu-tion, the opportunities in this sector are almost endless.
Semiconductor Industry – A Mixed Picture Our overall business level in the semi-conductor industry during the fiscal year was below standard with a solid demand for backend applications at the beginning of our reporting period, and lower business volumes in the second half. This was countered by a good project base for new frontend laser applications, as we were able to expand our addressable markets for semiconductor applications through the introduction of a new industrial turnkey laser system, which was especially designed for wafer marking and IGBT (Insulated Gate Bipolar Transistor) annealing applications. IGBTs are manu-factured on thinned wafers, the surfaces of which are changed in their characteristics and
properties by thermo-treatment. Another recent application trend with a high potential for laser applications is laser dicing and scribing of wafers or other thin layer materials such as those that are widely in use in the semiconductor industry including the manufacture of LEDs. In this area, the laser is becoming an even more popular production tool, increasingly replacing more traditional processing methods such as sawing, as carrier materials become thinner and make mechanical treatment almost impossible. We believe that with our Group's existing highly complex technology portfolio and technical excellence, we will be able to benefit from these trends.

Solar – A Comeback Story! In the photovoltaic sector, manufacturers and suppliers still face challenging times due to persisting – though decreasing – global overcapacity and intensive price erosion in the past. Despite the associated market consolidation and overall reduced invest-ment, innovations such as improved solar cell efficiency continue to be made, and are vital in allowing photovoltaic manufacturers to remain competitive in the market. Therefore our innovative laser solutions, which significantly enhance the efficiency of mono- and multi-crystalline cells and modules, continue to stimulate our business in this sector. Business opportunities arise here on one hand through a couple of planned
fabrication sites, especially in China, and on the other hand through the modernization of existing production lines. Business projects in this region of course depend on local governmental decisions that may influence investment affinity. In China, for example, the government has restricted its lending policy to the photovoltaic industry, which will now depend on an improvement in electrical efficiency of the solar cells produced. Ultimately, we believe this development will enhance business opportunities for our sophisticated laser equipment, once the more restrained spending behavior that is currently pervading the market picks up and investment activity has normalized.
Automotive – A Technology Trendsetter Our revenues with laser units and systems for the automotive and sub-supplying industry accounted for 8% of the total annual laser-related turnover. Traditionally, ROFIN has great expertise in standard laser marking solutions, such as label marking or the realization of backlit apertures with a day and night design. Regarding the latter, the laser selectively removes specific lacquer layers from multilayer-coated transparent parts and this is, for example, largely used in the cockpit area, but also on other polymer components in car manufacture. Due to its flexibility and low production costs, laser day and night marking has almost completely replaced two-component injection molding. Another example of customers relying on ROFIN’s extensive application know-how would be the interior lights of modern cars, which make already full usage of laser-marked LEDs. Together with a range of micro applications such as the cutting of air bag tissue or the polymer welding of car remote controls,
these standard applications in the auto-motive sector have provided us with a solid business level in fiscal year 2013. In automotive manufacturing processes, where more high-power lasers are required, we are increasingly seeing the fiber laser becoming a standard tool for welding and cutting applications. This is one of the attractive target markets for our high-power fiber lasers as we now have power classes from 4 to 6 kW in our technological product portfolio. During the fiscal year we delivered a couple of high-power fiber lasers for automotive applications and started a vast range of interesting projects so that we believe to gain a foothold with our new power classes in this sector. However, high-power applications are not ROFIN’s only focus for increasing its share in the automotive sector. We were also able to benefit from our enhanced engagement in the development of ultrashort pulse lasers and their manifold application possibilities, such as the laser drilling of miniaturized holes

in injection nozzles. This is a recent and promising application which optimizes diesel and fuel injection systems, leading to
substantial fuel savings and an increase in engine efficiency.
Machine Tool – The Traditional Applications As usual, sales to the machine tool industry contributed the lion’s share of 37% to our laser-related turnover during the reporting period. The beginning of our fiscal year was characterized by a good sales level overall for our higher and lower power CO2 laser portfolio as well as for our higher power fiber laser solutions. While the positive business trend for higher power fiber lasers continued into the second half of the fiscal year, we experienced softer demand for the higher power CO2 lasers, which was certainly in part due to a general shift from CO2 towards fiber laser technology for some high-power applications but also due to the completion of a volume order for a major infrastructure project in China, which drove high-power CO2 laser sales in the first half of the year. Upside potential for sales in higher power CO2 lasers offer some special applications, such as the welding of thicker-walled tubes and profiles where CO2 laser technology can demonstrate its advantages against solid-state lasers, as it prevents heavy spatter formation during the production process. One of the clear highlights in the machine tool sector was again the excellent business level with our low- to medium-power CO2 lasers throughout the fiscal year. Due to their wavelength, CO2 laser sources in these power classes are ideally suited to the treatment of all kinds of
organic materials, which cannot be processed with lasers of other wavelengths, as the organic tissues do not absorb the laser beam in the required manner. Today, this laser technology can be found in the mass production of leather shoes or air bag fabrics as well as in the manufacture of textiles, to name just a few of its many uses. The market for laser processing organic materials should remain a growth driver, where high single- digit to double-digit growth rates are possible. We believe that the opportunities for laser use in mass production are widespread and steadily increasing, and that ROFIN will be able to benefit from this trend with its comprehensive laser solution portfolio. Various other industries we serve have contributed to ROFIN’s annual laser-related revenues ranging from tool and mold-making to watch industries, from dental and major appliances to medical devices, as well as the packaging industry. Summed up, the turnover from all of these other industrial sectors accounted for 28% of annual revenues, excluding service or parts business during the fiscal year, and a larger portion of this contribution typically comes from the medical device and flexible packaging markets.
Medical Device – Precision is Key Our expertise of more than a decade benefits our large customer base in the medical device sector. Today, minimally invasive surgery techniques are expanding in popularity, and miniaturized implants as well as numerous other products in the medical device industry
are becoming ever smaller and smaller. The laser is a wear-free tool and is able to ensure highly reliable manufacturing processes with high speed and high productivity of the utmost quality, and is therefore ideally suited for cutting widths and weld seams within a

range of only a few microns. Besides the standard applications that contributed the major portion to our revenues from the medical device industry in fiscal year 2013, there was an increasing number of projects with our innovative system solutions using ultrashort-pulsed laser technology. Note-worthy with regard to the business performance in the medical device sector is the regional split during our reporting period. Europe and Asia delivered a very solid business level, whereas the North American revenues ended up being weaker due to the introduction of new tax regulations in the US at the beginning of 2013. Even though the enacted legal framework led at first to temporary investment reluctance, we believe
it also offers significant upside potential for future business, as new tracking requirements were also implemented for medical devices, which open up new opportunities for laser marking applications. In addition, the markets in Asia continue to offer substantial upside potential as healthcare markets are evolving in this region. More opportunities to enhance our business are opened up through the many interesting applications and projects in which our new technological developments are implemented, such as our ultrashort pulse lasers which are also used for “cold” laser applications like the fine cutting of fully bio-absorbable stents.
Flexible Packaging – A CO2 Laser Domain In markets such as consumer goods or the food sector, manufacturers are very demanding with respect to packaging aspects, such as safe transportation and storage, attractive presentation on the shelf, control of freshness, as well as easy opening or easy preparation in convenience food packs to name but a few matters for consideration. Laser technology provides solutions for all kind of packaging of goods, from the weakening of material layers for easy opening and reclosing, to the laser cutting of patented fruit packaging that need neither metal staples nor glue. The vast majority of laser processing methods for materials such as foils or paper are clearly the
domain of CO2 laser technology, as well as is the laser marking of expiration dates or batch numbers on packs. The number of intelligent packaging applications by means of lasers is almost indefinite and many companies rely on ROFIN's highly sophisticated laser technology portfolio and its wide spectrum of customized system solutions. In fiscal year 2013, the business in this industry sector attained a solid level and our key focus for the future will be to further capitalize on our in-depth knowledge of sophisticated packaging solutions in order to attract new customers globally from the food, industrial, and pharmaceutical packaging market segments.
Equipped for Sustained Growth Being close to our industrial customers allows us to understand their needs, which is an essential and important prerequisite in the industrial business environment. We invested early on to expand our global footprint by
establishing or acquiring new production, sales and service entities around the world. Having a client base that is well-diversified both geographically and by sector, spanning throughout attractive emerging markets, is

one of our key strategic goals in sustaining long-term growth. Our cutting-edge technology and innovative strength, combined with our intensive customer focus, in-depth applications experience, and our service mindset, are just some of the cornerstones of our business strategy leading us to believe that we are well equipped to deal with future challenges and opportunities. In addition, we believe that our philosophy of supporting a com-prehensive product range, encompassing all key technologies and the majority of applications in laser material processing, and focusing on cross-selling to an extensive customer base has proved its merits. We accomplished our 2013 key strategic objectives and once again demonstrated that
ROFIN can benefit from its technological know-how and expertise, as well as its excellent reputation in the market. We firmly believe that our Company’s performance is the result of the combined efforts of the people who embody the enterprise’s values and strengths and are committed to driving sustainable success. It is only through continued hard work and dedication that ROFIN is able to achieve its financial and operational performance. I would therefore like to take this opportunity to thank our employees, customers, vendors, and shareholders for their contributions and trust in our Company in 2013, and express my gratitude to the Board of Directors for their vision and guidance.
Yours Sincerely
Günther Braun CEO & President ROFIN-SINAR Technologies Inc.

Page intentionally left blank.

REPORT ON FORM 10-K
Fiscal Year 2013

UNITED STATESSECURITIES AND EXCHANGE COMMISSION
Washington, D.C. 20549
FORM 10-K
ANNUAL REPORT PURSUANT TO SECTION 13 OR 15(d) OF THE SECURITIES EXCHANGE ACT OF 1934 For the fiscal year ended September 30, 2013
TRANSITION REPORT PURSUANT TO SECTION 13 OR 15(d) OF THE SECURITIES EXCHANGE ACT OF1934
For the transition period from to
Commission file number: 000-21377
ROFIN-SINAR TECHNOLOGIES INC.(Exact name of Registrant as specified in its charter)
Delaware 38-3306461(State or other jurisdiction ofincorporation or organization)
(I.R.S. EmployerIdentification No.)
40984 Concept Drive, Plymouth, MI 48170
(Address of principal executive offices) (Zip Code)
Registrant’s telephone number, including area code: (734) 455-5400 Securities registered pursuant to Section 12(b) of the Act:
Title of each class Name of each exchange on which registered
Common stock, par value $0.01 per ShareRights Associated with common stock, par value
$0.01 per Share
The NASDAQ Global Select Market
Securities registered pursuant to Section 12(g) of the Act: NONE Indicate by check mark if the registrant is a well-known seasoned issuer, as defined in Rule 405 of the Securities Act. Yes No Indicate by check mark if the registrant is not required to file reports pursuant to Section 13 or Section 15(d) of the Act. Yes No
Indicate by check mark whether the registrant: (1) has filed all reports required to be filed by Section 13 or 15(d) of the Securities Exchange Act of 1934 during the preceding 12 months (or for such shorter period that the registrant was required to file such reports) and (2) has been subject to such filing requirements for the past 90 days. Yes No
Indicate by check mark whether the registrant has submitted electronically and posted on its corporate Website, if any, every Interactive Data File required to be submitted and posted pursuant to Rule 405 of Regulation S-T during the preceding 12 months (or for such shorter period that the registrant was required to submit and post such files). Yes No Indicate by check mark if disclosure of delinquent filers pursuant to Item 405 of Regulation S-K (§229.405 of this chapter) is not contained herein, and will not be contained, to the best of registrant’s knowledge, in definitive proxy or information statements incorporated by reference in Part III of this Form 10-K or any amendment to this Form 10-K.

2
Indicate by check mark whether the registrant is a large accelerated filer, an accelerated filer, a non-accelerated filer, or a smaller reporting Company. See definition of “accelerated filer”, “large accelerated filer”, and “smaller reporting company” in Rule 12b-2 of the Exchange Act.
Large accelerated filer Accelerated filer Non-accelerated filer Smaller reporting company Indicate by check mark whether the registrant is a shell company (as defined in Rule 12b-2 of the Exchange Act). Yes No
The aggregate market value of the voting and non-voting common equity held by non-affiliates of the registrant based upon the closing price of the common stock on March 29, 2013 (the last business day of the most recently completed second fiscal quarter) as reported by the NASDAQ Global Select Market was approximately $757,726,642. For the purposes hereof, “affiliates” include all executive officers and directors of the registrant. 28,141,469 shares of the registrant’s common stock, par value $0.01 per share, were outstanding as of November 26, 2013. Certain sections of the Company’s Proxy Statement to be filed in connection with the Company’s 2014 Annual Meeting of Stockholders to be held in March 2014 are incorporated by reference herein at Part III, Items 10-14.

3
ROFIN-SINAR TECHNOLOGIES INC.
TABLE OF CONTENTS
Page
PART IITEM 1. BUSINESS 4ITEM 1A. RISK FACTORS 23ITEM 1B. UNRESOLVED STAFF COMMENTS 31ITEM 2. PROPERTIES 31ITEM 3. LEGAL PROCEEDINGS 32ITEM 4. MINE SAFETY DISCLOSURES 32
PART IIITEM 5. MARKET FOR REGISTRANT’S COMMON EQUITY, RELATED
STOCKHOLDER MATTERS AND ISSUER PURCHASES OF EQUITY SECURITIES 33
ITEM 6. SELECTED FINANCIAL DATA 36ITEM 7. MANAGEMENT’S DISCUSSION AND ANALYSIS OF FINANCIAL
CONDITION AND RESULTS OF OPERATIONS37
ITEM 7A. QUANTITATIVE AND QUALITATIVE DISCLOSURES ABOUT MARKET RISK 46ITEM 8. CONSOLIDATED FINANCIAL STATEMENTS AND SUPPLEMENTARY DATA 47ITEM 9. CHANGES IN AND DISAGREEMENTS WITH ACCOUNTANTS ON
ACCOUNTING AND FINANCIAL DISCLOSURE47
ITEM 9A. CONTROLS AND PROCEDURES 47ITEM 9B. OTHER INFORMATION 48
PART IIIITEM 10. DIRECTORS, EXECUTIVE OFFICERS AND CORPORATE GOVERNANCE 48ITEM 11. EXECUTIVE COMPENSATION 48ITEM 12. SECURITY OWNERSHIP OF CERTAIN BENEFICIAL OWNERS AND
MANAGEMENT AND RELATED STOCKHOLDER MATTERS49
ITEM 13. CERTAIN RELATIONSHIPS AND RELATED TRANSACTIONS AND DIRECTOR INDEPENDENCE
49
ITEM 14. PRINCIPAL ACCOUNTANT FEES AND SERVICES 50
PART IVITEM 15. EXHIBITS AND FINANCIAL STATEMENT SCHEDULES 51

4
PART I Cautionary Note Regarding Forward-Looking Statements Certain statements in this Annual Report on Form 10-K constitute forward-looking statements within the meaning of the Private Securities Litigation Reform Act of 1995 (the “Reform Act”). Forward-looking statements include all statements that do not relate solely to historical or current facts, and can be identified by the use of words such as “may”, “believe”, “will”, “expect”, “project”, “anticipate”, “estimate”, “plan” or “continue”. These forward-looking statements are based on the current plans and expectations of our management and are subject to a number of uncertainties and risks that could significantly affect our current plans and expectations, as well as future results of operations and financial condition. These factors include (among others):
• downturns in the machine tool, automotive, semiconductor, electronics, photovoltaic, and medical device industries which may have, in the future, a material adverse effect on sales and profitability of the Company;
• the ability of the Company’s OEM customers to incorporate its laser products into their systems;
• the impact of exchange rate fluctuations, which may be significant because a substantial portion of the Company’s
operations is located overseas;
• the level of competition and the ability of the Company to compete in the markets for its products;
• the Company’s ability to develop new and enhanced products to meet market demand or to adequately utilize its existing technology;
• third party infringement of the Company’s proprietary technology or third party claims against the Company for the
infringement or misappropriation of proprietary rights;
• the scope of patent protection that the Company is able to obtain or maintain;
• competing technologies that are similar to or that serve the same uses as the Company’s technology;
• the Company’s ability to efficiently manage the risks associated with its international operations; and
• the other risks described under “ITEM 1A - Risk Factors”. In making these forward-looking statements, we claim the protection of the safe-harbor for forward-looking statements contained in the Reform Act. We do not assume any obligation to update these forward-looking statements to reflect actual results, changes in assumptions, or changes in other factors affecting such forward-looking statements.
ITEM 1. BUSINESS COMPANY OVERVIEW ROFIN-SINAR Technologies Inc. was incorporated in 1996 under the laws of the State of Delaware. ROFIN-SINAR's shares trade on the NASDAQ Global Select Market under the symbol RSTI. In this report, the terms “Company”, “ROFIN”, “RSTI”, “we”, “us”, and “our” mean ROFIN-SINAR Technologies Inc., and all entities included in the Company's consolidated financial statements.
ROFIN-SINAR Technologies is a leader in the design, development, engineering, manufacturing and marketing of laser sources and laser-based system solutions for industrial material processing applications, which include primarily cutting, welding and marking a wide range of materials. The Company's product portfolio ranges from single laser-beam sources to highly complex systems, covering all of the key laser technologies such as CO2 lasers, fiber, solid-state and diode lasers, and the entire power spectrum, from single-digit watts up to multi-kilowatts, as well as a comprehensive spectrum of wavelengths. An extensive range of laser components completes the product portfolio. Lasers are a non-contact technology for material processing, which have several advantages compared to conventional manufacturing tools that are desirable in industrial applications. The Company's lasers all deliver a high-quality beam at guaranteed power outputs and feature compact design,

5
high processing speed, flexibility, low operating and maintenance costs and easy integration into the customer's production process thus meeting a broad range of its customers' material processing requirements.
Through its global manufacturing, distribution and service network, the Company provides a comprehensive range of laser sources and laser-based system solutions to the following principal target markets: the machine tool, automotive, semiconductor, electronics, and photovoltaic industries. The Company sells directly to end users and to original equipment manufacturers (“OEMs”) that integrate ROFIN's laser sources with other system components. Many of ROFIN's customers are among the largest global participants in their respective industries. During fiscal 2013, 2012, and 2011, 20%, 22%, and 18%, respectively, of the Company’s sales were in North America, 45%, 44%, and 45%, respectively, were in Europe, and 35%, 34%, and 37%, respectively, were in Asia.
ROFIN's sales approach in the laser-related business reflects the many different requirements of its customers throughout a multitude of industries, and is divided into three areas of core competence: Macro, Micro, and Marking. The core of the Macro business section is high-powered laser sources, primarily used for cutting and welding as well as surface treatment applications. The Micro section concentrates on laser sources and laser-based system solutions that require less power output for micro-processing of materials. The Marking section specializes in innovative marking solutions on both organic and inorganic materials for many different industries. The activities in the components sector which comprises of diodes and diode laser components, power supplies, fibers and fiber beam deliveries as well as fiber laser components round out the Company's business activities in the industrial laser market. During fiscal 2013, 2012, and 2011, approximately 38%, 38%, and 40%, respectively, of the Company’s revenues related to sales of laser products for macro applications, approximately 49%, 50%, and 50%, respectively, related to sales of laser products for marking and micro applications, and approximately 13%, 12%, and 10%, respectively, related to sales of components.
THE INDUSTRIAL LASER MARKET FOR MATERIAL PROCESSING Over the past decades, lasers have revolutionized industrial manufacturing and have been used increasingly to provide reliable, flexible, non-contact, compact, and high-speed alternatives to conventional technologies for processing various kinds of metal and non-metal materials in a broad range of advanced manufacturing applications. The industrial laser market is generally considered to be made up of laser sources sold for industrial applications including material processing, medical therapeutic, instrumentation, research, telecommunications, optical storage, entertainment, image recording, inspection, measurement and control, bar-code scanning, and other end-uses.
According to the Industrial Laser Solutions magazine's 2013 forecast for industry data published in January 2013, worldwide laser revenues for industrial applications (excluding lithography, inspection, measurement, research, medical, etc.) are expected to reach approximately $2.2 billion. Based on this data, the Company estimates that it has currently a market share in the relevant industrial laser sector of approximately seventeen percent (based on laser-related sales volume). The Company has sold more than 66,000 laser sources since 1975 and currently has over 4,000 active customers (including multinational companies with multiple facilities purchasing from the Company).
BUSINESS STRATEGY The Company's business strategy is to maximize shareholder value by (i) strengthening its position as a leading supplier to the global market for macro (cutting and welding) applications; (ii) capitalizing on its leadership position in marking applications; (iii) extending its position in micro (fine cutting, fine welding, perforating, and structuring applications); (iv) cross-selling its various laser products to its existing large customer base; (v) enlarging its market coverage geographically and by developing new applications; (vi) strengthening its product portfolio and customer base through acquisitions; and (vii ) broadening its component product portfolio.
The Company believes that the major sources of its future growth will be the following:
• Developing New Laser Products through Technological Innovation: Product innovation in response to evolving customer needs for increased output power, greater penetration and higher processing speeds is a key component of the Company's strategy. The Company is currently focusing its research and development activity on expanding the output power range of its CO2, diffusion cooled, wave-guide Slab lasers and enhancing the performance of its line of high power, fast-flow CO2 lasers. The Company is also expanding its series of end and side pumped, solid-state lasers for marking and micro applications. In addition, the Company is actively engaged in the research and development of its low- and high-power fiber laser family to further expand its solid-state laser offering for marking, micro, and macro

6
applications. The Company is also enhancing its research and development efforts in order to broaden its portfolio of ultrashort pulse lasers. In addition, research and development is focused on expanding the Company's product range, especially in the field of passive and active fibers, laser diodes, power supplies, and fiber delivery systems.
• Focusing on Cross-Selling to Existing Customers in Target Markets: The Company intends to continue to focus its sales and marketing activities on its traditional target markets (the machine tool, automotive, semiconductor, electronics, and medical device industries) as well as those markets it has entered more recently (flexible packaging and photovoltaic industries). The Company has targeted and will continue to target these industries because they use advanced manufacturing processes that require continuing investments to improve production efficiency and because the Company has significant market presence in these sectors. In addition, building on the success of its laser marking of small integrated circuits, the Company intends to develop new applications, such as fine welding, cutting, and drilling for the semiconductor and electronics industry. In the packaging industry, the Company is seeking new opportunities for foil perforation based on its extensive knowledge of paper perforation with lasers. In the photovoltaic industry, the Company intends to further exploit structuring applications for its macro and micro laser products such as scribing of thin film solar cells as well as crystalline solar cells.
• Capitalizing on Global Presence to Attract New Customers: The Company intends to capitalize on its customer base and the presence of its manufacturing, sales and service operations in the three principal geographic markets in which its customers operate (North America, Europe, and the Asia/Pacific region) to increase market share in its existing industrial and geographic markets. The Company believes its global manufacturing, distribution and service network allows it to be more responsive to customers' needs and positions it to expand into additional promising markets which offer high long-term potential for growth.
• Offering Customized Solutions based on Standard Platforms: While the Company offers a wide range of laser applications and develops customized solutions for its customers, these applications and solutions are built on a focused number of product families comprised of standardized laser sources. For example, for its OEM customers in the machine tool industry, the Company provides customized laser versions. For its marking customers, the Company combines its standard laser markers with customized parts handling and software. For its micro applications customers, the Company delivers its standard laser sources in different customized packages. The Company believes that this product strategy has contributed to increases in product sales and intends to continue offering focused customization services and pursuing its initiatives to standardize its core products so as to lower its production costs and continue to improve its profitability.
• Acquiring Complementary Business Operations or Products: Besides growing organically, one of ROFIN's targets is to grow through strategic acquisitions. Since 1997 the Company has successfully acquired and integrated fifteen businesses, including its acquisitions of DILAS Diodenlaser GmbH (“DILAS”) (1997), assets of Palomar Technologies UK Ltd. (1998), Rasant-Alcotec Beschichtungstechnik GmbH (“Rasant”) (1999), Baasel Lasertech (“CBL”) (2000), Z-Laser S.A. (2001), Optoskand AB (“Optoskand”) (2004), PRC Laser Corporation (“PRC”) and Lee Laser, Inc. (“Lee”) (2004), H2B Photonics GmbH (“H2B”) (2006), ES Technologies Ltd. (2007), Corelase Oy (2007), m2k-laser GmbH (2007), Nufern (2008), Nanjing Eastern Laser Co. Ltd. (“NELC”) (2009), the coil winding business from Optelecom-NKF, Inc. (2010) and LASAG AG (“LASAG”) (2011). Management believes that, collectively, these acquisitions have advanced the Company's worldwide expansion, consolidated the Company's position in the industrial laser material processing market and contributed to the Company's financial performance during the last several years. The Company will continue to seek opportunities to make value-based acquisitions that complement its business operations, broaden its product offerings, or provide access to new geographical markets.
LASER TECHNOLOGY The term “laser” is an acronym for “Light Amplification by Stimulated Emission of Radiation”. Lasers were first developed in the early 1960s in the United States. A laser consists of an active lasing medium that gives off its own light (radiation) when excited, an optical resonator with a partially-reflective output mirror at one end, a fully-reflective rear mirror at the other that permits the light to bounce back and forth between the mirrors through the lasing medium, and an external energy source used to excite the lasing medium. A laser works by causing the energy source to excite (pump) the lasing medium, which converts the energy from the source into an emission consisting of particles of light (photons). These photons stimulate the release of more photons, as they are reflected between the two mirrors, which form the resonator. The resulting build-up in the number of

7
photons is emitted in the form of a laser beam through an output port or “window”. By changing the energy and the lasing medium, different wavelengths and types of laser light can be produced. The laser produces light from the lasing medium to achieve the desired intensity, uniformity, and wavelength through a series of reflective mirrors. The heat generated by the excitation of the lasing medium is dissipated through a cooling mechanism, which varies according to the type of laser technology.
Lasers are used for material processing because they have many advantages over other conventional production methods. In many areas of industrial manufacturing, lasers already allow for significantly greater precision, flexibility, and productivity and are often the only technology that enables efficient mass production of new products. The principal factors that distinguish different types of lasers and determine the particular laser suitable for a specific application, besides economic reasons, are wavelength, pulse duration, output power, and spatial coherence.
The principal types of laser technologies currently used for material processing are CO2 lasers, solid-state lasers, fiber lasers, and diode lasers.
CO2 lasers, which use CO2 gas as the lasing medium, are divided into high-power (above 500 watts) and low-power (below 500 watts) applications. There are two methods for CO2 excitation, radio frequency (“RF” or “HF”) and direct current (“DC”) excitation. Most high-power CO2 lasers are based on gas flow, in which a continuous supply of fresh laser gas flows through the laser cavity to create the energy necessary for excitation. Due to their ability to generate comparatively high levels of continuous-wave (“CW”) power, CO2 lasers are a particularly attractive laser medium for material processing applications. Material processing applications for CO2 laser sources vary according to the power output and configuration of the laser system. The primary applications for high-power CO2 lasers are cutting and welding of metal as well as surface treatment. Low-power CO2 lasers are used principally for marking, cutting, and engraving of organic materials. While both low- and high-power CO2 lasers are used for cutting, the materials they are used to process and their physical size can vary significantly.
Traditional solid-state lasers use flash lamps or laser diodes as source of excitation and are referred to as “flash-lamp-pumped” or “diode-pumped” lasers. The lasing medium is a solid-state crystal, generally in the form of a rod or a disc. Widely used crystal rod material is either neodymium yttrium aluminum garnet (Nd:YAG) or neodymium vanadate (Nd:YVO4). The rod is positioned in a cavity, which is either a gold or ceramic reflector, and pumped using flash lamps or laser diodes from the side, or alternatively the rod is pumped from its ends with laser diodes. Typical output powers vary from 3 to 1,000 watts from a single rod and output powers in the multiple kilowatt range can be achieved by combining several cavities within a resonator. In the “disc design” the lasing medium is a thin crystal (typically ytterbium:YAG) disc, which is excited by laser diodes in an optical multi-pass configuration. By using multiple thin disc laser heads within one resonator, several kilowatts of power can be generated.
Fiber lasers are solid-state lasers that have their origin in low-power information and communication applications, and since 2003 have undergone a rapid development towards higher output powers, which has also made this technology attractive for higher-power material processing applications. The lasing medium, typically ytterbium, is contained in a waveguide (the active fiber itself) and surrounded by a cladding, which guides the pump light to the lasing medium. With in-fiber components like fiber bragg gratings, tapered fiber bundles (pump light couplers), power combiners, and delivery fibers, from the generation of the light to the delivery of the light to the work piece, can be realized in an “all-in-fiber” technology. Today, a kilowatt and more can be generated from a single fiber, no bigger in diameter than a human hair. Higher power can be generated by bundling multiple fibers.
Solid-state and fiber lasers can also be used as mode-locked lasers emitting ultrashort pulses, i.e. pulses with durations of femtoseconds or picoseconds, which are suitable for processing the very sensitive materials.
Diode lasers are based on special semiconductor structures on a gallium arsenide (GaAs) die to generate laser light. A typical 10 mm long laser diode bar contains approximately 25 single laser emitters. When mounted on a specially designed, highly-efficient heat sink, a laser diode bar is able to produce up to 100 watts of laser output power. A single high-power laser diode module consists of: (1) a semiconductor laser diode bar; (2) a high-efficient heat sink, on which the laser bar is mounted; and optional (3) a micro-lens system, which is mounted in front of the laser bar to collimate or focus the light. Optical output power can be increased by combining the beamlets of several laser diode modules on top of each other. Through optical combination of such modules, output powers in the kilowatt range can be achieved. Diode lasers typically have larger spot diameters when focused, and are typically used for surface treatment such as cladding or hardening, soldering, and plastic welding.

8
THE COMPANY’S LASER PRODUCTS The Company distinguishes itself from the majority of its competitors who specialize in only one or two of the three principal laser technologies for material processing by offering its customers CO2, solid-state, fiber, and diode laser sources, and solutions in a variety of configurations and options. As a technological leader in CO2, solid-state, fiber, and diode lasers, the Company is able to meet a broad range of its customers' cutting, welding, and marking requirements. The Company's lasers all deliver a high-quality beam at guaranteed power outputs and feature compact design, high processing speed, flexibility, low operating and maintenance costs, and easy integration into the customer's production process. The Company's engineers and other technical experts work directly with the customer in the Company's applications centers to develop and customize the optimal solution for the customer's manufacturing requirements.
The Company currently offers a comprehensive range of laser products and related services for three principal material processing applications:
• cutting, welding, and surface treatment (macro applications);
• marking; and
• fine cutting, spot and seam welding, micro drilling, scribing, perforating, and fine structuring/ablation (micro applications).
Besides offering standard solutions and laser systems for some specialized niche applications, the Company works directly with its customers to develop and customize optimal solutions for their unique manufacturing requirements. In developing its laser-based solutions, the Company offers customers its expertise in:
• product development and manufacturing services based on over 35 years of laser technology experience and applications know-how;
• application and process development, which means developing new laser-based applications for manufacturing customers and assisting them in integrating lasers into their production processes;
• system engineering, which means advising customers on machine design, including tooling, automation, and controls for customers in need of “turn-key” solutions; and
• extensive after-sales support of its laser products, including technical support, field service, maintenance and training programs, and rapid spare parts delivery.
The following table sets forth the Company’s net sales of laser products used for macro applications, laser products used for marking and micro applications, and components in fiscal 2013, 2012, and 2011:
September 30,Product Category* 2013 2012 2011 (in thousands)Laser macro products $ 214,623 $ 205,394 $ 237,449Laser marking and micro products 272,632 272,195 302,330Components 72,813 62,532 57,984 $ 560,068 $ 540,121 $ 597,763_____________
* For each laser product category, net sales include sales of service (including training, maintenance and repair) and spare parts. The laser sources sold by the Company consist of a laser head (containing the lasing medium, resonator, source of excitation, resonator optics, and cooling mechanism), power supply, and microcontroller (for control and monitoring). The Company's products are offered in different configurations and utilize different design principles according to the desired application. A large variety of laser systems provided by our Company are equipped with the uniform operating concept “ROFIN Control Unit” (RCU). RCU is a real-time laser and handling control device, which allows control of any laser mode. The user interface allows full access from a terminal (for instance a touch screen) that is located directly on the machines, or via a preceding PC with an Ethernet connection. The standardized ROFIN Control Network allows the extended diagnosis of all laser components

9
via the Intranet, the Internet, or WLAN. With the open PLC programming system customers can individually adapt the process sequence.
For a more detailed discussion of the components of a laser source, see “Laser Technology”.
The following table sets forth the Company’s product categories by principal markets and principal applications:
PRODUCT CATEGORY PRINCIPAL MARKETS PRINCIPAL APPLICATIONSLaser macro products Machine tool Cutting and welding of metals Automotive Cutting and welding of metalsLaser marking products Semiconductor and electronics Marking of integrated circuits, wafers,
solar cells, electronic components, andsmart cards
Automotive Marking of labels and car componentsLaser micro products Medical devices, semiconductor and
electronics, photovoltaics, dental andjewelry
Fine welding, fine cutting, micro structuring/ablation, scribing, and drilling
Automotive, consumer electronics, consumer goods
Scribing, plastic welding, andsoldering
Packaging and paper industry Perforating and scribing of paperand foils
Components Laser industry, printing, defense industry, medical
LASER MACRO PRODUCTS The Company's business strategy for its macro laser business is to grow its revenues by:
• increasing its market share in its existing CO2 laser market through increased sales of its low and high power, diffusion cooled, wave-guide Slab lasers and fast-axial flow CO2 lasers;
• developing fiber lasers with higher output powers to achieve higher cutting speeds and deeper welding depths in order to broaden its addressable markets;
• further developing the Remote Welding, Tube Welding, Profile Welding, and Scanner Welding System concepts; and
• continuing research and product engineering for its solid-state and fiber laser series to further penetrate the market and to further increase the output power or vary the wavelengths for specific applications.
The Company's high-power laser macro product offering consists of laser products which are produced and marketed under the following brand names: ROFIN, PRC, NELC, Nufern, and DILAS.

10
The Company's family of CO2 laser products for macro applications, and their principal markets and applications, are discussed below.
LASER SERIES
POWER RANGE MODE OF
EXCITATION PRINCIPAL
MARKETS PRINCIPAL
APPLICATIONSDC Slab Series 1.0 kW - 8.0 kW High frequency Machine tool
Automotive Cutting and welding
SC Series 100 W - 600 W High frequency Machine toolElectronicsPackaging
Cutting and structuring of textile, paper and plastics
XL Series 1.0 kW - 1.5 kW Direct current Machine tool Cutting and weldingSTS Series 2.0 kW - 5.0 kW Direct current Machine tool Cutting and weldingFH Series 6.0 kW - 8.0 kW Direct current Machine tool Cutting and weldingSM/FA Series 1.0 kW - 4.0 kW Direct current Machine tool
Packaging Cutting and welding
PLS 2.5 kW - 6.0 kW Direct current Machine tool Cutting and welding
The Company believes that it is the only laser manufacturer of diffusion cooled, Slab-based lasers in the high-power range. In the DC Slab Series laser design, a radio-frequency excited gas discharge occurs between two water-cooled electrodes that have a large surface area that permits maximum heat dissipation. Principal markets for the Slab Series lasers are the machine tool and automotive industries.
The Company's SC Series diffusion cooled, wave-guide CO2 lasers are developed and produced by ROFIN-SINAR UK Ltd. The SC Series are sealed-off lasers, which are also based on the Slab laser principle used for the DC Slab Series. These lasers are used mainly for cutting and structuring applications. Principal markets are the machine tool, electronics, and packaging industries.
The Company's XL, STS, FH, SM, FA, and PLS Series fast-axial flow CO2 lasers are used for both cutting and welding applications and are marketed under the PRC and NELC brands. In the fast-axial flow principle, the gas discharge occurs in a tube in the same direction as the resonator, through which the laser gas mixture flows at a high speed. XL, STS, FH, SM, FA, and PLS Series products are used primarily by the machine tool industry. The SM Series are also frequently used in the packaging industry, for example for dieboard cutting.
The Company's family of solid-state and fiber laser products for macro applications, and their principal markets and applications, are discussed below.
LASER SERIES
POWER RANGE
MODE OFEXCITATION
PRINCIPALMARKETS
PRINCIPALAPPLICATIONS
DQ Series 500 W - 1.0 kW Laser diodes Automotive,Photovoltaics
Surface treatment
FL Series 500 W - 4.0 kW Laser diodes Automotive,Machine tool
Cutting and welding
NukW Series > 1.0 kW Laser diodes Defense industry Advanced applications
The Company's DQ Series of Q switched, solid-state lasers are designed for applications such as removal, cleaning, and insulation of various materials in the automotive and photovoltaic markets. To meet the different demands of these target markets, DQ Series lasers offer alternative set-up options which differ in power, pulse energy, and number of laser sources per unit.
The Company's FL Series of high-brightness single or multi-mode fiber lasers use special fiber optics as the active medium. These fiber lasers are suitable for classic cutting and welding applications as well as for new applications such as remote cutting and remote welding. In contrast to common laser concepts in which the created laser beam switches repeatedly between air and the active medium, this laser beam does not leave the fiber optic before entering the working process optic or the beam switch with subsequent launching into the working process. Due to this “all-in-fiber” technology, the risk of contamination can be eliminated. Beam switches and energy splitters are available options allowing up to four work cells to be operated with only one laser.

11
The Company's NukW Series products are stand-alone fiber laser amplifiers that are produced and marketed under the Nufern brand. Their principal market is the defense industry, where they are used for advanced applications.
The Company's family of high-power diode laser products for welding and surface treatment applications, and their principal market, are discussed below.
LASER SERIES
POWER RANGE MODE OF
EXCITATION PRINCIPAL
MARKETS PRINCIPAL
APPLICATIONSDiode Lasers 1.0 kW - 3.0 kW Direct current Machine tool Welding, cladding,
hardening
The Company's high-power diode lasers are designed to meet the requirements of a wide range of welding and surface treatment applications like cladding and hardening. The Company's high-power diode lasers are produced and marketed under the DILAS brand.
LASER MARKING PRODUCTS The Company entered the laser-marking business in 1989 when it acquired Laser Optronic GmbH from Coherent General, Inc. and designed and introduced the “PowerLine” laser marker. Since then the Company has developed a broad line of market leading laser markers that deliver optimal results in terms of quality and speed on a wide range of materials. Based on its vast experience, ROFIN offers standardized and customized laser marking systems in different power ranges and wavelengths for use in various industrial segments. Strength and experience in research and development, application and software ensure innovative, standardized and tailored solutions which meet most exigent customer demands. The Company's laser marking products incorporate high value-added software - VisualLaserMarker - that provide the customer full control of the laser marking process.
The Company believes that the following factors have contributed to the growth that it has experienced in the laser marking business:
• the Company's ability to tailor its laser marking solutions to the customer's requirements;
• the Company's expertise in solid-state laser beam power in different wavelengths, mode structure and high-frequency switching capability, which provides optimal quality in terms of marking contrast and speed on a wide variety of materials;
• the Company's proprietary software - VisualLaserMarker - which provides an interface between the laser marking products and the customer's computers, and supports a broad range of network communication software; and
• the Company's focus on innovation, which is reflected in cutting-edge products that satisfy standard as well as complex market requirements.
The Company's business strategy for its laser marking business is four-fold:
• to expand its position in worldwide laser marking markets with a particular focus on the semiconductor, electronics, automotive, smart card, and medical device industries;
• to offer a balanced product portfolio covering different technologies (such as CO2, solid-state, or fiber lasers) in different wavelengths (i.e. infrared, green, and UV) and different pulsing capabilities (i.e. ns or ps lasers);
• to pursue application development for existing and new products; and
• to capitalize on its installed base of lasers by cross-selling the Company's products to its existing customers.
The Company's laser marking product offering consists of laser products, which are produced and marketed under the following brand names: ROFIN, NETC (“Nanjing Eastern Technologies Co. Ltd”), and Nufern.

12
The Company's family of laser products for marking applications, and their principal markets, are discussed below.
LASER SERIES
POWER RANGE MODE OF
EXCITATION PRINCIPAL
MARKETS PRINCIPAL
APPLICATIONSPowerLine 2 W - 100 W Laser diodes or CO2 Semiconductor,
Electronics,General marking applications
Integrated circuitmarking, marking ofmetals plastics andorganic materials, dayand night design,smart card
MultiScan 100 W High frequency Packaging Consumer goodsmarking
LabelMarker Series Stand-alone laser based system Automotive Label markingEasyMark Laser workstation General marking
applications,Medicalcomponents, Toolindustry
Metal and plastics marking
EasyJewel Laser workstation Jewelry marking Metal markingCombiLine Series Laser workstation for integration of a wide
range of ROFIN laser markers General marking
applications Metal and plastics
markingNuQ Fiber Series 10 W - 50 W Laser diodes OEM/Integrators Marking,
engravingR Series 10 W - 25 W Laser diodes General marking
applicationsMetal and plastics marking
PowerLine - The Company's standard PowerLine laser marking products consist of a range of lasers with output power from 2 watts to 100 watts with a galvo-head, a personal computer with state-of-the-art processor and ROFIN's proprietary VisualLaserMarker software. The modular design of the PowerLine markers with 19” components enable the customers to order the most suitable configuration for their production processes or systems (e.g. OEM customers may order the laser head and 19” modules, for easy integration into the system specified by the end user). The PowerLine solid-state lasers incorporate diode modules which result in higher output power (and therefore higher marking speeds), high beam quality (and therefore constant and reliable marking quality), and longer service intervals. New-generation, completely air-cooled solutions provide further increases in efficiency in a compact size. PowerLine marking products are also available with fiber lasers with output powers of up to 100 watts (i.e. with PowerLine F 100), ensuring higher energy efficiency and therefore reduced operating costs. The availability of different wavelengths and pulse widths in the product portfolio enables to provide solutions for a wide range of applications. Especially the frequency multiplied lasers (green, UV) as well as short-pulse lasers open new areas for the industrial utilization. The Company's proprietary VisualLaserMarker software provides customers with a user-friendly software environment that allows them to select fonts, import graphics, preview marking and control all laser parameters and job programs. Special options and accessories include a double marking head allowing speeds of up to 1,600 characters per second in certain applications (most notably marking of integrated circuits), as well as beam-switching and -splitting options for marking of products in multiple production lines using a single laser. Their main application - among a wide variety of possible applications - is marking in the semiconductor and electronics industries.
MultiScan VS - This vector scanning marker utilizes a 100 watts sealed-off CO2 laser and features the ability to mark components that are moving at high speeds. The main application is the marking of consumer goods in the packaging industry.
LabelMarker Advanced - This stand alone, laser-based system is ROFIN's state-of-the art solution to address the high demands concerning speed and reliability in the process of label marking. The LabelMarker Advanced system delivers high efficiency and short marking time due to an integrated, powerful laser. As a comprehensive all-in-one solution, the LabelMarker Advanced is a compact laser system with a class 1 safety rating which can be used in any production area without additional safety requirements.
EasyMark - The EasyMark is a class 1 safety rating transportable desktop device. The 110 V to 230 V connection and integrated cooling based on thermo-electrical technology guarantees quick and easy initial operation. Besides a program-controlled z-axis and a rotary axis, the EasyMark offers various modules which can optionally be integrated. An aluminum T-slot plate facilitates mounting of customer-specific work piece carriers, thereby allowing the processing of work pieces of different sizes and shapes.

13
EasyJewel - The EasyJewel is a transportable desktop device with a class 1 safety rating specially developed to mark jewelry. The laser system offers the benefits of non-contact, abrasion-resistant, permanent marking onto almost any type of precious material with high speed and precision. Special machine features include quick and exact loading of regular and special shapes, jogging function to reach the optimum marking position, and various software capabilities.
CombiLine Basic/CombiLine Advanced - These compact laser workstations have been designed for small and medium-size batches. They integrate a wide range of ROFIN laser markers depending on the customer's specific application. Supply units are incorporated in the housing to provide efficient use of the customer's floor space. Different versions (either with rotary or work table with various axes) enable exact adaptation to the required tasks.
NuQ - These pulsed fiber laser sources are produced and marketed under the Nufern brand and are designed for OEM customers and integrators. Their compact industry standard footprint allows easy integration into marking systems in a variety of industries.
R Series - These solid-state lasers are produced and marketed under the NETC brand. The modular design of these lasers with 19” components guarantees an easy integration into different systems. The new developments in completely air-cooled solutions offer efficiency advantages as well as a compact size and are also available in an OEM version.
LASER MICRO PRODUCTS After the acquisition of Baasel Lasertech in 2000, the Company formed a separate sales and marketing group focused on micro applications. This group markets and sells a broad range of laser products, including pulsed, fiber and other solid-state lasers for various spot and seam welding and fine cutting applications, CO2 Slab lasers for perforating applications, Q switched, solid-state and ultrashort pulse lasers for surface structuring/ablation, cutting, and drilling, and diode lasers for soldering and plastic welding applications.
The Company's business strategy for its micro applications business is to:
• continue to develop customers in the consumer electronics industry for fine welding and cutting applications, as well as for plastic welding and soldering;
• focus on manufacturers of medical instruments and implants within the medical device industry using mainly cutting and welding applications;
• increase its sales of perforating systems to the packaging industry for applications like easy-tear and special perforated foils for food packaging that allow the transfer of air and keep moisture in packaged goods;
• further broadening its existing portfolio through expanding the output power range and offering different wavelengths (i.e. UV, infrared, green) and different laser technologies (i.e. fiber lasers, ultrashort pulse lasers);
• increase its sales in the photovoltaic market with different applications (e.g. through special laser solutions that realize an efficiency increase of solar cells);
• develop/broaden new markets for ultrashort pulse laser applications; and
• develop/broaden applications such as turbine drilling for the aerospace or power generation industries.
The Company's laser micro product offering consists of laser products which are produced and marketed under the ROFIN, DILAS, Corelase, Lee Laser, and ROFIN-LASAG brand names.

14
The Company's family of laser products for micro applications, and their principal markets, are discussed below.
LASER SERIES
POWER RANGE
MODE OFEXCITATION
PRINCIPALMARKETS
PRINCIPALAPPLICATIONS
Manual Welders
60 W - 200 W
Flash lamp
Jewelry,Mold making, Medical device
Spot and seamwelding
StarPulse 40 W - 500 W Flash lamp Medical device, Electronics
Spot and seamwelding
StarFiber 100 W – 600 W Diode
Electronics,Medical device
Fine cutting,fine welding
X-Lase
1 W – 24 W
Diode Semiconductor,Electronics
Scribing
StarFemto FX 1 W – 15 W Diode Medical device,Watch industry,Automotive
Cutting,structuring,drilling
PerfoLas Systems 1,000 – 2,000 W Direct current Paper
Perforating
StarShape Systems 100 – 600 W Direct current Packaging Cutting, drilling,structuring
UW and MPS LaserSystems
n.a. n.a. Electronics,Medical device,Automotive,Semiconductor,Energy,Job shops
Cutting,welding,structuring
Series 800/SeriesLLP
4 W – 1,000 W Flash lamp OEM
Micro/Marking
Series LDP 10 W – 800 W Diode OEM
Micro/Marking
Series LEP 2 W – 20 W Diode OEM
Micro/Marking
Series LDPP 8 W – 200 W Diode OEM Fine cutting
Series LFP 7 W - 15 W Diode OEM Micro
COMPACT/MINIDiode Laser System Series
25 W – 1,000 W Diode Automotive,Electronics,Medical device,Consumer goods
Plastic welding,soldering, micro hardening
Diode Lasers 10 - 500 W Direct current Automotive,Medical device
Plastic welding,soldering
KLS 246 Series 20 W – 120 W Flash lamp Automotive,Medical device,Consumer goods
Fine cutting, precision drilling,scribing
FLS Series 120 W – 800 W Flash lamp Aerospace,Powergeneration,Tooling
Drilling,cutting,welding
LFS Series 150 W – 200 W Diode Medical device,Electronics,Watch industry
Precision cutting andwelding
SLS CL Series 5 W – 250 W Flash lamp Medical device,Electronics,Automotive
Spot and seamwelding

15
Manual Welders - The Company's manual welders for micro applications, which are sold under the names Performance, Tool Open, and Integral, consist of pulsed, solid-state lasers in the range of 60 to 200 watts, which are primarily used for fine welding applications in the medical device, jewelry, and mold making industries.
StarPulse Series - The StarPulse Series consists of pulsed Nd:YAG rod lasers with power ratings from 40 to 500 watts. StarPulse lasers provide high peak powers and high pulse-to-pulse stability and are designed for use in fine welding applications such as laser welding of highly reflective materials in the medical device and electronics industries.
StarFiber Series - The robust and compact fiber laser systems of the StarFiber Series achieve nominal powers of 100 to 600 watts. The lasers can be operated in either pulse-modulated or continuous-wave mode. The StarFiber Series is designed for a broad range of applications including fine welding, such as welding of electromechanic components, and fine cutting, such as in the production of medical devices.
X-Lase - The X-Lase Series comprise of picosecond pulse mode-locked fiber laser systems with a maximal output power of 24 watts. Main markets are in the semiconductor, electronics, and display industries. In these industries the X-Lase products can be used for thin film patterning, ablation, and scribing applications. The X-Lase Series are manufactured and marketed under the Corelase brand.
StarFemto FX - The StarFemto FX Series is comprised of femtosecond pulse mode-locked laser systems with a maximal output power of 15 watts. The main markets are medical implants, automotive, and watch manufacturing, where they are mainly used for fine cutting, drilling, or structuring applications.
PerfoLas Systems - The PerfoLas systems consist of a high-power CO2 laser and a specially designed beam delivery and paper handling system that includes a laser beam splitter (PerfoLas Multiplexer) which allows customers to drill more than 500,000 holes per second into paper or foils. The primary application for these lasers is perforation of paper and foils.
StarShape Systems - Each StarShape system consists of a CO2 laser in combination with a galvo scanning head and is used for precise cutting, drilling, and surface structuring. The main market is the packaging industry.
The Universal Workstation (“UW”) and Modular Processing System (“MPS”) Series are modular, standard laser-based systems that have been designed to meet a variety of applications including welding, cutting, surface modification, and ablation. Depending on the application, the UW and MPS Systems can be equipped with different laser sources (CO2, femtosecond, fiber, diode, or solid-state laser) and modified for specific handling requirements.
The Series 800 and LLP are flash-lamp pumped, solid-state lasers, which are produced and marketed under the Lee Laser brand and sold to OEM customers and system integrators for various micro and marking applications.
The Series LDP and LEP are diode pumped, solid-state lasers that are produced and marketed under the Lee Laser brand and sold to OEM customers and system integrators for various micro and marking applications.
The Series LDPP are diode pulse-pumped Nd:YAG lasers that are produced and marketed under the Lee Laser brand and are designed specifically to precision cut thin metals. The main market is the medical device industry.
The Series LFP are hybrid diode pumped, solid state, picosecond lasers that are produced and marketed under the Lee Laser brand and are sold to OEM customers and system integrators for various micro applications.
The COMPACT and MINI Diode Laser System Series are laser systems that are manufactured and marketed under the DILAS brand. These systems are available in a wide range of output powers and wavelengths, including fiber-coupled direct beam or line source solutions, and are engineered for utilization in industrial laser materials processing, mainly for plastic welding, soldering, and brazing applications in the automotive, medical device, and electronic industries.
Diode Lasers - The Company's 10 - 500 W diode lasers, whose principal uses are in the automotive and medical device sectors for tasks such as plastic welding or soldering, are manufactured and marketed under the DILAS brand.
KLS 246 Series - The KLS Series lasers are pulsed solid-state lasers that provide excellent beam quality and high peak power, which are ideal for fine cutting, drilling, and scribing applications.
The FLS Series are lamp pumped, pulsed, solid-state lasers with high peak power for deep penetration cutting, welding, and drilling for high throughput. Targeted industries are mainly the aerospace, power generation, and tooling industries.

16
LFS Series - The pulsed fiber lasers of the LFS Series provide high pulse peak power and high beam quality, and are ideally suited for processing a wide range of materials in the medical device, electronics, and watch industries.
SLS CL Series - The lasers of this series are pulsed Nd:YAG solid-state lasers with output powers in the range of 5 to 250 watts and pulse durations of up to 200 ms with outstanding process features for welding challenging metals and dissimilar materials. The SLS Series lasers are state-of-the-art production tools in the medical device industry, but are also used in many other applications in the aerospace, power generation, electronics, and automotive industries.
The KLS 246, FLS, LFS and SLS CL Series are all manufactured by the Company's Switzerland-based subsidiary LASAG. A broad variety of accessories such as specific beam delivery components, scanners, as well as different processing heads for cutting, welding, or drilling applications are offered in combination with these micro products.
COMPONENTS Power Supplies - The Company offers power supplies for pulsed and continuous wave, solid-state lasers, CO2 lasers, diode lasers, as well as RF generators for acousto-optic Q-switches through its wholly-owned subsidiary PMB Elektronik GmbH.
Fiber and Optics Technology and Wafer Processing - Fiber coupling products and optical engines for primary use in fiber lasers are manufactured and marketed by the Company's Finland-based subsidiary Corelase Oy. In addition, the Company's wafer processing takes place in the Finland-based facility.
Laser Diodes and Modules - High-power semiconductor components such as high power, high-brightness laser diodes and modules are manufactured and marketed by the Company's subsidiaries DILAS Diodenlaser GmbH, DILAS Diode Laser Inc., DILAS Diodelaser China, and m2k-laser GmbH.
Fibers and Fiber Optic Beam Deliveries - Fibers, fiber components, beam splitters or switches, and beam combiners designed for use in industrial lasers or as beam delivery systems are manufactured and marketed by Optoskand AB.
Active and Passive Fibers and Amplifiers - Fibers and fiber laser technology components are developed, manufactured, and marketed by Nufern.
The Company's high-technology components are either integrated by other laser manufacturers into their products or are used for the Company's own product portfolio.
APPLICATIONS DEVELOPMENT In addition to manufacturing and selling laser sources for macro applications and marking and micro applications, ROFIN operates thirteen application centers in eight countries, where it develops laser-based solutions for customers seeking alternatives to conventional manufacturing techniques. Revenues derived from application development are not a significant component of total revenues. Applications development is generally a support service to the sales and marketing function and is performed to customize the laser to the particular needs of the customer. The Company currently has approximately 50 employees in applications development.

17
MARKETS AND CUSTOMERS ROFIN sells its laser products and laser-based system solutions to a wide range of industries. Our principal markets are the machine tool, semiconductor, electronics, photovoltaic, and automotive industries. The following table sets forth the allocation of the Company’s total laser-related sales (excluding service, spare parts, and components) among our principal markets:
Fiscal Years Principal Market 2013 2012 2011 Primary ApplicationsMachine Tool 37% 35% 38% Cutting and weldingSemiconductor, Electronics, and Photovoltaic 27% 27% 28% Marking of integrated
circuits, electroniccomponents, smartcards, and structuringof solar cells
Automotive & Sub-Supplier 8% 7% 7%Cutting, welding, andcomponent marking
72% 69% 73%
The remaining 28%, 31%, and 27%, of total laser sales in fiscal 2013, 2012, and 2011, respectively, were attributable to customers in a wide variety of other industries including aerospace, consumer goods, medical device manufacturing, flexible packaging, job shops, jewelry, universities, and institutes. No one customer accounted for over 10% of total sales in any of these periods.
SALES, MARKETING AND DISTRIBUTION ROFIN sells its products in approximately 70 countries to OEMs, systems integrators and industrial end users who have in-house engineering resources capable of integrating ROFIN’s products into their own production systems. Lasers for cutting applications are marketed and sold principally to OEMs in the machine tool industry, which sell laser cutting machines incorporating ROFIN’s products without any substantial involvement by ROFIN. Lasers for welding applications are marketed and sold both to systems integrators and to end users. Laser marking products are marketed and sold directly to end users and to OEMs for integration into their handling systems (mainly for integrated circuit, solar cell, and smart card marking applications). Laser micro products are marketed and sold directly to end users and to OEM customers (mainly for solar cell and jewelry applications). In the case of both welding lasers and laser marking products, the end user is significantly involved in the selection of the laser component. In these cases, ROFIN’s application engineers work directly with the end user to optimize the application’s performance and demonstrate the advantages of the Company’s products. ROFIN has approximately 146 direct sales engineers operating in 24 countries, approximately 47 of whom are dedicated to marketing lasers for macro applications and approximately 99 of whom are dedicated to marketing lasers for marking and micro applications. ROFIN sales engineers work either in a well-defined geographic territory or are dedicated to specific industries or applications. In addition, ROFIN has 44 independent representatives marketing the Company’s laser products in Australia, Austria, Argentina, Brazil, Chile, China, Czech Republic, Denmark, Estonia, Finland, France, Germany, Hungary, India, Israel, Italy, Korea, New Zealand, Northern Africa, Norway, the Middle East, the Philippines, Poland, Romania, Russia, Singapore, South Africa, Slovenia, Sweden, Switzerland, Thailand, Turkey, Ukraine, United Kingdom, and the United States. These independent representatives provide ROFIN with sales leads and opportunities, but do not distribute ROFIN’s products. All sales and delivery of products are conducted by the Company. Of the independent representative agreements, 18 are on an exclusive basis, with the other 26 on a non-exclusive basis. These agreements provide for a standard percentage of the net sales price to be paid as commissions to the representatives. The duration of the agreements is usually one year (with an automatic one-year extension) and a six-month cancellation clause.
ROFIN directs its worldwide sales and marketing of lasers for macro applications from its offices in Hamburg and Mainz (both Germany), Kingston upon Hull (UK), and East Granby, Connecticut (USA), and of laser diode components, from Mainz and Freiburg (both Germany). Worldwide sales and marketing of laser marking products is directed from ROFIN’s offices in Gunding-Munich (Germany) and, for laser micro products and power supplies, from Starnberg (Germany). Optical engines for fiber lasers for the worldwide market are sold and marketed from Tampere (Finland) and East Granby, Connecticut (USA), and fiber optics and beam delivery systems are sold and marketed from Gothenburg (Sweden). In Europe, ROFIN also maintains sales and service offices in Belgium, France, Italy, the Netherlands, Spain, Switzerland, and the United Kingdom.

18
North American sales of ROFIN’s macro and micro laser products are managed out of the Company’s Plymouth, Michigan (USA), facility. North American sales of its marking products are managed out of its Devens, Massachusetts (USA), facility. The Company also maintains sales offices in Chandler, Arizona; Buffalo Grove, Illinois; and Santa Clara, California (all USA), to support the expansion of ROFIN’s laser business in the North American market and a sales and service office in Mississauga (Canada) to support the Canadian market. North American sales of diode laser components are directed from Tucson, Arizona (USA). PRC Laser directs its worldwide sales and marketing of lasers for macro applications from its office in Landing, New Jersey (USA), Lee Laser directs its worldwide sales and marketing of lasers for micro applications from its office in Orlando, Florida (USA), and ROFIN-LASAG directs its worldwide sales and marketing of lasers for micro applications from its office in Thun, Switzerland. NETC and NELC direct their sales and marketing of lasers for marking and for macro applications, respectively, from their offices in Nanjing (China). All five companies sell their products independently under their own brands. The Company maintains sales and service offices in China, India, Japan, Singapore, South Korea, and Taiwan. Over the next five years, the Company expects demand for industrial lasers to increase in the Asia/Pacific region. The Company believes that the geographic markets with the greatest long-term business potential in the future are China and India, principally due to the expansion of domestic machine tool, automobile, semiconductor, electronics, and photovoltaic production in these countries.
CUSTOMER SERVICE, REPLACEMENT PARTS, AND COMPONENTS During fiscal 2013, 2012, and 2011, approximately 39%, 39%, and 36%, respectively, of the Company’s revenues were generated from sales of after-sales services, replacement parts, and components for laser products. The Company believes that a high level of customer support is necessary to successfully develop and maintain long-term relationships with its OEM- and end-user customers. The Company seeks to maintain this close relationship as our customers’ needs change and evolve. Recognizing the importance of its existing and growing installed multinational customer base, the Company has expanded its local service and support platform into new geographic regions. ROFIN has 440 customer service personnel. The Company’s field service and in-house technical support personnel receive ongoing training with respect to the Company’s laser products, maintenance procedures, laser-operating techniques, and processing technology. Most of the Company’s OEM customers also provide customer service and support to end users. Many of ROFIN’s laser products are operated 24 hours a day in high speed, quality-oriented manufacturing operations. Accordingly, the Company provides 24 hour, year-round service support to its customers in the United States, Germany, and the majority of other countries in which it operates. The Company plans to continue adopting similar service support elsewhere. In addition, eight-hour response time is provided to certain key customers. This support includes field service personnel who reside in close proximity to the Company’s installed base. The Company provides customers with process diagnostic and verification techniques, as well as specialized training in the operation and maintenance of its systems. The Company also offers regularly scheduled and intensive training programs and customized maintenance contracts for its customers.
Of ROFIN’s 440 customer service personnel, approximately 296 employees operate in the field in about 50 countries. Field service personnel are also involved in the installation of the Company’s systems. ROFIN’s approach to the sale of replacement parts is closely linked to the Company’s strategic focus on rapid customer response. The Company provides around-the-clock order entry and provides same or next day delivery of parts worldwide in order to minimize disruption to customers’ manufacturing operations. ROFIN typically provides a minimum one-year warranty for its products with warranty extensions negotiated on a case-by-case basis. It agrees to after-sales service and parts supply up to a period of 10 years, if requested by a customer. The Company’s growing base of installed laser sources and laser-based systems is expected to continue to generate a stable source of revenues from sales of replacement parts and after-sales service. In addition, the Company offers components such as OEM-laser modules, optical engines, laser diodes, active and passive fibers, fiber optic delivery systems, and power supplies. These high-technology components are either integrated by other laser manufacturers into their products or are used for the Company's own product portfolio.

19
COMPETITION
The Company believes that as manufacturing industries continue to modernize, seek to reduce production costs and require more precise and flexible production, the features of laser-based systems will become more desirable than systems incorporating conventional material processing techniques and processes. The increased acceptance of these laser applications by industrial users will be enhanced by laser product line expansion to include lower and higher power CO2 lasers, variations in wavelength, advancements in fiber-optic beam delivery systems, improvements in reliability, and the introduction of lower and higher power diode lasers, diode pumped, solid-state lasers, and fiber lasers, capable of performing heavy industrial material processing and marking and micro applications. Laser Macro Products The market for laser macro products and systems is fragmented and addressed by a large number of competitors. Many of them are small or privately owned or compete with ROFIN on a limited geographic, industry- or application-specific basis. The Company also competes in certain target markets with competitors that are part of large industrial groups and have access to substantially greater financial and other resources than ROFIN. The overall competitive position of the Company will depend upon a number of factors, including product performance and reliability, price, customer support, manufacturing quality, the compatibility of its products with existing laser systems, and the continued development of products utilizing diode laser, diode pumped, solid-state laser and fiber laser technologies. Competition among laser manufacturers is also based on attracting and retaining qualified engineering and technical personnel.
ROFIN believes it is among the top three suppliers of laser sources in the worldwide market for macro applications. Companies such as Trumpf and Fanuc (for high-power CO2 lasers), Synrad and Coherent (for low-power CO2 lasers), Trumpf and IPG Photonics (for solid-state or fiber lasers), and Laserline and Jenoptik (for diode lasers and laser diodes) all compete in a subset of markets in which ROFIN operates. However, in the Company's opinion, none of these companies compete in all of the industries, applications, and geographic markets currently served by ROFIN.
Laser Marking and Micro Products The Company's laser marking products compete with conventional ink-based and acid-etching technologies, as well as with laser mask-marking. The Company's micro products compete with conventional welding, etching, and spark erosion technologies. The Company believes that its principal competitors in the laser marking and micro markets include Trumpf, GSI Group, Unitek Miyachi, Han's Laser, and IPG Photonics. ROFIN also competes with manufacturers of conventional non-laser products in applications such as welding, drilling, soldering, cutting, and marking.
Significant competitive factors in the market for laser marking and micro products include system performance and flexibility, cost, the size of each manufacturer's installed base, capability for customer support, and breadth of product line. Because many of the required components to develop and produce a laser product for marking applications are commercially available, barriers to entry into this market are low and the Company expects new competitive products to enter this market. The Company believes that its product range for marking and micro applications will compete favorably in this market primarily due to performance and price characteristics of such products.
MANUFACTURING AND ASSEMBLY ROFIN manufactures and tests its high-power CO2, solid-state, and fiber laser macro products at its Hamburg (Germany), Plymouth, Michigan; Landing, New Jersey; East Granby, Connecticut (all USA), and Nanjing (China) facilities. The Company’s laser marking products are manufactured and tested at its facilities in Gunding-Munich (Germany), Starnberg (Germany), Oxford (UK), Singapore, Devens, Massachusetts (USA) and Nanjing (China). ROFIN’s micro application products are manufactured and tested in Starnberg (Germany), Tampere (Finland), Thun (Switzerland) and Orlando, Florida (USA). The Company’s diode laser products are manufactured and tested at its Mainz (Germany), Freiburg (Germany), Nanjing (China), and Tucson, Arizona (USA), facilities. The Company’s low-power CO2 laser products are manufactured and tested in Kingston upon Hull (UK). Coating of ROFIN’s Slab laser electrodes is performed at the Overath (Germany) facility. The Company’s fiber optics and beam delivery systems are manufactured and tested in Gothenburg (Sweden), and power supplies are manufactured and tested in Starnberg (Germany). The Company’s active and passive fibers and amplifiers are manufactured and tested in East Granby, Connecticut (USA). Optical engines for fiber lasers, fiber lasers modules, and wafer material are designed and manufactured in Tampere (Finland).

20
Given the competitive nature of the laser business, the Company focuses substantial efforts on maintaining and enhancing the efficiency and quality of its manufacturing operations. The Company utilizes just-in-time and cell-based manufacturing techniques to reduce manufacturing cycle times and inventory levels, thus enabling it to offer on-time delivery and high-quality products to its customers. ROFIN’s in-house manufacturing includes only those manufacturing operations that are critical to achieve quality standards or protect intellectual property. These manufacturing activities consist primarily of product development, testing of components and subassemblies (some of which are supplied from within the Company and others of which are supplied by third party vendors and then integrated into the Company’s finished products), assembly and final testing of the completed product, as well as proprietary software design and hardware/software integration. Although the Company minimizes the number of suppliers and component types, wherever practicable, it has at least two sources of supply for key items. ROFIN has a qualifying program for its vendors and generally seeks to build long-term relationships with such vendors. The Company purchases certain major components from single suppliers. The Company estimates that 12% of its revenues are from the sale of products that require specialized components currently only available from single sources. ROFIN has written agreements with such suppliers and has not had material delays in supplies from these sources. The Company believes that it could, if necessary, purchase such components from alternative sources, within four to six months, following appropriate qualification of such new vendors. ROFIN is committed to meeting internationally recognized manufacturing standards. Its Hamburg, Gunding-Munich, Starnberg, Mainz, Overath (all Germany), Thun (Switzerland), Gothenburg (Sweden), Monza (Italy), Paris (France), Daventry (UK), Kingston upon Hull (UK), Singapore, Pamplona (Spain), East Granby, Connecticut (USA), and Tucson, Arizona (USA), facilities are ISO 9001 certified.
RESEARCH AND DEVELOPMENT During fiscal 2013, 2012, and 2011, ROFIN’s net spending on research and development was $43.0 million, $42.6 million, and $38.3 million, respectively. The Company’s net spending on research and development reflects receipt of funding mainly under German and other European governments and European Union grants totaling $2.4 million, $1.6 million, and $2.3 million in fiscal 2013, 2012, and 2011, respectively. ROFIN has approximately 320 employees engaged in product research and development. ROFIN’s research and development activities are directed at meeting customers’ manufacturing needs and application processes. Core competencies include CO2 gas lasers, solid-state lasers, fiber lasers, diode lasers, precision optics, electronic power supplies, fibers, fiber optics, beam delivery, control interfaces, software programming, and systems integration. The Company strives for customer-driven development activities and promotes the use of alliances with key customers and joint development programs in a wide range of its target markets.
The Company’s research and development activities are carried out in fifteen centers in Hamburg, Gunding-Munich, Starnberg, Freiburg, and Mainz (all Germany), Kingston upon Hull (UK), Gothenburg (Sweden), Tampere (Finland), Thun (Switzerland), Plymouth, Michigan, Landing, New Jersey, Orlando, Florida, Tucson, Arizona, East Granby, Connecticut (all USA), and Nanjing (China), and are centrally coordinated and managed. ROFIN maintains close working relationships with the leading industrial, government and university research laboratories in Germany, including the Fraunhofer Institute for Laser Technology in Aachen, the Institute for “Technische Physik” of the German Space and Aerospace Research Center in Stuttgart, the Fraunhofer Institute for Applied Solid State Physics in Freiburg, the Fraunhofer Institute for Material Science in Dresden, the Laser Center in Hanover (all Germany), and elsewhere around the world, including the University of Edinburgh in the United Kingdom, Tampere University of Technology in Finland, and University of Bern in Switzerland. These relationships include funding of research, joint development programs, personnel exchange programs, and licensing of patents developed at these institutes.
INTELLECTUAL PROPERTY ROFIN owns intellectual property, which includes patents, proprietary software, technical know-how and expertise, designs, process techniques, and inventions. While policies and procedures are in place to protect critical intellectual property rights, ROFIN believes that its success depends to a larger extent on the innovative skills, know-how, technical competence, and abilities of ROFIN’s personnel.

21
ROFIN protects its intellectual property in a number of ways including, in certain circumstances, through patents. ROFIN has sought patent protection primarily in the United States, Europe, and Japan. ROFIN currently holds 233 patents for inventions relating to lasers, processes and power supplies with expiration dates ranging from 2013 to 2032. In addition, 130 patent applications have been filed and are under review by the relevant patent authorities. The Company holds 74 exclusive and non-exclusive licenses of patents and pending patent applications with relevance to its products and laser technology. ROFIN requires its employees and certain of its customers, suppliers, representatives, agents, and consultants to enter into confidentiality agreements to further safeguard ROFIN’s intellectual property. ROFIN, from time to time, receives notices from third parties alleging infringement of such parties’ patent or other intellectual property rights by ROFIN’s products. While these notices are common in the laser industry and ROFIN has in the past been able to develop non-infringing technology or license necessary patents or technology on commercially reasonable terms, ROFIN cannot assure that it would in the future prevail in any litigation seeking damages or expenses from ROFIN or to enjoin ROFIN from selling its products on the basis of such alleged infringement. Nor can ROFIN assure that it would be able to develop any non-infringing technology or to license any valid and infringed patents on commercially reasonable terms. In the event any third party made a valid claim against ROFIN or its customers and a license were not made available to ROFIN on commercially reasonable terms, ROFIN would be adversely affected. From time to time, ROFIN files notices of opposition to certain patents on laser technologies held by others, including academic institutions and competitors of ROFIN, which the Company believes could inhibit its ability to develop laser products for industrial material processing applications.
ORDER BACKLOG The Company’s order backlog was $118.0 million, $147.0 million, and $153.2 million, as of September 30, 2013, 2012, and 2011, respectively. The Company’s order backlog, which contains relatively little service, training and spare parts, represents approximately three months of laser shipments. The order backlog as of September 30, 2013, consists of an 11% lower order backlog for macro applications, a 25% lower order backlog for micro and marking applications, and a 27% lower order backlog for components compared to the order backlog as of September 30, 2012. The fluctuation of the U.S. dollar in fiscal year 2013 had a favorable effect of approximately $0.7 million on year-to-year order backlog. The decrease in the Company's order backlog from September 30, 2011 to September 30, 2012, was attributable to 21% lower orders for macro applications, 10% lower orders for micro and marking applications, partially offset by 9% higher orders for components. The fluctuation of the U.S. dollar in fiscal year 2012 had an unfavorable effect of approximately $5.4 million on year-to-year order backlog. An order is entered into backlog by ROFIN when a purchase order with an assigned delivery date has been received. Delivery schedules range from one week to six months, depending on the size, complexity and availability of the product or system ordered, although typical delivery dates for laser source products range between one to twelve weeks from the date an order is placed. Although there is a risk that customers may cancel or delay delivery of their orders, orders for standard non-customized lasers can typically be allocated to other customers without significant additional costs. The Company also manages this risk by establishing the right to charge a cancellation fee that covers any material and developmental costs incurred prior to the order being canceled. Enforcement of this right is dependent on many factors including, but not limited to, the customer’s requested length of delay, the number of other outstanding orders with the same customer, and the ability to quickly convert the canceled order to another sale. The Company anticipates shipping the present backlog during fiscal year 2014. However, the Company’s backlog at any given date is not necessarily indicative of actual sales for any future period.

22
EMPLOYEES The following table sets forth the Company's employees by geographic regions as of September 30, 2013 and 2012:
September 30,2013 2012
North America 427 420Germany 1,075 1,070Asia 329 297Other 434 426
2,265 2,213
The average number of employees for the fiscal year ended September 30, 2013, was 2,237.
While the Company’s employees are not covered by collective bargaining agreements and the Company has never experienced a work stoppage, slowdown or strike, the Company’s employees at its Hamburg and Starnberg (both Germany) facilities are each represented by a nine-person works council and in Gunding-Munich (Germany) by a seven-person works council. Additionally, Hamburg and Gunding-Munich are represented by a four-person central works council. Matters relating to compensation, benefits, and work rules are negotiated and resolved between management and the works council for the relevant location. The Company considers its relations with its employees to be good.
GOVERNMENT REGULATION The majority of the Company’s laser products sold in the United States are classified as Class IV Laser Products under applicable rules and regulations of the Center for Devices and Radiological Health (“CDRH”) of the U.S. Food and Drug Administration. The same classification system is applied in the European markets. Safety rules are formulated with “Deutsche Industrie Norm” (i.e., German Industrial Standards) or ISO standards, which are internationally harmonized.
CDRH regulations generally require a self-certification procedure pursuant to which, for each product incorporating a laser device, a manufacturer must file periodic reporting of sales and purchases, and compliance with product labeling standards with CDRH. The Company’s laser products for macro, micro and laser marking applications can result in injury to human tissue if directed at an individual or otherwise misused. The Company believes that its laser products for macro, micro and marking applications, and its components are in substantial compliance with all applicable laws for the manufacture of laser devices.
AVAILABLE INFORMATION The Company makes available, free of charge on its internet website, its Annual Report on Form 10-K, quarterly reports on Form 10-Q, current reports on Form 8-K, and any amendments to those reports filed or furnished pursuant to Section 13(a) or 15(d) of the Exchange Act, as soon as reasonably practicable after they are electronically filed with, or furnished to, the Securities and Exchange Commission (the “SEC”). You can find these reports on the Company’s website at www.rofin.com under the heading “Investor Relations”. The information on the Company’s website is not incorporated by reference in this Annual Report on Form 10-K. These reports may also be obtained at the SEC’s Public Reference Room at 100 F Street NE, Washington, D.C. 20549. Information on the operation of the Public Reference Room is available by calling the SEC at (202) 551-8090. You may also access this information at the SEC’s website (http://www.sec.gov). This site contains reports, proxy and information statements, and other information regarding issuers that file electronically with the SEC.

23
ITEM 1A. RISK FACTORS THE GLOBAL ECONOMY, CAPITAL MARKETS, CREDIT DISRUPTIONS, AND POLITICAL ENVIRONMENT CHANGES CAN ADVERSELY IMPACT OUR RESULTS OF OPERATIONS. Our business, operating results, or financial condition can be impacted by a number of macroeconomic factors, which could in turn affect our stock price. These macroeconomic factors include, but are not limited to, consumer confidence and spending levels, unemployment, consumer credit availability, global factory production, and credit market conditions. Additionally, changes in the political environment in the markets in which we operate can adversely impact our business, such as foreign exchange import and export controls, tariffs and other trade barriers, and price or exchange controls.
DOWNTURNS IN THE INDUSTRIES WE SERVE, PARTICULARLY IN THE MACHINE TOOL, AUTOMOTIVE, SEMICONDUCTOR, ELECTRONICS, AND PHOTOVOLTAIC INDUSTRIES, MAY HAVE A MATERIAL ADVERSE EFFECT ON OUR SALES AND PROFITABILITY. Our business depends substantially upon capital expenditures particularly by manufacturers in the machine tool, automotive, semiconductor, electronics, and photovoltaic industries. Approximately 72% of our laser sales during fiscal year 2013 were to these industry markets. These industries are cyclical and have historically experienced periods of oversupply, resulting in significantly reduced demand for capital equipment, including the products manufactured and marketed by us. For the foreseeable future, our operations will continue to depend upon capital expenditures in these industries, which, in turn, depend upon the market demand for their products. Decreased demand from manufacturers in these industries, for example, during an economic downturn, may lead to decreased demand for our products. Although such decreased demand would reduce our sales, we may not be able to reduce expenses quickly, due in part to the need for continual investment in research and development and the need to maintain our extensive ongoing customer service and support capability. Although we order materials for assembly in response to firm orders, the lead time for assembly and delivery of some of our products creates a risk that we may incur expenditures or purchase inventories for products which we cannot sell.
Accordingly, any economic downturn or slowdown in the machine tool, automotive, semiconductor, electronics, or photovoltaic industries could have a material adverse effect on our financial condition and results of operations.
A HIGH PERCENTAGE OF OUR SALES ARE OVERSEAS AND OUR RESULTS ARE THEREFORE SUBJECT TO THE IMPACT OF EXCHANGE RATE FLUCTUATIONS. Although we report our results in U.S. dollars, approximately 67% of our current sales are denominated in other currencies, including the Euro, Swedish krona, Swiss francs, British pound, Singapore dollar, Japanese yen, Korean won, Taiwanese dollar, Canadian dollar, Indian rupee, and Chinese RMB. The fluctuation of the Euro, and the other functional currencies, against the U.S. dollar has had the effect of increasing and decreasing (as applicable) reported net sales as well as cost of goods sold, gross margin, and selling, general and administrative expenses denominated in such foreign currencies when translated into U.S. dollars as compared to prior periods. Our subsidiaries will, from time to time, pay dividends in their respective functional currencies, thus presenting another area of potential currency exposure for us in the future. We also face transaction risk from fluctuations in exchange rates between the various currencies in which we do business. We believe that a certain portion of the transaction risk of our operations in multiple currencies is mitigated by our hedging activities, utilizing forward exchange contracts and forward exchange options. We also continue to borrow in many of our operating subsidiaries' functional currencies to reduce exposure to exchange gains and losses. However, there can be no assurance that changes in currency exchange rates will not have a material adverse effect on our business, financial condition, and results of operations.

24
OUR INABILITY TO MANAGE THE RISKS ASSOCIATED WITH OUR INTERNATIONAL OPERATIONS COULD ADVERSELY AFFECT OUR BUSINESS. Our products are currently marketed in approximately 70 countries, with Germany, the rest of Europe, the United States, and the Asia/Pacific region being our principal markets. Our operations and sales in our principal markets are subject to risks inherent in international business activities, including:
• the general political and economic conditions in each such country or region;
• overlap of differing tax structures;
• climatic or other natural disasters in regions where we operate;
• increases in shipping costs or increases in fuel costs;
• longer payment cycles;
• acts of terrorism;
• increased vulnerability to the theft of, and reduced protection for intellectual property rights;
• management of an organization spread over various jurisdictions; and
• unexpected changes in regulatory requirements and compliance with a variety of foreign laws and regulations, such as import and export licensing requirements, trade restrictions, currency control and restrictions, delays, penalties or required withholdings on repatriation of earnings.
Any failure to manage the risks associated with our international business operations could have a material adverse effect on our financial condition and results of operations. Our profitability may be adversely affected by economic slowdowns in the United States, Europe, or the Asia/Pacific region. A recession in these economies could trigger a decline in laser sales to the machine tool, automotive, semiconductor, electronics, or photovoltaic industries, and any related weaknesses in their respective currencies could adversely affect customer demand for our products, the U.S. dollar value of our foreign currency denominated sales, and ultimately our consolidated results of operations.
We also are subject to risks that our operations outside the United States could be conducted by our employees, contractors, service providers, representatives, or agents in ways that violate the Foreign Corrupt Practices Act or other similar anti-bribery laws. Any such violations could have a negative impact on our business and could result in government investigations and/or injunctive, monetary, or other penalties. Moreover, we face additional risks that our anti-bribery policy and procedures may be violated by third-party sales representatives or other agents that help sell our products or provide other services, because such representatives or agents are not our employees and it may be more difficult to oversee their conduct.
OUR GLOBAL OPERATIONS ARE SUBJECT TO EXTENSIVE AND COMPLEX IMPORT AND EXPORT RULES THAT VARY AMONG THE LEGAL JURISDICTIONS IN WHICH WE OPERATE. FAILURE TO COMPLY WITH THESE RULES COULD RESULT IN SUBSTANTIAL PENALTIES.
Due to the international scope of our operations, we are subject to a complex system of import- and export-related laws and regulations, including U.S. export control and customs regulations and customs regulations of other countries. These regulations are complex and vary among the legal jurisdictions in which we operate. Any alleged or actual failure to comply with such regulations may subject us to government scrutiny, investigation, and civil and criminal penalties, and may limit our ability to import or export our products or to provide services outside the United States. Depending on its size and scope, any of these penalties could have a material impact on our financial position, results of operations, and cash flows.

25
WE DEPEND ON THE ABILITY OF OUR OEM CUSTOMERS TO INCORPORATE OUR LASER PRODUCTS INTO THEIR SYSTEMS. Our sales depend in part upon the ability of our OEM customers to develop and sell systems that incorporate our laser products. Adverse economic conditions, inadequate liquidity, large inventory positions, limited marketing resources, and other factors affecting these OEM customers could subject us to risks of business failure by such customers and potential credit and inventory risks, and thus could have a substantial impact upon our financial results. We cannot provide assurances that our OEM customers will not experience financial or other difficulties that could adversely affect their operations and, in turn, our financial condition or results of operations.
WE EXPERIENCED IN THE PAST, AND EXPECT TO EXPERIENCE IN THE FUTURE, FLUCTUATIONS IN OUR QUARTERLY RESULTS. THESE FLUCTUATIONS MAY INCREASE THE VOLATILITY OF OUR STOCK PRICE. We have experienced and expect to continue to experience some fluctuations in our quarterly results. We believe that fluctuations in quarterly results may cause the market prices of our common stock, on the NASDAQ Global Select Market and the Frankfurt Stock Exchange, to fluctuate, perhaps substantially. Factors which may have an influence on the Company’s operating results in a particular quarter include:
• general economic uncertainties;
• fluctuations in demand for, and sales of, our products or prolonged downturns in the industries that we serve;
• the timing of the receipt of orders from major customers;
• product mix;
• competitive pricing pressures;
• the relative proportions of domestic and international sales;
• our ability to design, manufacture, and introduce new products on a cost-effective and timely basis;
• the delayed effect of incurrence of expenses to develop and improve marketing and service capabilities;
• foreign currency fluctuations;
• ability of our suppliers to produce and deliver components and parts, including sole or limited source components, in a timely manner, in the quantity desired, and at the prices we have budgeted;
• our ability to control expenses; and
• costs related to acquisitions of businesses. These and other factors make it difficult for us to release precise predictions regarding the results and the development of our business. In addition, current conditions in the domestic and global economies are uncertain. As a result, it is difficult to estimate the level of growth for the economy as a whole or of capital expenditures in the industrial markets we serve. Because all of the components of our budgeting and forecasting are dependent on estimates of spending within these markets, the prevailing economic uncertainty renders estimates of future revenue and expenses even more difficult than usual to make. In addition, our backlog at any given time is not necessarily indicative of actual sales for any succeeding period. As our delivery schedule typically ranges from one week to six months, our sales will often reflect orders shipped in the same quarter that they are received. Moreover, customers may cancel or reschedule shipments and production difficulties could delay shipments. Accordingly, the Company’s results of operations are subject to significant fluctuations from quarter to quarter. See also “Business - Order Backlog”.
Other factors that we believe may cause the market price of our common stock to fluctuate, perhaps substantially, include announcements of new products, technologies, or customers by us or our competitors, developments with respect to intellectual property, and shortfalls in our operations relative to analysts’ expectations. In addition, in recent years, the stock market in general, and the shares of technology companies in particular, have experienced wide price fluctuations. These broad market and industry fluctuations, particularly in the semiconductor, electronics, photovoltaics, machine tool, and automotive industries,

26
may adversely affect the market prices of our common stock on the NASDAQ Global Select Market and the Frankfurt Stock Exchange.
THE MARKETS FOR OUR PRODUCTS ARE HIGHLY COMPETITIVE AND INCREASED COMPETITION COULD INCREASE OUR COSTS, REDUCE OUR SALES, OR CAUSE US TO LOSE MARKET SHARE. The laser industry is characterized by significant price and technical competition. Our current and proposed laser products for macro, marking and micro applications, and components, compete with those of several well-established companies, some of which are larger and have substantially greater financial, managerial and technical resources, more extensive distribution and service networks, and larger installed customer bases than us. We believe that competition will be particularly intense in the CO2, diode, solid-state, and fiber laser markets, as many companies have committed significant research and development resources to pursue opportunities in these markets. There can be no assurance that we will successfully differentiate our current and proposed products from the products of our competitors or that the marketplace will consider our products to be superior to competing products. Because many of the components required to develop and produce a laser-based marking system are commercially available, barriers to entry into this market are relatively low, and we expect new competitive product entries in this market. To maintain our competitive position in these markets, we believe that we will be required to continue a high level of investment in engineering, research and development, marketing, and customer service and support. There can be no assurance that we will have sufficient resources to continue to make these investments, that we will be able to make the technological advances necessary to maintain our competitive position, or that our products will receive market acceptance. See also “Business - Competition”.
OUR FUTURE GROWTH AND COMPETITIVENESS DEPEND UPON OUR ABILITY TO DEVELOP NEW AND ENHANCED PRODUCTS TO MEET MARKET DEMAND AND TO INCREASE OUR MARKET SHARE FOR LASER MACRO AND MARKING AND MICRO PRODUCTS. If we are to increase our laser sales in the near term, these sales will have to come through increases in market share for our existing products, through the development of new products, or through the acquisition of competitors or their products. To date, a substantial portion of our revenues has been derived from sales of high-powered CO2 laser sources, solid-state laser sources, and diode lasers. In order to increase market demand for these products, we will need to devote substantial resources to:
• continuing to broaden our CO2, solid-sate, fiber, and diode laser product range;
• continuing to increase the output power and vary the laser wavelengths of our product portfolio; and
• continuing to reduce the manufacturing costs of our product range to achieve more attractive pricing. A large part of our growth strategy depends upon being able to increase our worldwide market share for laser macro, marking and micro products.
Our future success depends on our ability to anticipate our customers’ needs and develop products that address those needs. Our ability to control costs is limited by our need to invest in research and development. If we are unable to implement our strategy to develop new and enhanced products, our business, operating results, and financial condition could be adversely affected. We cannot provide assurance that we will successfully implement our business strategy or that any of the newly developed or enhanced products will achieve market acceptance or not be rendered obsolete or uncompetitive by products of other companies. See also “Management’s Discussion and Analysis of Financial Condition and Results of Operations” and “Business - The Company’s Laser Products”.
WE DEPEND ON OUR EXECUTIVE MANAGEMENT TEAM AND SKILLED PERSONNEL TO OPERATE OUR BUSINESS EFFECTIVELY IN A RAPIDLY CHANGING MARKET, AND IF WE ARE UNABLE TO RETAIN EXISTING OR HIRE ADDITIONAL PERSONNEL WHEN NEEDED, OUR ABILITY TO DEVELOP AND SELL OUR PRODUCTS COULD BE HARMED. Our future success depends in large part upon the leadership and performance of our executive management team and key employees at the operating level. These key employees include engineering, sales, marketing, manufacturing, and support

27
personnel for our operations on a worldwide basis. Recruiting and retaining highly skilled personnel in certain functions continues to be difficult. At certain locations where we operate, the cost of living is extremely high and it may be difficult to retain key employees and management at a reasonable cost. We may not be successful in attracting, assimilating, or retaining qualified personnel to fulfill our current or future needs. If we fail to attract additional employees or lose the services of one or more of our executive officers or key employees, or if one or more of them decide to join a competitor or otherwise compete directly or indirectly with us, we may not be able to successfully manage our business or achieve our business objectives. If we lose the services of any of our key employees at the operating or regional level, we may not be able to replace them with similarly qualified personnel, which could harm our business.
WE MAY NOT BE ABLE TO SUCCESSFULLY ACQUIRE NEW OPERATIONS OR INTEGRATE FUTURE ACQUISITIONS, WHICH COULD CAUSE OUR BUSINESS TO SUFFER. An important part of our growth strategy is making strategic acquisitions of companies with complementary operations, technologies, or products. We regularly review potential acquisitions and periodically engage in discussions regarding such possible acquisitions. We may be unable to successfully complete potential strategic acquisitions if we cannot reach agreement on acceptable terms or for other reasons. Future acquisitions may require us to obtain additional debt or equity financing, which may not be available on terms acceptable to us, if at all. In connection with future acquisitions, we may assume the liabilities of the companies we acquire. Any debt that we incur to pay for future acquisition could contain covenants that restrict the manner in which we operate our business. Any new equity securities that we issue for this purpose would be dilutive to our existing stockholders. If we buy a company or a division of a company, we may experience difficulty integrating that company or division’s personnel and operations, which could negatively affect our operating results. In addition:
• the key personnel of the acquired company may decide not to work for us;
• we may experience additional financial and accounting challenges and complexities in areas such as tax planning, treasury management, and financial reporting;
• we may be held liable for risks and liabilities (including for environmental-related costs) as a result of our acquisitions, some of which we may not discover during our due diligence;
• our ongoing business may be disrupted or receive insufficient management attention; and
• we may not be able to realize the synergies, cost savings, or other financial benefits we anticipated.
PRODUCTION DIFFICULTIES AND PRODUCT DELIVERY DELAYS OR DISRUPTIONS COULD HAVE A MATERIAL ADVERSE EFFECT ON OUR BUSINESS.
We manufacture and test our products at our facilities in Germany, the United States, the United Kingdom, China, Finland, Sweden, Switzerland, and Singapore. If use of any of our manufacturing facilities were interrupted by a natural disaster or otherwise, our operations would be negatively impacted until we could establish alternative production and service operations. Significant production difficulties could be the result of:
• mistakes made while transferring manufacturing processes between locations;
• changing process technologies;
• ramping production;
• installing new equipment at our manufacturing facilities; and
• shortage of key components. In addition, we may experience product delivery delays in the future. A significant disruption in third-party package delivery and import/export services, or significant increases in prices for those services, could interfere with our ability to ship products, increase our costs, and lower our profitability.

28
We ship a significant portion of our products to our customers through independent package delivery and import/export companies. We also ship our products through national trucking firms, overnight carrier services, and local delivery practices. If one or more of the package delivery or import/export providers experiences a significant disruption in services or institutes a significant price increase, the delivery of our products could be prevented or delayed. Such events could cause us to incur increased shipping costs that could not be passed on to our customers, negatively impacting our profitability and our relationships with certain customers.
IF WE FAIL TO ACCURATELY FORECAST COMPONENT AND MATERIAL REQUIREMENTS FOR OUR PRODUCTS, WE COULD INCUR ADDITIONAL COSTS AND INCUR SIGNIFICANT DELAYS IN SHIPMENTS, WHICH COULD RESULT IN A LOSS OF CUSTOMERS. We use rolling forecasts based on anticipated product orders and material requirements planning systems to determine our product requirements. It is very important that we accurately predict both the demand for our products and the lead times required to obtain the necessary components and materials. We depend on our suppliers for most of our product components and materials. Lead times for components and materials that we order vary significantly and depend on factors including the specific supplier requirements, the size of the order, contract terms, and current market demand for components. For substantial increases in our sales levels of certain products, some of our suppliers may need at least nine-month lead time. If we overestimate our component and material requirements, we may have excess inventory, which would increase our costs. If we underestimate our component and material requirements, we may have inadequate inventory, which could interrupt and delay delivery of our products to our customers. Any of these occurrences would negatively impact our net sales, business, or operating results.
WE DEPEND ON LIMITED SOURCE SUPPLIERS THAT COULD CAUSE SUBSTANTIAL MANUFACTURING DELAYS AND INCREASE OUR COSTS IF A DISRUPTION IN SUPPLY OCCURS. We estimate that 12% of our revenues are derived from sales of products that require specialized components only available from single sources. We also rely on a limited number of independent contractors to manufacture subassemblies for some of our products. There can be no assurance that, in the future, our current or alternative sources will be able to meet all of our demands on a timely basis. If one or more of our suppliers or subcontractors experiences difficulties that result in a reduction or interruption in supply to us, or if they fail to meet any of our manufacturing requirements, our business could be harmed until we are able to secure alternative sources, if any. If we are unable to find necessary parts or components on commercially reasonable terms, we could be required to reengineer our products to accommodate available substitutions which could increase our costs and/or have a material adverse effect on manufacturing schedules, product performance, and market acceptance. The manufacturing of our solid-state lasers require elements of rare earth in small quantities. Shortages of these elements, delays in their delivery and resulting increases of the market price for such materials might have an adverse effect on our production costs.
IF OUR GOODWILL OR INTANGIBLE ASSETS BECOME IMPAIRED, WE MAY BE REQUIRED TO RECORD A SIGNIFICANT CHARGE TO EARNINGS. Under accounting principles generally accepted in the United States, we review our intangible assets for impairment when events or changes in circumstances indicate the carrying value may not be recoverable. Goodwill is required to be tested for impairment at least annually. Factors that may be considered a change in circumstances indicating that the carrying value of our goodwill or other intangible assets may not be recoverable include declines in our stock price and market capitalization or future cash flow projections. A decline in our stock price, or any other adverse change in market conditions, particularly if such change has the effect of changing one of the critical assumptions or estimates we used to calculate the estimated fair value of our reporting units, could result in a change to the estimation of fair value that could result in an impairment charge. Any such material charges, whether related to goodwill or purchased intangible assets, may have a material negative impact on our financial and operating results.
29
WE ARE EXPOSED TO LAWSUITS IN THE NORMAL COURSE OF BUSINESS WHICH COULD HAVE A MATERIAL ADVERSE EFFECT ON OUR BUSINESS, OPERATING RESULTS, OR FINANCIAL CONDITION. We are exposed to lawsuits in the normal course of our business, including product liability claims, if personal injury, death or commercial losses occur from the use of our products. While we typically maintain business insurance, including directors' and officers' policies, litigation can be expensive, lengthy, and disruptive to normal business operations, including the potential impact of indemnification obligations for individuals named in any such lawsuits. We may not, however, be able to secure insurance coverage on terms acceptable to us in the future. Moreover, the results of complex legal proceedings are difficult to predict. An unfavorable resolution of a particular lawsuit, including a recall or redesign of products if ultimately determined to be defective, could have a material adverse effect on our business, operating results, or financial condition.
THE LONG SALES CYCLES FOR OUR PRODUCTS MAY CAUSE US TO INCUR SIGNIFICANT EXPENSES WITHOUT OFFSETTING REVENUES. Customers often view the purchase of our products as a significant and strategic decision. As a result, customers typically expend significant effort in evaluating, testing, and qualifying our products before making a decision to purchase them, resulting in a lengthy initial sales cycle. While our customers are evaluating our products and before they place an order with us, we may incur substantial sales and marketing and research and development expenses to customize our products to the customer's needs. We may also expend significant management efforts, increase manufacturing capacity and order long lead-time components or materials prior to receiving an order. Even after this evaluation process, a potential customer may not purchase our products. As a result, these long sales cycles may cause us to incur significant expenses without ever receiving revenue to offset such expenses.
OUR FAILURE TO PROTECT OUR PROPRIETARY TECHNOLOGY OR TO AVOID LITIGATION FOR INFRINGEMENT OR MISAPPROPRIATION OF PROPRIETARY RIGHTS OF THIRD PARTIES COULD RESULT IN A LOSS OF REVENUES AND PROFITS. Our future success depends in part upon our intellectual property rights, including trade secrets, know-how, and continuing technological innovation. There can be no assurance that the steps taken by us to protect our intellectual property rights will be adequate to prevent misappropriation or that others will not develop competitive technologies or products. We currently hold 233 United States and foreign patents on our laser sources, with expiration dates ranging from 2013 to 2032. We have also obtained licenses under certain patents covering lasers and related technology incorporated into our products. In addition, 130 patent applications have been filed and are under review by the relevant patent authorities. There can be no assurance that other companies are not investigating or developing other technologies that are similar to ours, that any patents will issue from any application filed by us or that, if patents do issue, the claims allowed will be sufficiently broad to deter or prohibit others from marketing similar products. In addition, there can be no assurance that any patents issued to us will not be challenged, invalidated or circumvented, or that the rights thereunder will provide a competitive advantage to us. See also “Business - Intellectual Property”. From time to time, we receive notices from third parties alleging infringement of such parties’ patent or other proprietary rights by our products. While these notices are common in the laser industry and we have in the past been able to develop non-infringing technology or license necessary patents or technology on commercially reasonable terms, there can be no assurance that we would in the future prevail in any litigation seeking damages or expenses from us or to enjoin us from selling products on the basis of such alleged infringement, or that we would be able to develop any non-infringing technology or license any valid and infringed patents on commercially reasonable terms. In the event any third party made a valid claim against us or our customers and a license was not made available to us on commercially reasonable terms, we would be adversely affected.
CHANGES IN GOVERNMENTAL REGULATION OF OUR BUSINESS OR OUR PRODUCTS COULD REDUCE DEMAND FOR OUR PRODUCTS OR INCREASE OUR EXPENSES.
We are subject to many governmental regulations, including but not limited to the laser radiation safety regulations of the Radiation Control for Health and Safety Act administered by the National Center for Devices and Radiological Health, a branch of the United States Food and Drug Administration. Among other things, these regulations require us to file annual reports, to maintain quality control and sales records, to perform product testing, to distribute appropriate operating manuals, to conduct safety reviews, to incorporate design and operating features in products sold to end users, and to certify and label our products.

30
We are also subject to regulatory oversight, including comparable enforcement remedies, in the markets we serve. Any significant change in these regulations could reduce demand for our products or increase our expenses, which in turn could adversely affect our business, financial condition, results of operations, and cash flows.
CHANGES IN TAX RATES, TAX LIABILITIES, OR TAX ACCOUNTING RULES COULD AFFECT FUTURE RESULTS. As a global company, we are subject to taxation in the United States and various other countries and jurisdictions in which we do business. Significant judgment is required to determine our worldwide tax liabilities. Our future tax rates could be affected by changes in the composition of earnings in countries with differing tax rates, changes in the valuation of our deferred tax assets and liabilities, or changes in the tax laws in the jurisdictions in which we do business. In addition, we are subject to regular examination of the income tax returns that we and our subsidiaries file by the Internal Revenue Service and other tax authorities. We regularly assess the likelihood of favorable or unfavorable outcomes resulting from these examinations to determine the adequacy of our provision for income taxes. Although we believe our tax estimates are reasonable, there can be no assurance that any final determination will not be materially different than the treatment reflected in our historical income tax provisions and accruals, which could materially and adversely affect our operating results and financial condition.
ANY DEFECTS IN OUR PRODUCTS OR CUSTOMER PROBLEMS ARISING FROM THE USE OF OUR PRODUCTS MAY SERIOUSLY HARM OUR BUSINESS AND REPUTATION. Our laser products are technologically complex and may contain both known and undetected errors or performance problems. In addition, performance problems can also be caused by the improper installation or use of our products by a customer. These errors or performance problems could result in customer dissatisfaction, which could harm our sales or customer relationships. In addition, these problems may cause us to incur significant warranty and repair costs and divert the attention of our engineering personnel from our product development efforts.
IF WE EXPERIENCE A SIGNIFICANT DISRUPTION IN, OR BREACH IN SECURITY OF, OUR INFORMATION TECHNOLOGY SYSTEMS, OUR BUSINESS MAY BE ADVERSELY AFFECTED.
We rely on information technology systems throughout our Company to manage orders, process shipments to customers, manage inventory levels, and maintain financial information. Events could result in the disruption of our systems, including power outages, computer attacks by hackers, viruses, catastrophes, hardware and software failures, and other unforeseen events. If we were to experience a significant period of system disruption in information technology systems that involve our interactions with customers or suppliers, it could result in the loss of sales and customers and significant incremental costs, which could adversely affect our business. In addition, security breaches of our information technology systems could result in the misappropriation or unauthorized disclosure of confidential information belonging to us or to our employees, partners, customers, or suppliers, which could result in our suffering significant financial or reputational damage.

31
ITEM 1B. UNRESOLVED STAFF COMMENTS None.
ITEM 2. PROPERTIES The Company’s manufacturing facilities include the following:
Location of FacilityOwned orLeased
Size**(sq. ft.)
LeaseExpiration Primary Activity
Hamburg, Germany Owned* 175,193
CO2 lasers, solid-state lasers, diode lasers, fiber lasers
Starnberg, Germany Leased 127,520 2014 through 2017 Laser marking and micro products,power supplies
Gunding-Munich, Germany Leased 81,892 2017 Solid-state lasers, laser markingproducts
Plymouth, Michigan Leased 52,128 2017 CO2 lasers, laser micro and marking systems
Kingston upon Hull, UnitedKingdom
Leased 48,502 2017 Low-power CO2 lasers
Orlando, Florida Owned 35,272 Solid-state lasersLanding, New Jersey Owned 34,292 CO2 lasersMainz, Germany Leased 78,469 2024 Diode lasers and componentsDevens, Massachusetts Leased 16,955 2017 Laser marking systemsGothenburg, Sweden Leased 21,345 2014 through 2017 Fiber optic productionOverath, Germany Leased 22,948 2015 Coating of materialsOxford, United Kingdom Leased 14,919 2019 Laser marking systemsTampere, Finland Leased 10,064 None Fiber lasers, optical enginesTampere, Finland Owned 44,100 Fiber lasers, optical enginesPamplona, Spain Owned 12,654 Laser marking systemsSingapore Leased 7,812 2015 Laser marking productsFreiburg, Germany Leased 8,931 2014 Laser diodesTucson, Arizona Leased 22,310 2015 ComponentsEast Granby, Connecticut Leased 96,565 2027 Fibers, fiber lasersNanjing, China Owned 67,834 CO2 lasers, laser marking products,
diode componentsThun, Switzerland Leased 25,134 2015 Solid-state lasers for micro material
processing
* The facility is owned by ROFIN-SINAR Laser GmbH (“RSL”); the real property on which the facility is located is leased by RSL under a 99-year lease.
** Includes sales, administration and research and development facilities, where applicable.
The Thun (Switzerland) facility lease has a renewal option for five years. One of the Starnberg (Germany) main facilities is leased until 2015 from a member of the Company’s Board of Directors and includes a clause to terminate the lease contract within a two-year notice period during the contract, while the other main facilities are leased until 2016 and 2017. The Freiburg (Germany) facility lease has a renewal option for five years. The Gothenburg (Sweden) main facility leases have a renewal option for three years. The Tampere (Finland) facility lease can be terminated upon six-month notice from the landlord and the lessee. The Company maintains sales, administration, and research and development facilities at each of the Hamburg, Starnberg, Gunding-Munich, Mainz, Freiburg, Kingston upon Hull, Gothenburg, Tampere, East Granby, Plymouth, Landing, Orlando, Thun, and Nanjing locations. The Company also maintains sales and service offices worldwide, all of which are leased, with the exception of the Pamplona (Spain) and Seoul (South Korea) properties which are owned.

32
The Company believes that its existing facilities are adequate to meet its currently projected needs for the next 12 months and that suitable additional or alternative space would be available, if necessary, in the future on commercially reasonable terms.
ITEM 3. LEGAL PROCEEDINGS The Company has been and is likely to be involved from time to time in litigation involving its intellectual property and ordinary routine litigation arising in the ordinary course of business. A licensor of patents that, before their expiration in 2010, covered the technology used in certain of the Company's CO2 lasers has asserted that the Company has calculated royalties due in respect of certain sales of such CO2 lasers in a manner that is not consistent with the applicable license agreement. In addition, the licensor claims that it has not been provided with copies of invoices and other documentation relating to such sales, to which it asserts it is entitled under the license agreement. The Company disputes these and related allegations and believes that it is in compliance with all of its obligations under the license agreement. The patents, and therefore the license rights, have already expired and there are no further license fees to be calculated and paid. Accordingly, management believes that the resolution of this matter will not have a material adverse impact on the Company's financial condition, results of operations, or cash flows.
ITEM 4. MINE SAFETY DISCLOSURES
Not applicable.

33
PART II ITEM 5. MARKET FOR REGISTRANT'S COMMON EQUITY, RELATED STOCKHOLDER MATTERS,
AND ISSUER PURCHASES OF EQUITY SECURITIES The Company’s common stock is traded on the NASDAQ Global Select Market and also on the Prime Standard Segment of the Frankfurt Stock Exchange, under the symbol RSTI and international securities identification number (ISIN) US7750431022, respectively. The table below sets forth the high and low closing sales prices of the Company’s common stock for each quarter ended during the last two fiscal years as reported by NASDAQ:
Common Stock Trade PricesQuarter ended High LowDecember 31, 2011 $ 27.19 $ 18.47March 31, 2012 $ 29.39 $ 23.30June 30, 2012 $ 26.92 $ 17.90September 30, 2012 $ 22.97 $ 17.23December 31, 2012 $ 21.68 $ 17.93March 31, 2013 $ 28.25 $ 22.27June 30, 2013 $ 27.65 $ 23.99September 30, 2013 $ 25.43 $ 22.49
At November 26, 2013, the Company had six holders of record of its common stock and 28,141,469 shares outstanding. A significantly greater number of holders of the Company’s common stock are “street name” or beneficial holders, whose shares are held of record by bankers, brokers, and other financial institutions. The Company has not paid dividends on its common stock and does not anticipate paying dividends in the foreseeable future. During fiscal year 2013, the Company did not sell any equity securities that were not registered under the Securities Act. Except as set forth in the next paragraph, there were no purchases of common stock of the Company made by the Company or any “affiliated purchaser” of the Company as defined in Rule 10b-18(a)(3) under the Exchange Act during the fourth fiscal quarter of fiscal year 2013.
As previously reported, on August 1, 2012, the Board of Directors authorized the Company to initiate a share buyback of up to $20.0 million of the Company's stock over the proceeding twelve months ending August 10, 2013, subject to market conditions. The shares were able to be repurchased from time to time in open market transactions or privately negotiated transactions at the Company's discretion, including as to the quantity, timing, and price thereof. During the fourth quarter, we repurchased shares of common stock as follows:
Period
TotalNumber of
SharesPurchased
AveragePrice Paidper Share
Total Number ofShares Purchased as
Part of a Publicly-Announced Plans or
Programs
Maximum Number(or ApproximateDollar Value) ofShares that May
Yet Be PurchasedUnder the Plans or
ProgramsJuly 1, 2013 through July 31, 2013 — — — $ 9.3 millionAugust 1, 2013 through August 10, 2013 179,145 $ 23.01 179,145 — Total/Average 179,145 $ 23.01 179,145
During fiscal year 2013, the Company repurchased 179,145 shares of common stock at a cost of $4.1 million. From commencement of the program on August 1, 2012, through its completion on August 10, 2013, the Company repurchased 684,340 shares of common stock at a cost of $14.8 million. The Company has not made any repurchases under the program following the conclusion on August 10, 2013.

34
STOCK PRICE PERFORMANCE GRAPH The following Stock Price Performance Graph includes comparisons required by the SEC. The Graph does not constitute soliciting material and should not be deemed filed or incorporated by reference into any other Company filings under the Securities Act of 1933, as amended, or the Securities Exchange Act of 1934, as amended, except to the extent that the Company specifically incorporates this information by reference therein. The following graph presents the one-year total return for ROFIN-SINAR Technologies Inc. common stock compared with the NASDAQ Stock Market Index and the S&P Technology Sector Index. ROFIN-SINAR selected these comparative groups due to industry similarities and the fact that they contain several direct competitors.
The graph assumes that the value of the investment in ROFIN-SINAR Technologies Inc. common stock, the NASDAQ Stock Market Index, and the S&P Technology Sector Index each was $100 on September 30, 2008, and that all dividends were reinvested. The S&P Technology Sector Index is weighted by market capitalization.
The stock price performance shown in this graph is not necessarily indicative of, and not intended to suggest future stock price performance.

35
EDGAR REPRESENTATION OF DATA POINTS USED IN PRINTED GRAPHIC
ROFIN-SINAR
Technologies Inc.NASDAQ Stock
Market IndexS&P Technology
Sector Index9/30/2008 100 100 1009/30/2009 75.01 103.76 108.509/30/2010 82.91 116.52 120.069/30/2011 62.72 120.44 124.669/30/2012 64.46 157.60 165.069/30/2013 79.09 195.67 176.47

36
ITEM 6. SELECTED FINANCIAL DATA The following table sets forth selected consolidated financial data for the past five fiscal years. The information set forth below should be read in conjunction with the consolidated financial statements and notes and “Management’s Discussion and Analysis of Financial Condition and Results of Operations” contained elsewhere in this Annual Report on Form 10-K.
Year ended September 30, 2013 2012 2011 2010 2009
STATEMENT OF OPERATIONS DATA:Net sales $ 560,068 $ 540,121 $ 597,763 $ 423,570 $ 349,579Cost of goods sold 363,559 343,769 365,684 257,316 217,532Gross profit 196,509 196,352 232,079 166,254 132,047Selling, general & administrative expenses 101,726 101,088 107,510 89,908 88,906Research & development expenses 43,014 42,604 38,337 30,137 31,500Amortization expense 2,553 2,279 2,569 2,250 3,559Income from operations 49,216 50,381 83,663 43,959 8,082Net interest expense (income) 54 (11) (135) 375 309Income before income taxes 49,155 52,392 87,143 45,901 14,700Income tax expense 14,139 17,180 26,070 15,442 5,197Net income attributable to RSTI 34,755 34,530 60,032 29,840 9,163Earnings per common share
attributable to RSTI– Basic $ 1.23 $ 1.21 $ 2.11 $ 1.04 $ 0.32Earnings per common share
attributable to RSTI– Diluted $ 1.22 $ 1.20 $ 2.06 $ 1.02 $ 0.31Shares used in computing earnings
per share – Basic 28,189 28,498 28,440 28,807 28,912Shares used in computing earnings
per share – Diluted 28,392 28,744 29,105 29,212 29,194
OPERATING DATA (as percentage of sales): Gross profit 35.1% 36.4% 38.8% 39.3% 37.8%Selling, general & administrative expenses 18.2% 18.7% 18.0% 21.2% 25.4%Research & development expenses 7.7% 7.9% 6.4% 7.1% 9.0%Income from operations 8.8% 9.3% 14.0% 10.4% 2.3%Income before income taxes 8.8% 9.7% 14.6% 10.8% 4.2%
BALANCE SHEET DATA: Working capital $ 372,778 $ 318,827 $ 333,328 $ 287,443 $ 274,279Total assets 699,910 652,532 653,946 558,192 539,507Line of credit and loans 18,622 22,545 22,863 20,661 31,409Long-term debt 14,913 5,662 14,742 15,488 12,426Total equity 543,418 493,919 478,617 417,476 421,694

37
ITEM 7. MANAGEMENT'S DISCUSSION AND ANALYSIS OF FINANCIAL CONDITION AND RESULTS OF OPERATIONS OVERVIEW ROFIN-SINAR Technologies is a leader in the design, development, engineering, manufacturing, and marketing of laser sources and laser-based system solutions for industrial material processing applications, which include primarily cutting, welding, and marking a wide range of materials. The Company's product portfolio ranges from single laser-beam sources to highly complex systems, covering all of the key laser technologies such as CO2 lasers, fiber, solid-state, and diode lasers, and the entire power spectrum, from single-digit watts up to multi-kilowatts, as well as a comprehensive spectrum of wavelengths. An extensive range of laser components completes the product portfolio. Lasers are a non-contact technology for material processing, which have several advantages compared to conventional manufacturing tools that are desirable in industrial applications. The Company's lasers all deliver a high-quality beam at guaranteed power outputs and feature compact design, high processing speed, flexibility, low operating and maintenance costs, and easy integration into the customer's production process thus meeting a broad range of its customers' material processing requirements.
According to the Industrial Laser Solutions magazine's 2013 forecast for industry data published in January 2013, worldwide laser revenues for industrial applications (excluding lithography, inspection, measurement, research, medical, etc.) are expected to reach approximately $2.2 billion. Based on this data, the Company estimates that it has currently a market share in the relevant industrial laser sector of approximately seventeen percent (based on laser-related sales volume). The Company has sold more than 66,000 laser sources since 1975 and currently has over 4,000 active customers (including multinational companies with multiple facilities purchasing from the Company). During fiscal 2013, 2012, and 2011, approximately 38%, 38%, and 40%, respectively, of the Company’s revenues related to sales of laser products for macro applications, approximately 49%, 50%, and 50% respectively, related to sales of laser products for marking and micro applications, and approximately 13%, 12%, and 10%, respectively, related to sales of components.
Through its global manufacturing, distribution and service network, the Company provides a comprehensive range of laser sources and laser-based system solutions to the following principal target markets: the machine tool, automotive, semiconductor, electronics, and photovoltaic industries. The Company sells directly to end users and to original equipment manufacturers (“OEMs”) that integrate ROFIN’s laser sources with other system components. Many of ROFIN’s customers are among the largest global participants in their respective industries. During fiscal 2013, 2012, and 2011, 20%, 22%, and 18%, respectively, of the Company’s sales were in North America, 45%, 44%, and 45%, respectively, were in Europe, and 35%, 34%, and 37%, respectively, were in Asia. The results of the fiscal year ended September 30, 2013, were characterized by the change in technology towards more fiber laser. Sales improved in Asia and Europe while sales in North America slightly decreased. Demand was mainly driven by the machine tool and electronics industries.
Outlook We believe that European and North American markets will remain stable while we see a more cautious sentiment coming from some of our customers in Asia, therefore we expect to see some volatility in our business at the beginning of the fiscal year 2014. However, despite a challenging beginning backlog, we believe that our book-to-bill ratio will improve based on current sales projects and new product introductions, especially in ultrashort pulse technology. In addition, our measures for an optimized cost structure concerning our high-power fiber lasers, along with the broadening of our fiber laser portfolio should increase our competitiveness and improve our financial performance.
Acquisitions and Formation of New Entities Effective April 12, 2010, the Company purchased the Electro Optics fiber optic gyroscope coil winding business of Optelecom-NKF, Inc., through its wholly-owned subsidiary Nufern. This purchase resulted in additional goodwill of $0.3 million.
Effective October 15, 2010, the Company acquired 100% of the common stock of LASAG AG, Thun (Switzerland), through its wholly-owned subsidiary ROFIN-SINAR Technologies Europe S.L. (“RSTE“). Additionally, the Company acquired the LASAG sales and service operations in Germany, Italy, Japan, and the United States. LASAG is one of the original laser companies with more than 30 years of experience in the development and manufacturing of industrial solid-state lasers. LASAG markets and sells its laser products for fine cutting, spot welding, drilling, and scribing applications to the medical

38
device, automotive, electronic, and aerospace industries. In addition, LASAG has special expertise in high-precision drilling and laser processing heads. This purchase resulted in goodwill of $1.6 million and other intangibles, net of $2.3 million.
Effective August 24, 2011, the Company formed ROFIN BAASEL Laser India Pvt. Ltd. in Mumbai (India) as a wholly-owned subsidiary through its wholly-owned subsidiaries ROFIN-SINAR Laser GmbH (99%) and ROFIN-BAASEL Lasertech GmbH & Co KG (1%). It started its operations in October 2011 and is responsible for sales and service of ROFIN laser products in India.
On each of October 26, 2011, and March 12, 2012, the Company purchased an additional 5% of the share capital of m2k-laser GmbH through ROFIN-SINAR Laser GmbH under an option agreement between the Company and the minority shareholders of m2k-laser GmbH. As a result of those share purchases, the Company currently holds 90% of the share capital of m2k-laser GmbH.
Effective March 28, 2007, the Company acquired 100% of the common stock of Corelase Oy, Tampere (Finland). Corelase Oy has considerable experience in semiconductors, optics, and fiber technology. Its product lines include ultrashort pulse, mode-locked fiber laser systems, fiber laser modules, and other components. The terms of the purchase included payment of a deferred purchase price based on Corelase Oy achieving certain financial targets. On December 14, 2011, the Company finalized and paid the deferred purchase price. This payment resulted in additional goodwill of $13.4 million.
Effective September 29, 2011, the Company received the remaining 15% of the share capital of H2B Photonics GmbH (“H2B“)through a transfer of shares and now holds 100% of the share capital. In May 2012, the Company merged its wholly-owned subsidiary PMB Elektronik GmbH with H2B and named the newly formed subsidiary PMB Elektronik GmbH.
Effective December 20, 2012, the Company acquired the remaining 20% of the common stock of ROFIN-BAASEL China Co., Ltd. through its wholly-owned subsidiary RSL. The Company currently holds 100% of the share capital of ROFIN-BAASEL China Co., Ltd.
Effective January 8, 2013, the Company acquired the remaining 20% of the common stock of Nanjing Eastern Technologies Company, Ltd. The Company currently holds 100% of the share capital of Nanjing Eastern Technologies Company, Ltd.
RESULTS OF OPERATIONS For the periods indicated, the following table sets forth the percentage of net sales represented by the respective line items in the Company’s consolidated statements of operations:
Years ended September 30, 2013 2012 2011Net sales 100.0% 100.0% 100.0%Cost of goods sold 64.9% 63.6% 61.2%Gross profit 35.1% 36.4% 38.8%Selling, general and administrative expenses 18.2% 18.7% 18.0%Research & development expenses 7.7% 7.9% 6.4%Intangibles amortization 0.5% 0.4% 0.4%Income from operations 8.8% 9.3% 14.0%Income before income taxes 8.8% 9.7% 14.6%Net income attributable to RSTI 6.2% 6.4% 10.0%

39
Fiscal Year 2013 Compared to Fiscal Year 2012 Net Sales – Net sales of $560.1 million represents an increase of $19.9 million, or 4%, over the prior year. Net sales increased $22.9 million, or 5%, in Europe/Asia and decreased $3.0 million, or 3%, in North America, compared to the prior year. The U.S. dollar fluctuated against foreign currencies, which had a favorable effect on net sales of $0.6 million. Net sales of laser products for macro applications increased by 4% to $214.6 million, primarily due to the higher demand for our fiber lasers and CO2 lasers from OEM customers in the machine tool industry. Net sales of lasers for marking and micro applications rose by $0.5 million to $272.7 million, an increase of less than 1% compared to fiscal year 2012. This was due to higher demand for our lasers for micro and marking applications, principally from the electronics and smart card industries, though this was partially offset by lower demand from the semiconductor industry. Revenues for the component business increased by 16% to $72.8 million, primarily due to higher sales related to laser diode products and fiber-related components. Gross Profit – The Company’s gross profit of $196.5 million represents a slight increase of $0.2 million, or less than 1%, over the prior year. As a percentage of sales, gross profit decreased to 35%. The decreased percentage margin in fiscal year 2013 was primarily a result of an unfavorable product mix towards a lager portion of fiber lasers, a decrease in our service and spare parts business, and higher fixed cost related to the manufacturing and qualification of new components for our high-power fiber laser portfolio. Gross profit was unfavorably affected by $0.5 million in fiscal year 2013 due to the fluctuation of the U.S. dollar against foreign currencies. Selling, General and Administrative Expenses – Selling, general and administrative expenses increased by $0.6 million, or 1%, to $101.7 million, compared to fiscal year 2012, primarily as a result of higher labor cost and sales commissions. As a percentage of net sales, selling, general and administrative expenses decreased to 18%. Selling, general and administrative expenses were unfavorably affected by $0.1 million due to the fluctuation of the U.S. dollar against foreign currencies in fiscal year 2013. Research and Development – The Company’s net expenses for research and development amounted to $43.0 million, which represents an increase of $0.4 million, or 1%, primarily due to the continuing activities to broaden our fiber laser and ultrashort pulse laser product portfolio. Gross research and development expenses for fiscal year 2013 and 2012, were $45.4 million and $44.2 million, respectively, and were reduced by $2.4 million and $1.6 million of government grants during the respective periods. The Company will continue to apply for, and expects to continue receiving, government grants towards research and development, principally in Europe. Research and development expenses were unfavorably affected by $0.2 million due to the fluctuation of the U.S. dollar against foreign currencies in fiscal year 2013.
Other Income/Expenses – Net other expenses of $0.1 million in fiscal year 2013 represents a decrease of $2.1 million compared with net other income of $2.0 million in the prior year. This decrease is a result of net exchange losses of $0.5 million in fiscal year 2013, compared to net exchange gains of $1.4 million in fiscal year 2012, $0.1 million lower net interest income, and a lower net miscellaneous income of $0.2 million. Income Tax Expense – Income tax expense of $14.1 million in fiscal year 2013 and $17.2 million in fiscal year 2012, represents effective tax rates of 28.8% and 32.8% for the respective periods. The lower effective income tax rate in fiscal year 2013 is mainly a result of the generation of taxable income in countries with lower tax rates and the utilization of research and development credits, mainly in the US. Income tax expense, a significant portion of which is incurred in foreign currencies, was not materially affected by the fluctuation of the U.S. dollar against foreign currencies. Net Income Attributable to RSTI – As a result of the foregoing factors, net income attributable to RSTI of $34.8 million ($1.22 per diluted share, based on 28.4 million weighted average common shares outstanding) in fiscal year 2013 increased by $0.3 million over the prior year’s net income attributable to RSTI of $34.5 million ($1.20 per diluted share, based on 28.7 million weighted average common shares outstanding). Net income attributable to RSTI was unfavorably affected by $0.8 million in fiscal year 2013 due to the fluctuation of the U.S. dollar against foreign currencies.
Fiscal Year 2012 Compared to Fiscal Year 2011 Net Sales – Net sales of $540.1 million represents a decrease of $57.7 million, or 10%, over the prior year. Net sales decreased $66.0 million, or 14%, in Europe/Asia and increased $8.3 million, or 8%, in North America, compared to the prior year. The U.S. dollar fluctuated against foreign currencies, which had an unfavorable effect on net sales of $18.3 million. Net sales of laser products for macro applications decreased by14% to $205.4 million, primarily due to the lower demand for our CO2 lasers from OEM customers in the machine tool industry. Net sales of lasers for marking and micro applications decreased by 10% to $272.2 million compared to fiscal year 2011, mainly due to a lower demand for our lasers for micro and marking applications

40
principally from the electronics and photovoltaic industries. Revenues for the component business increased by 8% to $62.5 million, primarily due to higher sales related to laser diode products and fiber-related components. Gross Profit – The Company’s gross profit of $196.4 million represents a decrease of $35.7 million, or 15%, over the prior year. As a percentage of sales, gross profit decreased to 36%. The decreased percentage margin in fiscal year 2012 was primarily a result of lower fixed cost absorption due to a lower level of business, an unfavorable product mix, and a decrease in our service and spare parts business. Gross profit was unfavorably affected by $3.2 million in fiscal year 2012 due to the fluctuation of the U.S. dollar against foreign currencies. Selling, General and Administrative Expenses – Selling, general and administrative expenses decreased by $6.4 million, or 6%, to $101.1 million, compared to fiscal year 2011 primarily as a result of less variable labor cost and third party sales commissions related to our lower level of business. As a percentage of net sales, selling, general and administrative expenses increased to 19%. Selling, general and administrative expenses were favorably affected by $3.5 million due to the fluctuation of the U.S. dollar against foreign currencies in fiscal year 2012. Research and Development – The Company’s net expenses for research and development amounted to $42.6 million, which represents an increase of $4.3 million, or 11%, primarily due to lower research and development grants compared to fiscal year 2011 and continuing activities to broaden our fiber laser product portfolio. Gross research and development expenses for fiscal year 2012 and 2011 were $44.2 million and $40.6 million, respectively, and were reduced by $1.6 million and $2.3 million of government grants during the respective periods. The Company will continue to apply for, and expects to continue receiving, government grants towards research and development, principally in Europe. Research and development expenses were favorably affected by $2.1 million due to the fluctuation of the U.S. dollar against foreign currencies in fiscal year 2012.
Other Income – Net other income of $2.0 million in fiscal year 2012 represents a decrease of $1.5 million compared to the prior year. This decrease in net other income is a result of lower net exchange gains of $1.4 million in fiscal year 2012, compared to $1.9 million in fiscal year 2011, $0.1 million lower net interest income and $0.8 million lower net miscellaneous income, related to one-time income for cancellation fees in fiscal year 2011. Income Tax Expense – Income tax expense of $17.2 million in fiscal year 2012 and $26.1 million in fiscal year 2011, represents effective tax rates of 32.8% and 29.9% for the respective periods. The higher effective income tax rate in fiscal year 2012 is mainly due to higher taxable income in countries with higher tax rates and additional taxes for the one-time repatriation of earnings. Income tax expense, a significant portion of which is incurred in foreign currencies, was favorably affected by $0.6 million due to the fluctuation of the U.S. dollar against foreign currencies. Net Income Attributable to RSTI – As a result of the foregoing factors, net income attributable to RSTI of $34.5 million ($1.20 per diluted share, based on 28.7 million weighted average common shares outstanding) in fiscal year 2012 decreased by $25.5 million over the prior year’s net income attributable to RSTI of $60.0 million ($2.06 per diluted share, based on 29.1 million weighted average common shares outstanding). Net income attributable to RSTI was favorably affected by $3.0 million in fiscal year 2012 due to the fluctuation of the U.S. dollar against foreign currencies.
LIQUIDITY AND CAPITAL RESOURCES Fiscal Year 2013 The Company’s primary sources of liquidity at September 30, 2013, were cash and cash equivalents of $133.7 million, short-term investments of $3.2 million, and short-term credit lines of $67.0 million. As of September 30, 2013, $2.1 million was outstanding under the short-term lines of credit and $1.5 million was used for bank guarantees under these lines of credit, leaving $63.4 million available for borrowing under short-term lines of credit. In addition, the Company maintained credit lines specific to bank guarantees for $21.2 million, of which $7.7 million was used. Therefore, $76.9 million was unused and available under our short-term and bank guarantee lines of credit, in aggregate, at September 30, 2013. At September 30, 2013, the entire amount of our long-term lines of credit was fully drawn. The Company is subject to financial covenants under some of these facilities and lines of credit, which could restrict the Company from drawing money under them. At September 30, 2013, the Company was in compliance with these covenants. Cash and cash equivalents increased by $35.0 million during fiscal year 2013. Approximately $57.0 million in cash and cash equivalents were provided by operating activities, primarily as the result of the net income ($35.0 million) plus other non cash items, principally depreciation and amortization ($15.3 million), and a decrease in inventories ($10.1 million). Operating cash

41
flow was negatively affected by an increase of other accounts receivable ($2.7 million) and by a decrease in accounts payable ($2.2 million) and income tax payable ($1.3 million). Net cash used in investing activities totaled $15.5 million for the year ended September 30, 2013, and was primarily related to various additions to property and equipment ($16.2 million) and the purchase of short-term investments ($6.3 million), partly offset by the sale of short-term investments ($6.8 million). Net cash used in financing activities totaled $9.4 million for the year ended September 30, 2013, and was primarily related to payments to minority shareholders ($4.3 million), the stock buyback program ($4.1 million), and repayments of loans ($24.9 million), partly offset by borrowings from banks ($20.9 million) and $2.9 million generated through issuance of new shares from the exercise of stock options.
The Company expects that its capital expenditures will be approximately $19 million in fiscal year 2014. Management believes that cash flows from operations, along with existing cash and cash equivalents and availability under the credit facilities and lines of credit, will provide adequate resources to meet the Company’s capital requirements and operational needs on both a current and a long-term basis.
As of September 30, 2013, $114.2 million of the total $137 million of cash, cash equivalents, and short-term investments, was held by our non-US subsidiaries, with the balance ($22.8 million) held by our US subsidiaries. As of that date, of the $18.6 millions of the Group's indebtedness to banks, $4.0 million was owed by our US subsidiaries, and $14.6 million was owed by our non-US subsidiaries. We expect our existing domestic cash, cash equivalents, and short-term investments, together with cash flows from operations to be sufficient to fund our domestic operating activities. In addition, the US Company has $20.0 millions in available and unused lines of credit at September 30, 2013. Therefore, we do not intend, nor do we foresee a need, to repatriate foreign earnings that are considered to be indefinitely reinvested, and we do not believe there are any material implications for or restrictions on the liquidity of our domestic subsidiaries as a result of having a majority of our cash, cash equivalents, and short-term investments held by our foreign subsidiaries.
Fiscal Year 2012 The Company’s primary sources of liquidity at September 30, 2012, were cash and cash equivalents of $98.8 million, short-term investments of $2.4 million, short-term credit lines of $72.9 million, and long-term credit lines of $7.2 million. As of September 30, 2012, $15.3 million was outstanding under the short-term lines of credit and $1.6 million was used for bank guarantees under these lines of credit, leaving $56.0 million available for borrowing under short-term lines of credit. In addition, the Company maintained credit lines specific to bank guarantees for $15.1 million, of which $6.7 million was used. Therefore, $64.3 million was unused and available under our short-term and bank guarantee lines of credit, in aggregate, at September 30, 2012. At September 30, 2012, the entire amount of our long-term lines of credit was fully drawn. The Company is subject to financial covenants under some of these facilities and lines of credit, which could restrict the Company from drawing money under them. At September 30, 2012, the Company was in compliance with these covenants. Cash and cash equivalents decreased by $28.7 million during fiscal year 2012. Approximately $22.0 million in cash and cash equivalents were provided by operating activities, primarily as the result of the net income ($35.2 million) plus other non-cash items, principally depreciation and amortization ($13.9 million) and a decrease in accounts receivable ($7.6 million). Operating cash flow was negatively affected by an increase in and inventories ($18.2 million) and by a decrease in accrued liabilities and pension obligations ($11.4 million) and income tax payable ($6.2 million). Net cash used in investing activities totaled $39.4 million for the year ended September 30, 2012, and was primarily related to various additions to property and equipment ($27.3 million), business acquisitions ($13.4 million) and purchase of short-term investments ($8.7 million), partially offset by proceeds from the sale of short-term investments ($9.8 million). Net cash used in financing activities totaled $9.5 million for the year ended September 30, 2012, and was primarily related to the stock buyback program ($10.7 million) and repayments of loans ($10.5 million), partly offset borrowings from banks ($10.9 million).

42
Fiscal Year 2011 The Company’s primary sources of liquidity at September 30, 2011, were cash and cash equivalents of $127.4 million, short-term investments of $3.0 million, short-term credit lines of $72.7 million, and long-term credit lines of $16.4 million. As of September 30, 2011, $6.5 million was outstanding under the short-term lines of credit and $10.3 million was used for bank guarantees under these lines of credit, leaving $55.9 million available for borrowing under short-term lines of credit. In addition, the Company maintained credit lines specific to bank guarantees for $6.3 million, of which $0.3 million was used. Therefore, $61.9 million was unused and available under our short-term and bank guarantee lines of credit, in aggregate, at September 30, 2011. At September 30, 2011, the entire amount of our long-term lines of credit was fully drawn. The Company is subject to financial covenants under some of these facilities and lines of credit, which could restrict the Company from drawing money under them. At September 30, 2011, the Company was in compliance with these covenants. Cash and cash equivalents increased by $16.8 million during fiscal year 2011. Approximately $50.0 million in cash and cash equivalents were provided by operating activities, primarily as the result of the increased net income and other non-cash items, principally depreciation and amortization and the increase in accrued liabilities and pension obligations, and income tax payable. Operating cash flow was negatively affected by the increase in accounts receivable and inventories, mainly as a result of the fast business growth experienced during fiscal year 2011. Net cash used in investing activities totaled $28.5 million for fiscal year 2011, and was primarily related to various additions to property and equipment ($21.8 million), business acquisitions ($11.2 million), and purchase of short-term investments ($8.6 million), partially offset by proceeds from the sale of short-term investments ($12.6 million). Net cash used in financing activities totaled $4.7 million and was primarily related to the stock buyback program ($8.8 million) and loan repayments of $9.5 million, partly offset by $6.3 million in borrowings from banks and $7.2 million generated through issuance of new shares from the exercise of stock options.
The following table illustrates the Company’s contractual obligations as of September 30, 2013:
Payments due by period (in thousands) Less than 1-3 3-5 More thanContractual Obligations Total 1 Year Years Years 5 Years
Long and short-term debt $ 18,622 $ 3,709 $ 6,258 $ 6,364 $ 2,291Pension obligations 24,458 698 1,876 2,786 19,098Operating lease obligations 33,211 9,938 12,762 4,239 6,272Purchase obligations * 95,630 70,951 23,386 1,278 15Interest obligation 1,027 307 475 160 85
Other short- and long-term obligations reflected onthe registrant's Balance Sheet 3,716 236 409 926 2,145Total $ 176,664 $ 85,839 $ 45,166 $ 15,753 $ 29,906
* Purchase obligations include payments due under various types of agreements to purchase raw materials, services, or other goods.
Note – Uncertain tax benefit liabilities of $0.5 million are not included in the Company’s contractual obligation table, as the Company cannot make reasonable estimates about the timing of any required payments related to these liabilities.

43
Off-Balance Sheet Arrangements The Company has no off-balance sheet arrangements or financing arrangements involving variable interest entities, except for the remaining unused credit lines amounting to $76.9 million.
CURRENCY EXCHANGE RATE FLUCTUATIONS Although the Company prepares its consolidated financial statements in U.S. dollars, approximately 67% of its net sales are denominated in other currencies, primarily the Euro, Swedish krona, Swiss francs, British pound, Singapore dollar, Taiwanese dollar, Korean won, Japanese yen, Canadian dollar, Indian rupee, and Chinese RMB. Net sales and costs and related assets and liabilities are generally denominated in the functional currencies of the operations, thereby serving to reduce the Company’s exposure to exchange gains and losses. Exchange differences upon translation from each operation’s functional currency to U.S. dollars are accumulated as a separate component of equity. The currency translation adjustment component of shareholders’ equity had the effect of increasing total equity by $17.1 million at September 30, 2013, as compared to $2.3 million at September 30, 2012. The fluctuation of the Euro and the other relevant functional currencies against the U.S. dollar has had the effect of increasing or decreasing (as applicable) reported net sales, as well as cost of goods sold, gross margin, selling, general and administrative expenses, and research and development expenses, denominated in such foreign currencies when translated into U.S. dollars as compared to prior periods. The Company defines the term “constant currency” to mean that financial data for a period are translated into U.S. dollars using the same foreign currency exchange rates that were used to translate financial data for the previously reported period. Changes in sales, gross profit, and income from operations include the effect of fluctuations in foreign currency exchange rates. The Company's management reviews and analyzes business results on a constant currency basis and believes these results represent the Company's underlying business trends without distortion due to currency fluctuations. The Company believes that this “constant currency” financial information is a useful measure for investors because it reflects actual changes in operations. The following chart compares our net sales, gross profit, and income from operations for each of fiscal years 2013, 2012, and 2011, to the equivalent financial results calculated on a “constant currency” basis. Because this “constant currency” financial information does not conform to Generally Accepted Accounting Principles, it is presented under the caption “Non-GAAP Constant Currency”:
Fiscal Year 2013 Fiscal Year 2012 Fiscal Year 2011
GAAPActual
Non-GAAP
ConstantCurrency
GAAPActual
Non-GAAP
ConstantCurrency
GAAPActual
Non-GAAP
ConstantCurrency
(in millions)Net sales $ 560.1 $ 559.5 $ 540.1 $ 558.4 $ 597.8 $ 583.1Gross profit 196.5 197.0 196.4 199.5 232.1 226.8Income from operations 49.2 50.0 50.4 47.8 83.7 82.0
Between fiscal year 2012 and 2013, the average exchange rate for the Euro strengthened against the U.S. dollar by approximately 0.6%. The impact of fluctuations in exchanges rates of foreign currencies against the U.S. dollar was to increase net sales by $0.6 million and to decrease gross profit by $0.5 million, because approximately 67% of fiscal year 2013 sales were denominated in other currencies, primarily the Euro. These exchange rate fluctuations had the effect of increasing operating expense by $0.3 million, thereby decreasing income from operations by $0.8 million.
Between fiscal year 2011 and 2012, the average exchange rate for the Euro weakened against the U.S. dollar by approximately 6.8%. The impact of this weakening was to decrease net sales and gross profit by $18.3 million and $3.1 million, respectively, because approximately 64% of sales were denominated in other currencies, primarily the Euro. This weakening of the Euro had the effect of decreasing operating expenses by $5.7 million, thereby increasing income from operations only by $2.6 million.

44
Between fiscal year 2010 and 2011, the average exchange rate for the Euro strengthened against the U.S. dollar by approximately 2.7%. The impact of this strengthening was to increase net sales and gross profit by $14.7 million and $5.3 million, respectively, because approximately 63% of fiscal year 2011 sales were denominated in other currencies, primarily the Euro. These exchange rate fluctuations had the effect of increasing operating expense by $3.6 million, thereby increasing income from operations by $1.7 million.
CRITICAL ACCOUNTING POLICIES The Company’s significant accounting policies are also described in Note 1 of the consolidated financial statements. Certain of the accounting policies require the application of significant judgment by management in selecting appropriate assumptions for calculating financial estimates. By their nature, these judgments are subject to an inherent degree of uncertainty. Allowance for Doubtful Accounts The Company records allowances for uncollectible customer accounts receivable based on historical experience. Additionally, an allowance is made based on an assessment of specific customers’ financial condition and liquidity. If the financial condition of the Company’s customers were to deteriorate, additional allowances may be required. No individual customer represents more than 10% of total accounts receivable. Any increase in allowance will impact operating income during a given period.
Inventory Valuation Inventories are stated at the lower of cost or market, after provisions for excess and obsolete inventory salable at prices below cost. Provisions for slow moving and obsolete inventories are provided based on current assessments about historical experience and future product demand and production requirements for the next twelve months. We also write-down up to ninety percent of our total demo inventory costs over thirty six months. These factors are impacted by market conditions, technology changes, and changes in strategic direction, and require estimates and management judgment that may include elements that are uncertain. The Company evaluates the adequacy of these provisions quarterly. Although the Company strives to achieve a balance between market demands and risk of inventory excess or obsolescence, it is possible that, should conditions change, additional provisions may be needed. Any changes in provisions will impact operating income during a given period.
Warranty Reserves The Company provides reserves for the estimated costs of product warranties when revenue is recognized. The Company relies upon historical experience, expectations of future conditions, and its service data to estimate its warranty reserve. The Company continuously monitors these data to ensure that the reserve is sufficient. Warranty costs have historically been within our expectations. To the extent we experience increased warranty claim activity or increased costs associated with servicing those claims (such costs may include material, labor, and travel costs), revisions to the estimated warranty liability would be required. Increases in reserves will impact operating income during the period.
Pension Obligations The determination of the Company’s obligation and expense for pension is dependent on the selection of certain actuarial assumptions in calculating those amounts. Assumptions are made about interest rates, expected investment return on plan assets, total turnover rates, and rates of future compensation increases. In addition, the Company provides the actuarial consultants with subjective factors such as withdrawal rates and mortality rates to develop their calculations of these amounts. The Company generally reviews these assumptions at the beginning of each fiscal year. The Company is required to consider current market conditions, including changes in interest rates, in making these assumptions. The actuarial assumptions that the Company uses may differ materially from actual results due to changing market and economic conditions, higher or lower withdrawal rates, or longer or shorter life spans of participants. These differences may result in a significant impact on the amount of pension benefits expense the Company has recorded or may record.
Another key assumption in determining the net pension expense is the assumed discount rate to be used to discount plan obligations. The Company's U.S. plan uses a cash flow matching approach, which uses projected cash flows matched to spot rates along a high-quality corporate yield curve to determine the present value of cash flows to calculate a single equivalent discount rate. A lower discount rate increases the present value of benefit obligations and increases pension expense.

45
To determine the expected long-term rate of return on plan assets, the Company considers the current and expected asset allocations, as well as historical and expected returns on various categories of plan assets.
Income Taxes We estimate our income tax provision in each of the jurisdictions in which we operate, a process that includes estimating exposures related to examinations by taxing authorities. We must also make judgments regarding the ability to realize the deferred tax assets. The carrying value of our net deferred tax assets is based on our belief that it is more likely than not that we will generate sufficient future taxable income in certain jurisdictions to realize these deferred tax assets. A valuation allowance has been established for deferred tax assets that we do not believe meet the “more likely than not” criteria. We assess whether an uncertain tax position taken or expected to be taken in a tax return meets the threshold for recognition and measurement in the consolidated financial statements. Our judgments regarding future taxable income as well as tax positions taken or expected to be taken in a tax return may change due to changes in market conditions, changes in tax laws, or other factors. If our assumptions and consequently our estimates change in the future, the valuation allowances and/or tax reserves established may be increased or decreased, resulting in a respective increase or decrease in income tax expense.
Share-Based Payment Stock-based compensation cost is measured at grant date, based on the fair value of the award, and is recognized as expense over the employee requisite vesting period. We make judgments about the fair value of the awards, including the expected term of the award, volatility of the underlying stock and estimated forfeitures, which impact the amount of compensation expense recognized in the financial statements. Such amounts may change as a result of additional grants, forfeitures, modifications in assumptions, and other factors. The income tax effects of share-based payments are recognized in the financial statements for those awards which will normally result in tax deductions under existing tax law. Under current U.S. federal tax laws, we receive a compensation expense deduction related to stock options only when those options are exercised and vested shares are received. Accordingly, the financial statement recognition of compensation cost for stock options creates a deductible temporary difference which results in a deferred tax asset and a corresponding deferred tax benefit in the income statement for all U.S.-based employees. Stock compensation expense related to non-U.S. employees is treated as a permanent difference for income tax purposes.
Recent Accounting Pronouncements Adopted In June 2011, the Financial Accounting Standards Board ("FASB") issued guidance requiring changes to the presentation of comprehensive income which requires entities to present the total of comprehensive income, the components of net income, and the components of other comprehensive income either in a single continuous statement of comprehensive income or in two separate but consecutive statements. These changes, with retrospective application, became effective for the Company in fiscal year 2013. Other than the change in presentation to report comprehensive income as a separate but consecutive statement, these changes did not have an impact on the consolidated financial statements. In September 2011, the FASB issued ASU 2011-08, “Testing Goodwill for Impairment”. The amendments under ASU 2011-08 allow entities to first assess qualitative factors to determine whether it is necessary to perform the two-step quantitative goodwill impairment test. Under these amendments, an entity is not required to calculate the fair value of a reporting unit unless the entity determines, based on a qualitative assessment, that it is more likely than not that the reporting unit’s fair value is less than its carrying amount. The amendments included a number of events and circumstances for entities to consider in conducting the qualitative assessment. Entities now have the option to bypass the qualitative assessment for any reporting unit in any period and proceed directly to performing the first step of the two-step quantitative goodwill impairment test. ASU 2011-08 was effective for annual and interim goodwill impairment tests performed for fiscal years beginning after December 15, 2011 (fiscal year 2013 for the Company). Adoption of ASU 2011-08 did not have a material impact on the Company’s financial statements.
Recent Accounting Pronouncements Not Yet Adopted as of September 30, 2013 In December 2011, the FASB issued ASU No. 2011-11, “Disclosures about Offsetting Assets and Liabilities”. ASU 2011-11 amended ASC 210, “Balance Sheet”, to converge the presentation of offsetting assets and liabilities between U.S. GAAP and IFRS. ASU 2011-11 requires that entities disclose both gross information and net information about both instruments and transactions eligible for offset in the statement of financial position and instruments and transactions subject to an agreement similar to a master netting arrangement. In January 2013, the FASB issued ASU 2013-01 which limited the scope of this guidance to derivatives, repurchase type agreements, and securities borrowing and lending transactions. The guidance from these updates is effective for fiscal years, and interim periods within those years, beginning after January 1, 2013, which is the

46
Company’s fiscal year 2014. The Company does not believe the adoption will have a significant impact on the Company's consolidated financial statements.
In February 2013, the FASB issued ASU 2013-02, “Reporting of Amounts Reclassified Out of Accumulated Other Comprehensive Income”. ASU 2013-02 requires reclassification adjustments for items that are reclassified from accumulated other comprehensive income to net income be presented on the financial statements or in a note to the financial statements. The new disclosure requirements are effective for fiscal years, and interim periods within those years, beginning after December 15, 2012. As such, ASU 2013-02 will be effective October 1, 2013, for the Company and will be applied prospectively. The Company does not believe the adoption will have a significant impact on the Company's consolidated financial statements.
In March 2013, the FASB amended guidance related to a parent company’s accounting for the release of the cumulative translation adjustment into net income upon derecognition of certain subsidiaries or groups of assets within a foreign entity or of an investment in a foreign entity. This guidance is effective for fiscal periods beginning after December 15, 2013, and is to be applied prospectively to derecognition events occurring after the effective date. The Company does not anticipate that the adoption of this amendment will have a material impact on its financial statements.
In July 2013, the FASB issued ASU 2013-10, "Inclusion of the Fed Funds Effective Swap Rate (or Overnight Index Swap Rate) as a Benchmark Interest Rate for Hedge Accounting Purposes". The update permits the Fed Funds Effective Swap Rate to be used as a U.S. benchmark interest rate for hedge accounting purposes under FASB ASC Topic 815, in addition to the interest rates on direct Treasury obligations of the U.S. government (UST) and the London Interbank Offered Rate (LIBOR). The update also removed the restriction on using different benchmark rates for similar hedges. ASU 2013-10 has no effect on the financial statements as of September 30, 2013, but will be applicable to any hedging activity the Company enters into after July 17, 2013.
In July 2013, the FASB issued guidance on financial statement presentation of an unrecognized tax benefit when a net operating loss carryforward, a similar tax loss, or a tax credit carryforward exists. Under this guidance an unrecognized tax benefit, or a portion of an unrecognized tax benefit, should be presented in the financial statements as a reduction to a deferred tax asset for a net operating loss carryforward, a similar tax loss, or a tax credit carryforward, except as follows. To the extent a net operating loss carryforward, a similar tax loss, or a tax credit carryforward is not available at the reporting date under the tax law of the applicable jurisdiction to settle any additional income taxes that would result from the disallowance of a tax position or the tax law of the applicable jurisdiction does not require the entity to use, and the entity does not intend to use, the deferred tax asset for such purpose, the unrecognized tax benefit should be presented in the financial statements as a liability and should not be combined with deferred tax assets. These amendments are effective for fiscal years, and interim periods within those years, beginning after December 15, 2013. The Company does not believe the adoption will have a significant impact on the Company's consolidated financial statements.
Other accounting standards that have been issued by the FASB or other standards-setting bodies that do not require adoption until a future date are not expected to have a material impact on the Company's financial statements upon adoption.
ITEM 7A. QUANTITATIVE AND QUALITATIVE DISCLOSURES ABOUT MARKET RISK The following discussion about the Company’s market risk disclosures involves forward-looking statements. Actual results could differ materially from those projected in the forward-looking statements. The Company is exposed to market risk related to changes in interest rates and foreign currency exchange rates. The Company does not use derivative financial instruments for trading purposes.
Interest Rate Sensitivity As of September 30, 2013, the Company maintained cash equivalents and short-term investments of $137.0 million, consisting mainly of non-taxable interest bearing securities and demand deposits all with maturities of less than one year. If short-term interest rates were to increase or decrease by 10%, the impact on interest income would be less than $0.1 million. As of September 30, 2013, the Company had $1.9 million of variable rate debt on which the interest rate is reset every three months, $3.9 million of variable rate debt on which the interest rate is reset every six months, $1.9 million of variable rate debt on which the interest rate is reset every twelve months, and $10.9 million of fixed rate debt. Maturities of this debt are as follows: $3.7 million is due in 2014, $1.9 million is due in 2015, $4.4 million is due in 2016, $5.0 million is due in 2017, $1.3 million is due in 2018, $0.5 million is due annually from 2019 through 2022, and $0.3 million is due in 2023. A 10% change in

47
the variable interest rates of the Company’s debt would result in an increase or decrease in interest expense of less than $0.1 million. The Company has entered into two interest rate swap agreements to minimize the interest expenses on a portion of its variable debt described in the previous paragraph by shifting from variable to fixed interest rates. One swap agreement is for a total notional amount of Euro 1.4 million (equivalent to $1.9 million based on the exchange rate at September 30, 2013) and the other is for a total notional amount of Swiss francs 3.5 million (equivalent to $3.9 million based on the exchange rate at September 30, 2013).
Foreign Currency Exchange Risk The Company enters into foreign currency forward contracts and forward exchange options generally of less than one year duration to hedge a portion of its foreign currency risk on sales transactions. At September 30, 2013, the Company held Japanese yen forward exchange contracts with notional amounts of Euro 1.3 million and $0.1 million. The gains or losses resulting from a 10% change in currency exchange rates would be approximately $0.2 million and $0.2 million, respectively.
ITEM 8. CONSOLIDATED FINANCIAL STATEMENTS AND SUPPLEMENTARY DATA See Item 15(a) for an index to the consolidated financial statements, which are incorporated here by reference.
ITEM 9. CHANGES IN AND DISAGREEMENTS WITH ACCOUNTANTS ON ACCOUNTING AND FINANCIAL DISCLOSURE
None.
ITEM 9A. CONTROLS AND PROCEDURES Attached as exhibits to this Form 10-K are certifications of the Company’s Chief Executive Officer and Chief Financial Officer, which are required in accordance with Rule 13a-14 of the Securities Exchange Act of 1934, as amended (the “Exchange Act”). This “Controls and Procedures” section includes information concerning the controls and controls evaluation referred to in the certifications. Part IV, Item 15 of this Form 10-K, sets forth the report of Deloitte & Touche LLP, our independent registered public accounting firm, regarding its audit of the Company’s internal control over financial reporting set forth below in this section. This section should be read in conjunction with the certifications and the Deloitte & Touche LLP report for a more complete understanding of the topics presented.
Evaluation of Disclosure Controls and Procedures
The Company, under the supervision and with the participation of its management, including the Chief Executive Officer and Chief Financial Officer, evaluated the effectiveness of the design and operation of the Company’s disclosure controls and procedures (as defined in Rules 13a-15(e) and 15d-15(e) of the Exchange Act). Based on the evaluation, the Chief Executive Officer and Chief Financial Officer concluded that the Company’s disclosure controls and procedures were effective as of September 30, 2013. There has been no change in the Company’s internal control over financial reporting during the fourth quarter of the fiscal year ended September 30, 2013, that has materially affected, or is reasonably likely to materially affect, the Company’s internal control over financial reporting.

48
Management Report on Internal Control Over Financial Reporting
The Company’s management is responsible for establishing and maintaining adequate internal control over financial reporting to provide reasonable assurance regarding the reliability of the Company’s financial reporting and the preparation of financial statements for external purposes in accordance with Generally Accepted Accounting Principles. Internal control over financial reporting includes those policies and procedures that (i) pertain to the maintenance of records, that in reasonable detail accurately and fairly reflect the transactions and dispositions of the assets of the Company; (ii) provide reasonable assurance that transactions are recorded as necessary to permit preparation of financial statements in accordance with Generally Accepted Accounting Principles, and that receipts and expenditures of the Company are being made only in accordance with authorizations of management and directors of the Company; and (iii) provide reasonable assurance regarding prevention or timely detection of unauthorized acquisition, use or disposition of the Company’s assets that could have a material effect on the financial statements.
Management assessed the Company’s internal control over financial reporting as of September 30, 2013, the end of its fiscal year. Management based its assessment on criteria established in “Internal Control - Integrated Framework” (1992) issued by the Committee of Sponsoring Organizations of the Treadway Commission. Management’s assessment included evaluation of such elements as the design and operating effectiveness of key financial reporting controls, process documentation, accounting policies, and the Company’s overall control environment. This assessment is supported by testing and monitoring performed by the Company’s Internal Audit organization. Based on its assessment, management has concluded that the Company’s internal control over financial reporting was effective as of the end of the fiscal year to provide reasonable assurance regarding the reliability of financial reporting and the preparation of financial statements for external reporting purposes in accordance with Generally Accepted Accounting Principles. Management reviewed the results of its assessment with the Audit Committee of the Company’s Board of Directors.
The Company’s independent registered public accounting firm, Deloitte & Touche LLP, independently assessed the effectiveness of the Company’s internal control over financial reporting. Deloitte & Touche LLP has issued an attestation report concurring with management’s assessment, which is included at the beginning of Part IV, Item 15 of this Annual Report on Form 10-K.
The Company’s management does not expect that the internal controls over financial reporting will prevent or detect all errors and all fraud. A control system, no matter how well designed and operated, can provide only reasonable, not absolute, assurance that the objectives of the control system are met. Further, the design of a control system must reflect the fact that there are resource constraints, and the benefits of controls must be considered relative to their costs. Due to the inherent limitations in all control systems, no evaluation of controls can provide absolute assurance that all control issues, errors and instances of fraud, if any, within the Company have been or will be detected.
ITEM 9B. OTHER INFORMATION None.
PART III
ITEM 10. DIRECTORS, EXECUTIVE OFFICERS AND CORPORATE GOVERNANCE The information required by this item is included in the “Election of Directors”, “Directors and Executive Officers”, “Section 16(a) Beneficial Ownership Reporting Compliance”, and “Committees of the Board of Directors; Meetings and Compensation of Directors”, sections of the Company’s Proxy Statement to be filed in connection with the Company’s 2014 Annual Meeting of Stockholders to be held in March 2014, and is incorporated by reference herein.
ITEM 11. EXECUTIVE COMPENSATION The information required by this item is included in the “Executive Compensation and Related Information” section of the Company’s Proxy Statement to be filed in connection with the Company’s 2014 Annual Meeting of Stockholders to be held in March 2014, and is incorporated by reference herein.

49
ITEM 12. SECURITY OWNERSHIP OF CERTAIN BENEFICIAL OWNERS AND MANAGEMENT AND RELATED STOCKHOLDER MATTERS
The following table sets forth the number of securities authorized for issuance under our equity compensation plans at September 30, 2013:
Number of securitiesto be issued upon
exercise ofoutstanding options,warrants and rights
Weighted-averageexercise price of
outstandingoptions, warrants
and rights
Number of securitiesremaining available for
future issuance underequity compensation
plans (excludingsecurities reflected in
column (a)) (a) (b) (c)Equity compensation plans approved bysecurity holders:
2002 Equity Incentive Plan 987,700 2/20/2004 —2007 Incentive Stock Plan 2,122,150 * 1/28/2004 1,097,500
Total equity compensation plans approved bysecurity holders 3,109,850 3/25/2004 1,097,500Equity compensation plans not approved bysecurity holders — — —Total 3,109,850 3/25/2004 1,097,500
The remaining information required by this is included in the “Security Ownership of Certain Beneficial Owners” and “Management” sections of the Company’s Proxy Statement to be filed in connection with the Company’s 2014 Annual Meeting of Stockholders to be held in March 2014, and is incorporated by reference herein.
* Does not include 60,000 shares that were issued as the annual grants of shares of common stock to outside Board of Directors.
ITEM 13. CERTAIN RELATIONSHIPS AND RELATED TRANSACTIONS, AND DIRECTOR INDEPENDENCE
The information required by this item is included in the “Compensation Committee”, “Compensation Committee Interlocks and Insider Participation”, and “Certain Relationships and Related Transactions” sections of the Company’s Proxy Statement to be filed in connection with the Company’s 2014 Annual Meeting of Stockholders to be held in March 2014, and is incorporated by reference herein. The main facility in Starnberg is rented under a 25-year operating lease from the former minority shareholder of ROFIN-BAASEL Lasertech GmbH & Co. KG (“CBL”), Mr. Baasel, who is also a member of the Board of Directors of the Company, and includes a clause to terminate the lease contract upon two-year notice. The Company paid expenses, mainly for rental expenses, $0.8 million to Mr. Baasel during fiscal years 2013 and 2012, and $0.9 million during fiscal year 2011. The Company believes that all transactions noted above, have been executed on an arms-length basis. Except for the foregoing, no director, officer, nominee director, 5% holder of the Company’s shares, or immediate family member, associate or affiliate thereof, had any material interest, direct or indirect, in any transaction since the beginning of fiscal year 2013 or has any material interest, direct or indirect, in any proposed transaction, having a value of $60,000 or more.
Indebtedness of Officers and Directors Since the beginning of fiscal year 2004, there has been no indebtedness to the Company by any director or officer or associates of any such person, other than reimbursements for purchases, for ordinary travel and expense advances and for other transactions in the ordinary course of business.

50
ITEM 14. PRINCIPAL ACCOUNTANT FEES AND SERVICES The information set forth under “Independent Public Accountants” in the definitive form of the Company’s Proxy Statement to be filed in connection with the Company’s 2014 Annual Meeting of Stockholders to be held in March 2014, is incorporated by reference herein.

51
PART IV
ITEM 15. EXHIBITS AND FINANCIAL STATEMENT SCHEDULES
a. 1 Consolidated Financial Statements The following financial statements are filed as part of this Form 10-K: Report of Independent Registered Public Accounting Firm Consolidated Balance Sheets as of September 30, 2013, and 2012 Consolidated Statements of Operations for the years ended September 30, 2013, 2012, and 2011
Consolidated Statements of Comprehensive Income for the years endedSeptember 30, 2013, 2012, and 2011
Consolidated Statements of Stockholders’ Equity for the years ended September 30, 2013, 2012, and 2011 Consolidated Statements of Cash Flows for the years ended September 30, 2013, 2012, and 2011 Notes to Consolidated Financial Statements 2 Financial Statement Schedules Schedule II – Valuation and Qualifying Accounts Schedules not listed above have been omitted because the matter or conditions are not present or the
information required to be set forth therein is included in the Consolidated Financial Statements hereto. 3 Exhibits The exhibits listed in the accompanying index to exhibits are filed or incorporated by reference as part of
this Annual Report.
F-1F-2
F-4
F-5
F-6
F-7F-8
F-33

52
EXHIBITNUMBER DESCRIPTION
3.1 Certificate of Incorporation of the Company and Form of Certificate of Amendment thereto (*)
3.2 By-Laws of the Company, As Amended Through November 29, 2011 (*******)
4.1 Form of Rights Agreement (*)
10.1 Form of Sale and Transfer Agreement between Siemens Aktiengesellschaft and ROFIN-SINARTechnologies Inc. (*)
10.2 Form of Sale and Transfer Agreement by and among Siemens Power Corporation and ROFIN-SINARTechnologies Inc. (*)
10.3 Form of Tax Allocation and Indemnification Agreement among ROFIN-SINAR Technologies Inc.,ROFIN-SINAR, Inc., Siemens Corporation, and Siemens Power Corporation (*)
10.4 Joint Venture Agreement, dated as of May 27, 1992, by and among ROFIN-SINAR Laser GmbH,Marubeni Corporation and Nippei Toyama Corporation (*)
10.5 Cooperation Agreement, dated as of May 27, 1992, among Nippei Toyama Corporation, ROFIN-SINARLaser GmbH, and Marubeni Corporation (*)
10.6 Cooperation Agreement, dated as of May 27, 1992, among ROFIN-SINAR Laser GmbH, MarubeniCorporation, and Nippei Toyama Corporation (*)
10.7 Inheritable Building Right (Erbbaurecht), dated as of March 1, 1990, between ROFIN-SINAR LaserGmbH and Lohss GmbH (in German, English summary provided) (*)
10.8 Lease Agreement, dated August 10, 1990, between Josef and Maria Kranz and ROFIN-SINAR LaserGmbH (in German, English summary provided) (*)
10.9 Lease Agreement, dated March 25, 1993, between DR Group and ROFIN-SINAR, Incorporated (ConceptDrive property) (*)
10.10 ROFIN-SINAR Laser GmbH Pension Plan (in German, English summary provided) (*) (a)
10.11 Form of 1996 Equity Incentive Plan (*) (a)
10.12 Form of 1996 Non-Employee Directors’ Stock Plan (*) (a)
10.13 Deutsche Bank AG Commitment Letter dated August 22, 1996 (*)
10.14 Form of Employment Agreement, dated as of September 2, 1996, among Peter Wirth, ROFIN-SINARLaser GmbH, and ROFIN-SINAR Technologies Inc. (in German, English summary provided) (a)
10.15 Form of Employment Agreement, dated as of September 2, 1996, among Gunther Braun, ROFIN-SINARLaser GmbH, and ROFIN-SINAR Technologies Inc. (in German, English summary provided) (*) (a)
10.16 English Translation of Acquisition Agreement, dated as of April 29, 2000, by and between MannesmannDemag Krauss-Maffei AG and ROFIN-SINAR Laser GmbH (***)
10.17 English Translation of Option Agreement between Carl Baasel and ROFIN-SINAR Laser GmbH (**)

53
EXHIBIT NUMBER
DESCRIPTION
10.18 Lease Agreement between Carl Baasel and ROFIN-SINAR Laser GmbH (**) 10.19 2002 Equity Incentive Plan (****) (a) 10.20 2007 Incentive Stock Plan (******) (a) 14.1 Code of Business Ethics (*****) 21.1 List of Subsidiaries of the Registrant 23.1 Consent of Deloitte & Touche, LLP Independent Registered Public Accounting Firm 31.1 Rule 13a-14(a)/15d-14(a) Certification of Chief Executive Officer 31.2 Rule 13a-14(a)/15d-14(a) Certification of Chief Financial Officer 32.1 Section 1350 Certification of Chief Executive Officer 32.2 Section 1350 Certification of Chief Financial Officer
101
Interactive Data File In accordance with Rule 406T of Regulation S-T promulgated by the Securities and Exchange Commission, Exhibit 101 is deemed not filed or part of a registration statement or prospectus for purposes of Section 11 or 12 of the Securities Act of 1933, is deemed not filed for purposes of Section 18 of the Securities Exchange Act of 1934, and otherwise is not subject to liability under these sections.
(*) Incorporated by reference to the exhibits filed with the Company’s Registration Statement on Form S-1
(File No. 333-09539) which was declared effective on September 25, 1996. (**) Incorporated by reference to the exhibit filed with the Company’s Current Report on Form 8-K filed with
the Securities and Exchange Commission on May 24, 2000. (***) Incorporated by reference to the exhibit filed with the Company’s Annual Report on Form 10-K/A filed
with the Securities and Exchange Commission on January 18, 2001. (****) Incorporated by reference to the exhibit filed with the Company’s Annual Report on Form 10-K filed with
the Securities and Exchange Commission on December 23, 2003. (*****) Incorporated by reference to the exhibit filed with the Company’s Proxy Statement on Schedule 14A filed
with the Securities and Exchange Commission on January 30, 2004.
(******) Incorporated by reference to the exhibit filed with the Company’s Proxy Statement on Schedule 14A filed with the Securities and Exchange Commission on January 25, 2007, and as amended by the Company's Current Report on Form 8-K filed with the Securities and Exchange Commission on March 2, 2011.
(*******) Incorporated by reference to the exhibit filed with the Company’s Annual Report on Form 10-K filed with the Securities and Exchange Commission on November 29, 2011.
(a) Management contracts and compensatory plans and arrangements required to be filed as exhibits pursuant to Item 15(c) of this Report.

54
SIGNATURES Pursuant to the requirements of Section 13 or 15(d) of the Securities Exchange Act of 1934, the registrant has duly caused this report to be signed on its behalf by the undersigned, thereunto duly authorized.
Date: November 29, 2013 ROFIN-SINAR TECHNOLOGIES INC. By: /s/ Günther Braun Günther Braun President, Chief Executive Officer, and Director
Pursuant to the requirements of the Securities Act of 1934, this report has been signed below by the following persons on behalf of the registrant and in the capacities and on the dates indicated.
SIGNATURE TITLE DATE /s/ Peter Wirth Chairman of the Board November 29, 2013
Peter Wirth /s/ Günther Braun President, Chief Executive Officer, November 29, 2013
Günther Braun and Director /s/ Ingrid Mittelstaedt Chief Financial Officer November 29, 2013
Ingrid Mittelstaedt
/s/ Ralph Reins Director November 29, 2013Ralph Reins
/s/ Gary Willis Director November 29, 2013
Gary Willis /s/ Carl F. Baasel Director November 29, 2013
Carl F. Baasel
/s/ Daniel Smoke Director November 29, 2013Daniel Smoke
/s/ Stephen Fantone Director November 29, 2013
Stephen Fantone

F-1
REPORT OF INDEPENDENT REGISTERED PUBLIC ACCOUNTING FIRM
To the Board of Directors and Stockholders ofROFIN-SINAR Technologies Inc. and Subsidiaries
Plymouth, Michigan
We have audited the accompanying consolidated balance sheets of ROFIN-SINAR Technologies Inc. and subsidiaries (the "Company") as of September 30, 2013 and 2012, and the related consolidated statements of operations, comprehensive income, stockholders' equity, and cash flows for each of the three years in the period ended September 30, 2013. Our audits also included the financial statement schedule listed in the Index at Item 15 (the “financial statement schedule”). We also have audited the Company's internal control over financial reporting as of September 30, 2013, based on criteria established in Internal Control - Integrated Framework (1992) issued by the Committee of Sponsoring Organizations of the Treadway Commission. The Company's management is responsible for these financial statements and financial statement schedule, for maintaining effective internal control over financial reporting, and for its assessment of the effectiveness of internal control over financial reporting, included in the accompanying Management Report on Internal Control Over Financial Reporting. Our responsibility is to express an opinion on these financial statements and financial statement schedule and an opinion on the Company's internal control over financial reporting based on our audits.
We conducted our audits in accordance with the standards of the Public Company Accounting Oversight Board (United States). Those standards require that we plan and perform the audit to obtain reasonable assurance about whether the financial statements are free of material misstatement and whether effective internal control over financial reporting was maintained in all material respects. Our audits of the financial statements included examining, on a test basis, evidence supporting the amounts and disclosures in the financial statements, assessing the accounting principles used and significant estimates made by management, and evaluating the overall financial statement presentation. Our audit of internal control over financial reporting included obtaining an understanding of internal control over financial reporting, assessing the risk that a material weakness exists, testing and evaluating the design and operating effectiveness of internal control based on the assessed risk. Our audits also included performing such other procedures as we considered necessary in the circumstances. We believe that our audits provide a reasonable basis for our opinions.
A company's internal control over financial reporting is a process designed by, or under the supervision of, the company's principal executive and principal financial officers, or persons performing similar functions, and effected by the company's board of directors, management, and other personnel to provide reasonable assurance regarding the reliability of financial reporting and the preparation of financial statements for external purposes in accordance with generally accepted accounting principles. A company's internal control over financial reporting includes those policies and procedures that (1) pertain to the maintenance of records that, in reasonable detail, accurately and fairly reflect the transactions and dispositions of the assets of the company; (2) provide reasonable assurance that transactions are recorded as necessary to permit preparation of financial statements in accordance with generally accepted accounting principles and that receipts and expenditures of the company are being made only in accordance with authorizations of management and directors of the company; and (3) provide reasonable assurance regarding prevention or timely detection of unauthorized acquisition, use, or disposition of the company's assets that could have a material effect on the financial statements.
Because of the inherent limitations of internal control over financial reporting, including the possibility of collusion or improper management override of controls, material misstatements due to error or fraud may not be prevented or detected on a timely basis. Also, projections of any evaluation of the effectiveness of the internal control over financial reporting to future periods are subject to the risk that the controls may become inadequate because of changes in conditions, or that the degree of compliance with the policies or procedures may deteriorate.
In our opinion, the consolidated financial statements referred to above present fairly, in all material respects, the financial position of ROFIN-SINAR Technologies Inc. and subsidiaries as of September 30, 2013 and 2012, and the results of their operations and their cash flows for each of the three years in the period ended September 30, 2013, in conformity with accounting principles generally accepted in the United States of America. Also, in our opinion, such financial statement schedule, when considered in relation to the basic consolidated financial statements taken as a whole, presents fairly, in all material respects, the information set forth therein. Also, in our opinion, the Company maintained, in all material respects, effective internal control over financial reporting as of September 30, 2013, based on the criteria established in Internal Control - Integrated Framework (1992) issued by the Committee of Sponsoring Organizations of the Treadway Commission.
/s/ Deloitte & Touche LLP
Detroit, MI
November 29, 2013

F-2
ROFIN-SINAR TECHNOLOGIES INC. AND SUBSIDIARIESCONSOLIDATED BALANCE SHEETS(dollars in thousands, except share data)
September 30, 2013 2012ASSETS Current assets:
Cash and cash equivalents $ 133,733 $ 98,735Short-term investments 3,244 2,428Accounts receivable, trade 114,088 111,850Less allowance for doubtful accounts (3,423) (3,915)
Trade accounts receivable, net 110,665 107,935Accounts receivable from related party (note 14) 5 313Other accounts receivable 7,893 5,103Inventories, net (note 3) 198,460 202,188Prepaid expenses 4,474 5,823Deferred income tax assets (note 11) 22,818 16,997
Total current assets 481,292 439,522
Long-term investments (note 4) 1,900 3,200Property and equipment, at cost (note 5) 180,397 161,249
Less accumulated depreciation (93,485) (81,248)Property and equipment, net 86,912 80,001
Deferred income tax assets (note 11) 13,446 13,970Goodwill (note 6) 104,404 101,615Intangibles, net (note 6) 10,674 11,938Other assets 1,282 2,286
Total assets $ 699,910 $ 652,532
LIABILITIES AND EQUITY Current liabilities:
Line of credit and short-term borrowings (note 8 and 9) $ 3,709 $ 16,883Accounts payable, trade 24,596 26,644Accounts payable to related party (note 14) 331 98Income taxes payable (note 11) 5,290 7,049Deferred income tax liabilities (note 11) 4,651 1,011Accrued liabilities (note 7) 69,937 69,010
Total current liabilities 108,514 120,695
Long-term debt (note 9) 14,913 5,662Pension obligations (note 12) 24,070 23,253Deferred income tax liabilities (note 11) 5,040 4,746Other long-term liabilities 3,955 4,257
Total liabilities 156,492 158,613Commitments and contingencies (note 10)

F-3
Stockholders’ equity: Preferred stock, 5,000,000 shares authorized, none issued or outstanding — —Common stock, $0.01 par value, 50,000,000 shares authorized,
32,725,950 shares issued at September 30, 2013 (32,495,500 shares issued atSeptember 30, 2012) 327 325
Additional paid-in capital 228,124 223,339Retained earnings 462,808 428,053Accumulated other comprehensive income (loss) 11,533 (4,236)Treasury shares, at cost, 4,601,681 shares at September 30, 2013 (4,422,536 at September30, 2012) (163,026) (158,904)
Total ROFIN-SINAR Technologies Inc. stockholders’ equity 539,766 488,577Noncontrolling interest in subsidiaries 3,652 5,342
Total equity 543,418 493,919Total liabilities and equity $ 699,910 $ 652,532
See accompanying notes to consolidated financial statements

F-4
ROFIN-SINAR TECHNOLOGIES INC. AND SUBSIDIARIESCONSOLIDATED STATEMENTS OF OPERATIONS
YEARS ENDED SEPTEMBER 30, 2013, 2012, AND 2011(dollars in thousands, except share and per share amounts)
Years ended September 30, 2013 2012 2011Net sales $ 560,068 $ 540,121 $ 597,763Cost of goods sold 363,559 343,769 365,684
Gross profit 196,509 196,352 232,079
Selling, general and administrative expenses 101,726 101,088 107,510Research and development expenses 43,014 42,604 38,337Amortization expense 2,553 2,279 2,569
Income from operations 49,216 50,381 83,663
Other expense (income): Interest income (541) (692) (868)Interest expense 595 681 733Foreign currency losses (gains) 452 (1,358) (1,946)Miscellaneous (445) (642) (1,399)
Total other expense (income), net 61 (2,011) (3,480)
Income before income taxes 49,155 52,392 87,143Income tax expense (note 11) 14,139 17,180 26,070
Net income 35,016 35,212 61,073Less: net income attributable to the noncontrolling interest 261 682 1,041
Net income attributable to RSTI $ 34,755 $ 34,530 $ 60,032
Net income attributable to RSTI per share (note 13): Per Share of Common Stock Basic $ 1.23 $ 1.21 $ 2.11Per Share of Common Stock Diluted $ 1.22 $ 1.20 $ 2.06
Weighted average shares used in computing earnings per share (note 13): Basic 28,188,849 28,498,395 28,440,185Diluted 28,391,762 28,744,267 29,104,945
See accompanying notes to consolidated financial statements

F-5
ROFIN-SINAR TECHNOLOGIES INC. AND SUBSIDIARIESCONSOLIDATED STATEMENTS OF COMPREHENSIVE INCOME
YEARS ENDED SEPTEMBER 30, 2013, 2012, AND 2011(dollars in thousands)
Years ended September 30, 2013 2012 2011Net income $ 35,016 $ 35,212 $ 61,073
Other comprehensive income (loss):Fair value of interest rate swap agreements, net of tax expense of $25 and taxbenefits of $5 and $43 80 (9) (151)Foreign currency translation adjustments 14,830 (11,133) (4,221)Defined benefit pension plans, net of tax expense of $619 and tax benefit of$1,679 and $2 (note 12) 859 (3,540) 419
Other comprehensive income (loss), net of tax $ 15,769 $ (14,682) $ (3,953) Total comprehensive income $ 50,785 $ 20,530 $ 57,120
Less: Total comprehensive income attributable to the noncontrolling interest 261 682 1,041Total comprehensive income attributable to RSTI $ 50,524 $ 19,848 $ 56,079
See accompanying notes to consolidated financial statements

F-6
ROFIN-SINAR TECHNOLOGIES INC. AND SUBSIDIARIESCONSOLIDATED STATEMENTS OF STOCKHOLDERS’ EQUITY
YEARS ENDED SEPTEMBER 30, 2013, 2012, AND 2011(dollars in thousands, except share data)
Number ofCommon
SharesOutstanding
CommonStock
Par Value
AdditionalPaid-inCapital
RetainedEarnings
AccumulatedOther
ComprehensiveIncome (Loss)
TreasuryStock
ROFIN-SINAR
TechnologiesStockholders’
Equity
Non-Controlling
InterestsTotal
Equity
BALANCES at September 30, 2010 28,267,996 $ 320 $ 205,100 $ 333,491 $ 14,399 $ (139,453) $ 413,857 $ 3,619 $ 417,476
Total comprehensive income (loss) 60,032 (3,953) 56,079 1,041 57,120
Common stock issued in connection withStock Incentive Plans 452,600 4 12,796 — — — 12,800 — 12,800
Purchases of treasury stock (233,837) — — — — (8,779) (8,779) — (8,779)
BALANCES at September 30, 2011 28,486,759 $ 324 $ 217,896 $ 393,523 $ 10,446 $ (148,232) $ 473,957 4,660 $ 478,617
Total comprehensive income (loss) 34,530 (14,682) 19,848 682 20,530
Common stock issued in connection withStock Incentive Plans 91,400 1 5,443 — — — 5,444 — 5,444
Purchases of treasury stock (505,195) — — — — (10,672) (10,672) — (10,672)
BALANCES at September 30, 2012 28,072,964 $ 325 $ 223,339 $ 428,053 $ (4,236) $ (158,904) $ 488,577 $ 5,342 $ 493,919
Total comprehensive income (loss) 34,755 15,769 — 50,524 261 50,785
Purchase of non-controlling interest — — (2,332) — — — (2,332) (1,951) (4,283)
Common stock issued in connection withStock Incentive Plans 230,450 2 7,117 — — — 7,119 — 7,119
Purchases of treasury stock (179,145) — — — — (4,122) (4,122) — (4,122)
BALANCES at September 30, 2013 28,124,269 $ 327 $ 228,124 $ 462,808 $ 11,533 $ (163,026) $ 539,766 $ 3,652 $ 543,418
See accompanying notes to consolidated financial statements

F-7
ROFIN-SINAR TECHNOLOGIES INC. AND SUBSIDIARIESCONSOLIDATED STATEMENTS OF CASH FLOWS
YEARS ENDED SEPTEMBER 30, 2013, 2012, AND 2011(dollars in thousands)
Years ended September 30, 2013 2012 2011CASH FLOWS FROM OPERATING ACTIVITIES: Net income $ 35,016 $ 35,212 $ 61,073Adjustments to reconcile net income to net cash provided by operating activities:
Depreciation and amortization 15,318 13,924 13,027Issuance of restricted stock 245 222 311Provision for doubtful accounts 156 1,176 1,606Exchange rate gains 540 (1,356) (914)Loss on disposal of property and equipment 398 151 135Stock-based compensation expenses 3,929 4,466 5,200Deferred income taxes (2,542) (1,744) (3,441)Change in operating assets and liabilities:
Accounts receivable, trade (469) 7,594 (21,349)Other accounts receivable (2,698) 120 (1,427)Inventories 10,068 (18,172) (27,529)Prepaid expenses and other 1,582 (1,958) (4,186)Accounts payable (2,247) (94) 2,718Income taxes payable (1,320) (6,185) 6,961Accrued liabilities and pension obligations (952) (11,380) 17,786
Net cash provided by operating activities 57,024 21,976 49,971CASH FLOWS FROM INVESTING ACTIVITIES:
Additions to property and equipment (16,168) (27,283) (21,779)Proceeds from the sale of property and equipment 128 173 418Purchases of short-term investments (6,253) (8,707) (8,640)Sales of short-term and long-term investments 6,771 9,841 12,648Acquisition of businesses, net of cash acquired — (13,413) (11,161)
Net cash used in investing activities (15,522) (39,389) (28,514)CASH FLOWS FROM FINANCING ACTIVITIES:
Proceeds from the issuance of long term debt 20,878 10,949 6,253Repayments to bank (24,869) (10,483) (9,498)Purchase of treasury stock (4,122) (10,672) (8,779)Issuance of common stock 2,945 460 7,153Excess tax benefit from stock options 2 295 136Payments to subsidiary’s minority shareholders (4,262) — —
Net cash used in financing activities (9,428) (9,451) (4,735)Effect of foreign currency translation on cash 2,924 (1,813) 62
Net increase (decrease) in cash and cash equivalents 34,998 (28,677) 16,784Cash and cash equivalents at beginning of year 98,735 127,412 110,628Cash and cash equivalents at end of year $ 133,733 $ 98,735 $ 127,412
Cash paid during the year for interest $ 614 $ 714 $ 673Cash paid during the year for income taxes $ 21,560 $ 24,812 $ 21,060
See accompanying notes to consolidated financial statements

F-8
ROFIN-SINAR TECHNOLOGIES INC. AND SUBSIDIARIESNOTES TO CONSOLIDATED FINANCIAL STATEMENTS
September 30, 2013, 2012, and 2011(dollars in thousands, except per share amounts)
1. SUMMARY OF ACCOUNTING POLICIES Description of the Company and Business The primary business of ROFIN-SINAR Technologies Inc. (“ROFIN” or “RSTI” or “the Company”) is to develop, manufacture, and market industrial lasers and supplies used for material processing applications. The majority of the Company’s customers are in the machine tool, automotive, semiconductor, and electronics industries and are located in the United States, Europe, and Asia. For the years ended September 30, 2013, 2012, and 2011, ROFIN generated approximately 61%, 61%, and 64%, respectively, of its revenues from the sale of lasers and laser systems. For the years ended September 30, 2013, 2012, and 2011, approximately 39%, 39%, and 36%, respectively, of its revenues were generated from sales of after-sales services, replacement parts, and components for laser products. The accompanying financial statements present the historical financial information of ROFIN-SINAR Technologies Inc., its wholly-owned subsidiaries ROFIN-SINAR, Inc. (“RS Inc.”), PRC Laser Corp. (“PRC”), Lee Laser, Inc. (“Lee”), ROFIN-BAASEL Canada Ltd., DILAS Diode Laser, Inc., Corelase Oy, Nufern, ROFIN-SINAR Technologies Europe S.L. (“RSTE”), Nanjing Eastern Technologies Company, Ltd. (“NETC”) and its 80%-owned subsidiaries Nanjing Eastern Laser Company, Ltd. (“NELC”). RSTE, a European holding company formed in 1999, owns 100% of ROFIN-SINAR Laser GmbH (“RSL”), 95% of DILAS Diodenlaser GmbH (“DILAS”), 100% of ROFIN-BAASEL Italiana S.r.l., 100% of ROFIN-BAASEL France SAS, 100% of ROFIN-SINAR UK Ltd., 100% of ROFIN-BAASEL UK Ltd., 100% of ROFIN-BAASEL Benelux B.V., 100% of ROFIN-BAASEL Singapore Pte., Ltd., 100% of ROFIN-BAASEL Espana S.L. (“RBE”), 100% of ROFIN-BAASEL Taiwan Ltd., 100% of ROFIN-BAASEL Korea Co., Ltd., 100% of ROFIN-LASAG AG (“LASAG”) and 100% of ROFIN-BAASEL Swiss AG. ROFIN-BAASEL UK Ltd. owns 100% of ES Technology Ltd. (which was merged with Laser Service Ltd in May 2011). The financial statements of PRC include the consolidated accounts of PRC Laser Europe N.V., Belgium. RSL includes the consolidated accounts of its 88%-owned subsidiary, ROFIN-BAASEL Japan Corp., its 100%-owned subsidiary, Rasant-Alcotec Beschichtungstechnik GmbH (“Rasant”), its 100%-owned subsidiary, ROFIN-BAASEL Lasertech GmbH & Co. KG (“CBL”), its 100%-owned subsidiary Optoskand AB (“Optoskand”), its 100%-owned subsidiary, CBL Verwaltungsgesellschaft mbH, its 90%-owned subsidiary m2k-laser GmbH (“m2k“), its 100%-owned subsidiary ROFIN BAASEL Laser India Pvt. Ltd., and its 100%-owned subsidiary ROFIN-BAASEL China Co., Ltd. CBL includes the consolidated accounts of its wholly-owned subsidiaries, ROFIN-BAASEL, Inc. (“RB Inc.”), WB-PRC Laser Service GmbH, Baasel Lasermed GmbH, and PMB Elektronik GmbH (which was merged with H2B Photonics GmbH in May 2012). DILAS includes the consolidated accounts of its 95%-owned subsidiary DILAS Diodelaser China Co., Ltd. All intercompany balances and transactions have been eliminated in consolidation.
Acquisitions and Formation of New Entities The Company uses the acquisition method of accounting for its acquisitions with the respective results of operations included in the consolidated results from the date of acquisition.
• Effective October 15, 2010, the Company acquired 100% of the common stock of LASAG AG, Thun (Switzerland) (“LASAG”), through its wholly-owned subsidiary RSTE. Additionally, the Company acquired the LASAG sales and service operations in Germany, Italy, Japan, and the United States. LASAG is one of the original laser companies with more than 30 years of experience in the development and manufacturing of industrial solid-state lasers. LASAG markets and sells its laser products for fine cutting, spot welding, drilling, and scribing applications to the medical device, automotive, electronic, and aerospace industries. In addition, LASAG has special expertise in high-precision drilling and laser processing heads. This purchase resulted in goodwill of $1.6 million and other intangibles, net of $2.3 million.

F-9
• Effective August 24, 2011, the Company formed ROFIN BAASEL Laser India Pvt. Ltd. in Mumbai (India) as a wholly-owned subsidiary through its wholly-owned subsidiaries ROFIN-SINAR Laser GmbH (99%) and ROFIN-BAASEL Lasertech GmbH & Co KG (1%). It started its operations in October 2011 and is responsible for sales and service of ROFIN laser products in India.
• On each of October 26, 2011, and March 12, 2012, the Company purchased an additional 5% of the share capital of m2k-laser GmbH through ROFIN-SINAR Laser GmbH under an option agreement between the Company and the minority shareholders of m2k-laser GmbH. As a result of those share purchases, the Company currently holds 90% of the share capital of m2k-laser GmbH.
• Effective March 28, 2007, the Company acquired 100% of the common stock of Corelase Oy, Tampere (Finland). Corelase Oy has considerable experience in semiconductors, optics, and fiber technology. Its product lines include ultrashort pulse, mode-locked fiber laser systems, fiber laser modules, and other components. The terms of the purchase included payment of a deferred purchase price based on Corelase Oy achieving certain financial targets. On December 14, 2011, the Company finalized and paid the deferred purchase price. This payment resulted in additional goodwill of $13.4 million.
• Effective September 29, 2011, the Company received the remaining 15% of the share capital of H2B Photonics GmbH through a transfer of shares and now holds 100% of the share capital. In May 2012, the Company merged its wholly-owned subsidiary PMB Elektronik GmbH with H2B and named the new formed subsidiary PMB Elektronik GmbH.
• Effective December 20, 2012, the Company acquired the remaining 20% of the common stock of ROFIN-BAASEL China Co., Ltd. through its wholly-owned subsidiary RSL. The Company currently holds 100% of the share capital of ROFIN-BAASEL China Co., Ltd.
• Effective January 8, 2013, the Company acquired the remaining 20% of the common stock of Nanjing Eastern Technologies Company, Ltd. The Company currently holds 100% of the share capital of Nanjing Eastern Technologies Company, Ltd.
None of these acquisitions were material for the purpose of proforma presentation.
Fair Value The Company’s cash, short-term investments, accounts receivable, and accrued liabilities are carried at amounts, that reasonably approximate their fair value due to their short-term nature. The Company’s notes payable are at variable interest rates that approximate market. Fair value is defined as the price that would be received to sell an asset or paid to transfer a liability in an orderly transaction between market participants at the measurement date. Where available, fair value is based on observable market prices or parameters or derived from such prices or parameters. Where observable prices or inputs are not available, valuation models may be applied.
Assets and liabilities recorded at fair value in our balance sheet are categorized based upon the level of judgment associated with the inputs used to measure their fair values. Hierarchical levels are directly related to the amount of subjectivity associated with the inputs to fair valuation of these assets and liabilities and are as follows:
• Level 1 - Unadjusted observable quoted prices for identical instruments in active markets.
• Level 2 - Observable inputs other than those included in Level 1. For example, quoted prices for similar assets or liabilities in active markets or quoted prices for identical assets or liabilities in inactive markets.
• Level 3 - Unobservable inputs reflecting management's own assumptions about the inputs used in pricing the asset or liability.
Cash Equivalents Cash equivalents consist of financial instruments that are readily convertible into cash and have original maturities of three months or less at the time of acquisition.

F-10
Inventories Inventories are stated at the lower of cost or market, after provisions for excess and obsolete inventory salable at prices below cost. Costs are determined using the first-in, first-out and weighted average cost methods. The Company writes down inventory for estimated obsolescence or unmarketable inventory equal to the difference between the cost of inventory and the estimated market value based upon assumptions about future demand and market conditions. If actual market conditions are less favorable than those projected by management, additional inventory write-downs may be required. We also write-down up to ninety percent of our total demo inventory costs over thirty six months.
Property and Equipment Property and equipment are recorded at cost and depreciated over their estimated useful lives, except for leasehold improvements, which are amortized over the lesser of their estimated useful lives or the term of the lease. The methods of depreciation are straight line for financial reporting purposes and accelerated for income tax purposes. Depreciable lives for financial reporting purposes are as follows:
Useful LivesBuildings 40 YearsTechnical machinery and equipment 3-10 YearsFurniture and fixtures 3-10 YearsComputers and software 3-4 YearsLeasehold improvements Term of lease
Total depreciation expense for the years ended September 30, 2013, 2012, and 2011, amounted to $12,765, $11,646, and $10,458, respectively.
The Company reviews long-lived assets for impairment whenever events or changes in circumstances indicate that the carrying amount of an asset may not be recoverable. Recoverability of assets to be held and used is measured by a comparison of the carrying amount of an asset to future undiscounted net cash flows expected to be generated by the asset. If such assets are considered to be impaired, the impairment to be recognized is measured by the amount by which the carrying amount of the assets exceeds the fair value of the assets. Assets to be disposed of are reported at the lower of the carrying amount or fair value less costs to sell.
Goodwill and Other Intangible Assets Goodwill represents the excess purchase price over the fair value of the assets acquired in connection with the Company’s acquisitions. Goodwill is required to be tested on an annual basis for potential impairment at the reporting unit level. A reporting unit is defined as the lowest level of an entity that is a business and that can be distinguished, physically and operationally and for internal reporting purposes, from other activities, operations, and assets of the entity. A reporting unit can be no higher than an operating segment and would generally be lower than that level of reporting. The Company manages its business under one operating and reportable segment, and has one reporting unit. In testing for impairment, the fair value of the reporting unit, that is determined based on market data, is compared to its carrying amount. If the carrying value is below the fair value assessment, there will be no impairment loss. If the fair value is below the carrying value, then the Company is required to perform an additional test to determine the implied fair value of the goodwill. The Company performed its annual goodwill impairment testing as of September 30th and determined that the fair value of its reporting unit exceeds its carrying value and accordingly, the second step of the impairment test was not required to be performed.

F-11
Revenue Recognition and Accounts Receivable Valuation Revenue is recognized when persuasive evidence of an arrangement exists, the product has been delivered, the price is fixed or determinable and collection is probable. Terms under these arrangements are generally free on board (“FOB”) shipping point, or ex works factory (“EXW”), at which time legal title passes from the Company to the customer. Therefore, delivery is generally considered to have occurred upon shipment. In certain circumstances customers may negotiate different terms. In these situations, delivery is considered to have occurred once legal title has passed from the Company to the customer. This may be at delivery to the customer’s destination or acceptance by the Company’s customer. Sales to end-user customers and resellers typically do not have customer acceptance provisions and only certain of the original equipment manufacturer (“OEM”) customer sales have customer acceptance provisions. Customer acceptance is generally limited to performance under published product specifications. For the few product sales that have customer acceptance provisions because of higher than published specifications, (1) the products are tested and accepted by the customer at a company site or by the customer’s acceptance of the results of a testing program prior to shipment to the customer, or (2) the revenue is deferred until customer acceptance occurs. The Company records revenues net of volume discount rebates that are earned by certain OEM customers, based on sales levels, pursuant to contractual agreements. The vast majority of our sales are made to OEMs, resellers, and end users in the industrial market. Sales made to OEMs and resellers in the industrial market do not require installation of the products by the Company, as installation is performed by the customer and are not subject to other post-delivery obligations. The Company may enter into multiple-deliverable arrangements which include the delivery of lasers, laser systems, installation, and training. Revenue from these arrangements is allocated to separate units of accounting if certain criteria are met. The allocation of the arrangement consideration to the separate units of accounting is based on vendor-specific objective evidence or third-party evidence. If such evidence is not available, the Company uses best estimate of selling price. Revenue related to installation and training is recognized when installation is completed or training is provided which usually takes place up to three months after the delivery of the laser or the laser system. The Company records allowances for uncollectible customer accounts receivable based on historical experience. Additionally, an allowance is made based on an assessment of specific customers’ financial condition and liquidity. If the financial condition of the Company’s customers were to deteriorate, additional allowances may be required.
Income and Other Taxes Income taxes are accounted for under the asset and liability method. Deferred tax assets and liabilities are recognized for the future tax consequences attributable to differences between the financial statement carrying amounts of existing assets and liabilities and their respective tax bases and operating loss tax carryforwards. Deferred tax assets and liabilities are measured using enacted tax rates that apply to taxable income in the years in which those temporary differences are expected to be recovered or settled. The effect on deferred taxes of a change in tax rates is recognized in income in the period that includes the enactment date. In assessing the realizability of deferred tax assets, management considers whether it is more likely than not that some portion or all of the deferred tax assets will not be realized. The Company recognizes certain tax liabilities for anticipated tax audit findings in the U.S. and other tax jurisdictions based on its estimate of whether, and to the extent to which additional taxes would be due. If the audit finding results in actual taxes owed more or less than what the Company anticipated, its income tax expense would increase or decrease in the period of determination. Revenue and expenses are presented net of any country-specific taxes.
Accounting for Warranties The Company issues a standard warranty of one to two years for parts and labor on lasers that are sold. Additionally, extended warranties are negotiated on a contract-by-contract basis. The Company provides for estimated warranty costs as products are shipped.
The Company’s estimate of costs to fulfill its warranty obligations is based on historical experience and expectation of future conditions. To the extent the Company experiences increased warranty claim activity or increased costs associated with servicing those claims, revisions to the estimated warranty liability would be required.

F-12
Foreign Currency Translation The assets and liabilities of the Company’s operations outside the United States are translated into U.S. dollars at exchange rates in effect on the balance sheet date, and revenues and expenses are translated using a weighted average exchange rate during the period. Gains or losses resulting from the translation of foreign currency financial statements are recorded as a separate component of stockholders’ equity. Gains and losses resulting from the remeasurement of foreign currency transactions are reported as a component of “Other expense (income), net”.
Earnings per Share (“EPS”) Basic EPS is computed by dividing “Net Income attributable to RSTI” by the weighted average number of common shares outstanding during the period. Diluted EPS reflects the potential dilution from common stock equivalents (stock options).
Comprehensive Income Comprehensive income consists of net income, foreign currency translation adjustments, pension liability adjustments, and fair value of interest rate swap agreements, and is presented in the consolidated statements of stockholders’ equity and comprehensive income.
Accumulated other comprehensive income is comprised of the following:
September 30, 2013 2012 2011Foreign currency translation adjustment $ 17,091 $ 2,261 $ 13,394Defined benefit pension plans (net of taxes of $2,615 in 2013, $3,234 in 2012,and $1,555 in 2011) (5,449) (6,308) (2,768)Fair value of interest swap agreements (net of taxes of $33 in 2013, $59 in 2012,and $54 in 2011) (109) (189) (180)Total accumulated other comprehensive income (loss) $ 11,533 $ (4,236) $ 10,446
Research and Development Expenses Research and development costs are expensed when incurred and are net of primarily German and other European governments and European Union grants of $2,437, $1,638, and $2,305, received for the years ended September 30, 2013, 2012, and 2011, respectively. The Company has no future obligations under such grants.
Derivative Financial Instruments The Company uses derivative financial instruments to manage funding costs and exposures arising from fluctuations in interest rates. These derivative financial instruments consist primarily of interest rate swaps. The Company does not use derivative financial instruments for trading purposes. On the date the derivative contract is entered into, the Company designates the derivative as a hedge of the variability of cash flows to be paid related to a recognized liability (“cash flow” hedge). Changes in the fair value of a derivative that is highly effective and that is designated and qualifies as a cash flow hedge are recorded in other comprehensive income, until earnings are affected by the variability in cash flows of the designated hedged item. Interest rate swap agreements designated as hedges of the Company’s financial liabilities are recorded in the consolidated balance sheet at fair value. Adjustments to the fair value of the derivative asset or liability are recorded as an adjustment to other comprehensive income.
From time to time, the Company enters into foreign currency forward contracts and forward exchange options generally of less than one year duration to hedge a portion of its sales transactions denominated in foreign currencies. The gains and losses from these foreign currency forward contracts and forward exchange options are reflected in the consolidated statement of operations. At September 30, 2013, the Company held Japanese yen forward exchange contracts with notional amounts of Euro 1.3 million and $0.1 million.

F-13
Operating Leases The Company leases facilities under operating leases. Building lease agreements generally include rent escalation clauses. Most of the Company’s lease agreements include renewal periods at the Company’s option. The Company recognizes scheduled rent increases on a straight-line basis over the lease term beginning with the date the Company takes possession of the leased space.
Use of Estimates Management of the Company makes a number of estimates and assumptions relating to the reporting of assets and liabilities, the disclosure of contingent assets and liabilities, and the reporting of revenues and expenses, to prepare these financial statements in conformity with generally accepted U.S. accounting principles. Significant items subject to such estimates and assumptions include the valuation allowance for receivables, inventory valuation, warranty liabilities, the valuation allowance for deferred tax assets, assets and obligations related to employee benefits, and share-based payment awards. Actual results could differ from these estimates.
Stock Incentive Plans The Company measures share-based payments to employees, including grants of employee stock options, at fair value and expenses them in the consolidated statement of operations over the service period (generally the vesting period) of the grant.
Shipping and Handling Costs The Company accounts for shipping and handling fees and costs by recording revenue from shipping and handling fees in net sales and shipping and handling costs in cost of sales.
Recent Accounting Pronouncements Adopted In June 2011, the Financial Accounting Standards Board ("FASB") issued guidance requiring changes to the presentation of comprehensive income which requires entities to present the total of comprehensive income, the components of net income, and the components of other comprehensive income either in a single continuous statement of comprehensive income or in two separate but consecutive statements. These changes, with retrospective application, became effective for the Company in fiscal year 2013. Other than the change in presentation to report comprehensive income as a separate but consecutive statement, these changes did not have an impact on the consolidated financial statements. In September 2011, the FASB issued ASU 2011-08, “Testing Goodwill for Impairment”. The amendments under ASU 2011-08 allow entities to first assess qualitative factors to determine whether it is necessary to perform the two-step quantitative goodwill impairment test. Under these amendments, an entity is not required to calculate the fair value of a reporting unit unless the entity determines, based on a qualitative assessment, that it is more likely than not that the reporting unit’s fair value is less than its carrying amount. The amendments included a number of events and circumstances for entities to consider in conducting the qualitative assessment. Entities now have the option to bypass the qualitative assessment for any reporting unit in any period and proceed directly to performing the first step of the two-step quantitative goodwill impairment test. ASU 2011-08 was effective for annual and interim goodwill impairment tests performed for fiscal years beginning after December 15, 2011 (fiscal year 2013 for the Company). Adoption of ASU 2011-08 did not have a material impact on the Company’s financial statements.
Recent Accounting Pronouncements Not Yet Adopted as of September 30, 2013 In December 2011, the FASB issued ASU No. 2011-11, “Disclosures about Offsetting Assets and Liabilities”. ASU 2011-11 amended ASC 210, “Balance Sheet”, to converge the presentation of offsetting assets and liabilities between U.S. GAAP and IFRS. ASU 2011-11 requires that entities disclose both gross information and net information about both instruments and transactions eligible for offset in the statement of financial position and instruments and transactions subject to an agreement similar to a master netting arrangement. In January 2013, the FASB issued ASU 2013-01 which limited the scope of this guidance to derivatives, repurchase type agreements, and securities borrowing and lending transactions. The guidance from these updates is effective for fiscal years, and interim periods within those years, beginning after January 1, 2013, which is the Company’s fiscal year 2014. The Company does not believe the adoption will have a significant impact on the Company's consolidated financial statements.
In February 2013, the FASB issued ASU 2013-02, “Reporting of Amounts Reclassified Out of Accumulated Other Comprehensive Income”. ASU 2013-02 requires reclassification adjustments for items that are reclassified from accumulated

F-14
other comprehensive income to net income be presented on the financial statements or in a note to the financial statements. The new disclosure requirements are effective for fiscal years, and interim periods within those years, beginning after December 15, 2012. As such, ASU 2013-02 will be effective October 1, 2013, for the Company and will be applied prospectively. The Company does not believe the adoption will have a significant impact on the Company's consolidated financial statements.
In March 2013, the FASB amended guidance related to a parent company’s accounting for the release of the cumulative translation adjustment into net income upon derecognition of certain subsidiaries or groups of assets within a foreign entity or of an investment in a foreign entity. This guidance is effective for fiscal periods beginning after December 15, 2013, and is to be applied prospectively to derecognition events occurring after the effective date. The Company does not anticipate that the adoption of this amendment will have a material impact on its financial statements.
In July 2013, the FASB issued ASU 2013-10, "Inclusion of the Fed Funds Effective Swap Rate (or Overnight Index Swap Rate) as a Benchmark Interest Rate for Hedge Accounting Purposes". The update permits the Fed Funds Effective Swap Rate to be used as a U.S. benchmark interest rate for hedge accounting purposes under FASB ASC Topic 815, in addition to the interest rates on direct Treasury obligations of the U.S. government (UST) and the London Interbank Offered Rate (LIBOR). The update also removed the restriction on using different benchmark rates for similar hedges. ASU 2013-10 has no effect on the financial statements as of September 30, 2013, but will be applicable to any hedging activity the company enters into after July 17, 2013.
In July 2013, the FASB issued guidance on financial statement presentation of an unrecognized tax benefit when a net operating loss carryforward, a similar tax loss, or a tax credit carryforward exists. Under this guidance an unrecognized tax benefit, or a portion of an unrecognized tax benefit, should be presented in the financial statements as a reduction to a deferred tax asset for a net operating loss carryforward, a similar tax loss, or a tax credit carryforward, except as follows. To the extent a net operating loss carryforward, a similar tax loss, or a tax credit carryforward is not available at the reporting date under the tax law of the applicable jurisdiction to settle any additional income taxes that would result from the disallowance of a tax position or the tax law of the applicable jurisdiction does not require the entity to use, and the entity does not intend to use, the deferred tax asset for such purpose, the unrecognized tax benefit should be presented in the financial statements as a liability and should not be combined with deferred tax assets. These amendments are effective for fiscal years, and interim periods within those years, beginning after December 15, 2013. The Company does not believe the adoption will have a significant impact on the Company's consolidated financial statements. Other accounting standards that have been issued by the FASB or other standards-setting bodies that do not require adoption until a future date are not expected to have a material impact on the Company's financial statements upon adoption.

F-15
2. FAIR VALUE MEASUREMENTS Financial assets and liabilities, measured at fair value on a recurring basis, are classified on the valuation hierarchy in the table below:
September 30, 2013Total Level 1 Level 2 Level 3
Cash and cash equivalents $ 133,733 $ 133,733 $ — $ —Short-term investments 3,244 3,244 — —Derivatives (126) — (126) —Non-current auction rate securities 1,900 — — 1,900Other long term assets 250 — 250 —Total assets and liabilities at fair value $ 139,001 $ 136,977 $ 124 $ 1,900
September 30, 2012Total Level 1 Level 2 Level 3
Cash and cash equivalents $ 98,735 $ 98,735 $ — $ —Short-term investments 2,428 2,428 — —Derivatives (239) — (239) —Non-current auction rate securities 3,200 — — 3,200Total assets and liabilities at fair value $ 104,124 $ 101,163 $ (239) $ 3,200
The changes in the fair value measurement of investments using significant unobservable inputs (level 3), are as follows:
Fair ValueMeasurements Using Significant
Unobservable Inputs (Level 3)September 30, 2011 $ 3,700
Settlements (500)September 30, 2012 $ 3,200
Settlements (1,300)September 30, 2013 $ 1,900
3. INVENTORIES Inventories, net of obsolescence and lower of cost or market reserves, are summarized as follows:
September 30, 2013 2012Finished goods $ 30,177 $ 31,205Work in progress 43,870 49,678Raw materials and supplies 71,367 69,648Demo inventory 20,691 19,247Service parts 32,355 32,410Total inventories $ 198,460 $ 202,188

F-16
4. LONG-TERM INVESTMENTS Long-term investments include auction rate securities which are variable rate securities tied to short-term interest rates with maturities on the face of the securities in excess of 90 days. Auction rate securities have rate resets through a modified Dutch auction, at predetermined short-term intervals, usually every 7, 28, 35, or 49 days. The securities trade at par, and are callable at par on any payment date at the option of the issuer. Investment earnings paid during a given period are based upon the reset rate determined during the prior auction. Through sales, the Company reduced its holdings of auction rate securities to approximately $1.9 million at September 30, 2013. All sales were settled, for cash, at par value. At September 30, 2013, the Company held one individual auction rate security. The Company does not believe that the remaining balance of auction rate securities represent a significant portion of the Company's total liquidity. The Company has historically used a discounted cash flow model to determine the fair market value of these investments. This model included estimates for interest rates, discount rates, the amount of cash flows, and expected holding periods. As a result, the Company concluded that the par value of these investments approximates fair market value. Additionally, the Company has the ability and intent to hold these investments until a resumption of the auction process or until maturity. Although the Company believes these investments will become liquid within the next twelve months, it is uncertain what impact the current economic environment will have on this position and therefore, they have been classified as long-term assets on the consolidated balance sheet.
5. PROPERTY AND EQUIPMENT Property and equipment include the following:
September 30, 2013 2012Buildings $ 44,135 $ 41,967Technical machinery and equipment 61,890 53,038Construction in progress 6,864 5,264Furniture and fixtures 31,144 27,309Computers and software 8,352 8,402Leasehold improvements 28,012 25,269Total property and equipment, at cost $ 180,397 $ 161,249
6. GOODWILL AND OTHER INTANGIBLE ASSETS The changes in the carrying amount of goodwill for the years ended September 30, 2013 and 2012, are as follows:
GermanyUnitedStates
Rest ofWorld Total
Balance as of September 30, 2011 $ 43,514 $ 13,284 $ 33,702 $ 90,500Additional goodwill from acquisitions — — 13,413 13,413Currency exchange differences (1,712) (128) (458) (2,298)
Balance as of September 30, 2012 $ 41,802 $ 13,156 $ 46,657 $ 101,615Additional goodwill from acquisitions — — — —Currency exchange differences 1,881 141 767 2,789
Balance as of September 30, 2013 $ 43,683 $ 13,297 $ 47,424 $ 104,404

F-17
The carrying values of other intangible assets are as follows:
September 30, 2013 September 30, 2012
GrossCarryingAmount
AccumulatedAmortization
GrossCarryingAmount
AccumulatedAmortization
Amortized intangible assets: Patents $ 10,764 $ 8,270 $ 10,385 $ 7,649Customer base 19,084 16,778 18,812 15,357Other 22,389 16,515 21,186 15,439Total $ 52,237 $ 41,563 $ 50,383 $ 38,445
Patents are amortized on a straight-line basis over the life of the patent which ranges from 1 to 20 years. Customer base is amortized on a straight-line basis over seven years. Other intangible assets mainly comprised of software and unpatented technology are amortized on a straight-line basis between 1 and 16 years. Amortization expense for the years ended September 30, 2013, 2012, and 2011, was $2,553, $2,279, and $2,569, respectively.
At September 30, 2013, estimated amortization expense of existing intangible assets for the next five fiscal years based on the average exchange rates as of September 30, 2013, is as follows:
2014 $ 2,6002015 2,4002016 1,4002017 1,2002018 700
7. ACCRUED LIABILITIES Accrued liabilities are comprised of the following:
September 30, 2013 2012Employee compensation $ 23,402 $ 21,968Warranty reserves 12,301 11,894Other taxes payable 320 440Customer deposits 16,242 17,605Other 17,672 17,103Total accrued liabilities $ 69,937 $ 69,010
The Company provides for the estimated costs of product warranties when revenue is recognized. The estimate of costs to fulfill warranty obligations is based on historical experience and expectation of future conditions.

F-18
The change in warranty reserves for the years ended September 30, 2013 and 2012, are as follows:
Balance as of September 30, 2011 $ 13,197Additional accruals for warranties during the period 3,448Usage during the period (4,342)Currency translation (409)
Balance as of September 30, 2012 $ 11,894Additional accruals for warranties during the period 4,351Usage during the period (4,356)Currency translation 412
Balance as of September 30, 2013 $ 12,301
8. LINES OF CREDIT The Company maintains $20,000 in short-term lines of credit in the U.S. As of September 30, 2013, $20,000 remained unused and available for future use. As of September 30, 2012, $15,000 was available under short-term lines of credit in the U.S. In addition, the Company’s non-U.S. subsidiaries have short-term credit lines amounting to $46,953, which allow them to borrow in the applicable local currency. At September 30, 2013 and 2012, direct borrowings under these agreements totaled $2,071 and $10,316, respectively. Additionally, $1,459 and $1,631 were used for bank guarantees under those lines of credit as of September 30, 2013 and 2012, respectively. The remaining unused portion of the lines of credit at September 30, 2013, was $43,423, in aggregate. Interest rates vary from 0.55% to 2.60%, depending upon the country and the usage made of the available credit. Furthermore, the Company also maintains credit lines specific to bank guarantees amounting to $21,235 and $15,088 as of September 30, 2013 and 2012, respectively, of which $7,726 and $6,742 was used as of September 30, 2013 and 2012, respectively.
The Company is subject to financial covenants under some of these lines of credit, which could restrict the Company from drawing money under them. At September 30, 2013, the Company was in compliance with these covenants.
9. LONG-TERM DEBT Long-term debt included in the Consolidated Balance Sheets is comprised of the following:
September 30,Description 2013 20122.53% Term loan due 2015 $ 1,897 $ 2,8421.85% Term loan due 2018 3,388 —1.7% Term loan due 2017 3,388 —2.6% Term loan due 2016 3,879 4,2721.0% State of Connecticut Term loan due 2023 4,000 —1.0% Long-term credit facilities — 115 Total long-term debt facilities 16,551 7,229Current portion of long-term debt included in line of credit and shortterm borrowings 1,638 1,567 Total long-term debt $ 14,913 $ 5,662

F-19
Principal payments of long-term debt as of September 30, 2013, are as follows:
Fiscal year ending September 30, Total2014 $ 1,6382015 1,8582016 4,4002017 5,0172018 1,3472019 and thereafter 2,291
16,551
10. COMMITMENTS The Company leases operating facilities and equipment under various operating leases. The lease agreements require payment of real estate taxes, insurance, and maintenance expenses by the Company.
Minimum lease payments for future fiscal years under non-cancellable operating leases as of September 30, 2013, are:
Fiscal year ending September 30, Total2014 $ 9,9382015 7,8092016 4,9532017 2,9302018 1,3092019 and thereafter 6,272
Rent expense charged to operations for the years ended September 30, 2013, 2012, and 2011, approximated $10,733, $10,061, and $10,169, respectively. Purchase obligations for payments due under various types of agreements to purchase raw materials, services, and other goods as of September 30, 2013, are:
Less than 1 Year $ 70,9511 - 3 Years 23,3863 - 5 Years 1,278More than 5 years 15

F-20
11. INCOME TAXES Significant components of the income tax provision are as follows:
Years ended September 30, 2013 2012 2011Current:
United States $ 4,393 $ 5,710 $ 5,050Foreign 12,288 13,214 24,461
Total current 16,681 18,924 29,511Deferred:
United States (1,107) (1,145) (3,164)Foreign (1,435) (599) (277)
Total deferred (2,542) (1,744) (3,441)Total income tax expense $ 14,139 $ 17,180 $ 26,070
Income (Loss) before income taxes is attributable to the following geographic regions:
Years ended September 30, 2013 2012 2011United States $ 10,131 $ 9,101 $ 8,443Germany 19,215 28,112 59,396France (562) 77 802Italy 1,146 794 1,868Singapore 2,535 2,454 1,945United Kingdom 8,631 7,442 7,505China 4,381 2,139 3,405Japan 175 996 565Other 3,503 1,277 3,214
Total income before income taxes $ 49,155 $ 52,392 $ 87,143
The difference between actual income tax expense and the amount computed by applying the U.S. federal income tax rate is as follows:
Years ended September 30, 2013 2012 2011U.S. federal statutory tax rate 35% 35% 35%Computed “expected” tax expense $ 17,154 $ 18,316 $ 30,500Difference between U.S. and foreign statutory rates (3,617) (2,828) (4,819)Other permanent differences (87) 134 87Research & development credits (935) — —Adjustment of valuation allowance (3) (151) 237Change in statutory tax rates 37 (135) (76)Other 1,590 1,844 141
Actual tax expense $ 14,139 $ 17,180 $ 26,070

F-21
Total income taxes for the years ended September 30, 2013, 2012, and 2011, were allocated as follows:
Years ended September 30, 2013 2012 2011Income taxes from operations $ 14,139 $ 17,180 $ 26,070Stockholders’ equity: Tax benefit applicable to the exercise of stock options (2) (295) (136) Tax (benefit) expense applicable to defined benefit pension plan 619 (1,679) (2)
Tax (benefit) expense applicable to the fair value of interest swapagreements 25 (5) (43)
Total income tax $ 14,781 $ 15,201 $ 25,889

F-22
Deferred income taxes result from temporary differences between the amount of assets and liabilities recognized for financial reporting and tax purposes. The components of net deferred income taxes are as follows:
September 30, 2013 2012Deferred income tax assets:
Foreign Net operating loss carryforwards $ 5,029 $ 5,936Inventories 5,647 5,825Pension obligations 2,813 2,019Accounts payable 83 —Other 931 1,636
Total Foreign 14,503 15,416United States:
Net operating loss carryforwards 7,428 8,084Tax credits 122 122Warranty reserve 918 908Inventories 6,516 6,254Allowance for doubtful accounts 253 283Accrued liabilities 676 837Pension obligations 1,071 1,753Property & equipment 70 —Accounts receivables 119 —Stock-based compensation expense 2,189 1,907Other 341 356
Total United States 19,703 20,504Gross deferred income tax assets 34,206 35,920Less: Valuation allowance (3,088) (3,091)
Net deferred income tax assets $ 31,118 $ 32,829Deferred income tax liabilities:
Foreign: Property & equipment (689) (833)Intangibles (2,384) (4,187)Accounts receivable (12) (318)Other (1,320) (1,812)
Total Foreign (4,405) (7,150)United States:
Accounts receivable — (170)Other current assets — (282)Non-US earnings (140) (17)
Total United States (140) (469)Gross deferred income tax liabilities (4,545) (7,619)Net deferred income tax assets $ 26,573 $ 25,210

F-23
The total deferred income tax assets (liabilities) are included in the accompanying consolidated balance sheet as follows:
September 30, 2013 2012
Deferred income tax assets – current $ 22,818 $ 16,997Deferred income tax assets – non-current 13,446 13,970Deferred income tax liabilities – current (4,651) (1,011)Deferred income tax liabilities – non-current (5,040) (4,746)
Net deferred income tax assets $ 26,573 $ 25,210
In assessing the realizability of deferred tax assets, management considers whether it is more likely than not that some portion or all of the deferred tax assets will not be realized. The ultimate realization of deferred tax assets is dependent upon the generation of future taxable income during the periods in which those temporary differences become deductible, as well as limitations imposed by the relevant taxing jurisdictions on the future benefits of those deductions. Management considers the scheduled reversal of deferred tax liabilities, projected future taxable income, the relevant statutory and regulatory limitations, and tax planning strategies in making this assessment. Based upon the level of historical taxable income and projections for future taxable income over the periods in which the deferred tax assets are deductible, management believes it is more likely than not that the Company will realize the benefits of these deductible differences. At September 30, 2013, the Company had state net operating tax loss carryforwards available of $40,027 in the United States (which start to expire in 2022) and federal net operating tax loss carryforwards available of $12,975 and $5,213 in Germany, and $13,437 in other European/Asian countries (which start to expire in 2016). As of September 30, 2013, deferred tax assets, net of valuation allowances related to these operating tax losses and tax credits, amounted to $9,491.
We have accumulated undistributed earnings of foreign subsidiaries aggregating approximately $420 million at September 30, 2013. These earnings are expected to be indefinitely reinvested outside of the United States. If those earnings were distributed in the form of dividends or otherwise, they would be subject to United States federal income taxes (subject to an adjustment for foreign tax credits), state income taxes and withholding taxes payable to the various foreign countries. It is not currently practicable to estimate the tax liability that might be payable on the repatriation of these foreign earnings.
The Company's policy is to recognize interest and penalties accrued on any unrecognized tax benefits as interest expense and SG&A, respectively. The Company classified the unrecognized tax benefit as non-current because payment is not anticipated within one year of the balance sheet date. As of September 30, 2013, the Company's gross unrecognized tax benefits totaled $474, which includes $35 of interest and penalties. Approximately $439 of unrecognized tax benefits would impact the effective tax rate, if recognized. The Company estimates that the unrecognized tax benefits will not change significantly within the next year. A reconciliation of the beginning and ending amount of gross unrecognized tax benefits, excluding the related accrual for interest, is as follows:
Balance at September 30, 2010 $ 615Decreases in tax positions for prior years (3)Increases in tax positions for current years 250Settlements with taxing authorities (34)
Balance at September 30, 2011 $ 828Decreases in tax positions for prior years (392)Increases in tax positions for current years —Settlements with taxing authorities —
Balance at September 30, 2012 $ 436Decreases in tax positions for prior years —Increases in tax positions for current years 38Settlements with taxing authorities —
Balance at September 30, 2013 $ 474

F-24
The Company files federal and state income tax returns in several domestic and foreign jurisdictions. In most tax jurisdictions, returns are subject to examination by the relevant tax authorities for a number of years after the returns have been filed. With limited exceptions, the Company is no longer subject to examination by the United States Internal Revenue Service for years through 2006. With respect to state and local tax jurisdictions and countries outside the United States, with limited exceptions, the Company is no longer subject to income tax audits for years before 2008.
12. EMPLOYEE BENEFIT PLANS The Company has defined benefit pension plans for the RSL and RS Inc. employees. The Company’s U.S. plan began in fiscal year 1995 and is funded. Any new employees hired after January 1, 2007, are not eligible for the RS Inc. pension plan. As is the normal practice with German companies, the German pension plan is unfunded. Any new employees, hired after the acquisition of CBL, are not eligible for the RSL pension plan. The measurement date of the Company’s pension plans is September 30.
The Company’s Spanish subsidiary had a defined benefit pension plan which began in fiscal year 2009 and was funded. In July 2013, a new labor agreement was negotiated that affected the Company's Spanish subsidiary. Under the new agreement, the Company's Spanish pension plan was canceled during fiscal year 2013, and all assets used to fund the plan were remitted back to the Company.
Effective January 1, 2012, the RS Inc. defined benefit pension plan was amended to exclude highly compensated employees, as defined by the Internal Revenue Service, from receiving future years of service under the RS Inc. pension plan. A non-qualified defined benefit pension plan was created to replace the benefits lost by the employees that were otherwise excluded from the qualified pension plan. The determination of the Company’s obligation and expense for pension is dependent on the selection of certain actuarial assumptions in calculating those amounts. Assumptions are made about interest rates, expected investment return on plan assets, total turnover rates, and rates of future compensation increases. In addition, the Company’s actuarial consultants use subjective factors such as withdrawal rates and mortality rates to develop their calculations of these amounts. The Company generally reviews these assumptions at the beginning of each fiscal year. The Company is required to consider current market conditions, including changes in interest rates, in making these assumptions. The actuarial assumptions that the Company uses may differ materially from actual results due to changing market and economic conditions, higher or lower withdrawal rates or longer or shorter life spans of participants. These differences may result in a significant impact on the amount of pension benefits expense the Company has recorded or may record. Another key assumption in determining the net pension expense is the assumed discount rate to be used to discount plan obligations. The Company's U.S. plan uses a cash flow matching approach, which uses projected cash flows matched to spot rates along a high-quality corporate yield curve to determine the present value of cash flows to calculate a single equivalent discount rate. A lower discount rate increases the present value of benefit obligations and increases pension expense.
To determine the expected long-term rate of return on plan assets, the Company considers the current and expected asset allocations, as well as historical and expected returns on various categories of plan assets.

F-25
The following table sets forth the funded status of the plans at the balance sheet dates:
September 30, 2013 2012Change in benefit obligation:
Projected benefit obligation at beginning of year $ 32,615 $ 25,528Service cost 1,024 830Interest cost 1,279 1,277Actuarial losses (gains) (658) 6,133Settlement (168) —Foreign exchange rate impacts 731 (630)Benefits paid – total (562) (523)
Projected benefit obligation at end of year 34,261 32,615Projected benefit obligation at end of year:
U.S. plans 12,707 13,700Foreign plans 21,554 18,915Projected benefit obligation at end of year 34,261 32,615
Change in plan assets: Fair value of plan assets at beginning of year 9,008 7,623Actual return on plan assets 883 1,177Employer contributions 200 430Foreign exchange rate impacts 2 (2)Settlement (56) —Benefits paid – funded plans (234) (220)
Fair value of plan assets at end of year 9,803 9,008Fair value of plan assets at end of year:
U.S. plans 9,803 8,952Foreign plans — 56Fair value of plan assets at end of year 9,803 9,008Funded status at end of year $ (24,458) * $ (23,607) *
Amounts recognized in the consolidated balance sheet Accrued benefit liability $ (24,458) $ (23,607)Accumulated other comprehensive loss (pre-tax) 8,064 9,542
Net amount recognized $ (16,394) $ (14,065) *$388 and $354 relate to expected payments in the following twelve months for the Company’s unfunded non-US plans and are therefore classified in current “Accrued liabilities” in the consolidated balance sheets as of September 30, 2013 and 2012, respectively.
September 30, 2013 2012Information for pension plans with an accumulated benefit obligation in excess ofplan assets Projected benefit obligation $ 34,261 $ 32,615Accumulated benefit obligation 31,129 29,347Fair value of plan assets 9,803 9,008

F-26
September 30,2013 2012
Components of net periodic benefit cost and other amounts recognized in other comprehensive incomeNet periodic benefit cost
Service Cost $ 1,024 $ 830Interest Cost 1,279 1,277Expected return on plan assets (606) (522)Amortization of net loss 494 233Amortization of prior service cost 49 27Net periodic benefit cost $ 2,240 $ 1,845
Other changes in plan assets and benefit obligations recognized in other comprehensive income (pre-tax)Net loss (gain) (1,429) 5,246Amortization of prior service cost (49) (27)
Total recognized in other comprehensive income $ (1,478) $ 5,219Total recognized in net periodic benefit cost and other comprehensive income $ 762 $ 7,064
The weighted average assumptions used in the valuation of the plan are as follows:
September 30, 2013 2012Discount rate to determine benefit obligations:
United States 4.66% 3.96%Foreign 3.50% 3.80%
Discount rate to determine net periodic benefit cost: United States 3.78% 5.08%Foreign 3.80% 5.08%
Expected return on plan assets United States 7.00% 7.00%Foreign —% 3.75%
Rate of compensation increase United States 3.0% 3.0%Foreign 3.0% 3.0%
The Company recognizes the over (under) funded status of the defined benefit plans in the statement of financial position. The Company also recognizes, in other comprehensive income, certain gains and losses that arise during the period but are deferred under current pension accounting rules. Expected benefit payments for each of the next five fiscal years and for the five years aggregated thereafter is as follows: $698 in 2014, $929 in 2015, $947 in 2016, $1,151 in 2017, $1,635 in 2018, and $8,829 thereafter.
The Company’s pension plan asset allocations at September 30, 2013 and 2012, by asset category are as follows:
2013 2012
Dollar Value PercentageTarget
Allocation Dollar Value PercentageCertificates of Deposit $ 369 4% 5% $ 378 4%Equity Securities 5,236 53% 50% 4,892 54%Debt Securities 4,198 43% 45% 3,738 42%Total Plan Assets $ 9,803 100% 100% $ 9,008 100%

F-27
The Company employs a total return investment approach whereby a mix of equity, debt securities, and government securities are used to maximize the long-term return of plan assets for a prudent level of risk. The intent of this strategy is to minimize plan expenses by maximizing investment returns within that prudent level of risk. Furthermore, equity investments are diversified across U.S. and non-U.S. stocks as well as growth, value, and small and large capitalizations. Additionally, cash balances are maintained at levels adequate to meet near-term plan expenses and benefit payments. Investment risk is measured and monitored on an ongoing basis through semi-annual investment portfolio reviews. Investments in our defined benefit plan are stated at fair value. Level 1 assets are valued using quoted market prices that represent the asset value of the shares held by the trusts. The level 2 assets are investments in pooled funds, which are valued using a model to reflect the valuation of their underlying assets that are publicly traded with observable values. The fair value of our level 3 pension plan assets are measured by compiling the portfolio holdings and independently valuing the securities in those portfolios. The fair values of our pension plan assets, by level within the fair value hierarchy, are as follows:
September 30, 2013Asset Categories Level 1 Level 2 Level 3 TotalCertificates of Deposit $ — $ 369 $ — $ 369Equity Securities
Small Cap — 261 — 261Mid Cap — 541 — 541Large Cap — 2,924 — 2,924International — 1,286 — 1,286Emerging Markets — 224 — 224
Debt Securities Bonds & Mortgages — 3,143 — 3,143Inflation Protected — 452 — 452High Yield — 483 — 483Money Market — 120 — 120Other — — — —
Total Plan Assets $ — $ 9,803 $ — $ 9,803
September 30, 2012Asset Categories Level 1 Level 2 Level 3 TotalCertificates of Deposit $ — $ 378 $ — $ 378Equity Securities
Small Cap — 232 — 232Mid Cap — 462 — 462Large Cap — 2,611 — 2,611International — 1,318 — 1,318Emerging Markets — 269 — 269
Debt Securities Bonds & Mortgages — 2,707 — 2,707Inflation Protected — 442 — 442High Yield — 475 — 475Money Market — 69 — 69Other — 45 — 45
Total Plan Assets $ — $ 9,008 $ — $ 9,008
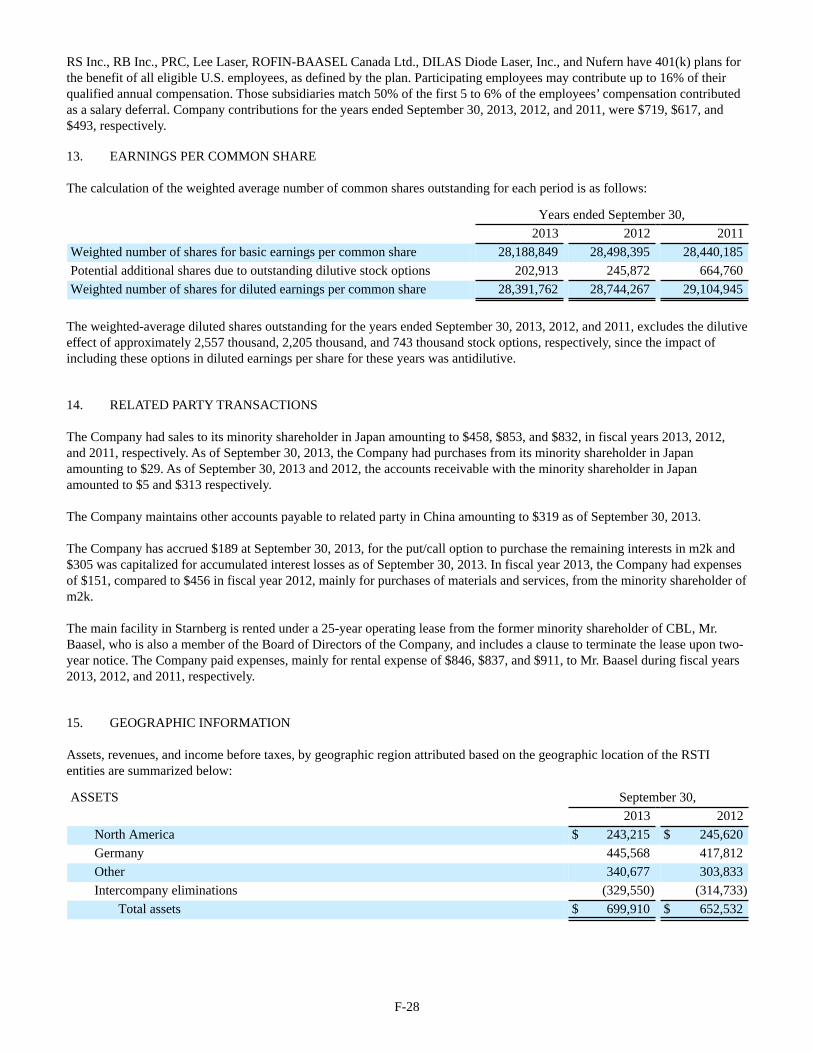
F-28
RS Inc., RB Inc., PRC, Lee Laser, ROFIN-BAASEL Canada Ltd., DILAS Diode Laser, Inc., and Nufern have 401(k) plans for the benefit of all eligible U.S. employees, as defined by the plan. Participating employees may contribute up to 16% of their qualified annual compensation. Those subsidiaries match 50% of the first 5 to 6% of the employees’ compensation contributed as a salary deferral. Company contributions for the years ended September 30, 2013, 2012, and 2011, were $719, $617, and $493, respectively.
13. EARNINGS PER COMMON SHARE The calculation of the weighted average number of common shares outstanding for each period is as follows:
Years ended September 30, 2013 2012 2011Weighted number of shares for basic earnings per common share 28,188,849 28,498,395 28,440,185Potential additional shares due to outstanding dilutive stock options 202,913 245,872 664,760Weighted number of shares for diluted earnings per common share 28,391,762 28,744,267 29,104,945
The weighted-average diluted shares outstanding for the years ended September 30, 2013, 2012, and 2011, excludes the dilutive effect of approximately 2,557 thousand, 2,205 thousand, and 743 thousand stock options, respectively, since the impact of including these options in diluted earnings per share for these years was antidilutive.
14. RELATED PARTY TRANSACTIONS The Company had sales to its minority shareholder in Japan amounting to $458, $853, and $832, in fiscal years 2013, 2012, and 2011, respectively. As of September 30, 2013, the Company had purchases from its minority shareholder in Japan amounting to $29. As of September 30, 2013 and 2012, the accounts receivable with the minority shareholder in Japan amounted to $5 and $313 respectively. The Company maintains other accounts payable to related party in China amounting to $319 as of September 30, 2013.
The Company has accrued $189 at September 30, 2013, for the put/call option to purchase the remaining interests in m2k and $305 was capitalized for accumulated interest losses as of September 30, 2013. In fiscal year 2013, the Company had expenses of $151, compared to $456 in fiscal year 2012, mainly for purchases of materials and services, from the minority shareholder of m2k. The main facility in Starnberg is rented under a 25-year operating lease from the former minority shareholder of CBL, Mr. Baasel, who is also a member of the Board of Directors of the Company, and includes a clause to terminate the lease upon two-year notice. The Company paid expenses, mainly for rental expense of $846, $837, and $911, to Mr. Baasel during fiscal years 2013, 2012, and 2011, respectively.
15. GEOGRAPHIC INFORMATION Assets, revenues, and income before taxes, by geographic region attributed based on the geographic location of the RSTI entities are summarized below:
ASSETS September 30, 2013 2012
North America $ 243,215 $ 245,620Germany 445,568 417,812Other 340,677 303,833Intercompany eliminations (329,550) (314,733)
Total assets $ 699,910 $ 652,532

F-29
PROPERTY AND EQUIPMENT, NET September 30, 2013 2012
North America $ 17,856 $ 16,901Germany 48,256 44,818Other 21,132 18,487Intercompany eliminations (332) (205)
Total long-lived assets $ 86,912 $ 80,001
REVENUES - TOTAL BUSINESS Years ended September 30, 2013 2012 2011
North America $ 157,936 $ 168,262 $ 169,513Germany 358,701 365,122 426,424Other 262,197 222,034 231,218Intercompany eliminations (218,766) (215,297) (229,392)
$ 560,068 $ 540,121 $ 597,763
INTERCOMPANY REVENUES Years ended September 30, 2013 2012 2011
North America $ 13,859 $ 12,693 $ 13,545Germany 147,470 147,683 163,251Other 57,437 54,921 52,596Intercompany eliminations (218,766) (215,297) (229,392)
$ — $ — $ —
EXTERNAL REVENUES Years ended September 30, 2013 2012 2011
North America $ 144,078 $ 155,569 $ 155,968Germany 211,231 217,439 263,173Other 204,759 167,113 178,622
$ 560,068 $ 540,121 $ 597,763
INCOME BEFORE INCOME TAXES Years ended September 30, 2013 2012 2011
North America $ 10,275 $ 9,521 $ 8,664Germany 19,215 28,112 59,396Other 19,665 14,759 19,083
$ 49,155 $ 52,392 $ 87,143
16. ENTERPRISE WIDE INFORMATION The Company derives revenues from the sale and servicing of laser products used for macro applications, from the sale and servicing of laser products for marking and micro applications, and from the sale of components products.

F-30
Product and service sales are summarized below:
September 30,Product Category 2013 2012 2011Laser macro products $ 214,623 $ 205,394 $ 237,449Laser marking and micro products 272,632 272,195 302,330Components 72,813 62,532 57,984 $ 560,068 $ 540,121 $ 597,763
17. SELECTED QUARTERLY FINANCIAL DATA (Unaudited) The following represents the Company’s quarterly results (millions of dollars, except per share amounts):
Quarters ended
Dec. 31,
2012March 31,
2013June 30,
2013Sept. 30,
2013Net sales $ 142.2 $ 131.1 $ 139.1 $ 147.6Gross profit 50.1 46.8 49.3 50.2Net income 9.0 7.3 8.8 9.9Net income attributable to RSTI 8.9 7.4 8.7 9.8Earnings per share – Basic 0.32 0.26 0.31 0.35Earnings per share – Diluted 0.32 0.26 0.31 0.35
Quarters ended
Dec. 31,
2011March 31,
2012June 30,
2012Sept. 30,
2012Net sales $ 131.6 $ 129.4 $ 131.7 $ 147.5Gross profit 46.9 48.8 49.3 51.2Net income 8.2 8.2 8.6 10.2Net income attributable to RSTI 8.1 8.0 8.4 10.1Earnings per share – Basic 0.28 0.28 0.29 0.35Earnings per share – Diluted 0.28 0.28 0.29 0.35
18. TREASURY STOCK On August 1, 2012, the Board of Directors authorized the Company to initiate a share buyback of up to $20,000 of the Company's Common Stock over the proceeding twelve months ending August 10, 2013, subject to market conditions. The shares were able to be repurchased from time to time in open market transactions or privately negotiated transactions at the Company's discretion, including as to the quantity, timing and price thereof. During fiscal year 2013, the Company purchased approximately 0.2 million shares of common stock, at an average price of $23.01, under the stock buyback program for a total price of $4,122.
19. STOCK INCENTIVE PLANS Effective March 16, 2011, the stockholders approved an amendment to the ROFIN-SINAR Technologies Inc. 2007 Incentive Stock Plan (“the 2007 Incentive Plan”) that increases the number of shares reserved for issuance from 1,600,000 to 3,100,000 shares. The 2007 Incentive Plan supersedes the ROFIN-SINAR Technologies Inc. 1996 Non-Employee Directors’ Stock Plan and the ROFIN-SINAR Technologies Inc. 2002 Equity Incentive Plan. Under the 2007 Incentive Plan, the Company has reserved shares of common stock to provide for the grant of options to purchase common stock (“options”), grants of shares of common stock (“stock grants”), stock units, and stock appreciation rights (“SARs”) to certain eligible employees and to outside directors. There were no incentive stock options, restricted stock or performance shares granted in fiscal years 2013 or 2012

F-31
under this Plan. Non-qualified stock options were granted to officers and other key employees in fiscal years 2013 and 2012. During fiscal year 2013, outside directors each received 3,000 shares of common stock and 370,500 non-qualified stock options were granted to officers and other key employees. The terms of these issuances are the same as those described below. Directors’ Plan The Company had reserved 100,000 shares of common stock for the Directors’ Plan, which covered non-employee members of the Board of Directors. Under this plan each member of the Board of Directors who was not an employee of the Company and who was elected or continued as a member of the Board of Directors was entitled to receive an initial grant of 1,500 shares of common stock and thereafter an annual grant of 1,500 shares of common stock. The Directors’ Plan also provided that non-employee directors aged 65 or older, upon their appointment or election to the Board of Directors, will receive, in lieu of such initial and annual grants of shares of common stock, 7,500 shares of restricted stock which shall vest in 5 equal installments from the date of grant and each of the following four anniversaries thereof. Prior to vesting, no shares of restricted stock may be sold, transferred, assigned, pledged, encumbered or otherwise disposed of, subject to certain exceptions. The Company records compensation expense based on the fair market value of the common stock, as determined by the closing price at the date of issuance. This plan was superseded by the 2007 Incentive Plan, as discussed above. Equity Incentive Plan The Company also maintained the previous Equity Incentive Plans, whereby incentive and non-qualified stock options, restricted stock and performance shares were granted to officers and other key employees to purchase a specified number of shares of common stock at a price not less than the fair market value on the date of grant. The term of the Equity Incentive Plans continued through 2011. Options generally vest over five years and expire not later than ten years after the date on which they are granted. These plans were superseded by the 2007 Incentive Plan, as discussed above.
The fair value of our stock options was estimated based on the date of grant using the Black-Scholes option pricing model. The following assumptions were used in these calculations:
September 30,
2013
Grants2012
Grants2011
GrantsWeighted average grant date fair value $ 12.42 $ 11.09 $ 15.48Expected life 5 Years 5 Years 5 YearsVolatility 49.64% 46.11% 46.12%Risk-free interest rate 0.98% 1.22% 2.01%Dividend yield —% —% —%
For purposes of the Black-Scholes model, the Company uses historical data to estimate the expected life, volatility, and estimated forfeitures of an option. The risk-free interest rate is based on the U.S. Treasury yield curve in effect at the time of grant.

F-32
The balance of outstanding stock options and all options activity for the three-year period ended September 30, 2013, are as follows:
Number of
Shares
WeightedAverage
Exercise Price
Weighted AverageRemaining
Contractual Term(Years)
AggregateIntrinsic
Value(Millions)
Outstanding at September 30, 2012 3,109,850 $ 25 3/4
Granted 370,500 $ 27 3/5
Exercised (218,450) $ 13 2/8 Forfeited (23,200) $ 30 0 Outstanding at September 30, 2013 3,238,700 $ 26 9/10 5.24
Exercisable at September 30, 2013 2,199,200 $ 26 7/10 3.83 $ 4.3
As of September 30, 2013, there was $10,467 of total unrecognized compensation cost related to stock options. These costs are expected to be recognized over a weighted average period of 3.61 years.
Years ended September 30, 2013 2012 2011Fair value of shares vested during the year $ 4,035 $ 4,962 $ 5,550Total intrinsic value of stock options exercised $ 2,932 $ 1,363 $ 7,794Cash received from stock option exercises $ 2,901 $ 460 $ 7,153

F-33
SCHEDULE II
ROFIN-SINAR TECHNOLOGIES INC. AND SUBSIDIARIESValuation and Qualifying Accounts - Allowance for Doubtful Accounts
Years ended September 30, 2013, 2012, and 2011(dollars in thousands)
Balance atBeginning of
PeriodAcquiredReserve
Additions-Charged toCosts andExpenses (Deductions)
Balance at End ofPeriod
September 30, 2011 $ 3,020 $ 63 $ 1,623 $ (1,013) $ 3,693September 30, 2012 $ 3,693 $ — $ 1,666 $ (1,444) $ 3,915September 30, 2013 $ 3,915 $ — $ 156 $ (648) $ 3,423
Allowance for Inventory Reserve
Years ended September 30, 2013, 2012, and 2011(dollars in thousands)
Balance atBeginning of
PeriodAcquiredReserve Additions
Usage forDisposalsand Scrap
Balance at End ofPeriod
September 30, 2011 $ 19,945 $ 3,548 $ 7,051 $ (5,252) $ 25,292September 30, 2012 $ 25,292 $ — $ 7,039 $ (5,174) $ 27,157September 30, 2013 $ 27,157 $ — $ 8,890 $ (7,455) $ 28,592

F-34
INDEX TO EXHIBITS
Exhibit No. Exhibit
21.1 List of Subsidiaries of the Registrant 23.1 Consent of Deloitte & Touche, LLP Independent Registered Public Accounting Firm, 31.1 Rule 13a-14(a)/15d-14(a) Certification of Chief Executive Officer 31.2 Rule 13a-14(a)/15d-14(a) Certification of Chief Financial Officer 32.1 Section 1350 Certification of Chief Executive Officer 32.2 Section 1356 Certification of Chief Financial Officer
101
Interactive Data File In accordance with Rule 406T of Regulation S-T promulgated by the Securities and Exchange Commission, Exhibit 101 is deemed not filed or part of a registration statement or prospectus for purposes of Section 11 or 12 of the Securities Act of 1933, is deemed not filed for purposes of Section 18 of the Securities Exchange Act of 1934, and otherwise is not subject to liability under these sections.

EXHIBIT 21.1
LIST OF SUBSIDIARIES AND INVESTMENTS OF ROFIN-SINAR TECHNOLOGIES INC.
State or OtherName Jurisdiction of Incorporation
ROFIN-SINAR, Inc. Delaware, USAPRC LASER Corporation Delaware, USAPRC Laser Europe N.V. BelgiumLee Laser, Inc. Delaware, USANufern East Granby, USAROFIN-SINAR Technologies Europe S.L. SpainROFIN-SINAR Laser GmbH GermanyROFIN-BAASEL Japan Corp. JapanRasant-Alcotec Beschichtungstechnik GmbH GermanyBaasel Lasermed GmbH GermanyCBL Verwaltungsgesellschaft mbH GermanyROFIN-BAASEL Lasertech GmbH & Co. KG GermanyROFIN-BAASEL, Inc. Massachusetts, USAWB-PRC Laser Service GmbH GermanyOptoskand AB SwedenPMB Elektronik GmbH GermanyROFIN-BAASEL Italiana S.r.l. ItalyROFIN-BAASEL France SAS FranceROFIN-SINAR UK Ltd. United KingdomROFIN-BAASEL UK Ltd. United KingdomROFIN-BAASEL Benelux B.V. The NetherlandsROFIN-BAASEL Singapore Pte., Ltd. SingaporeROFIN-BAASEL Espana S.L. SpainDILAS Diodenlaser GmbH GermanyROFIN-BAASEL Taiwan Ltd. TaiwanROFIN-BAASEL Korea Co., Ltd. KoreaROFIN-BAASEL China Co., Ltd. ChinaROFIN-BAASEL Canada Ltd. CanadaDILAS Diode Laser, Inc. Delaware, USAm2k-laser GmbH GermanyCorelase Oy FinlandES Technology Ltd. United KingdomDILAS Diodelaser China Co., Ltd. ChinaNanjing Eastern Technologies Company, Ltd. ChinaROFIN-BAASEL Swiss AG SwitzerlandNanjing Eastern Laser Co., Ltd. ChinaROFIN-LASAG AG SwitzerlandROFIN BAASEL Laser India Pvt. Ltd. India

EXHIBIT 23.1
CONSENT OF INDEPENDENT REGISTERED PUBLIC ACCOUNTING FIRM
We consent to the incorporation by reference in Registration Statement Nos. 333-103145, 333-157973, and 333-174082 on Form S-8 of our report dated November 29, 2013, relating to the consolidated financial statements and financial statement schedule of ROFIN-SINAR Technologies Inc. and subsidiaries, and the effectiveness of ROFIN-SINAR Technologies Inc. and subsidiaries internal control over financial reporting, appearing in this Annual Report on Form 10-K of ROFIN-SINAR Technologies Inc. for the year ended September 30, 2013.
/s/ Deloitte & Touche LLP
Detroit, MI
November 29, 2013

EXHIBIT 31.1 Rule 13a-14(a)/15d-14(a) Certification of the Chief Executive Officer
I, Günther Braun, certify that:
1. I have reviewed this Annual Report on Form 10-K of ROFIN-SINAR Technologies Inc.
2. Based on my knowledge, this Annual Report does not contain any untrue statement of a material fact or omit to state a material fact necessary to make the statements made, in light of the circumstances under which such statements were made, not misleading with respect to the period covered by this report.
3. Based on my knowledge, the financial statements, and other financial information included in this Annual Report, fairly present in all material respects the financial condition, results of operations and cash flows of the registrant as of, and for, the periods presented in this Annual Report.
4. The registrant’s other certifying officer(s) and I are responsible for establishing and maintaining disclosure controls and procedures (as defined in Exchange Act Rules 13a-15(e) and 15d-15(e)) and internal control over financial reporting (as defined in Exchange Act Rules 13a-15(f) and 15d-15(f) for the registrant and have:
a) designed such disclosure controls and procedures, or caused such disclosure controls and procedures to be designed under our supervision, to ensure that material information relating to the registrant, including its consolidated subsidiaries, is made known to us by others within those entities, particularly during the period in which this report is being prepared;
b) designed such internal control over financial reporting, or caused such internal control over financial reporting to be designed under our supervision, to provide reasonable assurance regarding the reliability of financial reporting and the preparation of financial statements for external purposes in accordance with Generally Accepted Accounting Principles;
c) evaluated the effectiveness of the registrant’s disclosure controls and procedures and presented in this report our conclusions about the effectiveness of the disclosure controls and procedures, as of the end of the period covered by this report, based on such evaluation; and
d) disclosed in this report any change in the registrant’s internal control over financial reporting that occurred during the registrant’s most recent fiscal quarter (the registrant’s fourth fiscal quarter in the case of an annual report) that has materially affected, or is reasonably likely to materially affect, the registrant’s internal control over financial reporting; and
5. The registrant’s other certifying officer and I have disclosed, based on our most recent evaluation of internal control over financial reporting, to the registrant’s auditors and the audit committee of registrant’s board of directors (or persons performing the equivalent functions):
a. all significant deficiencies and material weaknesses in the design or operation of internal control over financial reporting which are reasonably likely to adversely affect the registrant’s ability to record, process, summarize and report financial information; and
b. any fraud, whether or not material, that involves management or other employees who have a significant role in the registrant’s internal control over financial reporting.
Date: November 29, 2013
/s/ Günther BraunGünther BraunChief Executive Officer

EXHIBIT 31.2
Rule 13a-14(a)/15d-14(a) Certification of the Chief Financial Officer I, Ingrid Mittelstaedt, certify that: 1. I have reviewed this Annual Report on Form 10-K of ROFIN-SINAR Technologies Inc.
2. Based on my knowledge, this Annual Report does not contain any untrue statement of a material fact or omit to state a material fact necessary to make the statements made, in light of the circumstances under which such statements were made, not misleading with respect to the period covered by this report.
3. Based on my knowledge, the financial statements, and other financial information included in this Annual Report, fairly present in all material respects the financial condition, results of operations and cash flows of the registrant as of, and for, the periods presented in this Annual Report.
4. The registrant’s other certifying officer(s) and I are responsible for establishing and maintaining disclosure controls and procedures (as defined in Exchange Act Rules 13a-15(e) and 15d-15(e)) and internal control over financial reporting (as defined in Exchange Act Rules 13a-15(f) and 15d-15(f) for the registrant and have:
a) designed such disclosure controls and procedures, or caused such disclosure controls and procedures to be designed under our supervision, to ensure that material information relating to the registrant, including its consolidated subsidiaries, is made known to us by others within those entities, particularly during the period in which this report is being prepared;
b) designed such internal control over financial reporting, or caused such internal control over financial reporting to be designed under our supervision, to provide reasonable assurance regarding the reliability of financial reporting and the preparation of financial statements for external purposes in accordance with Generally Accepted Accounting Principles;
c) evaluated the effectiveness of the registrant’s disclosure controls and procedures and presented in this report our conclusions about the effectiveness of the disclosure controls and procedures, as of the end of the period covered by this report, based on such evaluation; and
d) disclosed in this report any change in the registrant’s internal control over financial reporting that occurred during the registrant’s most recent fiscal quarter (the registrant’s fourth fiscal quarter in the case of an annual report) that has materially affected, or is reasonably likely to materially affect, the registrant’s internal control over financial reporting; and
5. The registrant’s other certifying officer and I have disclosed, based on our most recent evaluation of internal control over financial reporting, to the registrant’s auditors and the audit committee of registrant’s board of directors (or persons performing the equivalent functions):
a) all significant deficiencies and material weaknesses in the design or operation of internal control over financial reporting which are reasonably likely to adversely affect the registrant’s ability to record, process, summarize and report financial information; and
b) any fraud, whether or not material, that involves management or other employees who have a significant role in the registrant’s internal control over financial reporting.
Date: November 29, 2013
/s/ Ingrid MittelstaedtIngrid MittelstaedtChief Financial Officer

EXHIBIT 32.1
Section 1350 Certification of the Chief Executive Officer In connection with the Annual Report of ROFIN-SINAR Technologies Inc. (the “Company”) on Form 10-K for the year ended September 30, 2013, as filed with the Securities and Exchange Commission on the date hereof (the “Report”), I, Günther Braun, Chief Executive Officer of the Company, certify, pursuant to 18 U.S.C. § 1350, as adopted pursuant to § 906 of the Sarbanes-Oxley Act of 2002, that:
(1) The Report fully complies with the requirements of section 13(a) or 15(d) of the Securities Exchange Act of 1934; and
(2) The information contained in the Report fairly presents, in all material respects, the financial condition and results of operations of the Company.
Date: November 29, 2013
/s/ Günther BraunGünther BraunChief Executive Officer

EXHIBIT 32.2
Section 1350 Certification of the Chief Financial Officer In connection with the Annual Report of ROFIN-SINAR Technologies Inc. (the “Company”) on Form 10-K for the year ended September 30, 2013, as filed with the Securities and Exchange Commission on the date hereof (the “Report”), I, Ingrid Mittelstaedt, Chief Financial Officer of the Company, certify, pursuant to 18 U.S.C. § 1350, as adopted pursuant to § 906 of the Sarbanes-Oxley Act of 2002, that:
(1) The Report fully complies with the requirements of section 13(a) or 15(d) of the Securities Exchange Act of 1934; and(2) The information contained in the Report fairly presents, in all material respects, the financial condition and results of
operations of the Company.
Date: November 29, 2013
/s/ Ingrid MittelstaedtIngrid MittelstaedtChief Financial Officer

ROFIN-SINAR Technologies Inc.,40984 Concept Drive, Plymouth,MI 48170, USA, [email protected],www.rofin.com