the prospects for a zero ghg power sector in latin america · the prospects for a zero ghg power...
TRANSCRIPT

The prospects for a zero GHG power sector in Latin America
Walter Vergara, July 7th , 2017
Senior fellow, WRI
Inter American Dialogue, Washington DC
Abengoa, Conceptualization of Cerro Dominador CSP plant in Chile

• 10% of global emissions (4.6 GtCO2e); 7.7 tCO2e per capita;
• 22% decrease in carbon intensity per GDP-PPP since 2000;
• 48% renewable power = 0.21 tCO2e /MWh;
• Urban public-transport share of passenger trips even higher than in
Northern Europe;
• Nearly 50% of emissions come from land use and land use change.
LAC’s carbon footprint

Projected demand and emissions of the power sector
0
5
10
15
20
25
2000 2010 2020 2030 2040 2050 2060 2070
EJ/y
ear
GEA-MIX GEA-BAU
0
500
1000
1500
2000
2500
1990 2012 2030 2050 2070
MtC
O2e
CAIT | GEA-BAU
(CAIT, 2015; IIASA, 2015)

Area: 102,000 sq km Irradiance 265 W/m2 Power received 27.4 TW or 80 PWh per year Proven oil reserves of Saudia Arabia 268 billion barrels of oil If all converted to power: 26 PWh With average efficiency of 15% In 16 years, 4% of the area of Atacama generates same power as all the proven all proven oil reserves of Saudi Arabia.
Atacama Desert Energy field

Area: 10,000 sq km Wind Field: Class Seven (Consistent over 9m/s at 50 m height) Estimated Wind Energy Potential: 18 GW (ACS, 2012) (Prieto, 2008) (Colombia’s estimated installed capacity is 15.5 GW) Installed capacity: 20 MW Projects proposed: 3 GW
Atacama desert: Energy field Guajira Peninsula Energy Field
Jepirachi power plant

(Ecofys, 2009)
Resource endowment Renewable energy sources in Latin America
0 20 40 60
PWh/year
Geothermal
OCEAN
Hydro-Power
Wind-offshore
Wind-onshore
Solar PV
Solar CSP
Biomass-Residues
• The region’s endowment estimated to be at about 93 PWh (Ecofys 2009)
• The global power
demand sits at 19.7 PWh (EIA,2015).

Hydro power plants > 1 GW nominal capacity
Source: Power Watch, 2017

Policy Framework has made progress
• Most countries: o RE targets
o RE programs & policies
• Many countries: o Fiscal incentives/provisions
• Some countries o Carbon tax
o Preferential dispatch
o Regs on distributive power

(IRENA, 2015)
Generation costs are falling (US$/kWh)

Calculated LCOEs for renewables

0
0.05
0.1
0.15
0.2
0.25
0.3
0.35
0.4
Solar PV Solar CSP Wind onshore
US$
/kW
h
2012 20252050 2075
0.000
0.050
0.100
0.150
0.200
0.250
0.300
0.350
0.400
0.450
0.500
2012 2025 2050 2075
US$
/kW
h
HydroWindSolar utility PVSolar CSP without storageSolar Tower with 7 h storageWave powerTidal powerGeothermalCoalNatural gasDiesel (1.71 US$/gallon)Diesel (5 US$/gallon)

Pathway to zero carbon power in LAC
• All new demand is met by renewables by 2020
• Fossil plants other than gas are mothballed by 2030
• All NG plants are mothballed by 2050
• Grid integrated by 2030 (regional storage in hydro)
• Widespread distributed power by 2030
80 GW
240 GW
540 GW 960 GW

Key barriers facing decarbonisation of power in the region
San Jacinto-Tecate Geothermal Plant
Fossil-fuel subsidies remain an important obstacle to entry; Lack of CO2 market/carbon tax delays transition; Grid integration and distributed power face entrenched interests; Regional market integration in power needs to be achieved.

Interconnected regional grid
• Allow large reservoirs of renewable energy to access regional market;
• Dampen the intermittencies of local renewable resources;
• Allow regional multi-annual reservoirs to operate as a large energy storage facility;
• Reduce power costs.

Modal share in urban transport
Sources: (Berlin, 2013), (Bogotá, 2013), (Curitiba, 2011), (Copenhagen, 2013), (USA, 2012) recalculated
26%
31%
30%
13%
Berlin
Public Transport
Private Transport
Walk
Cycle
44.7%
17.5%
27.5%
5.1% 3.8% 1.5%
Bogota
Public Transport
Private Transport
Walk
Taxi
Cycle
Other
28%
29%
7%
36%
Copenhagen
Public Transport
Private Transport
Walk
Cycle
45%
28%
21%
5% 1% Curitiba
Public Transport
Private Transport
Walk
Cycle
Other
5.2%
79.8%
10.1%
2.9% 1.3% 0.6% USA
Public Transport
Private Transport
Carpool
Walk
Taxi
Cycle
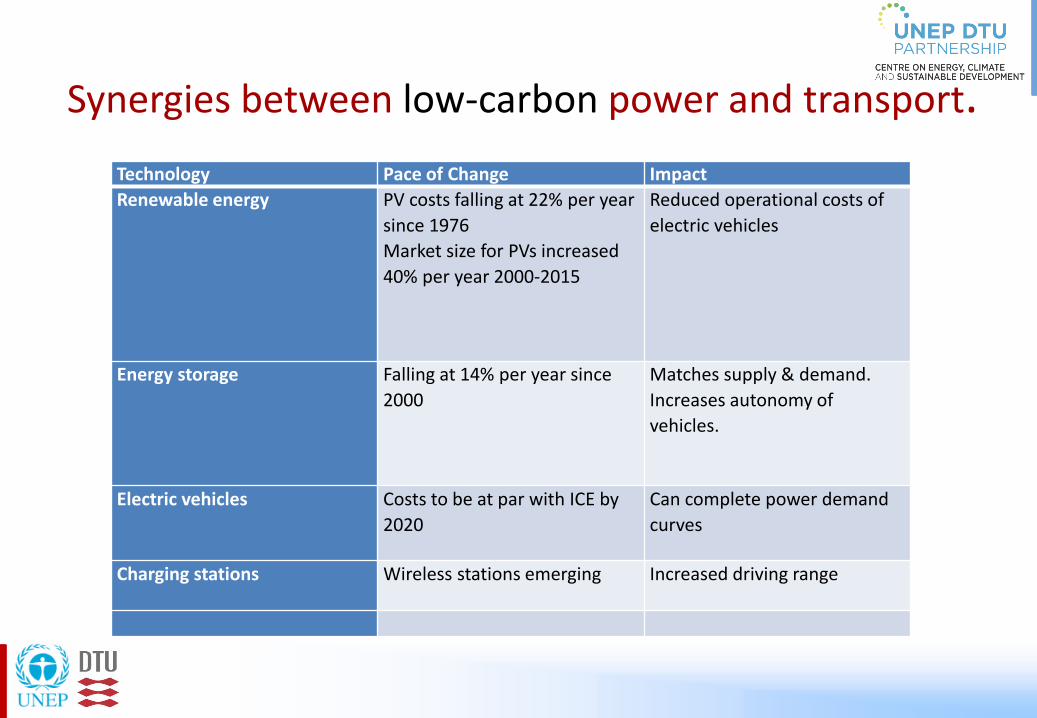
Synergies between low-carbon power and transport.
Technology Pace of Change Impact
Renewable energy PV costs falling at 22% per year
since 1976
Market size for PVs increased
40% per year 2000-2015
Reduced operational costs of
electric vehicles
Energy storage Falling at 14% per year since
2000
Matches supply & demand.
Increases autonomy of
vehicles.
Electric vehicles Costs to be at par with ICE by
2020
Can complete power demand
curves
Charging stations Wireless stations emerging Increased driving range


Projected learning curves for electric vehicle options with credit for avoided
cost of air pollution
0.0
0.2
0.4
0.6
0.8
1.0
1.2
1.4
1.6
1.8
Electric Cars Electric Buses (18m) Electric Trucks
US$
/km
2012 2025 2050 2075
current LCOE for Gasoline Cars
current LCOE for Diesel Buses
current LCOE for Diesel Trucks

Energy savings from full transport electrification
0
1
2
3
4
5
6
2005 2010 2020 2030 2040 2050 2060 2070
PW
h/y
ear
Equivalent energy demand of transport sector if fossil fuels were used
Actual energy demand of electricity by transport sector
Author’s estimates. (IIASA, 2012)

Complementarity of electricity and transport demand
Typical daily load curve in Colombia. Nominal capacity for hydro is 10GW. System requires expansion to handle peak demand. Daily energy demand of diesel is 180 GWh per day, or 60 GWh electric. If 50% is now electric, this would require an additional capacity of 1250 MW per hour distributed during the period of lower demand.
Typical load curve of power demand In Colombia.

Added value of a Zero GHG Power Sector • Energy security (inexhaustible renewable resources);
• Improvements in terms of trade;
• Improved air quality in urban areas (electrification of transport);
• Regional cooperation (integrated grid and means of transport); and,
• Places the region on a path more consistent with the sustainable development goals just adopted by the UN (climate, cities, energy, forests)
• It would support the deployment of new means of production and better use of natural resources with improvements in quality of life. It would not just signal a leadership role for the region in the climate arena.

Data sources
• CAIT (emissions today, www.cait.wri.org), • IIASA (emissions under BAU projections, (www.iiasa.ac.at/web-
apps/ene/geadb/dsd) • ENERDATA (energy use in transport and energy, www.enerdata.net) • GACMO (LCOE and LCOT, www.cdmpipeline.org) • Contact: [email protected]
• The report can be downloaded with the following links: • - English:
http://orbit.dtu.dk/files/123115955/Zero_Carbon_Latin_America_rev.pdf
• - Spanish: http://orbit.dtu.dk/files/123116630/Carbono_Cero.pdf