the prospects for sustained growth in africa: …
TRANSCRIPT
NBER WORKING PAPER SERIES
THE PROSPECTS FOR SUSTAINED GROWTH IN AFRICA:BENCHMARKING THE CONSTRAINTS
Simon JohnsonJonathan D. Ostry
Arvind Subramanian
Working Paper 13120http://www.nber.org/papers/w13120
NATIONAL BUREAU OF ECONOMIC RESEARCH1050 Massachusetts Avenue
Cambridge, MA 02138May 2007
Simon Johnson is the Ronald A. Kurtz Professor of Entrepreneurship at the Sloan School of Management,MIT. Jonathan D. Ostry is Deputy Director of the Research Department at the IMF. Arvind Subramanianis a Senior Fellow at the Peterson Institute for International Economics. Work on this paper was undertakenwhile Johnson was a visiting scholar in the IMF's Research Department, and Subramanian was AssistantDirector of the Macroeconomic Studies Division of the Research Department at the IMF. The viewsexpressed in this paper are those of the authors and do not necessarily represent the views of the IMFor IMF policy. This paper is a revision of a background paper prepared for the NBER's Africa meetingin April 2006 and was also presented at the Peterson Institute of International Economics. We thankparticipants, and particularly Fred Bergsten, Martin Feldstein, and Ben Jones, as well as colleaguesat the IMF for helpful comments. We are grateful to Manzoor Gill and Murad Omoev for superb assistancewith the data. The views expressed herein do not necessarily reflect the views of the National Bureauof Economic Research.
© 2007 by Simon Johnson, Jonathan D. Ostry, and Arvind Subramanian. All rights reserved. Shortsections of text, not to exceed two paragraphs, may be quoted without explicit permission providedthat full credit, including © notice, is given to the source.

The Prospects for Sustained Growth in Africa: Benchmarking the ConstraintsSimon Johnson, Jonathan D. Ostry, and Arvind SubramanianNBER Working Paper No. 13120May 2007JEL No. O10,O11,O43,O55
ABSTRACT
A dozen countries had weak institutions in 1960 and yet sustained high rates of growth subsequently.We use data on their characteristics early in the growth process to create benchmarks with which toevaluate potential constraints on sustained growth for sub-Saharan Africa. This analysis suggests thatwhat are usually regarded as first-order problems -- broad institutions, macroeconomic stability, tradeopenness, education, and inequality -- may not nowbe binding constraints in Africa, although the extentof ill-health, internal conflict, and societal fractionalization do stand out as problems in contemporaryAfrica. A key question is to what extent Africa can rely on manufactured exports as a mode of "escapefrom underdevelopment," a strategy successfully deployed by almost all the benchmark countries.The benchmarking comparison specifically raises two key concerns as far as a development strategybased on expanding exports of manufactures is concerned: micro-level institutions that affect the costsof exporting, and the level of the real exchange rate -- especially the need to avoid overvaluation.
Simon Johnson4901 46th Street NWWashington, DC 20016and [email protected]
Jonathan D. OstryInternational Monetary Fund700 19th Street, N.W.Washington, DC [email protected]
Arvind SubramanianInternational Monetary Fund700 19th Street, N.W.Washington, DC [email protected]

1
I. INTRODUCTION
Conventional wisdom has long been negative on African growth. Sub-Saharan Africa
is commonly regarded as destined to remain poor either because of its geography (including
its unique disease burden) or its ethnolinguistic fractionalization (leading to repeated
conflicts) or its deep-rooted corruption. The precise mechanisms vary, but a standard
argument has been that Africa’s economic prospects are not bright because its long-standing
problems are hard to fix.
In contrast, some more optimistic recent views hold that Africa either is improving by
itself and/or could improve dramatically if more foreign aid were provided.2 Again, the
precise mechanism varies, but these views are unified by much more positive assessments of
Africa’s growth potential (although they disagree on how much additional funding through
aid is desirable.)
There is no doubt that Africa has done badly, on average and for the most part, not
just over the past 20-40 years, but in fact since the beginning of modern economic growth in
the nineteenth century. It is also indisputable that much of Africa is currently doing quite
well—for the region south of the Sahara, growth in total GDP will likely have exceeded 5
percent in 2006 for the third straight year and per capita growth is running in the range of
3.5-4 percent in recent years.3 The controversy rather lies with how to think about the last
2 The Commission on Africa (often referred to as the Blair Commission) articulated the first view; see also Collier and O’Connell (2006). The U.N. Millennium Project, headed by Jeffrey Sachs, has taken the second position. 3 The IMF growth forecasts for 2007 are 6.3 percent for GDP and 4.4 percent for GDP per capita, though it should be acknowledged that there is a well-established optimistic bias in these forecasts: see Timmermann (2006). These estimates are based on treating sub-Saharan Africa as one country,
(continued…)

2
decade or so, as well as the current situation and immediate future. In particular, are there
indications that parts of Africa can sustain growth at rates that are consistent with lifting
entire countries out of poverty—as East Asia did in the decades after 1960?
The key word here is “sustain.” Is today’s growth likely to be sustained for 10 or 15
or more years? We know that what is associated with growth accelerations is not necessarily
what keeps growth going—for example, an increase in commodity prices sparked growth in
much of Africa during the 1960s, but this growth proved hard to sustain as political conflicts
developed.
There is not yet a unified theory of sustained growth. As a consequence, there is also
not an accepted equation into which we can plug values to obtain the likely duration of a
rapid growth spell. However, there are at least three plausible views regarding what is
associated with crises and derails growth, i.e., what tends to cause decelerations.
First, while weak economic and political institutions do not appear to prevent growth
episodes, they are very much associated with severe crises and the derailment of growth
(Acemoglu et. al., 2003, Satyanath and Subramanian, 2007). It is hard to escape bad
institutions. Good leaders can make a difference for a while, but when they leave office,
countries with weak institutions (i.e., autocracies) will often suffer a relapse (Jones and
Olken, 2005a).
Weak institutions are associated with and arguably manifest in high degrees of
inequality (Acemoglu, Johnson, and Robinson, 2005a). Inequality can curtail expansions
both because societies with unequal distributions handle the distributional consequences of
adverse external shocks poorly (Rodrik, 1999). Berg, Ostry, and Zettelmeyer (2006), looking
i.e., they are averages across countries weighted by GDP. Table 1a and Appendix Table 9 provide
(continued…)

3
at a broad panel of post-1945 accelerations, find that the duration of such episodes is
negatively related to initial income inequality. Moreover, the effects seem to be very large,
with each percentage point of the Gini coefficient raising the annual risk that a growth spell
will end by between 7 percent and 15 percent, relative to the baseline.
Second, a greater propensity to experience conflict or civil strife might also prove to
be a key factor curtailing growth accelerations. This might be part of weak institutions or, in
some cases, it may be that formal institutions are strong while society remains deeply
divided—and these divisions are sometimes manifest in damaging conflict.
Third, bad macroeconomic policies (particularly inflation), protectionism and/or
overvalued exchange rates may choke off growth in the tradable goods sector.4 This may
make it harder to find profitable opportunities in the economy as a whole, or it may draw
resources into imports in a way that proves unsustainable. Across a variety of methodologies,
for example, overvaluation is robustly correlated with crises, even when controlling for
deeper determinants of problems, such as inequality and institutions: see, for example,
Acemoglu et. al., 2003, “Growth and Institutions” in IMF (2003) and “Building Institutions”
in IMF (2005).
In addition, there are at least two other possible explanations for poor longer-term
growth performance that are particularly relevant for Africa: inadequate education and poor
alternative calculations for aggregate growth. 4 In principle, growth could be sustained without growth in the tradable goods sector. In practice, this does not seem to happen in developing countries as they converge toward standards of living in the rich countries. Either tradable goods are particularly important in productivity growth directly, through some form of spillover, or this sector has important indirect effects (through its demands for better institutions.)
4
health.5 Both are symptoms of insufficient physical capital (i.e., not enough schools and
clinics) and initial levels of human capital that are “too low” to allow accumulation of further
human capital (i.e., not enough teachers and doctors to develop skills in healthy young
people). Both of these factors could conceivably limit the returns on productive private
investments—for example, some minimum amount of skill or a basic road network may be
necessary to support a modern manufacturing sector. Perhaps there are temporary booms,
based on commodity prices, and then collapses when prices fall because skills have not
developed further.
What is the threshold level at which any of these indicators signal a potential problem
with sustained growth? This is hard to know in the abstract and presumably depends on the
context, including the interaction between various indicators. One plausible benchmark,
however, is the recent (post-1945) experience of countries that started with weak institutions
(and relatively low income levels) but nevertheless were able to sustain rapid growth. (There
is, of course, not one definition of “rapid” growth; we look at various alternatives below.)
Relatively few (we count no more than 12–see below) initially poor countries have
managed to sustain rapid growth (and improve their institutions) to an extent described below
in the past 50 years. Almost all of these countries experienced a rapid growth in exports; in
most cases the rapid increase in exports was of manufactures.6 In this paper, we examine
whether any African countries show new signs of breaking away from the poverty path
(through exports of any kind, or in some other way).
5 Taken literally, these views would tend to suggest there should never be growth, rather than a problem with sustaining growth. 6 To be clear, we are not claiming any causal effect from exports to growth. We are merely pointing out the association and suggesting that this warrants serious attention.
5
The data that would allow such a comparison (from the right time period—early in
sustained accelerations) are not readily available; one contribution here is a dataset that
others can use (and criticize and, hopefully, improve).7 We therefore present our data in
considerable detail, documenting the years covered by available sources and discussing the
weaknesses.
The good news from this comparison is that, in terms of the standard concerns, the
prospects for sustained African growth are not unfavorable. Broadly defined, institutions
have improved. In some cases they have improved dramatically—this reflects the end of civil
war (which often has destabilizing effects on entire regions) and, in some places, the
strengthening of democracy. There is also widespread macroeconomic stability and there
has been a great deal of trade liberalization (in the sense of opening to imports).8
However, the benchmarking suggests three important caveats to this positive
assessment. First, in terms of specific economic institutions, as measured for example by the
World Bank’s Doing Business project, there remains a wide gap between Africa and most
other developing countries. In particular, the regulatory costs of exporting are high in much
of Africa. These numbers have to be used with care because (a) we do not (and will likely
never) know what these indicators were when East Asia took off, and (b) there are no data
7 We use standard international sources. There is a great that could be done, however, by digging into national statistical records. Hopefully, what we present here will serve as a preliminary guide to such investigations. 8 Recent debt reductions have helped: see “Review of Low-Income Country Debt Sustainability Framework and Implications of the MDRI [Multilateral Debt Relief Initiative],” (IMF and World Bank, 2005b).

6
over time, so perhaps these measures have also improved in Africa. Still, this is a key issue
for the future.9
Second, some African countries seem to have experienced significant real exchange
rate overvaluation; there are also pressures for further appreciation (e.g., due to higher
commodity prices or aid inflows). In contrast, almost all the East Asian (and other) success
stories avoided any episode of significant overvaluation during the entire period of sustained
growth.10 There is a definite warning here for Africa, especially since there may be a need for
these countries to diversify out of commodity dependence and to increase manufacturing
exports as the East Asian countries did so successfully.
Third, health indicators in Africa are much less robust today than they were in most
of the benchmark countries were when they started to grow. In part this is due to weaker
public health systems, but in part it may also be due to the disease environment in Africa—
for example, malaria has long been a particularly intense problem. Improving health is a first
order issue for its own sake; the impact on growth, however, remains unclear (see Acemoglu
and Johnson, 2006).
Section II briefly reviews what we know about the key constraints on sustained
growth and explains our choice of benchmark countries. Section III compares recent African
growth with experience in our benchmark countries. Section IV focuses on comparing
9 We do not know why measures of broad and specific institutions paint such a different picture. Leading data sources suggest that economic institutions have improved almost everywhere in the world since they became a standard measure (roughly in the mid-1990s). There is a strong possibility that a version of the Lucas Critique applies—using historical performance (of broad institutions) to guide policy actions can be misleading. Alternatively, it might be thought of as the Goodhart Effect—any number that becomes a target for policy loses its meaning (while the underlying phenomenon does not necessarily change.)

7
institutions in Africa today and our benchmark countries early in their growth process,
including measures of inequality and conflict. Section V provides a similar comparison for
trade outcomes and policies, while Section VI looks at the available measures of education
and health. Section VII concludes.
II. CONSTRAINTS ON SUSTAINED GROWTH
A. Institutions
Economic thinking about growth has changed a great deal over the last 15 years.
Post-war growth theory stressed the need to accumulate factors of production—capital, and
unskilled and skilled labor—and to increase the productivity with which these factors are
used. But it left unanswered what has proved to be the more basic and essential question:
under what conditions do countries accumulate factors and improve productivity? To answer
this, attention has turned increasingly to broad economic institutions.
Broad economic institutions are the set of laws, rules, and other practices that govern
property rights. They also encompass the provision of law and order, and efficient
bureaucracies. Good economic institutions create effective property rights for most people,
including both protection against expropriation by the state (or powerful elites), and
enforceable contracts between private parties. Although this definition is far from requiring
full equality of opportunity in society, it implies that societies where only a small fraction
10 Experience in Latin America since 1960 suggests that repeated bouts of overvaluation are damaging to both exports and, more broadly, to growth; see Berg, Ostry and Zettelmeyer (2006) for more analysis and discussion.

8
of the population have well-enforced property rights do not have good economic
institutions.11
Bad economic institutions mean insecure property rights for most people. Insecure
property rights can arise from expropriation by the state or powerful elites (often manifest in
the form of corruption) or from severe political instability (e.g., failed states and
conflict/post-conflict situations). Serious crime and the collapse of the state’s capacity to
maintain public order can very quickly undermine property rights. Thus, good economic
institutions are essential to create markets and sustain efficient market transactions.
In the case of institutions, perceptions are key—if entrepreneurs can be confident that
their property rights will be protected, they will be comfortable investing with relatively little
in the way of formal rights. However, perceptions eventually need to be underpinned by
actual protections, i.e., if property can be stolen or expropriated, there should be recourse or
appeal of some meaningful kind. Property rights are never perfect, and conflicts often emerge
between alternative claimants on property. The issue is the extent to which property rights
are protected, preferably by a fair and transparent process of dispute resolution.
The centrality of institutions in the growth process rests on the notion that if a country
builds good institutions, entrepreneurs will invest in capital goods and ordinary people will
invest in human capital; strong institutions will also reduce the likelihood of
economic/financial crises curtailing a growth acceleration, and will smooth adjustment to
adverse shocks that could also curtail an expansion. Empirical results from a range of authors
over the past decade suggest that the magnitude of the impact of institutions is likely to be
substantial. For example, in some estimates, an improvement in sub-Saharan Africa’s level of
11 In a number of resource-rich economies, property rights are reasonably protected in the resource
(continued…)
9
institutional development from its current average to the mean of developing Asia could be
associated with as much as an 80 percent increase in its per capital income (from $800 to
over $1400).12 This long-run effect is likely to reflect the favorable impact of institutions on
the duration of growth spells and the volatility of economic growth.
However, institutions do not necessarily have to be improved directly and
immediately in order for growth to occur. The question is, therefore, if initial institutions are
weak, what can we say—quantitatively—about the experience of countries as far as being
able to initiate growth, and sustain that acceleration. And, in circumstances in which a
durable acceleration takes place, to what degree is there also a virtuous circle with respect to
improvements in the quality of broad institutions? These are the issues to which we now turn.
B. A Benchmarking Approach
There is a great deal of agreement on the qualitative issues that matter for sustained
growth, but little hard guidance on the numbers, i.e., when is a potential problem a real
problem? For example, the recent Barcelona Consensus—drafted by a Who’s Who of growth
economists—argues that while institutions matter, they are not the whole story.13 A similar
point is sometimes made about macroeconomic constraints—for example, inflation can be a
sector itself, but similar protection may not exist economy-wide. 12 See also Acemoglu, Johnson and Robinson, 2001, and Rodrik, Subramanian and Trebbi, 2004, for the empirical analysis that gives rise to these estimates. 13 This is also known as the Barcelona Development Agenda, see http://www.barcelona2004.org/esp/banco_del_conocimiento/docs/agenda_eng.pdf. The Barcelona participants were: Olivier Blanchard, Guillermo Calvo, Daniel Cohen, Stanley Fischer, Jeffrey Frankel, Jordi Galí, Ricardo Hausmann, Paul Krugman, Deepak Nayyar, José Antonio Ocampo, Dani Rodrik, Jeffrey D. Sachs, Joseph E. Stiglitz, Andrés Velasco, Jaime Ventura, and John Williamson. On these issues, there seems to have been considerable convergence with World Bank views; see http://www1.worldbank.org/prem/lessons1990s/chaps/frontmatter.pdf
10
problem, but no one argues that low inflation is sufficient to ignite growth. What exactly are
the critical constraints?
We develop and apply simple benchmarks, based on the experience of countries that
plausibly (a) had weak institutions in 1960, and (b) sustained high rates of growth after 1960.
Point (a) is important because we take seriously the concern that developing countries today
may be different from European and other countries that either had good institutions already
by 1850 or were well on their way to developing such institutions.14
Our benchmarks are therefore drawn from countries that have recently escaped
poverty (or are well on their way) despite a difficult starting position, as measured by their
economic and political institutions. The 12 countries that we characterize as having had weak
institutions at the time of their growth take-off clearly scored poorly on a widely accepted
measure of political institutions: on the Polity IV measure of constraint on the executive,
which ranges from 1-7, their average score was 2.2 (compared with 7 for most advanced
industrial economies).
An alternative would be look only at countries that escaped poverty despite weak
initial economic institutions. Unfortunately, the standard measures of economic institutions
are available only from the mid-1980s and, given that economic institutions likely improved
over time in many of these rapidly growing countries, these are not appealing. However,
Adelman and Morris (1971) compiled measures of economic and social institutions circa
1960 (actually 1958-63). While their coverage is not as extensive as that of the Polity IV
database used in this paper, they tell a broadly similar story of economic institutions not
14 While we do not necessarily agree with the arguments and interpretation of historical evidence in Chang (2005), we do agree that it may be unreasonable to expect poor countries today to see improving their institutions as a necessary condition for growth.
11
being strong at the time of the take-off of the SG countries. Their best proxy for the quality
of economic institutions is probably the “degree of administrative efficiency of public
administration.” On this measure, the average score for the sustained growth countries (SGs)
in 1960 is about the average for a group of all developing countries.15
The benchmarking approach has several advantages. It is quite transparent—others
may disagree with the construction of our criteria, but at least these criteria are clear. Also,
while the composition of the benchmark can be criticized, once that benchmark is established
our judgment of what is happening in Africa is driven just by the numbers (not by any
preconceptions we may have about particular African countries.)
The main disadvantage of this approach is that it does not incorporate any notion of a
tradeoff. For example, perhaps good performance on one dimension can compensate for
weaker performance on another dimension. This being said, the benchmarking of Africa
today against post-war growth success-from-initial-weakness stories does reveal a number
of common features that appear to drive the latter and a number of common hurdles that
African countries appear to need to overcome.
C. Cases of Sustained Growth Accelerations
Defining sustained growth accelerations cannot be an entirely objective exercise
because it depends on the criteria for defining sustained growth and accelerations, in
particular there can be long debate about the level of growth rates worthy of being regarded
15 There are nine SGs for which this measure is available (China, Malaysia, and Singapore, are missing), and their average is 51.1. For the sample of 74 developing countries for which Adelman and Morris provide data, the average is 47.7 with a standard deviation of 30. Adelman and Morris provide a letter code and a separate conversion to a numerical scale; we applied this scale to the above calculations.

12
as high, and also the change in growth that deserves to be called an acceleration. Here we
adopt the (well-known, but still debated) criteria from Hausmann, Pritchett and Rodrik
(2004). These yield a set of sustained growth acceleration that accord broadly with anecdotes
of success stories—no notable successes are left out, and applying the same criteria in an
even-handed fashion actually includes several cases that usually do not get much attention.
The exact criteria are as follows.16 Countries must have experienced: an improvement
in growth rates of at least 2 percentage points per capita (this captures the idea of
acceleration);17 sustained growth of at least 3½ percent per capita for seven years; and higher
post-acceleration income level than the pre-acceleration peak (this is to ensure that
accelerations are not simply a rebound from a prior period of very bad performance, for
example, due to wars or conflict or other shocks). In addition, growth per capita must remain
above 3 percent after seven years, which captures the sense that good performance is
sustained.
These criteria are actually quite moderate—leading to a doubling of income in 20-35
years. As we will see, there are (a few) countries that have greatly exceeded these growth
rates on average. Nevertheless, these numbers offer a minimum level of performance that can
reasonably be regarded as sustained growth.
Also, while the timing of these accelerations can be debated further, assigning a
precise date is useful, because it allows us to focus our attention on the conditions that
16 We exclude from our sample industrial and transition countries. This excludes, for example, Ireland, Portugal, and Spain, which have sustained high growth over at least part of this period; a number of transition countries are also on the verge of qualifying, if their growth holds up. 17 While our real interest is in cases of sustained and high growth rates, the fact that many sub-Saharan African countries have been stagnating means that attaining high growth will almost inevitably require an acceleration. Thus, identifying the features associated with such accelerations is likely to be useful.

13
prevailed when the growth rate picked up (and shortly thereafter). Subject to data limitations,
we can discern something about what was or was not a constraint, and this may be relevant
for Africa today.
Our focus is on whether African countries can sustain growth despite weak initial
institutions, so countries that had accelerations based on strong initial (around 1960)
institutions already are excluded from our benchmark (the data are not perfect, but countries
such as Botswana, India, Mauritius, and Sri Lanka are excluded from our sustained growth
benchmark on this basis).18 (Botswana and Mauritius will appear in our African data, as that
is based on geography, rather than country characteristics, but they will be treated there as
potentially distinct experiences and separated out from our calculations of mean values.)
Applying these criteria gives 12 countries. Of these, 10 are usually regarded as
manufacturing export-based models. Of the ten, all but two are East Asian: China, Indonesia,
Malaysia, Singapore, South Korea, Taiwan Province of China, Thailand, and Vietnam. China
and Vietnam obviously started their growth accelerations much later (around 1980, rather
than around 1960), but they have shown consistently high growth rates since that time and fit
our criteria. Tunisia and the Dominican Republic are the other manufacturing export-based
successes.19
18 Although India did not grow very rapidly from 1960-80 (per capita growth rate of 1.7 percent per year), it experienced a dramatic improvement in performance thereafter (close to 4 percent per year after 1980). Rodrik and Subramanian (2005) argue that this turnaround, which was sustained for at least ten years without significant policy reforms, could be attributable to the fact that India had previously significantly underperformed relative to the quality of its institutions. In this view, a small change in the policy environment allowed these institutions to come into play and boost its growth record. 19 The Dominican Republic recently experienced a major banking crisis and growth has decelerated. GDP growth per capita averaged 0.2 percent between 2000 and 2004, but bounced back to 7.3 percent in 2005. Tunisia seems to fall into the East Asian pattern of having weak political institutions initially, but achieving manufacturing-based export success through a combination of consistently
(continued…)

14
With respect to the other two countries, concerns about data quality limit any
assessment of Egyptian performance.20 Only Chile appears to be a real exception to the rule
of manufacturing-based export success. As such, it might be an interesting model for Africa
and an alternative to the East Asian escape (from poverty) route. But even here, if we take
seriously the Adelman and Morris ratings, it would appear that Chile had strong economic
institutions already by 1960. As in the case of Botswana, these favorable initial conditions
might have played a role in alleviating the effects of the natural resource curse.21 Moreover,
in the case of Chile, while copper has been an important export, Chile has also developed
agribusiness/aquaculture exports that are very high value-added products.
D. Why Did Manufacturing Exports Matter So Much (after 1960)?
This benchmarking strategy suggests we should pay attention to exports, and—
perhaps—particularly to manufacturing exports. One possible reason is that manufacturing
exports help create a middle class that favors further strengthening of institutions.
Theoretically, the idea is that institutions do not spring up unassisted or without some
foundation of support from various social groups. Acemoglu, Johnson, and Robinson (2005a)
review some historical evidence on this point, and argue that it is the interaction of economic
and political power that produces (or changes) institutions. The literature that finds
competitive exchange rate and government assistance to manufacturing. If we had set the growth threshold slightly higher, e.g., at 4 percent, the Dominican Republic, Egypt, and Tunisia would not have qualified as sustained growth cases, but the other countries would still have qualified. 20 Part of this concern stems from the puzzling coexistence of sustained growth over a 25-year period and a decline in the share of overall exports relative to GDP of about 8 percentage points. 21 We need to be careful in assessing the prospects for countries, such as Gabon or Sao Tomé and Principe, where oil reserves are large relative to the economy. Some oil exporters have done very well since 1960, e.g. Brunei, Saudi Arabia and other small Gulf states; they do not make it into our set of benchmark countries due to lack of data.

15
significant effects of institutions on outcomes may have drawn too much attention to a state
variable (institutions) relative to the forcing variables (the power of various groups).22
In particular, expansion of trade may sometimes create profound changes in the
distribution of economic power, with consequences for political power and, consequently, for
institutions. This is one interpretation for the effects of the expansion of long-run trade
through the Atlantic, to Asia and the New World, after 1500 (Acemoglu, Johnson, and
Robinson, 2005b).23 However, trade per se does not necessarily lead to better institutions; if
the returns from trade fall into the hands of monarchs or a small elite, they may actually lead
to a concentration of power and, ultimately, worse institutions.
Although we do not have definitive evidence on this point, we note that while the
Sustained Growth cases began their growth episodes with weak political institutions, over
time, they benefited from a virtuous circle in which economic and political institutions
improved. This highlights the notion that institutions are not immutable, but can respond to
economic and policy changes, and thus that the quality of broad institutions is not a
permanent barrier to long-term growth. A significant number of countries with sustained
growth have improved their institutions over time, thus laying the foundation for sound
growth in the medium run.
For example, Indonesia, Korea, Taiwan Province of China, and Thailand witnessed a
substantial strengthening of their political institutions. On the Polity IV scale that goes from
22 Rajan (2006) also stresses the potential importance of constituencies relative to institutions. However, he puts more emphasis on increasing education as a key lever that develops progrowth constituencies. 23 Keep in mind that this early “Atlantic trade” was much more about commodities than manufactures. They key point is who controls the rents and the extent to which these can be seized by the state, rather than the precise content of the cargo.
16
one (weak institutions) to seven (strong institutions), Indonesia’s and Taiwan Province of
China’s by four points, Korea’s by five points, Thailand’s rating improved by six points.
The possibility that institutional development occurs only when growth is driven by
manufacturing exports is further suggested by the experience of countries whose exports
have been natural resource-based. A number of such countries have experienced a surge in
exports in the aftermath of terms of trade shocks without any commensurate improvement in
the quality of institutions. In some ways, this is the crux of the natural resource curse.
As rents to governments increase, there is even less incentive for them to work toward
improving institutions (Ross, 2001).
E. Recent Literature on Accelerations and Sustained Growth
Our approach is closely related to part of the growth literature that has focused on the
information contained in turning points in countries’ growth performance. This is a
promising line of research because, by focusing on the correlates of accelerations or
decelerations in growth, it avoids many of the pitfalls of cross-country growth regressions
that attempt to explain developing countries’ average growth experience (where the average
typically confounds periods of steep hills and cliffs, rather than the smooth upward paths
of the industrial countries—a point emphasized by Pritchett, 2000). The papers by Rodrik
(1999), Hausmann, Pritchett and Rodrik (2004), Jermanowski (2005), and Jones and Olken
(2005b) represent some initial attempts to uncover the informational content of growth
transitions, though not surprisingly they conclude that there is a lot we still do not understand
about the anatomy of growth transitions.
17
Of course, identifying the correlates of accelerations does not directly get at the issue
of what makes growth sustained. Indeed, it is likely that what ignites growth is not the same
as what curtails growth (Jones and Olken, 2005b): crises of one type or another, conflict, and
macroeconomic instability seem to be strongly correlated with the end of growth spells, but
the converse of these does not appear to be a particularly reliable indicator of what causes an
acceleration in growth. A more fruitful approach may therefore be to look at the correlates
of growth duration per se, i.e., once a growth spurt has begun, how can it be kept going?
Berg, Ostry, and Zettelmeyer (2006) focus on growth duration, and point out that,
whereas economically significant increases in growth are relatively common events in the
developing world (including in Africa), much rarer are the very long sustained spells of the
type that lifted many countries in East Asia out of poverty over the past few decades. The
correlates of growth duration should thus have significant policy relevance. The authors use
survival analysis to relate the probability that a growth spell will end to a variety of economic
and political variables. They consider the role of democratic institutions, income inequality,
health and education, external competitiveness, and a number of variables related to
macroeconomic stability. While their results should probably still be viewed as somewhat
preliminary, their conclusions are nonetheless strikingly similar to ones we arrive at in our
benchmarking exercise.24
24 Apart from the role mentioned above that inequality appears to play in limiting the duration of growth spells, there appears to be a significant effect of high inflation and exchange rate crises as risk factors. Reducing inflation from 50 to 10 percent, for example, halves the risk of a downbreak in growth in any given year. Sharp currency depreciations (currency crises), following periods of significant overvaluation, also appear to be significant predictors of the end of growth spells.

18
III. RECENT AFRICAN GROWTH EXPERIENCE
To focus our attention on countries with potential for relatively high sustained
growth, in the discussion below we divide the countries into two groups based on whether or
not they attain a minimum threshold of growth over the past decade (Table 1a).25 We set the
threshold low, to be as inclusive as possible. We therefore have nineteen African countries
that had per capita growth over the last decade above 2 percent, and the rest of the region that
was below this threshold (31 countries for which we have data).
Table 1a and Appendix Table 9 report basic growth measures for sub-Saharan Africa.
Column 1 shows GDP per capita growth and column 3 shows total GDP growth. Two points
are immediately obvious. First, while average GDP growth was respectable over the last
decade (4.5 percent unweighted and 4.1 percent weighted by population), average GDP per
capita growth was much lower (2 percent unweighted and only 1.4 percent weighted).
Column 6 confirms in more detail that population growth remains high in most sub-Saharan
African countries (there is much less variation across countries in population growth than in
income growth). The fact that per capita GDP growth is slightly larger than per worker GDP
growth (column 2) reflects the faster growth in labor force relative to the population, which is
sometimes characterized as a demographic dividend.
It is worth noting that average growth rates for the 1990s are even being surpassed
today. In fact, over the past few years, GDP per capita growth has accelerated. The World
Economic Outlook growth rate for Africa in 2004 was 3.6 percent and in 2005 it was 3.5
25 Given the discrepancy between the different sources of growth data, we averaged the growth numbers for each country from two sources: the World Bank’s World Development Indicators and the Penn World Tables, version 6.2. However, there is clearly an interesting and important question as to the reasons for the deficiencies in African growth data across sources—an issue to which we hope to return in the future.

19
percent. The IMF currently expects growth of 3.9 percent in 2006 and 3.7 percent in 2007.
Per capita growth rates in excess of 2 percent per annum are expected for most regions,
except the CFA Franc Zone.
This said, there is a great deal of variation within Africa. Focusing just on per capita
growth rates, there are a number of countries with growth over 3 percent per annum. Some of
these countries were recovering from a civil war (Liberia). Others discovered oil (Angola,
Cape Verde, and Equatorial Guinea.) But five others had growth above or close to 3 percent
(Botswana, Lesotho, Mauritius, Mozambique, Rwanda, Tanzania, and Uganda) and another
eight countries were around 2 percent. A few countries continue to decline, with Zimbabwe
as the most notable outlier.
We turn now to the growth picture in the two groups of SSA countries, The first
column of Table 1a shows that average growth in Group 1 was 4.8 percent per annum over
1996–2005. If we exclude Botswana (diamonds and good institutions), Angola, Chad, and
Equatorial Guinea (oil), Liberia and Rwanda (rebound from civil conflict) and Mauritius (a
long-standing manufacturing export story and arguably good institutions), average growth
was 3.1 percent. (We adopt the terms Group 1 and Group 2 for convenience; we are not
passing judgment on any countries, just trying to look at the data in an informative manner.)
It is useful to test whether there was a difference in means between the Group 1
African countries and the SG cases. Specifically, we report the p-value from a t-test where
the null hypothesis is that there is no difference in means for the two groups.26
26 The sample for the t-test includes the countries in Group 1 and the 12 SG countries. We report the test for two types of comparison. In the first, we compare the means of the Group 1 countries for the period 1993-2002 with the corresponding means for SGs at the time of their growth acceleration. In the second, we adjust the mean value of a variable for the SGs for the trend increase in that variable for the world as a whole. Specifically, we calculate the mean value of the variable for the world
(continued…)
20
This test shows that if we take the entirety of Group 1, we fail to reject the null
hypothesis that their average growth is the same as that that experienced by the Sustained
Growth cases. But this finding is driven by the presence of a number of outliers (the
asterisked countries in Table 1a) whose growth reflects oil, rebound from civil conflict, or
which had reasonably strong institutions to begin with. If we drop those countries, average
per capita growth was 3.1 percent. This is significantly below what was experienced in our
Sustained Growth benchmark countries (see Table 1b).
IV. ARE INSTITUTIONS LIKELY TO BE A CONSTRAINT?
Table 2a focuses on the Group 1 sub-Saharan African countries with relatively high
recent growth. The same data are reported for Group 2 in Appendix Table 10. Table 2b
reports comparable data from our Sustained Growth cases; the notes to this table explain the
exact time period from which the data are drawn (this is important as much of the relevant
data is not available for exactly the time of acceleration).
A. Broad or General Institutions
The first standard measure captures the quality of broad institutions from the Polity
dataset. This measure is available for all time periods, so we can look at exactly the time of
acceleration (or any other time).
sample for 1970 and for the period 1993-2002. We subtract the latter from the former and add this difference to the mean for the SGs at time T. The rationale for the second comparison is that the improvement in performance of the Group 1 countries might just be due to “grade inflation” which may not reflect a true improvement in performance. When the p-value is high it means that we cannot reject the null hypothesis that the means for the African group are the same as those of the SGs. A low p-value denotes a statistical difference in performance between the two groups.

21
Table 2b shows that constraint on the executive was low in most of the Sustained
Growth cases at the time of acceleration (we call this time T; the exact date of T is shown in
the first column of Table 2b.) The average score was 2.2, and 4 of the 12 cases had the lowest
possible score—Chile, Korea, Thailand and Tunisia.
In contrast, in the Group 1 of African countries, the average score today is 3.8 and
only one (Sudan) has the lowest possible score. In terms of political institutions, as reported
in the second column, most Group 1 African countries already have a higher score than did
the SG cases when their accelerations began. Institutions are not today very strong, but they
are potentially good enough in much of Africa so as not to be an obvious constraint on
sustained growth.27 It is also noteworthy that levels of inequality today in this group of
African countries (column 7) is close to the average for the sustained growth countries when
the latter started their growth spurt. This is promising in light of the finding in Berg, Ostry
and Zettelmeyer (2006) about the importance of inequality for sustaining growth spurts. It is
countries in the second group that seem to have high levels of inequality, and hence poorer
prospects for sustaining growth.
While comparable measures of the quality of broad economic institutions at the
beginning of the SG growth accelerations are unavailable, data from Adelman and Morris
(1971) suggest that countries such as Indonesia, Korea, Thailand and even the Dominican
Republic had improved their economic institutions substantially during the growth period.
For example, Korea and Thailand that were ranked below the mean on "administrative
efficiency" in 1960 saw their investment rating rise to about 1.5 and 2 standard deviations
above the mean, respectively on a measure of investment risk in 1984. While less dramatic,
22
Indonesia and the Dominican Republic also saw improvements in their institutions by 1984,
with both countries moving from below average to substantially above average ratings on
these measures. Available data are not good enough to ascertain the exact timing of these
improvements but it appears that in the preponderance of Sustained Growth cases, the
improvement in economic institutions happened relatively early in the growth acceleration.
The World Bank (1993) has noted that China's investment climate improved dramatically
and relatively early during its growth acceleration.
For this reason, when the broad measures of economic institutions begin, in the mid-
1980s, the scores for countries that accelerated in the 1960s are already good. The average
score for Economic Risk (a composite indicator that contains the leading dimensions of
economic institutions, such as corruption and rule of law) was 31.7 (out of 50), while for
Investment Risk (an alternative measure) it was 7.1 (out of 12).
Note that for China and Vietnam, data from the mid-1980s are at or close to the time
of acceleration (1978 for China and 1985 for Vietnam). Vietnam had a relatively low (i.e.,
bad) score, of 5.0, at that time, while China was already at a relatively high 8.6 in terms of
Investment Risk.
Remarkably, our Group 1 African countries have an average Economic Risk indicator
of 31.7 and an Investment Risk just above 8. There is nothing here to indicate that broad
economic institutions are worse in this part of Africa today than they were 20 years ago in
our Sustained Growth cases. Most likely, many of the Sustained Growth cases began their
accelerations with broad economic institutions that were no better than in much of Africa
today.
27 Indeed, the p-value for the t-test of similar political institutions between Group 1 countries and the
(continued…)

23
The story in terms of control of corruption is more complicated. Column 6 in Table
2a shows the Kaufmann-Kraay index, which is out of 6 (higher is less corrupt), and which is
normalized. In other words, our corruption measure is relative, while our other measures of
broad institutions are in absolute terms, i.e., everyone can improve in terms of the latter but
not the former. These data are only available from the mid-1990s.28
Of the sustained growth cases, half of the countries had corruption scores of 3 or
below in the mid-1990s. This is not very different from the preponderance of Group 1
African countries as of 2005. No doubt corruption is an important issue in many countries,
but it does not appear to prevent growth. Nor does controlling corruption necessarily lead to
growth.
In terms of testing for differences in means, we find no difference in the adjusted
broad measures, but we do find Group 1 has significantly higher corruption than was the case
for Sustained Growth countries (but recall that these data are for a later point in the SGs
growth experience.)29
B. Costs of Doing Business
One area worthy of further attention relates to businesses’ costs of entry (the units
here are hours of time and fraction of income per capita per annum) and to the costs of
trading. These data are from the World Bank’s Doing Business database. These are plausible
measures for the specific institutions that directly impact business.
SGs is rejected, but in the direction of suggesting that the former had significantly better institutions. 28 The original Kaufmann-Kraay index, which is a measure of relative performance, ranges from minus 2.5 to plus 2.5. Our transformation changes the range from 1 to 6, which we achieve by adding 3.5 to the original value.
24
In contrast to the measures of broad institutions, where the Group 1 African countries
do well relative to other countries, in terms of these more micro measures, the picture is
mixed.30
It is very surprising that the time for paying taxes is actually lower than in the SG
cases today (average of 229 hours in the Group 1 African countries vs. 348 in the Sustained
Growth cases). On the total amount of tax payable, the Group 1 African countries rank about
the same as the SG cases—45 percent of gross profits on average.
It is on the costs of entry, i.e., registering a new business, that African countries do
worse than the SGs as well as the average developing country. In the average Group 1
country, costs are about 123 percent (measured in terms of per capita income) compared with
25 percent in the SGs and 78 percent in the average developing country. The t-test for
differences in means confirms that Africa has a disadvantage in this category.
While there is a presumption that macro and micro institutions should broadly co-
move, there can clearly be exceptions. One possibility is that macro and micro institutions
could be measuring distinct functions that institutions perform. For example, while broad
institutions such as the judiciary will determine the protection of property rights and
enforcement of contracts, the costs of doing business measured at the micro-level could relate
to ease of acquiring specific licenses, which could be the domain of other administrative
institutions/authorities. Another explanation for the lack of co-movement could simply be
time. Even where, say, laws and regulations relating to property rights can be relatively
29 In an earlier version of this paper, the sample of Group I countries was slightly different but that did not alter the basic conclusions that we obtain for the sample used in this version. 30 Comparisons between African countries and SG cases in relation to the costs of doing business should be treated more cautiously because, unlike in the rest of the paper, countries are being compared at the same point in real time and not the same point in “acceleration” time.

25
easily changed, their effective enforcement (which would be picked up at the micro-level)
may take more time.
Finally, the measurement of micro-institutions has not yet acquired the prominence of
their macro counterparts. Further work is required to understand the differences between
macro and micro differences, and what policy levers are available to countries to remedy the
high costs of trading and doing business more generally.
C. Conflict and Fractionalization
It is possible that while broad institutions in Africa are at reasonable levels, the
problem could be the potential for, or actual, conflict. Wars of various kinds definitely have
been an issue in Africa’s recent past.
Tables 3a, 3b, and Appendix Table 11 explore this issue in more detail, using data
from the Uppsala Armed Conflict Dataset. Interestingly, what we find here is that in terms of
“all conflicts,” Group 1 African countries are not significantly worse than were the SG
countries at the start of their growth.
Looking at interstate conflicts, in the window of T-9 to T, there was actually less
conflict in the Group 1 countries than in the Sustained Growth cases. However, in terms of
internal conflict, there appears to have been more in Africa—most of this has been
concentrated in a few countries, but it has still spilled out into wider regions (e.g. Sudan-
Chad, Liberia-Sierra Leone, Democratic Republic of Congo and several neighbors.) The
potential for more intense and disruptive conflict in Africa should not be discounted.
In Tables 4a, 4b, and Appendix Table 12, we present various measures of societal
fractionalization, which is an indicator of the potential for conflict. Societies can potentially

26
fracture along different lines—ethnic, religious, or linguistic. These tables indicate that
regardless of the measure, all African countries (Groups 1 and 2) fare significantly worse
than the SG cases. While the widely-noted reduction in internal African conflicts over the
last decade offers some basis for optimism, the divided nature of many of these countries
should serve to temper such optimism.
V. TRADE OUTCOMES AND POLICIES
Tables 5a and 5b look in more detail at trade outcomes and trade policies. Apart from
micro institutions that may have hampered the export orientation of a number of African
countries, trade policies—as well as the exchange rate to which we turn later—are other
possible candidates.
A. Export Performance
The Sustained Growth cases generally attained great success in manufacturing
exports. The average increase in the ratio of manufacturing exports to GDP for this group
over their growth episode was 36 percentage points. For example, Singapore and, to a lesser
extent, Korea and Malaysia, achieved a rapid increase in manufacturing exports at a very
early stage: within the first five years of the growth spurt, the share of manufactured exports
in GDP had risen by 7.3 percentage points for Singapore, and by about 2.5 percentage points
for the other two countries. Clearly, there was two-way causality between export ratios and
growth, but even to the extent that early rapid export growth was a proximate cause, it raises
the question as to the underlying policy choices that facilitated this growth.
27
The average export-GDP ratio is quite high in the Group 1 African countries—their
average ratio of 31 percent is almost double that of the Sustained Growth cases at the time of
their accelerations (19 percent). The Group 1 numbers are high in part because of Botswana
(diamonds), Equatorial Guinea (oil), Mauritius (clothing) and Lesotho (clothing). Even if we
drop the asterisked countries in Table 5a, the average remains at 25 percent, which is still
high.
In terms of manufactured exports too, African countries do not start at a very great
disadvantage compared to the SGs. Even after excluding the few African countries with high
levels of manufactured exports relative to GDP (Botswana, Lesotho, and Mauritius), in most
cases the ratio of manufactured exports to GDP is close to what it was for the SGs.
This picture is similar if we focus on apparel, footwear, and textile exports—the
traditional starting point for countries that export manufactures. Aside from Lesotho and
Mauritius (and Swaziland, which is in the Group 2 countries), these exports are small at less
than 0.5 percent of GDP but this was also true of the SGs.
The SGs, however, increased their manufactured exports dramatically. Table 5a
seems to suggest that, at least during the last ten years, there has not been any significant
improvement in manufacturing or textiles exports from Africa. The question is whether the
current policy environment is conducive to SSA countries repeating the feat of the SGs over
the medium term. On the one hand, the external trading environment facing SSA countries is
more difficult now because of the competition from Asian exporters, particularly China,
India, and Vietnam. On the other, SSA exporters face virtually duty-free access to the
markets of industrial countries in manufactures thanks to the various preferential schemes in
the European Union (Everything But Arms) and the United States (The Africa Growth and

28
Opportunity Act) whereas barriers facing Asian exporters in the 1960 and 1970s were much
higher than today.31 On balance, it is therefore difficult to assess whether today’s
environment is actually more difficult for the SSA countries.
B. Trade Liberalization
Countries do seem to become more open as they grow and this is borne out by the
experience of the SGs. While it is true that some countries in the SG group did not liberalize
(and to some degree still have not—e.g., China and Vietnam), the weight of the evidence
points in a different direction, as the examples of Indonesia, Korea, Malaysia, Singapore, and
Taiwan Province of China show. In terms of the aggregate data, the average percent of years
that a country has been open (since the growth acceleration began) is 58 percent for the
Sustained Growth cases.
The (perhaps) surprising fact is that many African countries are quite liberal on trade.
Table 5a shows that the augmented Sachs-Warner measure for the Group 1 countries is 0.6
(out of 1, with higher meaning more liberal).32 They are more open than the SGs were at the
comparable stage of their growth spurt (0.4 is the average on the SW measure for the SGs),
and they are more open than the average developing country today (0.5 on the SW measure).
31 Of course, some of this duty-free access is undermined by onerous rules of origin (Mattoo et. al., 2003) 32 The Sachs-Warner measure is a broad measure of trade liberalization and incorporates data on tariffs, quantitative restrictions (QRs), black market premium, export marketing boards, and whether a country has a socialist regime. This measure was updated by Wacziarg and Welch (2003). Rodriguez and Rodrik (2000) criticize the results obtained by Sachs and Warner (1995) based on their measure on the grounds that it captures not just trade but a variety of macroeconomic and institutional factors. They also showed that it was the black market premium component of the indicator that was driving the results rather than tariffs and QRs.

29
C. Exchange Rate Overvaluation
Anecdotally, one important factor that supported export growth in the SG cases was
the avoidance of exchange rate overvaluation.33 While this is hard to measure exactly, we
have constructed the following, relatively standard, proxy for overvaluation.
First, following Frankel (2004), for every year beginning in 1960, we ran a cross-
section regression of the log of a country’s price level relative to the United States (available
in the Penn World Tables) on the country’s per capita GDP in PPP terms. This equation
captures (in a cross-section context) the Balassa-Samuelson effect, which predicts that as
countries grow richer, the real exchange rate—measured by the price level relative to the
United States—should appreciate. The predicted value of the real exchange rate from this
regression provides a sense of equilibrium, while the difference between the predicted and
actual real exchange rate is a measure of overvaluation.34
We look at average currency overvaluation (last 5 years for which data are available
for the African countries and for the entire duration of the growth episode for the SG cases),
33 Conditions for success in global markets might be slightly different today than in the 1960s and 1970s, when the Asian countries succeeded: for example, reputation (for quality and reliability) has become very important in today’s manufacturing based on global production chains. Hence, a competitive exchange rate is by no means sufficient to guarantee export success. 34 We estimate the following cross-section equation for every year since 1960 for the sample of all
countries: log logi i ip yα β ε= + + where p is the log of the price level for country i in terms of the United States, and y the level of per capita PPP GDP. Our measure of overvaluation is then:
log ( log ).ii ioverval p yα β= − +$ $ We average this measure for each country over the relevant time period. Clearly, there are alternative ways of measuring overvaluation that are parsimonious in only considering relative income as a determinant of real exchange rates. But the key point is that here the relationship is estimated over the very long run—in effect when we run the annual cross-sectional regression, what we are assuming is that PPP will apply over the very long run, spanning the period over which the United States and other OECD countries have become rich and others have not. Implicitly, the timeframe for estimating the PPP relationship is 300-400 years.

30
the longest consecutive spell of overvaluation, and the extent of overvaluation during that
spell (Table 6).35
Almost all the sustained growth cases avoided overvaluation during the growth
period, with some (Indonesia and Thailand) exhibiting substantial undervaluation. The
average degree of overvaluation for the SGs was minus 18 percent (i.e. these countries’
exchange rate was substantially undervalued) compared with an average overvaluation of
7 percent for the Group 1 countries and 18 percent for Group 2 African countries.36
On average in the Group 1 African countries, there either is now or has been
substantial overvaluation in almost all cases, although today this problem is less marked on
average. The degree and extent of overvaluation in Group 2 countries has been even greater
(on average 20 percent or so in recent years).
Another indicator is to see how long and how large have been “spells”—consecutive
periods—of overvaluation. Spells can be important especially if there are hysteresis effects
and fixed costs of adjustment. In the SG cases, the average duration of the longest spell was
6.4 years, while for Group 1 countries it is 13 years and for the Group 2 countries is 15 years.
During this spell, the average amount of overvaluation was 11 percent for the average SG
country, while it was 37 percent for the average African country. Thus, the striking finding is
that the average African country is likely to have persistent overvaluation that is twice as
long as for the average SG country and that is almost three times as large in magnitude. On
nearly all the measures of overvaluation—average, duration and persistence—the SSA
countries and Group 1 countries are significantly worse off than the SGs at a comparable
35 Spells of overvaluation are consecutive periods for which our measure of overvaluation is positive.

31
point in time (the statistical tests reject the hypothesis that the overvaluation measures for
Group 1 countries and SGs are similar).
If development, and in the case of Africa, diversification, is about creating the
incentives to invest in the tradable goods sector, and given the inability and unwillingness of
African country governments to pursue interventionist industrial policy, the exchange rate
becomes a key instrument in promoting this objective. The question then arises as to the
feasibility of sustaining a competitive exchange rate.
The real exchange rate is not an easy policy lever for at least two reasons. First, the
fact that changes in the real exchange rate have serious distributional consequences,
especially in Africa (Bates, 1981), suggests a role for deeper, political economy factors
constraining choices on the exchange rate. Second, the ability of countries in East Asia as
well as China and India (and Tunisia) to sustain a competitive exchange rate has been helped
by their caution in opening up to capital flows (see Prasad, Rajan and Subramanian, 2006).
Latin America has witnessed periodic bouts of currency appreciation driven by surges in
capital flows. While Africa has not witnessed private flows, it too has seen large inflows in
the form of aid, which puts upward pressure on the exchange rate.37 Reconciling the tension
between the need for a competitive exchange rate and the constrained ability to achieve it (in
36 It is noteworthy that the Sustained Growth countries avoided overvaluation even in cases where there were substantial aid inflows (e.g., Indonesia, in the 10 year window around its acceleration, had aid-to-GDP of 24 percent). 37 Aid-to-GDP at current levels is high compared to the initial starting point of most SG cases, though it is lower than the aid levels received by Indonesia at the time its takeoff, suggesting perhaps that the present level of aid should not inevitably constrain, one way or another, these countries’ ability to enjoy sustained growth. While, Rajan and Subramanian (2005) provide evidence that aid and the consequent exchange rate overvaluation have a significant negative effect on exports of manufactures, it is possible that countries can mitigate the adverse effects through policy changes, such as improvements aimed at enhancing productive efficiency.
32
light of the political economy and aid factors) will remain a major challenge for African
countries.
D. Costs of Importing and Exporting
While the Group 1 countries in SSA are comparable to—or even better than—other
developing countries on broad measures of trade policy (the trade restrictiveness rankings
and Sachs-Warner openness measures), they seem to do distinctly worse on the more micro
measures of the costs of trading (Tables 7a and 7b).
For example, in the average Group 1 country it takes about 12 documents and 57 days
to undertake imports: these numbers are of course vastly superior today in the SGs (the
comparable numbers are 9 and 21 respectively); more strikingly, these numbers are also
inferior to the average developing country where it takes 11 documents and only 37 days,
the latter being about 25 percent better than for the average Group 1 country. There is a
similar difference on the export side.
The fact that African countries do worse than the average developing country is not
surprising, but what is interesting is that this discrepancy is not reflected in the broader
measures of trade policy, where as discussed earlier, the average African country does,
if anything, marginally better.
Here again, we see a difference between macro and micro measures. In this case, it is
possible that the macro measures are too coarse, and hence are less informative than the
micro measures. Or, it could be the case that, while broad policy reform has taken place,
implementation lags behind. Either way, though, these figures suggest some scope for
remedial action to improve the micro-environment for importing and exporting.

33
VI. OTHER POTENTIAL CONSTRAINTS
A. Education
The educational attainment measures are gross primary and secondary enrollment
ratios at the time of the growth spurt (from the World Bank’s World Development
Indicators); see Tables 8a and 8b. For example, the average enrollment ratio in primary
education for the Group 1 countries was 91 compared with 95 for the SGs. Indeed, the
comparable figures for secondary education (32 and 36 percent, respectively) show Group 1
countries as being comparable to the SGs. Of course, it must be kept in mind that these
measures do not adjust for the quality of education.
B. Health and Infrastructure
Without a doubt, there are some difficult health problems in Africa today. Rates of
HIV/AIDS infections may have been revised downwards recently, but this still remains a
major issue in many countries, particularly in southern Africa. One important measure
of health is life expectancy.
We report data for two years: the latest available and 1982. We include 1982 so as to
have a measure from before the HIV/AIDS epidemic became widespread, i.e., we are looking
for evidence that health has become more of a constraint over the past 20 years. Note that life
expectancy has not declined everywhere in Africa over this time period, but there have been
dramatic and shocking declines in some countries (particularly in southern Africa.)
Life expectancy in Group 1 was 49.6 years in 1982 and 48.2 years in the most
recently available data. Some countries (with rapid growth currently) in this group have very
34
low life expectancy—for example, 42 years in Ethiopia and Mozambique. Average life
expectancy in Group 2 is similar (50.9 years in 1982 and 48.8 years today). These figures are
significantly poorer than those for the SGs at the start of their growth episodes.
The only Sustained Growth country with such low life expectancy at the start of its
acceleration was Indonesia—Table 8b shows that this was 46 in 1967. However, a number
of other SG cases started with life expectancy in the low 50s (e.g., Egypt, Korea, Thailand,
and Tunisia; India too had a life expectancy of 54 in the early 1980s).
Health in Africa definitely needs to improve, but the jury is out on whether this
constitutes a binding constraint on sustained growth. Bad health may prevent growth from
accelerating, for example because it limits effort. But there is no clear theory of why ill-
health would allow accelerations but not sustained growth.38 In addition, the available
evidence suggests that while improving health can definitely increase incomes, the size of the
effect is small (see the discussion in Acemoglu and Johnson, 2006).
We are not suggesting that the African health sector does not need further investment.
It is hard to find comparable data on inputs into the health system, as measures of spending
are either not available or are difficult to compare across income levels. However, number of
doctors is a reasonable proxy for the scope of the health system. Column 5 of Table 8a shows
that the Group 1 countries have on average only 150 physicians per million inhabitants, and
this falls to 88 per million if we exclude the exceptional starred cases. This is low by any
standards. Efforts to provide more international assistance for health care in Africa seem well
placed; the historical evidence suggests that this spending could save many lives and
38 This would need a mechanism through which growth worsens health sufficiently to prevent further investments in human capital. Alternatively, people might be willing to acquire basic skills (for an
(continued…)

35
significantly reduce ill health (see the post-World War II experience, reviewed in Acemoglu
and Johnson, 2006.)
Again, Table 8b shows that the availability of physicians was much higher in many
SG cases, e.g., Korea already had 600 per million people at the time of its acceleration. But
some SGs had poor health systems when they started to grow rapidly. According to this
indicator—Indonesia had 37.3 and Thailand had 129 doctors per million, which are
comparable to the numbers in many African countries.
A closely related argument is that Africa more broadly lacks the basic infrastructure
to develop. Again, it is hard to find comparable measures, but telephone mainlines and roads
are two rough but reasonable proxies for infrastructure. On both these measures, many of the
SG cases were worse off when they started to grow than Africa is today. For example, China,
Vietnam and Indonesia had two or fewer mainlines per 1,000 people. (Table 8c indicates that
these data are available only from the mid-1970s; this is therefore informative about
conditions when China and Vietnam started to accelerate, but Indonesia had already been
growing for 10 years when it still only had 1.5 mainlines per 1,000).
Roads are harder to compare, because we would need to adjust for mountainous or
desert terrain, as well as the quality of the road surface. Also, these data are not available
before 1990. Still they indicate that roads per surface area in the Sustained Growth cases
were not generally much more developed that in the Group 1 African countries (with the
notable exception of Singapore.) For example, road infrastructure in Indonesia and Thailand
(in 1990) was quite comparable to many African countries (today). The t-test indicates no
acceleration) but not more advanced skills (to sustain growth). In the British Industrial Revolution, perhaps for 50 years during the nineteenth century, health probably worsened, yet growth continued.
36
significant difference in means for Group 1 African countries and the sustained growth cases
in terms of roads.
Overall, while more infrastructures are presumably better than less, there is no
evidence that the Sustained Growth countries took off after a massive push in terms of public
investment (including health). They may have been slightly healthier than Africa today, but
their overall infrastructure was at comparable levels.
Africa is often compared with Korea in the 1950s or 1960s, but this may be
misleading. In part because of the Korea war and associated U.S. military-related
investments (e.g., in roads), Korea may have had an unusual starting point. Perhaps a
comparison with Indonesia in the mid-1960s is more instructive. In this regard, at least the
Group 1 African countries have no significant disadvantage.
VII. CONCLUSIONS
For those who view Africa’s prospects through the perspective of the “deep”
determinants of development—geography, institutions and history—the outlook seems bleak.
For others, the outlook appears rosier, either because of the current commodity-powered
upturn or because of a faith that pulling certain policy levers (especially foreign aid) will
deliver strong results. Both these views are far from persuasive. Extrapolating the recent past
is a cardinal sin of forecasting, especially since Africa has seen many a false dawn of
commodity booms turning bust. And foreign aid has had disappointing effects in the past.
But implicit in these assessments has been a comparison of Africa with its own past
or Africa with other countries today. The contribution of this paper has been to look at the
evidence differently. We compared Africa today with countries that were similarly weak in

37
the past—in terms of their institutional development—and yet managed to escape from
poverty. Looking at the data suggests (but does not prove) that these “deep” indicators,
especially for a group of “promising” African countries, are not much worse in Africa today
than they were in much of East Asia in the early 1960s (e.g., Indonesia and Thailand) or in
Vietnam and China circa 1980. There are inherited institutional weaknesses in Africa—and
internal conflict and societal fractionalization remain concerns—but the East Asian
experience definitely demonstrates that some institutional weaknesses can be escaped. So the
good news is that breaking away from a country’s institutional legacy is possible because it
has been done by others, including some East Asian countries which were not that dissimilar
from some promising performers in Africa today.
But when we turn from the deep “why” to the proximate “how” question, we find that
since the 1960s, escapes from poverty in the face of weak institutions have generally
involved exports and—in almost all cases—manufacturing exports. Africa need not, of
course, take exactly the same route, but a stronger and more dynamic manufacturing export
sector would surely help sustain growth. To achieve this, though, reducing the direct
regulatory costs for exporters and avoiding real exchange rate overvaluation will be essential.
And on these scores, we see risks going forward that were less of an issue for the east Asian
escapees: commodity-based growth and sizable aid inflows—that partly underpin the rosier
prognosis for Africa—can be pitfalls for institutional development and the avoidance of real
exchange rate overvaluation. Sub-Saharan Africa’s escape from poverty, while certainly
possible, may be more challenging than it was for east Asia. Clearly, fatalism is unwarranted
but the means of escape need to be found.

Table 1a. Indicators for Selected sub-Saharan African Countries, 1996-2005: Income, Growth, and Population1
Real Per Capita
GDP Growth (WDI, Penn
Tables)3Real Per Worker
GDP Growth4Real GDP Growth4
PPP Real GDP Per Capita (Constant
2000 $)GDP (Current US$ Millions)
Population Growth
Population (Millions)
(1) (2) (3) (4) (5) (6) (7)Group 1: Sub-Saharan African Countries with Growth >= 2.0 percent
Angola* 4.7 4.7 7.9 1,857 11,880 2.6 14.2Botswana* 4.6 4.1 5.7 7,809 6,190 0.9 1.8Burkina Faso 2.0 2.1 4.7 1,024 3,380 3.0 11.5Cameroon 2.0 1.8 4.3 1,875 11,611 2.0 15.0Cape Verde 4.2 4.4 5.6 4,816 658 2.3 0.5Chad* 2.4 2.3 8.2 1,055 2,390 3.3 8.4Equatorial Guinea* 24.3 24.2 23.2 9,172 1,649 2.3 0.5Ethiopia 1.8 2.0 5.0 796 8,390 2.3 64.9Ghana 2.1 2.4 4.7 1,918 7,300 2.2 20.1Guinea 2.4 2.2 3.6 1,975 3,420 2.2 8.5Lesotho 3.3 2.8 2.9 2,220 1,006 0.6 1.8Liberia* 9.4 9.5 18.0 n.a. 441 4.3 3.0Mali 2.8 2.4 5.7 832 3,300 2.9 11.9Mauritius* 3.8 4.4 4.7 9,745 4,820 1.1 1.2Mozambique 4.7 4.4 8.5 946 4,300 2.2 18.1Rwanda* 6.1 6.8 7.5 1,096 1,800 5.1 7.8Sudan* 2.3 2.8 6.3 1,656 15,070 2.1 33.2Tanzania 5.1 5.4 5.5 549 9,250 2.1 35.1Uganda 3.6 3.4 6.0 1,238 6,410 3.2 25.0
Average 4.8 4.9 7.3 2,810 5,435 2.5 14.9
Average (excl. * countries) 3.1 3.0 5.1 1,654 5,366 2.3 19.3
P-value for T-test: mean for Group 1 equals mean for SGs 0.98 0.77 ... ... ... ... ...
P-value for T-test: mean for Group 1 (excl. asterisked countries) equals mean for SGs
0.00 0.04 ... ... ... ... ...
Group 2: Sub-Saharan African Countries with Growth < 2.0%
Average 0.04 0.37 2.7 2,533 10,329 2.5 13.6
Average (excl. * countries in group 2) 0.24 0.52 2.6 2,756 11,182 2.4 12.9
Average Sub-Saharan Africa 2.0 2.1 4.5 2,644 8,350 2.4 14.1
Weighted Average Sub-Saharan Africa2 1.44 1.51 4.1 1,720 … 2.4 …
Source: World Development Indicators (WDI, November 2006 download), unless otherwise indicated.
1/ All variables are averages for the period 1996-2005, unless otherwise indicated.2/ Weighted by population.3/ Real per Capita GDP Growth is the average of WDI and Penn World Table's estimates for the period 1995-2004.4/ GDP is measured in national currency terms (WDI).

29
Table 1b. Indicators for Sustained Growth Countries (SGs): Income, Growth, and Population1
Year T
Real Per Capita GDP Growth (WDI, Penn
Tables)3 Real GDP Growth4
PPP Real GDP Per Capita (Constant 2000 $) at Time T
Latest PPP Real GDP Per Capita
(Constant 2000 $)4
Latest GDP (Current US$
Millions)5Population
GrowthLatest Population
(Millions)5Real Per Worker
GDP Growth4
(1) (2) (4) (5) (6) (7) (8) (9)Chile 1986 4.35 6.01 5,018 11,301 120,000 1.5 16.3 3.86China,P.R.: Mainland 1978 8.41 9.73 674 5,878 2,200,000 1.2 1304.5 8.82Dominican Republic 1969 3.23 5.35 3,335 6,779 28,000 2.0 8.9 4.83Egypt 1976 3.46 5.61 1,742 3,985 89,000 2.1 74.0 3.46Indonesia 1967 3.96 6.14 1,099 3,437 290,000 1.9 220.6 2.73Korea 1962 5.97 7.33 3,498 19,560 790,000 1.4 48.3 5.21Malaysia 1970 4.50 6.66 2,998 9,699 130,000 2.4 25.3 4.04Singapore 1969 5.21 7.75 6,536 26,764 120,000 2.1 4.4 3.07Taiwan Province of China 1961 6.30 n.a n.a. n.a. n.a. n.a. n.a. n.a.Thailand 1960 4.69 6.69 1,899 7,649 180,000 2.0 64.2 2.46Tunisia 1968 3.40 5.28 3,415 7,423 29,000 1.9 10.0 4.72Vietnam 1985 4.68 6.72 n.a. 2,739 52,000 1.7 83.0 5.95
Average … 4.8 6.7 3,021.5 9,564.7 366,181.8 1.8 169.0 4.5
Weighted Average2 … 7.1 8.6 977 5,877 1,559,704 1.39 … 7.1
Source: World Development Indicators (WDI, November 2006 download), unless otherwise indicated.
1/ The variables are averages for the period T to 2005, unless otherwise indicated, where T refers to the start of the growth episode.2/ Weighted by population.3/ Real per Capita GDP Growth is the average of WDI and Penn World Table's estimates for the period 1995-2004.4/ GDP is measured in national currency terms. Growth rates are averages for the period T (the start of the growth episode) to L (2005), the latest year for which data are available.5/ The latest year is 2005.

Table 2a. Indicators for Selected sub-Saharan African Countries: Institutions and Costs of Doing Business1
Growth Institutions Governance Inequality
Real Per Capita GDP
Growth (Constant
2000, WDI)2Constraint on the Executive3
Economic Risk4
Investment Risk5
Control of Corruption6 Gini7
Time for Paying Taxes (in hours per
year)
Total Amount of Tax Payable (as a percentage of gross profits)
Costs of Entry (measured in % per capita
income)(1) (2) (3) (4) (5) (6) (7) (8) (9)
Group 1: Sub-Saharan African Countries with Growth >= 2.0%
Angola* 5.1 3 28.0 7.67 2.0 n.a. 272 64 487Botswana* 4.8 7 39.3 10.83 3.0 63 140 53 11Burkina Faso 1.6 3 28.3 9 2.0 40 270 51 121Cameroon 2.1 2 37.7 8 2.0 45 n.a. 46 152Cape Verde 3.2 n.a. n.a. n.a. 3.8 n.a. 100 54 46Chad* 4.8 2 n.a. n.a. 2.4 n.a. 122 68 226Equatorial Guinea* 20.3 2 n.a. n.a. 1.9 n.a. 212 62 101Ethiopia 2.6 3 32.5 7 2.0 30 212 33 46Ghana 2.4 6 29.1 8.5 2.0 41 304 32 50Guinea 1.3 3 34.0 5 2.5 40 416 49 187Lesotho 2.3 7 n.a. n.a. 3.5 63 352 26 40Liberia* 12.4 n.a. 31.6 5.0 2.0 n.a.Mali 2.7 5 24.0 7.5 2.0 51 270 50 202Mauritius* 3.6 7 n.a. n.a. 3.8 n.a. 158 25 8Mozambique 6.1 4 25.5 8.67 1.5 40 230 39 86Rwanda* 2.2 3 n.a. n.a. 3.1 n.a. 168 41 188Sudan* 4.1 1 34.0 7.5 2.5 n.a. 180 37 59Tanzania 3.2 3 34.5 11.5 3.0 35 248 45 92Uganda 2.6 3 33.5 8 2.5 43 237 32 114
Average 4.6 3.8 31.7 8.0 2.5 44.5 228.9 45.0 122.9Average (excl. * countries) 2.8 3.9 31.0 8.1 2.4 43 264 42 103P-value for T-test: mean for Group 1 (excl. asterisked countries) equals mean for SGs 0.00 0.01 0.78 0.27 0.01 0.43 0.30 0.62 0.00
P-value for T-test: mean for Group 1 equals adjusted mean for SGs9 … 0.04 2.29 0.27 … … … … …
P-value for T-test: mean for Group 1 (excl. asterisked countries) equals adjusted mean for SGs9
… 0.03 0.10 0.35 … … … … …
Group 2: Sub-Saharan African Countries with Growth < 2.0%Average 0.22 4.0 29.9 7.2 1.7 49.0 331 87 153Average (excl. * countries) 0.24 4.0 30.4 7.1 1.7 49.0 318.1 74.7 137.9
Average, 1980 (excl. * countries in group 2)10 … 2.6 26.6 5.4 … … … … …
Sustained Growth Countries (SGs) 4.9 2.2 31.7 7.1 3.4 39.5 348 44 25Developing world … … … … … … 283.7 55.2 77.6
Sources: WDI (November 2006 download), ICRG, Polity IV, and World Bank Doing Business websites.1/ Data are for the most recent 10 year period available, except for the sustained growth countries (SGs). Asterisk denote countries with strong initial institutions orthose recovering from conflict or experiencing a commodity boom.2/ The data from WDI. For SGs, data refer to the average for the period T to L, where T refers to the start of the growth episode and L the latest year (2005).3/ Score ranges from 1 to 7. The higher the score the more the constraints on the executive. The data refer to year 2004 for SSA countries, and to the period T for SGs.4/ Score for economic risk ranges from 1 to 50. The higher the score the lower the risk. For SGs data refer to 1984, and for SSA economic risk to 2002.5/ Score investment risk ranges from 1 to 12. For SGs data refer to 1996, and for SSA to 2006.6/ Score ranges from 1 to 6. The higher the score the less the corruption. For SGs data refer to 1996, and for SSA to 2004 or 2005.7/ For SGs, data refer to T or to the year closest to T for which data are available (see table 8c)8/ The data are from the World Bank Doing Business websites: "http://www.doingbusiness.org/ExploreTopics/PayingTaxes/". Data for all the countries including SGs are for the most recent period based on the survey of January 2006.9/ Mean for SGs adjusted by adding the change in world mean between 1970 and the average for the period 1996-2005. Year 1985 is used for Chad.10/ 1: For constraint on the Executive, Namibia is excluded since the earliest data on it is 1990; 2: For Economic risk and Investment risk, the averages are for year 1985. Namibia is exlcuded since the earliest data available on them are 1990.
Economic Institutions. Costs of Doing Business8

31
31
Table 2b. Indicators for Sustained Growth Countries (SGs): Institutions and Costs of Doing Business1
GrowthPolitical
Institutions. Governance Inequality
Year T
Real Per Capita GDP Growth
(Constant 2000, WDI)2
Constraint on the Executive3
Economic Risk4
Investment Risk4
Control of Corruption5 Gini6
Time for Paying Taxes (in hours per
year)
Total Amount of Tax Payable (as a percentage of gross profits)
Costs of Entry (measured in %
per capita income)
(1) (2) (3) (4) (5) (6) (7) (8) (9)Chile 1986 4.4 1.0 22.2 2.7 3.8 55.7 432 26.3 9.8China,P.R.: Mainland 1978 8.5 3.0 35.5 8.6 2.0 21.2 872 77.1 9.3Dominican Republic 1969 3.2 3.0 26.2 4.3 3.3 45.5 178 67.9 30.2Egypt 1976 3.4 3.0 28.6 6.3 2.1 33.0 536 50.4 68.8Indonesia 1967 4.2 2.0 30.1 6.5 3.0 32.7 576 37.2 86.7Korea 1962 5.8 1.0 34.8 9.8 5.0 32.0 290 30.9 15.2Malaysia 1970 4.1 3.0 37.5 7.5 4.0 51.3 190 35.2 19.7Singapore 1969 5.5 3.0 39.5 10.8 4.0 40.0 30 28.8 0.8Taiwan Province of China 1961 6.8 2.0 40.6 10.0 4.0 31.7 n.a. 35.8 4.6Thailand 1960 4.6 1.0 35.2 8.0 3.0 46.6 104 40.2 5.8Tunisia 1968 3.3 1.0 30.3 5.3 3.0 48.5 268 58.8 9.3Vietnam 1985 4.9 3.0 20.0 5.2 3.0 35.7 n.a. 41.6 44.5
Average … 4.9 2.2 31.7 7.1 3.4 39.5 347.6 44.2 25.4
Developing world … … … … … … … 283.7 55.2 77.6
Sources: WDI (November 2006 download), ICRG, Polity IV, and World Bank Doing Business websites.
1/ Data refer to the start (T) of the growth episode, unless otherwise specified.2/ Average for the period T to L, where T refers to the start of the growth episode and L the latest year (2005).3/ Data refer to the period T. Score ranges from 1 to 7. The higher the score the more the constraints on the executive.4/ Data refer to the mid-1980s (1984). Score for economic risk ranges from 1 to 50, and for investment risk from 1-12. The higher the score the lower the risk.5/ Data refer to the mid-1990s (1996). Score ranges from 1 to 6. The higher the score the less the corruption.6/ For SGs, data refer to T or to the year closest to T for which data are available (see table 8c)7/ The data are from the World Bank Doing Business websites: "http://www.doingbusiness.org/ExploreTopics/PayingTaxes/". Data for all the countries including SGs are for the most recent period based on the survey of January 2006.
Economic Institutions. Costs of Doing Business7

Table 3a. Indicators for Selected sub-Saharan African Countries: Conflicts1
Mean Max Mean Max Mean Max Mean Max Mean Max Mean Max
Group 1: Sub-Saharan African Countries with Growth >= 2.0%
Angola* 2.1 3.0 2.7 3.0 0.8 3.0 1.9 3.0 0.0 0.0 0.0 0.0Botswana* 0.1 1.0 0.1 1.0 0.0 0.0 0.0 0.0 0.0 0.0 0.0 0.0Burkina Faso 0.0 0.0 0.0 0.0 0.0 0.0 0.0 0.0 0.0 0.0 0.0 0.0Cameroon 0.1 1.0 0.1 1.0 0.0 0.0 0.0 0.0 0.1 1.0 0.1 1.0Cape Verde 0.0 0.0 0.0 0.0 0.0 0.0 0.0 0.0 0.0 0.0 0.0 0.0Chad* 1.4 3.0 1.2 3.0 0.7 1.0 0.8 1.0 0.0 0.0 0.0 0.0Equatorial Guinea* 0.0 0.0 0.0 0.0 0.0 0.0 0.0 0.0 0.0 0.0 0.0 0.0Ethiopia 1.7 3.0 1.4 3.0 1.0 1.0 0.8 3.0 1.0 3.0 0.9 3.0Ghana 0.0 0.0 0.0 0.0 0.0 0.0 0.0 0.0 0.0 0.0 0.0 0.0Guinea 0.8 3.0 0.6 3.0 0.2 1.0 0.1 1.0 0.0 0.0 0.0 0.0Lesotho 0.1 1.0 0.1 1.0 0.0 0.0 0.0 0.0 0.0 0.0 0.0 0.0Liberia* 0.7 3.0 1.2 3.0 0.7 3.0 1.2 3.0 0.0 0.0 0.0 0.0Mali 0.0 0.0 0.1 1.0 0.0 0.0 0.1 1.0 0.0 0.0 0.0 0.0Mauritius* 0.0 0.0 0.0 0.0 0.0 0.0 0.0 0.0 0.0 0.0 0.0 0.0Mozambique 0.0 0.0 0.6 3.0 0.0 0.0 0.6 3.0 0.0 0.0 0.0 0.0Rwanda* 2.0 3.0 2.3 3.0 1.4 3.0 1.8 3.0 0.0 0.0 0.0 0.0
Sudan* 3.0 3.0 2.8 3.0 2.9 3.0 2.8 3.0 0.0 0.0 0.0 0.0Tanzania 0.0 0.0 0.0 0.0 0.0 0.0 0.0 0.0 0.0 0.0 0.0 0.0Uganda 2.6 3.0 2.1 3.0 2.1 3.0 1.7 3.0 0.0 0.0 0.0 0.0
Average 0.8 1.4 0.8 1.6 0.5 3.0 0.6 3.0 0.1 0.2 0.1 3.0Average (excl. * countries) 0.5 1.0 0.5 1.4 0.3 0.5 0.3 1.0 0.1 0.4 0.1 0.4Average, 1980 (excl. * countries) 0.4 0.4 0.0
T-test: mean for Group 1 equals mean for SGs 0.42 0.53 0.54 0.56 0.03 0.04 0.03 0.03 0.03 0.01 0.01 0.00
T-test: mean for Group 1 (excl. asterisked countries) equals mean for SGs
0.82 0.31 0.96 0.45 0.15 0.26 0.19 0.11 0.07 0.02 0.02 0.01
P-value for T-test: mean for Group 1 equals adjusted mean for SGs3
0.64 0.53 0.78 0.56 0.09 0.04 0.08 0.03 0.40 0.01 0.14 0.00
P-value for T-test: mean for Group 1 (excl. asterisked countries) equals adjusted mean for SGs3
0.94 0.31 0.70 0.45 0.30 0.26 0.38 0.11 0.58 0.02 0.23 0.01
Group 2: Sub-Saharan African Countries with Growth < 2.0%
Average 1.3 1.3 1.3 1.3 0.6 0.6 0.5 0.5 0.2 0.2 0.4 0.4Average, 19804 0.2 … … … 0.2 … … … 0.0 … … …
Sustained Growth Countries (SGs) 0.5 1.8 0.6 1.9 0.1 0.3 0.1 0.4 0.4 1.6 0.5 1.8
Sources: PRIO / Uppsala Armed Conflict Dataset (Gleditsch et al 2005).
1/ 0: No conflict 1: Minor (at least 25 deaths per year for every year in the period) 2: Intermediate (more than 25 but fewer than 1000 deaths per year) 3: War (at least 1000 deaths per year) T refers to year 2000 for Sub-Saharan African Countries. 2/ Values are based on maximum value of any conflict (internal extra-state, interstate, or internationalized internal) during a year.3/ Mean for SGs adjusted by adding the change in world mean between 1970 and the average for the period 1996-2005.4/ Since average 1980 is for one year, only one value is valid and reported for each category; Namibia is excluded since the earliest data on it is 1990.
T - 4 to T + 5 T - 9 to T T - 9 to TInterstate Conflicts
T - 4 to T + 5 T - 9 to T T - 4 to T + 5CountryAll Conflicts2 Internal Conflicts

33
Table 3b. Indicators for Sustained Growth Countries (SGs): Conflicts1
Year_TMean Max Mean Max Mean Max Mean Max Mean Max Mean Max
Chile 1986 0.0 0.0 0.0 0.0 0.0 0.0 0.0 0.0 0.0 0.0 0.0 0.0China,P.R.: Mainland 1978 1.0 3.0 0.2 1.0 0.0 0.0 0.0 0.0 1.0 3.0 0.2 1.0Dominican Republic 1969 0.1 1.0 0.1 1.0 0.1 1.0 0.1 1.0 0.0 0.0 0.0 0.0Egypt 1976 0.3 3.0 1.2 3.0 0.0 0.0 0.0 0.0 0.3 3.0 1.0 3.0Indonesia 1967 0.7 1.0 1.4 2.0 0.4 1.0 1.0 2.0 0.4 1.0 0.5 1.0Korea 1962 0.9 3.0 0.3 3.0 0.0 0.0 0.0 0.0 0.9 3.0 0.3 3.0Malaysia 1970 0.3 1.0 0.4 1.0 0.3 1.0 0.4 1.0 0.1 1.0 0.4 1.0Singapore 1969 0.0 0.0 0.0 0.0 0.0 0.0 0.0 0.0 0.0 0.0 0.0 0.0Taiwan Province of China 1961 0.3 3.0 0.6 3.0 0.0 0.0 0.0 0.0 0.3 3.0 0.6 3.0Thailand 1960 0.9 3.0 1.2 3.0 0.0 0.0 0.1 1.0 0.3 3.0 0.9 3.0Tunisia 1968 0.0 0.0 0.3 3.0 0.0 0.0 0.0 0.0 0.0 0.0 0.3 3.0Vietnam 1985 1.9 3.0 1.8 3.0 0.0 0.0 0.0 0.0 1.2 2.0 1.4 3.0
Average … 0.5 1.8 0.6 1.9 0.1 0.3 0.1 0.4 0.4 1.6 0.5 1.8Sources: PRIO / Uppsala Armed Conflict Dataset (Gleditsch et al 2005).
1/ 0: No conflict 1: Minor (at least 25 deaths per year for every year in the period) 2: Intermediate (more than 25 but fewer than 1000 deaths per year) 3: War (at least 1000 deaths per year)2/ Values are based on maximum value of any conflict (internal extra-state, interstate, or internationalized internal) during a year.
T - 4 to T + 5 T - 9 to T T - 9 to TInterstate Conflicts
T - 4 to T + 5CountryAll Conflicts 2 Internal Conflicts
T - 4 to T + 5 T - 9 to T

34
Table 4a. Indicators for Selected sub-Saharan African Countries: Social Fractionalization
country
Ethnic based on Easterly and
Levine (1997)
Ethnic based on Fearon
(2003)Religious based on
Fearon (2003)Ethnic based on
Alesina et al.(2003)Linguistic based on Alesina et al. (2003)
Religious based on Alesina et al. (2003)
Group 1: Sub-Saharan African Countries with Growth >= 2.0%
Angola* 0.78 0.76 0.61 0.79 0.79 0.63Botswana* 0.51 0.35 0.50 0.41 0.41 0.60Burkina Faso 0.68 0.70 0.58 0.74 0.72 0.58Cameroon 0.89 0.89 0.64 0.86 0.89 0.73Cape Verde n.a. n.a. n.a. 0.42 n.a. 0.08Chad* 0.83 0.77 0.63 0.86 0.86 0.64Equatorial Guinea* n.a. n.a. n.a. 0.35 0.32 0.12Ethiopia 0.69 0.76 0.61 0.72 0.81 0.62Ghana 0.71 0.85 0.70 0.67 0.67 0.80Guinea 0.75 0.67 0.27 0.74 0.77 0.26Lesotho 0.22 0.25 0.32 0.26 0.25 0.72Liberia* 0.83 0.90 0.64 0.91 0.90 0.49Mali 0.78 0.75 0.18 0.69 0.84 0.18Mauritius* 0.58 0.63 0.63 0.46 0.45 0.64Mozambique 0.65 0.77 0.62 0.69 0.81 0.68Rwanda* 0.13 0.18 0.51 0.32 n.a. 0.51
Sudan* 0.74 0.71 0.45 0.71 0.72 0.43Tanzania 0.93 0.95 0.64 0.74 0.90 0.63Uganda 0.90 0.93 0.72 0.93 0.92 0.63
Average 0.68 0.70 0.54 0.65 0.71 0.53Average (excl. * countries) 0.72 0.75 0.53 0.68 0.76 0.54
P-value for T-test: mean for Group 1 equals mean for SGs 0.00 0.00 0.00 0.00 0.00 0.25
P-value for T-test: mean for Group 1 (excl. asterisked countries) equals mean for SGs 0.00 0.00 0.02 0.00 0.00 0.28
Group 2: Sub-Saharan African Countries with Growth < 2.0%
Average 0.6 0.7 0.5 0.7 0.6 0.5
Sources: Easterly and Levine (2003); Fearon (2003), and Alesina et. al. (2003)
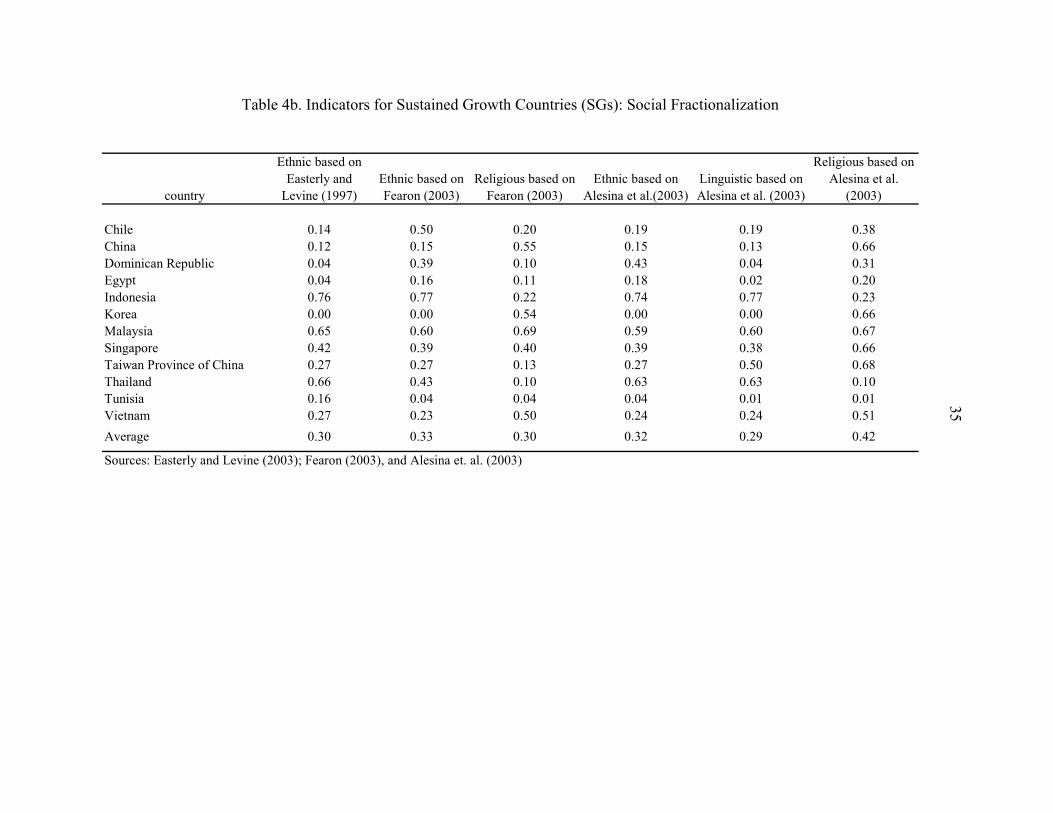
35
Table 4b. Indicators for Sustained Growth Countries (SGs): Social Fractionalization
country
Ethnic based on Easterly and
Levine (1997)Ethnic based on Fearon (2003)
Religious based on Fearon (2003)
Ethnic based on Alesina et al.(2003)
Linguistic based on Alesina et al. (2003)
Religious based on Alesina et al.
(2003)
Chile 0.14 0.50 0.20 0.19 0.19 0.38China 0.12 0.15 0.55 0.15 0.13 0.66Dominican Republic 0.04 0.39 0.10 0.43 0.04 0.31Egypt 0.04 0.16 0.11 0.18 0.02 0.20Indonesia 0.76 0.77 0.22 0.74 0.77 0.23Korea 0.00 0.00 0.54 0.00 0.00 0.66Malaysia 0.65 0.60 0.69 0.59 0.60 0.67Singapore 0.42 0.39 0.40 0.39 0.38 0.66Taiwan Province of China 0.27 0.27 0.13 0.27 0.50 0.68Thailand 0.66 0.43 0.10 0.63 0.63 0.10Tunisia 0.16 0.04 0.04 0.04 0.01 0.01Vietnam 0.27 0.23 0.50 0.24 0.24 0.51Average 0.30 0.33 0.30 0.32 0.29 0.42
Sources: Easterly and Levine (2003); Fearon (2003), and Alesina et. al. (2003)
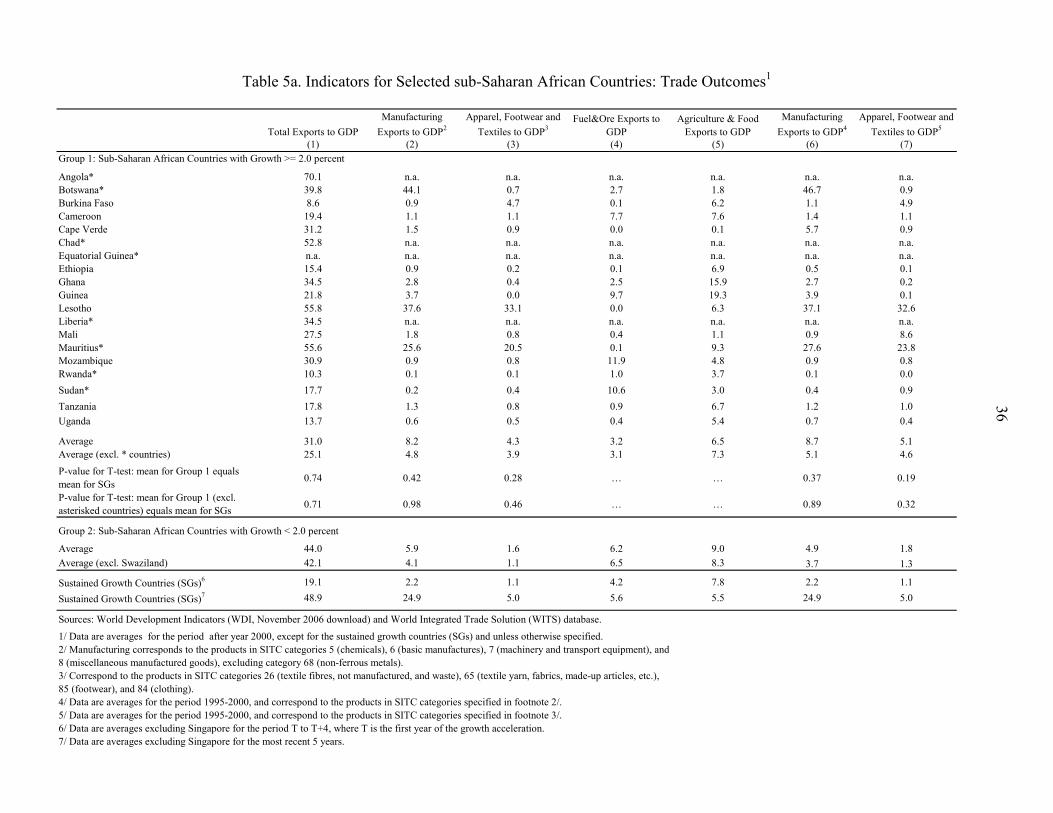
36
Table 5a. Indicators for Selected sub-Saharan African Countries: Trade Outcomes1
Total Exports to GDPManufacturing
Exports to GDP2Apparel, Footwear and
Textiles to GDP3Fuel&Ore Exports to
GDPAgriculture & Food
Exports to GDPManufacturing
Exports to GDP4Apparel, Footwear and
Textiles to GDP5
(1) (2) (3) (4) (5) (6) (7)Group 1: Sub-Saharan African Countries with Growth >= 2.0 percent
Angola* 70.1 n.a. n.a. n.a. n.a. n.a. n.a.Botswana* 39.8 44.1 0.7 2.7 1.8 46.7 0.9Burkina Faso 8.6 0.9 4.7 0.1 6.2 1.1 4.9Cameroon 19.4 1.1 1.1 7.7 7.6 1.4 1.1Cape Verde 31.2 1.5 0.9 0.0 0.1 5.7 0.9Chad* 52.8 n.a. n.a. n.a. n.a. n.a. n.a.Equatorial Guinea* n.a. n.a. n.a. n.a. n.a. n.a. n.a.Ethiopia 15.4 0.9 0.2 0.1 6.9 0.5 0.1Ghana 34.5 2.8 0.4 2.5 15.9 2.7 0.2Guinea 21.8 3.7 0.0 9.7 19.3 3.9 0.1Lesotho 55.8 37.6 33.1 0.0 6.3 37.1 32.6Liberia* 34.5 n.a. n.a. n.a. n.a. n.a. n.a.Mali 27.5 1.8 0.8 0.4 1.1 0.9 8.6Mauritius* 55.6 25.6 20.5 0.1 9.3 27.6 23.8Mozambique 30.9 0.9 0.8 11.9 4.8 0.9 0.8Rwanda* 10.3 0.1 0.1 1.0 3.7 0.1 0.0Sudan* 17.7 0.2 0.4 10.6 3.0 0.4 0.9Tanzania 17.8 1.3 0.8 0.9 6.7 1.2 1.0Uganda 13.7 0.6 0.5 0.4 5.4 0.7 0.4
Average 31.0 8.2 4.3 3.2 6.5 8.7 5.1Average (excl. * countries) 25.1 4.8 3.9 3.1 7.3 5.1 4.6P-value for T-test: mean for Group 1 equals mean for SGs 0.74 0.42 0.28 … … 0.37 0.19
P-value for T-test: mean for Group 1 (excl. asterisked countries) equals mean for SGs 0.71 0.98 0.46 … … 0.89 0.32
Group 2: Sub-Saharan African Countries with Growth < 2.0 percent
Average 44.0 5.9 1.6 6.2 9.0 4.9 1.8Average (excl. Swaziland) 42.1 4.1 1.1 6.5 8.3 3.7 1.3
Sustained Growth Countries (SGs)6 19.1 2.2 1.1 4.2 7.8 2.2 1.1Sustained Growth Countries (SGs)7 48.9 24.9 5.0 5.6 5.5 24.9 5.0
Sources: World Development Indicators (WDI, November 2006 download) and World Integrated Trade Solution (WITS) database.
1/ Data are averages for the period after year 2000, except for the sustained growth countries (SGs) and unless otherwise specified.2/ Manufacturing corresponds to the products in SITC categories 5 (chemicals), 6 (basic manufactures), 7 (machinery and transport equipment), and 8 (miscellaneous manufactured goods), excluding category 68 (non-ferrous metals). 3/ Correspond to the products in SITC categories 26 (textile fibres, not manufactured, and waste), 65 (textile yarn, fabrics, made-up articles, etc.), 85 (footwear), and 84 (clothing). 4/ Data are averages for the period 1995-2000, and correspond to the products in SITC categories specified in footnote 2/.5/ Data are averages for the period 1995-2000, and correspond to the products in SITC categories specified in footnote 3/.6/ Data are averages excluding Singapore for the period T to T+4, where T is the first year of the growth acceleration.7/ Data are averages excluding Singapore for the most recent 5 years.

37
Table 5b. Indicators for Sustained Growth Countries (SGs): Trade Outcomes
Year T
Total Exports to
GDPManufacturing
Exports to GDP3
Apparel, Footwear and
Textiles to GDP4
Fuel & Ore Exports to
GDP
Agriculture & Food Exports
to GDP
Total Exports to
GDPManufacturing
Exports to GDP3
Apparel, Footwear and
Textiles to GDP4
Fuel & Ore Exports to GDP
Agriculture & Food Exports
to GDP(1) (2) (3) (4) (5) (6) (7) (8) (9) (10)
Chile 1986 32.9 2.5 0.3 14.2 8.7 35.3 4.3 0.2 12.6 9.4China,P.R.: Mainland 1978 7.2 4.9 2.8 2.6 2.1 26.9 21.9 5.3 1.1 1.3Dominican Republic 1969 18.9 3.3 0.0 0.5 14.3 44.7 1.3 0.1 0.6 1.6Egypt 1976 25.3 2.5 4.6 4.7 4.4 20.4 2.1 1.0 2.8 1.0Indonesia 1967 11.7 0.2 0.0 4.9 5.8 34.6 16.7 4.6 8.9 4.5Korea 1962 6.6 2.1 1.4 0.7 1.3 39.2 29.8 3.0 1.9 0.8Malaysia 1970 39.7 3.7 0.5 9.6 23.9 118.0 81.3 3.5 11.3 9.8Singapore 1969 113.3 28.1 5.9 20.7 32.9 150.5 133.6 3.1 15.5 3.9Taiwan Province of China 1961 n.a. n.a. n.a. n.a. n.a. n.a. n.a. n.a. n.a. n.a.Thailand 1960 15.9 0.3 0.6 1.2 12.4 66.6 43.1 5.2 2.3 10.4Tunisia 1968 22.9 2.4 0.3 4.1 5.2 44.9 25.6 14.0 3.6 2.9Vietnam 1985 10.1 0.0 0.0 0.0 0.0 58.2 22.9 13.3 11.1 13.1
Average5 19.1 2.2 1.1 4.2 7.8 48.9 24.9 5.0 5.6 5.5Sources: World Development Indicators (WDI, November 2006 download) and World Integrated Trade Solution (WITS) database.
1/ Average for the period T to T+4, except China (1984) and Dominican Republic (1974).2/ Average for the latest 5 years (2000 to 2004).3/ Manufacturing corresponds to the products in SITC categories 5 (chemicals), 6 (basic manufactures), 7 (machinery and transport equipment), and 8 (miscellaneous manufactured goods),excluding category 68 (non-ferrous metals). 4/ Correspond to the products in SITC categories 26 (textile fibres, not manufactured, and waste), 65 (textile yarn, fabrics, made-up articles, etc.), 85 (footwear), and 84 (clothing). 5/ Averages are excluding Singapore.
Trade Outcomes: Initial1 Trade Outcomes: Latest2
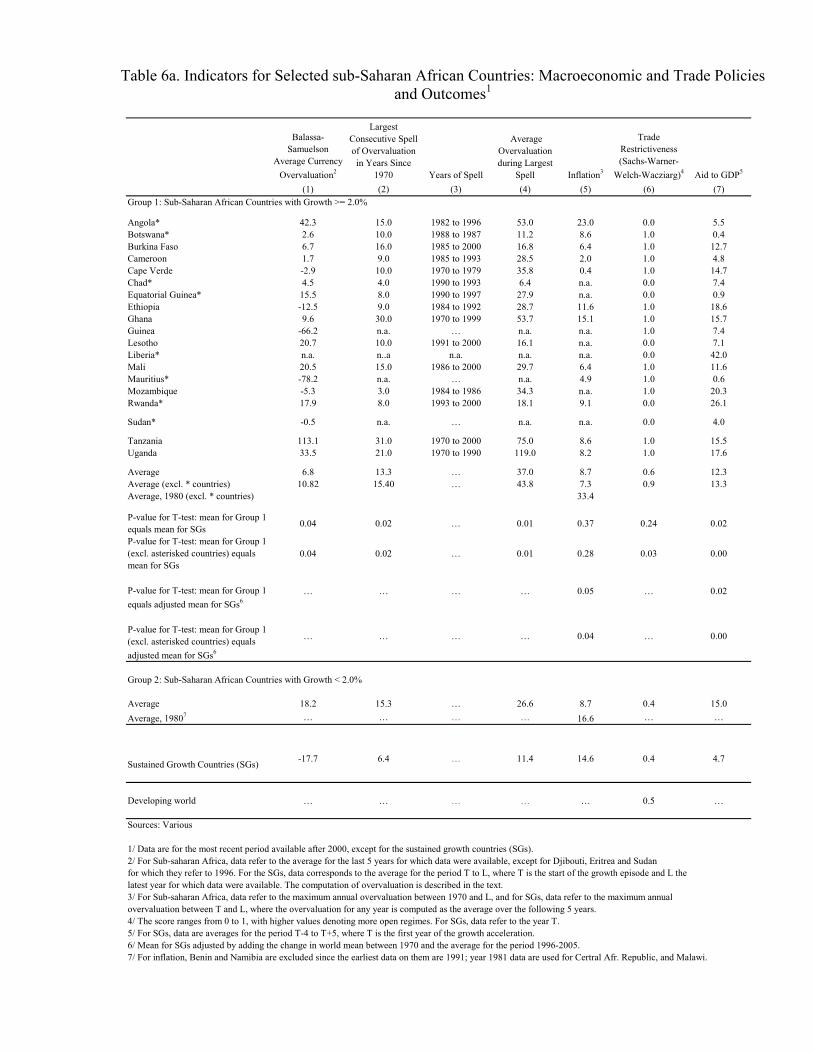
Table 6a. Indicators for Selected sub-Saharan African Countries: Macroeconomic and Trade Policies and Outcomes1
Balassa-Samuelson
Average Currency Overvaluation2
Largest Consecutive Spell of Overvaluation in Years Since
1970 Years of Spell
Average Overvaluation during Largest
Spell Inflation3
Trade Restrictiveness (Sachs-Warner-
Welch-Wacziarg)4 Aid to GDP5
(1) (2) (3) (4) (5) (6) (7)Group 1: Sub-Saharan African Countries with Growth >= 2.0%
Angola* 42.3 15.0 1982 to 1996 53.0 23.0 0.0 5.5Botswana* 2.6 10.0 1988 to 1987 11.2 8.6 1.0 0.4Burkina Faso 6.7 16.0 1985 to 2000 16.8 6.4 1.0 12.7Cameroon 1.7 9.0 1985 to 1993 28.5 2.0 1.0 4.8Cape Verde -2.9 10.0 1970 to 1979 35.8 0.4 1.0 14.7Chad* 4.5 4.0 1990 to 1993 6.4 n.a. 0.0 7.4Equatorial Guinea* 15.5 8.0 1990 to 1997 27.9 n.a. 0.0 0.9Ethiopia -12.5 9.0 1984 to 1992 28.7 11.6 1.0 18.6Ghana 9.6 30.0 1970 to 1999 53.7 15.1 1.0 15.7Guinea -66.2 n.a. … n.a. n.a. 1.0 7.4Lesotho 20.7 10.0 1991 to 2000 16.1 n.a. 0.0 7.1Liberia* n.a. n..a n.a. n.a. n.a. 0.0 42.0Mali 20.5 15.0 1986 to 2000 29.7 6.4 1.0 11.6Mauritius* -78.2 n.a. … n.a. 4.9 1.0 0.6Mozambique -5.3 3.0 1984 to 1986 34.3 n.a. 1.0 20.3Rwanda* 17.9 8.0 1993 to 2000 18.1 9.1 0.0 26.1
Sudan* -0.5 n.a. … n.a. n.a. 0.0 4.0
Tanzania 113.1 31.0 1970 to 2000 75.0 8.6 1.0 15.5Uganda 33.5 21.0 1970 to 1990 119.0 8.2 1.0 17.6
Average 6.8 13.3 … 37.0 8.7 0.6 12.3Average (excl. * countries) 10.82 15.40 … 43.8 7.3 0.9 13.3Average, 1980 (excl. * countries) 33.4
P-value for T-test: mean for Group 1 equals mean for SGs 0.04 0.02 … 0.01 0.37 0.24 0.02
P-value for T-test: mean for Group 1 (excl. asterisked countries) equals mean for SGs
0.04 0.02 … 0.01 0.28 0.03 0.00
P-value for T-test: mean for Group 1 equals adjusted mean for SGs6
… … … … 0.05 … 0.02
P-value for T-test: mean for Group 1 (excl. asterisked countries) equals adjusted mean for SGs6
… … … … 0.04 … 0.00
Group 2: Sub-Saharan African Countries with Growth < 2.0%
Average 18.2 15.3 … 26.6 8.7 0.4 15.0Average, 19807 … … … … 16.6 … …
Sustained Growth Countries (SGs) -17.7 6.4 … 11.4 14.6 0.4 4.7
Developing world … … … … … 0.5 …
Sources: Various
1/ Data are for the most recent period available after 2000, except for the sustained growth countries (SGs).2/ For Sub-saharan Africa, data refer to the average for the last 5 years for which data were available, except for Djibouti, Eritrea and Sudan for which they refer to 1996. For the SGs, data corresponds to the average for the period T to L, where T is the start of the growth episode and L the latest year for which data were available. The computation of overvaluation is described in the text.3/ For Sub-saharan Africa, data refer to the maximum annual overvaluation between 1970 and L, and for SGs, data refer to the maximum annual overvaluation between T and L, where the overvaluation for any year is computed as the average over the following 5 years.4/ The score ranges from 0 to 1, with higher values denoting more open regimes. For SGs, data refer to the year T. 5/ For SGs, data are averages for the period T-4 to T+5, where T is the first year of the growth acceleration.6/ Mean for SGs adjusted by adding the change in world mean between 1970 and the average for the period 1996-2005.7/ For inflation, Benin and Namibia are excluded since the earliest data on them are 1991; year 1981 data are used for Certral Afr. Republic, and Malawi.

39
Table 6b. Indicators for Sustained Growth Countries (SGs): Macroeconomic and Trade Policies and Outcomes1
Year T
Average Currency
Overvaluation2
Largest Consecutive
Spell of Overvaluation in Years Since 1970 Years of Spell
Average Overvaluation during Largest
Spell Inflation3
Trade Restrictiveness (Sachs-Warner-Welch-
Wacziarg)4Aid to GDP5
(1) (2) (3) (4) (5) (6) (7)Chile 1986 -15.6 5.0 1979 to 1983 12.2 19.6 1.0 0.1China,P.R.: Mainland 1978 -27.9 12.0 1970 to 1981 20.6 n.a. 0.0 0.1Dominican Republic 1969 1.9 10.0 1970 to 1979 10.6 6.4 0.0 3.9Egypt 1976 -14.5 5.0 1985 to 1989 30.5 13.0 0.0 8.8Indonesia 1967 -27.3 3.0 1976 to 1978 13.0 53.4 0.4 24.0Korea 1962 -13.7 9.0 1989 to 1997 10.8 10.6 0.0 6.8Malaysia 1970 -9.0 6.0 1970 to 1975 7.4 6.9 1.0 0.8Singapore 1969 11.1 9.0 1970 to 1978 15.4 4.7 1.0 0.8Taiwan Province of China 1961 9.3 18.0 1980 to 1997 16.5 n.a. 0.6 2.9Thailand 1960 -22.8 0.0 … 0.0 1.9 1.0 1.1Tunisia 1968 -29.3 0.0 … 0.0 n.a. 0.0 6.3Vietnam 1985 -73.9 0.0 … 0.0 n.a. 0.0 0.9
Average -17.7 6.4 … 11.4 14.6 0.4 4.7
Developing world … … … … … 0.5 …
Sources: Various
1/ The data refer to the start (T) of the growth episode, unless otherwise specified.2/ Average for the period T to L, where T refers to the start of the growth episode and L the latest year for which data are available.3/ Average for the period T to T+4, except Korea (1967).4/ Average for the period T to T+4.5/ Average for the period T-4 to T+5.

Table 7a. Indicators for Selected sub-Saharan African Countries: Costs of Trading1
No. of Documents Required to Export
(in units)
No. of Signatures Needed to Export (in
units)
Time for Export Procedures (in calendar days)
No. of Documents Required to Import (in
units)
No. of Signatures Needed to Import (in
units)
Time for Import Procedures (in calendar days)
(1) (2) (3) (4) (5) (6)Group 1: Sub-Saharan African Countries with Growth >= 2.0%
Angola* 6.0 n.a. 74.0 10.0 28.0 85.0Botswana* 6.0 7.0 37.0 9.0 10.0 42.0Burkina Faso 9.0 19.0 69.0 13.0 37.0 66.0Cameroon 10.0 11.0 38.0 14.0 20.0 51.0Cape Verde 4.0 n.a. 18.0 9.0 n.a. 16.0Chad* 7.0 32.0 87.0 14.0 42.0 111.0Equatorial Guinea* 6.0 20.0 26.0 6.0 33.0 50.0Ethiopia 8.0 33.0 45.0 11.0 45.0 52.0Ghana 5.0 11.0 21.0 9.0 13.0 42.0Guinea 7.0 11.0 43.0 12.0 23.0 56.0Lesotho 6.0 n.a. 46.0 9.0 15.0 51.0Liberia* n.a. n.a. n.a. n.a. n.a. n.a.Mali 10.0 33.0 66.0 16.0 60.0 61.0Mauritius* 5.0 4.0 16.0 7.0 4.0 16.0Mozambique 6.0 12.0 39.0 16.0 12.0 38.0Rwanda* 14.0 27.0 60.0 20.0 46.0 95.0
Sudan* 12.0 35.0 56.0 13.0 50.0 83.0
Tanzania 3.0 10.0 24.0 10.0 16.0 39.0Uganda 12.0 18.0 42.0 19.0 27.0 67.0
Average 7.6 18.9 44.8 12.1 28.3 56.7Average (excl. * countries) 7.3 17.6 41.0 12.5 26.8 49.0
P-value for T-test: mean for Group 1 equals mean for SGs 0.24 0.00 0.00 0.02 0.00 0.00
P-value for T-test: mean for Group 1 (excl. asterisked countries) equals mean for SGs
0.24 0.00 0.00 0.01 0.00 0.00
Group 2: Sub-Saharan African Countries with Growth < 2.0%
Average 8.8 18.5 36.2 12.4 30.9 47.3
Sustained Growth Countries (SGs) 6.6 6.5 19.1 9.4 8.0 21.3
Developing world 7.5 12.6 29.4 10.6 19.1 36.6
Source: The World Bank Doing Business websites: "http://www.doingbusiness.org/ExploreTopics/TradingAcrossBorders/".
1/ Data are for the most recent period based on the survey of January 2006, except (2) and (5), which are based on a survey of January 2005.

41
Table 7b. Indicators for Sustained Growth Countries (SGs): Costs of Trading1
Year T
No. of Documents Required to Export
(in units)
No. of Signatures Needed to Export
(in units)
Time for Export Procedures (in calendar days)
No. of Documents Required to Import
(in units)
No. of Signatures Needed to Import (in
units)
Time for Import Procedures (in calendar days)
(1) (2) (3) (4) (5) (6)Chile 1986 7.0 7.0 20.0 9.0 8.0 24.0China,P.R.: Mainland 1978 6.0 7.0 18.0 12.0 8.0 22.0Dominican Republic 1969 7.0 3.0 17.0 11.0 6.0 17.0Egypt 1976 8.0 11.0 20.0 8.0 8.0 25.0Indonesia 1967 7.0 3.0 25.0 10.0 6.0 30.0Korea 1962 5.0 3.0 12.0 8.0 5.0 12.0Malaysia 1970 6.0 3.0 20.0 12.0 5.0 22.0Singapore 1969 5.0 2.0 6.0 6.0 2.0 3.0Taiwan Province of China 1961 8.0 9.0 14.0 8.0 11.0 14.0Thailand 1960 9.0 10.0 24.0 12.0 10.0 22.0Tunisia 1968 5.0 8.0 18.0 8.0 12.0 29.0Vietnam 1985 6.0 12.0 35.0 9.0 15.0 36.0
Average … 6.6 6.5 19.1 9.4 8.0 21.3
Developing world … 7.5 12.6 29.4 10.6 19.1 36.6
Source: The World Bank Doing Business websites: "http://www.doingbusiness.org/ExploreTopics/TradingAcrossBorders/".
1/ Data are for the most recent period based on the survey of January 2006, except (2) and (5), which are based on a survey of January 2005.

Table 8a. Indicators for Selected sub-Saharan African Countries: Social and Physical Infrastructure1
Primary Education2
Secondary Education2 Latest3 1982
Physicians (per million people)3
Telephone Mainlines (per 1,000 people)3
Total Roads per Surface Area (in
km)4
(1) (2) (3) (4) (5) (6) (7)Group 1: Sub-Saharan African Countries with Growth >= 2.0%
Angola* n.a. 16.5 40.9 39.9 77.0 6 43Botswana* 104 73.4 36.0 63.2 343.0 76 34Burkina Faso 48 11.5 47.7 47.7 41.2 6 46Cameroon 111 35.7 45.9 50.7 132.9 7 121Cape Verde 114 65.1 70.1 61.7 329.7 148 273Chad* 71 13.7 43.7 44.5 32.1 1 26Equatorial Guinea* 119 29.2 43.1 43.6 251.9 20 103Ethiopia 73 24.5 42.3 42.0 24.1 6 29Ghana 79 38.7 56.9 53.8 101.2 14 186Guinea 73 24.8 53.8 42.8 112.9 3 152Lesotho 127 34.0 36.0 54.3 51.7 20 196Liberia* n.a. n.a. 42.5 44.9 26.3 n.a. 95Mali 60 21.3 48.0 42.7 57.0 5 13Mauritius* 104 80.3 72.3 66.7 953.4 286 966Mozambique 86 8.7 41.9 42.8 25.6 4 38Rwanda* 108 13.5 43.7 45.7 33.0 3 456
Sudan* 57 31.3 56.4 50.1 156.1 28 5
Tanzania 89 n.a. 46.1 54.8 31.8 4 88Uganda 131 18.0 47.8 49.9 64.9 2 294
Average 91.4 31.8 48.2 49.6 149.8 35.6 166.4
Average (excl. * countries) 90 28 49 49 88 20 130Average, 1980 (excl. * countries) 68.6 28.9
P-value for T-test: mean for Group 1 equals mean for SGs 0.60 0.56 0.00 … 0.01 0.45 0.30
P-value for T-test: mean for Group 1 (excl. asterisked countries) equals mean for SGs5
0.67 0.20 0.00 … 0.00 0.86 0.29
P-value for T-test: mean for Group 1 equals adjusted mean for SGs 0.00 0.00 0.04 … 0.00 0.00 …
P-value for T-test: mean for Group 1 (excl. asterisked countries) equals adjusted mean for SGs5
0.01 0.00 0.06 … 0.00 0.00 …
Group 2: Sub-Saharan African Countries with Growth < 2.0%
Average 89 34.6 48.8 50.9 216 27 155Average, 19806 79.4 19.2 … … … … …
Sustained Growth Countries (SGs) 95 35.9 59.5 64.7 522.5 21 204Sources: World Development Indicators (WDI, November 2006 download), and Deninger and Squire (1996).
1/ Data are for the most recent period available after 2000, except for the sustained growth countries (SGs). 2/ Measured as the gross enrollment ratio. For SGs, data refer to T or to the year closest to T for which data are available (see tables 6b and 6c for details).3/ For SGs, data refer to T or to the year closest to T for which data are available (see table 8c).4/ For SGs, data refer to 1990 and exclude Singapore.5/ Mean for SGs adjusted by adding the change in world mean between 1970 and the average for the period 1996-2005.6/ Eritrea (1992), Seychelles (1998), Gabon (1990), Namibia (1998) and Sao Tome & Principe (1998) are excluded. Years for which the latest data available are stated in brackets.
Life Expectancy

43
Table 8b. Indicators for Sustained Growth Countries (SGs): Social and Physical Infrastructure1
Year TPrimary
Education2Secondary Education2 Year T3 1982
Physicians (per million people)3
Telephone Mainlines (per 1,000 people)3
Total Roads per Surface Area (in km)4
(1) (2) (3) (4) (5) (6) (7)
Chile 1986 105.0 66.9 72.7 70.7 816.8 45.4 105.2China,P.R.: Mainland 1978 112.6 45.9 65.4 67.8 1080.0 2.0 123.0Dominican Republic 1969 98.4 21.2 59.9 63.0 435.0 19.0 227.8Egypt 1976 70.0 40.3 54.1 56.5 535.9 8.9 45.9Indonesia 1967 80.0 16.1 46.0 56.2 37.3 1.5 151.6Korea 1962 103.4 41.6 55.2 67.7 600.0 30.0 571.4Malaysia 1970 88.7 34.2 63.0 68.0 232.0 13.8 261.2Singapore 1969 105.5 46.0 68.5 71.8 656.9 93.0 4114.7Taiwan Province of China 1961 n.a. n.a. n.a. n.a. n.a. n.a. n.a.Thailand 1960 81.4 17.4 53.9 65.2 128.9 5.5 140.6Tunisia 1968 100.4 22.7 52.1 63.7 168.5 11.6 122.4Vietnam 1985 103.0 42.7 63.4 61.4 1056.0 1.2 289.7
Average 95.3 35.9 59.5 64.7 522.5 21.1 203.9Sources: World Development Indicators (WDI, November 2006 download), and Deninger and Squire (1996).
1/ The data refer to the start (T) of the growth episode, unless otherwise specified.2/ Measured as the gross enrollment ratio. Data refer to T or to the year closest to T for which data are available (see table 6c for details).3/ Data refer to T or to the year closest to T for which data are available (see Table 6c for details)4/ Data refer to 1990. Average excludes Singapore.
Life Expectancy

44
Table 8c. Years Corresponding to Data in Table 8b.
Year TPrimary
EducationSecondary Education Year T 1980 Physicians Telephone Mainlines
Total Roads per Surface Area
(1) (2) (4) (5) (6) (7) (8)
Chile 1986 1985 1985 1987 1982 1984 1986 1990China,P.R.: Mainland 1978 1980 1980 1977 1982 1978 1978 1990Dominican Republic 1969 1970 1970 1972 1982 1975 1980 1990Egypt 1976 1975 1975 1977 1982 1975 1976 1990Indonesia 1967 1970 1970 1967 1982 1970 1975 1990Korea 1962 1970 1970 1962 1982 1985 1975 1990Malaysia 1970 1970 1970 1972 1982 1970 1975 1990Singapore 1969 1970 1970 1972 1982 1970 1975 1990Taiwan Province of China 1961 n.a. n.a. n.a. n.a. n.a. n.a. n.a.Thailand 1960 1970 1970 1963 1982 1960 1975 1990Tunisia 1968 1970 1970 1968 1982 1970 1975 1990Vietnam 1985 1985 1985 1987 1982 1986 1985 1990
Life Expectancy
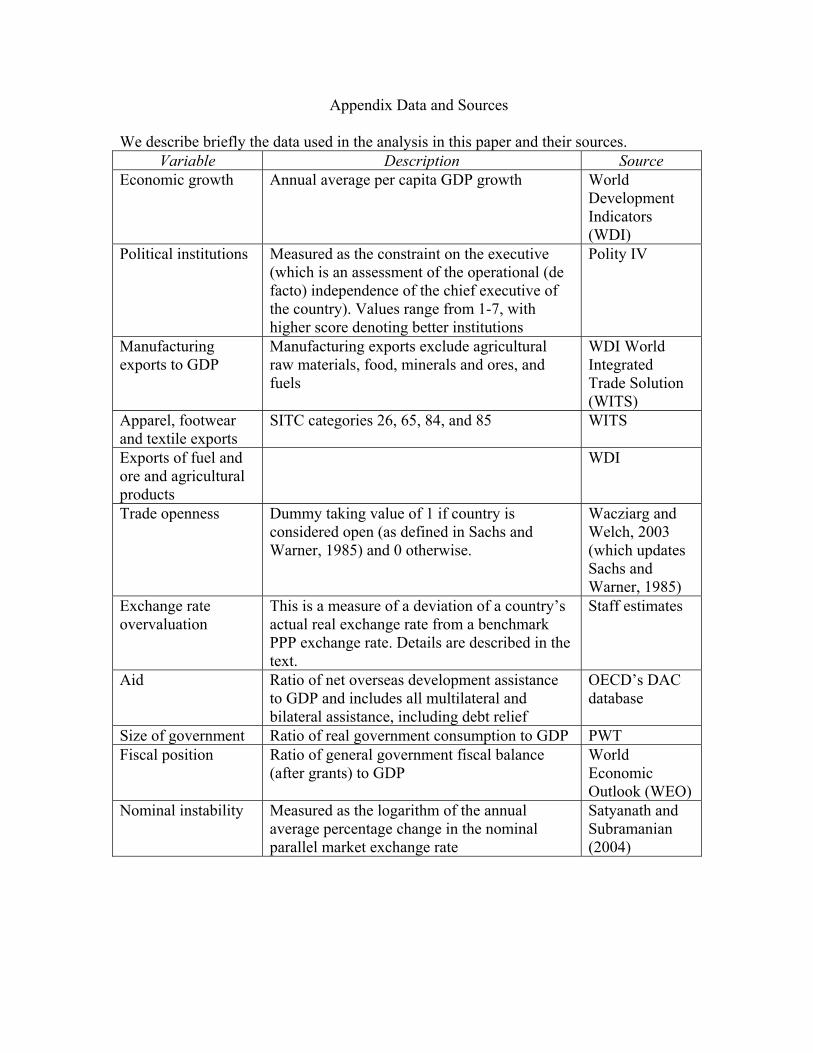
Appendix Data and Sources We describe briefly the data used in the analysis in this paper and their sources.
Variable Description Source Economic growth Annual average per capita GDP growth World
Development Indicators (WDI)
Political institutions Measured as the constraint on the executive (which is an assessment of the operational (de facto) independence of the chief executive of the country). Values range from 1-7, with higher score denoting better institutions
Polity IV
Manufacturing exports to GDP
Manufacturing exports exclude agricultural raw materials, food, minerals and ores, and fuels
WDI World Integrated Trade Solution (WITS)
Apparel, footwear and textile exports
SITC categories 26, 65, 84, and 85 WITS
Exports of fuel and ore and agricultural products
WDI
Trade openness Dummy taking value of 1 if country is considered open (as defined in Sachs and Warner, 1985) and 0 otherwise.
Wacziarg and Welch, 2003 (which updates Sachs and Warner, 1985)
Exchange rate overvaluation
This is a measure of a deviation of a country’s actual real exchange rate from a benchmark PPP exchange rate. Details are described in the text.
Staff estimates
Aid Ratio of net overseas development assistance to GDP and includes all multilateral and bilateral assistance, including debt relief
OECD’s DAC database
Size of government Ratio of real government consumption to GDP PWT Fiscal position Ratio of general government fiscal balance
(after grants) to GDP World Economic Outlook (WEO)
Nominal instability Measured as the logarithm of the annual average percentage change in the nominal parallel market exchange rate
Satyanath and Subramanian (2004)

Appendix Data and Sources
Variable Description Source Primary education Measured as the gross primary schooling
enrollment ratio. The gross enrollment ratio is the total enrollment at a given educational level, regardless of age, divided by the population of the age group that typically corresponds to that level of education. The specification of age groups varies by country, based on different national systems of education and the duration of schooling at the primary and secondary levels.
WDI
Secondary education Measured as the gross secondary schooling enrollment ratio
WDI
Inequality Measured as the gini coefficient of income inequality
WDI
Economic institutions
This is an assessment of factors affecting the risk to investment. The risk rating assigned is the sum of three subcomponents (contract viability/expropriation, payments delays, and profits repatriation), each with a maximum score of four points and a minimum score of 0 points. The measure thus varies from 0 (high risk) to 12 (low risk).
International Country Risk Guide Economic Rating (ICRGE)
Business environment/Trading costs
Measured as the costs per capita of starting a business; and various measures of costs of imports and exports.
World Bank’s Doing Business Database
Measures of social and physical infrastructure
WDI
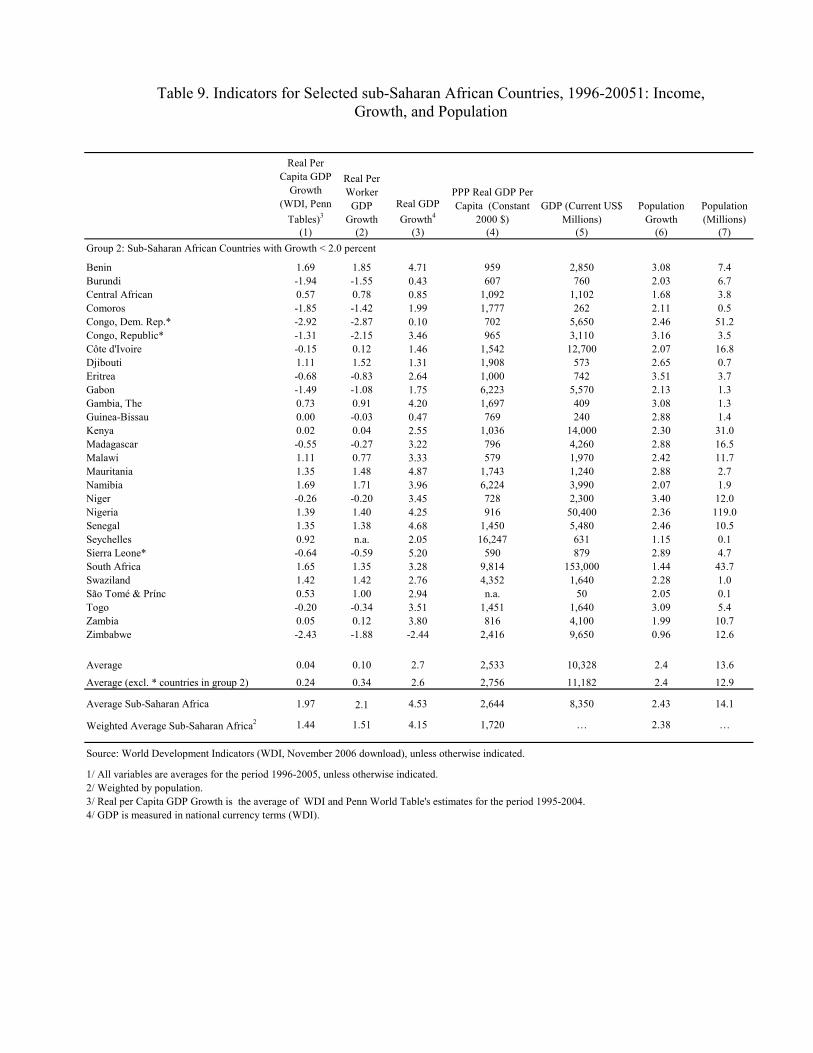
Table 9. Indicators for Selected sub-Saharan African Countries, 1996-20051: Income, Growth, and Population
Real Per Capita GDP
Growth (WDI, Penn
Tables)3
Real Per Worker
GDP Growth
Real GDP Growth4
PPP Real GDP Per Capita (Constant
2000 $)GDP (Current US$
Millions)Population
GrowthPopulation (Millions)
(1) (2) (3) (4) (5) (6) (7)Group 2: Sub-Saharan African Countries with Growth < 2.0 percent
Benin 1.69 1.85 4.71 959 2,850 3.08 7.4Burundi -1.94 -1.55 0.43 607 760 2.03 6.7Central African 0.57 0.78 0.85 1,092 1,102 1.68 3.8Comoros -1.85 -1.42 1.99 1,777 262 2.11 0.5Congo, Dem. Rep.* -2.92 -2.87 0.10 702 5,650 2.46 51.2Congo, Republic* -1.31 -2.15 3.46 965 3,110 3.16 3.5Côte d'Ivoire -0.15 0.12 1.46 1,542 12,700 2.07 16.8Djibouti 1.11 1.52 1.31 1,908 573 2.65 0.7Eritrea -0.68 -0.83 2.64 1,000 742 3.51 3.7Gabon -1.49 -1.08 1.75 6,223 5,570 2.13 1.3Gambia, The 0.73 0.91 4.20 1,697 409 3.08 1.3Guinea-Bissau 0.00 -0.03 0.47 769 240 2.88 1.4Kenya 0.02 0.04 2.55 1,036 14,000 2.30 31.0Madagascar -0.55 -0.27 3.22 796 4,260 2.88 16.5Malawi 1.11 0.77 3.33 579 1,970 2.42 11.7Mauritania 1.35 1.48 4.87 1,743 1,240 2.88 2.7Namibia 1.69 1.71 3.96 6,224 3,990 2.07 1.9Niger -0.26 -0.20 3.45 728 2,300 3.40 12.0Nigeria 1.39 1.40 4.25 916 50,400 2.36 119.0Senegal 1.35 1.38 4.68 1,450 5,480 2.46 10.5Seychelles 0.92 n.a. 2.05 16,247 631 1.15 0.1Sierra Leone* -0.64 -0.59 5.20 590 879 2.89 4.7South Africa 1.65 1.35 3.28 9,814 153,000 1.44 43.7Swaziland 1.42 1.42 2.76 4,352 1,640 2.28 1.0São Tomé & Prínc 0.53 1.00 2.94 n.a. 50 2.05 0.1Togo -0.20 -0.34 3.51 1,451 1,640 3.09 5.4Zambia 0.05 0.12 3.80 816 4,100 1.99 10.7Zimbabwe -2.43 -1.88 -2.44 2,416 9,650 0.96 12.6
Average 0.04 0.10 2.7 2,533 10,328 2.4 13.6
Average (excl. * countries in group 2) 0.24 0.34 2.6 2,756 11,182 2.4 12.9
Average Sub-Saharan Africa 1.97 2.1 4.53 2,644 8,350 2.43 14.1
Weighted Average Sub-Saharan Africa2 1.44 1.51 4.15 1,720 … 2.38 …
Source: World Development Indicators (WDI, November 2006 download), unless otherwise indicated.
1/ All variables are averages for the period 1996-2005, unless otherwise indicated.2/ Weighted by population.3/ Real per Capita GDP Growth is the average of WDI and Penn World Table's estimates for the period 1995-2004.4/ GDP is measured in national currency terms (WDI).

Table 10. Indicators for Selected sub-Saharan African Countries: Institutions and Costs of Doing Business1
GrowthPolitical
Institutions. Governance Inequality
Real Per Capita GDP Growth
(Constant 2000, WDI)2
Constraint on the Executive3
Economic Risk4
Investment Risk5
Control of Corruption6 Gini8
Time for Paying
Taxes (in hours per
year)
Total Amount of Tax Payable (as a percentage of gross profits)
Costs of Entry (measured in %
per capita income)
(1) (2) (3) (4) (5) (6) (7) (8) (9)Uganda 4.1 3.0 33.5 9.0 2.8 237.0 42.9 117.8
Average 4.7 3.8 32.3 7.9 3.1 282.3 49.8 127.7
Average (excl. * countries) 2.9 3.3 32.2 7.9 3.1 319.2 48.9 138.5
Group 2: Sub-Saharan African Countries with Growth < 2.0%
Benin 1.5 5 n.a. n.a. 3.2 36 270 68.5 173.3Burundi -1.6 n.a. n.a. n.a. 2.3 42 140 286.7 222.4Central African -0.8 2 n.a. n.a. 2.1 61 504 209.5 209.3Comoros -0.1 7 n.a. n.a. 2.4 n.a. 100 47.5 192.3Congo, Dem. Rep.* -2.4 2 21.8 6.0 1.0 n.a. 312 235.4 481.1Congo, Republic* 0.2 n.a. 35.4 8.5 2.0 n.a. 576 57.3 214.8Côte d'Ivoire -0.6 n.a. 34.3 5.0 1.5 45 270 45.7 134.1Djibouti -1.3 3 n.a. n.a. 2.6 n.a. 114 41.7 222Eritrea -0.9 2 n.a. n.a. n.a. n.a. 216 86.3 115.9Gabon -0.4 2 36.6 9.0 1.0 n.a. 272 48.3 162.8Gambia, The 1.0 2 34.6 8.5 2.5 50 376 291.4 292.1Guinea-Bissau -2.4 2 26.0 7.5 2.0 47 208 47.5 261.2Kenya 0.2 6 33.0 9.5 1.0 43 432 74.2 46.3Madagascar 0.3 5 30.3 8.0 4.0 47 304 43.2 35Malawi 0.9 6 27.7 8.0 2.0 50 878 32.6 134.7Mauritania 1.9 3 n.a. n.a. 3.5 39 696 104.3 121.6Namibia 1.8 5 35.8 10.0 1.5 74 n.a. 25.6 18Niger 0.0 5 30.7 7.5 1.0 51 270 46 416.8Nigeria 1.8 5 28.6 6.5 1.3 44 n.a. 31.4 54.4Senegal 2.1 6 35.2 8.0 2.5 41 696 47.7 112.6Seychelles 0.9 n.a. n.a. n.a. 3.5 n.a. 76 48.8 9.1Sierra Leone* 2.1 5 25.5 8.0 2.0 n.a. 399 277 n.a.South Africa 1.8 7 36.3 2.0 1.0 58 350 38.3 6.9Swaziland 0.4 2 n.a. n.a. 2.5 61 104 39.5 41.1São Tomé & Prínc 0.8 n.a. n.a. n.a. 2.8 n.a. 424 55.2 147.2Togo 0.4 2 31.5 8.5 1.5 n.a. 270 48.3 252.7Zambia 1.8 5 24.0 7.0 3.0 42 131 22.2 29.9Zimbabwe -3.4 2 11.8 1.5 0.0 50 216 37 35.6
Average 0.22 4.0 29.9 7.2 2.1 49.0 330.9 87.0 153.5
Average (excl. * countries) 0.24 4.0 30.4 7.1 2.1 49.0 318.1 74.7 137.9Sustained Growth Countries (SGs)
4.9 2.2 31.7 7.1 3.4 39.5 348 44 25
Developing world 283.7 55.2 77.6Sources: WDI (November 2006 download), ICRG, Polity IV, and World Bank Doing Business websites.
1/ Data are for the most recent 10 year period available, except for the sustained growth countries (SGs). Asterisk denote countries with strong initial institutions orthose recovering from conflict or experiencing a commodity boom.2/ The data from WDI. For SGs, data refer to the average for the period T to L, where T refers to the start of the growth episode and L the latest year (2005).3/ Score ranges from 1 to 7. The higher the score the more the constraints on the executive. The data refer to year 2004 for SSA countries, and to the period T for SGs.4/ Score for economic risk ranges from 1 to 50. The higher the score the lower the risk. For SGs data refer to 1984, and for SSA economic risk to 2002.5/ Score investment risk ranges from 1 to 12. For SGs data refer to 1996, and for SSA to 2006.6/ Score ranges from 1 to 6. The higher the score the less the corruption. For SGs data refer to 1996, and for SSA to 2004 or 2005.7/ The data are from the World Bank Doing Business websites: "http://www.doingbusiness.org/ExploreTopics/PayingTaxes/". Data for all the countries including SGs are for the most recent period based on the survey of January 2006.8/ For SGs, data refer to T or to the year closest to T for which data are available (see table 8c).
Economic Institutions. Costs of Doing Business7
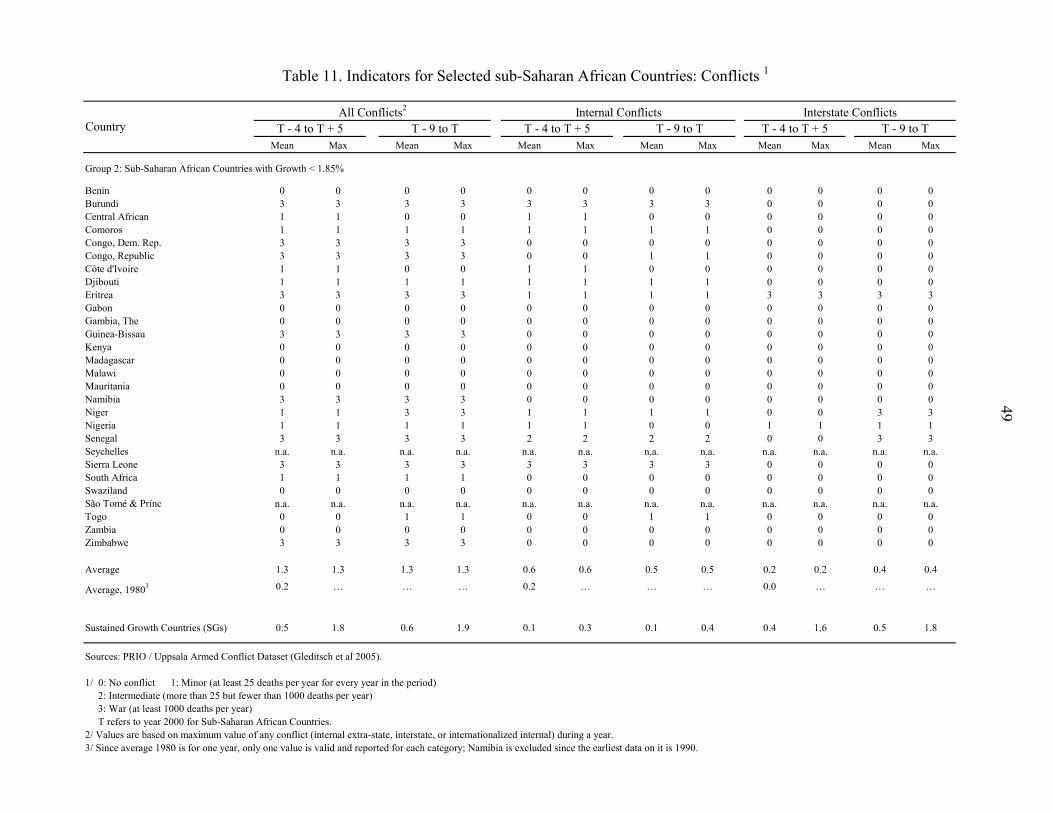
49
Table 11. Indicators for Selected sub-Saharan African Countries: Conflicts 1
Mean Max Mean Max Mean Max Mean Max Mean Max Mean Max
Group 2: Sub-Saharan African Countries with Growth < 1.85%
Benin 0 0 0 0 0 0 0 0 0 0 0 0Burundi 3 3 3 3 3 3 3 3 0 0 0 0Central African 1 1 0 0 1 1 0 0 0 0 0 0Comoros 1 1 1 1 1 1 1 1 0 0 0 0Congo, Dem. Rep. 3 3 3 3 0 0 0 0 0 0 0 0Congo, Republic 3 3 3 3 0 0 1 1 0 0 0 0Côte d'Ivoire 1 1 0 0 1 1 0 0 0 0 0 0Djibouti 1 1 1 1 1 1 1 1 0 0 0 0Eritrea 3 3 3 3 1 1 1 1 3 3 3 3Gabon 0 0 0 0 0 0 0 0 0 0 0 0Gambia, The 0 0 0 0 0 0 0 0 0 0 0 0Guinea-Bissau 3 3 3 3 0 0 0 0 0 0 0 0Kenya 0 0 0 0 0 0 0 0 0 0 0 0Madagascar 0 0 0 0 0 0 0 0 0 0 0 0Malawi 0 0 0 0 0 0 0 0 0 0 0 0Mauritania 0 0 0 0 0 0 0 0 0 0 0 0Namibia 3 3 3 3 0 0 0 0 0 0 0 0Niger 1 1 3 3 1 1 1 1 0 0 3 3Nigeria 1 1 1 1 1 1 0 0 1 1 1 1Senegal 3 3 3 3 2 2 2 2 0 0 3 3Seychelles n.a. n.a. n.a. n.a. n.a. n.a. n.a. n.a. n.a. n.a. n.a. n.a.Sierra Leone 3 3 3 3 3 3 3 3 0 0 0 0South Africa 1 1 1 1 0 0 0 0 0 0 0 0Swaziland 0 0 0 0 0 0 0 0 0 0 0 0São Tomé & Prínc n.a. n.a. n.a. n.a. n.a. n.a. n.a. n.a. n.a. n.a. n.a. n.a.Togo 0 0 1 1 0 0 1 1 0 0 0 0Zambia 0 0 0 0 0 0 0 0 0 0 0 0Zimbabwe 3 3 3 3 0 0 0 0 0 0 0 0
Average 1.3 1.3 1.3 1.3 0.6 0.6 0.5 0.5 0.2 0.2 0.4 0.4
Average, 19803 0.2 … … … 0.2 … … … 0.0 … … …
Sustained Growth Countries (SGs) 0.5 1.8 0.6 1.9 0.1 0.3 0.1 0.4 0.4 1.6 0.5 1.8
Sources: PRIO / Uppsala Armed Conflict Dataset (Gleditsch et al 2005).
1/ 0: No conflict 1: Minor (at least 25 deaths per year for every year in the period) 2: Intermediate (more than 25 but fewer than 1000 deaths per year) 3: War (at least 1000 deaths per year) T refers to year 2000 for Sub-Saharan African Countries. 2/ Values are based on maximum value of any conflict (internal extra-state, interstate, or internationalized internal) during a year.3/ Since average 1980 is for one year, only one value is valid and reported for each category; Namibia is excluded since the earliest data on it is 1990.
T - 4 to T + 5 T - 9 to T T - 9 to TInterstate Conflicts
T - 4 to T + 5 T - 9 to T T - 4 to T + 5CountryAll Conflicts2 Internal Conflicts

50
Table 12. Indicators for Selected sub-Saharan African Countries: Social Fractionalization
country
Ethnic based on Easterly and
Levine (1997)
Ethnic based on Fearon
(2003)Religious based on
Fearon (2003)Ethnic based on
Alesina et al.(2003)Linguistic based on Alesina et al. (2003)
Religious based on Alesina et al. (2003)
Group 2: Sub-Saharan African Countries with Growth < 2.0%Benin 0.62 0.62 0.47 0.79 0.79 0.55Burundi 0.04 0.33 0.55 0.30 0.30 0.52Central African 0.69 0.79 0.78 0.83 0.83 0.79Comoros n.a. n.a. n.a. 0.00 0.01 0.01Congo, Dem. Rep.* 0.90 0.93 0.68 0.87 0.87 0.70Congo, Republic* 0.66 0.88 0.52 0.87 0.69 0.66Côte d'Ivoire 0.86 0.78 0.56 0.82 0.78 0.76Djibouti 0.69 0.61 0.11 0.80 0.66 0.04Eritrea 0.59 0.65 0.58 0.65 0.65 0.43Gabon 0.69 0.86 0.46 0.77 0.78 0.67Gambia, The 0.73 0.76 0.18 0.79 0.81 0.10Guinea-Bissau 0.80 0.82 0.55 0.81 0.81 0.61Kenya 0.83 0.85 0.70 0.86 0.89 0.78Madagascar 0.06 0.86 0.56 0.88 0.02 0.52Malawi 0.62 0.83 0.62 0.67 0.60 0.82Mauritania 0.34 0.62 0.00 0.62 0.33 0.01Namibia 0.68 0.72 0.26 0.63 0.70 0.66Niger 0.73 0.64 0.32 0.65 0.65 0.20Nigeria 0.87 0.80 0.58 0.85 0.85 0.74Senegal 0.72 0.73 0.15 0.69 0.70 0.15Seychelles n.a. n.a. n.a. 0.20 0.16 0.23Sierra Leone* 0.77 0.76 0.54 0.82 0.76 0.54South Africa 0.88 0.88 0.46 0.75 0.87 0.86Swaziland 0.39 0.28 0.48 0.06 0.17 0.44São Tomé & Prínc n.a. n.a. n.a. n.a. 0.23 0.19Togo 0.71 0.88 0.46 0.71 0.90 0.66Zambia 0.82 0.73 0.46 0.78 0.87 0.74Zimbabwe 0.54 0.37 0.51 0.39 0.45 0.74
Average 0.65 0.72 0.46 0.66 0.61 0.50
Sources: Easterly and Levine (2003); Fearon (2003), and Alesina et. al. (2003)
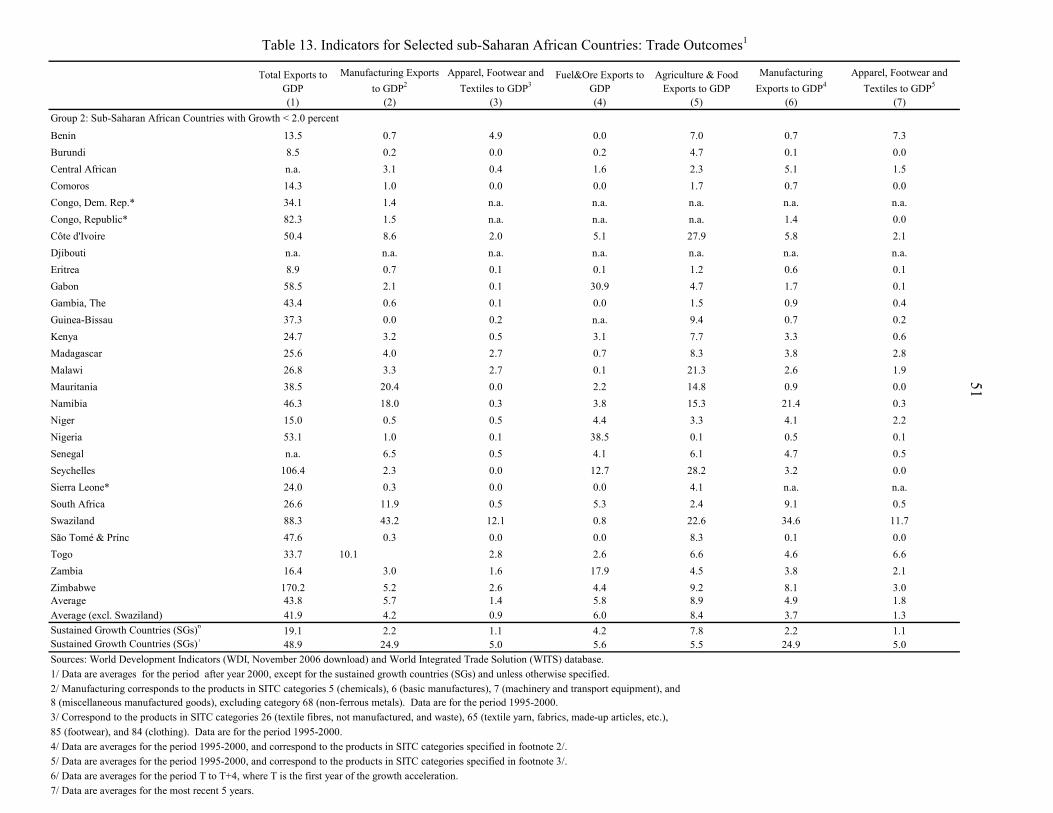
51
Table 13. Indicators for Selected sub-Saharan African Countries: Trade Outcomes1
Total Exports to GDP
Manufacturing Exports to GDP2
Apparel, Footwear and Textiles to GDP3
Fuel&Ore Exports to GDP
Agriculture & Food Exports to GDP
Manufacturing Exports to GDP4
Apparel, Footwear and Textiles to GDP5
(1) (2) (3) (4) (5) (6) (7)Group 2: Sub-Saharan African Countries with Growth < 2.0 percent
Benin 13.5 0.7 4.9 0.0 7.0 0.7 7.3Burundi 8.5 0.2 0.0 0.2 4.7 0.1 0.0Central African n.a. 3.1 0.4 1.6 2.3 5.1 1.5Comoros 14.3 1.0 0.0 0.0 1.7 0.7 0.0Congo, Dem. Rep.* 34.1 1.4 n.a. n.a. n.a. n.a. n.a.Congo, Republic* 82.3 1.5 n.a. n.a. n.a. 1.4 0.0Côte d'Ivoire 50.4 8.6 2.0 5.1 27.9 5.8 2.1Djibouti n.a. n.a. n.a. n.a. n.a. n.a. n.a.Eritrea 8.9 0.7 0.1 0.1 1.2 0.6 0.1Gabon 58.5 2.1 0.1 30.9 4.7 1.7 0.1Gambia, The 43.4 0.6 0.1 0.0 1.5 0.9 0.4Guinea-Bissau 37.3 0.0 0.2 n.a. 9.4 0.7 0.2Kenya 24.7 3.2 0.5 3.1 7.7 3.3 0.6Madagascar 25.6 4.0 2.7 0.7 8.3 3.8 2.8Malawi 26.8 3.3 2.7 0.1 21.3 2.6 1.9Mauritania 38.5 20.4 0.0 2.2 14.8 0.9 0.0Namibia 46.3 18.0 0.3 3.8 15.3 21.4 0.3Niger 15.0 0.5 0.5 4.4 3.3 4.1 2.2Nigeria 53.1 1.0 0.1 38.5 0.1 0.5 0.1Senegal n.a. 6.5 0.5 4.1 6.1 4.7 0.5Seychelles 106.4 2.3 0.0 12.7 28.2 3.2 0.0Sierra Leone* 24.0 0.3 0.0 0.0 4.1 n.a. n.a.South Africa 26.6 11.9 0.5 5.3 2.4 9.1 0.5Swaziland 88.3 43.2 12.1 0.8 22.6 34.6 11.7São Tomé & Prínc 47.6 0.3 0.0 0.0 8.3 0.1 0.0Togo 33.7 10.1 2.8 2.6 6.6 4.6 6.6Zambia 16.4 3.0 1.6 17.9 4.5 3.8 2.1Zimbabwe 170.2 5.2 2.6 4.4 9.2 8.1 3.0Average 43.8 5.7 1.4 5.8 8.9 4.9 1.8Average (excl. Swaziland) 41.9 4.2 0.9 6.0 8.4 3.7 1.3Sustained Growth Countries (SGs)6 19.1 2.2 1.1 4.2 7.8 2.2 1.1Sustained Growth Countries (SGs)7 48.9 24.9 5.0 5.6 5.5 24.9 5.0Sources: World Development Indicators (WDI, November 2006 download) and World Integrated Trade Solution (WITS) database.1/ Data are averages for the period after year 2000, except for the sustained growth countries (SGs) and unless otherwise specified.2/ Manufacturing corresponds to the products in SITC categories 5 (chemicals), 6 (basic manufactures), 7 (machinery and transport equipment), and8 (miscellaneous manufactured goods), excluding category 68 (non-ferrous metals). Data are for the period 1995-2000.3/ Correspond to the products in SITC categories 26 (textile fibres, not manufactured, and waste), 65 (textile yarn, fabrics, made-up articles, etc.), 85 (footwear), and 84 (clothing). Data are for the period 1995-2000.4/ Data are averages for the period 1995-2000, and correspond to the products in SITC categories specified in footnote 2/.5/ Data are averages for the period 1995-2000, and correspond to the products in SITC categories specified in footnote 3/.6/ Data are averages for the period T to T+4, where T is the first year of the growth acceleration.7/ Data are averages for the most recent 5 years.

Table 14. Indicators for Selected sub-Saharan African Countries: Macroeconomic and Trade Policies and Outcomes1
Average Currency Overvaluation2
Largest Consecutive Spell of
Overvaluation in Years Since 1970 Years of Spell
Average Overvaluation during Largest
Spell Inflation3Trade Restrictiveness (Sachs-
Warner-Welch-Wacziarg)4 Aid to GDP5
(1) (2) (3) (4) (5) (6) (7)Group 2: Sub-Saharan African Countries with Growth < 2.0%
Benin 29.2 15.0 1986 to 2000 30.3 5.4 1.0 9.5Burundi 4.1 8.0 1980 to 1987 18.3 13.5 1.0 53.0Central African 30.9 12.0 1987 to 1998 19.9 2.9 0.0 7.7Comoros -15.7 . … 0.0 n.a. 0.0 6.8Congo, Dem. Rep. 72.9 28.0 1970 to 1997 83.4 21.3 0.0 27.7Congo, Republic 49.3 31.0 1970 to 2000 53.5 1.3 0.0 2.8Côte d'Ivoire 18.1 15.0 1986 to 2000 20.8 3.9 1.0 1.0Djibouti 12.5 1.0 1996 12.5 n.a. 0.0 9.7Eritrea 4.3 1.0 1996 4.3 n.a. 0.0 28.0Gabon -0.7 9.0 1985 to 1993 17.2 0.1 0.0 0.5Gambia, The 20.7 9.0 1992 to 2000 20.3 3.2 1.0 15.8Guinea-Bissau 30.5 31.0 1970 to 2000 42.9 n.a. 1.0 28.1Kenya 9.4 21.0 1970 to 1990 16.9 10.3 1.0 4.0Madagascar 38.9 15.0 1973 to 1987 18.7 18.5 1.0 27.3Malawi 20.2 24.0 1977 to 2000 20.0 15.4 0.0 25.3Mauritania 19.4 19.0 1981 to 1999 26.0 12.1 1.0 12.0Namibia 12.0 11.0 1970 to 1980 52.8 2.3 0.0 3.2Niger 8.5 16.0 1984 to 1999 16.1 7.8 1.0 17.4Nigeria 125.6 31.0 1970 to 2000 94.1 13.5 0.0 0.8Senegal 17.0 16.0 1985 to 2000 30.0 1.7 0.0 14.5Seychelles 14.0 12.0 1986 to 1997 23.4 n.a. 0.0 1.4Sierra Leone -8.8 9.0 1977 to 1985 18.7 12.1 0.0 32.7South Africa -14.7 n.a. 1994 to 1995 0.0 3.4 1.0 0.3Swaziland -47.2 n.a. … 1.3 n.a. 0.0 4.8São Tomé & Prínc -4.8 4.0 1986 to 1989 24.4 n.a. 0.0 57.9Togo 45.0 14.0 1987 to 2000 30.1 6.8 0.0 2.9Zambia 64.6 16.0 1970 to 1985 33.3 18.3 1.0 20.4Zimbabwe -46.0 14.0 1970 to 1983 15.0 n.a. 0.0 4.0
Average 18.2 15.3 … 26.6 8.7 0.4 15.0
Average, 19806 … … … … 16.6 … …
Sustained Growth Countries (SGs)
-17.7 6.4 … 11.4 14.6 0.4 4.7
Developing world … … … … … 0.5 …
Sources: Various
1/ Data are for the most recent period available after 2000, except for the sustained growth countries (SGs).2/ For Sub-saharan Africa, data refer to the average for the last 5 years for which data were available, except for Djibouti, Eritrea and Sudan for which they refer to 1996. For the SGs, data corresponds to the average for the period T to L, where T is the start of the growth episode and L the latest year for which data were available. The computation of overvaluation is described in the text.3/ For SGs, data are averages for the period T to T+4, where T is the first year of the growth acceleration.4/ The score ranges from 0 to 1, with higher values denoting more open regimes. For SGs, data refer to the year T. 5/ For SGs, data are averages for the period T-4 to T+5, where T is the first year of the growth acceleration.6/ For inflation, Benin and Namibia are excluded since the earliest data on them are 1991; year 1981 data are used for Certral Afr. Republic, and Malawi.

Table 15. Indicators for Selected sub-Saharan African Countries: Costs of Trading1
No. of Documents Required to Export (in
units)
No. of Signatures Needed to Export (in
units)
Time for Export Procedures (in calendar days)
No. of Documents Required to Import (in
units)
No. of Signatures Needed to Import (in
units)
Time for Import Procedures (in calendar days)
(1) (2) (3) (4) (5) (6)Group 2: Sub-Saharan African Countries with Growth < 2.0%
Benin 8 10 35 11 14 48Burundi 12 29 80 14 55 124Central African 9 38 63 19 75 60Comoros 9 n.a. 28 8 n.a. 22Congo, Dem. Rep. 8 45 64 12 80 92Congo, Republic 12 42 50 15 51 62Côte d'Ivoire 9 11 21 19 21 48Djibouti 15 n.a. 25 14 n.a. 26Eritrea 11 2 69 18 5 69Gabon 4 n.a. 19 10 n.a. 26Gambia, The 4 n.a. 19 8 n.a. 23Guinea-Bissau 8 n.a. 27 9 n.a. 26Kenya 11 15 25 9 20 45Madagascar 8 15 48 11 18 48Malawi 8 12 44 16 20 60Mauritania 9 13 25 7 25 40Namibia 9 7 32 14 7 25Niger n.a. n.a. n.a. 19 52 89Nigeria 11 39 25 13 71 45Senegal 6 8 22 10 12 26Seychelles 6 n.a. 17 7 n.a. 19Sierra Leone 7 8 29 7 22 33South Africa 5 7 31 9 9 34Swaziland 9 n.a. 9 14 n.a. 35São Tomé & Prínc 8 n.a. 27 10 n.a. 29Togo 7 8 32 9 14 41Zambia 16 25 60 19 28 62Zimbabwe 9 18 52 15 19 66
Average 8.8 18.5 36.2 12.4 30.9 47.3Sustained Growth Countries (SGs) 6.6 6.5 19.1 9.4 8.0 21.3Developing world 7.5 12.6 29.4 10.6 19.1 36.6Source: The World Bank Doing Business websites: "http://www.doingbusiness.org/ExploreTopics/TradingAcrossBorders/".
1/ Data are for the most recent period based on the survey of January 2006, except (2) and (5), which are based on a survey of January 2005.
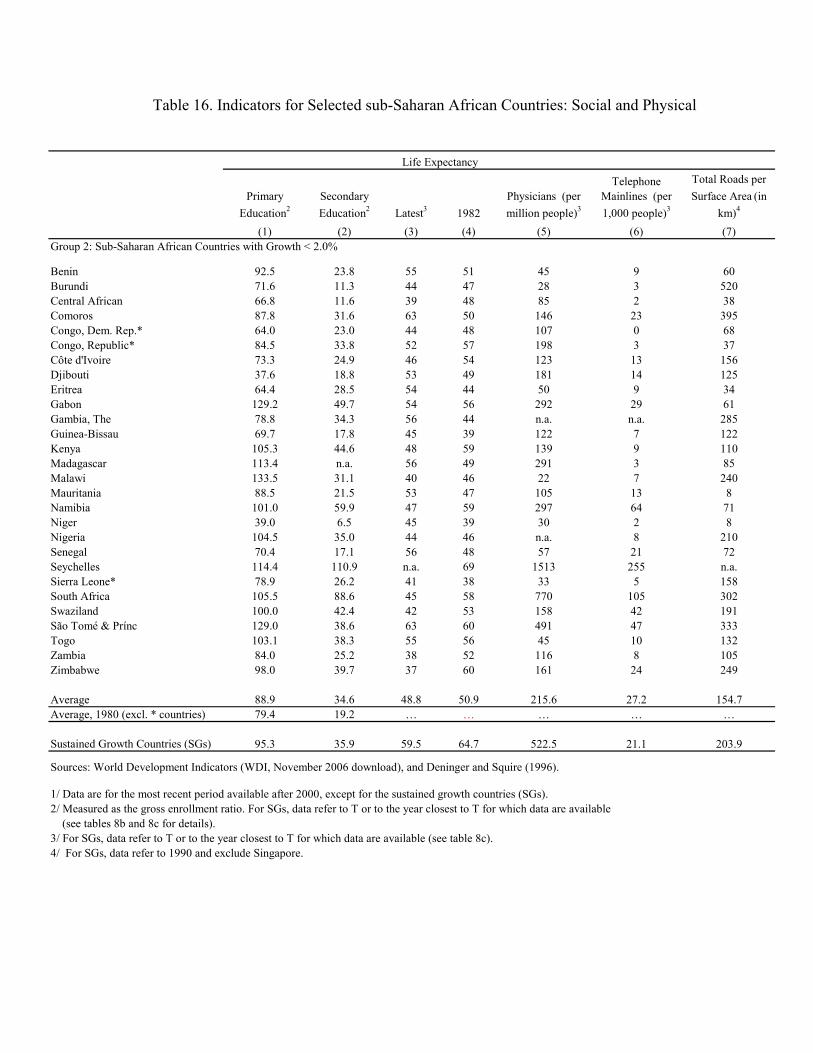
Table 16. Indicators for Selected sub-Saharan African Countries: Social and Physical
Primary Education2
Secondary Education2 Latest3 1982
Physicians (per million people)3
Telephone Mainlines (per 1,000 people)3
Total Roads per Surface Area (in
km)4
(1) (2) (3) (4) (5) (6) (7)Group 2: Sub-Saharan African Countries with Growth < 2.0%
Benin 92.5 23.8 55 51 45 9 60Burundi 71.6 11.3 44 47 28 3 520Central African 66.8 11.6 39 48 85 2 38Comoros 87.8 31.6 63 50 146 23 395Congo, Dem. Rep.* 64.0 23.0 44 48 107 0 68Congo, Republic* 84.5 33.8 52 57 198 3 37Côte d'Ivoire 73.3 24.9 46 54 123 13 156Djibouti 37.6 18.8 53 49 181 14 125Eritrea 64.4 28.5 54 44 50 9 34Gabon 129.2 49.7 54 56 292 29 61Gambia, The 78.8 34.3 56 44 n.a. n.a. 285Guinea-Bissau 69.7 17.8 45 39 122 7 122Kenya 105.3 44.6 48 59 139 9 110Madagascar 113.4 n.a. 56 49 291 3 85Malawi 133.5 31.1 40 46 22 7 240Mauritania 88.5 21.5 53 47 105 13 8Namibia 101.0 59.9 47 59 297 64 71Niger 39.0 6.5 45 39 30 2 8Nigeria 104.5 35.0 44 46 n.a. 8 210Senegal 70.4 17.1 56 48 57 21 72Seychelles 114.4 110.9 n.a. 69 1513 255 n.a.Sierra Leone* 78.9 26.2 41 38 33 5 158South Africa 105.5 88.6 45 58 770 105 302Swaziland 100.0 42.4 42 53 158 42 191São Tomé & Prínc 129.0 38.6 63 60 491 47 333Togo 103.1 38.3 55 56 45 10 132Zambia 84.0 25.2 38 52 116 8 105Zimbabwe 98.0 39.7 37 60 161 24 249
Average 88.9 34.6 48.8 50.9 215.6 27.2 154.7Average, 1980 (excl. * countries) 79.4 19.2 … … … … …
Sustained Growth Countries (SGs) 95.3 35.9 59.5 64.7 522.5 21.1 203.9
Sources: World Development Indicators (WDI, November 2006 download), and Deninger and Squire (1996).
1/ Data are for the most recent period available after 2000, except for the sustained growth countries (SGs). 2/ Measured as the gross enrollment ratio. For SGs, data refer to T or to the year closest to T for which data are available (see tables 8b and 8c for details).3/ For SGs, data refer to T or to the year closest to T for which data are available (see table 8c).4/ For SGs, data refer to 1990 and exclude Singapore.
Life Expectancy

References Acemoglu, Daron, and Simon Johnson, 2006, “Disease and Development: The Effect of Life
Expectancy on Economic Growth,” NBER Working Paper No. 12269 (Cambridge, Massachusetts: National Bureau of Economic Research).
———, and James A. Robinson, 2001, “The Colonial Origins of Comparative Development: An Empirical Investigation,” American Economic Review, Vol. 91 (December), pp. 1369–1401.
———, 2005a, “Institutions as the Fundamental Cause of Long-Run Growth,” Chapter 6 in Handbook of Economic Growth, Volume 1, Part A, edited by Philippe Aghion and Steven Durlauf, pp. 385–472. Also available as NBER Working Paper No. 10481 (Cambridge, Massachusetts: National Bureau of Economic Research).
———, 2005b, “The Rise of Europe: Atlantic Trade, Institutional Change, and Economic Growth,” American Economic Review, Vol. 95 (June), pp. 546–79.
———, and Yunyong Thaicharoen 2003, “Institutional Causes, Macroeconomic Symptoms: Volatility, Crises and Growth,” Journal of Monetary Economics, Vol. 50 (January), pp. 49–123.
Adelman, Irma, and Cynthia Taft Morris, 1971, Society, Politics, and Economic Development: A Quantitative Approach (Baltimore, Maryland: Johns Hopkins Press).
Alesina, Alberto, Arnaud Devleeschauwer, William Easterly, Sergio Kurlat, and Romain Wacziarg, 2003, “Fractionalization,” Journal of Economic Growth, Vol. 8 (No. 2), pp. 155-94.
Bates, Robert H., 1981, Markets and States in Tropical Africa (Berkeley, California:
University of California Press).
Berg, Andy, Jonathan D. Ostry, and Jeromin Zettelmeyer, 2006, “What Makes Growth Sustained?” (unpublished; Washington: International Monetary Fund).
Bio-Tchané, Abdoulaye, and Benedicte Vibe Christensen, 2006, “Right Time for Africa,” Finance and Development (December), pp. 8–13.
Chang, Ha-Joon 2005, Kicking Away the Ladder: Development Strategy in Historical Perspective (London: Anthem Press).
Collier, Paul, and Steve O’Connell, 2006, “Opportunities, Choices, and Syndromes,” in Explaining African Economic Growth (forthcoming; African Economic Research Consortium).
Easterly, William, and Ross Levine, 1997, “Africa’s Growth Tragedy: Policies and Ethnic Divisions,” Quarterly Journal of Economics, Vol. 112 (November), pp. 1203–50.

Fearon, James D., 2003, “Ethnic and Cultural Diversity by Country,” Journal of Economic Growth, Vol. 8 (No. 2), pp. 195–222.
Frankel, Jeffrey, 2004, "On the Renminbi: The Choice Between Adjustment Under a Fixed Exchange Rate and Adjustment Under a Flexible Rate," written for a High-Level Seminar on Foreign Exchange System, Dalian, China, May 2004.
Freeman, Richard B., and David L. Lindauer, 1999, “Why Not Africa?” NBER Working Paper No. 6942 (Cambridge, Massachusetts: National Bureau of Economic Research).
Gleditsch, Nils Petter, Peter Wallensteen, Mikael Eriksson, Margareta Sollenberg, and Håvard Strand, 2002, “Armed Conflict 1946–2001: A New Dataset,” Journal of Peace Research, Vol. 39 (September), pp. 615–37.
Hausmann, Ricardo, Lant Pritchett, and Dani Rodrik, 2004, “Growth Accelerations,” NBER Working Paper No. 11566 (Cambridge, Massachusetts: National Bureau of Economic Research).
Hernández-Catá, Ernesto, Stanley Fischer, and Mohsin S. Khan, 1998, “Africa—Is This the Turning Point?” IMF Papers on Policy Analysis and Assessment No. 98/6 (Washington: International Monetary Fund).
International Monetary Fund, 2003, World Economic Outlook, (Washington: IMF, April 2003).
———, 2005, World Economic Outlook (Washington: IMF, September 2005).
——— and the World Bank, 2006, “Review of Low-Income Country Debt Sustainability Framework and Implications of the MDRI” (Washington: IMF and World Bank).
Jerzmanowski, Michal, 2006, “Empirics of Hills, Plateaus, Mountains and Plains: A Markov-Switching Approach to Growth,” Journal of Development Economics, Vol. 81 (December).
Johnson, Simon, Jonathan D. Ostry, and Arvind Subramanian, 2006, “Levers for Growth: Policy Lessons from Earlier Bouts of Growth in Developing Countries,” Finance and Development, Vol. 43 (March).
Jones, Benjamin F., and Benjamin A. Olken, 2005a, “Do Leaders Matter? National Leadership and Growth Since World War II,” Quarterly Journal of Economics, Vol. 120 (August), pp. 835–64.
———, 2005b, “The Anatomy of Start-Stop Growth,” NBER Working Paper No. 1152 (Cambridge, Massachusetts: National Bureau of Economic Research).

Marshall, Monty G., Keith Jaggers, and Ted Robert Gurr, 2006, “Polity IV Project, Political Regime Characteristics and Transitions, 1800–2004,” (Maryland: Center for International Development and Conflict Management, University of Maryland, College Park).
Mattoo, Aaditya, Devesh Roy and Arvind Subramanian, 2003, “The Africa Growth and Opportunity Act and Its Rules of Origin: Generosity Undermined?” The World Economy, Vol. 26, No. 6.
Prasad, Eswar, Raghuram Rajan, and Arvind Subramanian, 2006, “Foreign Capital and Economic Development,” paper presented at the Kansas Federal Reserve Conference at Jackson Hole, Wyoming.
Rajan, Raghuram, and Arvind Subramanian, 2005, “What Undermines Aid’s Impact on Growth?” NBER Working Paper No. 11657 (Cambridge, Massachusetts: National Bureau of Economic Research).
Rajan, Raghuram, 2006, “The Persistence of Underdevelopment: Constituencies and Competitive Rent Preservation” (unpublished; Washington: International Monetary Fund).
Rodrik, Dani, 1999, “Where Did All the Growth Go? External Shocks, Social Conflict, and Growth Collapses,” Journal of Economic Growth, Vol. 4 (December), pp. 385–412.
——— and Arvind Subramanian, 2004, “From “Hindu Growth” to Productivity Surge: The Mystery of the Indian Growth Transition,” IMF Working Paper No. 04/77 (Washington: International Monetary Fund).
——— and Francesco Trebbi, 2004, “Institutions Rule: The Primacy of Institutions over Geography and Integration in Economic Development,” Journal of Economic Growth, Vol. 9 (June), pp. 131–65.
Ross, Michael L., 2001, "Does Oil Hinder Democracy?" World Politics, Vol. 53, No. 3, pp. 325–61.
Satyanath, Shankar and Arvind Subramanian, 2007, “The Real Origins of Nominal Pathologies,” forthcoming: IMF Staff Papers, (Washington: International Monetary Fund).
Timmermann, Allan, 2006, “An Evaluation of the World Economic Outlook Forecasts,” IMF
Working Paper 06/59 (Washington: International Monetary Fund).
World Bank, 1993, “The East Asian Miracle: Economic Growth and Public Policy,” (Washington: World Bank).
World Bank, 2000, “Can Africa Claim the 21st Century?” (Washington: World Bank).