the quantum mechanics of alpha decay - mitweb.mit.edu/8.13/www/jlexperiments/jlexp45.pdf · the...
TRANSCRIPT
The Quantum Mechanics of Alpha Decay
MIT Department of Physics(Dated: February 6, 2012)
The purpose of this experiment is to explore the relation between the mean lives of alpha-activenuclides and the energies of the alpha particles they emit. You will study portions of the sequencesof radioactive transformations whereby uranium is transmuted into lead. Various procedures willbe used to measure the alpha-particle energies and lifetimes of five alpha-active nuclides with meanlives ranging from days to microseconds, as well as the mean lives of two beta-active nuclides.
I. PREPARATORY QUESTIONS
1. With the help of Figures 9, 10, and 11, in Ap-pendix D and the associated reference [1], constructcharts of the decay chains that start with the natu-rally occurring isotopes of uranium, U, and tho-rium, Th, terminating with a stable isotopes oflead. For each nuclide, place a box in a coordinatesystem with atomic number and element name onthe x-axis and mass number (total number of nucle-ons) on the y-axis. In each box write the half life,decay mode(s) and energies, and branching proba-bilities. Be careful when looking up the decay en-ergy – most sites list the total energy of the decayrather than just the energy of the alpha particle.For example, the energy of the alpha particle emit-ted in the decay of Po212 is 8.78 MeV, not 8.95MeV. These energies can be found in reference [2].
2. The Geiger-Nuttall Relationship. Create a log-logplot of the expected relation between the mean livesof alpha-active nuclides and the energies of the al-pha particles they emit.
3. In section IV, we analytically solve the coupled dif-ferential equations for a two-nuclide decay chain,and examine some special limiting cases. However,in the case of our experiment with decay chainsconsisting of dozens of nuclides, this approach be-comes impractical. Today, it is much more prudentto produce a MATLAB implementation of a Bate-man equation solver.
In the liquid scintillator experiment, we employ arelatively pure source of Rn222 to measure the half-life of Rn222 and Po218. Using the bate.m scriptdescribed in Appendix C, the example implemen-tation, and your answer to prepatory question 1,write a script that shows the activity of all the nu-clides following Rn222 all the way to Pb206. Youshould be able to figure out how much Rn222 thereis from the information on the activity of the sourcein section VII.1. Make necessary approximationsfor multiple branchings. Plot your results, explainthem, and place them in your notebook.
4. Why are there no natural nuclides with Z > 83 andA = 4n+ 1?
5. Consider two counters, #1 and #2, each producingrandom, uncorrelated pulses at average rates of r1and r2, respectively, where r1 � r2. What is therate at which a pulse from #1 is succeeded by apulse from #2 within the time interval from t tot+ dt? What is the mean value of such time inter-vals (of false coincidences)? (In a measurement ofthe mean life of a nuclide by the method of delayedcoincidences, you will have to take care that yourdata are not swamped by events produced by ran-dom and uncorrelated events in the two detectors.)
6. Explain how a silicon barrier solid state detectorworks. (see Reference[3]).
II. INTRODUCTION
The first Nobel Prize in physics was awarded in 1901 toWilhelm Rontgen for his discovery on November 8, 1895that a penetrating radiation (X-rays) is emitted by thefluorescing glass of a cathode-ray tube under bombard-ment by cathode rays inside the tube. (Frederick Smithat Oxford missed that discovery: When he earlier noticedthat films left near a cathode ray tube were darkened, hetold his assistant to move the films away.) Antoine Bec-querel heard Rontgen’s report on January 20, 1896 atthe Academie des Sciences. He immediately set about toinvestigate whether other fluorescent materials emittedpenetrating radiations. After ten days without successhe read about the fluorescent properties of uranium salts.On January 30 he sprinkled some uranyl potassium sul-fate on top of a photographic plate wrapped in light-tightpaper, exposed the salt to sunlight for a few hours, de-veloped the plate, and found it darkened. He preparedto repeat the experiment on February 26 and 27, but theweather was cloudy, so he put the plate and salt awayin a drawer to wait for a sunny day. On March 1 hedeveloped the plate, “expecting to find the images veryfeeble. On the contrary, the silhouettes appeared withgreat intensity. I thought at once that the action mightbe able to go on in the dark.” Thus Becquerel discoveredthe phenomena that was later dubbed radioactivity byMarie Curie.
Marie Sklowdowska came from Warsaw to Paris tostudy at the Sorbonne in 1891. A few years later shebegan her studies of radioactivity in collaboration withher husband, Pierre Curie. By 1898 she had discov-
Id: 45.alphadecay.tex,v 1.151 2012/02/06 14:33:51 rfoote Exp

Id: 45.alphadecay.tex,v 1.151 2012/02/06 14:33:51 rfoote Exp 2
ered the radioactivity of thorium and had isolated (fromresidues of uranium refinement) a new element, radium,and showed that its activity per gram was a million timesgreater than that of uranium.
Ernest Rutherford, a young New Zealander workingat the Cavendish Laboratory of Cambridge University,showed that the radiation emitted by uranium is of twotypes distinguished by their penetrating power. In a pub-lication, completed in 1899 after he had moved to McGillUniversity in Montreal, Rutherford called the easily ab-sorbed radiation “alpha rays” and the more penetrat-ing radiation “beta rays”. Becquerel discovered that thebeta rays are deflected by electric and magnetic fieldslike charged particles with the same value of e/m as therecently discovered electrons. Then Rutherford demon-strated that alpha particles are doubly charged ions ofhelium, whose spectrum had been discovered first in thesun only a few years previously, and then in the gasesemitted by uranium ores. Shortly thereafter, Paul Vil-lard in France identified a third type of radiation he called“gamma”, which turned out to be high energy electro-magnetic radiation.
In 1900 Rutherford and Frederick Soddy found thatthorium emits a short-lived radioactive gaseous element(an isotope of radon, Rn228, called thoron) that is chem-ically inert, like argon. From measurements of its ra-dioactivity they drew the epochal conclusion that thorondecays into other radioactive elements — the discovery ofthe transmutation of elements. A year later Marie Curiediscovered a similar gaseous element Rn226 emitted by ra-dium. In a series of papers on radioactivity Rutherfordand Soddy unraveled most of the complex relations be-tween the decay products of uranium and thorium. Theydiscovered the exponential law of radioactive decay
N(t) = N0e−t/τ (1)
in which the “mean life” τ of the substance is a funda-mental characteristic that is unaffected by heat, chemicalcombination, or any other condition that affects the elec-tronic structure of the atom (except the absence of Kelectrons in the case of beta decay by electron capture).Also in 1903, Soddy published a calculation of the energyreleased by the decay of radium and wrote that it is “atleast twenty-thousand times, and may be a million times,as great as the energy of any molecular change.” Fouryears later Albert Einstein, in his discovery of the theoryof relativity, deduced the equivalence of mass and energyexpressed in his equation E = mc2 and suggested thatthe energy released in radioactivity was converted mass.
Rutherford dominated experimental nuclear physicsfor the next thirty years. His greatest discovery wasthe nucleus itself which he perceived in the results ofthe alpha-particle scattering experiments he initiated atManchester University in 1910. A fascinating account ofthis era has been written by Richard Rhodes [1986] inThe Making of the Atomic Bomb from which the abovehistory is taken [4].
III. RADIOACTIVITY
Most of the natural elements with atomic numbersfrom 1 (hydrogen) to 82 (lead) are stable. The few excep-tions include the isotope of potassium, K40, which consti-tutes 0.01% of natural potassium and suffers beta decaywith a mean life of 1.9 billion years. All the isotopes ofthe elements with Z > 82, with the possible exception ofBi209, are unstable and decay with half lives ranging frommicroseconds to billions of years. So where, when, andhow did the natural radioactive elements arise? Sincethe 1950s, and particularly from the work of WilliamFowler of Caltech and his collaborators, it has becomeclear that all the elements with Z > 26 (iron) are builtup suddenly from lighter elements by absorption of neu-trons in the neutron-rich region of a supernova during thefirst ∼1 sec of the explosion, the so-called rapid process(r-process). Supernovas occur in our galaxy at a rate ofabout 2 or 3 per century. One of these probably trig-gered the formation of the solar system and enriched itsraw material with freshly synthesized heavy elements ofwhich all with Z > 82 have been decaying ever since.
Light nuclei with equal numbers of protons and neu-trons (e.g., He4, C12, O16) are stable. Heavier nuclei(Z > 10), to be stable, need a higher proportion of neu-trons to provide sufficient nuclear-force binding to over-come the Coulomb-force repulsion of the protons (e.g.,K41, where A = 2Z + 3). Thus a nucleus with too fewneutrons will convert a proton to a neutron by emission ofa positron and an electron neutrino. On the other hand,a free neutron is slightly heavier than the proton anddecays into a proton, electron, and anti-neutrino with amean life of ∼ 12 minutes. Therefore, it can be energet-ically favorable for a nucleus with too many neutrons toconvert a neutron to a proton by emission of an electronand anti-neutrino. Thus nuclides with too few or toomany neutrons transmute by electron emission towardthe stable region along the bottom of the valley. A 3-Dplot of neutron number (y-axis) versus proton number(x-axis) versus potential energy per nucleon (z-axis) forall the isotopes of the elements shows a steep potentialenergy “valley of stability” with a positive curvature inthe x-y plane. The three kinds of radioactive transmuta-tion are:
1. Alpha decay (ejection of a helium nucleus consist-ing of two neutrons and two protons) is the mostcommon decay mode for elements above lead andnear the bottom of the stability valley.
2. Beta decay (emission of a positive or negative elec-tron or capture of a K-shell electron together withemission of a neutrino or anti-neutrino) generallyoccurs in nuclides on the valley sides and serves tocorrect unstable proportions of neutrons and pro-tons.
3. Spontaneous fission (division into two nuclei) oc-curs above uranium and is a mode of rapid decay

Id: 45.alphadecay.tex,v 1.151 2012/02/06 14:33:51 rfoote Exp 3
of the artificial elements above Z = 100. Theo-retical speculation about possible high-Z islands ofstability have stimulated numerous, and so far unc-successful, experiments to produce elements withZ = 114 or other so-called magic numbers.
A chain of radioactive decays, starting with a heavy nu-clide near the bottom of the stability valley (e.g., U238)and proceeding by alpha decays, produces nuclides withincreasing deficiencies of neutrons and corresponding po-sitions higher up the valley wall. The deficiency is cor-rected at various steps in the chain by emission of a neg-ative electron, i.e., beta decay. The three decay chainsfound in nature are illustrated in Appendix D. Thefourth doesn’t exist in nature because it has no long-lived parent nuclide that could have survived in signifi-cant quantity since the creation of earth’s elements. Al-pha decay occurs whenever permitted by energy conser-vation, unless preempted by beta decay. Consider thedecay process
Ra226 −→ Rn222 + He4. (2)
The total mass-energy (mc2 + kinetic energy) must beconserved. Thus, in the spontaneous alpha-decay of aradium nucleus we have,
Ra226 = Rn222∗ + He4 +Q, (3)
where Q = 4.869 MeV is the total kinetic energy of theproduct nuclei if they are in their ground states. (Precisevalues of isotopic masses are listed in the CRC nuclide ta-ble). The energy Q is shared in accordance with the con-servation of momentum between the mutually repelledHe4 and Rn222 nuclei. However, the latter, being a com-plex system of many constituent particles, may be leftin an excited state from which it later decays by gammaemission. Thus the kinetic energy of the remnant par-ticles (alpha particle and Rn222 nucleus) just after thedecay event depends on the energy of the excited stateof the Rn222 nucleus. High resolution spectrometry ofthe alpha particles from Ra226 reveals a “fine structure”[4.782 MeV (94.6%), 4.599 MeV (5.4%), 4.340 MeV(0.0051%), 4.194 MeV (7 × 10⁻⁴%)], each energy cor-responding to a particular excited state of the daughternuclide Rn222.
Generally, a nuclide, created in an excited state byalpha or beta decay of its parent nuclide, decays to itsground state by gamma-ray emission. In some cases itmay undergo alpha decay before it has had time to settleto its ground state, thereby giving rise to a more energeticalpha particle, which is another source of fine structurein alpha spectra.
III.1. The Geiger-Nuttall Relationship:
The Correlation Between Energy and Half Life inAlpha Decay
The principal aim of this experiment is to explore thecorrelation between the half lives of radioactive nuclidesand the energies of the alpha particles they emit — theshorter the half life the higher the energy. The mostabundant isotope of uranium, U238, with a half life, of4.5 billion years, emits alpha particles with an energy of4.2 MeV; Po212 with a half life of 0.304 µs emits alphaparticles with an energy of 8.785 MeV — in this case aratio of ∼ 4 × 10²³ in half life corresponds to a factorof only ∼ 2.1 in energy! The quantitative expressionof this correlation, discovered early in the investigationof radioactivity, is called the Geiger-Nuttall law and isexpressed by Equation 4,
lnλ = a1 lnEα + a2, (4)
where λ is the decay constant (= 1/τ), Eα is the emittedα-particle energy and a1 and a2 are constants.
Then, in 1927, Rutherford observed that the scatter-ing of 8.57 MeV alpha particles (from Po212) by a thinuranium foil is exactly what is expected for elastic scat-tering by a perfect 1/r Coulomb potential down to theclosest distance of approach for such particles, namely∼ 3 × 10⁻¹² cm. Thus the Coulomb barrier around auranium nucleus must be at least as high as 8.57 MeV,and any alpha particle going over the top to get out mustbe pushed away by Coulomb repulsion resulting in a fi-nal kinetic energy of at least that amount. And yet theenergy of alpha particles emitted by uranium is only 4.2MeV!
The explanation of these remarkable facts was an earlytriumph of the quantum mechanics discovered indepen-dently and in different forms by Erwin Schrodinger andWerner Heisenberg in 1926. Two years later, GeorgeGamow, a postdoc from Russia studying with Niels Bohrat the Institute for Theoretical Physics in Copenhagen,derived the equation for quantum mechanical tunnelingof alpha particles through the Coulomb barrier of the nu-cleus. Two young Americans studying in Europe, Ed-ward Condon and Ronald Gurney, discovered the sameexplanation independently. Their publications, Refer-ences [5, 6], on the topic are reproduced in the JuniorLab electronic library. From their barrier penetrationtheory is derived Equation 5 which is remarkably similarto the Geiger-Nuttall relationship, Equation 4, empiri-cally determined many years earlier.
lnλ = a1E−1/2α + a2 (5)
As mentioned earlier, radioactive decay is described byEquation 1 where τ is the mean life. The half life, τ1/2,is the solution of the equation
e−τ1/2/τA =1
2, (6)

Id: 45.alphadecay.tex,v 1.151 2012/02/06 14:33:51 rfoote Exp 4
which is
τ1/2 = τA ln 2 = 0.693τA. (7)
III.2. The Quantum Mechanics of Alpha-ParticleEmission
A very nice and accessible introduction to this mate-rial is given in Reference [7, 8]. Nuclei consist of protonsand neutrons held together by the strong, short rangenuclear force which exceeds the Coulomb repulsion be-tween the protons at distances less than of the order of1 fermi (10−13 cm). The potential function (a plot ofthe potential energy per unit charge of a positive testparticle against position) for a spherical high-Z nucleusis sketched in Figure 1. Inside the nuclear radius thepotential can be approximated by a square well poten-tial. Outside, the barrier is accurately represented by apotential proportional to 1/r. The wave function of analpha particle, initially localized inside the well, can berepresented as a traveling wave that is partially reflectedand partially transmitted at the barrier. The transmis-sion coefficient, very small, is the probability that thealpha particle will penetrate the barrier. As it bouncesback and forth inside the well the particle has multiplechances of penetrating the barrier and appearing on theoutside. If it does, then the potential energy which the al-pha particle had inside the nucleus is converted to kineticenergy as it slides down the outer slope of the barrier.
������������������������������������������������������������������������
������������������������������������������������������������������������
r
U
Increase in Z (less transparent)
Increase in V, M, or T (more transparent)
total energy of alpha particle
Increase in R (more transparent)
FIG. 1. Plot based on Figure 5.7 from Evans [1955] [8] illus-trating the nuclear potential barrier, and the effects of changesin the nuclear parameters on the transparency of the barrier,where Z is the atomic number, R is the radius of the nucleus,V , M , T are respectively the potential energy within the nu-cleus, mass and bouncing period of the emitted particle.
IV. EVOLUTION OF RADIOACTIVEMIXTURES: THE BATEMAN EQUATIONS
The source of radioactive nuclides in the present exper-iment is an ancient (∼ 109 years old) sample of the olive-green-colored mineral pitchblende containing triuraniumoctaoxide (U3O8). These rocks were borrowed from theHarvard mineral collection to which it was donated by ayoung rock hound who pried it out of a deposit betweenlayers of mica in the granite shield of Maine. Some phys-ical characteristics of U3O8 are a crystal density of 8.30g cm−3 and a bulk (ore) density ranging from 1.5 to 4.0g cm−3. Our samples happen to be relatively enriched inU3O8. The specific activity of U238 is 3.3× 10⁻⁷ Ci g−1
1. U3O8 is in soluble in water but will decompose to asolid ceramic (UO2) material above 1300 ◦C. This latterform is most commonly used as fuel for nuclear reactors.
The sample is evolving in time as the various compo-nents of the decay chains are born and decay. The ratesof growth and decay of radioactive isotopes in such mixedsamples is governed by a set of first-order linear differen-tial equations. Analysis of the variations of the countingrates of the various activities in light of these equationsand their solutions can yield measures of the mean livesand relative abundances of the various nuclides.
A full exposition of the differential equations that de-scribe the growth and decay of activities, the so-calledBateman equations, is given by Evans [1955], pp 470 –510. Here we consider only the two simple cases thatwill be of greatest use in planning and analyzing yourmeasurements. The fundamental law of radioactive de-cay is that at any instant the change, dA, in the numberof atoms of any given radioactive nuclide in a time inter-val, dt, is proportional to the number, A, present at thatparticular instant times dt, i.e.,
dA/dt = −A/τA, (8)
where τA is a constant characteristic of the nuclide. In-tegration of this equation leads immediately to the ex-pression, previously cited, for the number at any time t,namely
A(t) = A0e−t/τA , (9)
where A0 is the number present at t = 0. Now considerthe relations between the activities (decays/second) oftwo radioactive isotopes, A and B, such that B arisesfrom the decay of A. Let A(t) and B(t) represent thenumbers of atoms of the two isotopes present at any giventime, A0 and B0 the numbers present at t = 0, and τAand τB their mean lives, respectively. The rates of decayare A/τA and B/τB . As before, equation 8 describes the
1 1 Ci = 3.7 × 10¹⁰ disintegrations s−1

Id: 45.alphadecay.tex,v 1.151 2012/02/06 14:33:51 rfoote Exp 5
change of A. The rate of change of B is the algebraicsum of the rates of build-up and decay of B,
dB/dt = A/τA −B/τB . (10)
Equations 8 and 10 are simultaneous, first-order, dif-ferential equations that must be solved subject to theinitial conditions. The general solution to equation 8 isequation 9. The general solution of equation 10 is givenby the sum of the solution of the homogeneous equation,which is identical in structure to equation 8 and thereforehas the solution Bh = fhe
−t/τB where fh is any constant,and a particular solution. To find the particular solution,we use the homogeneous solution as a bootstrap and setBp = fp(t)e
−t/τB (this is the method of variation of pa-rameters). Substituting Bp for B and the solution forA in equation 10 and rearranging, we obtain for fp thedifferential equation
dfp/dt = (A0/τA)e−t(1/τA−1/τB). (11)
Integration of equation 11 and imposition of the initialcondition B(t = 0) = Bh(t = 0) +Bp(t = 0) = B0 yieldsthe solution (for τB 6= τA)
B(t) = B0e−t/τB +A0
τBτA − τB
[e−t/τA − e−t/τB ]. (12)
One form of equation 12 is of special importance tothe interpretation of data from this experiment. SupposeB0 = 0, τA � τB and t� τA. Then the rate of decay ofB is
rB(t) = B(t)/τB ≈ [A0/τA][1− e−t/τB ]. (13)
Under these circumstances the decay rate of B risesfrom zero and approaches asymptotically the decay rateof A.
These simple analyses provide us with at least twomeans of determining a nuclide’s lifetime:
1. One can derive an estimate of τB as the negativeslope of a plot of ln[rB(t = ∞) − rB(t)] against t.The diffusion of radon out of uraninite rocks occursat a nearly steady rate and can be considered theequivalent of production by radioactive decay of avery long-lived precursor.
2. A second way to determine τB is to turn off thesupply of B after its decay rate has reached a re-spectable value. Then the B rate will simply de-cline according to
rB = (B0/τB)e−t/τB . (14)
When a nuclide is third or later in a decay chain, theequation describing its decay rate is more complex, andinterpretation of the variation of an observed decay ratein terms of its mean life becomes more difficult or im-practical. If the mean lives of the secondary nuclides inthe chain are short compared to τA, and if one waits fora time long compared to any of those mean lives, then asteady state is approached in which all of the decay ratesare the same and equal to A0/τA.
IV.1. Numerical Solutions to the BatemanEquations
In spite of the complexity of the analytical solution,a set of differential equations for a multi-nuclide decaychain is readily solved by numerical integration with re-sults that can be displayed as plots of the various decayrates against time.
Expressed using matrices, the Bateman equations are
dN
dt= ΛN, Λ =
−λ1λ1 −λ2
λ2 −λ3. . .
. . .
. (15)
N is the nuclide number row vector, with the parentnuclide the first entry. Λ is the decay constant matrix(λi = 1/τi). The solution to this matrix differential equa-tion, for initial conditions N0, is analogously given by thematrix exponential,
N(t) = eΛtN0, (16)
where the matrix exponential is defined by the Taylorexpansion of the exponential,
eΛt = 1 + Λt+(Λt)2
2!+
(Λt)3
3!+ · · · , (17)
and we can check that it solves equation 15 by substitu-tion. Although we now have an elegant solution that issimilar in form to the single-nuclide solution, calculatingthe matrix exponential numerically is computationallyintensive. Using matrix algebra, equation 16 can be sim-plified for computational purposes. Since Λ is triangular,its eigenvalues are the main diagonal elements, the neg-atives of the decay constants. Let D = diag{−λi} bethe matrix of eigenvalues. Then Λ is diagonalized by thematrix of eigenvectors, V, as follows2,
2 The reasoning for this theorem is easy to understand with afundamental understanding of eigenvectors and eigenvalues. IfV contains the eigenvectors of Λ, then ΛV is analogous to the

Id: 45.alphadecay.tex,v 1.151 2012/02/06 14:33:51 rfoote Exp 6
ΛV = VD =⇒ Λ = VDV−1 (21)
Next, we express the matrix exponential eΛt in termsof D3,
eΛt = eVDV−1t = VeDtV−1. (27)
This is a great computational improvement becausethe matrix exponential of a diagonal matrix is easy to cal-culate (this, again, can easily be seen from equation 17),
eDt =
e−λ1t
e−λ2t
e−λ3t
. . .
(28)
. The new equation for N(t), substituting from Eq. (27),is
N(t) = VeDtV−1N0, (29)
and can easily be implemented in a program such asMATLAB. See Appendix C for details.
left side of the familiar eigenvalue equation Axi = λixi for eachof the eigenvectors. Similarly, VD is analogous to λixi. Thefollowing illustration may make this easier to follow:
ΛV = VD (18)
Λ
...
...x1 x2 · · ·...
...
=
...
...x1 x2 · · ·...
...
λ1
λ2. . .
(19)
Λ
...
...x1 x2 · · ·...
...
=
...
...λ1x1 λ2x2 · · ·
......
(20)
which is merely Λxi = λixi i times over.3 That eVDV−1t = VeDtV−1 can easily be seen from the defi-
nition of the matrix exponential in equation 17,
eVDV−1t = eVDtV−1(22)
= 1 + VDtV−1 +
(VDtV−1
) (VDtV−1
)2!
+ · · ·(23)
= VV−1 + VDtV−1 +V (Dt)2 V−1
2!+ · · · (24)
= V
(1 + Dt+
(Dt)2
2!+ · · ·
)V−1 (25)
= VeDtV−1. (26)
0 100 200 300 400 500 600 700 800 900−0.5
0
0.5
1
1.5
2
2.5
3
3.5
4
4.5x 10
18Isotope Activity, Bateman Equations (N
0 = 1 mol τ
1/2 = 105 sec)
Time (sec)
Act
ivity
(ev
ents
/ se
c, B
q)
τ1/2
= 105 sec
τ1/2
= 10 sec
τ1/2
= 103 sec
FIG. 2. Plot of the activity in becquerels (events / sec) versustime for a hypothetical decay chain consisting of isotopes withhalf lives τ1/2 = 105 sec, 10 sec, and 102 sec. In time of theorder of the length of the half lives, it comes to equilibrium– each isotope carries approximately the same activity. Thiswas seen directly in equation 13.
V. EXPERIMENTAL OVERVIEW
The Junior Lab experiment in alpha-decay consists oftwo different types of alpha-spectrometers:
1. A Beckman liquid scintillation detector. This ap-paratus is principally used for the determination ofthe lifetime of Rn222, though with a certain amountof skill it can also be used to measure the muchshorter lifetime of Po218 as well (described in Sec-tion VII.1). The lifetime of Po214, heralded bythe birth of a Bi214 atom, can be measured usingdelayed coincidence techniques described in Sec-tion VIII.1.
2. A Solid-State Spectrometer based around a “Pas-sivated Implanted Planar Silicon” or “PIPS” de-tector4. The lifetimes of all other nuclides can bemeasured with the PIPS based alpha-spectrometers(described in Section VI). The lifetime of Po212 ismeasured using coincidence techniques described inSection IX.3 with the assistance of a plastic scintil-lator to detect beta decays.
There are two sources for alpha-particle emitting iso-topes in this investigation. The first is a very (chemically)stable compound called triuranium octoxide (U3O8),which is the end product of the oxidation of Uraninite(UO2) in air (we will refer to it as uraninite for simplic-ity). These ‘rocks’ live in metal cans in the lead box inthe fume hood. They should never be removed from thecans. They are used with the PIPS detectors. The othersource is the tube of radium-226 salts. It emits radon-222gas which is ‘bubbled’ into scintillator fluid for use in theBeckman apparatus.
4 Canberra model A450-20AM from canberra.com

Id: 45.alphadecay.tex,v 1.151 2012/02/06 14:33:51 rfoote Exp 7
V.1. Suggested Experiment Schedule: Overview
Day 1.: 1. Section VI.3: Seal a can containinguraninite rocks with a rubber stopper in whicha certified “good” alpha particle detector isembedded. Apply a voltage (∼ 450V) betweenthe can and lab ground so as to draw to thesurface of the detector positive ions of decayproducts from radon isotopes leaking out ofthe rocks. Make sure the ground termi-nal of the floating 450V power supply isconnected to earth ground using an al-ligator clip to the side of the NIM bin!Record the energy spectra of the alpha parti-cles. With the help of your charts from thepreparatory questions, identify the features inthe energy spectra and explain the shapes ofthe lines.
2. Section VII.1: Prepare a sealed sample ofradon in liquid scintillator and initiate a mea-surement of the relatively long mean life ofRn222 and attempt to measure the short life-time of Po218. Conduct at least two runs:a “trial” run to familiarize yourself with theapparatus, and a second with all the “bugs”worked out.
Day 2.: 1. Section VI.4: Determine the mean livesof various alpha and beta activities by measur-ing changes in counting rates measured withthe silicon detector.
2. Measure the alpha decay activity in the liq-uid scintillator with the Beckman spectrome-ter and record the date and time.
3. Suggested Progress Check for end of2nd Session: Plot an alpha particle spec-trum (∼ 10 minute integration) with the x-axis in calibrated units of energy. All of thepeaks should be identified with energy, par-ent nucleus and half-lives obtained from theliterature.
Day 3.: 1. Section VIII.1: Measure the short meanlife of Po214 by the delayed coincidencemethod using the Beckman spectrometer co-incident circuit to detect the precursor betadecays of bismuth.
2. Measure the alpha decay activity in the liquidscintillator.
Day 4.: 1. Section IX.3: Measure the very shortmean life of Po212 by the delayed coincidencemethod using the auxiliary plastic scintillationcounter to detect the precursor beta decays ofbismuth.
2. Refine whatever parts of the experiment needadditional attention.
3. Measure the remaining alpha decay activity inthe liquid scintillator.
VI. SOLID-STATE SPECTROMETEREXPERIMENT
The sample of U3O8, consisting of a few small rocks(∼ 70 g), is contained in a can which will be assignedto you for the duration of your experiment. The PIPSdetectors are expensive and extremely delicate so takegreat care not to let anything touch the surface of thedetector. The rocks leak radon gas which can be trappedin the can by sealing it with the rubber-stopper in whichthe detector is mounted. Jostling of the rocks within thecans has, over time, produced small quantities of dust sobe careful not to spill any small particles when observingthe sample. The can setup is illustrated in Figure 3.
In this experiment samples of such generically relatednuclides are created on the surface of the silicon detec-tor. Each alpha-decay process involved in a decay chainreveals itself as a distinct peak in the energy spectrum,and its rate can be measured by appropriate manipula-tion of the recording sequence. Thus all the necessarydata for an exploration of the energy-mean life relationin alpha decay can be obtained with this one “simple”device. One can imagine that Lord Rutherford, in 1905,would have given his eyeteeth for such a detector to re-place the ion chambers, cloud chambers, calorimeters,and spinthariscopes he used in his discoveries.
When a radon atom suffers alpha decay, the daugh-ter polonium atom recoils with sufficient velocity to haveseveral of its outer electrons stripped in collisions withair molecules. An electric field, established by applica-tion of high voltage (∼ 450 VDC) between the can andthe detector, draws the polonium ion to the surface ofthe detector where it sticks. Its subsequent decay andthe decays of its daughter nuclides yield alpha and betaparticles. If an alpha particle from an atom stuck onthe detector surface is emitted in a direction into the de-tector, then nearly all of its energy will be dissipated inthe sensitive volume of the silicon where the number ofelectrons raised to the conduction band is almost exactlyproportional to the dissipated energy. The conductionelectrons are swept out of the silicon by the field estab-lished by the bias voltage (∼ 40 VDC) applied to thedetector. The resulting charge pulse is detected by thepreamplifier as a voltage pulse which is amplified andanalyzed with a multichannel analyzer (MCA) card.
VI.1. Multi-Channel Analyzer
The distribution in amplitude (pulse-height spectrum)of pulses from a detector-amplifier combination or per-haps from a Time-to-Amplitude Converter (TAC) isconveniently measured with a 2048 channel MCA cardmounted in the computer. Details of the MCA operation

Id: 45.alphadecay.tex,v 1.151 2012/02/06 14:33:51 rfoote Exp 8
can be found on the web in the Junior Lab E-Library andin the photocopied manual next to the experimental sta-tion. These cards allow full software control over upperand lower level discrimination voltages, have a coinci-dence (gated) detection mode, and offer a simple set oftools for establishing energy calibrations and determiningpeak statistics. With a slight amount of additional effort,the Maestro-32 control software may be programmed us-ing simple, text-based, .job files to automate repetetivemeasurements with precision. This technique is outlinedin appendix B.
Po+
��������������������
���������������������������������������������
���������������������������������������������������������������������������������������������������������������������������������������������������������������������������
���������������������������������������������������������������������������������������������������������������������������������������������������������������������������
Uraninite
stopper
Silicon barrierDetector
RG58 Cable to preamp
HV Supply
+−
+
Rubber
Metal can
FIG. 3. Schematic diagram of the metal can containing urani-nite, sealed by the rubber stopper carrying the silicon barrierdetector, and attached to the high voltage supply. A polo-nium ion is shown as it is about to be drawn to the detectorby the electric field.
You will be assigned a silicon barrier detector and acan containing a sample of uraninite rocks for your exclu-sive use during this experiment. The mixture of decayingnuclides stuck on the surface of the detector depends onthe history of its exposure to the decay products of radonthat emanates from the uraninite rocks, and on the com-positions of the particular uraninite rocks. Therefore itis essential that you control the exposures for your ownpurposes during the two-weeks of the experiment. Youwill find a lot of things going on in the can and on thesurface of the detector that are not explicitly mentionedin this lab guide. To figure out exactly what is goingon you will have to keep a meticulous timed and datedrecord of your manipulations and observations.
CAUTION
Precursor nuclides of all the activities studied in thisexperiment are isotopes of the noble gas, radon, whichdiffuse at steady rates out of the rocks in the can. Thenuclides drawn to the surface of the detector by the im-posed electric field are the isotopes of polonium (Po215,
Po216, and Po218) which are the decay products of thoseradon isotopes. Therefore, to initiate a useful amount ofthe action that follows deposition of one of those polo-nium isotopes on the detector surface, there must be anadequate activity of its parent radon isotope in the gas inthe can when you apply the high voltage, and the voltagemust be left on for a time of the order of the longest-livednuclide in the subsequent chain leading to the isotope un-der investigation. For example, if you want to study therapid decay of Po212, you must accumulate its 10.64-hourprecursor Pb212 on the surface of the detector for a dayor more with the high voltage on.
To study the decay of Po218, you will need to keep thecan sealed for a couple of days to accumulate the longlived precursor Rn222 gas that leaks from the rocks. Itsactivity will build toward its equilibrium value in propor-tion to the function 1− e−t/τ where τ is its mean life ofabout 3 days. If you open the can, the radon willescape, and you will have to wait for a time of theorder of τ for the activity to build up to a usefulvalue again. When you have enough of the gas in thecan, you can measure the meanlife of its daughter nuclidePo218 by turning on and off the high voltage applied tothe can. In the case of Rn219 and Rn220 radon isotopes,those times are of the order of minutes and seconds. SoTHINK before you open your can.
Additional information about some of the devices canbe found in Melissinos [1966] and in the equipment man-uals. There are three power supplies used in this ex-periment. Costly damage can occur if they are inad-vertently interchanged. The Ortec Model 428 DetectorBias Supply provides the low (∼ 40V) voltage to the Sil-icon Barrier Solid State Detector. This supply shouldbe connected to the ‘HV’ input on the Canberra Model2003BT preamplifier. The second supply is housed in ablack plastic box and provides ∼ 425 VDC for biasingthe can containing the uraninite with respect to the solidstate detector, causing polonium ions to be attracted tothe surface of the detector. The third supply provideshigh voltage to the photomultiplier of the scintillationcounter used to detect beta-decay electrons emanatingfrom the nuclides deposited on the surface of the SiliconDetector.
VI.2. Silicon Barrier Solid State Detector
When a charged particle dissipates an amount of ki-netic energy, K, in the sensitive volume of a solid statedetector, an average of K/ε valence electrons are raisedto the conduction band and swept out by the bias fieldto form a pulse of negative charge. In silicon ε ≈ 3 eV,so an alpha particle with an energy of several MeV pro-duces a charge pulse containing so many electrons thatthe fluctuations are a negligible source of width of a linein a typical alpha energy spectrum — the actual linewidth ∆E depends on the quality of the detector, andin a good detector it should not exceed ∆E ≈ 0.01E.

Id: 45.alphadecay.tex,v 1.151 2012/02/06 14:33:51 rfoote Exp 9
The solid state detector is connected to a preamplifierthrough which the bias voltage (<∼ 50V!) is supplied tothe detector, and in which the voltage induced by thecharge pulse at the gate of an input field-effect transistoris amplified before passing to a second amplifier and onto a MCA for pulse-height analysis (the physics of solidstate detectors is described in Melissinos, 1986.)
VI.3. Day 1: The Energy Spectra of AlphaParticles from the Decay Products of Uraninite
Emanations
The silicon detector assigned to you has probably beenexposed recently to alpha emitters of which not all havedecayed to negligible levels of activity. You can use theresidual activity to test the detector and spectrum anal-ysis equipment, and to adjust the gains of the system toachieve a convenient spread of the spectral lines (0 – 10MeV) with good linearity.
Connect the detector and other components as shownin Figure 4, except do not turn on or connect thedetector bias voltage supply. Place the detector inits rubber stopper face down on the table and cover itwith a black cloth (so that room light does not strike thesurface when the ∼ 40 VDC bias voltage is applied). Setthe MCA lower level discriminator (in software) to ∼ 200channels to eliminate detector noise (to check, make surethat the dead time when you’re taking spectra is hoveringaround 0.6% and 0%).
Turn on the Ortec 428 bias supply, set it to +40 VDCand measure the voltage at the SHV connector beforeconnecting to the preamplifier’s bias voltage input (theOrtec 428 dial is a rather coarse control and you wantto be sure not to exceed the manufacturer’s maximumvoltge recommendation at the risk of destroying the (ex-pensive) detector).
After setting up the scope trigger and gain, adjust thespectroscopy amplifier so that the highest-energy pulsesoccur at ∼ 8 VDC (if there is no scope, just try to makeit match up to MCA channel ∼ 800). Beware, you maybe plagued by 80MHz rf pickup, probably from the MITFM radio station broadcasting over the MIT 110V powerline!) Record all the settings of all the components inyour setup so that you can reestablish the same measure-ment conditions in your next lab session.
1. Record a 300 sec spectrum with the MCA mem-ory with the detector face down on the table (andcovered with a black cloth).
2. Seal your can with your stopper/detector. Recorda second 300 sec spectrum with no high voltageapplied to the can. Compare this spectrum withthe one you obtained with the detector face downon the table.
3. Connect the high voltage (∼ 425 V) power supplyin black plastic box between the can and lab groundand record a third 300 sec spectrum.
AnalyzerMultichannelAmplifier
Oscilloscope
DetectorAlpha-ParticleCanberra PIPS
+40VDCDetector Bias Supply
Canberra 2003BTPreamplifier
FIG. 4. Arrangement of components for measuring the en-ergy spectra of alpha particles from nuclides deposited on thesurface of the detector.
4. Reverse the voltage and record a fourth 300 secspectrum.
Try to understand everything you see in these fourspectra. Ask for advice if there are mysteries you can’tsolve. Record a 30-minute spectrum with ∼ 425 V ap-plied to the can with the polarity that produces the mostaction.
While you are waiting, get started on the long-termmeasurement of the mean life of Rn222 with the liquidscintillator, described in Section VII.1. You will need toget data over several days, so it’s wise to start early onthis measurement.
After initiating the Rn222 measurements, return tothe silicon detector experiment and measure the chan-nel numbers of all the peaks of the one-hour spectrum.With the aid of the chart of the nuclides (located onthe wall above the experiment), your preparatory ques-tion answers and [1], identify the peaks and explain theirshapes. Do you see evidence of the famous high-energyalphas from Po212? If so, estimate their energies and thefraction of the decays that give rise to them.
• Try to explain any discrepancies between the spec-trum of pulse heights you have observed and theirexpected energies (e.g. consider the effect of athin coating of protective material or dust over thesource or the detector.)
• In light of the likely age of the uranite source andthe opportunity it has had to achieve equilibriumamong the quantities of its radioactive decay prod-ucts, try to explain the inequalities you may see inthe intensities of the various alpha particle groups.
At the end of the first lab session, keep your cansealed with the stopper/detector and connect your high-voltage box between the can and the shield of the BNCconnector with the appropriate polarity to draw the polo-nium ions to the detector. This will build up a supplyof radioactive nuclides in the gas in the can and on thesurface of the detector for analysis at your next session.Note the time in your lab notebook.

Id: 45.alphadecay.tex,v 1.151 2012/02/06 14:33:51 rfoote Exp 10
VI.4. Days 2 and 3: Determination of the MeanLives of Several Nuclides
In preparation for your second session, devise a plan forthe determination of the mean lives of as many nuclidesas possible with data that you will be able to obtain fromthe setup used in the first session. Base your plans onthe possibilities of measurement implied by equations 13and 14 above. There are two alpha decays and two betadecays whose mean lives can be measured by appropriatemanipulations with the silicon detector.
Consider:
1. Disconnecting the high voltage and measuring thedecay of the nuclides stuck on the detector surface
2. Reconnecting the high voltage and measuring thebuild up of activities
3. Flushing the accumulated radon out of the can withnitrogen, sealing the can, and then measuring thebuild up of activities as radon accumulates in thegas in the can.
You may want to consult your instructor about yourstrategies.
Do not break the hermetic seal of your can andlet the accumulated radon escape before you haveextracted all the useful information from the stateof things that exists after a long accumulation ofradon in the can. Restore the settings of the measure-ment chain you established in the first session. Use theMCA to record the spectra and, for your convenience inanalysis, make whatever fine adjustments of the amplifi-cation may be necessary to bring the highest energy peakinto the same channel as before.
Record a 30-minute spectrum for comparison with theone you recorded in the first session.
Now proceed with the strategy you have devised tomeasure the mean lives of as many of the activities asyou can.
VII. LIQUID SCINTILLATION DETECTOREXPERIMENT
The Beckman scintillation detector consists two pho-tomultiplier tubes (PMTs) that view the flashes of lightin the liquid scintillation cocktail contained in a samplevial placed between them. Particle energy dissipated inthe scintillator produces a flash of blue light at a rateof about one photon per 30 eV. Some of the light is ab-sorbed by the metallic coating on the inside of the glasswindow of the PMT causing emission of a burst of pho-toelectrons. The photoelectrons enter a series of dynodestages (electron multiplier) from which an amplified burstof electrons emerges to be measured as a pulse of chargeproportional to the amount of light in the scintillationflash.
Liquid scintillation cocktails are generally xylene orother organic liquid with a small quantity of dissolvedcomplex aromatic hydrocarbon. A liquid scintillator con-verts into visible light about 1% of the energy lost by anenergetic electron traversing the liquid. Thus a 1 MeVelectron that stops in a liquid scintillator by virtue ofenergy loss due to ionizing collisions with carbon and hy-drogen atoms yields a flash of several thousand photons(∼ 1 visible photon per 100 eV of energy loss) which isreadily detected by a PMT. The liquid scintillator is alsoan efficient detector of alpha particles. However, the rateof energy loss along the path of a stopping alpha particleis so great that the conversion capacity of the aromaticmolecules is saturated and only about 0.1% of the ion-ization energy is converted into optical photons. Whilethe commercial liquid scintillator (Ultima Gold)used in Junior Lab is not particularly dangerous,please wear gloves and note the safety precautionslisted on the Material Safety Data Sheet (MSDS)posted by the hood.
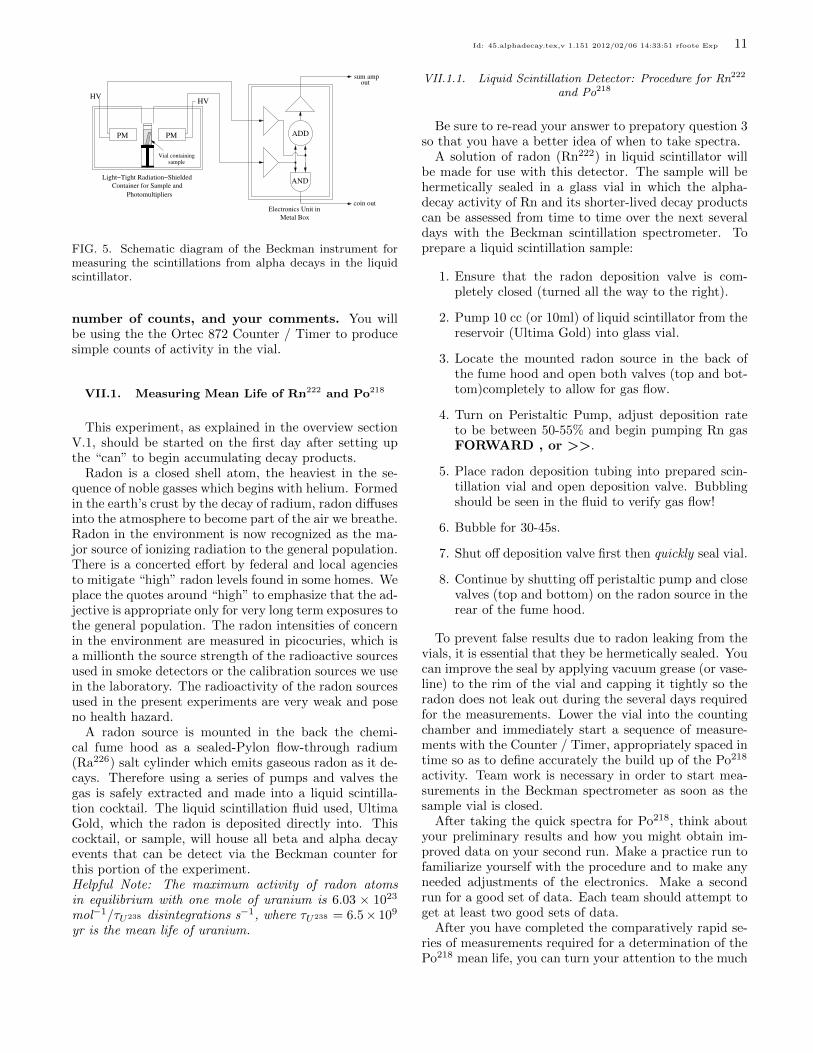
Figure 5 is a schematic diagram of the Beckman liquidscintillation spectrometer. It has a light-tight, radiation-shielded counting chamber and associated electronics tosupply power and process signals. In the chamber aretwo PMTs that view a platform on which a sample ofliquid scintillator can be lowered for counting. The plat-form is raised and lowered through a light-tight shutterby an electromechanical elevator. The outputs from thePMTs are amplified and fed to an addition circuit and acoincidence circuit contained in a chassis mounted by theside of the chamber. The output of the addition circuitis a negative 0 ∼ 1V pulse proportional to the sum ofthe amplitudes of the signals from the two PMTs pro-duced by a single scintillation event. The output of thecoincidence circuit is a positive 5V logic pulse producedwhenever two pulses above a certain minimum size arrivenearly simultaneously from the two PMTs. Dark currentpulses from the PMTs are random and uncorrelated, sothe chances of their occurring in two PMTs within theresolving time of the circuit is small. On the other hand,a faint scintillation event that produces enough light tocause one or more photoelectrons to be ejected from eachof the two photocathodes will yield pulses that are simul-taneous within the decay time of the phosphor, which ison the order of 10−8 sec. Thus the coincidence logic sig-nals are a very sensitive indicator of the occurrence offaint scintillation events, though they do not carry am-plitude information.
You will determine the mean life of Po218 by measur-ing the rapid growth (minutes) of its radioactivity in afreshly prepared sample of Rn222, and the mean life ofRn222 from the slow decay products. You will have towork rapidly at the beginning of this measurement in or-der not to miss the early stages in the build up of thePo218 activity (you studied how quickly in preparatoryquestion 3). Study the following procedure before youbegin. Make up a data table in your lab notebookto record the times (starts and durations), the
Id: 45.alphadecay.tex,v 1.151 2012/02/06 14:33:51 rfoote Exp 11
��
���������������������������������������
�����������������������������
PM PM
HVHV
ADD
coin out
sum ampout
ANDLight−Tight Radiation−Shielded
PhotomultipliersContainer for Sample and
Electronics Unit inMetal Box
Vial containingsample
FIG. 5. Schematic diagram of the Beckman instrument formeasuring the scintillations from alpha decays in the liquidscintillator.
number of counts, and your comments. You willbe using the the Ortec 872 Counter / Timer to producesimple counts of activity in the vial.
VII.1. Measuring Mean Life of Rn222 and Po218
This experiment, as explained in the overview sectionV.1, should be started on the first day after setting upthe “can” to begin accumulating decay products.
Radon is a closed shell atom, the heaviest in the se-quence of noble gasses which begins with helium. Formedin the earth’s crust by the decay of radium, radon diffusesinto the atmosphere to become part of the air we breathe.Radon in the environment is now recognized as the ma-jor source of ionizing radiation to the general population.There is a concerted effort by federal and local agenciesto mitigate “high” radon levels found in some homes. Weplace the quotes around “high” to emphasize that the ad-jective is appropriate only for very long term exposures tothe general population. The radon intensities of concernin the environment are measured in picocuries, which isa millionth the source strength of the radioactive sourcesused in smoke detectors or the calibration sources we usein the laboratory. The radioactivity of the radon sourcesused in the present experiments are very weak and poseno health hazard.
A radon source is mounted in the back the chemi-cal fume hood as a sealed-Pylon flow-through radium(Ra226) salt cylinder which emits gaseous radon as it de-cays. Therefore using a series of pumps and valves thegas is safely extracted and made into a liquid scintilla-tion cocktail. The liquid scintillation fluid used, UltimaGold, which the radon is deposited directly into. Thiscocktail, or sample, will house all beta and alpha decayevents that can be detect via the Beckman counter forthis portion of the experiment.Helpful Note: The maximum activity of radon atomsin equilibrium with one mole of uranium is 6.03 × 10²³
mol−1/τU238 disintegrations s−1, where τU238 = 6.5× 10⁹
yr is the mean life of uranium.
VII.1.1. Liquid Scintillation Detector: Procedure for Rn222
and Po218
Be sure to re-read your answer to prepatory question 3so that you have a better idea of when to take spectra.
A solution of radon (Rn222) in liquid scintillator willbe made for use with this detector. The sample will behermetically sealed in a glass vial in which the alpha-decay activity of Rn and its shorter-lived decay productscan be assessed from time to time over the next severaldays with the Beckman scintillation spectrometer. Toprepare a liquid scintillation sample:
1. Ensure that the radon deposition valve is com-pletely closed (turned all the way to the right).
2. Pump 10 cc (or 10ml) of liquid scintillator from thereservoir (Ultima Gold) into glass vial.
3. Locate the mounted radon source in the back ofthe fume hood and open both valves (top and bot-tom)completely to allow for gas flow.
4. Turn on Peristaltic Pump, adjust deposition rateto be between 50-55% and begin pumping Rn gasFORWARD , or >>.
5. Place radon deposition tubing into prepared scin-tillation vial and open deposition valve. Bubblingshould be seen in the fluid to verify gas flow!
6. Bubble for 30-45s.
7. Shut off deposition valve first then quickly seal vial.
8. Continue by shutting off peristaltic pump and closevalves (top and bottom) on the radon source in therear of the fume hood.
To prevent false results due to radon leaking from thevials, it is essential that they be hermetically sealed. Youcan improve the seal by applying vacuum grease (or vase-line) to the rim of the vial and capping it tightly so theradon does not leak out during the several days requiredfor the measurements. Lower the vial into the countingchamber and immediately start a sequence of measure-ments with the Counter / Timer, appropriately spaced intime so as to define accurately the build up of the Po218
activity. Team work is necessary in order to start mea-surements in the Beckman spectrometer as soon as thesample vial is closed.
After taking the quick spectra for Po218, think aboutyour preliminary results and how you might obtain im-proved data on your second run. Make a practice run tofamiliarize yourself with the procedure and to make anyneeded adjustments of the electronics. Make a secondrun for a good set of data. Each team should attempt toget at least two good sets of data.
After you have completed the comparatively rapid se-ries of measurements required for a determination of thePo218 mean life, you can turn your attention to the much

Id: 45.alphadecay.tex,v 1.151 2012/02/06 14:33:51 rfoote Exp 12
more gradual process of the decay of the parent nuclideitself, i.e. Rn222. Since the mean life of radon is severaldays, you will have to follow the decay of your samplefor several days or a week to get accurate results. Hereyou must overcome three problems. The first is that thebeta activities of Pb210 and Bi210 and the alpha activityof Po214 will continue to grow for several hours beforethey reach the equilibrium condition of being equal tothe acitivities of Rn222 and Po218. Since you cannot iso-late the counts due to Rn222, any rate you measure willbe influenced by these other activities. The best thing todo, therefore, is to wait until all the activities are nearlyequal (a couple of hours). Then any counts will give youa rate proportional to the Rn222 activity from which youcan determine the mean life. The other problem is thepossible leakage of the radon gas from the vial.
VII.1.2. Liquid Scintillation Detector: Analysis for Rn222
and Po218
Given the follwing facts:
1. The mean life of Po218 is much shorter than thatof Rn222,
2. The mean lives of the Po218 decay products thatlead to the production of alpha-active Po214 arelong compared to the mean life of Po218,
3. Some Po218 may be dissolved in the liquid scintil-lator along with Rn222,
one can show that the measured counting rate r(t) isrepresented to a good approximation by a function ofthe form
r(t) = a− be−t/τ (30)
where a, b and τ are constants. Thus
ln[a− r(t)] = ln b− t/τ (31)
The constant a is the total counting rate that is ap-proached asymptotically by the two alpha activities attimes much longer than the mean life of Po218, but stillmuch less than the mean life of Rn222. It can be esti-mated from an examination of a plot of r vs. t. A plot ofln[a − r(t)] vs. t during the first few minutes should benearly a straight line with a slope of −1/τ where τ is themean life of Po218. (Note: as r approaches a, statisticalfluctuations will cause wild gyrations or worse in the val-ues of ln[a − r], so the most useful information about τmust be derived from the early part of the rising curveof activity.
Additional questions:
1. Describe how the pulse height spectrum changeswith time.
2. Identify the part of the pulse height spectrum dueto the beta decays of Pb214 and Bi214.
3. What is the effect of the accumulating radionuclidePo210 on your results?
VIII. MEASURING LIFETIMES OFSHORT-LIVED SPECIES
A technique particularly well suited for determiningthe mean life of very short-lived species is to use thedecay event that gives birth to a particular nuclide asa start signal for a time-to-amplitude converter (TAC),and the decay event of the nuclide as the stop signal. Thedistribution of time intervals between the start and stopsignals is the decay curve of the nuclide. This method willbe used to measure the mean lives of Po214 and Po212.Po212 may be measured using the output of the Beck-man’s coincidence circuitry as described below.
VIII.1. Determination of the Mean Life of Po214
Po214, produced by the beta-decay of Bi214, has meanlife less than 300 microseconds. Its decay curve is mea-sured with the help of the Time-to-Amplitude Converter(TAC). During the third day of the experiment, you willdetermine the mean life by measuring the distribution induration of the time intervals between the scintillationpulse produced by the beta decay of a Bi214 nucleus intoa Po214 and the subsequent scintillation pulse producedby the 7.6 MeV alpha particle from the decay of the Po214
nucleus.
VIII.1.1. Procedure
Use an eluted radon source that has aged sufficientlyto bring the rate of Po214 decays up near to equilibriumwith the rate of Rn222 decays. Set up the electronics asshown in Figure 6. An inverter is required because theTAC is wired to only trigger on negative signals.
The +5 VDC logic pulses from the coincidence out-put from this timing measurement offer the criticallyimportant advantage that they are produced only whenpulses occur simultaneously in the two phototubes, asmentioned above. In order to detect with reasonable effi-ciency, the weak pulses due to the beta decays that pre-ceded the alpha emissions, it is necessary to accept smallscintillation-produced pulses, which, in the absence of acoincidence requirement, would be lost in the forest ofdark current pulses created by the thermionic electronsspontaneously and randomly emitted by the photocath-odes of both tubes. The inverted +5 VDC logic pulsesare fed directly to both the stop input of the Ortec TACand to the delayed gate generator. The negative pulses of

Id: 45.alphadecay.tex,v 1.151 2012/02/06 14:33:51 rfoote Exp 13
GeneratorDelay Gate
StopStart TAC
Multi−ChannelAnalyzer
��
������������
����������
Inverter
Metal BoxElectronics Unit in
Light−Tight Radiation−Shielded
PhotomultipliersContainer for Sample and
PM PM
HVHV
ADD
sum ampout
AND
Vial containingsample
coin out
FIG. 6. Experimental arrangement for measuring the short mean life of Po214. The inverter is necessary because the TAC willtake only negative signals as inputs. Scintillation light from a decay event strikes both PMTs and causes simultaneous pulsesthat trigger the coincidence circuit.
the delayed gate generator are in turn fed to the start in-put of the TAC. The TAC range should be set to severalmultiples of the expected nuclide lifetime. The output ofthe TAC plus MCA combination records the time inter-val between each delayed start pulse and the next stoppulse, provided the interval is within the allowed rangeof the TAC. Delaying the start pulse relative to the stoppulse by several microseconds prevents the timing actionof the TAC from being stopped by the same pulse thatstarts it. A high delay will result in the loss of events,however, so make sure you keep it suitably low. Cal-ibrate the TAC with pulses from the Time Calibrator,though you should note that the longest range possibleis only about 10% of the TAC’s range. The TAC andMCA are both very linear devices however, and you canextrapolate this calibration throughout the entire rangeof the MCA display. In a related measurement of themean life of Po212, we employ a different detector combi-nation to detect the birth and death of the Po212 nucleus.The sensitive layer of the silicon detector is too thin toyield a usable start pulse from the lightly-ionizing elec-trons emitted in the beta decay of the precursor bismuthnuclei. Therefore it is necessary to employ a separatedetector, a plastic scintillation detector with a thin win-dow, to detect the beta-decay electrons that signal thebirth of the short-lived polonium nuclei.
IX. MEASURING THE MEAN LIFE OF PO212
IX.1. Plastic Scintillation Counter
Beta-decay electrons emitted by the atoms plasteredonto the silicon detector surface will be detected by ascintillation detector with a plastic scintillator in an ar-
rangement shown schematically in Figure 7. The plasticscintillator is covered with a thin aluminum foil which isreadily traversed by the beta-decay electrons. Informa-tion about the wiring and operation of a photomultipliercan be found in Melissinos [3].
IX.2. Time-to-Amplitude Converter/SingleChannel Analyzer (TAC/SCA)
The Ortec Model 567 Time-to-Amplitude-Converter(TAC) is used to convert the time intervals betweenpulses at the “start” and “stop” inputs into the ampli-tudes of output pulses. If a start pulse is generated inthe plastic scintillator by a beta decay event heraldingthe birth of the radioactive nuclide Po212, and the stoppulse is generated in the silicon detector by its decay, thenthe distribution in amplitude of the TAC output pulseswill be proportional to the distribution in duration of thelifetimes of the Po212 atoms.
The polarity of the start and stop pulses is set us-ing internal jumpers and the threshold for the negativeand positive positions are ∼ −400mV and ∼ 2V respec-tively (it is currently set to negative and will stay thatway throughout the experiment). The SCA feature ofthe Ortec 567 is enabled by flipping the toggle switchadjacent to the output jacks. It will inhibit the TACoutput except for pulses with amplitudes that fall withinthe “window” set by the lower and upper discriminatordials. Within that window the TAC output remains pro-portional to the start-stop time intervals. For each pulsein the window, a +5 VDC logic pulse is generated at theSCA output. In this part of the experiment, it may beuseful to use the SCA logic pulse to gate the MCA inan analysis of the amplitudes of pulses from the ‘sum’

Id: 45.alphadecay.tex,v 1.151 2012/02/06 14:33:51 rfoote Exp 14
alpha signalOUT
���������������������������
������������������
Silicon detector
Scintillator
Photomultiplier
Magnetic Shield
betasignalOUT
HVIN
FIG. 7. Schematic diagram of the scintillation counter with the silicon detector in place.
output of the Beckman scintillation detector in order toidentify which of the alpha particle groups is associatedwith the very short lived (∼ 100µs) nuclide.
IX.3. Procedure
The mean-life of Po212 is very short. However, it can bemeasured by taking advantage of the fact that each birthof a Po212 atom is signaled by emission of an energeticelectron in the beta-decay of its parent Bi212 nucleus.The setup employs a scintillation detector covered by athin aluminum foil that can be penetrated by most of thedecay electrons. The silicon detector must first be platedwith sufficient precursors of Po212 by exposure to radongas in a can with the uraninite with the plating voltagesource connected (>∼ 1 day). Then it is placed in thewell of the scintillation counter so that electrons emitteddownward in the decay of the precursor Bi nucleus willexcite the scintillator. If the subsequent decay of thedaughter Po nucleus produces an alpha particle goingupward, the silicon detector will produce a pulse of thecharacteristic energy of the alpha decay. The scintillationpulse is used to start the timing sequence of the TAC,
then the silicon pulse is used to stop it. The output isrecorded by the MCA, from which the mean life can bedetermined.
The rate of accidentals during the short lifetime ofPo212 is so small that no pulse-height selection of thealpha pulses is necessary. Thus the setup shown in Fig-ure 8 should work.
Recommended settings:
• Canberra 2021 Spectroscopy Amplifier:coarse gain = 100, fine gain = 1, input polarity =+, shaping time constant = 2.0 µs, mode = ASYM,threshold = auto, output polarity = -
• Ortec 478 Power Supply: PMT Bias = +2000VDC
• Canberra 814 PAD: coarse gain = 64, fine gain= 10, amplifier input = +, preamp = IN, input tothe PREAMP IN, output from DISC OUT.
• Ortec 567 TAC: Set for a full scale timing rangeof 2µs, set the TAC inhibit = OUT
You should set the discriminator on the PAD to elim-inate the triggers from the PMT due to noise.

Id: 45.alphadecay.tex,v 1.151 2012/02/06 14:33:51 rfoote Exp 15
MCA
CRO
chan1
chan2High
Voltage
PAD Counter
TACstart
tacstopdelay cable
~10 meteramplifier
Spectroscopy Preamp
TimeCalibrator
discout
Inverter
FIG. 8. Setup for measuring the decay of Po212. The time calibrator puts out negative pulses so the input switch on thespectroscopy amplifier must be changed to negative for the calibration. The TAC is set to accept negative signals which shouldhave amplitudes greater than 2 volts.
Caution: Cover the scintillation detector withseveral layers of black cloth to stop light leaks.
X. ANALYSIS
• Identify the parent nuclides in the uraninite.
• Identify all the nuclides whose alpha decays youhave observed.
• Explain the shapes of the alpha peaks, especiallythe Po212 peak.
• Plot all the decay data and fitted decay curves, andestimate the mean or half-lives with errors.
XI. DETERMINATION OF THEENERGY-MEAN LIFE RELATION
The bottom line of this experiment is in the title: TheQuantum Mechanics of Alpha Decay. With the data inhand on the energies and lifetimes of four nuclides ofthe uranium family, you can display the energy-mean liferelation and contemplate the extraordinary dependenceof the decay rate on the barrier height and its explanationin terms of the quantum theory of barrier penetration.Be sure to re-read Section III.1 when performing thisanalysis.
The analysis of your data on energies and mean livesshould be carried out with regard for the statistical un-certainties. You should be able to determine the relativeenergies of the alpha particle groups from the silicon bar-rier detector data with uncertainties of less than 5% andthe corresponding mean lives to within 10%.
Plot the log of the mean lives versus the alpha particleenergies. Derive from your data a formula that expressesapproximately the Geiger-Nuttall relation between meanlife and energy.
Compare your experimental results with the expectedrelation from barrier penetration theory.
XII. SOME POSSIBLE THEORETICAL TOPICS
Beyond the primary references cited earlier in thelabguide, there are many references to aid you in yourdiscussions of radioactivity, alpha and beta decay, etc.Some include: [9–13].
• Barrier penetration and alpha decay.
• The Bateman equations.
• The relation between A and Z for nuclei stableagainst beta decay.
• The energy loss of charged particles in matter.
[1] http://atom.kaeri.re.kr/ton/ Table of Nuclides, Tech.Rep. (Nuclear Evaluation Lab and Korea Atomic EnergyResearch Institution and Brookhaven National Labora-
tory, 2002).[2] D. R. Lide, ed., CRC Handbook of Chemistry and
Physics, 75th ed. (CRC, 1995).
Id: 45.alphadecay.tex,v 1.151 2012/02/06 14:33:51 rfoote Exp 16
[3] A. Melissinos, Experiments in Modern Physics, 2nd ed.(Academic Press, 2003).
[4] R. Rhodes, The Making of the Atomic Bomb (Simon andSchuster, 1986).
[5] R. Gurney and E. Condon, Nature 122, 439 (1928).[6] R. Gurney and E. Condon, Physical Review 33, 127
(1929).[7] A. French and E. Taylor, An Introduction to Quantum
Physics (Norton, 1978).[8] R. Evans, The Atomic Nucleus (McGraw-Hill, 1955).[9] D. Bohm, Quantum Theory (Prentice Hall, 1951).
[10] S. Gasiorowicz, Quantum Physics, 2nd ed. (Wiley, 1996).[11] R. Liboff, Introduction to Quantum Mechanics (Holden-
Day, 1980).[12] I. Perlman and F. Asaro, Annual Review of Nuclear Sci-
ence 4, 157 (1954).[13] T. Kohman and N. Saito, Annual Review of Nuclear Sci-
ence 4, 401 (1954).[14] Trump-PCI-8K/2K Hardware Manual, Tech. Rep.
(EG&G Ortec, 2003).
ACKNOWLEDGMENTS
The junior lab staff would like to thank Brian A. Wiltfor his contributions to this lab guide.
Appendix A: Equipment List
Manufacturer Description URL
Canberra PIPS α-particle detector canberra.com
Canberra 802 Scintillation Counter canberra.com
Canberra 2006 Charged Particle preamp canberra.com
Canberra Amplifier canberra.com
Ortec Inverting Amplifier ortec-online.com
Constant Fraction Disc.
Coincidence Unit
Ortec Multi-Channel Analyzer ortec-online.com
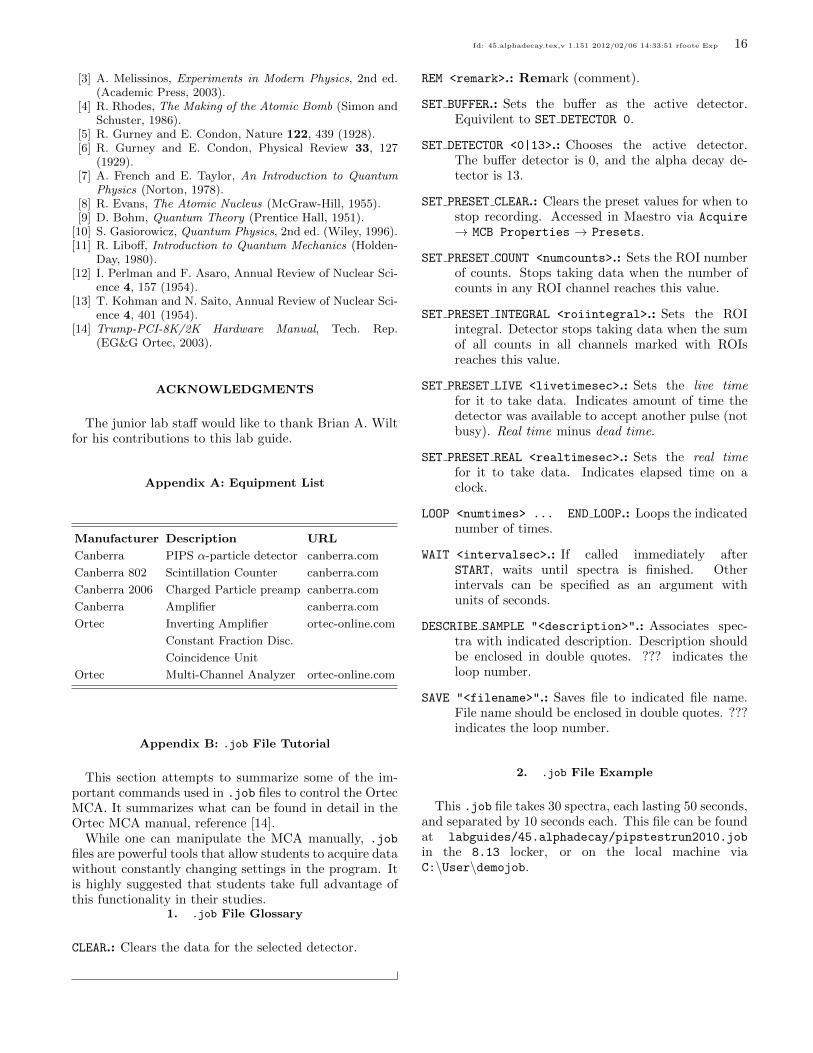
Appendix B: .job File Tutorial
This section attempts to summarize some of the im-portant commands used in .job files to control the OrtecMCA. It summarizes what can be found in detail in theOrtec MCA manual, reference [14].
While one can manipulate the MCA manually, .jobfiles are powerful tools that allow students to acquire datawithout constantly changing settings in the program. Itis highly suggested that students take full advantage ofthis functionality in their studies.
1. .job File Glossary
CLEAR.: Clears the data for the selected detector.
REM <remark>.: Remark (comment).
SET BUFFER.: Sets the buffer as the active detector.Equivilent to SET DETECTOR 0.
SET DETECTOR <0|13>.: Chooses the active detector.The buffer detector is 0, and the alpha decay de-tector is 13.
SET PRESET CLEAR.: Clears the preset values for when tostop recording. Accessed in Maestro via Acquire→ MCB Properties → Presets.
SET PRESET COUNT <numcounts>.: Sets the ROI numberof counts. Stops taking data when the number ofcounts in any ROI channel reaches this value.
SET PRESET INTEGRAL <roiintegral>.: Sets the ROIintegral. Detector stops taking data when the sumof all counts in all channels marked with ROIsreaches this value.
SET PRESET LIVE <livetimesec>.: Sets the live timefor it to take data. Indicates amount of time thedetector was available to accept another pulse (notbusy). Real time minus dead time.
SET PRESET REAL <realtimesec>.: Sets the real timefor it to take data. Indicates elapsed time on aclock.
LOOP <numtimes> ... END LOOP.: Loops the indicatednumber of times.
WAIT <intervalsec>.: If called immediately afterSTART, waits until spectra is finished. Otherintervals can be specified as an argument withunits of seconds.
DESCRIBE SAMPLE "<description>".: Associates spec-tra with indicated description. Description shouldbe enclosed in double quotes. ??? indicates theloop number.
SAVE "<filename>".: Saves file to indicated file name.File name should be enclosed in double quotes. ???indicates the loop number.
2. .job File Example
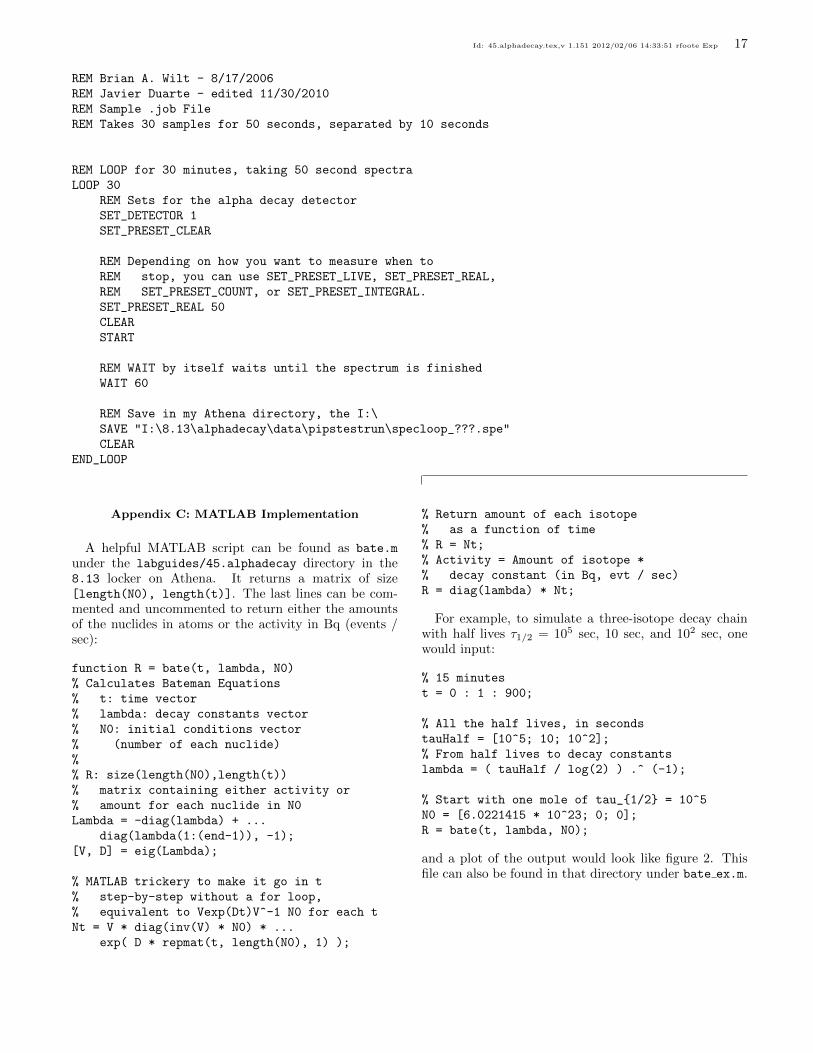
This .job file takes 30 spectra, each lasting 50 seconds,and separated by 10 seconds each. This file can be foundat labguides/45.alphadecay/pipstestrun2010.jobin the 8.13 locker, or on the local machine viaC:\User\demojob.
Id: 45.alphadecay.tex,v 1.151 2012/02/06 14:33:51 rfoote Exp 17
REM Brian A. Wilt - 8/17/2006REM Javier Duarte - edited 11/30/2010REM Sample .job FileREM Takes 30 samples for 50 seconds, separated by 10 seconds
REM LOOP for 30 minutes, taking 50 second spectraLOOP 30
REM Sets for the alpha decay detectorSET_DETECTOR 1SET_PRESET_CLEAR
REM Depending on how you want to measure when toREM stop, you can use SET_PRESET_LIVE, SET_PRESET_REAL,REM SET_PRESET_COUNT, or SET_PRESET_INTEGRAL.SET_PRESET_REAL 50CLEARSTART
REM WAIT by itself waits until the spectrum is finishedWAIT 60
REM Save in my Athena directory, the I:\SAVE "I:\8.13\alphadecay\data\pipstestrun\specloop_???.spe"CLEAR
END_LOOP
Appendix C: MATLAB Implementation
A helpful MATLAB script can be found as bate.munder the labguides/45.alphadecay directory in the8.13 locker on Athena. It returns a matrix of size[length(N0), length(t)]. The last lines can be com-mented and uncommented to return either the amountsof the nuclides in atoms or the activity in Bq (events /sec):
function R = bate(t, lambda, N0)% Calculates Bateman Equations% t: time vector% lambda: decay constants vector% N0: initial conditions vector% (number of each nuclide)%% R: size(length(N0),length(t))% matrix containing either activity or% amount for each nuclide in N0Lambda = -diag(lambda) + ...
diag(lambda(1:(end-1)), -1);[V, D] = eig(Lambda);
% MATLAB trickery to make it go in t% step-by-step without a for loop,% equivalent to Vexp(Dt)V^-1 N0 for each tNt = V * diag(inv(V) * N0) * ...
exp( D * repmat(t, length(N0), 1) );
% Return amount of each isotope% as a function of time% R = Nt;% Activity = Amount of isotope *% decay constant (in Bq, evt / sec)R = diag(lambda) * Nt;
For example, to simulate a three-isotope decay chainwith half lives τ1/2 = 105 sec, 10 sec, and 102 sec, onewould input:
% 15 minutest = 0 : 1 : 900;
% All the half lives, in secondstauHalf = [10^5; 10; 10^2];% From half lives to decay constantslambda = ( tauHalf / log(2) ) .^ (-1);
% Start with one mole of tau_{1/2} = 10^5N0 = [6.0221415 * 10^23; 0; 0];R = bate(t, lambda, N0);
and a plot of the output would look like figure 2. Thisfile can also be found in that directory under bate ex.m.

Id: 45.alphadecay.tex,v 1.151 2012/02/06 14:33:51 rfoote Exp 18
Appendix D: Naturally Occurring RadioactiveChains
See figures 9, 10, and 11 for naturally occurring ra-dioactive chains.

Id: 45.alphadecay.tex,v 1.151 2012/02/06 14:33:51 rfoote Exp 19
FIG. 9. The naturally occurring “Thorium” series. From “Nuclides and Isotopes, 15th Edition”, Reference [1].
FIG. 10. The naturally occurring “Uranium” series. From “Nuclides and Isotopes, 15th Edition”, Reference [1].

Id: 45.alphadecay.tex,v 1.151 2012/02/06 14:33:51 rfoote Exp 20
FIG. 11. The naturally occurring “Actinium” series. From “Nuclides and Isotopes, 15th Edition”, Reference [1].