the radiative impact of desert dust on orographic rain in ... · pdf filesop 1, on the...
TRANSCRIPT

Atmos. Chem. Phys., 15, 12231–12249, 2015
www.atmos-chem-phys.net/15/12231/2015/
doi:10.5194/acp-15-12231-2015
© Author(s) 2015. CC Attribution 3.0 License.
The radiative impact of desert dust on orographic rain in the
Cévennes–Vivarais area: a case study from HyMeX
C. Flamant1, J.-P. Chaboureau2, P. Chazette3, P. Di Girolamo4, T. Bourrianne5, J. Totems3, and M. Cacciani6
1Sorbonne Universités, UPMC Université Paris 06, CNRS and UVSQ, UMR 8190 LATMOS, Paris, France2Laboratoire d’Aérologie, Université of Toulouse and CNRS, Toulouse, France3LSCE, CEA-CNRS-UVSQ, Gif-sur-Yvette, France4SI-Università degli Studi della Basilicata, Potenza, Italy5CNRM, Météo-France-CNRS, Toulouse, France6Dipartimento di Fisica – Università di Roma “Sapienza”, Rome, Italy
Correspondence to: C. Flamant ([email protected])
Received: 20 July 2015 – Published in Atmos. Chem. Phys. Discuss.: 21 August 2015
Revised: 19 October 2015 – Accepted: 23 October 2015 – Published: 4 November 2015
Abstract. The study is focused on Intensive Observation
Period (IOP) 14 of the Hydrological Cycle in the Mediter-
ranean Experiment first Special Observing Period (HyMeX
SOP 1) that took place from 17 to 19 October 2012 and was
dedicated to the study of orographic rain in the Cévennes–
Vivarais (CV) target area. During this IOP a dense dust
plume originating from northern Africa (the Maghreb and
Sahara) was observed to be transported over the Balearic
Islands towards the south of France. The plume was char-
acterized by an aerosol optical depth between 0.2 and 0.8
at 550 nm, highly variable in time and space over the west-
ern Mediterranean Basin. The impact of this dust plume,
the biggest event observed during the 2-month-long HyMeX
SOP 1, on the precipitation over the CV area has been
analyzed using high-resolution simulations from the con-
vection permitting mesoscale model Meso-NH (mesoscale
non-hydrostatic model) validated against measurements ob-
tained from numerous instruments deployed specifically dur-
ing SOP 1 (ground-based/airborne water vapor and aerosol
lidars, airborne microphysics probes) as well as space-borne
aerosol products. The 4-day simulation reproduced realisti-
cally the temporal and spatial variability (including the verti-
cal distribution) of the dust. The dust radiative impact led to
an average 0.6 K heating at the altitude of the dust layer in the
CV area (and up to +3K locally) and an average 100 Jkg−1
increase of most unstable convective available potential en-
ergy (and up to +900Jkg−1 locally) with respect to a simu-
lation without prescribed dust aerosols. The rainfall amounts
and location were only marginally affected by the dust radia-
tive effect, even after 4 days of simulation. The transient na-
ture of this radiative effect in dynamical environments such
as those found in the vicinity of heavy precipitation events in
the Mediterranean is not sufficient to impact 24 h of accumu-
lated rainfall in the dust simulation.
1 Introduction
Although terrigenous dust aerosols are mobilized in arid and
semi-arid environments, they affect precipitation thousands
of kilometers away from the source regions through complex
semi-direct radiative effects (e.g., Lau et al., 2006; Huang
et al., 2006b, 2009, 2014; Solmon et al., 2008; Chaboureau
et al., 2011; Zhao et al., 2012) and indirect radiative effects
(e.g., Rosenfeld et al., 2001; van den Heever et al., 2006;
Huang et al., 2006a, 2014; Creamean et al., 2013).
Because of its proximity with the deserts of northern
Africa, the largest source of dust on Earth, the Mediterranean
Basin is regularly affected by outbreaks of dust located in the
first few kilometers of the troposphere when generated along
the coast of the Maghreb and up to 8 km altitude when dust is
transported from the deep Sahara (Alpert et al., 2004). Dust
outbreaks that reach western Europe occur mainly from late
spring to early fall (Papayannis et al., 2008; Pey et al., 2013,
and references therein) and are caused by low-pressure sys-
tems over the Atlantic and high pressures over northwestern
Published by Copernicus Publications on behalf of the European Geosciences Union.

12232 C. Flamant et al.: The radiative impact of desert dust on orographic rain
Africa (e.g., Moulin et al., 1998; Barkan et al., 2005; Escud-
ero et al., 2005; Querol et al., 2009). The transport of dust
towards the Mediterranean from the African sources is gen-
erally associated with the strong southerly winds ahead of
eastward propagating Atlantic troughs (e.g., Chaboureau et
al., 2011).
Because the regional distribution of dust during southerly
outbreaks over the Mediterranean Basin is highly variable in
time and space, the effect of dust upon the atmospheric circu-
lation and precipitation is similarly uncertain and needs to be
investigated. The direct radiative effect of dust can impact the
water cycle in two ways: through heating during the daytime
at the altitude of the dust layer and cooling near the surface,
below the dust layer. These processes yield opposite effects:
the former leads to a destabilization of the atmosphere (fa-
vorable to enhancing convection and rainfall) and the latter
leads to a stabilization. In the daytime, dust aerosols typi-
cally also reduce the net radiation impinging upon the sur-
face which results in a reduction of evaporation and in turn
of precipitation (Miller et al., 2004). In the nighttime, dust-
related forcing is much reduced with cooling being observed
as the result of the longwave forcing in the dust layer, while
warming is observed below the dust layer (e.g., Lemaître et
al., 2010). Hence, destabilization of the atmosphere can also
occur at night due to the presence of dust.
Despite the potentially significant influence of dust on the
water cycle and precipitating systems in the Mediterranean,
their radiative impact on quantitative precipitation forecasts
in this area has received little attention so far. Chaboureau
et al. (2011) investigated the radiative impact of dust on 5-
day precipitation forecasts over France during the Convec-
tive and Orographically induced Precipitation Study (COPS;
Wulfmeyer et al., 2008) and showed that skill in rain fore-
casts could be increased in the 5-day range when using a dust
prognostic scheme during dust episodes reaching Europe.
The objective of this study is to investigate – using
high-resolution simulations from the convection permit-
ting mesoscale model Meso-NH (mesoscale non-hydrostatic
model) – the radiative impact of a large dust outbreak on a se-
ries of precipitating convective systems that occurred over
the southern Massif Central in the fall of 2012, during the
first Special Observing Period of the Hydrological Cycle in
the Mediterranean Experiment (HyMeX SOP 1; Ducrocq et
al., 2014). The HyMeX SOP 1 was dedicated to improve
understanding and prediction of heavy precipitation events
(HPEs).
The study is focused on Intensive Observation Period
(IOP) 14 of the HyMeX SOP 1 which took place from 17 to
19 October 2012 and was dedicated to studying orographic
rain in the Cévennes–Vivarais (CV) target area. During this
IOP a dense mineral dust plume originating from northern
Africa (the Maghreb and Sahara) was observed to be trans-
ported towards the southern French coastline and over the
Balearic Islands and to lead to AODs (aerosol optical depths)
between 0.2 and 0.8 at 550 nm over the western Mediter-
ranean Basin and to be highly variable in time and space.
This case study was selected owing to the fact that the
dust outbreak observed during IOP 14 was the biggest event
observed in the course of the HyMeX SOP 1. It was also
chosen because only orographic rain was forecasted to occur
on the southern slopes of the Massif Central, i.e., precipita-
tion forced by orography and not embedded in large-scale
clusters such as those initiated along a cold front. Finally,
the wealth of data on the vertical distribution of dust (from
ground-based and airborne aerosol lidars and airborne micro-
physics probes) offers the great advantage of fully validating
the Meso-NH simulations, in order to obtain a simulated dust
radiative impact as realistic as possible.
The outline of the paper is the following. Section 2
presents the SOP 1 data sets as well as the space-borne prod-
ucts available during IOP 14 that are used in this study. Sec-
tion 3 describes the Meso-NH model as well as the twin sim-
ulations performed (one with prognostic dust and one with-
out dust radiative effect). Section 4 details the synoptic con-
ditions over the western Mediterranean and the associated
precipitation on the CV area, while the time evolution of the
dust outbreak over the Mediterranean during IOP 14 is pre-
sented in Sect. 5. Section 6 discusses the radiative impact of
dust on atmospheric temperature, atmospheric stability and
brightness temperature (BT) at 10.8 µm. Section 7 gives the
conclusion.
2 Data sets
2.1 Ground-based aerosol and water vapor lidars
In the framework of the HyMeX SOP 1, the atmospheric
aerosol load and moisture content was monitored over the
Mediterranean using two ground-based Raman lidar systems
operated in Menorca (Balearic Islands) and Candillargues
(near Montpellier).
The Water vapor and Aerosol Lidar (WALI; Chazette et
al., 2014) was deployed in Ciutadella (Menorca, Fig. 1)
from 17 September to 28 October 2012, collecting more
than 1000 h of measurements, distributed over 42 measure-
ment days and 10 IOPs. The lidar operates in nadir point-
ing mode with an emitted wavelength of 355 nm to fulfill
eye-safe conditions. The wide field of view of ∼ 2.3mrad
ensures a full overlap beyond 300 m. The system operates
at 20 Hz and monitors the total backscattering coefficient at
355 nm from the atmosphere, including contributions from
molecules, aerosols and clouds with a vertical resolution
of 30 m. It also monitors the cross-polarized (with respect
to laser emission) backscattering coefficient and the Raman
scattering from water vapor and nitrogen molecules. In the
following we shall analyze particle extinction coefficients at
355 nm, water vapor mixing ratios and volume depolariza-
tion ratio profiles obtained continuously from WALI from
00:00 UTC on 17 October to 00:00 UTC on 20 October. The
Atmos. Chem. Phys., 15, 12231–12249, 2015 www.atmos-chem-phys.net/15/12231/2015/

C. Flamant et al.: The radiative impact of desert dust on orographic rain 12233
Figure 1. (a) Domains of nested Meso-NH simulations with overlaid orography. The grid size of the large domain is 15 km while the grid
size of the nested domain is 2.5 km. (b) Nested domain with indications of the main orographic features as well as location of instruments
used in this study. The thick white line is the ATR 42 flight track on 18 October 2012 while the red dot represents the location of the aircraft
sounding during which remote sensing and in situ data used in this paper were acquired. The black box defines the Cévennes–Vivarais target
area (2–5◦ E, 43.2–45.5◦ N), as defined for the HyMeX SOP 1.
details of the extinction coefficient retrievals are given in
Chazette et al. (2014). The maximum range of water vapor
mixing ratio profiles derived from the zenith-pointing lidar is
∼ 6–7 and 1 km during nighttime and daytime, respectively.
It depends on the atmospheric transmission, mainly limited
by the presence of aerosols or/and clouds, as well as on the
level of background radiation associated with solar irradi-
ance.
The University of Basilicata Raman Lidar system (BASIL)
was deployed in Candillargues (Southern France, Fig. 1)
from 25 August to 5 November 2012, collecting more than
600 h of measurements, distributed over 51 measurement
days and 19 IOPs. The major feature of BASIL is repre-
sented by its capability to perform high-resolution and ac-
curate measurements of atmospheric temperature and water
vapor, both in daytime and nighttime (Di Girolamo et al.,
2004, 2009, 2015), based on the application of the pure ro-
tational and roto-vibrational Raman lidar technique, respec-
tively. Besides temperature and water vapor, BASIL also
provides measurements of the molecular, aerosol and cloud
backscatter coefficients at 355, 532 and 1064 nm, of particle
extinction coefficients at 355 and 532 nm, and of particle de-
polarization at 355 and 532 nm. In the following, we shall
analyze profiles of extinction coefficients obtained at 355 nm
and water vapor mixing ratios.
2.2 Airborne measurements
During the IOP 14 of HyMeX SOP 1, airborne in situ mea-
surements of meteorology, particles, gas, and clouds were
made onboard the SAFIRE (Service des Avions Français In-
strumentés pour la Recherche en Environnement) ATR 42
over the Mediterranean. The ATR 42 was also equipped
with the water vapor differential absorption lidar (DIAL) LE-
ANDRE 2 (Lidar Embarqué Aerosols Nuages Dynamique
Rayonnement Environnement), operating in both nadir and
zenith pointing mode.
2.2.1 Aerosol microphysics measurements
The size of the coarse particle is measured with a GRIMM
optical particle counter (OPC, model Sky 1.129) operated in-
side the cabin at 6 s time resolution and measuring the op-
tical size distributions between 0.25 and 32 µm on 31 size
classes in nominal diameter. The instrument integrates light
scattering between 30 and 150◦ at 655 nm. The flow inside
the instrument is modified by GRIMM to be constant what-
ever the pressure. The total number concentration of parti-
cles between 10 nm and 3 µm in diameter was measured us-
ing a butanol-based condensation nucleus counter (CPC, TSI
model 3772). The CPC sample flow is controlled by a critical
orifice so flow is constant whatever the sample pressure. Both
instruments are installed behind the isokinetic and isoax-
ial aerosol sample inlet which has a 4.3 µm diameter cutoff
size. Particle-phase species were sampled through a forward-
facing inlet installed in place of a side window of the aircraft.
The inlet is composed of an outer sleeve for channeling air
and a tube radius of curvature high enough to limit losses
during transport of particles (Crumeyrolle et al., 2008).
www.atmos-chem-phys.net/15/12231/2015/ Atmos. Chem. Phys., 15, 12231–12249, 2015

12234 C. Flamant et al.: The radiative impact of desert dust on orographic rain
2.2.2 Water vapor DIAL LEANDRE 2
The design of the LEANDRE 2 DIAL system and the
standard DIAL signal processing are given in Bruneau et
al. (2001) and are only briefly presented here. The system
includes a tuneable laser whose emission is positioned pre-
cisely upon an absorption line selected from two rotation–
vibration bands in the near-infrared spectrum (727–770 nm).
For operations during HyMeX, an absorption band around
730 nm was selected. As discussed in Bruneau et al. (2001),
LEANDRE 2 characteristics permit water vapor mixing ratio
measurements to be made with a precision ranging from less
than 0.1 gkg−1 in the mid-troposphere to less than 0.4 gkg−1
near the surface for an along-beam resolution of 150 m and
accumulation of 100 individual profiles (corresponding to
an along-track resolution of nearly 1 km). Systematic errors
associated with LEANDRE 2 water vapor mixing ratio re-
trievals are described in Bruneau et al. (2001). The verti-
cal distribution of the aerosols in the lower troposphere was
also documented using LEANDRE-2-derived reflectivity at
730 nm, which is mostly sensitive to aerosols with radii rang-
ing from 0.1 to 5 µm. The lidar reflectivity profiles were nor-
malized to the value of the molecular backscattering coef-
ficient (at 730 nm) at an altitude of 3.5 km above mean sea
level (km a.m.s.l.), i.e., above the observed dust plumes. The
resulting lidar-derived attenuated backscattering coefficient
profiles are used in this paper to analyze the two-dimensional
distribution of aerosol layers at high resolution (15 m in the
vertical and 1 km in the horizontal) as in Flamant et al. (2007,
2009a, b).
2.2.3 ATR 42 operations during IOP 14
During IOP 14, the ATR 42 performed a flight (flight #51,
Fig. 1) above the Gulf of Lion (see Fig. 1), between 15:35
and 19:11 UTC on 18 October. Measurements were made
at various altitudes in a 2◦× 2◦ domain (comprised be-
tween 41.5–43.5◦ N and 4–6◦ E). During that flight sequence,
the ATR 42 performed a complete sounding between 17:16
and 17:27 UTC from 3.6 to 0.3 kma.m.s.l. OPC and CPC
measurements derived from that aircraft profile will be dis-
cussed later in the paper. During the sounding, the LEAN-
DRE 2 DIAL operated in nadir pointing mode between 17:16
and 17:23 UTC. The LEANDRE 2 backscattering coefficient
profile and water vapor mixing ratio profile averaged during
this time period will be compared to the Meso-NH counter-
parts in the following.
2.3 Regional networks
The 24 h of accumulated precipitation derived from rain
gauge networks from France and Spain, processed homoge-
neously for the entire SOP 1 period, is utilized to pinpoint
the location and assess the rainfall efficiency of orographic
rain occurring during the IOP 14 in the CV area.
Aerosol optical measurements derived from several pho-
tometers of the AERONET network (available from http:
//aeronet.gsfc.nasa.gov/) have also been used for model vali-
dation purposes. In particular, we have used the data from the
station in La Ciutadella in Menorca (see location in Fig. 1).
2.4 Space-borne observations
The regional distribution of dust aerosols (mobilization and
transport) is described using the Moderate Resolution Imag-
ing Spectroradiometer (MODIS) Aqua AOD fields at 550 nm
available from the Giovanni web portal (http://disc.sci.gsfc.
nasa.gov/giovanni). The MODIS AOD products used are
a level 3, gridded (1◦× 1◦), daily product, representative of
the aerosol load around 13:30 UTC.
The calibrated thermal infrared BT at 10.8 µm provided by
Spinning Enhanced Visible and Infrared Imager (SEVIRI)
on board Meteosat Second Generation has also been used
to identify deep convective clouds and analyze their life cy-
cle with a 15 min temporal resolution. A threshold of 230 K
(∼−43 ◦C) on BT is used to assess the presence of deep con-
vection over the area of interest, as in Fu et al. (1990), based
on visual inspection of satellite imagery. Using a different
threshold, such as 250 K (Aoshima et al., 2008), does not
change the conclusions drawn in this study.
3 Meso-NH simulations
During the HyMeX SOP 1, 48 h dust forecasts done with
the non-hydrostatic mesoscale model Meso-NH (Lafore et
al., 1998) were provided each day using European Cen-
tre for Medium-Range Weather Forecasts (ECMWF) oper-
ational analyses and forecasts as initial and boundary condi-
tions. The model was run with 15 km horizontal grid spac-
ing over the domain with 400× 480 grid points shown in
Fig. 1. In the case of heavy precipitation over the HyMeX
SOP 1 area, the model was run with an additional inner grid
of 648×480 grid points with a grid spacing of 2.5 km (Fig. 1)
using the two-way interactive grid-nesting method (Stein et
al., 2000). The vertical grid of the two models had 62 lev-
els stretching from 60 m close to the surface to 600 m in the
upper troposphere. Subgrid-scale processes were represented
using parameterizations for surface exchanges (Masson et
al., 2013), turbulence (Cuxart et al., 2000), shallow convec-
tion (Pergaud et al., 2009), mixed-phase microphysics (Pinty
and Jabouille, 1998), subgrid clouds (Chaboureau and Bech-
told, 2005) and radiation (Mlawer et al., 1997). The parame-
terization of Bechtold et al. (2001) for deep convection was
activated for the outer grid only while the inner model was
run as a convection-permitting model.
The dust prognostic scheme described in Grini et
al. (2006) used the Dust Entrainment and Deposi-
tion (DEAD) model (Zender et al., 2003) for the calculation
of dust fluxes from wind friction speeds. Once generated into
the atmosphere, dust is then transported by the log-normal
Atmos. Chem. Phys., 15, 12231–12249, 2015 www.atmos-chem-phys.net/15/12231/2015/

C. Flamant et al.: The radiative impact of desert dust on orographic rain 12235
aerosol scheme of the ORganic and Inorganic Log-normal
Aerosols Model (ORILAM; Tulet et al., 2005) in three modes
with median radii of 0.32, 1.73 and 4.33 µm and standard de-
viations of 1.7, 1.6 and 1.5, respectively. Dust loss occurred
through sedimentation, surface deposition and scavenging.
The radiative properties of dust were obtained, in the short-
wave spectrum, from the photometers deployed during the
African Monsoon Multidisciplinary Analyses (AMMA) pro-
gramme while, in the longwave, the standard formulation of
absorption and re-emission for aerosols from the ECMWF
model was used (see Tulet et al., 2008, for more details). The
first dust forecast started at 00:00 UTC on 29 August 2012
from aerosol-free conditions. Then, dust data at the end of
a given 24 h forecast are passed as initial conditions at the
start of the next 24 h forecast.
Two simulations used in this study were run for 4 days.
The DUST simulation is the forecast initiated at 00:00 UTC
on 17 October during the HyMeX SOP 1 and integrated
for 2 more days. To quantify the radiative effects of dust,
the NODUST simulation was also initiated at 00:00 UTC
on 17 October but with all the radiative effects of dust
switched off. The assessment of cloud fields was done using
the so-called model-to-satellite approach (see Chaboureau et
al. (2008) and references within). In this approach, brightness
temperatures were computed from the model outputs using
the radiative transfer code RTTOV (Radiative Transfer for
Tiros Operational Vertical Sounder) version 8.7 (Saunders
et al., 2005) and compared to satellite observations. Previ-
ous studies (Clark and Chaboureau, 2010; Chaboureau et al.,
2012; Rysman et al., 2015, among others) have shown the
overall skill of Meso-NH to correctly predict cloud and rain
fields over the Mediterranean. The dust effect is not taken
into account in RTTOV version 8.7. It is marginal in the BTs
(a few kelvins for the window channels, e.g., Chaboureau et
al. (2007).
To assess the quality of the Meso-NH simulations, cate-
gorical scores have been widely used to quantify the match-
ing between observed and forecasted precipitation or high
clouds amounts at model grid points (e.g., Söhne et al.,
2008). Here we used the Heidke skill score (HSS), which
measures the fraction of correct forecasts after eliminating
those that would be correct due to chance. The HSS typically
lies between 0 and 1, the values for random and perfect fore-
casts, respectively. The HSS is applied to the 24 h rainfall
amounts from the rain gauge measurements and the Meso-
NH simulations to assess the HSS as a function of a rain rate
threshold.
4 Overview of IOP 14: synoptic situation and
precipitation in the CV area
On 17 October a large trough began to deepen west of the
Iberian Peninsula. As a result, the low-level flow turned to
the south over the Mediterranean Sea, bringing moist air with
orographic precipitation on the southern slope of the Massif
Central. The upper level flow over the CV area was south-
westerly. Precipitation began on the southern slope of the
Massif Central. The observed 24 h rainfall was of the order of
30–60 mm (Fig. 2a) in the form of an elongated band oriented
more or less along the upper level flow. Rainfall resulted from
the formation of a large cluster of stationary convective sys-
tems in the lee of the Pyrenees which progressively extended
northeastward over the Massif Central as observed with SE-
VIRI (Fig. 2b) at the time when BT was smallest over the CV
area.
On 18 October, the trough deepened to the southwest of
Portugal and the upper level flow over the CV area was al-
most southerly while the low-level flow turned to a more
southeasterly direction. Mainly stratiform rain fell over CV
with some short intervals of moderate rains from the Pyre-
nees to the southern fringes of the Massif Central. The ob-
served 24 h rainfall was similar to the previous day, with
maxima in excess of 75 mm over the Pyrenees and the Cor-
bières (Fig. 2c). Orographic rain in this region was the re-
sult of low-level southeasterly flow impinging on the topog-
raphy at the coast. The strong southeasterly flow (in excess
of 15 ms−1) was caused by low-level convergence over the
Gulf of Lion associated with the merging of three easterly
flows: an easterly flow from the Tyrrhenian defected north
of Corsica along the coastline, a southeasterly flow acceler-
ated in the strait between Corsica and Sardinia and a south-
easterly flow deflected south of Sardinia (not shown). An
extended cluster of deep convective systems was observed
with SEVIRI over the Massif Central, which was oriented
southwest–northeast, as on the previous day (Fig. 2d).
On 19 October, a cutoff was isolated on the southern
part of the elongated trough near Portugal. The active cold
front moved from central to eastern Spain and southwest-
ern France, the upper-level flow being southerly over the CV
area. As on 18 October, the low-level flow over the Gulf of
Lion was strong and oriented almost easterly. Ahead of the
front, there was an increase of precipitation on CV with per-
sistent orographic rains in a more unstable air mass. Amounts
of precipitation on the Pyrenees, the Corbières and southern
slopes of the Massif Central ranged from 30 to 60 mm, on av-
erage, reaching locally 60–80 mm (Fig. 2e). The largest 24 h
rainfall amounts (in excess of 150 mm) were observed in the
Pyrenees, just south of the city of Lourdes. A broad region
of rainfall amounts in excess of 100 mm was also observed
north of the French–Spanish border, upstream of Lourdes.
SEVIRI observations did not highlight any significant deep
convective systems in the CV area, as opposed to in south-
western France (Fig. 2f).
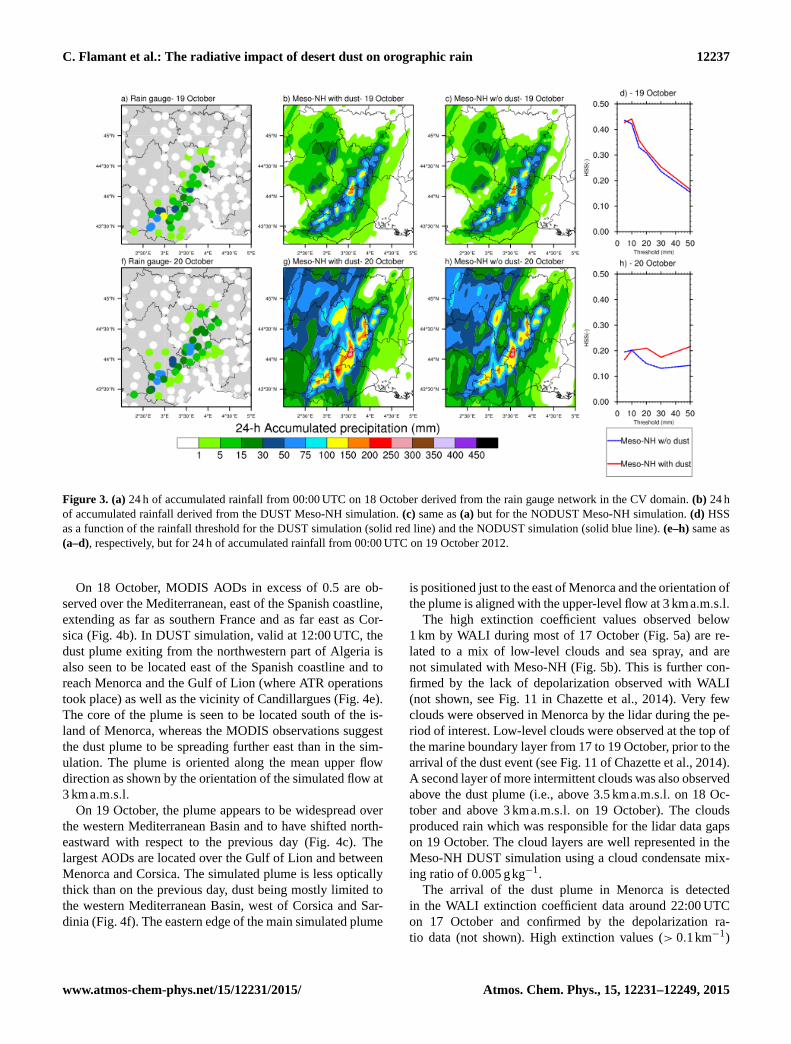
The 24 h of accumulated precipitation from 00:00 UTC on
18 October to 00:00 UTC on 19 October derived from the
rain gauge network in the CV area is shown in Fig. 3a to-
gether with its counterparts derived from DUST (Fig. 3b)
and NODUST (Fig. 3c). Both simulations represent the main
features of the rainfall pattern, but only small differences are
seen between the 24 h of accumulated rain from the two sim-
www.atmos-chem-phys.net/15/12231/2015/ Atmos. Chem. Phys., 15, 12231–12249, 2015

12236 C. Flamant et al.: The radiative impact of desert dust on orographic rain
Figure 2. Left column: 24 h rainfall amounts (from 00:00 UTC) derived from rain gauge measurements on (a) 17 October, (c) 18 October and
(e) 19 October 2012. The thick black line delineates the CV area (2–5◦ E, 43.2–45.5◦ N). Right column: brightness temperature at 10.8 µm
derived from SEVIRI at (b) 23:00 UTC on 17 October, (d) 12:00 UTC on 18 October and (f) 06:00 UTC of 19 October 2012. The SEVIRI
images are shown for the time when BT is smallest over the CV area. The white line delineates the CV area.
ulations. The HSS analysis shows that DUST represents a bit
more realistically the intermediate rainfall intensity range
(i.e., around 30 mm) than NODUST (Fig. 3d). Similar find-
ings are found for the following day, i.e., for 24 h of accumu-
lated precipitation between 00:00 UTC on 19 October and
00:00 UTC on 20 October (Fig. 3e–h). Larger values are ob-
served and simulated with respect to the previous day as seen
in the observations (Fig. 3e) and in the DUST and NODUST
simulations (Fig. 3f and g, respectively). The HSS values
for the DUST simulation are appreciably larger than their
NODUST counterpart (Fig. 3h), unlike on the previous day
(Fig. 3d). On the other hand, the HSS for the rainfall intensity
range between 5 and 40 mm is smaller than for the previous
24 h, while the HSS for large rain rates is larger (Fig. 3h).
In order to understand whether this is related to the over-
all quality of the dust simulation, in the next section we dis-
cuss the origin and evolution of the intense dust event ob-
served over the Mediterranean during IOP 14 and compare
the DUST simulation to a suite of ground-based, airborne
and space-borne observations.
5 Dust transport over the Mediterranean during
IOP 14
Over the Mediterranean, rather low MODIS-derived AODs
(less than 0.2 at 550 nm) were observed on 17 October
(Fig. 4a). The highest AOD values were observed north of
Morocco and Algeria, east of the Gibraltar Strait. The re-
trievals over the area are impaired by the presence of clouds
ahead of the approaching trough. In DUST simulation, valid
at 12:00 UTC (Fig. 4d), the largest AOD values are restricted
to northern Africa, suggesting that the northward transport of
dust is slightly delayed in the simulation.
Atmos. Chem. Phys., 15, 12231–12249, 2015 www.atmos-chem-phys.net/15/12231/2015/
C. Flamant et al.: The radiative impact of desert dust on orographic rain 12237
Figure 3. (a) 24 h of accumulated rainfall from 00:00 UTC on 18 October derived from the rain gauge network in the CV domain. (b) 24 h
of accumulated rainfall derived from the DUST Meso-NH simulation. (c) same as (a) but for the NODUST Meso-NH simulation. (d) HSS
as a function of the rainfall threshold for the DUST simulation (solid red line) and the NODUST simulation (solid blue line). (e–h) same as
(a–d), respectively, but for 24 h of accumulated rainfall from 00:00 UTC on 19 October 2012.
On 18 October, MODIS AODs in excess of 0.5 are ob-
served over the Mediterranean, east of the Spanish coastline,
extending as far as southern France and as far east as Cor-
sica (Fig. 4b). In DUST simulation, valid at 12:00 UTC, the
dust plume exiting from the northwestern part of Algeria is
also seen to be located east of the Spanish coastline and to
reach Menorca and the Gulf of Lion (where ATR operations
took place) as well as the vicinity of Candillargues (Fig. 4e).
The core of the plume is seen to be located south of the is-
land of Menorca, whereas the MODIS observations suggest
the dust plume to be spreading further east than in the sim-
ulation. The plume is oriented along the mean upper flow
direction as shown by the orientation of the simulated flow at
3 kma.m.s.l.
On 19 October, the plume appears to be widespread over
the western Mediterranean Basin and to have shifted north-
eastward with respect to the previous day (Fig. 4c). The
largest AODs are located over the Gulf of Lion and between
Menorca and Corsica. The simulated plume is less optically
thick than on the previous day, dust being mostly limited to
the western Mediterranean Basin, west of Corsica and Sar-
dinia (Fig. 4f). The eastern edge of the main simulated plume
is positioned just to the east of Menorca and the orientation of
the plume is aligned with the upper-level flow at 3 kma.m.s.l.
The high extinction coefficient values observed below
1 km by WALI during most of 17 October (Fig. 5a) are re-
lated to a mix of low-level clouds and sea spray, and are
not simulated with Meso-NH (Fig. 5b). This is further con-
firmed by the lack of depolarization observed with WALI
(not shown, see Fig. 11 in Chazette et al., 2014). Very few
clouds were observed in Menorca by the lidar during the pe-
riod of interest. Low-level clouds were observed at the top of
the marine boundary layer from 17 to 19 October, prior to the
arrival of the dust event (see Fig. 11 of Chazette et al., 2014).
A second layer of more intermittent clouds was also observed
above the dust plume (i.e., above 3.5 kma.m.s.l. on 18 Oc-
tober and above 3 kma.m.s.l. on 19 October). The clouds
produced rain which was responsible for the lidar data gaps
on 19 October. The cloud layers are well represented in the
Meso-NH DUST simulation using a cloud condensate mix-
ing ratio of 0.005 gkg−1.
The arrival of the dust plume in Menorca is detected
in the WALI extinction coefficient data around 22:00 UTC
on 17 October and confirmed by the depolarization ra-
tio data (not shown). High extinction values (> 0.1km−1)
www.atmos-chem-phys.net/15/12231/2015/ Atmos. Chem. Phys., 15, 12231–12249, 2015

12238 C. Flamant et al.: The radiative impact of desert dust on orographic rain
Figure 4. Top panels: MODIS Aqua-derived AOD at 13:30 UTC on (a) 17 October, (b) 18 October and (c) 19 October 2012. Meso-NH
DUST simulation of AOD at 12:00 UTC on (d) 17 October, (e) 18 October and (f) 19 October 2012. Bottom panels: the simulated horizontal
wind field at 3 kma.m.s.l. (vectors) is superimposed on panels (d–f) with the scale of the vectors given in the upper right corner of the panels.
The blue solid line indicates the position of the vertical cross sections shown in Fig. 8. The black box shows the CV area.
are seen between 0.2 and 2 kma.m.s.l. until 19 October
00:00 UTC and then between 0.2 and 4.5 km until 19 Oc-
tober 12:00 UTC. Later that day, the vertical extent of the
dust plume is seen to decrease with time until 00:00 UTC on
20 October. Low-level dust observed on 18 October suggests
dust emission at the coast of northern Africa, while elevated
dust observed on 19 October suggests transport from more
remote locations such as southern Algeria.
In the simulation, the arrival of the low-level dust in
Menorca is seen at approximately the same time as in the
observations. The general structure of the dust plume is re-
produced by the simulation, in particular the two deeper parts
of the plume observed at 12:00 UTC on 18 October and
06:00 UTC on 19 October, even though being simulated ∼
6h ahead (i.e., 06:00 UTC on 18 October and 00:00 UTC on
19 October) of their observed counterparts. This is confirmed
by the measurements from the sunphotometer in Menorca
showing large AOD values around 12:00 UTC on 18 Octo-
ber which compare well with WALI observations but trail
the Meso-NH AOD peak by ∼ 6h (Fig. 5e). Also, the end of
the dust episode is simulated ∼ 6h prior to the one observed
with the AERONET and ∼ 3h prior to the one derived from
WALI. Finally, on average, the modeled AOD is biased high
against the WALI observations during the period of the dust
event. The water vapor mixing ratio data from WALI show
a descending tongue of dry air (likely associated with the
tropopause folding ahead of the approaching trough) intrud-
ing in the lower troposphere between 21:30 UTC on 17 Octo-
ber and 07:00 UTC on 18 October (Fig. 5c). A similar feature
is seen in the simulation to start at the same time and altitude
(i.e., 3 kma.m.s.l.) as in the observations but to descend to
2 km much faster than in the observations. The depth of the
marine boundary layer is also simulated to be deeper than in
the WALI observations during the dust event.
Figure 6a shows the BASIL-derived profiles of the extinc-
tion coefficient at 355 nm over Candillargues during IOP 14.
The presence of low-level clouds at the top of the PBL
(planetary boundary layer) prevented extinction coefficient
retrievals for most of the period of interest, except on 18 Oc-
tober. The arrival of dust in Candillargues is observed around
04:00 UTC on 18 October in BASIL extinction data as also
confirmed by the volume depolarization ratio measurements
(not shown). Typical dust extinction values are found to be
on the order of 0.1 km−1 at 532 nm, i.e., much less than the
values observed in the upper part of the moist PBL prior
to 04:00 UTC (in excess of 0.25 km−1). The larger values
are caused by clouds which were more numerous in Candil-
largues than in Menorca, as evidenced from the cloud mask
Atmos. Chem. Phys., 15, 12231–12249, 2015 www.atmos-chem-phys.net/15/12231/2015/

C. Flamant et al.: The radiative impact of desert dust on orographic rain 12239
Figure 5. Time–height series of extinction coefficients derived from (a) WALI at 355 nm and (b) the Meso-NH DUST simulation – valid
for the spectral range 0.25–0.44 µm – over Menorca between 00:00 UTC on 17 October and 00:00 UTC on 20 October 2012. Data gaps in
(a) appear in white and are due to rain. (c) and (d) same as (a) and (b) but for the water vapor mixing ratio. The cloud layers in the Meso-NH
DUST simulation are shown using a cloud condensate mixing ratio of 0.005 gkg−1 (white contours in b and black contours in d). (e) AOD
evolution for the same time period as derived from WALI (blue solid line), AERONET (at 340 nm, black solid line), MODIS (grey solid
line) and the Meso-NH DUST simulation (red solid line). Error bars on the AOD retrievals are ±0.03 and ±0.02 for AERONET and WALI
retrievals, respectively.
derived from the lidar data in Fig. 6a. Low-level clouds are
observed at the top of the boundary layer at the beginning
of the dust event on 18 October, as well as at the top of the
dust plume later on. The Meso-NH simulation also shows the
presence of a thick cloud condensate layer at the top of the
boundary layer, which looks more contiguous than in the ob-
servations and the clouds above 3 kma.m.s.l., as in Menorca.
As observed in Menorca with WALI, the depth of the PBL
decreases with the arrival of the dust, the large extinction val-
ues observed in the lower part of the PBL not being related to
dust but rather to continental aerosols and low-level clouds.
The dust layer is observed between 1 and 2.5 kma.m.s.l. un-
til 11:00 UTC. The vertical extent of the dust plume is seen
to increase significantly afterwards until the early hours of
19 October and to reach 4 kma.m.s.l. The largest extinction
coefficient values are observed near the top of the plume.
Very dry air is seen to be associated with the dust plume (wa-
ter vapor mixing ratio less than 5 gkg−1), while the PBL in
Candillargues is characterized by water vapor mixing ratios
on the order of 10 gkg−1 or more (Fig. 6e). Overall, Meso-
NH overestimates the depth of the PBL and the water vapor
mixing ratio values in the PBL during most of 18 October
(Fig. 6e). Nevertheless, the structure of the dust plume is well
depicted by the Meso-NH DUST simulation (Fig. 6d).
The dust layer is also observed in the LEANDRE 2
data acquired above the Gulf of Lion between 17:16 and
17:23 UTC on 18 October (Fig. 7d, f). The presence of dust
is observed above 2 kma.m.s.l. (as in Candillargues further
north). Strong backscattering coefficients associated with the
dust are observed in a 700 m deep layer generally around
42◦ N, 5.2◦ E (Fig. 7f). The comparison is carried out with
a Meso-NH profile extracted from DUST at a later time (i.e.,
21:00 UTC) and approximately 100 km north of the position
of the aircraft profile (see the locations “dst” and “obs” in
www.atmos-chem-phys.net/15/12231/2015/ Atmos. Chem. Phys., 15, 12231–12249, 2015

12240 C. Flamant et al.: The radiative impact of desert dust on orographic rain
Figure 6. Time–height series of extinction coefficients derived from (a) BASIL at 355 nm and (b) the Meso-NH DUST simulation – valid
for the spectral range 0.25–0.44 µm – over Candillargues between 00:00 UTC on 17 October and 00:00 UTC on 20 October 2012. Missing
BASIL data appear in white. (c) Same as (b) but for dust aerosol concentration derived from the Meso-NH DUST simulation. (d) and (e) same
as (a) and (b) but for the water vapor mixing ratio. The cloud layers in the Meso-NH DUST simulation are shown using a cloud condensate
mixing ratio of 0.005 gkg−1 (white contour in b and black contour in d). The cloud mask in (a) and (c) is based on the BASIL extinction
coefficient, using a threshold of 0.25 km−1. Hence, the presence of clouds is shown by the white contours in (a) and the black contours in (d),
respectively. The cloud layers in the Meso-NH DUST simulation are shown using a cloud condensate mixing ratio of 0.005 gkg−1 (white
contours in b and black contours in d and e).
Fig. 7k). The selected profile was the best match obtained
with the LEANDRE-2-observed dust plume. The best match
is obtained by minimizing the difference between the lidar-
derived backscattering coefficient profiles, averaged over the
cross sections shown in Fig. 7a, and Meso-NH profiles at grid
points in the vicinity of the observations. Because we do not
expect the simulation to give the best comparison at the exact
location of the observations, we have compared systemati-
cally all Meso-NH profiles within a distance of 150 km of the
observations and selected the profile exhibiting the smallest
difference. High backscattering values observed with LEAN-
DRE 2 below 0.5 kma.m.s.l. (Fig. 7d) are related to the pres-
ence of sea-salt aerosols in the marine boundary layer and
hence are not reproduced in the dust simulation (Fig. 7e). The
simulation also shows the presence of a second dust layer
above 3.5 kma.m.s.l. (Fig. 7f), which is observed only at the
beginning of the aircraft profile to be slightly lower than in
the simulation (Fig. 7d). This elevated layer was observed
with LEANDRE 2 in other parts of the flight and with BASIL
in Candillargues (not shown).
The marine boundary layer in the Meso-NH simulation is
characterized by an average water vapor mixing ratio value
of 11 gkg−1 (Fig. 7b, c), i.e., the model is moist biased by
about 1 gkg−1 when compared to the LEANDRE 2 observa-
tions (Fig. 7a). The comparison is carried out with a Meso-
NH profile extracted from the dust simulation at a later time
(i.e., 21:00 UTC) and approximately 70 km north of the po-
sition aircraft profile (see the location “dry” and “obs”, re-
spectively in Fig. 7l). The selected profile was the best match
obtained with the LEANDRE-2-observed moisture field. The
dust layer is associated with water vapor mixing ratio values
of 5 gkg−1 and is located above a drier layer (3 gkg−1), this
Atmos. Chem. Phys., 15, 12231–12249, 2015 www.atmos-chem-phys.net/15/12231/2015/

C. Flamant et al.: The radiative impact of desert dust on orographic rain 12241
Figure 7. (a) LEANDRE-2-derived water vapor mixing ratio between 17:16 and 17:23 UTC along the aircraft profile marked as “obs”
in (l). (b) Meso-NH water vapor mixing ratio at 21:00 UTC for the same horizontal extent as (a) but at the location marked as “dry” in
(l). (c) Average vertical profiles of water vapor mixing ratio from LEANDRE 2 (red solid line) and Meso-NH DUST (black solid line)
derived from (a) and (b), respectively. (k) LEANDRE-2-derived attenuated backscattering coefficient between 17:16 and 17:23 UTC along
the aircraft profile marked as “obs” in (j). (d) Meso-NH DUST backscattering coefficient at 21:00 UTC at the location marked as “dst” in (k).
(f) Average vertical profiles of backscattering coefficients from LEANDRE 2 (red solid line) and Meso-NH DUST (black solid line) derived
from (d) and (e), respectively. (g) Vertical profiles of fine-mode particle concentration from CPC measurements (red solid line) acquired
during the aircraft sounding (“obs” in k) between 17:16 and 17:27 UTC and from Meso-NH DUST (black solid line) at 21:00 UTC. (h)
Meso-NH DUST coarse-mode particle concentration at 21:00 UTC at the location marked as “dst” in (k). (i) same as (g) but for coarse-
mode particle concentration. (k) AOD field derived from the Meso-NH DUST simulation with the location of the observational and modeled
soundings overlaid. (l) Same as (k) but for the integrated water vapor content.
type of layering having already been observed during COPS
(Chaboureau et al., 2011; Behrendt et al., 2011). This drier
layer is represented in the simulation (Fig. 7b), the dust layer
being embedded in a moister environment than in the obser-
vations.
The aircraft sounding performed between 17:16 and
17:27 UTC around 42◦ N, 5.2◦ E allowed sampling in situ
the thermodynamics in the lower troposphere as well as the
characteristics of the aerosols observed by lidar below the
aircraft. Strong easterly winds (in excess of 20 ms−1) are
observed between 0.3 and 1 kma.m.s.l. and are likely gen-
www.atmos-chem-phys.net/15/12231/2015/ Atmos. Chem. Phys., 15, 12231–12249, 2015

12242 C. Flamant et al.: The radiative impact of desert dust on orographic rain
Figure 8. (a) Vertical cross section of dust concentration (color scale) and cloud condensate mixing ratio of 0.01 gkg−1 (contours) along the
transect shown in Fig. 4 from 30◦ N, 6◦W to 45◦ N, 5◦ E at 12:00 UTC on 19 October 2012. The orography is also shown (hatched areas).
(b) same as (a) but for the difference in temperature between DUST and NODUST (color scale).
erating the production of sea spray in the boundary layer
observed with LEANDRE 2. Good agreement is also found
between the in situ measurements of the water vapor mix-
ing ratio and the LEANDRE 2 retrievals between 0.3 and
3.2 kma.m.s.l.
High concentrations of coarse particles measured with the
GRIMM OPC are observed above 2 kma.m.s.l. (in excess
of 20 particlesm−3; Fig. 7i), the elevated maximum corre-
sponding to the enhanced attenuated backscattering coeffi-
cient derived from the LEANDRE 2 measurements (Fig. 7f).
The second maximum of coarse particles observed in the
marine boundary layer is related to the presence of sea-salt
aerosols, as also observed with LEANDRE 2. A maximum
of fine-mode particles (in excess of 1000 particles cm−3) is
observed with the CPC above the boundary layer and below
the dust layer (Fig. 7g), related to nucleation events in the
free troposphere as described in Rose et al. (2015). These
fine-mode aerosols are neither simulated nor observed with
LEANDRE 2, which is sensitive to larger aerosols.
6 Radiative impact of dust on convective systems and
associated precipitation
The radiative impact of desert dust on convective systems
and associated precipitation is analyzed using the Meso-NH
simulations. We shall first illustrate and discuss this impact
based on temperature and most unstable convective available
potential energy (MuCAPE) fields valid on 19 October (the
last day of IOP 14) when it is at its maximum, due to an im-
portant accumulation of dust in the simulation. The discus-
sion is then extended to the entire IOP based on the analysis
of time series of several key variables extracted in the CV
area.
The vertical structure of the dust plume along the transect
shown in Fig. 4 is shown in Fig. 8a (shaded area). It high-
lights the transport of dust over the Mediterranean between 1
and 2 km as well as the accumulation (local maximum) south
of the Pyrenees and the vertical redistribution imposed by the
clouds over the southern slopes of the Pyrenees and over the
CV area further north (cloud boundaries are marked as black
contours corresponding to a cloud condensate mixing ratio of
0.01 gkg−1). A cooling effect (∼−0.4K) is evidenced along
the southern slopes of the Pyrenees and over the CV area be-
low the dust layer when looking at the difference in the tem-
perature fields between DUST and NODUST. This cooling
may be associated with the radiative impact of dust but could
also be due to cloud shading effects and/or radiatively cooled
downdrafts below the clouds. On the other hand, warming
(∼+0.4K) is seen to be generally co-localized with dust, es-
pecially in the upper part of the dust plume as, for instance,
over Spain and over the CV area within the cloud. Hence,
dust-related warming is likely contributing to the destabiliza-
tion of air masses in the southern part of the CV area.
Fig. 9 shows the 3-hourly evolution of the difference in
temperature between the DUST and NODUST simulations
from 09:00 UTC to 18:00 UTC on 19 October 2012. The
temperature differences at 500 ma.m.s.l. (Fig. 9a–d) and
2500 ma.m.s.l. (Fig. 9e–h) are seen to be highly variable in
time and space, thereby suggesting the radiative impact of
dust to be mostly a transient effect, even though part of the
simulated variability may be due to differences in the loca-
tion of clouds between the two simulations and the related
effects (cooling due to shading, rain, cool downdrafts and
warming due to latent heat release). Figure 9i–l show the dif-
ference in cloud content between the DUST and NODUST
simulations between 09:00 and 18:00 UTC. One can note that
the differences, positive or negative, are always found within
the dust plume (see the dust plume contour highlighted by an
AOD of 0.1 in Fig. 9). This strongly suggests that the dust
is the cause of these differences. The initial disruptive ef-
fect due to dust radiative impact likely combines with other
induced effects such as the production and dissipation of
clouds, the radiative impact of clouds and cloud dynamics,
to produce non-linearly growing differences in cloud content
and temperature as seen in Fig. 9a–h. In all cases, positive
temperature differences in excess of 1.5 K can be seen in the
CV area at 500 and 2000 ma.m.s.l. but only over very lim-
ited regions. This is not entirely surprising given the fact that
large concentrations of aerosols and stationary conditions are
generally needed in order to generate significant heating and
destabilization of the atmosphere, and because these con-
Atmos. Chem. Phys., 15, 12231–12249, 2015 www.atmos-chem-phys.net/15/12231/2015/

C. Flamant et al.: The radiative impact of desert dust on orographic rain 12243
Figure 9. Top panels: 3-hourly field of difference in temperature at 500 m between the DUST and NODUST simulations between 09:00
and 15:00 UTC on 19 October (a–d). Middle panels: same as top panels but for differences in temperature at 2500 m (e–h). Middle panels:
3-hourly field of difference in cloud content (i–l). Bottom panels: as middle panels but for the difference in MuCAPE (m–p). The black line
shows the AOD of 0.1. The blue solid line indicates the position of the vertical cross sections shown in Fig. 8. The black box shows the CV
area.
ditions are very difficult to find in dynamical environments
such as those found in the vicinity of HPEs in the Mediter-
ranean.
The 3-hourly evolution of the difference in MuCAPE be-
tween DUST and NODUST from 09:00 to 18:00 UTC on
19 October is also shown in Fig. 9m–p. Large differences in
MuCAPE between the two simulations are seen at all times
over the CV area, suggesting that the radiative impact of dust
can generate substantial destabilization of the air masses;
however, the transient nature of this effect is likely not suf-
ficient to impact rainfall in DUST as shown in Fig. 3. Nev-
ertheless, it is worth noting that the largest positive values of
MuCAPE differences are always found within the dust plume
(see the dust plume contour represented by an AOD of 0.1 in
Fig. 9). Given that the only difference between the two sim-
ulations is that radiative effects of dust are switched off in
NODUST, this is an indication that dust is in large part re-
sponsible for the modification in the MuCAPE distribution.
www.atmos-chem-phys.net/15/12231/2015/ Atmos. Chem. Phys., 15, 12231–12249, 2015

12244 C. Flamant et al.: The radiative impact of desert dust on orographic rain
Figure 10. (a) 3-hourly evolution of the maximum MuCAPE differ-
ence (dashed blue line) in the CV domain and the MuCAPE differ-
ence averaged over the CV domain (solid red line) between DUST
and NODUST from 00:00 UTC on 17 October to 00:00 UTC on
21 October 2012. (b) same as (a) but for the temperature difference
at 2.5 kma.m.s.l. (c) same as (b) but at 500 a m.s.l. (d) 3-hourly evo-
lution of the minimum 10.8 µm BT in NODUST (dashed blue line)
and in DUST (solid red line) in the CV domain. The dotted line is
the minimum BT in the CV area observed with SEVIRI. (e) same
as (d) but for the 10.8 µm BT averaged over the CV domain.
Furthermore, MuCAPE can be viewed as an integrator of all
stabilization/destabilization effects in the atmosphere (as op-
posed to temperature) and is easier to interpret than fields
of DUST/NODUST temperature differences whose interpre-
tation can differ between daytime and nighttime and in the
presence of key features of the water cycle, i.e., clouds and
water vapor.
We now look at these processes in a more systematic way
over the CV area during IOP 14. Because the air masses at
different levels are moving quickly in and out of the CV area,
looking at the maximum values of MuCAPE or minimum
values of BT is the most effective way of tracking a convec-
tive cell within the domain of interest.
The radiative impact of dust on atmospheric stability in
the CV domain can be seen in Fig. 10a. The maximum Mu-
CAPE difference between DUST and NODUST shows an
increasing trend from 0 Jkg−1 on 17 October to 900 Jkg−1
on average on 20 October 2012, with several maxima in ex-
cess of 1200 Jkg−1. This indeed suggests that dust can play
a role in destabilizing the atmosphere at a small scale. This
is corroborated by the trend in the maximum difference of
temperature at 2 m between DUST and NODUST, which ex-
hibits an increasing trend between 0 at the beginning of 17
October and ∼ 4K around 12:00 UTC on 20 October 2012
(Fig. 10c). During the same period, the maximum tempera-
ture difference at 2.5 km, i.e., the maximum height of the dust
plume transported over the Mediterranean, is also simulated
to increase from 0 to 3 K, suggesting strong destabilization
of the atmosphere over the CV area (Fig. 10b) even though
the maximum at 2 m a.m.s.l. and 2.5 kma.m.s.l. may not nec-
essarily be coincident in location.
When looking at these quantities averaged over the CV
domain it appears that the differences in MuCAPE and tem-
perature are much reduced, either because of a small num-
ber of grid cells impacted by strong destabilization or due to
a compensating effect between grid cells with strong desta-
bilization and strong stabilization. In all cases, the average
temperature difference at 2 m is almost zero throughout the
length of the simulation, whereas a slight positive value of
the temperature difference at 2.5 km is simulated (0.6 K af-
ter 12:00 UTC on 20 October) and small differences in Mu-
CAPE (reaching +100Jkg−1 at most) are simulated only on
20 October. This suggests an overall very weak radiative im-
pact on atmospheric stability in the CV area.
When analyzing the time series of average BT from SE-
VIRI over the CV area (Fig. 10e), two periods can be dis-
tinguished: first a 2-day period (17 and 18 October) in which
averaged BTs are lower than during the second 2-day (19 and
20 October), suggesting that the 17–18 October period was
impacted by more widespread convection as shown for the
afternoon of 17 October in Fig. 11. While SEVIRI shows that
a deep convective cell forms to the northeast of the Pyrenees
(18:00 UTC on 17 October) before moving into the CV area
(00:00 UTC on 18 October), the convection remains close to
the northern Pyrenees and extends towards CV in DUST and
NODUST, thereby yielding higher BT values over the CV
area than in the observations. The dust and dust-free simula-
tions produce similar averaged BTs on 17 and 18 October
and only slightly different averaged BTs on the following
2 days (Fig. 10e). Moreover, there are no systematic differ-
ences between the averaged BTs from the two simulations,
suggesting that dust radiative impact is generally negligible
over the domain. Furthermore, the averaged BTs in simu-
lations exhibit a decreasing trend over the 4 days, suggest-
ing a reinforcement of convection over the CV area, unlike
what is observed with SEVIRI. This decreasing trend is also
Atmos. Chem. Phys., 15, 12231–12249, 2015 www.atmos-chem-phys.net/15/12231/2015/

C. Flamant et al.: The radiative impact of desert dust on orographic rain 12245
Figure 11. Top panels: 3-hourly field of BT at 10.8 µm between 15:00 UTC on 17 October and 00:00 UTC on 18 October 2012. Middle
panels: same as top panels but for BT extracted from DUST. Bottom panels: same as middle panels but for BT extracted from NODUST.
The white box shows the CV area.
detectable in the temporal evolution of the minimum BTs,
which was also always found below the 230 K threshold, ex-
cept on 17 October. On the other hand, as observed for the
averaged BTs, the evolution of the minimum of BTs shows a
contrasting trend, i.e., larger values at the end of IOP 14 than
at the beginning. This is corroborated by the SEVIRI im-
agery for the afternoon of 19 October (Fig. 12), which shows
nearly deep-convection-free conditions over the CV area, as
opposed to what is seen in the DUST and NODUST simula-
tions in which isolated deep convection is present along the
northern edge of the CV area.
7 Summary, discussion and conclusions
The direct radiative impact of a moderately intense dust
plume (AOD between 0.2 and 0.8 at 550 nm) from northern
Africa on precipitation over the southern fringes of the Mas-
sif Central was investigated during IOP 14 of the HyMeX
SOP 1. A high-resolution mesoscale simulation with prog-
nostic dust, validated against numerous ground-based, air-
borne and space-borne aerosol data sets, was used to as-
sess the dust radiative impact by comparison with a high-
resolution simulation that took no dust effects into account.
The simulation with prognostic dust was first shown to
simulate the most intense dust plume observed during the
HyMeX SOP 1, in terms of spatiotemporal variability but
also, and more importantly, in terms of vertical distribution
and dust aerosol concentration. Comparison against satellite-
based observations of deep convection in the CV area re-
vealed that the model did not always produce isolated con-
vection and mesoscale convective systems in the right place
and that it underestimated (overestimated) the cloud cover as-
sociated with deeper clouds, as yielded by the simulated BT
at 10.8 µm, during the first (last) part of IOP 14. Nevertheless,
the structure of the 24 h of accumulated rainfall pattern was
found to be consistent with that derived from observations
made with an extended network of rain gages.
The radiative impact of dust on orographic rain occurring
over the CV area during IOP 14 was shown to be large in
some instances (up to +3K in the lower troposphere and
up to 900 Jkg−1 for MuCAPE), highly variable in time and
space, and limited to small parts of the CV area. The radia-
tive impact of dust at a given time was shown to be small
on average over the CV area due to compensating effects:
areas in which dust leads to the destabilization of the atmo-
spheric column, thereby favoring deep convection, were gen-
www.atmos-chem-phys.net/15/12231/2015/ Atmos. Chem. Phys., 15, 12231–12249, 2015

12246 C. Flamant et al.: The radiative impact of desert dust on orographic rain
Figure 12. Same as Fig. 11 but for the afternoon of 19 October.
erally seen surrounded by even larger areas in which dust was
seen to stabilize the atmosphere. Part of the simulated vari-
ability is likely due to differences in the location of clouds
between the two simulations and the related effects (cooling
due to shading, rain and cool downdrafts, and warming due
to latent heat release). The rather small radiative impact is
thought to be due to the relatively small AODs associated
with the dust plume (even though these were the largest ob-
served over the western Mediterranean during the SOP 1)
but also to the transient nature of the forcing. Because oro-
graphic rain of the CV area during IOP 14 occurred in a very
dynamic environment (as is often the case with heavy pre-
cipitation events in the Mediterranean area during the fall),
the fast moving, dust-laden, lower tropospheric flow did not
allow for radiative impact to build up in any part of the CV
area in order to lead to sustained destabilization of the at-
mospheric column. Nevertheless, the largest positive values
of MuCAPE differences were always found within the dust
plume, an indication that the dust’s direct radiative effect is
partly responsible for the modification in the MuCAPE dis-
tribution.
In order to verify our hypothesis that the transient nature
of the dust radiative forcing is what is limiting the impact
on atmospheric stability, even under the influence of a very
dense dust plume, we have designed further simulations (not
presented in this work) in which the dust aerosol concentra-
tion artificially increased by a factor of 40 the emissions over
northern Africa. The resulting AODs and aerosol concentra-
tions over the Mediterranean were simulated to be twice as
large as simulated and observed during IOP 14. The radia-
Atmos. Chem. Phys., 15, 12231–12249, 2015 www.atmos-chem-phys.net/15/12231/2015/

C. Flamant et al.: The radiative impact of desert dust on orographic rain 12247
tive impact was found to be slightly larger and to affect more
significantly temperature in the lower troposphere and Mu-
CAPE, but the overall the structure of the precipitation ob-
served and simulated during IOP 14 (Fig. 3) remained un-
changed. In this dust-enhanced simulation, the transient as-
pect of the radiative forcing resulting from the dynamical en-
vironment prevented any significant atmospheric destabiliza-
tion in the CV area.
Finally, in this study we only consider the radiative impact
of dust. However, there is now evidence that mineral dust al-
ters cloud microphysics and precipitation through so-called
indirect effects (e.g., the review by Tao et al., 2012, and ref-
erences therein). For instance, desert dusts have been shown
to lead to the suppression of coalescence and precipitation
processes (Rosenfeld et al., 2001). Min et al. (2009) found
that the microphysical effects of the dust aerosols could shift
the precipitation size spectrum from heavy precipitation to
light precipitation in the stratiform regions of mesoscale con-
vective systems over the Gulf of Guinea. Our analysis re-
veals that, when comparing observed and simulated BT fields
(a proxy for deep convection), opposite trends are found. For
instance, towards the end of IOP 14, when the dust plume
reaches the Mediterranean and the CV area, no deep convec-
tion is observed with SEVIRI whereas sporadic deep con-
vection is simulated in the Meso-NH DUST run. This could
be an indication that, in reality, precipitation may have been
suppressed due to the dust indirect effect, which is not ac-
counted for in the present Meso-NH simulation. Future work
should be conducted to address the indirect impact of dust on
orographic precipitation and heavy precipitation events using
the wealth of dedicated aerosol and cloud microphysics mea-
surements acquired in the framework of the HyMeX SOP 1
as well as the newly developed LIMA – Liquid, Ice, Multiple
Aerosol – scheme (Vié et al., 2015).
Acknowledgements. This work was supported by the French
Agence Nationale de la Recherche (ANR) via the IODA-MED
grant ANR-11-BS56-0005, the MUSIC grant ANR-14-CE01-014,
the MISTRALS/HyMeX programme, the French space agency
(CNES) and the Commissariat à l’Energie Atomique (CEA). Air-
borne data was obtained using the ATR-42 Environment Research
Aircraft operated and managed by Service des Avions Français
Instrumentés pour la Recherche en Environnement (SAFIRE),
which is a joint entity of CNRS, Météo-France and CNES. The
SAFIRE staff is thanked for their support during SOP 1. The
authors are grateful to D. Bruneau, P. Genau, C. Merlet, R. Mey-
nadier, T. Deleporte, S. Bastin, C. Kocha, C. Lavaysse (LATMOS),
as well as F. Blouzon and A. Abchiche (DT/INSU) for operating
the LEANDRE 2 system aboard the ATR-42 during the HyMeX
SOP 1. E. Freney (LaMP), F. Burnet and G. Momboise (CNRM)
are also thanked for operating the aerosol microphysics instruments
and for helpful discussions. We also would like to thank the two
anonymous referees for their highly relevant comments that helped
to improve the overall quality of the paper.
Edited by: J. Huang
References
Alpert, P., Kishcha, P., Shtivelman, A., Krichak, S. O., and
Joseph, J. H.: Vertical distribution of Saharan dust based on
2.5 year model predictions, Atmos. Res.,70, 109–130, 2004.
Aoshima, F., Behrendt, A., Bauer, H.-S., and Wulfmeyer, V.: Statis-
tics of convection initiation by use of Meteosat rapid scan data
during the Convection and Orographically-induced Precipitation
Study (COPS), Meteorol. Z., 17, 921–930, 2008.
Barkan, J., Alpert, P., Kutiel, H., and Kishcha, P.: Synoptics of dust
transportation days from Africa toward Italy and central Europe,
J. Geophys. Res., 110, D07208, doi:10.1029/2004JD005222,
2005.
Bechtold, P., Bazile, E., Guichard, F., Mascart, P., and Richard, E.:
A mass flux convection scheme for regional and global models,
Q. J. Roy. Meteor. Soc., 127, 869–886, 2001.
Behrendt, A., Pal, S., Aoshima, F., Bender, M., Blyth, A.,
Corsmeier, U., Cuesta, J., Dick, D., Dorninger, M., Fla-
mant, C., Di Girolamo, P., Gorgas, T., Huang, Y., Kalthoff, K.,
Khodayar, S., Mannstein, H., Trümner, K., Wieser, A., and
Wulfmeyer, V.: Observation of Convection Initiation Processes
with a Suite of State-of-the-Art Research Instruments during
COPS IOP8b, Q. J. Roy. Meteor. Soc., 137, 81–100, 2011.
Bruneau, D., Quaglia, P., Flamant, C., and Pelon, J.: The Airborne
Lidar LEANDRE 2 for Water Vapor Profiling in the Troposphere.
Part II: First Results, Appl. Opt., 40, 3462–3475, 2001.
Chaboureau, J.-P. and Bechtold, P.: Statistical representation of
clouds in a regional model and the impact on the diurnal cy-
cle of convection during Tropical Convection, Cirrus and Ni-
trogen Oxides (TROCCINOX), J. Geophys. Res., 110, D17103,
doi:10.1029/2004JD005645, 2005.
Chaboureau, J.-P., Tulet, P., and Mari, C.: Diurnal cycle of dust and
cirrus over West Africa as seen from Meteosat Second Genera-
tion satellite and a regional forecast model, Geophys. Res. Lett.,
34, L02822, doi:10.1029/2006GL027771, 2007.
Chaboureau, J.-P., Söhne, N., Pinty, J.-P., Meirold-Mautner, I., De-
fer, E., Prigent, C., Pardo, J. R., Mech, M., and Crewell, S.:
A midlatitude precipitating cloud database validated with satel-
lite observations, J. Appl. Meteorol. Clim., 47, 1337–1353, 2008.
Chaboureau, J.-P., Richard, E., Pinty, J.-P., Flamant, C., Di Giro-
lamo, P., Kiemle, C., Behrendt, A., Chepfer, H., Chiriaco, M.,
and Wulfmeyer, V.: Long-range transport of Saharan dust and its
radiative impact on precipitation forecast over western Europe:
a case study during the Convective and Orographically induced
Precipitation Study (COPS), Q. J. Roy. Meteor. Soc., 137, 236–
251, 2011.
Chaboureau, J.-P., Pantillon, F., Lambert, D., Richard, E., and
Claud, C.: Tropical transition of a Mediterranean storm by jet
crossing, Q. J. Roy. Meteor. Soc., 138, 596–611, 2012.
Chazette, P., Marnas, F., and Totems, J.: The mobile Water vapor
Aerosol Raman LIdar and its implication in the framework of the
HyMeX and ChArMEx programs: application to a dust transport
process, Atmos. Meas. Tech., 7, 1629–1647, doi:10.5194/amt-7-
1629-2014, 2014.
Clark, H. and Chaboureau, J.-P.: Uncertainties in short-term fore-
casts of a Mediterranean heavy precipitation event: assessment
with satellite observations, J. Geophys. Res., 115, D22213,
doi:2010JD014388, 2010.
Creamean, J. M., Suski, K. J., Rosenfeld, D., Cazorla, A., De-
mott, P. J., Sullivan, R. C., White, A. B., Ralph, F. M.,
www.atmos-chem-phys.net/15/12231/2015/ Atmos. Chem. Phys., 15, 12231–12249, 2015

12248 C. Flamant et al.: The radiative impact of desert dust on orographic rain
Minnis, P., Comstock, J. M., Tomlinson, J. M., and Prather,
K. A.: Dust and biological aerosols from the Sahara and
Asia influence in the Western US, Science, 29, 1572–1578,
doi:10.1126/science.1227279, 2013
Crumeyrolle, S., Gomes, L., Tulet, P., Matsuki, A., Schwarzen-
boeck, A., and Crahan, K.: Increase of the aerosol hygroscop-
icity by cloud processing in a mesoscale convective system: a
case study from the AMMA campaign, Atmos. Chem. Phys., 8,
6907–6924, doi:10.5194/acp-8-6907-2008, 2008.
Cuxart, J., Bougeault, P., and Redelsperger, J. L.: A turbulence
scheme allowing for mesoscale and large-eddy simulations. Q.
J. Roy. Meteor. Soc., 126, 1–30, 2000.
Di Girolamo, P., Marchese, R., Whiteman, D. N., and De-
moz, B. B.: Rotational Raman Lidar measurements of atmo-
spheric temperature in the UV, Geophys. Res. Lett., 31, L01106,
doi:10.1029/2003GL018342, 2004.
Di Girolamo, P., Summa, D.,and Ferretti, R.: Multiparameter Ra-
man Lidar measurements for the characterization of a dry strato-
spheric intrusion event, J. Atmos. Ocean. Tech., 26, 1742–1762,
2009.
Di Girolamo, P., Flamant, C., Cacciani, M., Richard, E.,
Ducrocq, V., Summa, D., Stelitano, D., Fourrié, N., and Said, F.:
Observation of low-level wind reversals over the Gulf of Lion
and their impact on the water vapor variability, Q. J. Roy. Me-
teor. Soc., in review, 2015.
Escudero, M., Castillo, S., Querol, X., Avila, A., Alarcon, M.,
Viana, M. M., Alastuey, A., Cuevas, E., and Rodriguez, S.: Wet
and dry African dust episodes over Eastern Spain, J. Geophys.
Res., 110, D18S08, doi:10.1029/2004JD004731, 2005.
Flamant, C., Chaboureau, J.-P., Parker, D. J., Taylor, C. M., Cam-
mas, J.-P., Bock, O., Timouck, F., and Pelon, J.: Airborne ob-
servations of the impact of a convective system on the planetary
boundary layer thermodynamics and aerosol distribution in the
inter-tropical discontinuity region of the West African Monsoon,
Q. J. Roy. Meteor. Soc., 133, 1175–1189, doi:10.1002/qj.97,
2007.
Flamant, C., Knippertz, P., Parker, D., Chaboureau, J.-P.,
Lavaysse, C., Agusti-Panareda, A., and Kergoat, L.: The impact
of a mesoscale convective system cold-pool on the northward
propagation of the inter-tropical discontinuity over West Africa,
Q. J. Roy. Meteor. Soc., 135, 139–165, 2009a.
Flamant, C., Lavaysse, C., Todd, M., Chaboureau, J.-P., and
Pelon, J.: Multi-platform observations of a springtime case of
Bodélé and Sudan dust emission, transport and scavenging over
West Africa, Q. J. Roy. Meteor. Soc., 135, 413–430, 2009b.
Fu, R., Del Genio, A., and Rossow, W. B.: Behavior of deep con-
vective clouds in the tropical Pacific from ISCCP radiances, J.
Climate, 3, 1129–1152, 1990.
Grini, A., Tulet, P., and Gomes, L.: Dusty weather forecasts using
the MesoNH mesoscale atmospheric model. J. Geophys. Res.,
111, D19205, doi:10.1029/2005JD007007, 2006.
Huang, J., Lin, B., Minnis, P., Wang, T., Wang, X., Hu, Y.,
Yi, Y., and Ayers, K.: Satellite-based assessment of possible dust
aerosols semi-direct effect on cloud water path over East Asia,
Geophys. Res. Lett., 33, L19802, doi:10.1029/2006GL026561,
2006a.
Huang, J., Minnis, P., Lin, B., Wang, T., Yi, Y., Hu, Y., Sun-
Mack, S., and Ayers, K.: Possible influences of Asian dust
aerosols on cloud properties and radiative forcing observed
from MODIS and CERES, Geophys. Res. Lett., 33, L06824,
doi:10.1029/2005GL024724, 2006b.
Huang, J., Fu, Q., Su, J., Tang, Q., Minnis, P., Hu, Y., Yi, Y.,
and Zhao, Q.: Taklimakan dust aerosol radiative heating derived
from CALIPSO observations using the Fu-Liou radiation model
with CERES constraints, Atmos. Chem. Phys., 9, 4011–4021,
doi:10.5194/acp-9-4011-2009, 2009.
Huang, J., Wang, T., Wang, W., Li, Z., and Yan, H.: Climate effects
of dust aerosols over East Asian arid and semiarid regions, J.
Geophys. Res., 119, 11398–11416, doi:10.1002/2014JD021796,
2014.
Lafore, J. P., Stein, J., Asencio, N., Bougeault, P., Ducrocq, V.,
Duron, J., Fischer, C., Héreil, P., Mascart, P., Masson, V., Pinty, J.
P., Redelsperger, J. L., Richard, E., and Vilà-Guerau de Arellano,
J.: The Meso-NH Atmospheric Simulation System. Part I: adi-
abatic formulation and control simulations, Ann. Geophys., 16,
90–109, doi:10.1007/s00585-997-0090-6, 1998.
Lau, K. M., Kim, M. K., and Kim, K. M.: Asian monsoon anomalies
induced by aerosol direct effects, Clim. Dynam., 26, 855–864,
doi:10.1007/s00382-006-0114-z, 2006.
Lemaître, C., Flamant, C., Cuesta, J., Raut, J.-C., Chazette, P., For-
menti, P., and Pelon, J.: Radiative heating rates profiles asso-
ciated with a springtime case of Bodélé and Sudan dust trans-
port over West Africa, Atmos. Chem. Phys., 10, 8131–8150,
doi:10.5194/acp-10-8131-2010, 2010.
Masson, V., Le Moigne, P., Martin, E., Faroux, S., Alias, A.,
Alkama, R., Belamari, S., Barbu, A., Boone, A., Bouyssel, F.,
Brousseau, P., Brun, E., Calvet, J.-C., Carrer, D., Decharme, B.,
Delire, C., Donier, S., Essaouini, K., Gibelin, A.-L., Giordani, H.,
Habets, F., Jidane, M., Kerdraon, G., Kourzeneva, E., Lafaysse,
M., Lafont, S., Lebeaupin Brossier, C., Lemonsu, A., Mahfouf,
J.-F., Marguinaud, P., Mokhtari, M., Morin, S., Pigeon, G., Sal-
gado, R., Seity, Y., Taillefer, F., Tanguy, G., Tulet, P., Vincendon,
B., Vionnet, V., and Voldoire, A.: The SURFEXv7.2 land and
ocean surface platform for coupled or offline simulation of earth
surface variables and fluxes, Geosci. Model Dev., 6, 929–960,
doi:10.5194/gmd-6-929-2013, 2013.
Miller, R. L., Tegen, I., and Perlwitz, J.: Surface radiative forcing
by soil dust aerosols and the hydrologic cycle, J. Geophys. Res.,
109, D04203, doi:10.1029/2003JD004085, 2004.
Min, Q.-L., Li, R., Lin, B., Joseph, E., Wang, S., Hu, Y., Morris, V.,
and Chang, F.: Evidence of mineral dust altering cloud micro-
physics and precipitation, Atmos. Chem. Phys., 9, 3223–3231,
doi:10.5194/acp-9-3223-2009, 2009.
Mlawer, E. J., Taubman, S. J., Brown, P. D., Iacono, M. J., and
Clough, S. A.: Radiative transfer for inhomogeneous atmo-
spheres: RRTM, a validated correlated-k model for the longwave,
J. Geophys. Res., 102D, 16663–16682, 1997.
Moulin, C., Lambert, C. E., Dayan, U., Masson, V., Ramonet, M.,
Bousquet, P., Legrand, M., Balkanski, Y. J., Guelle, W., Marti-
corena, B., Bergametti, G., and Dulac, F.: Satellite climatology of
African dust transport in the Mediterranean atmosphere, J. Geo-
phys. Res., 103, 13137–13144, 1998.
Papayannis, A., Amiridis, V., Mona, L., Tsaknakis, G., Balis, D.,
Bösenberg, J., Chaikovski, A., De Tomasi, F., Grigorov, I.,
Mattis, I., Mitev, V., Müller, D., Nickovic, S., Pérez, C.,
Pietruczuk, A., Pisani, G., Ravetta, F., Rizi, V., Sicard, M.,
Trickl, T., Wiegner, M., Gerding, M., Mamouri, R. E.,
D’Amico, G., and Pappalardo, G.: Systematic lidar ob-
Atmos. Chem. Phys., 15, 12231–12249, 2015 www.atmos-chem-phys.net/15/12231/2015/

C. Flamant et al.: The radiative impact of desert dust on orographic rain 12249
servations of Saharan dust over Europe in the frame of
EARLINET (2000–2002), J. Geophys. Res., 113, D10204,
doi:10.1029/2007JD009028, 2008.
Pergaud, J., Masson, V., Malardel, S., and Couvreux, F.: A param-
eterization of dry thermals and shallow cumuli for mesoscale
numerical weather prediction, Bound.-Lay. Meteorol., 132, 83–
106, doi:10.1007/s10546-009-9388-0, 2009.
Pey, J., Querol, X., Alastuey, A., Forastiere, F., and Stafoggia,
M.: African dust outbreaks over the Mediterranean Basin during
2001–2011: PM10 concentrations, phenomenology and trends,
and its relation with synoptic and mesoscale meteorology, At-
mos. Chem. Phys., 13, 1395–1410, doi:10.5194/acp-13-1395-
2013, 2013.
Pinty, J.-P. and Jabouille, P.: A mixed-phase cloud parameteriza-
tion for use in a mesoscale non-hydrostatic model: Simulations
of a squall line and of orographic precipitations, Preprints, Conf.
on Cloud Physics, 17–21 August 1998, Everett, WA, USA, Amer.
Meteor. Soc., 217–220, 1998.
Querol, X., Pey, J., Pandolfi, M., Alastuey, A., Cusack, M.,
Moreno, T., Viana, M., Mihalopoulos, N., Kallos, G., and Klean-
thous, S.: African dust contributions to mean ambient PM10 lev-
els across the Mediterranean Basin, Atmos. Environ., 43, 4266–
4427, 2009.
Rose, C., Sellegri, K., Freney, E., Dupuy, R., Colomb, A., Pichon,
J.-M., Ribeiro, M., Bourianne, T., Burnet, F., and Schwarzen-
boeck, A.: Airborne measurements of new particle formation
in the free troposphere above the Mediterranean Sea during the
HYMEX campaign, Atmos. Chem. Phys., 15, 10203–10218,
doi:10.5194/acp-15-10203-2015, 2015.
Rosenfeld, D., Rudich, Y., and Lahav, R.: Desert dust suppressing
precipitation: A possible desertification feedback loop, P. Natl.
Acad. Sci. USA, 98, 5975–5980, doi:10.1073/pnas.101122798,
2001.
Rysman, J.-F., Claud, C., Chaboureau, J.-P., Delanoë, J., and Fu-
natsu, B. M.: Severe convection in the Mediterranean from mi-
crowave observations and a convection-permitting model, Q. J.
Roy. Meteor. Soc., doi:10.1002/qj.2611, in press, 2015.
Saunders, R., Matricardi, M., Brunel, P., English, S., Bauer, P.,
O’Keeffe, U., Francis, P, and Rayer, P.: RTTOV-8 sci-
ence and validation report, NWP SAF Report 41, available
at: https://nwpsaf.eu/deliverables/rtm/rttov8_svr.pdf (last access:
3 November 2015), 2005.
Söhne, N., Chaboureau, J.-P., and Guichard, F.: Verification of cloud
cover forecast with satellite observation over West Africa, Mon.
Weather Rev., 136, 4421–4434, 2008.
Solmon, F., Mallet, M., Elguindi, N., Giorgi, F., Zakey, A.,
and Konaré, A.: Dust aerosol impact on regional pre-
cipitation over western Africa, mechanisms and sensitivity
to absorption properties, Geophys. Res. Lett., 35, L24705,
doi:10.1029/2008GL035900, 2008.
Stein, J., Richard, E., Lafore, J. P., Pinty, J. P., Asen-
cio, N., and Cosma, S.: High-resolution non-hydrostatic sim-
ulations of flash-flood episodes with grid-nesting and ice-
phase parameterization, Meteorol. Atmos. Phys., 72, 203–221,
doi:10.1007/s007030050016, 2000.
Tao, W.-K., Chen, J.-P., Li, Z., Wang, C., and Zhang, C.: Impact of
aerosols on convective clouds and precipitation, Rev. Geophys.,
50, RG2001, doi:10.1029/2011RG000369, 2012.
Tulet, P., Crassier, V., Cousin, F., Shure, K., and Rosset, R.:
ORILAM, A three moment lognormal aerosol scheme for
mesoscale atmospheric model. On-line coupling into the Meso-
NH-C model and validation on the Escompte campaign, J. Geo-
phys. Res., 110, D18201, doi:10.1029/2004JD005716, 2005.
Tulet, P., Mallet, M., Pont, V., Pelon, J., and Boone, A.: The 7–
13 March 2006 dust storm over West Africa: generation, trans-
port and vertical stratification, J. Geophys. Res., 113, D00C08,
doi:10.1029/2008JD009871, 2008.
van den Heever, S. C., Carrio, G., Cotton, W. R., DeMott, P. J.,
and Prenni, A. J.: Impacts of nucleating aerosol on Florida con-
vection: Part I. Mesoscale simulations, J. Atmos. Sci., 63, 1752–
1775, doi:10.1175/JAS3713.1, 2006.
Vié, B., Pinty, J.-P., Berthet, S., and Leriche, M.: LIMA (v1.0): a
two-moment microphysical scheme driven by a multimodal pop-
ulation of cloud condensation and ice freezing nuclei, Geosci.
Model Dev. Discuss., 8, 7767–7820, doi:10.5194/gmdd-8-7767-
2015, 2015.
Wulfmeyer, V., Behrendt, A., Bauer, H. S. , Kottmeier, C.,
Corsmeier, U., Blyth, A., Craig, G., Schumann, U., Ha-
gen, M., Crewell, S., Di Girolamo, P., Flamant, C., Miller, M.,
Montani, A., Mobbs, S., Richard, E., Rotach, M., Arpa-
gaus, M., Russchenberg, H., Schlüssel, P., König, M., Gärt-
ner, V., Steinacker, R., Dorninger, M., Turner, D., Weckwerth, T.,
Hense, A., and Simmer, C.: The Convective and Orographically-
induced Precipitation Study (COPS): A Research Project for Im-
proving Quantitative Precipitation Forecasting in Low-mountain
Regions, B. Am. Meteorol. Soc., 89, 1477–1486, 2008.
Zender, C. S., Bian, H. S., and Newman, D.: Mineral Dust
Entrainment and Deposition (DEAD) model: Description and
1990s dust climatology, J. Geophys. Res., 108, 4416–4434,
doi:10.1029/2002JD002775, 2003.
Zhao, C., Liu, X., and Leung, L. R.: Impact of the Desert dust on
the summer monsoon system over Southwestern North America,
Atmos. Chem. Phys., 12, 3717–3731, doi:10.5194/acp-12-3717-
2012, 2012.
www.atmos-chem-phys.net/15/12231/2015/ Atmos. Chem. Phys., 15, 12231–12249, 2015