the relationship between digital ultrasonographic image
TRANSCRIPT
Veterinarski arhiV 91 (2), 261-268, 2021
261ISSN 0372-5480Printed in Croatia
The relationship between digital ultrasonographic image echotexture parameters of the uterus and preovulatory follicle development and ovulation
in purebred Arabian mares
Ömer Korkmaz1, Tuğra Akkuş1*, Birten Emre1, and Abuzer K. Zonturlu1
1Department of Obstetrics and Gynecology, Faculty of Veterinary Medicine, Harran University, Sanliurfa, Turkey
_____________________________________________________________________________KorKmAz, Ö., T. AKKuş, B. EmrE, A. K. zonTurlu: The relationship between digital ultrasonographic image echotexture parameters of the uterus and preovulatory follicle development and ovulation in purebred Arabian mares. Vet. arhiv 91, 261-268, 2021.
ABSTRACTObjective assessment of ultrasonographic images is only possible using computer-assisted echotexture analysis.
This study investigated the relationship between cyclic digital echotexture analysis of ultrasonographic uterine images, and preovulatory follicle development and ovulation in 48 cyclic purebred Arabian mares during the breeding season. When the mares’ ovarian follicle diameters exceeded 30 mm, ultrasonographic examinations were performed and ultrasonographic images recorded with uterine endometrial edema degrees following follicle development until ovulation day. Echotexture measurements, including mean grayness value (MGV), heterogeneity (HET) and contrast (CON) parameters, were performed on the days when ovarian follicle diameters reached 30 mm (Group 1, n = 12), 35 mm (Group 2, n = 12), 40 mm (Group 3, n = 12) and 45 mm (Group 4, n = 12) in images recorded the day before ovulation and on the day of ovulation. MGV was the lowest in Group 2 and the difference from the other groups was statistically significant (P<0.001). CON was significantly higher in Group 2 than Groups 3 and 4 (P<0.01). However, there was no significant difference compared to Group 1 (P>0.05). Variations in HOM (P<0.05), contrast (P<0.05) and MGV (P<0.01) were statistically significant on the day before ovulation and ovulation day. Thus, uterine ultrasonographic echotexture parameters are associated with preovulatory follicle development in mares, which suggests that these parameters can indicate the day of ovulation in purebred Arabian mares.
Key words: mare; follicle diameter; ovulation; uterus echotexture; digital analysis _____________________________________________________________________________________________
DOI: 10.24099/vet.arhiv.0921
________________*Corresponding author:Dr. Tuğra Akkuş, Faculty of Veterinary Medicine, University of Harran, Sanliurfa, Turkey, E-mail: [email protected]
white) depending on the location and strength of the echoes from tissue interfaces (ZAGZEBSKI, 1996; SINGH et al., 1997). The ultrasonographic appearance of the tissues, which varies according to their histological structure, is called echotexture. Echotexture analysis cannot be quantified by the
IntroductionUltrasonographic imaging is based on the ability
of tissues to reflect ultrasound waves, with reflection varying according to tissue density (PIERSON and ADAMS, 1995; SINGH et al., 1997). Images comprise matrices of pixels that differ in gray scale values from 0 (absolute black) to 255 (absolute
Vet. arhiv 91 (2), 261-268, 2021262
Ö. Korkmaz et al.: The relationship between digital ultrasonographic image echotexture parameters of the uterus and preovulatory follicle development and ovulation in purebred Arabian mares
This study therefore uses computer-aided digital analysis to clarify the endometrial edema caused by increased ovarian follicle diameter in preovulatory follicle development, and associated uterine echotexture changes in cyclic purebred Arab mares, during the follicular phase from deviation until ovulation day. The study also investigates the relationship between these uterine echotexture parameters, follicle diameter increase and ovulation, and presents the data obtained to veterinarians working in this field.
Materials and methodsAnimals. The present study was conducted
on uterus ultrasound images of mares, with the permission of Dollvet Animal Experiments Local Ethics Committee (Dollvet Inc. HADYEK 2016/20). The study material consisted of ultrasonographic images of the uteruses of 48 purebred Arabian mares aged 7-10 years, weighing 380-400 kg, brought to Harran University, Faculty of Veterinary Medicine, Department of Obstetrics and Gynecology, between February 15, 2017 and June 30, 2017. No fertility problems were detected in the routine clinical examinations or the mares’ medical histories. The mares had had no pregnancies in the previous season and were not lactating.
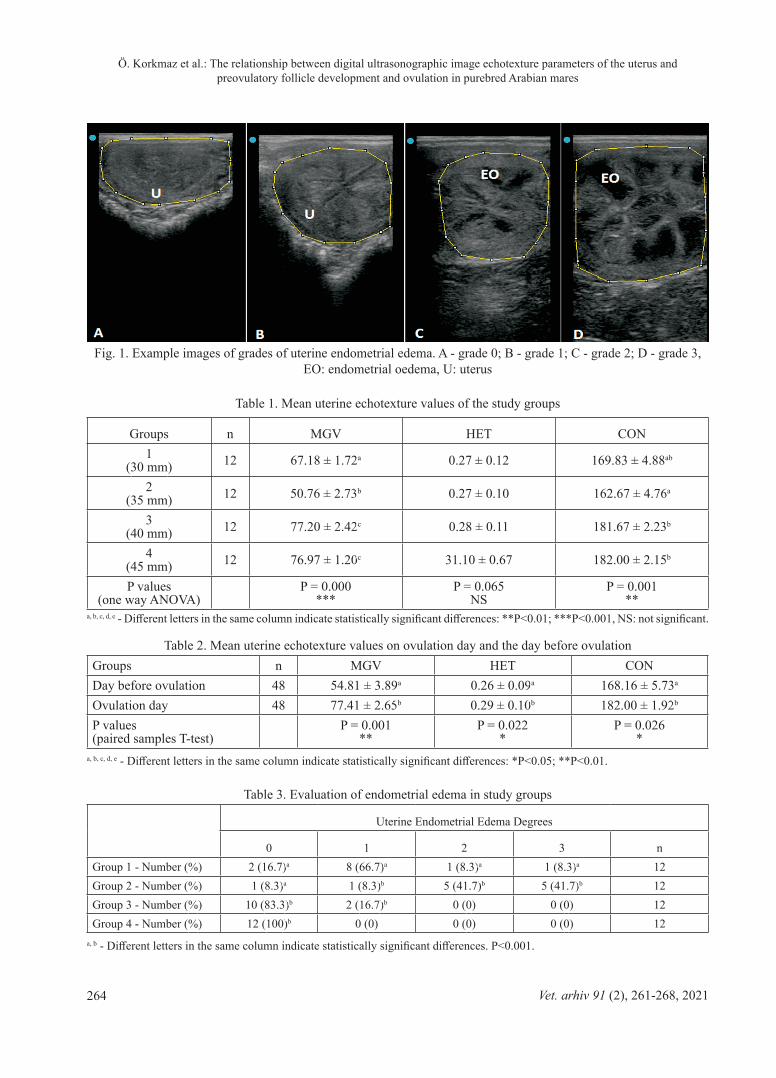
Ultrasound examination. Increases in ovarian follicle diameter were monitored in the mares during the breeding season for ovarian follicle diameters exceeding 25 mm, using daily ultrasonographic examinations (SonoSite Edge II Vet®, Providian Medical Equipment LLC, Highland Heights, Ohio, United States) until ovulation. Levels of uterine endometrial edema were recorded, along with increases in ovarian follicle diameter. Uterine ultrasonographic images were recorded for computer-aided image analysis. The following criteria were used for endometrial edema grading, based on MCCUE et al., (2011): grade 0, endometrial folds are undetectable while the edema lacks a homogeneous uterine echotexture appearance; grade 1, endometrial folds can be easily seen like a horse carriage wheel, while the edema is more pronounced; grade 3, endometrial folds are thicker while the edema pattern is enhanced. Throughout the study, the same ultrasound settings
human eye, which can distinguish only 18-20 different gray tones (PIERSON and ADAMS, 1995). However, computer-aided digital analysis allows quantitative assessment of the intensity of each pixel in the image for objective evaluation and to determine the subjectivity of analysis (SINGH et al., 2003; CENGIZ et al., 2014). Researchers are currently attempting to standardize digital analysis according to cases and species. It is predicted that it will become a part of imaging devices (CENGIZ et al., 2018).
In mares, ultrasonographic imaging can detect changes in the uterus due to the effects of ovarian hormones, which vary during the cycle. During dioestrus, uterine echotexture is homogeneous with no visible endometrial folds whereas, during oestrus, the dense central parts of the endometrial folds are echogenic, while the edematous portions of the folds appear as orange slices with non-echogenic areas (MCKINNON and CARNEVALE, 1993). Currently, computer-assisted image analysis systems are used in the follow-up of uterine endometrial echotexture changes in veterinary medicine (SCHMAUDER et al., 2008; KAUFFOLD et al., 2010; KUCUKASLAN, 2010, POLAT et al., 2015, ERDOGAN et al., 2017; ZONTURLU et al., 2018). In mares, computer-aided ultrasound image analysis methods are used in assessing the uterus (MATEU-SANCHEZ et al., 2016) and follicle wall for ovulation and follicular development (CHAN et al., 2003; GASTAL et al., 2006), and for differentiating early pregnancy from uterine cysts (ZONTURLU et al., 2018). Endometrial edemas can be graded on the basis of the endometrial folds and edema in uterine ultrasonographic images of mares (ATLI et al., 2005; SAMPER, 2010; MCCUE et al., 2011). However, there are various classification differences in this rating, such as 0 to 3 degrees (MCCUE et al., 2011) versus 0 to 5 degrees (SAMPER, 2010). Moreover, visual grading may produce varying results according to the observer. However, very few computer-assisted image analysis studies have been conducted to evaluate ultrasonographic images of the uterus quantitatively in mares in order to eliminate individual observation bias and differences.
Ö. Korkmaz et al.: The relationship between digital ultrasonographic image echotexture parameters of the uterus and preovulatory follicle development and ovulation in purebred Arabian mares
Vet. arhiv 91 (2), 261-268, 2021 263
(6.5 mHZ frequency, 7.9 cm depth, 70 dB gain and cm 0.83 MI), focus and brightness were maintained. All ultrasonographic examinations were performed by the same person, and at least three images were obtained from the uterine body at each examination.
Creating the working groups. Ultrasonographic images of each mare’s uterus were obtained on the days when the ovarian follicle diameter reached 30 mm (Group 1, n = 12), 35 mm (Group 2, n = 12), 40 mm (Group 3, n = 12) and 45 mm (n = 12). Ultrasonographic images of each mare’s uterus were also obtained one day before ovulation (Preovulation group) and on the day of ovulation (Ovulation group). These images were then grouped to assess preovulatory follicle diameter.
Obtaining ultrasound images for digital echotexture analysis. Digital echotexture analysis of ultrasound images of the uterus were performed using a personal computer. The images were saved in PNG file format with a resolution of 640x480 pixels. Computer analysis was performed using specialized software (ImageJ 1.42q; NIH, USA-Image Processing and Analysis Java). All uterine images were included in the measurement analysis. Polygonal-style boundaries were formed from each uterine region of the uterus (Fig. 1), while mean grayness value (MGV), heterogeneity (HET) or homogeneity (HOM), and contrast (CON) were measured from the echotexture parameters. Homogeneity or heterogeneity are two concepts used in echotexture evaluation. The term homogeneity refers to images taken on the same day, whereas heterogeneity refers to images taken on different days (RAETH et al., 1985). The parameters are defined further below.
Homogeneity (HOM) or heterogeneity (HET): This is the gray value combination of neighboring pixels in the specified matrix with the same micro or macrotexture. HOM values range from 0-1 (RAETH et al., 1985).
HOM = ∑(i,j) p (i,j) 2HOM = homogeneity, i,j = the row (i) and column (j) index; p(i, j ) = value in the section of the co-occurrence matrix
Contrast (CON): This is the total measurement of large gray value differences in the selected examination areas. It provides information about
the macrotexture of the image. It is defined by LEFEBVRE et al., (2000) as
CON = ∑ (i,j)EROI (i,j) 2 * p(i,j)CON = contrast, i,j = the row (i) and column (j) index; p(i, j) = value in the section of the co-occurrence matrix
Mean Gray Value (MGV): This is the arithmetic mean grayness of all pixels in the image that defines its brightness. MGV ranges from 0 to 255. It is defined by RAETH et al., (1985) as
µg = 1/N ∑(x,y)g(xy)µg = mean grey level (values: 0-255); N = size of ROI in pixels; x,y = row (x) and column (y) index; g(xy) = grey level in pixels
Statistical analysis. Statistical analysis of the data was performed with SPSS for Windows (version 22.0). The normal distribution of the variables was examined visually (histogram and probability graphs) and analytically (Kolmogorov-Smirnov/Shapiro-Wilk tests). Descriptive analyzes were given as mean ± standard deviation for normally distributed variables. As the data was normally distributed, it was evaluated using one-way ANOVA. The homogeneity of the variances was determined from the Levene test. Cases with p-values below 0.05 were evaluated as statistically significant. Post-hoc Tukey tests was used to compare significant differences between groups. Comparisons between ovulation and ovulation were compared using a dependent groups Student’s t test. Finally, differences between groups in follicle diameter and endometrial edema were compared by using the Chi-square (X2) test.
ResultsThe mean follicle diameter of the purebred
Arabian mares was 43.04 ± 2.94 mm at ovulation. Ovulation occurred in 25 mares with follicle diameters of 40-45 mm, which correlated with the mean ovulation follicle diameter. In 16 mares, follicle diameter was greater than 45 mm at ovulation, while ovulation occurred with a follicle diameter between 35 and 40 mm in 7 mares.
Table 1 presents the mean values of uterine echotexture for the four study groups. The mean grayness value (MGV) was lowest in the group with 35 mm follicle diameter (Group 2).
Vet. arhiv 91 (2), 261-268, 2021264
Ö. Korkmaz et al.: The relationship between digital ultrasonographic image echotexture parameters of the uterus and preovulatory follicle development and ovulation in purebred Arabian mares
Table 1. Mean uterine echotexture values of the study groups
Groups n MGV HET CON1
(30 mm) 12 67.18 ± 1.72a 0.27 ± 0.12 169.83 ± 4.88ab
2(35 mm) 12 50.76 ± 2.73b 0.27 ± 0.10 162.67 ± 4.76a
3(40 mm) 12 77.20 ± 2.42c 0.28 ± 0.11 181.67 ± 2.23b
4(45 mm) 12 76.97 ± 1.20c 31.10 ± 0.67 182.00 ± 2.15b
P values(one way ANOVA)
P = 0.000***
P = 0.065NS
P = 0.001**
a, b, c, d, e - Different letters in the same column indicate statistically significant differences: **P<0.01; ***P<0.001, NS: not significant.
Table 2. Mean uterine echotexture values on ovulation day and the day before ovulationGroups n MGV HET CONDay before ovulation 48 54.81 ± 3.89a 0.26 ± 0.09a 168.16 ± 5.73a
Ovulation day 48 77.41 ± 2.65b 0.29 ± 0.10b 182.00 ± 1.92b
P values(paired samples T-test)
P = 0.001**
P = 0.022*
P = 0.026*
a, b, c, d, e - Different letters in the same column indicate statistically significant differences: *P<0.05; **P<0.01.
Table 3. Evaluation of endometrial edema in study groups
Uterine Endometrial Edema Degrees
0 1 2 3 nGroup 1 - Number (%) 2 (16.7)a 8 (66.7)a 1 (8.3)a 1 (8.3)a 12Group 2 - Number (%) 1 (8.3)a 1 (8.3)b 5 (41.7)b 5 (41.7)b 12Group 3 - Number (%) 10 (83.3)b 2 (16.7)b 0 (0) 0 (0) 12Group 4 - Number (%) 12 (100)b 0 (0) 0 (0) 0 (0) 12
a, b - Different letters in the same column indicate statistically significant differences. P<0.001.
Fig. 1. Example images of grades of uterine endometrial edema. A - grade 0; B - grade 1; C - grade 2; D - grade 3, EO: endometrial oedema, U: uterus
Ö. Korkmaz et al.: The relationship between digital ultrasonographic image echotexture parameters of the uterus and preovulatory follicle development and ovulation in purebred Arabian mares
Vet. arhiv 91 (2), 261-268, 2021 265
Diameters for Group 1 and Group 2 were significantly different from the other groups (P<0.001). The contrast (CON) values of the 35 mm and 40 mm groups differed significantly from the <45 mm follicle diameter group (P<0.01).
Ultrasonographic image echotextures differed significantly between ovulation day and the day before in terms of heterogeneity (P<0.05), contrast (P<0.05) and mean grayness value (P<0.01) (Table 2).
There was a direct relationship between follicle size and endometrial edema in all groups (P<0.001). When the follicle diameter reached 40-45 mm, the edema disappeared (Table 3).
DiscussionThis is the first study using the whole uterus
tissue and performing digital echotexture analysis on the ultrasonographic image of the uterus in mares. In some previous studies, the target tissue was divided into four equal quadrants while a small circular area was selected to generate mean values (SCHMAUDER et al., 2008; CENGIZ et al., 2014; NOSEIR and SOSA, 2015; POLAT et al., 2015; SCULLY et al., 2015; CENGIZ et al., 2017). In our study, we adopted the technique of ERDOGAN et al., (2017), who avoided the edematous areas of myometrium in dogs and selected the whole uterine tissue in a polygonal manner to obtain mean values. In addition to creating the digital data, we followed ZONTURLU et al., (2018) who differentiated between early pregnancy and uterus cysts in mares by analyzing all polygons in the ultrasound images selected for analysis (Fig. 1). We agree with other researchers who believe that analyzing the whole uterine tissue rather than random images from different parts of the tissue provides more reliable results (ERDOGAN et al., 2017; ZONTURLU et al., 2018).
Among the parameters obtained from ultrasonographic images, mean gray value (MGV), homogeneity (HOM), heterogeneity (HET) and contrast (CON) describe changes in the echotexture image of the uterus (CENGIZ et al., 2014). We preferred heterogeneity over homogeneity since the uterine images were monitored regularly on different days.
Although ULKUMEN et al., (2014) reported that age, maternal weight and number of births has no effect on endometrial tissue and mean grayness, others have reported that maternal age, weight and number of births affects mean grayness (PAULA et al., 2009; PALA et al., 2015). In the present study, age (7-10 years) and weight (380-400 kg) were kept between certain values to minimize physiological differences. In addition, we only worked from non-lactating mares who had not been pregnant in the previous season and were without fertility problems. By seeking to maximize uniformity, we intended to avoid ultrasonographic images that could lead to errors due to postpartum endometrial involution.
Echogenic changes occur in uterine endometrial tissue in correlation with the concentrations of peripheral ovarian hormones in mares and cows (GINTHER, 1998; BRAGG WEVER et al., 2002a; BRAGG WEVER et al., 2002b; SCHMAUDER et al., 2008). While higher uterine echotexture values have been reported in heifers (BONAFOS et al., 1995), values fall in mares during pre-oestrus and ovulation (PIERSON and GINTHER, 1987; GRIFFIN and GINTHER, 1991). While echo changes in the endometrial tissue in mares have been visually indicated (BRAGG WAVER et al., 2002b; MATEU-SANCHEZ et al., 2016), computer-aided digital echotexture analysis has not yet been evaluated. In addition, uterine echotexture studies in mares have mainly focused on the oestrus cycle (BRAGG WAVER et al., 2002a; BRAGG WEVER et al., 2002b; GRIFFIN and GINTHER, 1991), early pregnancy processes (GRIFFIN and GINTHER, 1991; ZONTURLU et al., 2018) and uterine pathologies (ZONTURLU et al., 2018). In contrast, this study provides the first digitally supported echotexture analysis of whole ultrasonographic images of endometrial tissue of mare uterus.
Echotexture measurement values were lowest in Group 2. This group preceded Group 3, in which follicle diameter exceeded 40 mm and ovulation was most common (25/48). We assume that species-specific endometrial edema during preovulatory follicular development in mares can explain why uterine echotoxture values were lowest in Group 2. In addition, we found that echotextural parameters
Vet. arhiv 91 (2), 261-268, 2021266
Ö. Korkmaz et al.: The relationship between digital ultrasonographic image echotexture parameters of the uterus and preovulatory follicle development and ovulation in purebred Arabian mares
one day before ovulation were significantly lower than on the day of ovulation. This is in line with previous studies (PIERSON and GINTHER 1987; GRIFFIN and GINTHER, 1991). The emergence and disappearance of endometrial edema in oestrus in mares is directly related to the presence of estrogen and basal progesterone (SAMPER, 2010). Edema, which can appear at the end of diestrus, becomes more pronounced as oestrus progresses, before diminishing or disappearing within 24 hours of ovulation (ATLI et al., 2005; MCCUE et al., 2011). In line with this, the uterine images for Group 3 mares, which had the most ovulations, showed no grade 2 or 3 edemas. In contrast, Group 2, which displayed the most intense endometrial edema, had the lowest heterogeneity, MGV and contrast values due to endometrial edema.
SCHMAUDER et al., (2008) reported that the uterus at oestrus has increased homogeneity in ultrasonography, which contradicts previous findings. However, they used computer-aided image analysis systems that are superior to observational evaluation. CENGIZ et al. (2014) confirmed that homogeneity in goats peaked during estrus. We also found that heterogeneity in mare uteruses was higher on ovulation day than the day before ovulation. In line with previous findings for other animal species, MGV values were lowest in Group 2 mares, where follicle diameters exceeded 3mm, and also lower on the day of ovulation than on the day before.
In cows, MGV and HOM values change in opposite directions during the oestrus cycle with MGV lowest and HOM highest at oestrus. HOM values then decrease from day 2 to day 13 after oestrus, whereas MGV increases (SCHMAUDER et al., 2008). MGV follows a similar pattern in goats to peak on day 17 after oestrus (CENGIZ et al., 2014). In contrast, MGV in pigs is lowest on day 12 after ovulation. However, this is associated with endometrial estrogen synthesis and vascularization specific to pigs (KAUFFOLD et al., 2010). In our study of mares, MGV and heterogeneity values ran in parallel in all four groups.
Endometrial echotexture changes are associated with estrogen synthesis in mares, cows and pigs (PIERSON and GINTHER 1987; KAUFFOLD et
al., 2010; SCHMAUDER et al., 2008) but related to changes in blood progesterone concentration in goats (CENGIZ et al., 2014;). CENGIZ et al., (2014) did not correlate estrogen with endometrial echotexture changes in goats and reported that the increase in HOM value might be related to uterine tone rather than edema. On the other hand, they also suggested that, although estrogen plasma concentration changes suddenly, the gradual change in homogeneity may mask this relationship. In our study, heterogeneity was low one day before the ovulation, but high (i.e. decreased homogeneity) on ovulation day. This finding supports GINTHER et al., (1998), who argued that, under ultrasonographic examination, the endometrial layer expands and appears more heterogeneous, while endometrial homogeneity decreases due to regression of the edema.
Conclusions Our analysis of endometrial echotexture changes
during the development of preovulatory follicles in cyclic purebred Arabian mares shows that mean grayness (MGV) and contrast (CON) values increase significantly after follicular size reaches 35 mm until ovulation. That is to say, uterine echotexture images of mares are related to the course of endometrial edema in the follicular phase, with statistically significant increases in heterogeneity, contrast and MGV values on ovulation day compared to the day before ovulation. This suggests that it is possible to use this method to estimate the day of ovulation in purebred Arabian mares.
ReferencesATLI, M. O., H. ÇETİN, Ö. KORKMAZ (2005): Degree
of endometrial edema on oestrus and ovulation days in purebred Arabian mares. Vet. Bil. Derg. 21, 65-68 (in Turkish).
BONAFOS, L. D., K. KOT, O. J. GINTHER (1995): Physical characteristics of the uterus during the bovine estrous cycle and early pregnancy. Theriogenology 43, 713-721.
DOI: 10.1016/0093-691X(95)00014-YBRAGG WEVER, N. D., R. A. PIERSON, C. E. CARD
(2002a): Assessment of endometrial odema and echotexture in natural and hormanally manipulated estrus in mares. Theriogenology. 58, 507-510.
DOI: 10.1016/S0093-691X(02)00853-1
Ö. Korkmaz et al.: The relationship between digital ultrasonographic image echotexture parameters of the uterus and preovulatory follicle development and ovulation in purebred Arabian mares
Vet. arhiv 91 (2), 261-268, 2021 267
BRAGG WEVER, N. D., R. A. PIERSON, C. E. CARD (2002b). Relationship between estradiol 17-β and endometrial echotexture during natural and hormonally manipulated estrus in mares. Proceedings of the 48th annual convention of the American Association of Equine Practitioners, 4-8 December, Orlando, Florida, pp 41-48.
CENGIZ, M., A. COLAK, A. HAYIRLI, O. CANNAZIK (2017): Optical density changes in ultrasonographic images of the endometrium and corpus luteum in pregnant and cyclic cows. Turk J. Vet. Anim. Sci. 41, 18-24.
DOI: 10.3906/vet-1604-1641CENGİZ, M., A. ÇOLAK, B. POLAT, M. F. A. CHACHER
(2018): Ultrasonographic B-mode echotexture analysis of genital organs in veterinary gynecology. Turkiye Klinikleri J. Vet. Sci. Obstet Gynecol-Special Topics. 4, 55-61 (in Turkish).
CENGIZ, M., H. KANCA, S. SALAR, A. BASTAN, I. KUCUKASLAN, H. ALKAN, K. KARATAS, A. HAYIRLI (2014): Endometrial echotexture parameters in Turkish Saanen Goats (Akkeci) during oestrus and early pregnancy. Anim. Reprod. Sci. 146, 27-33.
DOI: 10.1016/j.anireprosci.2014.02.004CHAN, J. P. W., T. H. HUANG, S. T. CHUANG, F. P. CHENG,
H. P. FUNG, C. L. CHEN (2003): Quantitative echotexture analysis for prediction of ovulation in mares. J. Equine Vet. Sci. 23, 397-402.
DOI: 10.1016/j.jevs.2003.08.013ERDOGAN, G., N. KUCUK, H. KANCA, M. AKSOY (2017):
In vivo and in vitro assessment of ovarian echotexture through computer assisted real time ultrasonography in bitches. Ankara Univ. Vet. Fak. 64, 171-176.
DOI: 10.1501/Vetfak_0000002795GASTAL, E. L., M. O. GASTAL, O. J. GINTHER (2006):
Relationships of changes in B-mode echotexture and colour-Doppler signals in the wall of the preovulatory follicle to changes in systemic oestradiol concentrations and the effects of human chorionic gonadotrophin in mares. Reproduction 131, 699-709.
DOI: 10.1530/rep.1.01011GINTHER, O.J. (1998): Tubular genitalia. In: Ultrasonic
Imaging and Animal Reproduction. (Ginther, O. J., Ed.), Equi services Publishing, CrossPlains, USA, pp 105-128.
GRIFFIN, P. G., O. J. GINTHER (1991): Dynamics of uterine diameter and endometrial morphology during the estrous cycle and early pregnancyin mares. Anim. Reprod. Sci. 25, 133-142.
DOI: 10.1016/0378-4320(91)90038-2KAUFFOLD, J., B. VON DEM BUSSCHE, K. FAILING,
A. WEHREND, M. WENDT (2010). Use of B-mode ultrasound and grey-scale analysis to study uterine echogenicity in the pig. J. Reprod. Dev. 56, 444-448.
DOI: 10.1262/jrd.09-220T
KUCUKASLAN, I. (2010): Evaluation of endometrial echostructure following Lotagen® administiration in cows with chronic endometritis. PhD Thesis, Institute of Health Sciences, Ankara University, Turkey.
LEFEBVRE, F., M. MEUNIER, F. THIBAULT, P. LAUGIER, G. BERGER (2000): Computerized ultrasound B-scan characterization of breast nodules. Ultrasound Med. Biol. 26, 1421-1428.
DOI: 10.1016/S0301-5629(00)00302-1MATEU-SANCHEZ, S., J. R. NEWCOMBE, C. GARCES-
NARRO, J. CUERVO-ARANGO (2016): The period of the follicular phase during which the uterus of mares shows estrus-like echotexture influences the subsequent pregnancy rate. Theriogenology 86, 1506-1515.
DOI: 10.1016/j.theriogenology.2016.05.009MCCUE, P. M., C. F. SCOGGIN, A. R. G. LINDHOLM
(2011): Estrus. In: Equine Reproduction. (McKinnon, A. O., E. L. Squires, W. E. Vaala, D. D. Varner, Eds.), Willey-Blackwell, Oxford, UK, pp. 1716-1727.
MCKINNON, A. O., E. M. CARNEVALE (1993): Ultrasonography. In: Equine Reproduction. (McKinnon, A.O., J. L. Voss, Eds.), Lea & Febiger, Malvern, Pennsylvania, pp. 211-220.
NOSEIR, W. M. B., G. A. M. SOSA (2015): Treatment of ovarian cysts in Buffaloes with emphasis to echotexture analysis. J. Dairy Vet. Anim. Res. 2, 1-7.
DOI: 10.15406/jdvar.2015.02.00030PALA, H.G., B.A. ULKUMEN, Y. UYAR, F.M. KOYUNCU,
Y. BAYTUR (2015): Three-dimensional placental volume and mean grey value: normal ranges in a Turkish population and correlation with maternal serum biochemistry and Doppler parameters. J. Obstet. Gynaecol. 35, 259-262.
DOI: 10.3109/01443615.2014.958146PAULA, C. F. S., R. RUANO, J. A. D. B. CAMPOS, M.
ZUGAIB (2009): Quantitative analysis of placental vasculature by three-dimensional power Doppler ultrasonography in normal pregnancies from 12 to 40 weeks of gestation. Placenta 30, 142-148.
DOI: 10.1016/j.placenta.2008.11.010PIERSON, R. A., G. P. ADAMS (1995): Computer-assisted
image analysis, diagnostic ultrasonography and ovulation induction: strange bedfellows. Theriogenology 43, 105-112.
DOI: 10.1016/0093-691X(94)00014-LPIERSON, R. A., O. J. GINTHER (1987): Ultrasonographic
appearance of the bovine uterus during the estrous cycle. J. Am. Vet. Med. A. 190, 995-1001.
POLAT, B., M. CENGIZ, O. CANNAZIK, A. COLAK, E. ORUC, S. ALTUN, S. SALAR, A. BASTAN (2015): Endometrial echotexture variables in postpartum cows with subclinical endometritis. Anim. Reprod. Sci. 155, 50-55.
DOI: 10.1016/j.anireprosci.2015.01.015
Vet. arhiv 91 (2), 261-268, 2021268
Ö. Korkmaz et al.: The relationship between digital ultrasonographic image echotexture parameters of the uterus and preovulatory follicle development and ovulation in purebred Arabian mares
RAETH, U., D. SCHLAPS, B. LIMBERG, I. ZUNA, A. LORENZ, G. VAN KAICK, W. J. LORENZ, B. KOMMERELL (1985): Diagnostic accuracy of computerized B-scan texture analysis and conventional ultrasonography in diffuse parenchymal and malignant liver disease. J. Clin. Ultrasound. 13, 87-99.
DOI: 10.1002/jcu.1870130203SAMPER, J. C. (2010): A review of a practitioner's perspective
on endometrial edema. Pferdehelkunde 26, 14-18. DOI: 10.21836/PEM20100103SCHMAUDER, S., F. WEBER, E. KIOSSİS, H. BOLLWEIN
(2008): Cyclic changes in endometrial echotexture of cows using a computer-assisted program for the analysis of first-and second-order grey level statistics of B Mode ultrasound images. Anim. Reprod. Sci. 106, 153-161.
DOI: 10.1016/j.anireprosci.2007.12.022SCULLY, S., A. C. O. EVANS, F. CARTER, P. DUFFY,
P. LONERGAN, M. A. CROWE (2015): Ultrasound monitoring of blood flow and echotexture of the corpus luteum and uterus during early pregnancy of beef heifers. Theriogenology 83, 449-458.
DOI: 10.1016/j.theriogenology.2014.10.009
SINGH, J., R. A. PIERSON, G. P. ADAMS (1997): Ultrasound image attributes of the bovine corpus luteum: structural and functional correlates. J. Reprod. Fertil. 109, 35-44.
DOI: 10.1530/jrf.0.1090035SINGH, J., G. P. ADAMS, R. A. PIERSON (2003): Promise of
new imaging technologies for assessing ovarian function. Anim. Reprod. Sci. 78, 371-399.
DOI: 10.1016/S0378-4320(03)00100-3ULKUMEN, B. A., H. G. PALA, Y. UYAR, F. M. KOYUNCU,
Y. B. BAYTUR (2014): The alteration in placental volume and placental mean grey value in growth-restricted pregnancies assessed by 3D ultrasound. J. Obstet. Gynaecol. 29, 1-4.
ZAGZEBSKI, J. A. (1996): Physics of diagnostic ultrasound. In: Essentials of Ultrasound Physics (Zagzebski, J. A. Ed.), Mosby Year Book Inc, St. Louis, pp. 1-19.
ZONTURLU, A. K., T. AKKUS, C. KACAR, Ö. KORKMAZ, S. KAYA, M. C. DEMIR, B. EMRE (2018): Discrimination of early pregnancy and endometrial cyst by ultrasonographic assessment of uterine echotexture in mares. Kafkas Univ. Vet. Fak. 24, 519-524.
DOI: 10.9775/kvfd.2018.19476
Received: 1 January 2020Accepted: 7 February 2020
_____________________________________________________________________________KorKmAz, Ö., T. AKKuş, B. EmrE, A. K. zonTurlu: Povezanost ehoteksturnih pokazatelja digitalne ultrasonografije maternice, predovulacijskog razvoja folikula i ovulacije u čistokrvnih arapskih kobila. Vet. arhiv 91, 261-268, 2021.
SAžETAKObjektivna procjena ultrazvučnih prikaza moguća je jedino primjenom računalne ehoteksturne analize. U ovom
je radu istražen odnos između ciklične digitalne ehoteksturne analize ultrazvučnog prikaza maternice i razvoja predovulacijskog folikula i ovulacije u 48 čistokrvnih arapskih kobila u ciklusu tijekom sezone parenja. Nakon što je promjer folikula jajnika u kobila prešao 30 mm, učinjena je ultrasonografija pri čemu su UZV prikazi zabilježili stupnjeve materničnog endometralnog edema koji su slijedili razvoj folikula do dana ovulacije. Mjerenja ehoteksture, uključujući prosječnu vrijednost u sivoj ljestvici (MGV), pokazatelje heterogenosti (HET) i kontrasta (CON), učinjena su u dane kad je promjer ovarijskih folikula dosegnuo 30 mm (skupina 1, n = 12), 35 mm (skupina 2, n = 12), 40 mm (skupina 3, n = 12) i 45 mm (skupina 4, n = 12) u slikama zabilježenim dan prije i na sam dan ovulacije. MGV je bio najniži u skupini 2 i statistički se znakovito razlikovao od drugih skupina (P < 0,001). CON je bio znakovito veći u skupini 2 nego u skupinama 3 i 4 (P < 0,01). U svakom slučaju nije bilo znakovite razlike u usporedbi sa skupinom 1 (P > 0,05). Varijacije HOM-a (P < 0,05), kontrasta (P < 0,05) i MGV-a (P < 0,01) bile su statističke znakovite na dan prije ovulacije kao i na dan ovulacije. Prema tome ultrazvučni pokazatelji ehoteksture povezani su s razvojem predovulacijskih folikula u kobila te zaključujemo da oni mogu uputiti na dan ovulacije u čistokrvnih arapskih kobila.
Ključne riječi: kobila; promjer folikula; ovulacija; ehotekstura maternice; digitalna analiza_____________________________________________________________________________________________