the revenue performance of casinos after a smoking ban
TRANSCRIPT
Research Division Federal Reserve Bank of St. Louis Working Paper Series
The Revenue Performance of Casinos after a Smoking Ban: The Case of Illinois
Thomas A. Garrett and
Michael R. Pakko
Working Paper 2009-027B http://research.stlouisfed.org/wp/2009/2009-027.pdf
June 2009 Revised March 2010
FEDERAL RESERVE BANK OF ST. LOUIS Research Division
P.O. Box 442 St. Louis, MO 63166
______________________________________________________________________________________
The views expressed are those of the individual authors and do not necessarily reflect official positions of the Federal Reserve Bank of St. Louis, the Federal Reserve System, or the Board of Governors.
Federal Reserve Bank of St. Louis Working Papers are preliminary materials circulated to stimulate discussion and critical comment. References in publications to Federal Reserve Bank of St. Louis Working Papers (other than an acknowledgment that the writer has had access to unpublished material) should be cleared with the author or authors.
The Revenue Performance of Casinos after a Smoking Ban: The Case of Illinois
Thomas A. Garrett Research Division
Federal Reserve Bank of St. Louis St. Louis, MO 63166-0442
Michael R. Pakko Institute for Economic Advancement University of Arkansas – Little Rock
2801 South University Avenue Little Rock, AR 72204-1099
March 2010
JEL Codes: I12, D78, H11
Keywords: Gaming, Gambling, Smoking, Revenue, Casinos
Abstract
Recent state-wide smoking bans are likely the most significant regulations imposed on the casino gaming industry. We explore the effects that the Illinois state smoking ban has had on Illinois casino revenue and attendance as well as casino tax revenue. Our empirical methodology extends and enhances that of previous literature in that we observe a natural experiment in comparing the performance of Illinois casinos with out-of-state casinos (no smoking ban) that share a market with Illinois casinos. Estimates suggest that revenue and admissions at Illinois casinos declined by more than 20 percent ($400 million) and 12 percent, respectively. Calculations reveal that casino tax revenue to state and local governments declined by approximately $200 million.
___________________ The views presented in this paper are those of the authors and do not represent official positions of the Federal
Reserve Bank of St. Louis or the Federal Reserve System.
- 1 -
The Revenue Performance of Casinos after a Smoking Ban: The Case of Illinois
Introduction
Over the past, decade a growing number of state and local governments have enacted
laws that restrict or prohibit smoking in bars, restaurants, and other public places. As of January
2009, fifteen states and 774 city and county jurisdictions across the United States have enacted
laws prohibiting smoking in bars, restaurants, and workplaces. Of the local prohibitions against
smoking, 593 require smoke-free workplaces and 594 require smoke-free restaurants.1
Proponents of smoking bans cite public health benefits, whereas opponents argue that revenue
and employment losses may outweigh the health benefits from a smoking ban. Research on the
economic effects (revenue and employment) of smoking bans has revealed a negative effect for
some businesses, although the magnitude of the smoking ban effect differs across studies.2
In addition to prohibiting smoking in bars and restaurants, many state and local
governments have also enacted smoking bans in gaming establishments. As of January 2009, 15
states have enacted 100 percent smoke-free laws for state-regulated gaming.
3
1 See American Nonsmokers’ Rights Foundation (2009a).
However, the
extension of smoking prohibitions to commercial casinos is a new phenomenon. Of the 12 states
2 Recent studies include Phelps (2006), Adams and Cotti (2007), and Fleck and Hanssen (2008). Phelps (2006) and Adams and Cotti (2007) used nationwide county-level employment data and examined the change in employment at bars and restaurants after communities adopted a smoking ban. Neither study found significant employment changes at restaurants, on average, but both find statistically significant employment declines at bars, with loss estimates ranging from 4 percent to 16 percent. Fleck and Hanssen (2008) analyzed quarterly restaurant sales data for 267 California cities over 25 years. They find a statistically significant 4 percent decline in revenue that is attributed to smoking bans. Other studies on the subject include Dunham and Marlow (2000a, 2000b, 2003), Glantz and Smith (1994), and Pakko (2008b). Difficulties in estimating the effects of smoking bans and likely reasons for the divergent results across studies include differences in the type of ban (partial, full) across jurisdictions, the length of time each ban has been in place, the coverage of the data used in the analyses, and the size of the smoking population relative to the non-smoking population. 3 See American Nonsmokers’ Rights Foundation (2009b). Native American gaming exists in 29 states and is not subject to state and local smoking laws.
- 2 -
with commercial casino gaming, only Colorado and Illinois prohibit smoking in commercial
casinos.4
For several reasons, the policy discussion on prohibiting smoking in casinos has received
separate, and arguably sharper, debate than smoking bans in bars and restaurants.
The smoke-free laws in those two states both took effect at the beginning of 2008.
5 First, the
marginal contribution of one or two casinos to local employment and tax revenue, most notably
in the Midwest and South, is much greater than for a bar or restaurant; in many small
communities, one or two casinos employ a large percentage of the population and also provide a
large percentage of tax revenue to local communities.6
Research on the effects of a smoking ban on casino revenue has thus far focused on the
state of Delaware, which implemented a smoke-free law in December 2002.
Second, many state and local
governments earmark casino revenue to specific programs such as infrastructure and education.
Third, a casino smoking ban is likely to have a greater negative revenue impact on the gaming
industry than a smoking ban would have on the restaurant industry because customers patronize
casinos for longer time periods than they do restaurants. Finally, the view by some that casino
gaming is an immoral activity increases attention to any public policy affecting casino gaming.
7
4 See American Nonsmokers’ Rights Foundation (2009b). Many commercial casinos designate a percentage of their floor space as non-smoking.
In the first study
on the subject, Mandel, Alamar, and Glantz (2005) found that the smoking ban in Delaware had
a negative but statistically insignificant effect on gaming revenue. After correcting for errors in
the Mandel, Alamar, and Glantz (2005) study, Pakko (2006) found that the smoking ban in
Delaware casinos resulted in a loss of about $6 million, which represented a loss of over 12
5 Points of debate have been summarized from transcripts from floor debate in the Illinois General Assembly prior to passage of the Smoke Free Illinois Act in July of 2007. See http://www.ilga.gov/search/iga_search.asp?scope=sentran95 and search by keywords “smoking ban.” 6 For example, contacts at the Casino Queen in East St. Louis, Illinois, report that the city of East St. Louis receives over half of its annual operating revenue from the casino. 7 The three casinos in Delaware are not commercial casinos. They operate as part of the Delaware State Lottery and represent “electronic gaming devices” (slot machines) located at racetracks throughout the state. Casinos operating at racetracks are often called racinos.
- 3 -
percent relative to average monthly revenue in the year preceding the smoking ban. In a
subsequent study, Pakko (2008a) examined the effect of smoking bans on individual casino
revenue in Delaware, finding that casino revenue declined significantly at each of the three
Delaware casinos as a result of the smoking ban, with a total revenue effect of approximately 15
percent. Finally, Thalheimer and Ali (2008) estimate a system of slot machine demand equations
for the three Delaware casinos. They find that the smoking ban in Delaware reduced gaming
demand by nearly 16 percent.
In this paper we extend the economic research on the effect of smoking bans on casino
gaming revenue. Our work has several advantages over previous studies on the subject. First,
the focus of our analysis is casino gaming in the state of Illinois, the first example of a smoking
ban that applies to full-service commercial casinos. Second, we use casino revenue data in
adjacent states to help identify the effect of the smoking ban in Illinois and to examine whether
there were any revenue spillover effects for casinos located within the same markets but not
subject to the smoking ban. This provides for a natural experiment in comparing the
performance of Illinois casinos with out-of-state casinos (no smoking ban) that share a market
with Illinois casinos. Third, we explore the effect of the Illinois smoking ban on casino
admissions as well as casino revenue to generate insight into any difference in the number of
patrons versus intensity of casino wagering after the smoking ban. Finally, we conduct several
analyses using state-level data, market-level data, and individual casino-level data to assess the
impact of the Illinois casino smoking ban on Illinois casinos as well as the casino markets in
neighboring states that border Illinois. Our results have implications for the casino industry and
the state and local governments that receive a portion of their revenue from casino gaming taxes.
- 4 -
Background and Motivation
Riverboat gaming was legalized in Illinois in February 1990 with passage of the
Riverboat Gambling Act, making Illinois the second state in the nation to legalize riverboat
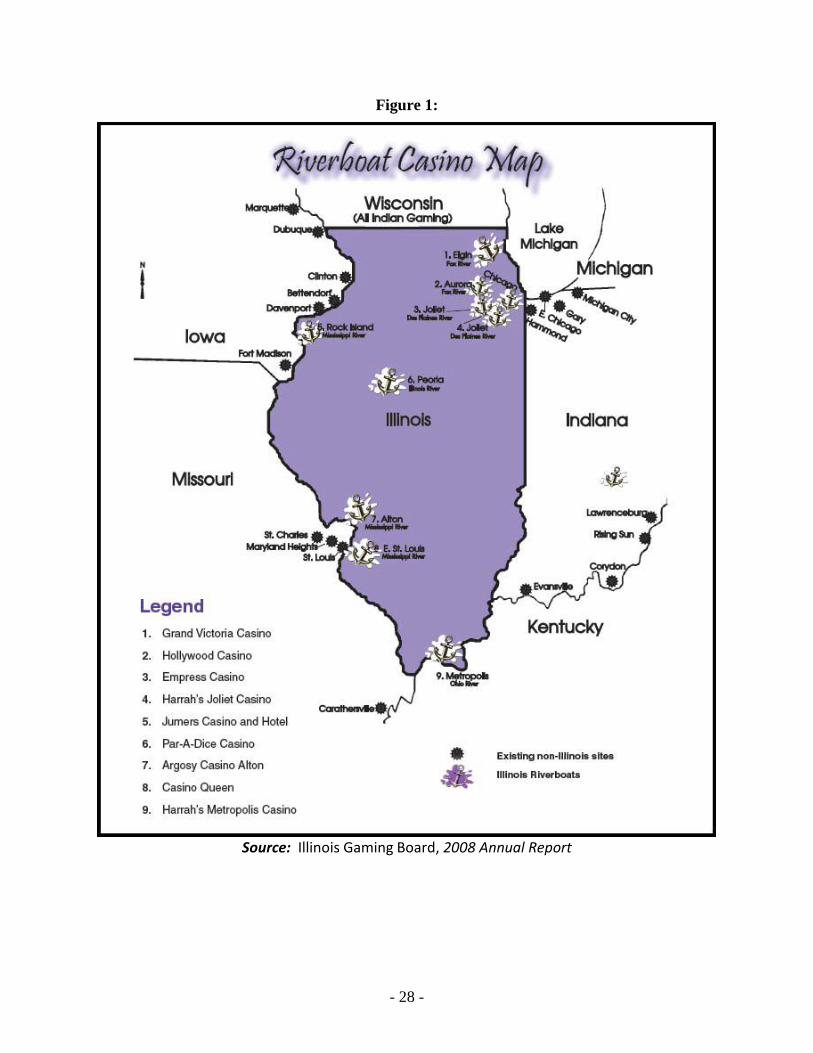
gambling. There are currently nine riverboat casinos in Illinois, eight of which border
neighboring states – two along the Mississippi River across from St. Louis, Missouri; one along
the Mississippi River near Davenport, Iowa; one in southern Illinois on the Ohio River; and four
along rivers in the Chicago area.8 In 2007, Illinois casinos generated nearly $2 billion in
adjusted gross receipts (AGR) and $685 million in casino tax revenue to the state government
(all earmarked for education) and $120 million to the municipalities where the riverboats are
located.9
In July 2007, the state of Illinois passed the Smoke Free Illinois Act (SB0500, Public Act
095-0017).
The state of Illinois ranks 6th in state-wide casino revenue generated, but has the fewest
number of casinos of the top 6 states.
10
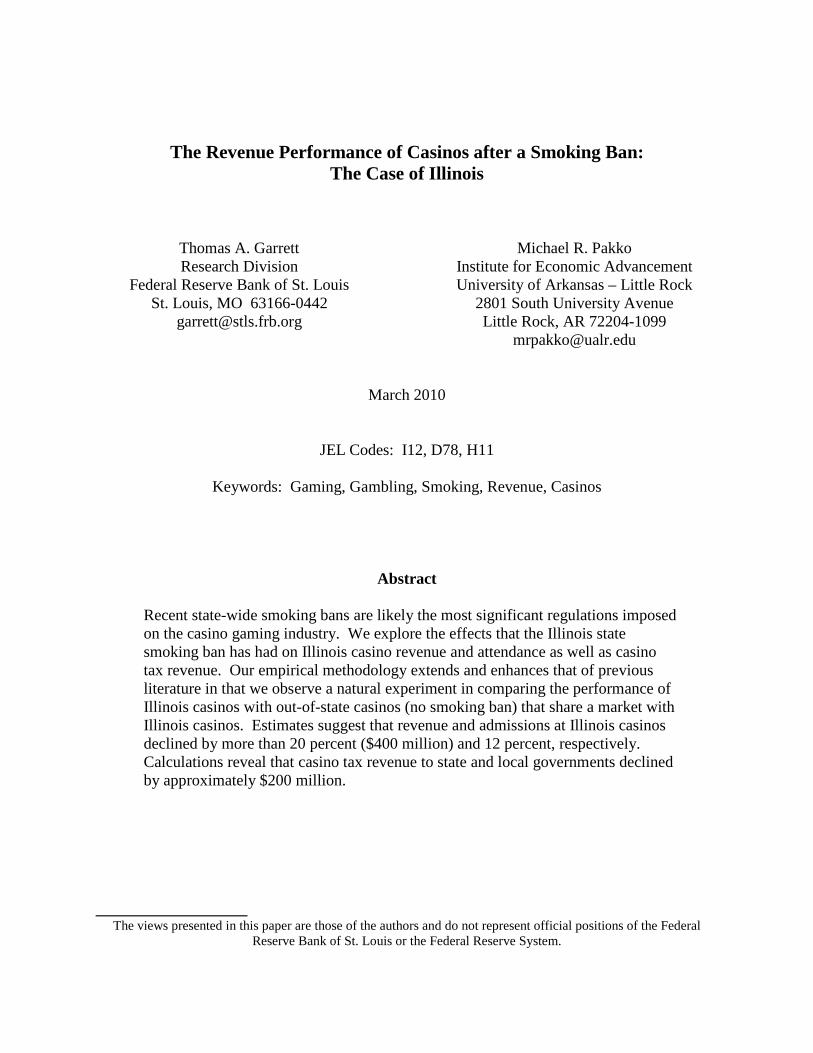
One contribution of our study is that we empirically estimate the effect of the Illinois
smoking ban on the revenue of out-of-state casinos that border Illinois. For our purposes, there
are four distinct casino markets (based on geographic proximity) that each consist of casinos in
both Illinois and the border state (see Figure 1). Each market therefore has Illinois casinos
directly affected by the smoking ban and out-of-state casinos that may have experienced revenue
and visitation spillovers from the Illinois smoking ban. The first market, which we term the
The Act prohibits smoking in public places, places of employment, and
governmental vehicles. During debate, numerous industries including the casino industry
argued, eventually unsuccessfully, for an exemption from the state-wide smoking ban.
8 The ninth casino is in Peoria, which is located in central Illinois and thus faces no nearby out-of-state competitors. 9 See the Illinois Gaming Board 2007 Annual Report (http://www.igb.state.il.us/annualreport/2007igb.pdf.) Adjusted gross revenues are defined as total wagers less player winnings. 10 Full text of the Smoke Free Illinois Act as well as the voting history can be found at http://www.ilga.gov/search/iga_search.asp?scope=sentran95 and by searching with the keywords “smoking ban.”
- 5 -
“Chicago area market,” consists of four casinos along Chicago area rivers and four casino
locations in northwestern Indiana.11 Second, the “Southern” market includes one casino in the
city of Metropolis Illinois, which faces competition from a casino in southern Missouri as well as
one in southern Indiana. The third market, the “Quad City market,” has one casino on the
Illinois side of the Mississippi River and four nearby riverboat casinos on the Iowa side of the
Mississippi River.12 Finally, the “St. Louis market’ includes three casinos in Missouri and two
casinos in Illinois that are all located within the St. Louis metropolitan area.13
The conceptual basis for the hypothesis that a smoking ban will have a negative effect on
casino revenue (for those casinos in the smoking ban state) is straightforward: Casino patrons
who smoke will chose not to visit the now-smoke-free casino or will gamble less as a result of
taking breaks from gambling to go outside the facility to smoke. The effect of the smoking ban
will depend on the size of these effects, and the size of each effect is a function of casino patron
smoking rates.
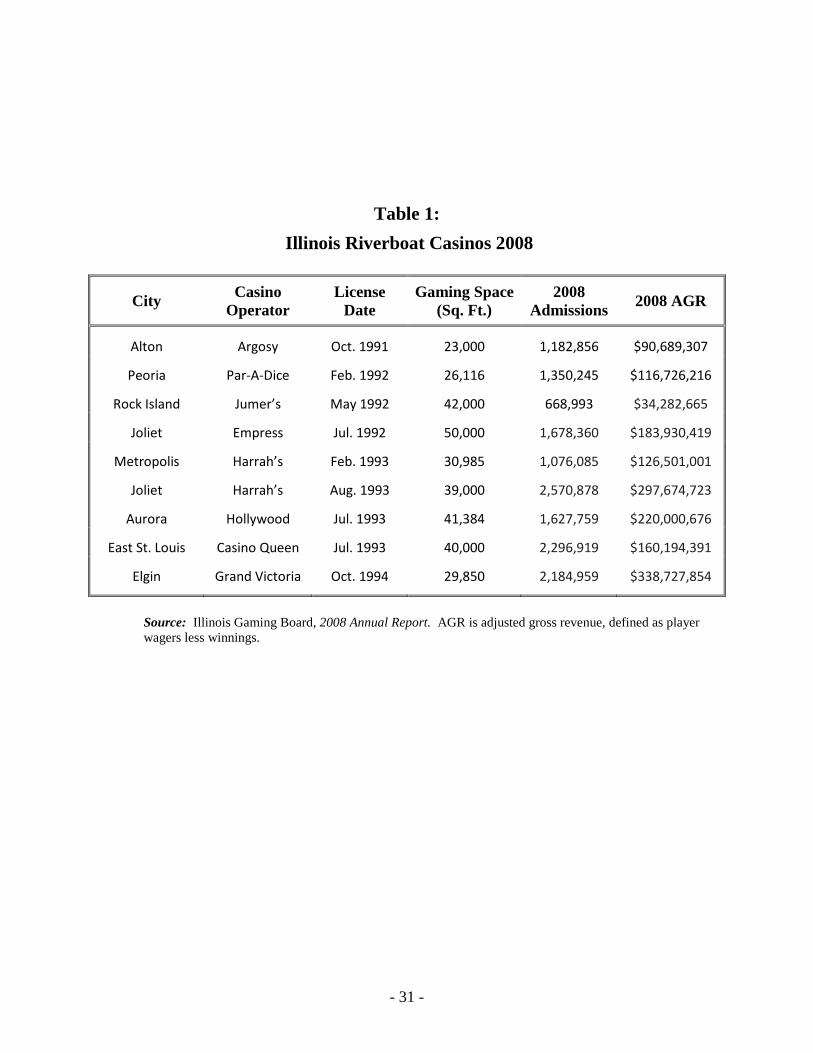
A listing of the
Illinois casinos used in our analysis, along with descriptive statistics, is provided in Table 1.
14
One key factor in the potential revenue loss from a casino smoking ban is the percentage
of gamblers who smoke. Those in the casino industry argue that a smoking ban will unfairly hurt
their industry because casino patrons have a higher smoking rate than that of the general
By examining both casino revenue and casino admissions, we provide insights
into whether fewer patrons visited the Illinois casinos after the ban or whether wagering by the
same number of patrons is less (thus suggesting no substitution with area casinos but rather less-
intense wagering).
11 We treat the Majestic I and Majestic II—two casinos in Gary, Indiana, sharing a common admissions gate—as one casino location. 12 The Quad Cities include Davenport (Iowa), Moline (Illinois), Rock Island (Illinois), and Bettendorf (Iowa). 13 Data from the Lumiere Place casino, which opened in December 2007, is treated separately from those of the pre-existing casinos in the St. Louis market. 14 We assume that the smoking ban will not induce a significant number of people to begin gambling as a result of the ban.
- 6 -
population. This premise is included in the work of Pritsos, Pritsos, and Spears (2008).
However, these authors find evidence that the smoking rate (about 21 percent) in casinos located
in Nevada (Las Vegas, Reno, and Lake Tahoe) is not statistically different from that of the
general population. It may be the case, however, that smoking casino patrons have higher
gaming expenditures than non-smoking patrons. Petry and Oncken (2002) conducted a survey of
gamblers who smoke and those who do not and found that smokers gambled on more days and
spent more money gambling than did non-smoking gamblers. Thus, at a minimum, a casino
smoking ban is likely to influence about 20 percent of all casino patrons and 20 percent of casino
revenue if one assumes that the smoking rate for gamblers is the same as the general population
and gamblers who smoke do not gamble more than non-smoking gamblers.15
One confounding issue with estimating the effects of the smoking ban is that the timing
of the ban coincides with a general economic downturn. The 2008 Annual Report of the Illinois
Gaming Board reports uncertainty about the relative importance of the two effects:
There are two factors underlying the reductions in this year’s gaming revenues. The first is the smoking ban implemented by the Smoke Free Illinois Act (Public Act 95-0017), effective January 1, 2008. According to the casino industry, implementation of this Act has caused the AGR [adjusted gross receipts] per admission to fall. This is because habitual smokers take smoking breaks, during which time they do not engage in gaming activity. The second factor is the downturn in the Illinois and national economies. As a discretionary form of spending, gaming expenditures are especially prone to reductions during hard economic times. The relative importance of the above two factors has not yet been quantified with certainty.
- 2008 Annual Report, Illinois Gaming Board, p. 12
15 The adult smoking rates in 2007 for Illinois, Indiana, Missouri, and Iowa were, respectively, 20.1 percent, 24.1 percent, 24.5 percent, and 19.8 percent. The U.S. smoking rate in 2007 was 19.3 percent. Data from the Centers for Disease Control and Prevention were compiled by the Henry J. Kaiser Family Foundation. See http://www.statehealthfacts.org/comparemaptable.jsp?ind=80&cat=2.
- 7 -
Our objective in this paper is to statistically disentangle the factors underlying the decline
in Illinois casino revenue. We approach the issue by estimating multiple linear regression
models for casinos in Illinois, as well as in the surrounding states that also have riverboat
casinos: Iowa, Indiana, and Missouri. The model includes controls for seasonality, general
economic conditions, previous policy changes, and weather events.
Empirical Model and Data
We follow previous literature by capturing the revenue impact of the smoking ban using a
dummy variable in a regression equation that includes controls for trend, seasonality, and
economic activity. We also include controls for specific exogenous factors, including changes in
public policy as well as exceptional weather events. Specifically, the regression model takes the
general form:
log( ) ( ) ( )t t t ty c Trend t Seas t X Smokefree uβ γ= + + + + + (1)
where yt represents either adjusted gross revenue or admissions. Trend(t) and Seas(t) represent
general trend and seasonal components, and β is a vector of coefficients associated with a matrix
of variables (Xt) that measures overall economic activity, policy changes, and other exogenous
events. The impact of the smoking ban is estimated by γ, the coefficient on a dummy variable
that takes on the value of one since the implementation of the Illinois smoking ban (beginning in
January 2008) and zero before.
Data
Monthly data for adjusted gross receipts (AGR) and total admissions for 1997 through
2008 were readily available on websites of the government gaming commissions for Illinois and
- 8 -
its contiguous states with riverboat gaming: Iowa, Indiana, and Missouri. Details about the
compilation of the data are reported in the Appendix.
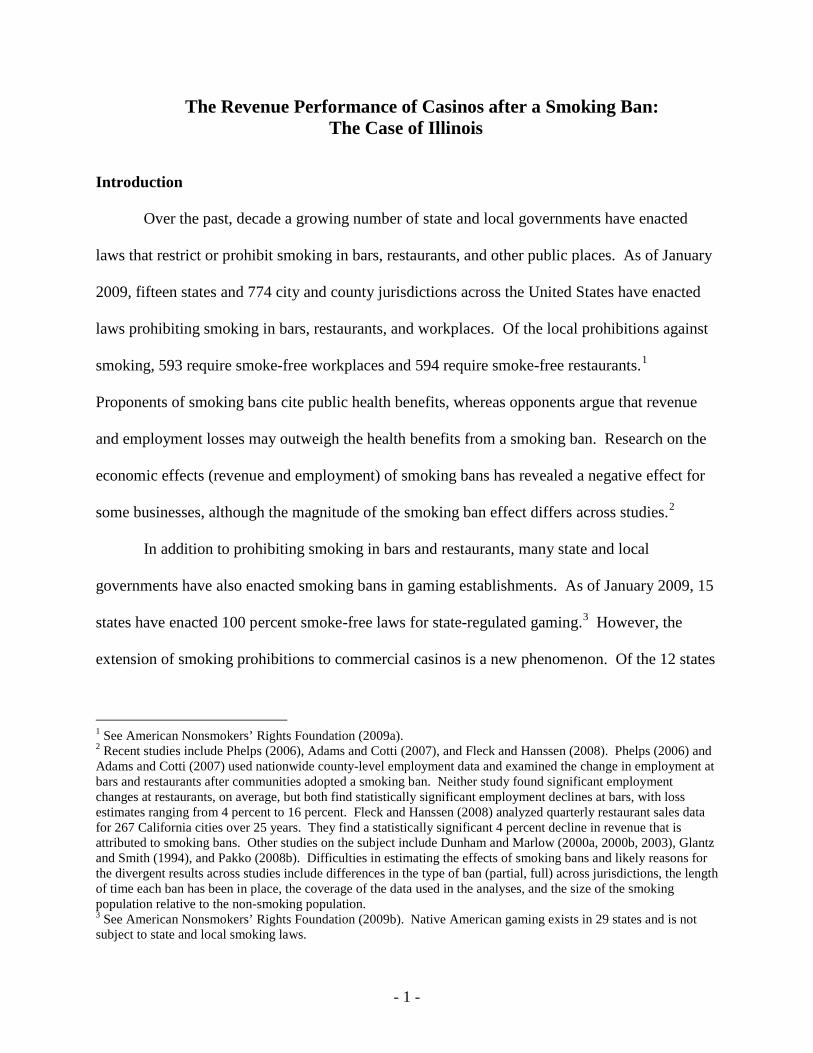
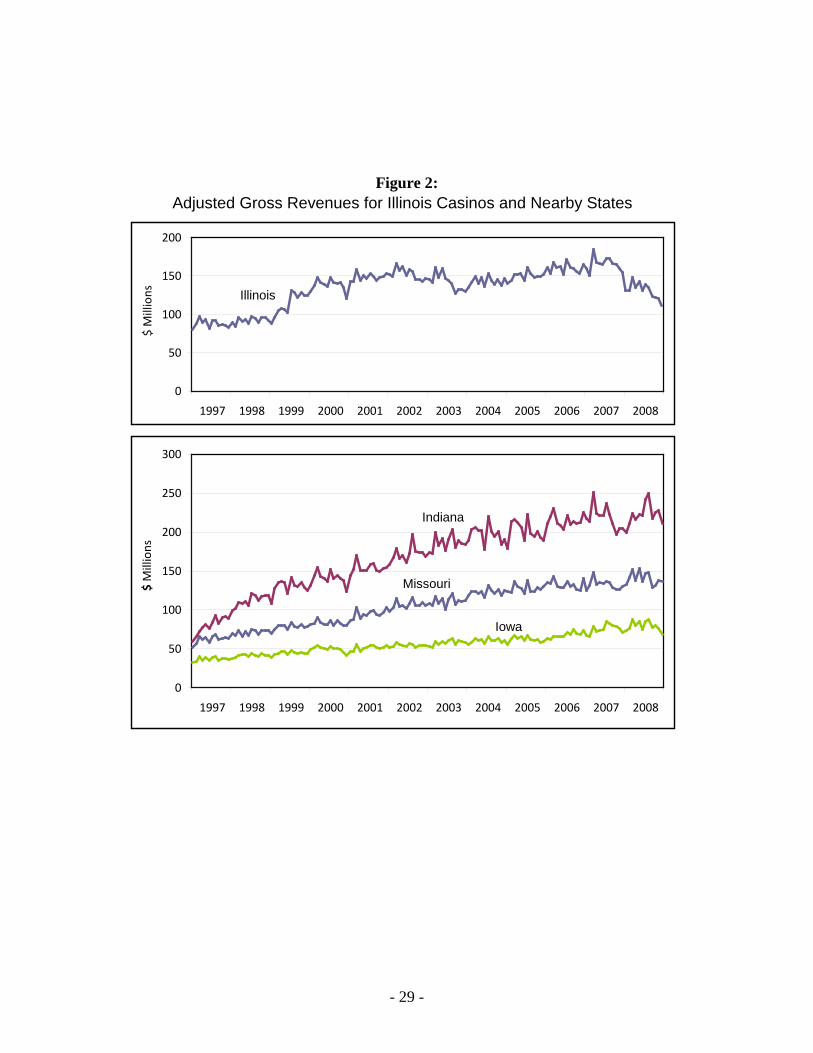
Figure 2 shows statewide revenue over the sample period. Data for Illinois and its
surrounding states all show an upward trend, with slowing growth that might be associated with
the maturation of a relatively new industry.16
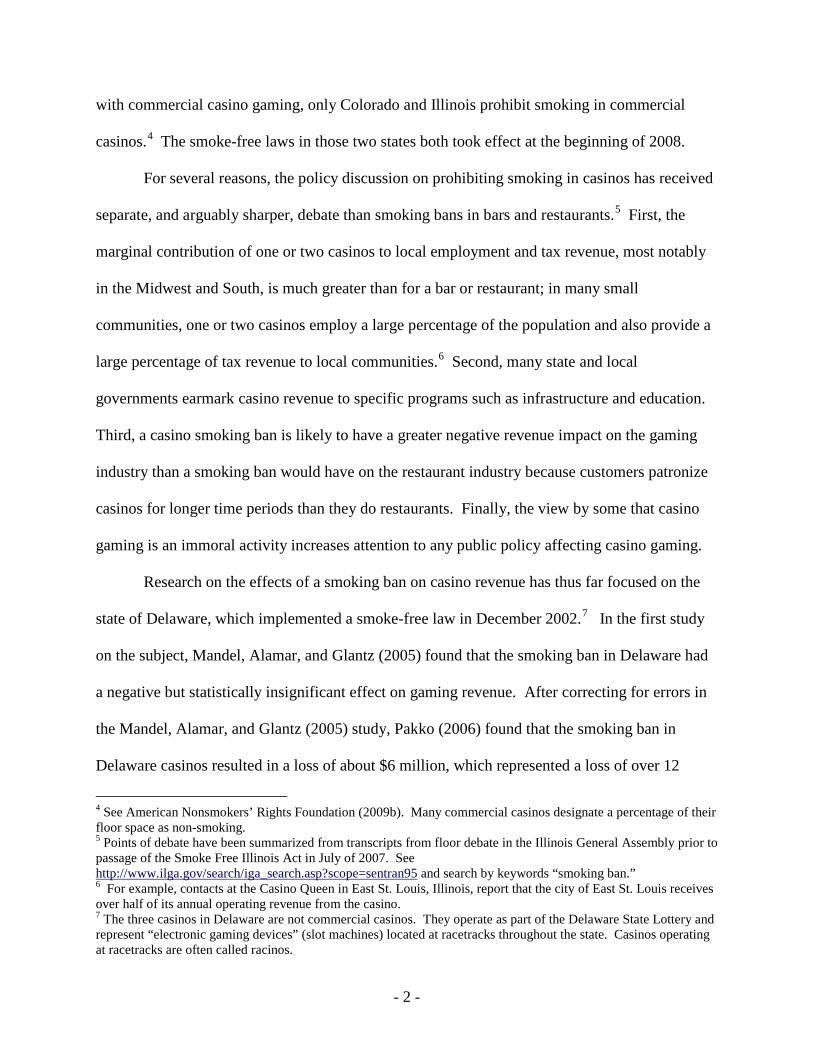
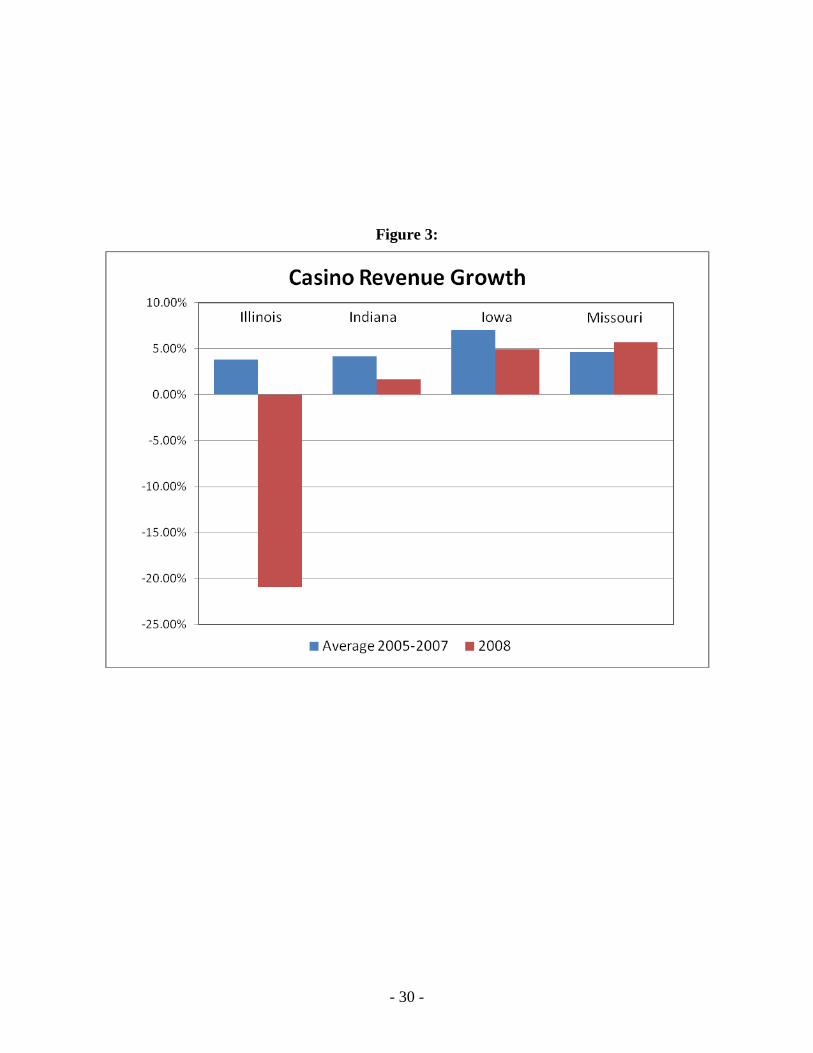
Figure 3 presents the data in a way that highlights the unique experience of Illinois
casinos during 2008. In the three previous years, casino revenue in all four states grew at rates of
4 to 6 percent. During 2008, revenue in the states surrounding Illinois continued to expand
(albeit at lower rates in Indiana and Iowa). In Illinois, however, revenue plummeted by nearly
21 percent. This drop represents a decline of nearly 25 percent relative to trend.
Each of the series also displays a pronounced
seasonal pattern. The data for Illinois also appears to include structural breaks that can be
associated with specific policy changes enacted by the state legislature (detailed below). Most
prominent among these breaks is the sharp fall in revenue in 2008, coinciding with the
implementation of the Illinois smoking ban. Although a nationwide recession began at the same
time—and might be expected to depress gaming revenue—the downturn in Illinois represents a
clear departure from the experiences of its surrounding states.
The significance of this difference between the experience of Illinois and its neighbors is
explored first in regressions for statewide totals. For this exercise, explanatory variables in the X
matrix include CEAIit, state-level indexes of coincident economic activity for each of the four
states (from the Federal Reserve Bank of Philadelphia); Snowit, a measure of monthly snowfall in
16 Mandel et al. (2005) and Pakko (2006, 2008a) cite this factor as an explanation for a significant quadratic trend in the revenues of gaming venues in Delaware. For the four states considered here, riverboat gaming was established in the early to mid 1990s.
- 9 -
each state; and dummy variables specifying particular policy changes or exogenous events. 17
Two specific policy changes for the Illinois casino are represented by Jul99, the date when
continuous riverboat boarding took effect, and Jul03, the date of a significant increase in the tax
rate imposed on admissions and wagering. 18,19 Because we have an interest in evaluating
spillovers from Illinois policy changes on gaming in surrounding states, these two dummy
variables are also included in the regressions for Indiana, Iowa and Missouri. Additional dummy
variables are relevant for the other states: Aug02 is the date on which Indiana casinos began
continuous boarding, Apr-May2001 is a dummy variable for a period during which Iowa casinos
on the Mississippi river were closed due to flooding, and Sep-Nov99 controls for the phased-in
adoption of continuous boarding in Missouri.20
The regressions each include a constant, a trend,
and a trend-squared term. To account for seasonality, a full array of seasonal dummies is also
included in each regression (coefficients not reported). The residuals of the regressions are
modeled to include an AR(1) term. Standard errors for all regressions are calculated using the
heteroskedasticity/autocorrelation adjustment procedure of Newey and West (1987).
Empirical Results: State-Level Analysis
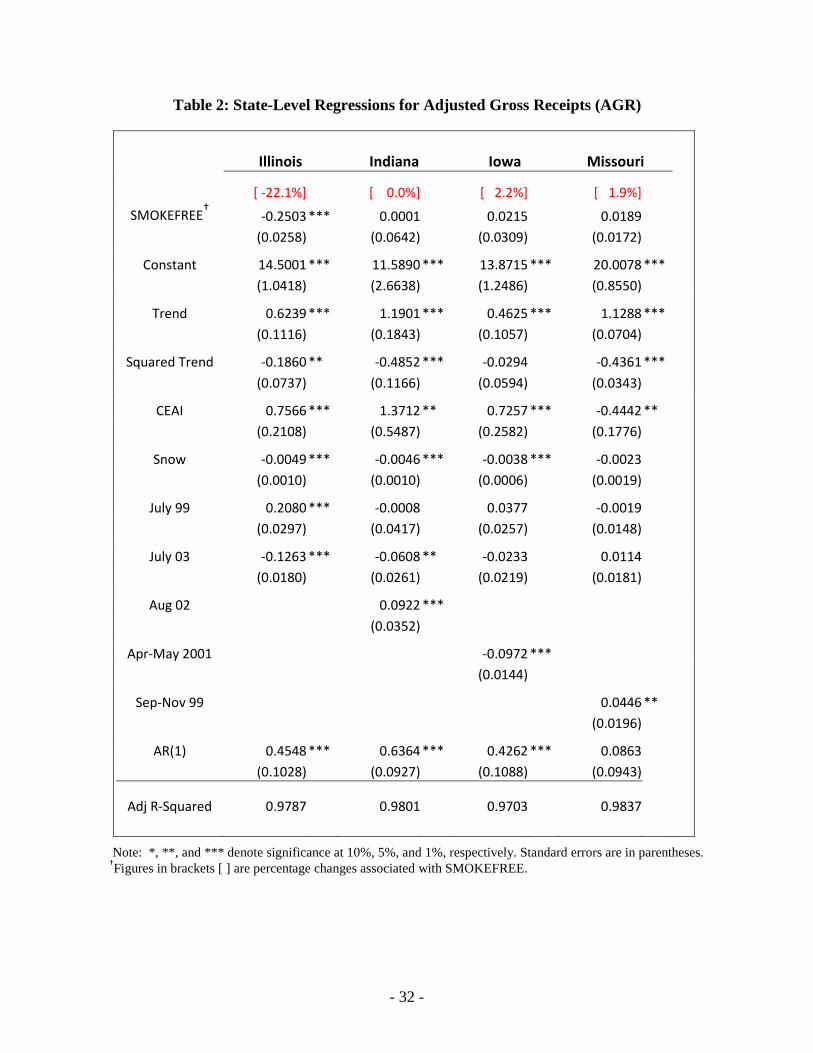
The results for statewide totals of AGR are shown in Table 2. The regressions achieve a
reasonable fit to the data, with each of the state-specific policy variables displaying a statistically
17 Monthly snowfall totals were obtained from the National Oceanographic and Atmospheric Administration (NOAA). The data are measured in inches, represented as deviations from “normal” (1971-2000 averages). For the four states, snowfall data were collected for a representative centrally located city: Illinois-Urbana, Indiana-Indianapolis, Missouri-Columbia, and Iowa-Quad Cities (Moline, IL). 18 Prior to July 1999, riverboats took excursions that limited admittance to specific cruise departure times. After that date, the boats were allowed to remain permanently docked, with continuous open boarding. 19 Although the tax changes did not affect customers directly, the response of casino operators was to cut back on expenses and to lower win-ratios. The effect of these responses had a demonstrable effect on both attendance and revenues. See Mellen (2003). 20 Continuous boarding was allowed for St. Louis area riverboats in September 1999, with the policy extended across the rest of the state in November. To account for this phase-in, the variable SepNov99 takes a value of 0.5 for September and October and a value of 1.0 thereafter.
- 10 -
significant impact (although there is no evident impact of Illinois policy variables on the revenue
of other states). The key variable of interest—the dummy variable representing the Illinois
smoking ban—enters with a statistically significant coefficient of -0.25, representing a
percentage loss of approximately 22 percent.21
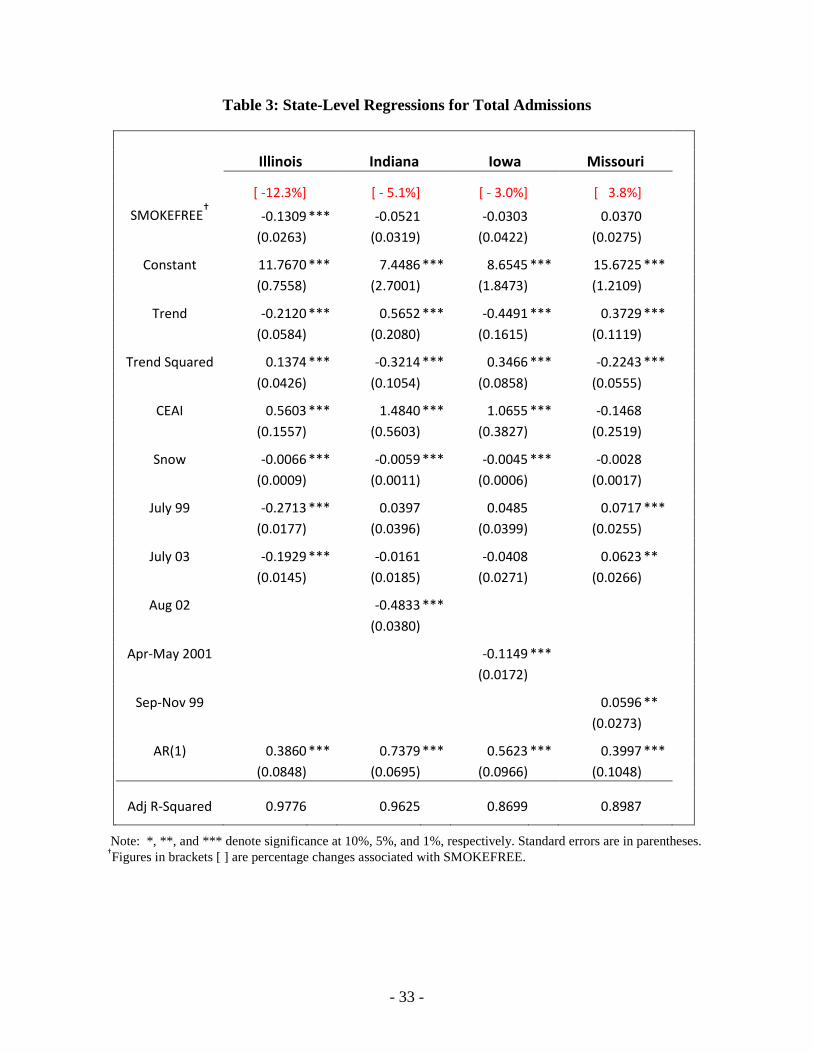
Results for regressions using the natural logarithm of total admissions as the dependent
variable are reported in Table 3. The coefficient on the smoking ban dummy variable for Illinois
is negative and statistically significant, although the magnitude of the decline is considerably
smaller than found for AGR. For admissions, the smoking ban dummy is associated with mixed
changes in the other states; however, the point estimates are small and not statistically
significant.
Coefficients on the smoking ban dummy variable
for revenue in surrounding states are all positive. However, the point estimates are small and not
statistically significant. Hence, there is no clear evidence that the losses at Illinois casinos are
associated with revenue increases in nearby states.
22
The statistically significant declines in statewide admissions and revenue in Illinois
suggest that the smoking ban affected demand for casino gaming along both extensive and
intensive margins. These findings are consistent with the survey results of Petry and Oncken
(2002), which suggests that smoking patrons visit casinos more often and wager more money.
The results in Tables 2 and 3 suggest that smoking patrons continued to visit the casinos, but
perhaps did not visit as often, stay as long, or wager as much as they did before the ban. To
further investigate this proposition, and to evaluate more carefully the possibility of demand
21 The conversion of regression coefficients to percentage changes uses the formula exp(γ)-1 (Halvorsen and Palmquist, 1980). 22 In these and subsequent regressions, the coefficient on the open boarding policy change of July 2003 is a large, negative, and statistically significant. This is an artifact of the counting of admissions. Before open boarding, patrons who stayed for more than one “cruise” were double counted. This practice ended with open boarding.
- 11 -
spillovers into neighboring states, we now turn to an analysis of data for individual casinos in the
context of geographically defined markets.
Empirical Results: Individual Casinos in Illinois
Table 4 presents the coefficient estimates for the Smokefree dummy variable in
regressions for each of the nine individual casinos in Illinois.23 For the sake of brevity in
presentation here, the full regressions results for each casino are reported in a separate online
Appendix.24 All regressions include the policy variables for July 1999 and July 2003, along with
a number of casino-specific events, described in the paper’s Appendix.25
The first column of Table 4 shows the results for revenue (AGR). The impact of the
smoking ban on Chicago area AGR is remarkably uniform, with each showing losses of over 20
percent. For casinos outside the Chicago area, the revenue losses range from less than 10 percent
to nearly 30 percent. In every case, however, the coefficients from the AGR regressions are
negative and statistically significant.
The second column of Table 4 reports the findings when total admissions is used as the
dependent variable. A comparison of these estimates with those found for revenue highlights the
importance of extensive versus intensive changes in demand. In some cases, admissions
declined by magnitudes similar to the fall in revenue (e.g., the Empress casino in Joliet). In other 23 The casino in Rock Island opened a new, expanded facility in December 2008, resulting in a one-month surge in attendance and revenues at the end of the sample period. To account for this event, regressions for Rock Island (and other casinos in the Quad Cities market) were estimated using data through November 2008 only. 24 See http://research.stlouisfed.org/econ/garrett/2009-027appendix.pdf. 25 For example, the two casinos in Joliet engaged in major renovations or built new facilities in October 2001 (Harrah’s) and May 2003 (Empress). The Hollywood casino in Aurora opened new facilities in February and June of 2002. Renovations and new facilities were also relevant for the Par-A-Dice in Peoria (Sept. 2005 and March 2007) and the Casino Queen in East St. Louis (August 2007). For the casino in Metropolis, Illinois, river conditions created transitory disturbances to business, which we modeled with pulse dummy variables. All regressions for the individual casinos include the Coincident Economic Activity Index for Illinois. Snowfall variables are as follows: For Chicago area casinos, the snowfall at Chicago’s Midway Airport is used; regressions for the casinos in East Peoria and Metropolis use snowfall totals for Urbana, Illinois. For the Rock Island casino, snowfall for Moline, Illinois, is used. For the Alton Belle and Casino Queen, the snowfall for St. Louis, Missouri, is used.
- 12 -
cases, declines in attendance were quite smaller than the corresponding declines in AGR. In the
majority of cases, attendance figures were significantly lower after the imposition of the smoking
ban, but the magnitude of the declines were smaller than the declines in revenue This
observation supports the results reported for the state-level regressions shown in Tables 2 and 3.
Before examining regional markets more closely, it is worth noting that the one casino
that seems least affected by the smoking ban is the one that faces the least competition - the Par-
A-Dice casino in Peoria. Its location in the center of the state sets it approximately 90 miles
from the nearest competition.26
Empirical Results: Regional Casino Markets
This is clearly one factor that could account for the relatively
good performance of that particular venue.
It is possible that factors in each of the four geographic market areas of the state are
relevant for the assessment of the smoking ban’s impact on Illinois casinos. After all, we are
limited to measuring the effects of the smoking ban solely by the timing of its imposition. It
might still be the case that the 2008 recession had an impact on casino attendance and revenue
that was not completely captured by the regression analysis of Illinois casinos alone. A
comparison of the Illinois casinos with those in common markets but across state lines provides
some insight in this possibility.
Chicago Market
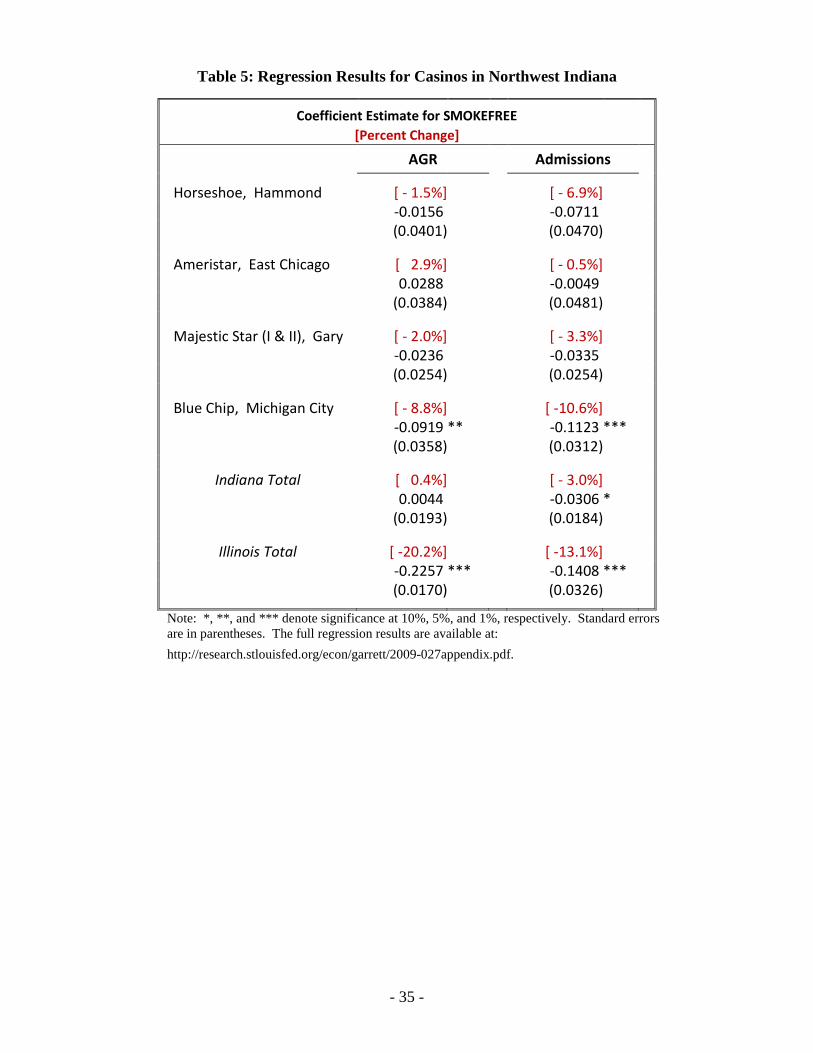
The largest casino market is the Chicago area market. In addition to the four casinos in
Illinois, there are four casino locations in northwest Indiana that are part of the greater Chicago
26 Boyd Gaming Corporation, 2008 Annual Report
- 13 -
metropolitan area.27
In contrast to the AGR results for Illinois casino revenue, for which the coefficients on
the smoking ban dummy variable were all negative and significant, no clear pattern emerges for
the Indiana casinos. There is only one case (the Blue Chip casino) for which the smoking ban
dummy is associated with a significant negative effect, and this might be associated with the
impact of the competing casino in Michigan that opened only 5 months before the Illinois
smoking ban was implemented. Similarly, there is no clear pattern of changes in admissions at
Indiana casinos after January 2008. Again, with the exception of the Blue Chip casino,
coefficients on the smoking ban dummy variable are very small and not statistically significant.
Table 5 reports regression coefficients on the smokefree variable for AGR
and total attendance for these locations.
28
The clear differences between the Indiana casinos and the Illinois casinos in the Chicago
area market are summarized in the last two rows of Table 5. The four casinos in Illinois show a
revenue decline of approximately 20 percent after the smoking ban implementation, whereas the
Indiana casinos show no significant decline in revenues as a result of the Illinois smoking ban.
Admissions figures show a decline of about 13 percent in Illinois, compared to a decline of 3
percent at the Indiana casinos.
27 The Majestic Star casinos in Gary Indiana are two separate gaming floors that share a common admission gate. For the purposes of this analysis, the revenues of these two casinos are combined. 28 The full regression results – reported in the Appendix – include the July 1999 and July 2003 dates in order to evaluate the prevalence of cross-border spillovers from policy changes in Illinois. There is little evidence of such spillover effects from these events, suggesting that it is not surprising for the smoking ban to show no significant, measurable effects on the nearby Indiana casinos. The regressions summarized in Table 5 also include a dummy variable for August 2007, the opening date for a new tribal casino in Michigan, only 10 miles north of the Blue Chip in Michigan City, Indiana. The impact of this event on the revenues and admissions are large and significant for the Blue Chip casino itself, but are not evident for other casinos in the market. The regressions for casinos in northwest Indiana all use the CEAI for Illinois and snowfall totals for Chicago (Midway). The regressions for Indiana casinos also include two Indiana-specific events: In August 2002 the Indiana Gaming Commission allowed continuous boarding. In two cases, major renovations were also associated with increased admissions and revenues: in August 2008 for the Horseshoe casino in Hammond and in February 2006 for the Blue Chip casino in Michigan City.
- 14 -
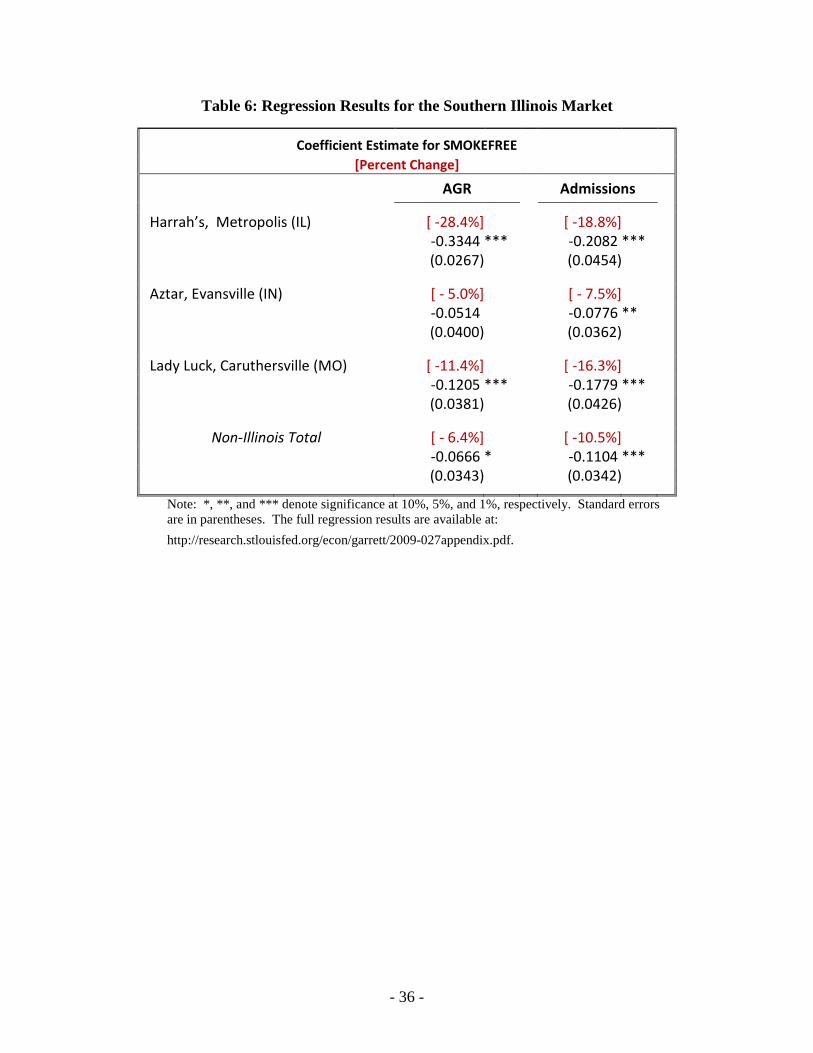
Southern Illinois Market The Harrah’s casino in Metropolis Illinois faces nearby competitors in two states: Casino
Aztar in Evansville, Indiana, and the Lady Luck in Caruthersville, Missouri. Of all the nine
Illinois casinos, the Metropolis casino shows the largest losses in Table 4. The coefficients on
the smokefree dummy variable for Metropolis are reproduced in the first row of Table 6 for
comparison with results for the Evansville and Caruthersville casinos.
In Table 6, the dummy variable for the Illinois smoking ban is associated with negative
responses at each of the non-Illinois casinos, for both AGR and admissions. In the case of
Caruthersville, both declines are statistically significant. These findings suggest that the
regression model might not be capturing the effect of an overall slowdown in local market
conditions, with the smoking ban dummy variable picking up some of that effect. Indeed, in the
final row of Table 6, regressions for the sum of the two non-Illinois casinos display declines. In
the case of the admissions regression, the downturn is clearly significant. If the dummy variable
is overstating the revenue impact of the smoking ban for the Metropolis casino by over 6 percent,
and overstating the impact on admissions by over 10 percent, that still leaves a relative decline of
over 20 percent for AGR and about 8 percent for admissions—broadly consistent with the results
for the Chicago market.
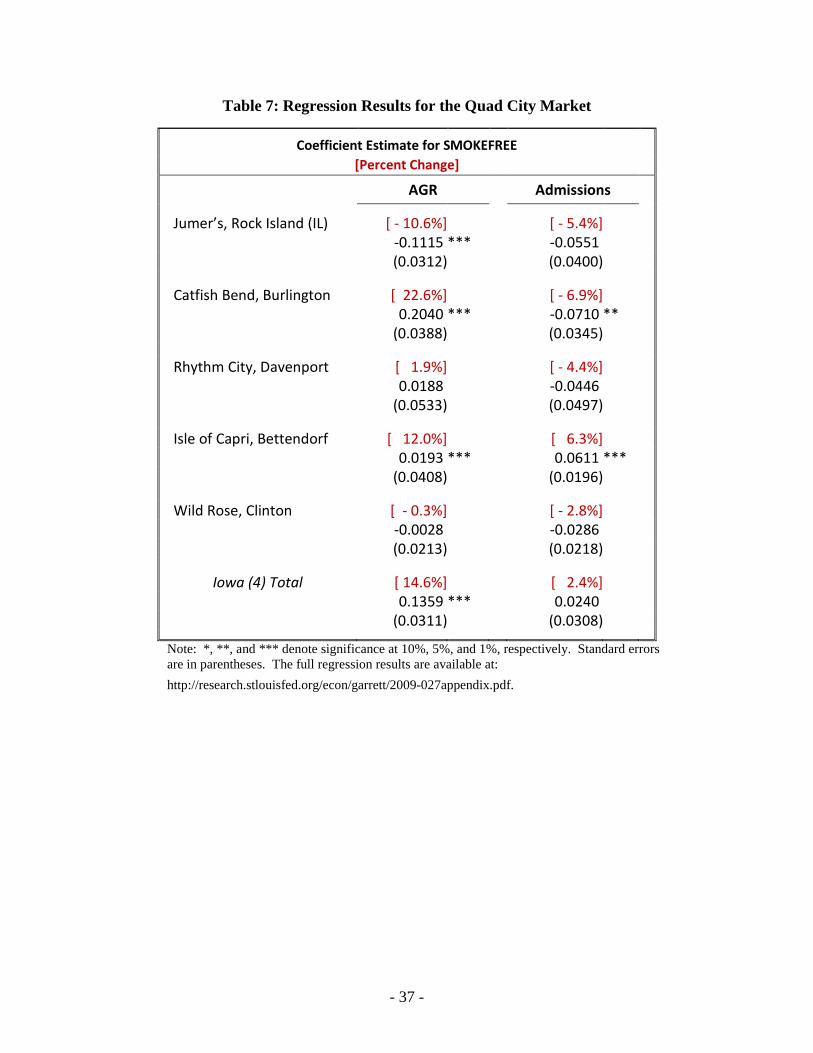
Quad Cities Market
In the northwest corner of Illinois, Jumer’s Casino in Rock Island faces an array of
competitors across the Mississippi river in Iowa. Table 7 compares the experience of Rock
Island with its four nearest competitors.
The first row of Table 7 shows the coefficient estimates for Rock Island, which suggest
losses of about 10 percent for revenue (statistically significant) and 5 percent for admissions (not
- 15 -
significant). In terms of revenue impact, estimates for the four casinos across the river in Iowa
stand in sharp contrast: The smoking ban dummy variable picks up revenue increases of nearly
23 percent for Catfish Bend and 12 percent for Isle of Capri in Bettendorf. For the four Iowa
casinos combined, the regression model shows a significant increase of nearly 15 percent. In the
same sense that estimates from out-of-state casinos in the southern Illinois market might indicate
smaller revenue impacts than directly measured by the Smokefree variable in the Metropolis
regression, the estimates for the Iowa market show that the Rock Island casinos lagged its
competitors by more than the smoking ban dummy variable would suggest. A 10 percent decline
in Rock Island revenue compared with a 14 percent increase in Iowa casino revenue overall
places the relative performance for Rock Island roughly 24 percent below its Iowa competitors.
For the regressions using total admissions, two of the four Iowa casinos show statistically
significant effects associated with the smoking ban dummy variable. Despite the large increase
in revenue at Catfish Bend, admissions were down by about 7 percent. In contrast, admissions at
the casino in Bettendorf show a statistically significant increase of 6 percent associated with the
smoking ban. For the regression using admission totals for the four Iowa casinos combined, the
coefficient is positive but not statistically significant.
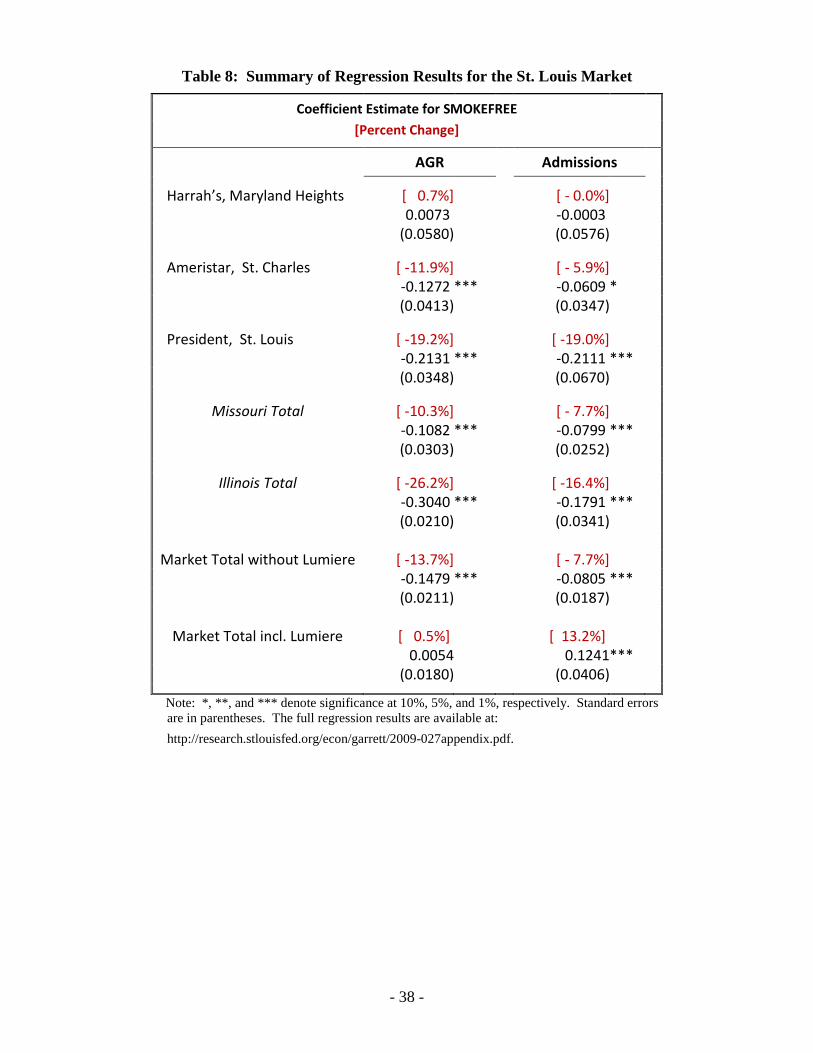
St. Louis Market
The final market to consider is the St. Louis area market. This market includes two
casinos on the Illinois side of the Mississippi river: the Argosy in Alton and the Casino Queen in
East St. Louis. The regressions in Table 4 show that these two venues experienced losses of over
25 percent in revenue and between 15 and 20 percent declines in attendance. However, the
situation in the St. Louis market is complicated by the opening of a new casino and hotel in St.
Louis city, the Lumiere Place Casino, which opened in mid-December 2007. The timing of its
- 16 -
opening – coinciding so closely to the implementation of the Illinois smoking ban – makes it
nearly impossible to disentangle the effects with certainty. Nevertheless, careful analysis can
yield some findings that are at least suggestive.
Table 8 presents results for the three other casinos on the Missouri side of the border,
without taking any explicit account of the opening of Lumiere Place. Two of the three show
statistically significant declines in revenue: Ameristar Casino in St. Charles registered a decline
of nearly 12 percent, and the President Casino (located less than a mile from the new casino)
shows a revenue loss of nearly 20 percent associated with the smoking ban. On the other hand,
the regression for Harrah’s in Maryland Heights shows a small, positive point-estimate for the
smoking ban dummy (although it is not statistically significant). The fourth and fifth rows in
Table 8 compare the sums of the three Missouri casinos’ revenue and attendance figures with
those using the sum of the two Illinois casinos. The Missouri total shows a revenue decline of
about 10 percent, with the two Illinois casinos showing a loss of more than 26 percent. For
admissions, the Illinois casinos were down by over 16 percent, as compared with less than 8
percent for the three Missouri casinos.
The final two rows of Table 8 indicate the impact that Lumiere Place had on revenue and
admissions for the St. Louis market as a whole. Not including Lumiere’s revenue, AGR in the St.
Louis market was down by 14 percent as a result of the smoking ban. When Lumiere’s revenue
is included, the coefficient on the smoking ban dummy is slightly positive but not significant.
For admissions, a negative coefficient for the total without including Lumiere is significant, but
when Lumiere’s attendance is added to the total, the coefficient is positive and significant. We
can conclude that overall, casino revenue in the St. Louis market was consistent with no unusual
- 17 -
aggregate changes in revenue in 2008, but with an increase in overall casino attendance that is
likely associated with the novelty of a new casino.
If we assume (somewhat simplistically) that the opening of Lumiere Place had the same
impact on all other casinos in the market, the relatively poorer performance of the Illinois casinos
still leaves room for the conclusion of a significant impact of the smoking ban. However, it is
unlikely that the opening of a new competitor affected all other casinos in the market identically.
Indeed, evidence from the Chicago market suggests that geographic proximity is an important
determinant of competitive impact.
The results in Table 8 are consistent with that hypothesis as well. The President casino in
downtown St. Louis – less than 0.5 miles from the new casino – showed large losses in 2008 for
both revenue and admissions. On the other hand, evidence for effects on the other two casinos in
Missouri is mixed: These casinos are both about 21.5 miles from the new Lumiere Place. We
might expect, therefore, that the Casino Queen in East St. Louis – about 1.7 miles driving
distance from Lumiere Place – lost more business to its new competitor than did the casino in
Alton, Illinois (which is, coincidentally, about 21.5 miles from Lumiere Place).
A comparison of Missouri and Illinois totals in Table 8 provides some indication of the
magnitude of the smoking ban’s effect relative to the effect of new competition in the market.
The 2008 dummy variable is associated with revenue declines at the three Missouri casinos of
only 10 percent, compared with 26 percent for the two Illinois casinos. For admissions, the
comparison is -16 percent for the Illinois casinos versus -8 percent for the Missouri casinos.
Despite the difficulty of estimating specific values for the effect of the smoking ban on
each of the two Illinois casinos in the St. Louis market, the results of this exercise are generally
consistent with the findings from other markets: The smoking ban was associated with
- 18 -
significant revenue declines and smaller but still significant declines in admissions at Illinois
casinos. For the St. Louis market, it may be difficult to be precise about the magnitudes, but the
evidence is qualitatively consistent with outcomes in other markets around the state.
Interpreting the Regional Market Estimates
The exercise of estimating the impact of the Illinois smoke-free law on individual casinos
and comparing those estimates with the experience of nearby out-of-state competitors can be
interpreted as a robustness check on our results for total statewide revenue and attendance. To
the extent that local economic conditions or other exogenous factors affect our measurement of
the smoking ban’s effect, some adjustment to our raw estimates might be in order.
Table 9 summarizes our estimates for the smoking ban’s impact on AGR and attendance
figures: first, in terms of the unadjusted estimated coefficients on the smokefree dummy variable
and second with an adjustment for the estimates found for out-of-state casinos in the relevant
geographic market. That is, we calculate the market-adjusted effect by taking the difference
between the estimated coefficient for each individual casino and the coefficient found for the
out-of-state casinos in the same market. So, for example, the adjusted coefficient for Harrah’s in
Metropolis (from Table 6) is -0.3344 - (-0.0666) = -0.2678, or -23.5 percent. This “difference in
differences” calculation provides an alternative set of estimates for the statewide impact of the
smoking ban.29
The results for the Chicago-area market are the most straightforward to interpret. Each of
the four Illinois casinos in the Chicago area suffered revenue losses of more than 20 percent.
The corresponding estimates for competing casinos in Indiana show only small changes that are
not generally significant. Similarly, our estimates of the smoking ban’s impact on total
29 The specific coefficients used for these comparisons are those reported in Table 5, line 5 (Chicago); Table 6, line 4 (Southern Illinois); Table 7, line 6 (Quad Cities); and Table 8, line 4 (St. Louis).
- 19 -
attendance at Chicago area casinos shows a downturn of more than 13 percent, while the
coefficient estimates for Indiana casinos in that market shows a downturn of only 3 percent. In
terms of relative performance, total attendance at the Illinois casinos was down 9 percent
compared with out-of-state competitors.
In the southern Illinois market, we found downturns in both revenue and attendance that
were among the largest in the state. However, we also found that the smokefree dummy variable
picked up negative effects for casinos in Indiana and Missouri as well. This suggests the
possibility that there is some additional factor missing from the analysis or that our regression
specification is not fully accounting for the impact of the economic downturn on casinos in this
market. Specifically, our estimates show revenue at the Metropolis casino was down by 28
percent while revenue at out-of-state casinos was down by 6 percent. Hence, in terms of relative
performance, we might temper our estimate of revenue losses to be about 22 percent. A similar
comparison for admissions indicates that the 19 percent loss at the Illinois casino, considered
alongside a 10 percent decline in attendance at out-of-state casinos, yields a measure of relative
performance of approximately -9 percent.
In the Iowa market, we found significant positive effects associated with the smokefree
dummy variable. This might indicate that the casinos on the Iowa side of the river benefited
from the patronage of customers who chose not to attend the casino in Rock Island after the
smoking ban; or it might indicate that there was a general upturn in demand within this particular
market, but that the Rock Island casino did not share in the increase. Whatever the
interpretation, the revenue decline of over 10 percent in Illinois contrasts with a revenue increase
of more than 14 percent in Iowa, yielding a measure of relative performance amounting to -25
percent. In this market, coefficient estimates for the admissions regressions were not generally
- 20 -
significant, but a comparison of coefficient point estimates yields a measure of relative
performance equal to nearly -8 percent.
Finally, in the St. Louis market, one factor influencing revenue that is difficult to
disentangle from the smoking ban is the opening of a new casino in downtown St. Louis. This
factor most certainly has an impact on the magnitude of our coefficient estimates. As a whole,
the three pre-existing casinos on the Missouri side of the river suffered revenue declines of about
10 percent after January 2008, compared with declines of over 26 percent in the Illinois casinos
in this market. The difference-in-differences effect is about -16 percent. For total admissions,
the Illinois casinos were down 16 percent and the three Missouri casinos were down by over 7
percent, leaving a relative difference of nearly -9 percent.
When the coefficients for Illinois casinos are adjusted for market conditions measured for
nearby out-of-state competitors, the results become more uniform across the state. In terms of
relative performance, revenue was down by approximately 20 percent and total admissions were
down by about 10 percent. These estimates are consistent with the results in Tables 2 and 3 for
statewide totals. In fact, summing over the results for each of the nine casinos provides
alternative estimates that are quite close to the results reported in Table 2 and 3 (22.1 percent for
revenue and 12.3 for admissions). For the unadjusted coefficients, total revenue losses come to
21.8 percent with attendance declines of 13 percent. With the difference-in-differences
adjustment for market conditions, revenue is calculated to have fallen by 20.4 percent, with
admissions down 9.1 percent. These lower figures are primarily attributable to adjustments
made to account for local economic conditions in the Southern Illinois market and the St. Louis
market.
- 21 -
Impact on Casino Tax Revenue
Given the estimates reported above, the evidence suggests that the Illinois smoking ban
has been associated with declining attendance and falling revenue at Illinois riverboat casinos.
For policymakers, a key question that arises from this analysis involves the impact on tax
revenue.
The state of Illinois imposes both a per capita admission tax and a proportionate wagering
tax on riverboat casinos. The admissions tax is set at $3 per person for patrons of Casino Rock
Island and $2 per person for the other eight casinos. From each admission, $1 goes to the host
community where a riverboat gaming operation is located and the remainder goes to the state.
The wagering tax is set on a graduated scale, as a percent of AGR. The tax rates are
reported in Table 10.30
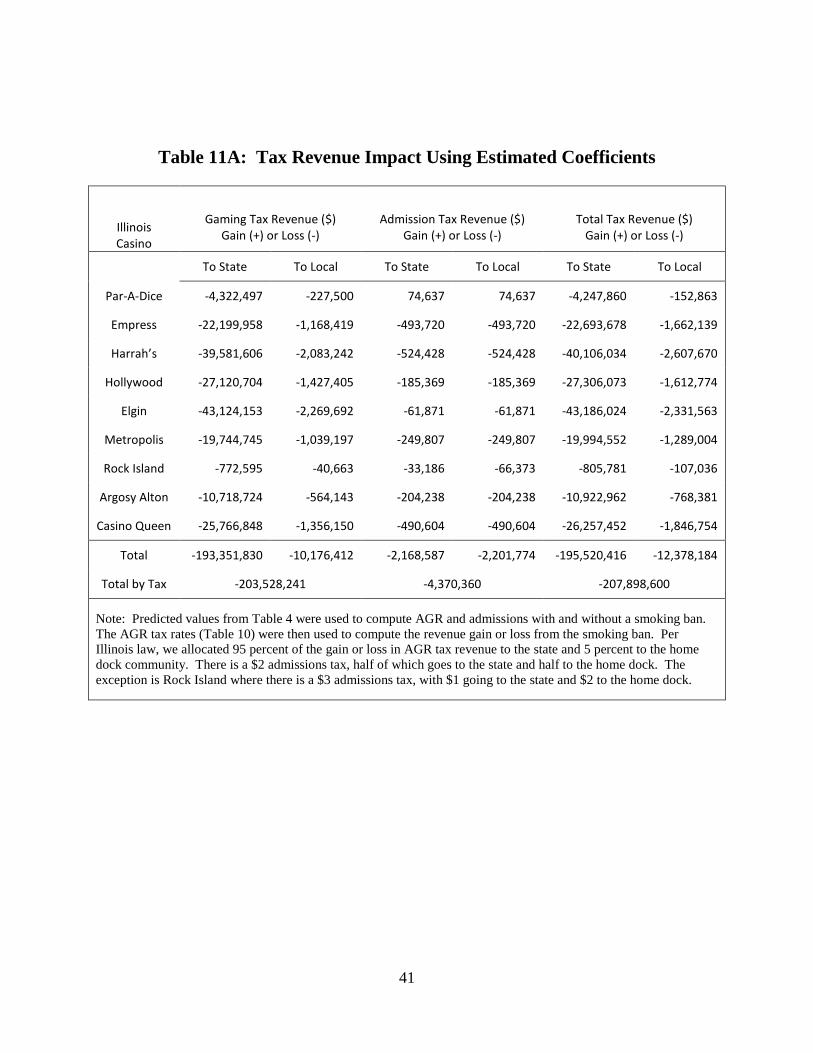
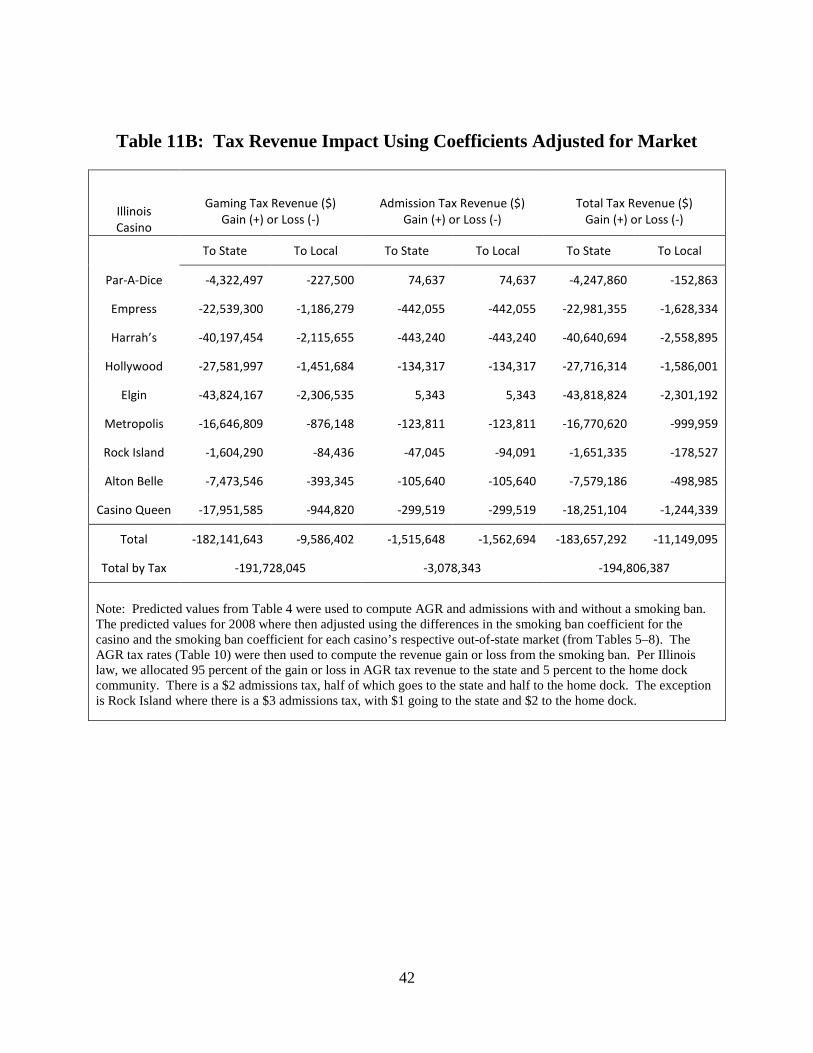
Using our estimated effects on revenue and admissions at the Illinois casinos, Tables 11A
and 11B show the casino tax revenue impact of the smoking ban for both state and local
governments. In Table 11A, using the unadjusted estimated coefficients reported in Table 4, we
find total tax revenue declines of $208 million. Of this total, the state lost $195.5 million, while
local communities collectively suffered revenue losses of $12.4 million. Table 11B uses the
market-adjusted coefficients. Tax revenue losses are slightly smaller using this calculation:
Total revenues were down by $194.8 million, with the state’s share of that loss $183.7 million
and the local communities’ share equal to approximately $11.1 million.
Each local government that serves as a host community for a casino
licensee receives a share in an amount equal to 5 percent of AGR, with the remainder of the
progressive tax revenue going to the state.
31
30 The present tax structure has been in effect since July 1, 2005 (Illinois Gaming Board, Annual Report, 2008).
31 These figures represent only the loss in gaming tax revenue and admissions tax revenue. Total tax revenue losses to the state and local governments may be less if consumers substitute away from casino gambling into other taxable activities.
- 22 -
Summary and Conclusions
A growing number of state and local government have passed laws that ban smoking in
public places, including casinos. Prohibiting smoking in casinos – if such smoking bans reduce
casino revenue - serves as an opposing public policy to the legalization of casino gaming as a
mean of generating revenue. These opposing policies, along with health-related aspects of
smoking, are the primary points of debate in policy discussions regarding smoking bans and, as a
result, have attracted the attention of researchers interested in estimating the potential revenue
effects of smoking bans.
Our work extends and improves upon previous studies that have explored the revenue
effects of smoking bans in two key ways. First, we consider the effect of the smoking ban on
both revenue and attendance to provide new insight into the intensity of wagering and casino
patronage after the smoking ban. Second, and more importantly, we conduct a natural
experiment by comparing the performance of casinos in a smoking-ban state with out-of-state
casinos with no smoking ban that all share a common casino market. This natural experiment
provides for a more effective test of the impact of smoking bans than simply analyzing casinos
directly impacted by the smoking ban and, we argue, should be considered in future research on
the economic effects of smoking bans.
Our results indicate that Illinois casinos suffered losses of more than 20 percent – well
over $400 million – in total during the first year of the Smoke Free Illinois Act. Some of this
loss appears to be associated with casino patrons gambling less when they do attend the casinos,
and part of the loss is also evident in declining attendance. We find that the impact of the
smoking ban on total admissions amounts to around 10 percent, with our point estimates
indicating a downturn in the range of 9 to 13 percent. These estimates imply total casino tax
revenue was lower by roughly $200 million.

- 23 -
The economic effects of the Smoke Free Illinois Act—specifically with regard to casino
revenue and government tax receipts—represent only part of the Act’s overall impact. In a full
analysis, these effects need to be considered alongside costs and benefits, including the public
health benefits of the legislation.
- 24 -
References Adams, Scott and Chad Cotti. “The Effect of Smoking Bans on Bars and Restaurants: An
Analysis of Changes in Employment.” The B.E. Journal of Economic Analysis and Policy, vol. 7, no. 1, Contributions, Article 12, 2007. See www.bepress.com/bejeap/Vol7/iss1/art12.
American Nonsmokers’ Rights Foundation. “Municipalities with Local 100% Smokefree Laws.”
January 4, 2009a. Available at http://www.no-smoke.org/pdf/100ordlisttabs.pdf. American Nonsmokers’ Rights Foundation. “Smokefree Gaming Laws.” January 4, 2009b.
Available at http://www.no-smoke.org/pdf/100smokefreecasinos.pdf. Dunham, John and Michael Marlow. “The Effects of Smoking Laws on Seating Allocations of
Restaurants, Bars, and Taverns.” Economic Inquiry, vol. 38, no. 1, January 2000, pp. 151-57.
Dunham, John and Michael Marlow. “Smoking Laws and Their Differential Effects on
Restaurants, Bars, and Taverns.” Contemporary Economic Policy, vol. 18, no. 3, July 2000, pp. 326-33.
Dunham, John and Michael Marlow. “The Economic Incidence of Smoking Laws.” Applied
Economics, vol. 35, no. 18, December 2003, pp. 1935-42. Fleck, Robert and Andrew Hanssen. “Why Understanding Smoking Bans is Important for
Estimating Their Effects: California’s Restaurant Smoking Bans and Restaurant Sales.” Economic Inquiry, vol. 46, no. 1, January 2008, pp. 60-76.
Glantz, Stanton and Lisa Smith. “The Effect of Ordinances Requiring Smoke-Free Restaurants
on Restaurant Sales.” American Journal of Public Health, vol. 84, no. 7, July 1994, pp. 1081-1085.
Halvorsen, R., and R. Palmquist. “The Interpretation of Dummy Variables in Semilogarithmic
Equations,” The American Economic Review 70 (1980), 474-475.
Mandel, L., B. Alamar, and S. Glantz. “Erratum to Mandel, L.L., Alamar, B.C., and Glantz, S.A.. ‘Smoke-free Law Did Not Affect Revenue from Gaming in Delaware.’ Tobacco Control, vol. 14 (2005), pp. 10-12.” Tobacco Control On-Line (Electronic Letters), May 23, 2005.
Mellen, Karen, “Charities Lose in Illinois Casino Towns,” Chicago Tribune, August 29, 2003. Newey, W. K., and K. D. West, “A Simple, Positive Semi-Definite, Heteroskedasticity and
Autocorrelation Consistent Covariance Matrix,” Econometrica 55:3 (May 1987), 703-708, Pakko, Michael R. “Smoke-free Law Did Affect Revenue from Gaming in Delaware.” Tobacco
Control, vol. 15, no. 1, February 2006, pp. 68-69.
- 25 -
Pakko, Michael R. “No Smoking at the Slot Machines: The Effect of a Smoke-Free Law on
Delaware Gaming Revenues.” Applied Economics, vol. 40, no. 13-15, July-August 2008a, pp. 1769-74.
Pakko, Michael R. “The Economic Impact of a Smoking Ban in Columbia, Missouri: An
Analysis of Sales Tax data for the First Year.” Federal Reserve Bank of St. Louis Regional Economic Development, vol. 4, no. 1, October 2008b, pp. 30-40. Available online http://research.stlouisfed.org/publications/red/2008/01/Pakko.pdf.
Petry, Nancy and Cheryl Oncken. “Cigarette Smoking is Associated with Increased Severity of
Gambling Problems in Treatment-Seeking Gamblers.” Addiction, vol. 97, no. 6, May 2002, pp. 745-753.
Phelps, Ryan. “The Economic Impact of 100% Smoking Bans.” Kentucky Annual Economic
Report 2006, Center for Business and Economic Research, Gatton College of Business and Economics, University of Kentucky, 2006, pp. 31-34.
Pritsos, C., K. Pritsos, and K. Spears. “Smoking Rates Among Gamblers at Nevada Casinos
Mirror U.S. Smoking Rate.” Tobacco Control, vol. 17, no. 2, April 2008, pp. 82-85. Thalheimer, Richard and Mukhtar Ali. “The Demand for Casino Gaming with Special Reference
to a Smoking Bank.” Economic Inquiry, vol. 46, no. 2, April 2008, pp. 273-282.
- 26 -
Appendix: Data Description and Description of Dummy Variables Data Description The sample period for the analysis runs from January 1997 through December 2008. Monthly data for adjusted gross receipts (AGR) and total admissions were obtained from information on the websites of the various state gaming commissions, as detailed below:
Illinois: Data for 1997 through 2008 were available in Annual Reports of the Illinois Gaming Board: http://www.igb.state.il.us/annualreport/. Indiana: Data for total admissions and AGR were obtained from monthly reports of the Indiana Gaming Commission: http://www.in.gov/igc/2363.htm. AGR has been reported directly since July 2003. For July 2002 through June 2003, total revenue is measured as the sum of revenues reported for table games and slot machines. Prior to July 2002 revenues were calculated by multiplying the total wagering tax by 5.0. (Until July 2002, Indiana imposed a fixed 20% tax on adjusted gross revenues). Iowa: Revenue and admissions data were obtained from monthly reports of the Iowa Racing and Gaming Commission: http://www.state.ia.us/irgc/. Missouri: Revenue and admissions data were obtained from monthly reports of the Missouri Gaming Commission: http://www.mgc.dps.mo.gov/rb_fin_nav/mo_fin_report_nav.htm.
Other Variables:
• Indexes of coincident economic activity for Illinois, Indiana, Iowa, and Missouri were obtained from the Federal Reserve Bank of Philadelphia.
• Monthly snowfall totals, along with measures of “normal” snowfall, were collected from various webpages
associated with the National Oceanic and Atmospheric Administration (NOAA).
• Dummy variables representing one-time intercept shifts as well as “pulse” dummies for transitory events are defined in Table A1.
Description of Dummy Variables
Intercept Shift Dummies SMOKEFREE: Illinois smoking ban. Value=1 for 2008:01 through 2008:12 and zero otherwise. July 99: Beginning of open boarding for Illinois casinos. Aug 02: Beginning of open boarding for Indiana casinos. July 03: Tax increase for Illinois casinos, reportedly associated with policy changes (supply shift). July 03: Indiana casinos get approval to stay open 24 hours per day. Sep-Nov 99: Beginning of open boarding for Missouri casinos. St. Louis area casinos began open boarding in September, with the rest of the state following in November. Dummy variable coded as having a value of 0.5 for 1999:09 and 1999:10, 1.0 for 1999:11 and all subsequent periods (zero otherwise). May03: Empress – Joliet, new barge completed.
- 27 -
Oct 01: Harrah’s – Joliet, riverboats replaced with floating barges. Feb 02: Hollywood – Aurora opens new dockside casino. Jun 02: Hollywood – Aurora opens phase two of dockside casino. Sep 05: Par-A-Dice – Peoria renovation completed August 23. Sep 01: Harrah’s – Metropolis opens new riverboat. Aug 07: Casino Queen – E. St. Louis opens new land-based casino. Aug 07: New casino in SW Michigan opens, competition for casinos in the Chicago market (esp. those in Indiana). Aug 08: Horseshoe – Hammond opens new riverboat. Feb 06: Blue Chip – Michigan City opens new riverboat. Mar 07: In Evansville, Indiana, new casino owners announce layoffs, leading to a public dispute with the mayor. Jun 07: Catfish Bend opens new land-based casino. Isle of Capri in Bettendorf, Iowa, opens new hotel tower. Nov 07: Catfish Bend closes old riverboat casino. Jul 08: Wild Rose – Clinton, Iowa, opens new land-based casino.
Pulse Dummies
Apr-May 2001: Flooding on the Mississippi River closes some of the Iowa casinos. Jan 2005: Low water forces Metropolis casino to close for several days. Aug 2005: Flooding forces Metropolis casino to close for several days. Apr 2008: Flooding closes Iowa casinos along the Mississippi. Jun 2008: Flooding closes Rhythm City Casino in Davenport, Iowa. Apr 1998: Barges collide with the President casino, forcing its closing. May 2002: Flooding forces the closing of the President casino for several days. Apr 2008: Flooding forces the closing of the President casino for several days. Jun 2008: Flooding forces the closing of the President casino for several days. Jul 2008: Flooding forces the closing of the President casino for several days. Sep 2008: Flooding forces the closing of the President casino for several days
- 28 -
Figure 1:
Source: Illinois Gaming Board, 2008 Annual Report
- 29 -
Figure 2: Adjusted Gross Revenues for Illinois Casinos and Nearby States
0
50
100
150
200
1997 1998 1999 2000 2001 2002 2003 2004 2005 2006 2007 2008
$ M
illio
ns Illinois
0
50
100
150
200
250
300
1997 1998 1999 2000 2001 2002 2003 2004 2005 2006 2007 2008
$ M
illio
ns
Indiana
Iowa
Missouri
- 30 -
Figure 3:
- 31 -
Table 1: Illinois Riverboat Casinos 2008
City Casino Operator
License Date
Gaming Space (Sq. Ft.)
2008 Admissions 2008 AGR
Alton Argosy Oct. 1991 23,000 1,182,856 $90,689,307
Peoria Par-A-Dice Feb. 1992 26,116 1,350,245 $116,726,216
Rock Island Jumer’s May 1992 42,000 668,993 $34,282,665
Joliet Empress Jul. 1992 50,000 1,678,360 $183,930,419
Metropolis Harrah’s Feb. 1993 30,985 1,076,085 $126,501,001
Joliet Harrah’s Aug. 1993 39,000 2,570,878 $297,674,723
Aurora Hollywood Jul. 1993 41,384 1,627,759 $220,000,676
East St. Louis Casino Queen Jul. 1993 40,000 2,296,919 $160,194,391
Elgin Grand Victoria Oct. 1994 29,850 2,184,959 $338,727,854
Source: Illinois Gaming Board, 2008 Annual Report. AGR is adjusted gross revenue, defined as player wagers less winnings.
- 32 -
Table 2: State-Level Regressions for Adjusted Gross Receipts (AGR)
Illinois Indiana Iowa Missouri [ -22.1%] [ 0.0%] [ 2.2%] [ 1.9%] SMOKEFREE
† -0.2503 *** 0.0001 0.0215 0.0189
(0.0258) (0.0642) (0.0309) (0.0172) Constant 14.5001 *** 11.5890 *** 13.8715 *** 20.0078 *** (1.0418) (2.6638) (1.2486) (0.8550) Trend 0.6239 *** 1.1901 *** 0.4625 *** 1.1288 *** (0.1116) (0.1843) (0.1057) (0.0704) Squared Trend -0.1860 ** -0.4852 *** -0.0294 -0.4361 *** (0.0737) (0.1166) (0.0594) (0.0343) CEAI 0.7566 *** 1.3712 ** 0.7257 *** -0.4442 ** (0.2108) (0.5487) (0.2582) (0.1776) Snow -0.0049 *** -0.0046 *** -0.0038 *** -0.0023 (0.0010) (0.0010) (0.0006) (0.0019) July 99 0.2080 *** -0.0008 0.0377 -0.0019 (0.0297) (0.0417) (0.0257) (0.0148) July 03 -0.1263 *** -0.0608 ** -0.0233 0.0114 (0.0180) (0.0261) (0.0219) (0.0181) Aug 02 0.0922 *** (0.0352) Apr-May 2001 -0.0972 *** (0.0144) Sep-Nov 99 0.0446 ** (0.0196) AR(1) 0.4548 *** 0.6364 *** 0.4262 *** 0.0863 (0.1028) (0.0927) (0.1088) (0.0943) Adj R-Squared 0.9787 0.9801 0.9703 0.9837
Note: *, **, and *** denote significance at 10%, 5%, and 1%, respectively. Standard errors are in parentheses. †Figures in brackets [ ] are percentage changes associated with SMOKEFREE.
- 33 -
Table 3: State-Level Regressions for Total Admissions
Illinois Indiana Iowa Missouri [ -12.3%] [ - 5.1%] [ - 3.0%] [ 3.8%] SMOKEFREE
† -0.1309 *** -0.0521 -0.0303 0.0370
(0.0263) (0.0319) (0.0422) (0.0275) Constant 11.7670 *** 7.4486 *** 8.6545 *** 15.6725 *** (0.7558) (2.7001) (1.8473) (1.2109) Trend -0.2120 *** 0.5652 *** -0.4491 *** 0.3729 *** (0.0584) (0.2080) (0.1615) (0.1119) Trend Squared 0.1374 *** -0.3214 *** 0.3466 *** -0.2243 *** (0.0426) (0.1054) (0.0858) (0.0555) CEAI 0.5603 *** 1.4840 *** 1.0655 *** -0.1468 (0.1557) (0.5603) (0.3827) (0.2519) Snow -0.0066 *** -0.0059 *** -0.0045 *** -0.0028 (0.0009) (0.0011) (0.0006) (0.0017) July 99 -0.2713 *** 0.0397 0.0485 0.0717 *** (0.0177) (0.0396) (0.0399) (0.0255) July 03 -0.1929 *** -0.0161 -0.0408 0.0623 ** (0.0145) (0.0185) (0.0271) (0.0266) Aug 02 -0.4833 *** (0.0380) Apr-May 2001 -0.1149 *** (0.0172) Sep-Nov 99 0.0596 ** (0.0273) AR(1) 0.3860 *** 0.7379 *** 0.5623 *** 0.3997 *** (0.0848) (0.0695) (0.0966) (0.1048) Adj R-Squared 0.9776 0.9625 0.8699 0.8987
Note: *, **, and *** denote significance at 10%, 5%, and 1%, respectively. Standard errors are in parentheses. †Figures in brackets [ ] are percentage changes associated with SMOKEFREE.
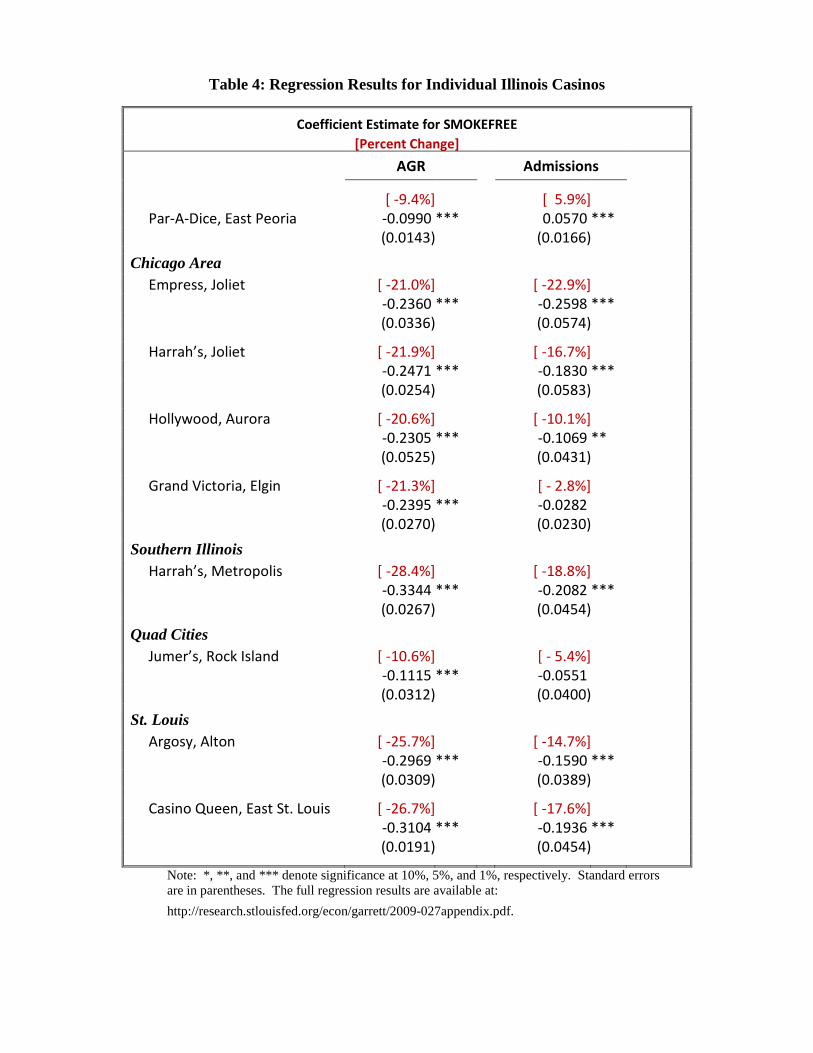
Table 4: Regression Results for Individual Illinois Casinos
Coefficient Estimate for SMOKEFREE [Percent Change]
AGR Admissions
[ -9.4%] [ 5.9%] Par-A-Dice, East Peoria -0.0990 *** 0.0570 *** (0.0143) (0.0166) Chicago Area Empress, Joliet [ -21.0%] [ -22.9%] -0.2360 *** -0.2598 *** (0.0336) (0.0574) Harrah’s, Joliet [ -21.9%] [ -16.7%] -0.2471 *** -0.1830 *** (0.0254) (0.0583) Hollywood, Aurora [ -20.6%] [ -10.1%] -0.2305 *** -0.1069 ** (0.0525) (0.0431) Grand Victoria, Elgin [ -21.3%] [ - 2.8%] -0.2395 *** -0.0282 (0.0270) (0.0230) Southern Illinois Harrah’s, Metropolis [ -28.4%] [ -18.8%] -0.3344 *** -0.2082 *** (0.0267) (0.0454) Quad Cities Jumer’s, Rock Island [ -10.6%] [ - 5.4%] -0.1115 *** -0.0551 (0.0312) (0.0400) St. Louis Argosy, Alton [ -25.7%] [ -14.7%] -0.2969 *** -0.1590 *** (0.0309) (0.0389) Casino Queen, East St. Louis [ -26.7%] [ -17.6%] -0.3104 *** -0.1936 *** (0.0191) (0.0454) Note: *, **, and *** denote significance at 10%, 5%, and 1%, respectively. Standard errors
are in parentheses. The full regression results are available at: http://research.stlouisfed.org/econ/garrett/2009-027appendix.pdf.
- 35 -
Table 5: Regression Results for Casinos in Northwest Indiana
Coefficient Estimate for SMOKEFREE [Percent Change]
AGR Admissions
Horseshoe, Hammond [ - 1.5%] [ - 6.9%] -0.0156 -0.0711 (0.0401) (0.0470) Ameristar, East Chicago [ 2.9%] [ - 0.5%] 0.0288 -0.0049 (0.0384) (0.0481) Majestic Star (I & II), Gary [ - 2.0%] [ - 3.3%] -0.0236 -0.0335 (0.0254) (0.0254) Blue Chip, Michigan City [ - 8.8%] [ -10.6%] -0.0919 ** -0.1123 *** (0.0358) (0.0312) Indiana Total [ 0.4%] [ - 3.0%]
0.0044 -0.0306 * (0.0193) (0.0184) Illinois Total [ -20.2%] [ -13.1%] -0.2257 *** -0.1408 *** (0.0170) (0.0326)
Note: *, **, and *** denote significance at 10%, 5%, and 1%, respectively. Standard errors are in parentheses. The full regression results are available at: http://research.stlouisfed.org/econ/garrett/2009-027appendix.pdf.
- 36 -
Table 6: Regression Results for the Southern Illinois Market
Coefficient Estimate for SMOKEFREE [Percent Change]
AGR Admissions
Harrah’s, Metropolis (IL) [ -28.4%] [ -18.8%] -0.3344 *** -0.2082 *** (0.0267) (0.0454) Aztar, Evansville (IN) [ - 5.0%] [ - 7.5%] -0.0514 -0.0776 ** (0.0400) (0.0362) Lady Luck, Caruthersville (MO)
[ -11.4%] [ -16.3%]
-0.1205 *** -0.1779 *** (0.0381) (0.0426) Non-Illinois Total [ - 6.4%] [ -10.5%] -0.0666 * -0.1104 *** (0.0343) (0.0342) Note: *, **, and *** denote significance at 10%, 5%, and 1%, respectively. Standard errors
are in parentheses. The full regression results are available at: http://research.stlouisfed.org/econ/garrett/2009-027appendix.pdf.
- 37 -
Table 7: Regression Results for the Quad City Market
Coefficient Estimate for SMOKEFREE [Percent Change]
AGR Admissions
Jumer’s, Rock Island (IL) [ - 10.6%] [ - 5.4%] -0.1115 *** -0.0551 (0.0312) (0.0400) Catfish Bend, Burlington [ 22.6%] [ - 6.9%] 0.2040 *** -0.0710 ** (0.0388) (0.0345) Rhythm City, Davenport [ 1.9%] [ - 4.4%] 0.0188 -0.0446 (0.0533) (0.0497) Isle of Capri, Bettendorf [ 12.0%] [ 6.3%] 0.0193 *** 0.0611 *** (0.0408) (0.0196) Wild Rose, Clinton [ - 0.3%] [ - 2.8%]
-0.0028 -0.0286 (0.0213) (0.0218) Iowa (4) Total [ 14.6%] [ 2.4%] 0.1359 *** 0.0240 (0.0311) (0.0308)
Note: *, **, and *** denote significance at 10%, 5%, and 1%, respectively. Standard errors are in parentheses. The full regression results are available at: http://research.stlouisfed.org/econ/garrett/2009-027appendix.pdf.
- 38 -
Table 8: Summary of Regression Results for the St. Louis Market Coefficient Estimate for SMOKEFREE
[Percent Change]
AGR Admissions
Harrah’s, Maryland Heights [ 0.7%] [ - 0.0%] 0.0073 -0.0003 (0.0580) (0.0576) Ameristar, St. Charles [ -11.9%] [ - 5.9%] -0.1272 *** -0.0609 * (0.0413) (0.0347) President, St. Louis [ -19.2%] [ -19.0%] -0.2131 *** -0.2111 *** (0.0348) (0.0670) Missouri Total [ -10.3%] [ - 7.7%]
-0.1082 *** -0.0799 *** (0.0303) (0.0252) Illinois Total [ -26.2%] [ -16.4%] -0.3040 *** -0.1791 *** (0.0210) (0.0341)
Market Total without Lumiere [ -13.7%] [ - 7.7%] -0.1479 *** -0.0805 *** (0.0211) (0.0187)
Market Total incl. Lumiere [ 0.5%] [ 13.2%] 0.0054 0.1241 *** (0.0180) (0.0406)
Note: *, **, and *** denote significance at 10%, 5%, and 1%, respectively. Standard errors are in parentheses. The full regression results are available at: http://research.stlouisfed.org/econ/garrett/2009-027appendix.pdf.
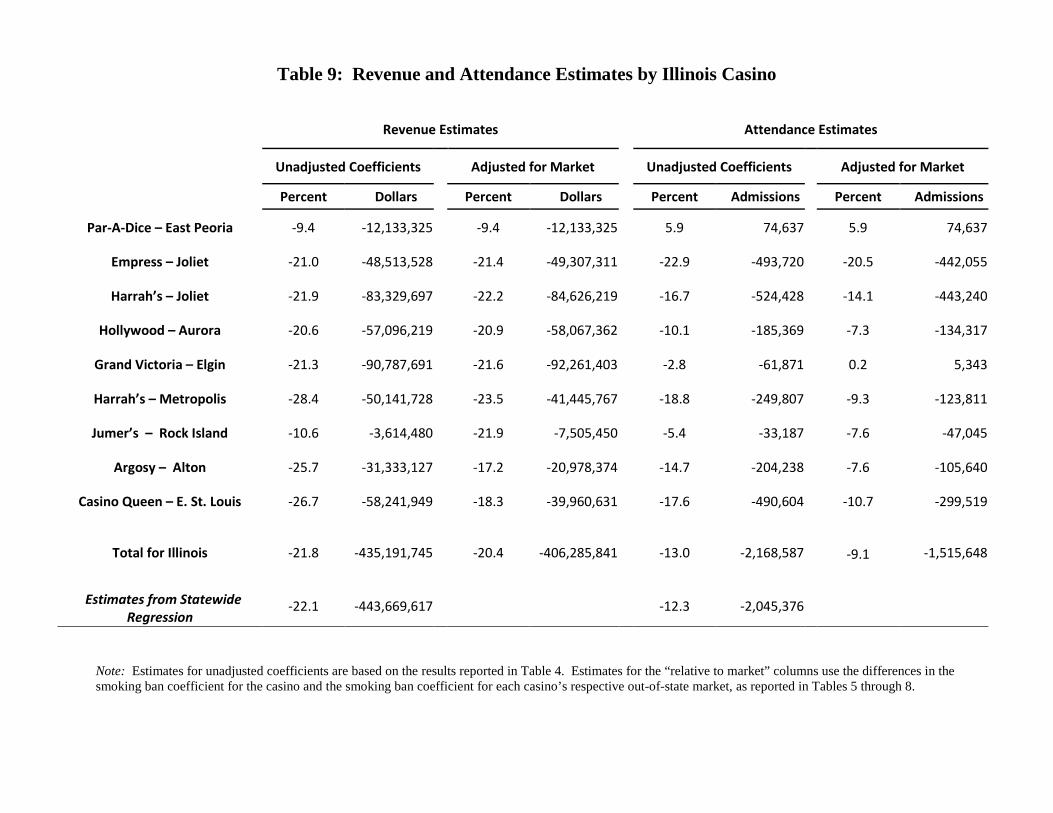
Table 9: Revenue and Attendance Estimates by Illinois Casino
Revenue Estimates Attendance Estimates
Unadjusted Coefficients Adjusted for Market Unadjusted Coefficients Adjusted for Market
Percent Dollars Percent Dollars Percent Admissions Percent Admissions
Par-A-Dice – East Peoria -9.4 -12,133,325 -9.4 -12,133,325 5.9 74,637 5.9 74,637
Empress – Joliet -21.0 -48,513,528 -21.4 -49,307,311 -22.9 -493,720 -20.5 -442,055
Harrah’s – Joliet -21.9 -83,329,697 -22.2 -84,626,219 -16.7 -524,428 -14.1 -443,240
Hollywood – Aurora -20.6 -57,096,219 -20.9 -58,067,362 -10.1 -185,369 -7.3 -134,317
Grand Victoria – Elgin -21.3 -90,787,691 -21.6 -92,261,403 -2.8 -61,871 0.2 5,343
Harrah’s – Metropolis -28.4 -50,141,728 -23.5 -41,445,767 -18.8 -249,807 -9.3 -123,811
Jumer’s – Rock Island -10.6 -3,614,480 -21.9 -7,505,450 -5.4 -33,187 -7.6 -47,045
Argosy – Alton -25.7 -31,333,127 -17.2 -20,978,374 -14.7 -204,238 -7.6 -105,640
Casino Queen – E. St. Louis -26.7 -58,241,949 -18.3 -39,960,631 -17.6 -490,604 -10.7 -299,519
Total for Illinois -21.8 -435,191,745 -20.4 -406,285,841 -13.0 -2,168,587 -9.1 -1,515,648
Estimates from Statewide
Regression -22.1 -443,669,617 -12.3 -2,045,376
Note: Estimates for unadjusted coefficients are based on the results reported in Table 4. Estimates for the “relative to market” columns use the differences in the smoking ban coefficient for the casino and the smoking ban coefficient for each casino’s respective out-of-state market, as reported in Tables 5 through 8.
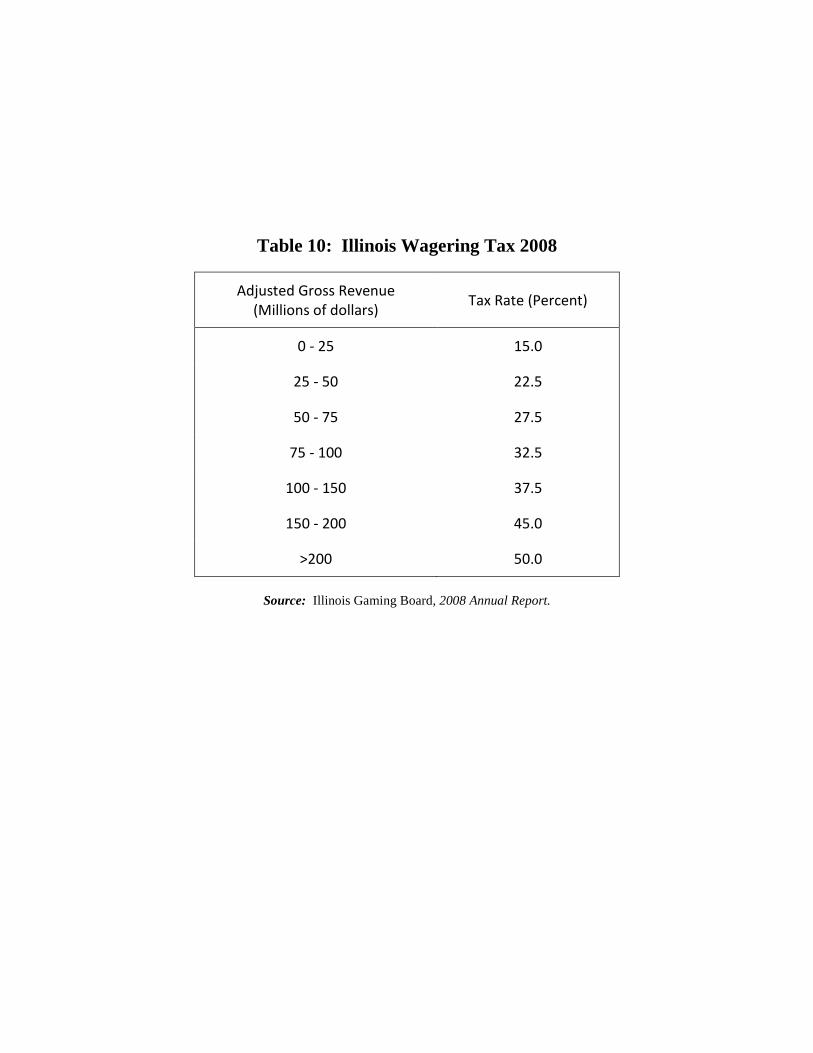
Table 10: Illinois Wagering Tax 2008
Adjusted Gross Revenue (Millions of dollars)
Tax Rate (Percent)
0 - 25 15.0
25 - 50 22.5
50 - 75 27.5
75 - 100 32.5
100 - 150 37.5
150 - 200 45.0
>200 50.0
Source: Illinois Gaming Board, 2008 Annual Report.
41
Table 11A: Tax Revenue Impact Using Estimated Coefficients
Illinois Casino
Gaming Tax Revenue ($)
Gain (+) or Loss (-)
Admission Tax Revenue ($)
Gain (+) or Loss (-)
Total Tax Revenue ($)
Gain (+) or Loss (-)
To State To Local To State To Local To State To Local
Par-A-Dice -4,322,497 -227,500 74,637 74,637 -4,247,860 -152,863
Empress -22,199,958 -1,168,419 -493,720 -493,720 -22,693,678 -1,662,139
Harrah’s -39,581,606 -2,083,242 -524,428 -524,428 -40,106,034 -2,607,670
Hollywood -27,120,704 -1,427,405 -185,369 -185,369 -27,306,073 -1,612,774
Elgin -43,124,153 -2,269,692 -61,871 -61,871 -43,186,024 -2,331,563
Metropolis -19,744,745 -1,039,197 -249,807 -249,807 -19,994,552 -1,289,004
Rock Island -772,595 -40,663 -33,186 -66,373 -805,781 -107,036
Argosy Alton -10,718,724 -564,143 -204,238 -204,238 -10,922,962 -768,381
Casino Queen -25,766,848 -1,356,150 -490,604 -490,604 -26,257,452 -1,846,754
Total -193,351,830 -10,176,412 -2,168,587 -2,201,774 -195,520,416 -12,378,184
Total by Tax -203,528,241 -4,370,360 -207,898,600
Note: Predicted values from Table 4 were used to compute AGR and admissions with and without a smoking ban. The AGR tax rates (Table 10) were then used to compute the revenue gain or loss from the smoking ban. Per Illinois law, we allocated 95 percent of the gain or loss in AGR tax revenue to the state and 5 percent to the home dock community. There is a $2 admissions tax, half of which goes to the state and half to the home dock. The exception is Rock Island where there is a $3 admissions tax, with $1 going to the state and $2 to the home dock.
42
Table 11B: Tax Revenue Impact Using Coefficients Adjusted for Market
Illinois Casino
Gaming Tax Revenue ($)
Gain (+) or Loss (-)
Admission Tax Revenue ($)
Gain (+) or Loss (-)
Total Tax Revenue ($)
Gain (+) or Loss (-)
To State To Local To State To Local To State To Local
Par-A-Dice -4,322,497 -227,500 74,637 74,637 -4,247,860 -152,863
Empress -22,539,300 -1,186,279 -442,055 -442,055 -22,981,355 -1,628,334
Harrah’s -40,197,454 -2,115,655 -443,240 -443,240 -40,640,694 -2,558,895
Hollywood -27,581,997 -1,451,684 -134,317 -134,317 -27,716,314 -1,586,001
Elgin -43,824,167 -2,306,535 5,343 5,343 -43,818,824 -2,301,192
Metropolis -16,646,809 -876,148 -123,811 -123,811 -16,770,620 -999,959
Rock Island -1,604,290 -84,436 -47,045 -94,091 -1,651,335 -178,527
Alton Belle -7,473,546 -393,345 -105,640 -105,640 -7,579,186 -498,985
Casino Queen -17,951,585 -944,820 -299,519 -299,519 -18,251,104 -1,244,339
Total -182,141,643 -9,586,402 -1,515,648 -1,562,694 -183,657,292 -11,149,095
Total by Tax -191,728,045 -3,078,343 -194,806,387
Note: Predicted values from Table 4 were used to compute AGR and admissions with and without a smoking ban. The predicted values for 2008 where then adjusted using the differences in the smoking ban coefficient for the casino and the smoking ban coefficient for each casino’s respective out-of-state market (from Tables 5–8). The AGR tax rates (Table 10) were then used to compute the revenue gain or loss from the smoking ban. Per Illinois law, we allocated 95 percent of the gain or loss in AGR tax revenue to the state and 5 percent to the home dock community. There is a $2 admissions tax, half of which goes to the state and half to the home dock. The exception is Rock Island where there is a $3 admissions tax, with $1 going to the state and $2 to the home dock.