the role of cbsl courses in the retention of non-traditional students
TRANSCRIPT

The Role of CBSL Courses in the Retention of Non-traditional
Students
Susan Reed DePaul University
Helen Rosenberg University of Wisconsin-Parkside
Anne Statham University of Southern Indiana
Howard Rosing DePaul University

Non-traditional students less likely to graduate
Identifying non traditional students
Older, part-time, working, caregiving, married, commuting….
Older students, 43% of undergraduates
Predicted to grow 20% as opposed to 11% for traditional age students (NCES, 2011).
High correlation among measures makes non-traditionality difficult to analyze
Students with two or more non-traditional characteristics less likely to complete degree (CSSE, 2005; NCES, 2008).
The term "nontraditional student" is not a precise one (NCES, 2002)

Factors contributing to retention
Tinto (1975, 1997, 2005) identified four factors that affect retention:
academic integration
social integration
financial pressures
psychological differences
Engagement as measure of academic integration: NSSE finds that students involved in “high impact practices” more likely to re-enroll (Kuh, 2012)
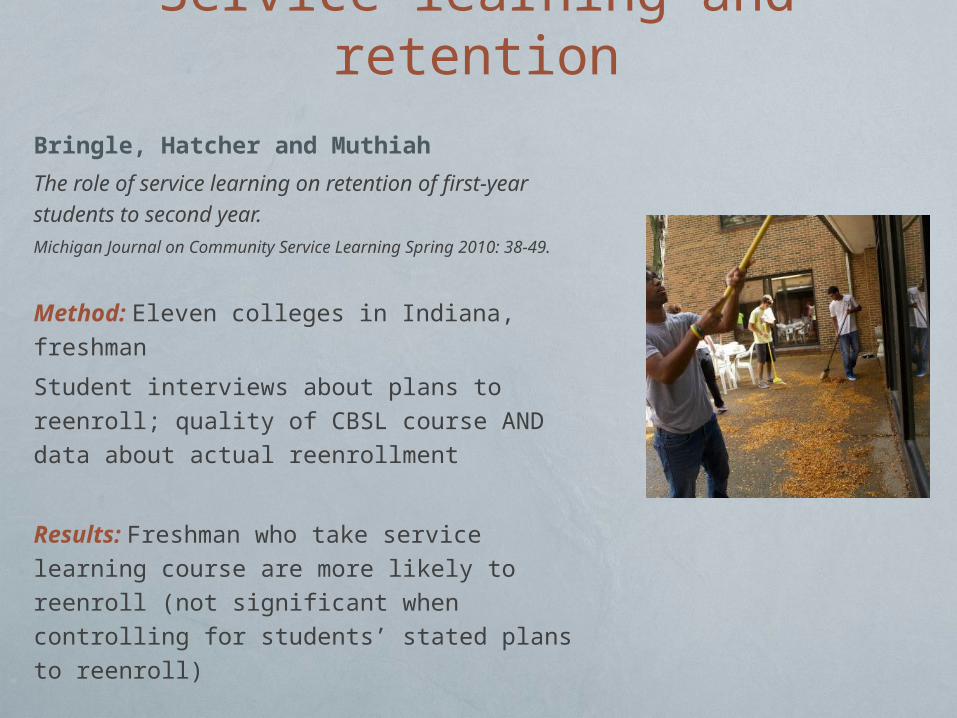
Service learning and retention
Bringle, Hatcher and Muthiah
The role of service learning on retention of first-year students to second year. Michigan Journal on Community Service Learning Spring 2010: 38-49.
Method: Eleven colleges in Indiana, freshman
Student interviews about plans to reenroll; quality of CBSL course AND data about actual reenrollment
Results: Freshman who take service learning course are more likely to reenroll (not significant when controlling for students’ stated plans to reenroll)

Rosenberg, Reed, Statham and Rosing (2011)
compared students’ perceptions of their
CBSL experiences at three universities
and found…
…adult and working students less likely to strongly agree that service learning enhanced classroom experience or skills
…those with fewer previous opportunities to develop skills through work experiences appreciated CBSL
…significant differences between our universities…public/private, more urban/less urban
Service-learning with non-traditional students

Sample
Incoming students in Fall, 2009 for three Midwestern Universities
Incoming students include freshmen and transfer students
University of Wisconsin-Parkside
DePaul University, Chicago
University of Southern Indiana
Data obtained from Institutional Research Offices (IRO)
Help with data collection and analysis from IRO varied by campus

Independent Variables
Measures of Non-traditionalityAge
Fulltime/Part Time
First Generation College Student
Race
Service Learning
DemographicsGender
Freshman/Transfer Students
GPA
Interaction terms

MethodologyLogistic Regression Analysis
predicts persistence or graduation or non-enrollment as dichotomous dependent variable
Used backwards, stepwise technique for exploratory analysisAllows entry of sets of variables in stepwise manner to assess the relative variance explained by each model
First step entered measures of non-traditionality, demographics and effects of taking a CBSL course
Second step entered fulltime/part time student status
Third step entered GPA
Followed sample cross 1, 2, and 3 years
© 1998 G. Meixner

Comparison of Means of Variables in Analysis (by Campus)
Independent Variables USI UW-Parkside DePaul
Service Learning Course .08 .13 .10
Race (1=white) .89 .71 .60
Age (1=<24) .89 .88 .92
First Generation (FG=1) .33 .62
Entry Status (Freshman=1) .75 .72 .64
Gender (Male=1) .43 .57 .44
Full Time/Part Time (1=FT) .80 .44 .90
GPA 2.661 2.593 3.09

USI ResultsLogistic Regression on Fall 2010 Enrollment/Graduation
95% CI for Odds Ratio
95% CI for Odds Ratio
95% CI for Odds Ratio
B (SE) Odds Ratio B (SE) Odds Ratio B (SE) Odds Ratio
Included
Constant .667 -1.426 -4.149
Service Learning
.608(.166) 1.836 .509(.197) 1.661 ------ ------
Race .269 (.122) 1.308 .290(.144) 1.337 ------- ------
Age -.428 (.129 .652 .770(.191) 2.160 ------- ------
First Generation -.246(.087) .782 ------- ------ ------- ------
Entry Status ------ ------- -.489(.134) .613 -.498(.135) .609
Gender -.145(.083) .865 -1.89 (.095) .828 .223(.107) 1.249
Full Time 2.918(.140) 18.508 2.497(.148) 12.147
GPA 1.233(.069) 3.433 Note: R2 = X (Hosmer &
Lemeshow), .016 (Cox & Snell), .023 (Nagelkerke). Model X
2(1) = 45.25, p<.01. *p<.01.
Note: R2 = X (Hosmer & Lemeshow), .211 (Cox & Snell), .295 (Nagelkerke). Model X
2(1) = 665.31, p<.01. *p<.01.
Note: R2 = X (Hosmer & Lemeshow), .334 (Cox & Snell), .468 (Nagelkerke). Model X
2(1) = 1126.91, p<.01. *p<.01.

95% CI for Odds Ratio
95% CI for Odds Ratio
95% CI for Odds Ratio
B (SE) Odds Ratio B (SE) Odds Ratio B (SE) Odds Ratio
Included
Constant 1.022 -.434 -4.505
Service Learning
.448(.108) 1.565 .217(.116) 1.242 ------ -------
Race .582 (.167) 1.790 .545(.193) 1.724 ------- -------
Age -.637(.216) .592 ------- ------ -.643(.774)- .529
First Generation
------ -------- ------- ------ ------ -------
Entry Status -.382(.165) .683 -1.005(.134) .366 -.774(.206) .461
Gender -------- -------- -.235 (.132) .791 --------- -------
Full Time 2.771(.159) 15.974 2.233(.182) 9.326
GPA 1.734(.119) 5.666
Note: R2 = X (Hosmer & Lemeshow), .027 (Cox & Snell), .042 (Nagelkerke). Model X
2(1) = 44.05, p<.01. *p<.01.
Note: R2 = X (Hosmer & Lemeshow), .194 (Cox & Snell), .301 (Nagelkerke). Model X
2(1) = 406.13, p<.01. *p<.01.
Note: R2 = X (Hosmer & Lemeshow), .297 (Cox & Snell), .459 (Nagelkerke). Model X
2(4) = 661.61, p<.01. *p<.01.
USI ResultsLogistic Regression on Fall 2011 Enrollment/Graduation

95% CI for Odds Ratio
95% CI for Odds Ratio
95% CI for Odds Ratio
B (SE) Odds Ratio B (SE) Odds Ratio B (SE) Odds Ratio
Included
Constant .995 -.249 -4.550
Service Learning
.430(.090) 1.537 .2687(.094) 1.307 ------ ----
Race .679 (.218) 1.972 .574(.254) 1.775 ------- ----
Age -.680(.232) .506 ------- ------ -.548.(.297)- .578
First Generation
------ ----- ------- ------ ------ ------
Entry Status -.590(.213) .683 -.590(.213) .554 --------- -------
Gender -------- -------- -------- ------- --------- ----
Full Time 2.709(.191) 15.015 2.261(.196) 9.591
GPA 1.73(.160) 5.657
Note: R2 = X (Hosmer & Lemeshow), .033 (Cox & Snell), .006 (Nagelkerke). Model X
2(1) = 50.10, p<.01. *p<.01.
Note: R2 = X (Hosmer & Lemeshow), .169 (Cox & Snell), .304 (Nagelkerke). Model X
2(4) = 274.694, p<.01. *p<.01.
Note: R2 = X (Hosmer & Lemeshow), .236 (Cox & Snell), .423 (Nagelkerke). Model X
2(3) = 398.94, p<.01. *p<.01.
USI ResultsLogistic Regression on Fall 2012 Enrollment/Graduation

95% CI for Odds Ratio
95% CI for Odds Ratio
95% CI for Odds Ratio
B (SE) Odds Ratio B (SE) Odds Ratio B (SE) Odds Ratio
Included Constant .672
(.155) .192 (.169) -1.796 (.277) Service Learning
.234 (.337) 1.264 .536 (.228)* 1.709 .593 (.241)* 1.810
Race -.099 (.146) .905 -.306 (.160)* .680 -.432 (.170)* .650
Age -.034 (.223) .966 .292 (.239) 1.339 -.109 (.256) .896
First Generation
-.064 (.134) .966 -.190 (.147) .827 -.387 (.158)* .679
Entry Status .129 (.158) 1.138 .134 (.172) 1.143 -.084 (103) .919
Gender .058 (.130) 1.060 -.080 (.142) .923 -.190 (.151) .827
Full Time 1.877 (.158)* 6.534 -.190 (.051) .827GPA 1.031 (.108)* 2.804
UW-Parkside ResultsLogistic Regression on Fall 2010 Enrollment/Graduation

95% CI for Odds Ratio
95% CI for Odds Ratio
95% CI for Odds Ratio
B (SE) Odds Ratio B (SE) Odds Ratio B (SE) Odds Ratio
Included Constant -.402 (.154) -.886 (.185) .412 -3.251 (.426) Service Learning 1.031* (.154) 2.805 .613 (.184)* 1.846 .194 (.211) 1.214Race
.266 (.141) 1.305 .050 (.166) 1.051 .129 (.198) 1.138Age
-.023 (.217) .978 .296 (.247) 1.344 -.287 (.315) .750First Generation -.008 (.131) .992 -.213 (.157) .808 -.351 (.196) .704Entry Status
.221 (.153) 1.247 .238 (.182) 1.268 .010 (.228) 1.010Gender -.048 (.127) .954 -.216 (.151) .806 -.478 (.191)* .620Full Time 2.828 (.184)* 16.904 1.269 (.221)* 3.558GPA 1.439 (.174)* 4.218
UW-Parkside ResultsLogistic Regression on Fall 2011 Enrollment/Graduation

95% CI for Odds Ratio
95% CI for Odds Ratio
95% CI for Odds Ratio
B (SE) Odds Ratio B (SE) Odds Ratio B (SE) Odds Ratio
Included Constant -1.145 (.171) -1.991 (.218) .137 -1.975 (.527) Service Learning 1.097 (.102)* 2.995 .811 (.115)* 2.249 .276 (.130)* 1.317Race
-.006 (.157) .994 -.252 (.188) .778 -.583 (.255)* .558Age
-.118 (.233) .889 .115 (.268) 1.122 -.034 (.374) .967First Generation .062 (.140) 1.064 .021 (.177) 1.021 -.071 (.226) .931Entry Status
.317 (.164)* 1.373 .773 (.201)* 2.167 .086 (.282) 1.090Gender .294 (.137)* 1.341 .374 (.174)* 1.454 .258 (.224) 1.295Full Time 3.506 (.223)* 33.316 2.034 (.256)* 7.645GPA .276 (.130)* 1.317
UW-Parkside ResultsLogistic Regression on Fall 2012 Enrollment/Graduation

DePaul ResultsLogistic Regression on Fall 2010 Enrollment/Graduation
B (SE) Odds Ration
Constant -.524
Service Learning -1.311 (.961) .270
Race .572(.415) 1.771
Age .178(.916) 1.195
First Generation ----------- -----
Entry Status -.465(.133) .628
Gender --------- ------
Full Time -2.207(.686) ..110
GPA 1.066(.281) 2.904
R square =.115 (Cox & Snell) Chi Square=34.841 p=.776
.205 (Nagelkerke)

Significance of Service-Learning by Institution
Students who take service-learning courses are more likely to persist.
USI effect disappears after adding GPA
UW-Parkside effect remains after adding GPA
DePaul no significant effect

Age
Age is a weak predictor of persistence at one university; younger students are more likely to reenroll
USI Age effect disappears after adding full-time/part-time and GPA
UW-Parkside No effect
DePaul No Effect

Race
Race is an inconsistent predictor of persistence with white students more likely to reenroll.
USI race effect disappears after adding GPA
UW-Parkside race effect remains but is weakened by adding part-time/full-time status and GPA
DePaul no effect
First Generation
Students who have college-educated parents are more likely to persist but this effect disappears after the 1st year.
USI effect disappears after adding full-time/part-time & GPA
UW-Parkside effect disappears after adding part-time/full-time status and GPA
DePaul no data

Transfer StudentsTransfer students are more likely to persist but the effect is mitigated by full-time/part-time & GPA.
USI effect disappears after adding full-time/part-time status & GPA
UW-Parkside effect disappears after adding full-time/part-time status and GPA
DePaul effect disappears after adding full-time/part-time & GPA

Comparing institutions: Challenges
Working with Offices of Institutional Research (e.g., degree of responsiveness)
Data collected not even across institutions

Service-Learning has a positive effect on all students (traditional and non-traditional)
Part-time is the most significant characteristic of non-traditional students in relation to persistent enrollment
Implications

Implications for further research
Extend timeframe for analysis because non-traditional students take longer to complete their degree.
Difficulty of analyzing measures of non-traditionality because they are highly correlated.
Consider the different reasons that students enroll part-time (defining “part-time” may be different for traditional and non-traditional students)

Discussion
Thank you
Susan [email protected]
Helen [email protected]
Anne Stratham [email protected]
Howard [email protected]