the skill complementarity of broadband internetftp.iza.org/dp7762.pdf · discussion paper series...
TRANSCRIPT

DI
SC
US
SI
ON
P
AP
ER
S
ER
IE
S
Forschungsinstitut zur Zukunft der ArbeitInstitute for the Study of Labor
The Skill Complementarity of Broadband Internet
IZA DP No. 7762
November 2013
Anders AkermanIngvil GaarderMagne Mogstad

The Skill Complementarity of
Broadband Internet
Anders Akerman Stockholm University
Ingvil Gaarder
European University Institute
Magne Mogstad University College London, Statistics Norway and IZA
Discussion Paper No. 7762 November 2013
IZA
P.O. Box 7240 53072 Bonn
Germany
Phone: +49-228-3894-0 Fax: +49-228-3894-180
E-mail: [email protected]
Any opinions expressed here are those of the author(s) and not those of IZA. Research published in this series may include views on policy, but the institute itself takes no institutional policy positions. The IZA research network is committed to the IZA Guiding Principles of Research Integrity. The Institute for the Study of Labor (IZA) in Bonn is a local and virtual international research center and a place of communication between science, politics and business. IZA is an independent nonprofit organization supported by Deutsche Post Foundation. The center is associated with the University of Bonn and offers a stimulating research environment through its international network, workshops and conferences, data service, project support, research visits and doctoral program. IZA engages in (i) original and internationally competitive research in all fields of labor economics, (ii) development of policy concepts, and (iii) dissemination of research results and concepts to the interested public. IZA Discussion Papers often represent preliminary work and are circulated to encourage discussion. Citation of such a paper should account for its provisional character. A revised version may be available directly from the author.

IZA Discussion Paper No. 7762 November 2013
ABSTRACT
The Skill Complementarity of Broadband Internet* Does adoption of broadband internet in firms enhance labor productivity and increase wages? And is this technological change skill biased or factor neutral? We exploit rich Norwegian data with firm-level information on value added, factor inputs and broadband adoption to answer these questions. We estimate production functions where firms can change their technology by adopting broadband internet. A public program with limited funding rolled out broadband access points, and provides plausibly exogenous variation of broadband adoption in firms. This enables us to address endogeneity of broadband adoption and examine how it shifts the production technology and changes the productivity and labor outcomes of different types of workers. We find that broadband adoption favors skilled labor by increasing its relative productivity. The increase in productivity of skilled labor is especially large for college graduates in fields such as science, technology, engineering and business. By comparison, broadband internet is a substitute for workers without high school diploma, lowering their marginal productivity. Consistent with the estimated changes in labor productivity, wage regressions show the expansion of broadband internet improves (worsens) the labor outcomes of skilled (unskilled) workers. We explore several possible explanations for the skill bias of broadband internet. We find suggestive evidence that broadband internet complements skilled workers in executing nonroutine abstract tasks, and substitutes for unskilled workers in performing routine tasks. When we use our production function estimates to construct measures of firm level productivity, we find that broadband internet accounts for a few percent of the standard deviation in total factor productivity across firms. Taken together, our findings have important implications for the ongoing policy debate over government investment in broadband infrastructure to encourage productivity and wage growth. JEL Classification: J23, J24, J31, O33 Keywords: broadband internet, labor productivity, tasks, technological change, skill bias Corresponding author: Magne Mogstad Department of Economics University College London Gower Street London WC1E 6BT United Kingdom E-mail: [email protected]
* Thanks to Jerome Adda, Ingvild Almaas, Russell Cooper, David Green, Hyejin Ku and Morten Ravn for helpful suggestions. We are grateful to David Autor and David Dorn for sharing their data on job task requirements and useful comments.

1 Introduction
Economists and policymakers are keenly interested in understanding the productivity andlabor market effects of the advancements in information and communication technology(ICT). Many have argued that these technological changes were behind the resurgence inU.S. productivity growth since the late 1990s, and that investments in ICT are important inexplaining labor productivity patterns across multiple industries and countries.1 Recently,policymakers have pointed to broadband internet as a key productivity enhancing factor,calling for public funding to roll out broadband infrastructure.2 While governmentagencies are projecting broadband penetration rates to be important for productivity andjob creation, there is little scientific evidence to substantiate these claims.3
Estimating how adoption of new technology, such as broadband internet, affectsproductivity has proven difficult for several reasons. It is often difficult to access dataon technology adoption which can be linked with firm-level information on value addedand factor inputs. Another key challenge is the likelihood that some determinants ofproduction are unobserved to the econometrician but observed by the firm; if adoptionof new technology depends on these determinants, then OLS estimates of productionfunctions will be biased. On top of this, the use of inputs such as capital and labor couldalso be correlated with technology adoption and unobserved productivity, and thereforecreate bias in OLS estimates. These empirical challenges have meant that existing researchhas largely focused on demonstrating positive associations of ICT with productivity. Draca,Sadun, and Van Reenen (2007), in their Handbook of Information and CommunicationTechnologies chapter, review the literature carefully and conclude that “none of theliterature has produced convincing evidence of a causal impact of ICT on productivity, forexample by analyzing a natural experiment”.
In this paper, we examine how the adoption of new technology in firms shifts theirproduction technology and changes the productivity and labor outcomes of different typesof workers. Our context is the adoption of broadband internet in Norwegian firms over the
1The evidence is reviewed in Draca, Sadun, and Van Reenen (2007), Oliner, Sichel, and Stiroh (2007),Jorgenson, Ho, and Stiroh (2008), and Syverson (2011). See also Bloom, Sadun, and Van Reenen (2012).
2President Obama’s campaign in 2008 promised that “every American should have the highest form ofbroadband access”. Later, he called on Congress to approve funding for rolling out broadband to unservedand underserved areas, arguing that increased broadband spending will keep America competitive whilealso creating new jobs. In the UK, former Prime Minister Gordon Brown compared the expansion ofbroadband infrastructure to “the roads and the bridges and the railways that were built in previous timesto stimulate the economy”.
3In 2008, the U.S. Commissioner of Federal Communications Commission stated that “Affordablebroadband would quickly add $500 billion to the U.S. Economy and create 1.2 million jobs”. Projectionsfrom the U.S. Bureau of Economic Analysis suggest that for every $1 invested in broadband, the economybenefits nearly $3. A notable example of research on this topic is Czernich, Falck, Kretschmer, andWoessmann (2011), who find positive association between broadband penetration and economic growthacross OECD countries over time. Another example is Forman, Goldfarb, and Greenstein (2012), showingthat internet investments correlate with wage and employment growth in some but not all U.S. counties.
1

period 2001-2007.4 Norway is a small open economy with segmented local labor markets.Our analysis employs several data sources that we can link through unique firm andindividual identifiers. Using firm-level information on value added, capital, labor by skilllevel and broadband adoption, we estimate production functions where firms can changetheir technology by adopting broadband internet.5 We complement these productionfunction estimates with wage regressions which include interactions between skill levelsand broadband internet.
As a source of exogenous variation in broadband adoption, we follow Bhuller, Havnes,Leuven, and Mogstad (forthcoming) in exploiting a public program aimed at ensuringbroadband access at a reasonable price to all households throughout the country.6 Becauseof limited funding, access to broadband was progressively rolled out, so that the necessaryinfrastructure (access points) was established in different municipalities at different times.We use this spatial and temporal variation in the availability of broadband across munici-palities as an instrumental variable for adoption of broadband in firms. Our identificationstrategy – which controls for municipality (time and industry) fixed effects – is motivatedby two features of the broadband program. First, most of the supply and demand factorstend to vary little over time. Second, the timing of the roll-out is unlikely to co-varywith the key correlates of productivity and labor outcomes. We demonstrate that thedata is consistent with these program features, and further challenge the validity of theinstrument by probing the stability of the estimates to alternative specifications, findinglittle cause for worry. Following Levinsohn and Petrin (2003), we also make sure that theresults are robust to using intermediate inputs to proxy for unobserved productivity inthe production function.
Figure 1 previews the main results of our analysis. This figure shows estimates of laborproductivity and skill premium before and after the expansion of broadband internet,providing a visual representation of the reduced form of our econometric models. Timezero represents the year with the strongest growth in broadband coverage rate in a givenmunicipality, after taking out municipality, industry and year fixed effects. In eachtime period, we estimate Cobb-Douglas production functions and wage regressions whilecontrolling for municipality, industry and year fixed effects. The graphs suggest strongskill complementarity of broadband internet. The first (second) graph shows that thesharp rise in coverage rates from time -1 to time zero is associated with a substantialincrease (decrease) in the output elasticity of (un)skilled labor. The third graph shows
4Throughout the paper, we focus on broadband internet, defined as internet connections with downloadspeeds that exceed 256 kbit/s. Before the expansion of broadband internet, all firms with a telephoneconnection would have dial-up access to internet, but limited to a bitrate of less than 56 kbit/s. Broadbandinternet facilitated internet use without excessive waiting times.
5Throughout the paper, we follow the literature by referring to education and skills interchangeably;thus skilled refers to highly educated and unskilled refers to those with lower levels of education.
6Bhuller, Havnes, Leuven, and Mogstad (forthcoming) use the roll-out of broadband internet to studyhow internet use affects sex crimes.
2

Figure 1. Labor productivity and skill premium, pre and post expansion
(a) Output elasticity: Skilled labor
−.2
−.1
0.1
.2R
esid
ual c
over
age
rate
.3.3
5.4
.45
.5O
utpu
t ela
stic
ity
−3 −2 −1 0 1 2 3Year relative to increase in coverage
Skilled labor Residual coverage rate
(b) Output elasticity: Unskilled labor
−.2
−.1
0.1
.2R
esid
ual c
over
age
rate
.2.2
5.3
.35
.4O
utpu
t ela
stic
ity
−3 −2 −1 0 1 2 3Year relative to increase in coverage
Unskilled labor Residual coverage rate
(c) Return to Skill: Hourly wage
−.2
−.1
0.1
.2R
esid
ual c
over
age
rate
.14
.16
.18
.2Lo
g ho
urly
wag
e
−3 −2 −1 0 1 2 3Year relative to increase in coverage
Skilled wage premium Residual coverage rate
Note: Baseline samples of firms and workers during the period 2001-2007 (see Section 3 for details). Coverage rates are
residuals from a regression of municipality-level broadband coverage on municipality, industry and year fixed effects. Time
zero represents the year with the strongest growth in residual coverage rates in a given municipality. In each period, we
estimate Cobb-Douglas production functions and wage regressions while controlling for municipality, industry and year
fixed effects. Graphs (a) and (b) report period-specific OLS estimates of the output elasticity of skilled and unskilled labor.
Graph (c) reports period-specific OLS estimates of log hourly wage on a dummy for skilled and controls for gender and
potential experience. We define an employee as (un)skilled if he has (not) completed high school. The grey areas show 95%
confidence intervals.
3

how relative wages of skilled workers increases after this rise in coverage rates.Consistent with this reduced form evidence, the structural production function estimates
show that broadband adoption in firms favors skilled labor by increasing its relativeproductivity. The estimated increase in productivity of skilled labor is especially large forworkers with college degree in high return fields such as science, technology, engineering,and business. By comparison, broadband internet is a substitute for workers without highschool diploma, lowering their marginal productivity. In line with the estimated changesin labor productivity, the wage regressions show the expansion of broadband internetimproves (worsens) the labor outcomes of (un)skilled workers. The gains are largest forcollege graduates in high return fields. When we use our production function estimates toconstruct measures of firm level productivity, we find that broadband internet accountsfor a few percent of the standard deviation in total factor productivity across firms.
Our findings are consistent with the widespread view that ICT is complementary withhuman capital. Technological changes that reduce quality-adjusted ICT prices – such as thearrival of broadband internet – should therefore increase skill demand and returns to skill.While the labor market consequences of investments in computers and R&D have beenstudied extensively,7 we provide novel evidence on the skill bias of broadband adoption.We also show an important link between computerization and broadband adoption infirms: When broadband internet becomes available, it is not randomly adopted; instead, itis more quickly adopted in firms in which complementary factors are abundent, includingcomputers and skilled workers. These findings conform to the predictions of a model ofendogenous technology adoption where firms’ choices reflect principles of comparativeadvantage (see e.g. Beaudry and Green, 2003, 2005; Beaudry, Doms, and Lewis, 2010).This pattern of broadband adoption illustrates that the estimated effects pertain to asubgroup of early adopters of broadband internet, and that we need to be cautious inextrapolating these local estimates to the longer-run impact of broadband adoption forthe population of firms at large.
We further use the rich Norwegian data to explore possible mechanisms behind the skillbias of broadband adoption. We find two pieces of evidence against the hypothesis thatour findings reflect changes in the demand for goods due to the expansion of broadbandinternet. First, we find no impact of broadband adoption on online sales or procurement.Second, when we look separately at firms in the tradeable sector where demand is givenby the world market, we still find that broadband adoption in firms favors skilled labor byincreasing its relative productivity. Our data is also at odds with broadband adoptioncoinciding with general technical upgrading in firms. Another possible mechanism receivinglittle support in data is that our findings are driven by changes in labor productivity and
7See e.g. Krueger (1993), Berman, Bound, and Griliches (1994), DiNardo and Pischke (1997), Autor,Katz, and Krueger (1998), Machin and Van Reenen (1998), Beaudry and Green (2003; 2005) and Beaudry,Doms, and Lewis (2010). Acemoglu (2003), Bond and Van Reenen (2007) and Goldin and Katz (2007)provide recent reviews of the extensive literature on technology-skill complementarity.
4

wages in firms directly affected by the expansion of broadband access, such as telecomfirms or IT consultancy companies.
Instead, our findings are consistent with the task approach to skill biased technologicalchange. Autor, Levy, and Murnane (2003) argue that ICT substitutes for workers inperforming routine tasks – more amenable to automatization – and complements workersin executing problem-solving, complex communication, and information-intensive tasks(ofted called “nonroutine abstract tasks”).8 We first show that workers of differenteducational background indeed cluster disproportionately in occupations that requiredifferent tasks. In particular, college graduates tend to move into occupations that arepervasive at nonroutine abstract tasks, especially those with degrees in high return fields.By comparison, low educated workers are over-represented in occupations that involverelatively little nonroutine abstract tasks, but require more routine or manual tasks. Next,we estimate wage regressions which include interactions between broadband internet andthe tasks performed in jobs rather than (or in addition to) the educational credentialsof workers performing those jobs. These estimates suggest an important channel behindthe skill bias of broadband internet is that it complements non-routine abstract tasks butsubstitutes for routine tasks whilst not affecting manual tasks.
Taken together, our findings have important implications for the debate about the roleof government policies in encouraging productivity growth.9 Our estimates suggest thatpolicy increasing the broadband penetration rates could enhance firm productivity. Arelated issue is why policy changes, even if they encourage productivity, do not alwayshappen. One explanation is that established interests earning rents in the unreformedenvironment could be able to stave off reform. Examining who wins, who loses, and byhow much could inform about the nature of these barriers and how to design compensationschemes. Our study points to the skill bias of broadband induced shift in productiontechnology as a barrier to government investment in broadband infrastructure.
The paper unfolds as follows. Section 2 presents a framework for estimation oftechnological change in production and discusses previous research. Section 3 describes ourdata, before Section 4 discusses the expansion of broadband internet. Section 5 presentsour empirical strategy. Section 6 describes our main findings, discusses their economicsignificance, and reports results from a number of robustness checks. Section 7 explorespossible mechanisms. The final section offers some concluding remarks.
8See also Autor, Katz and Kearney (2006, 2008), Goos and Manning (2007), Black and Spitz-Oener(2010), Firpo, Fortin, and Lemieux (2011), Acemoglu and Autor (2011), Autor and Dorn (2013), andMichaels, Natraj, and Van Reenen (forthcoming). A related literature argues that ICT changes workplaceorganization and practices, by increasing skill requirements, worker autonomy and management’s abilityto monitor workers (see e.g. Caroli and Van Reenen, 2001; Bresnahan, Brynjolfsson, and Hitt, 2002;Brynjolfsson and Hitt, 2003; Bloom, Garicano, Sadun, and Van Reenen, 2009).
9Several studies have evaluated reforms with plausibly productivity enhancing effects (see the discussionin Syverson, 2011). One example is Olley and Pakes (1996), examining the impact of deregulationon productivity growth in the U.S. telecommunication industry. Another example is Pavcnik (2002),investigating the effects of liberalized trade on firm productivity in Chile.
5

2 Technological change in production
2.1 A framework for estimation
Economic theory views the production technology as a function describing how a collectionof factor inputs can be transformed into output, and it defines a technological change asa shift in the production function, i.e., a change in output for given inputs. Consider aCobb-Douglas production technology with exponents that potentially change with theadoption of broadband internet:
Yit = eα0+Ditα1Kβk0+Ditβk1it Uβu0+Ditβu1
it Sβs0+Ditβs1it eεit , (1)
where Yit represents output of firm i in period t, Kit, Uit and Sit are inputs of capital,unskilled, and skilled labor, respectively, eα0+Ditα1 is the average total factor productivity(TFP), and eεit is the time- and firm-specific deviation from average TFP. Equation (1)extends on the usual Cobb-Douglas technology through the indicator variable Dit, whichis equal to one if firm i has broadband internet in period t (and zero otherwise). Thissimple extension allows for the possibility that broadband adoption is both factor-neutral(α1 6= 0) and factor-biased (βk1 6= 0, βu1 6= 0 or βs1 6= 0).
By estimating production functions like (1), we will explore several forms of factor-biased technological change that are discussed in the literature (see e.g. Berman, 2000).Broadband adoption is absolutely skill biased if the output elasticity of skilled workersincreases,
βs1 > 0,
while broadband adoption is relatively skill biased if
βs1βs0
>βu1
βu0,
and broadband adoption is strongly skill biased if
βs1 > 0 > βu1.
A complementary approach to assess how broadband adoption shifts the productiontechnology is to examine the labor market implications. Under standard conditions,relative skill bias implies that relative wages of skilled workers increase, holding the ratioof labor inputs fixed; or that the employment share of skilled workers increases, keepingrelative wages constant. These two implications have been treated as alternative symptomsof skill-biased technological change in the literature. By comparison, strong skill biasimplies that wages or employment rate of unskilled workers decreases with broadbandadoption. By evaluating how the staged expansion of broadband internet affected hourly
6

wages and employment rates in local labor markets, we will examine the implications ofdifferent forms of skill-biased technological change.
2.2 Empirical challenges and previous research
To estimate how broadband adoption shifts the production technology, it is useful totransform (1) to a linear production function:
yit = α0 + βk0kit + βu0uit + βs0sit +Dit [α1 + βk1kit + βs1sit + βu1uit] + εit, (2)
where lower-case letters refer to natural logarithms. While there exists a large literature onthe identification and estimation of production functions,10 there is little direct evidenceon how adoption of new technology changes the productivity of different types of workers.
One reason is the difficulty in accessing data on technology adoption which can belinked with firm-level information on value added, capital, and labor by skill level. Forinstance, typical annual accounts data reports labor costs as average (or total) wagesfor all workers, rather than wages by the skill level of the workers (Van Beveren, 2012).Moreover, statistical agencies have only recently started to systematically collect ICTinformation at the firm level (Draca, Sadun, and Van Reenen, 2007). In most cases, thisinformation relates to broad measures of expenditure or usage of ICT, rather than precisemeasures of specific technological changes.
Another reason is the threats to identification of production functions. A key concern isthe likelihood that some determinants of production are unobserved to the econometricianbut observed by the firm; if adoption of new technology depends on unobserved productivity,then OLS estimates of (2) will be biased. Several studies illustrate the difficulty in drawingcredible inferences absent an appropriate instrumental variable. DiNardo and Pischke(1997) suggest that computer users possess unobserved skills which might have little to dowith computers but which raise their productivity. Beaudry and Green (2003; 2005) andBeaudry, Doms, and Lewis (2010) show the speed and extent of computer adoption arelikely endogenous and reflect principles of comparative advantage. Another generic concernin estimation of production functions is that the levels of capital and labor chosen could becorrelated with unobserved factors of productivity. Olley and Pakes (1996) and Levinsohnand Petrin (2003) develop methods for estimating production functions that control forcorrelations between the use of factor inputs and unobserved productivity. However, moststudies of technological change in production ignore these threats to identification andsimply estimate a production function using OLS (Draca, Sadun, and Van Reenen, 2007).In particular, there have been few attempts to find instruments that affect the decision toadopt new technology.
Because we have data with firm-level information on value added, capital, labor by10 For recent reviews, see Draca, Sadun, and Van Reenen (2007) and Van Beveren (2012).
7

skill level and broadband adoption, we are able to estimate production functions like (2);as a source of exogenous variation in broadband adoption, we exploit that the necessaryinfrastructure was established in different areas at different times; and following Levinsohnand Petrin (2003), we use intermediate inputs to proxy for unobserved productivity in theproduction function. This enables us to address the threats to identification and providenovel evidence on how broadband adoption in firms shifts the production technologyand changes the productivity of different types of workers. The wage regressions whichinclude interactions between skill levels and broadband internet allow us to examine theimplications of skill-biased change without invoking the full set of assumptions behind theproduction function estimation.
3 Data
Our analysis uses several data sources, which we can link through unique identifiers foreach firm, employee, and municipality. The coverage and reliability of Norwegian data arerated as exceptional in international quality assessments (see e.g. Atkinson, Rainwater,and Smeeding, 1995). Below we describe our data and sample selection, while detailsabout the data sources and each of the variables are given in Appendix Table A1.
Firm and worker data
Our firm data comes from administrative registers, which are updated annually by StatisticsNorway and verified by the Norwegian Tax Authority. The data comprises all non-financialjoint-stock firms over the period 1999-2008.11 It contains detailed information fromthe firm’s balance sheets on output (such as revenues) and inputs (such as capital,labor, intermediates) as well as 4-digit industry codes and geographical identifiers at themunicipality level.
We merge the firm data set with a linked employer-employee registry that containscomplete records of all firms and workers for the period 1999–2008. For every employee,we know his or her length and field of education, and annual labor income. In our baselinespecification, we define an employee as skilled if he or she has completed high school,while employees with less schooling are defined as unskilled. In much of our analysis, werefine these often used proxies for skill levels: We divide skilled workers into mediumskilled (high school graduates) and high skilled (post secondary education); and we interactpost-secondary education with field of study.
Internet data
For the period 2001–2007, we have (i) data on broadband subscription for a stratifiedrandom sample of firms, and (ii) complete records of the fraction of households that have
11These firms cover the vast majority of revenues and workers in the private sector (about 81 % ofrevenues and 71 % of workers in 2001).
8

access to broadband internet in every municipality. As explained in detail below, we willuse the former to measure broadband adoption in firms, while the latter will form the basisfor our instrumental variable. Throughout this paper, broadband is defined as internetconnections with download speed that exceeds 256 kbit/s.
Our data on broadband subscriptions of firms comes from the annual CommunitySurvey on ICT Usage of Firms, performed by Statistics Norway. This survey includesinformation on the use of broadband internet in firms. In each year, the survey samplesfrom the universe of joint-stock firms with at least five employees. The survey design is astratified random sampling by industry and the number of employees.
The data on broadband access comes from the Norwegian Ministry of GovernmentAdministration. The ministry monitors the access of broadband internet to households, andthe suppliers of broadband access to end-users are therefore required to file annual reportsabout their coverage rates to the Norwegian Telecommunications Authority. The coveragerates are based on information on the area signal range of the local access points anddetailed information on the place of residence of households. In computing the coveragerates at the municipality level, it is taken into account that multiple suppliers may providebroadband access to households living in the same area, so that double counting is avoided.
Socio-economic data
Most of our socio-economic data come from administrative registers provided by StatisticsNorway. Specifically, we use a rich longitudinal database which covers every residentfrom 1998 to 2008. It contains individual demographic information (regarding gender,age, marital status and number of children), socio-economic data (educational attainment,income, employment status), and geographic identifiers for municipality of residence.The information on educational attainment is based on annual reports from Norwegianeducational establishments, whereas the income data and employment data are collectedfrom tax records and other administrative registers. The household information is fromthe Central Population Register.
Hourly wages and occupation
While the employer-employee registry contains data on employment status and annualwages of all workers, it does not provide information on hourly wages (or hours of work).When looking at the impact of broadband internet on hourly wages, we use data fromStatistics Norway’s Wage Statistics Survey. In each year, the survey provides informationon hourly wages and occupations. For employees in the private sector, the data is basedon an annual stratified random sampling of all firms. The survey covers all employeesin the public sector. Taken together, the information on hourly wages covers about 80percent of Norwegian employees in every year (100 percent of the public sector employees
9

and 70 percent of the private sector employees).
Sample selection and summary statistics
In the production function estimation, we use the sample of joint-stock firms recorded inthe internet survey (which all have at least five employees). In the interest of externalvalidity, we exclude firms that are carrying out extraction of natural resources (includingoil, gas and fish).12 We refine this sample to be appropriate for estimation of productionfunctions by focusing on firms with at least one employee in each of the two levels of skill.The baseline sample consists of 18,675 firms over the period 2001–2007. Throughout thepaper, we use sampling weights to produce representative estimates for the correspondingpopulation of joint-stock firms (192,312 firms).13
Table 1 displays summary statistics for key firm variables over time.14 The first paneldisplays the mean of output and non-labor inputs over time, with standard deviations inparentheses. In the production function, we use value added as the dependent variable,defined as revenues (total sales) net of intermediates (procurement of materials andintermediate inputs). We measure capital as the value of total stock of fixed assets. It isevident that these variables are fairly stable over time, perhaps with a weakly increasingtrend in revenues, value added and intermediates.
The second and third panel of Table 1 show means and standard deviations of wagebills and number of employees by skill levels. There is a steady increase in both the wagebills and the number of employees over time, especially for the high skilled. Following Foxand Smeets (2011), our main analysis measures labor inputs by wage bills instead of thenumber of workers. This has the advantage of making the measure of physical capital andhuman capital more comparable: Physical capital is measured in terms of monetary unitsto reflect the quality of the machinery employed, while using the wage bill to proxy forlabor input also implies measuring labor in terms of its expense in order to better reflectits quality.15
Appendix Figure A1 displays the distribution of firms by industry. This figure showsthe industry composition in our sample and in the corresponding population of firms.The four main industries are wholesale/retail, manufacturing, construction, and realestate/business services. This holds true both in terms of number of firms, aggregate valueadded, number of employees, and total wage bills. We can also see that the distributionsin our sample (with sampling weights) closely mirror the distributions for the population
12The production function estimates barely move if we include firms carrying out extraction of naturalresources.
13The production function estimates are very similar if we instead use the unweighted sample of firms.The same is true if we exclude firms which locate in the capital (Oslo) or the three big cities.
14Throughout this paper, all monetary figures are fixed at 1998 level after adjusting for inflation. Forthe figures expressed in U.S. dollars (USD), we have used the following exchange rate: NOK/USD = 7.5.
15Our findings of skill-biased technical change from broadband adoption in firms are robust to measuringlabor inputs by the number of workers instead of the wage bill.
10

Table 1. Descriptive statistics of baseline firm sample
2001 2004 2007 Overall OverallInput-output (USD, thousands) (log) (log) (log) (log) (level)Revenues 7.45 7.45 7.72 7.51 6,190
(1.20) (1.23) (1.35) (1.26) (45,766)Value added 6.65 6.68 6.99 6.74 2,412
(1.10) (1.12) (1.24) (1.15) (14,894)Intermediates 6.45 6.42 6.60 6.47 3,779
(1.82) (1.84) (2.01) (1.85) (36,864)Capital 4.54 4.34 4.50 4.41 1,112
(1.77) (1.88) (2.01) (1.88) (18,532)Wage bills (USD, thousands) (log) (log) (log) (log) (level)Total 5.72 5.79 6.20 5.87 906
(1.07) (1.10) (1.16) (1.12) (5,261)Unskilled 4.78 4.74 5.03 4.83 336
(1.28) (1.30) (1.35) (1.29) (2,355)Skilled 4.92 5.08 5.57 5.17 570
(1.37) (1.38) (1.41) (1.39) (3,287)Employees (log) (log) (log) (log) (level)Total 2.67 2.71 3.03 2.78 34
(0.91) (0.91) (0.99) (0.93) (199)Unskilled 1.86 1.81 2.01 1.88 15
(1.04) (1.05) (1.13) (1.06) (107)Skilled 1.88 2.01 2.40 2.07 19
(1.07) (1.04) (1.14) (1.08) (100)Number of firmsSurvey 2,422 2,536 3,341 18,675Population 26,631 27,623 27,807 192,312
Note: The baseline firm sample consists of joint-stock firms recorded in the internet survey. Sampling weights are used to
ensure representative results for the population of joint-stock firms. (Un)Skilled comprises workers with(out) high school
diploma. Detailed descriptions of the variables are given in Appendix Table A1.
11

of firms. The ability of our sampling weights to produce representative estimates areconfirmed in Appendix Figures A2 and A3: The former displays the distributions of outputand inputs across firms, while the latter shows the time trends in these variables.
Appendix Table A2 reports estimates from a standard Cobb-Douglas productionfunction (without broadband adoption), based on our sample (with sampling weights) andthe population of firms. The first two columns report OLS estimates, while the last twocolumns use the method for estimating production functions proposed by Levinsohn andPetrin (2003). It is evident that whether we use our sample or the population of firmsmatters little for the estimated output elasticities. We can also see that our estimatesalign well with the findings in previous studies. As predicted by theory, OLS overstates thelabor coefficients because the level of inputs chosen is positively correlated with unobservedproductivity. The magnitudes of the output elasticities of capital and labor are comparableto what found in previous studies using micro data (see e.g. Pavcnik, 2002; Fox andSmeets, 2011).
Lastly, Appendix Table A3 displays summary statistics for the labor outcomes over time.When estimating the employment effects, we consider the full population of individualsbetween the ages of 18 and 67 (the mandatory retirement age). To estimate the impact onhourly wages, we consider all workers between the ages of 18 and 67 who are recorded inthe wage statistics surveys. Due to a sluggish Norwegian economy, the employment ratesdecline somewhat between 2000 and 2004. By comparison, hourly wages were steadilyincreasing over over the entire period 2001–2007.
4 Expansion of broadband internet
Over the past decade, many OECD countries were planning the expansion of servicesrelated to information and communications technology. In Norway, the key policy changecame with the National Broadband Policy, introduced by the Norwegian Parliament in thelate 1990s. This section provides details about the program and describes the expansionof broadband internet.16
The program
The National Broadband Policy had two main goals. The first was to ensure that everyarea of the country had access to broadband at a reasonable and uniform price. Thesecond was to ensure that the public sector quickly adopted broadband internet.
The Norwegian government took several steps to reach these goals. First and foremost,it invested heavily in the necessary infrastructure. The investment in infrastructure waslargely channeled through the (state-owned) telecom company Telenor, which was the solesupplier of broadband access to end-users in the early 2000s and continues to be the main
16Our discussion draws on Bhuller, Havnes, Leuven, and Mogstad (forthcoming).
12

supplier today. Moreover, virtually all broadband infrastructure was, and still is, ownedand operated by Telenor.
Second, local governments were required to ensure access to broadband internet by 2005to local public institutions, such as administrations, schools, and hospitals (St.meld.nr.49, 2002–2003). To assist municipalities in rural areas, the federal government providedfinancial support through a funding program known as Høykom. Local governments couldreceive funds from this program by submitting a project plan that had to be evaluatedby a program board with expert evaluations. The stated aim was to ensure broadbandcoverage throughout the country. Once approved, financial support was provided in theinitial years of broadband access, thus making it possible for public institutions to coverrelatively high initial costs.17
Supply and demand factors
The transmission of broadband signals through fiber-optic cables required installation oflocal access points. Since 2000, such access points were progressively rolled out, generatingconsiderable spatial and temporal variation in broadband coverage. The staged expansionof access points was in part due to limited public funding, but also because Norway is alarge and sparsely populated country. There are often long driving distances between thepopulated areas, which are mostly far apart or partitioned by mountains or the fjord-gashedshoreline.18
The government reports describing the National Broadband Policy and the roll-outof broadband access points (see St.meld.nr. 38 (1997-1998); St.meld.nr. 49 (2002-2003);Bhuller, Havnes, Leuven, and Mogstad, forthcoming), suggest that the main supply factorsdetermining the timing of roll-out are topographical features and existing infrastructure(such as roads, tunnels, and railway routes), that slow down or speed up physical broadbandexpansion.19 Based on the program accounts, we expect the potential demand factorsto be related to public service provision, income level, educational attainment, and thedegree of urbanization in the municipality.
17During the period 1999–2005, the Høykom program received more than 1000 such applications andco-funded nearly 400 projects, allocating a total of 50 million Euros (NOK 400 million). From 2002, theMinistry of Education and Research co-financed another scheme (Høykom skole), providing financialsupport for broadband infrastructure in public schools. There are virtually no private schools in Norway.
18The Norwegian territory covers about 149,400 square miles, an area about the size of California orGermany, with around 13 % and 6 % of those regions’ populations (in 2008), respectively. The country isdominated by mountainous or high terrain, as well as a rugged coastline stretching about 1,650 miles,broken by numerous fjords and thousands of islands.
19The reason is that the transmission of broadband signals through fiber-optic cables required installationof local access points. In areas with challenging topography and landscapes, it was more difficultand expensive to install the local access points and the fiber-optic cables. Furthermore, the existinginfrastructure mattered for the marginal costs of installing cables to extend the coverage of broadbandwithin a municipality and to neighboring areas.
13

Descriptive statistics
Figure 2 displays the evolution of broadband coverage to households between 2001 and 2007.In each year, we report the overall mean broadband coverage rate and the distributionof broadband coverage rates across municipalities. There is considerable variation, bothacross municipalities and over time. By 2000, broadband transmission centrals wereinstalled in the cities of Oslo, Stavanger, and Trondheim, as well as in a few neighboringmunicipalities of Oslo and Trondheim. However, less than one-third of the householdswere covered by a broadband service provider in each of these municipalities.
Appendix Figure A4 shows geographic differences in the broadband coverage rates acrossmunicipalities over time. The maps illustrate that for a large number of municipalitiesthere was no broadband coverage in the first few years, whereas most municipalities hadachieved fairly high coverage rates in 2005. Moreover, there is considerable variation incoverage rates within the municipalities in these years.
Figure 2 displays the evolution of broadband internet use in firms between 2001 and2007. There is considerable variation, both across municipalities and over time. Inparticular, the increase in coverage to households seems to have spilled over into increasedaccess and take-up among firms. This is mirrored by an increase in the average usage rateof firms from around 20 percent in 2001 to above 80 percent by 2007.
5 Empirical strategy
Randomizing broadband adoption is not feasible: We cannot in practice force firms toadopt a new technology. One can, however, think of a social experiment which randomizesbroadband coverage at the municipality level. The randomization breaks the correlationbetween coverage rates and unobserved determinants of productivity. The intention of ourIV-approach is to mimic this hypothetical experiment. Our source of exogenous variationin broadband adoption comes from the staged installation of broadband infrastructure,generating spatial and temporal variation in broadband coverage rates.
Below, we first describe how we use the roll-out of broadband coverage to address theendogeneity of internet adoption. Next, we discuss how we follow Levinsohn and Petrin(2003) in using intermediate inputs to control for correlation between input levels and theunobserved firm-specific productivity process.
IV model
Our IV strategy exploits that firms’ access to and take-up of broadband internet changed asa side-effect of the expansion of broadband internet to households. This can be represented
14

Figure 2. Broadband coverage rates of households and broadband subscription rates offirms
0
.2
.4
.6
.8
1
2001 2003 2005 2007
Broadband coverage rates of households
0
.2
.4
.6
.8
1
2001 2003 2005 2007
Broadband subscription rates of firms
Note: The graphs show the overall mean and distribution of broadband coverage rates of households and broadband
subscription rates of firms across municipalities for each year during the period 2001–2007.
15

by the following system of equations, where the second stage is
yimkt = x′imktβ0 +Dimktx′imktβ1 + ηm + τt + λk + εimkt, (3)
while the first stages are given by
Dimkt = x′imktδ + Zmtx′imktφ+ γm + θt + σk + νimkt (4)
Dimktx1,imkt = x′imktδ1 + Zmtx′imktφ1 + γ1,m + θ1,t + σ1,k + ν1,imkt
... = ...
Dimktxn,imkt = x′imktδn + Zmtx′imktφn + γn,m + θn,t + σn,k + νn,imkt
where y is (log) value-added, D is a dummy variable for whether the firm uses broadbandinternet, Z is the fraction of households in a municipality with access to broadbandinternet, and x is a vector of n inputs (in log) and a constant term. In all cases, subscript idenotes firm, subscript k denotes industry, subscript m denotes municipality and subscriptt denotes year. All equations include a full set of municipality indicators (ηm, γm), yearindicators (τt, θt), and (4-digit) industry indicators (σk, λk). Throughout the paper, thestandard errors are clustered at the municipality level and robust to heteroskedasticity.
Unobservable determinants of production that are fixed at the municipality or industrylevel will be controlled for through the municipality and industry indicators, just likecommon time shocks are absorbed by the year indicators. To check that the estimatedoutput elasticities are not confounded by time-varying observable factors, we report resultswith and without a large set of time-varying controls. In particular, we show that ourestimates change little if we add control variables for the potential supply and demandfactors discussed above.
Assessing the IV model
Our IV model – which controls for municipality (time and industry) fixed effects – ismotivated by two features of the program. First, most of the supply and demand factorstend to vary little over time. Second, the timing of the roll-out is unlikely to co-vary withkey correlates of production.
To investigate whether the data is consistent with these program features, we firstregress Zmt on municipality, time and industry fixed effects as well as time-varying supplyand demand factors. We find that 89 % of the variation in broadband coverage can beattributed to time-invariant municipality and industry characteristics and common timeeffects, while less than 1 % of the variation in broadband coverage can be attributed to alarge set of time-varying variables.20
20The time-varying variables include demographic factors (income level, education, share of populationresiding in a densely populated locality, size of population, and level of unemployment), inputs and output
16

Second, we examine the relationship between the timing of broadband roll-out andbaseline municipality characteristics. To this end, we estimate the following equation
∆Zmt = ηm + [θt ×Wm,2000]′ ψt + εmt (5)
where ∆Zmt = Zmt − Zm,t−1, θt is a vector of year fixed effects, and Wm,2000 includesmunicipality-level information from year 2000 on demography, average levels of inputsand output, industry structures and skill composition. Demography includes income level,education, share of population residing in a densely populated locality (an urbanizationindictor), size of population and level of unemployment. For inputs and output we haveincluded municipality averages of revenues, intermediates, capital stock, number of workersand wage bill. As measures of industry structure, we use number of firms, employmentshare in manufacturing, employment share in wholesale, and employment share in services.The last group of municipality characteristics is the skill composition, measured as theshares of wages and workers by skill level.
Appendix Figure A5 plots the estimated coefficients from the vector ψt for every t (andthe associated 95 % confidence intervals). Our results indicate that broadband expansionis positively related to urbanization until 2002. From 2003 onwards, there appears tobe no systematic relationship between the timing of the broadband expansion and thisvariable. But more importantly, the timing of the expansion does not correlate withbaseline industry structure, the levels of output and inputs, as well as the skill composition.Nevertheless, in the robustness analysis we demonstrate that our estimates change littlewhen allowing for different underlying time trends in firm productivity or labor outcomesacross municipalities.
Extension of the IV model
The IV approach breaks the correlation between Dimkt and εimkt. However, it is still possiblethat the factor inputs ximkt are correlated with broadband adoption and unobservedproductivity, which could bias the IV estimates of equation (3). Following Levinsohn andPetrin (2003, hereafter LP), we take a more structural approach to address this threat toidentification of the production function.21
LP use a structural model of an optimizing firm to derive the conditions under whichintermediate inputs can be used to proxy for unobserved productivity in the production
(municipality averages of revenues, intermediates, capital stock, number of workers and wage bill), industrystructure (number of firms, employment share in manufacturing, employment share in wholesale, andemployment share in services) and skill composition (shares of wages and workers by skill level).
21Levinsohn and Petrin (2003) extend on Olley and Pakes (1996) by using intermediate inputs insteadof investments as a proxy for unobserved productivity. This addresses the problem that investment is zeroin a non-trivial number of cases. Both studies also show how to address endogenous exit and entry offirms. Because our information on broadband adoption comes from repeated cross-sections (rather thanpanel data), we abstract from endogenous entry and exit.
17

function. The error term εimkt is assumed to be additively separable in a transmittedcomponent (ωimkt) and an i.i.d. component (χimkt). The key difference between ωimkt andχimkt is that the former is a state variable, and therefore impacts the firm’s decision rule,while the latter has no impact on the firm’s decision. The intermediate input demandfunction depends on the firm-specific state variables, ωimkt and kimkt,
aimkt = gt(ωimkt, kimkt). (6)
and it must be monotonic in ω for all relevant k.22 The monotonicity condition forintermediate inputs means that conditional on capital, profit maximizing behavior mustlead more productive firms to use more intermediate inputs.
The monotonicity allows gt(ωimkt, kimkt) to be inverted to yield ω as a function ofintermediate inputs and capital, ωimkt = ωt(aimkt, kimkt). By expressing the unobservedproductivity variable ωimkt as a function of observables, we are able to control for ωimkt inthe second stage equation:
yimkt = x′imktβ0 +Dimktx′imktβ1 + ηm + τt + λk + ωt (aimkt, kimkt) + χimkt. (7)
As in Olley and Pakes (1996) and LP, we use a polynomial expansion in a and k toapproximate ωt(·). By simultaneous estimation of the first stage equations in (4) and thesecond stage equation in (7), we obtain consistent estimates of βu0, βs0, βk1, βu1,βs1, andΦt (aimkt, kimkt) = βk0kimkt + ωt(aimkt, kimkt).
While these output elasticities are sufficient to assess how broadband adoption affectslabor productivity, we need to identify βk0 to recover the full shift in production technol-ogy. Because kimkt is collinear with the non-parametric function ωt(aimkt, kimkt), furtherassumptions are necessary.23 Details on how βk0 is estimated are found in Appendix B.
6 Empirical results
6.1 Evidence on skill bias
A virtue of our research design is that it provides a transparent way of showing howthe skill bias of broadband internet is identified. To this end, we begin with a graphicaldepiction before turning to a more detailed regression-based analysis
22For simplicity, we assume as Olley and Pakes (1996) and Levinsohn and Petrin (2003) that capital isthe only state variable over which the firm has control, while intermediates, labor and broadband internetare viewed as non-dynamic input factors.
23βk1 is identified as the interaction of capital with Dimkt provides independent variation. Note also thatthe intercept in the production function is not separately identified from the mean of E [ωimkt|ωimkt−1]without some further restriction.
18

Figure 3. Association between broadband subscription and coverage rates, after takingout municipality, industry and year fixed effects
−.1
−.0
50
.05
Res
idua
l sub
scrip
tion
rate
s
−.4 −.2 0 .2Residual coverage rates
Note: Baseline firm sample over the period 2001-2007, consisting of joint-stock firms recorded in the internet survey. Bins
are based on the residual subscription rates of firms with bin size = 0.08. The size of the circle represents the number of
firms in each bin. Sampling weights are used to ensure representative results for the population of joint-stock firms. The
Y-axis reports residuals from a regression of broadband subscription rates of firms on municipality, industry and year fixed
effects. The X-axis reports residuals from a regression of broadband coverage rates of households on municipality, industry
and year fixed effects.
Graphical evidence
Figure 3 illustrates the variation used in the first stages by drawing a scatter plot of thebroadband coverage rates of households against the broadband user rates of firms. Welet the size of the circle represent the number of firms in each bin. The figure shows astrong association between the coverage and user rates. This suggests a strong impact onbroadband adoption of the increase in broadband coverage from the previous year. Indeed,when regressing user rates of firms on coverage rates of household as well as municipality,industry and year fixed effects, the coefficient on the coverage rate is about 0.23 witha standard error of 0.04. It implies that a 10 percentage point increase in broadbandcoverage to households induces (an additional) 2.3 % of the firms to adopt broadbandinternet.
Figure 1 in the introduction provided a visual representation of the reduced form ofthe IV model. In the same way, Appendix Figure A6 illustrates the reduced form ofthe LP approach by showing how LP estimates of the period-specific output elasticitiesvary with the roll-out of broadband coverage. Both set of estimates are summarized inFigure 4, where we normalize the period-specific output elasticities so that they equalone at time -1. We can clearly see that the growth in broadband coverage is associatedwith an increase in the output elasticity of skilled labor, while the output elasticity ofunskilled labor decreases. The similarity between the estimated output elasticities acrossthe two graphs suggest that correlation between input levels and unobserved productivity
19

is unlikely to drive our results. It is still possible that the association between broadbandcoverage and labor productivity is confounded by time-varying factors. However, thereis no evidence of changes in a wide range of municipality level characteristics from time-1 to time zero, including industry structure, firm characteristics, skill composition anddemographic characteristics.24 As a result, the estimated output-elasticities barely movewhen we add time-varying control variables to the regression models.
Regression results
Table 2 reports production function estimates based on OLS, IV and LP. In all cases,we find that broadband adoption in firms favors skilled labor by increasing its relativeproductivity. Indeed, the output elasticity of skilled labor increases substantially, whilebroadband internet seems to be a substitute for unskilled labor. By comparison, there islittle if any change in the output elasticity of capital. The full set of first stage results arereported in Appendix Table A4. The first stages are strong, with large F-statistics on theexcluded instruments which mean weak instrument bias is not a concern.
To interpret the magnitude of these changes in output elasticities, it is useful to computethe implied marginal productivities. When using the LP estimates to compute marginalproductivities, we find that for every $1 spent on skilled labor, the production increasesby $1.34 in the absence of broadband internet. Broadband adoption in firms increasesthe productivity of skilled labor by $0.27. For unskilled labor, however, this technologicalchange lowers the marginal productivity by $.06; one explanation for this finding is thatbroadband in firms replaces tasks previously performed by unskilled labor; these workersmay then be reallocated to tasks for which they have lower comparative advantage, whichpushes their marginal productivity down.
The statistical tests reported in the lower panel of Table 2 suggest that broadbandinternet is strongly skill-biased.25 Under standard conditions, strong skill bias impliesthat wages or employment rates of (un)skilled workers should decrease (increase) withbroadband internet. Table 3 examines these implications by estimating how the expansionof broadband internet affected hourly wages and employment rates in local labor market.Specifically, we run the following wage regression which includes interactions betweenbroadband internet and individuals’ skill level:
ylmkt = βUUlmkt + βSSlmkt + Zmt(γUUlmkt + γSSlmkt) +X ′lmktδ + τt + ηm + λk + εlmkt
(8)
where ylmkt denotes (log) hourly wage or employment status of individual l in municipalitym and industry k in period t, and X is a vector of controls for his or her gender and
24For brevity, we do not include these graphs, but they are available from the authors upon request.25To test for strong skill bias, we use the method of Holm (1979) to take into account the multiplicity
in testing βs1 ≤ 0 vs. βs1 > 0 and βu1 ≥ 0 vs. βu1 < 0.
20

Figure 4. Normalized output elasticities, pre and post expansion
(a) Reduced form of IV
−.2
−.1
0.1
.2R
esid
ual c
over
age
rate
.51
1.5
Out
put e
last
icity
−3 −2 −1 0 1 2 3Year relative to increase in coverage
Unskilled labor Skilled laborResidual coverage rate
(b) Reduced form of LP
−.2
−.1
0.1
.2R
esid
ual c
over
age
rate
.51
1.5
Out
put e
last
icity
−3 −2 −1 0 1 2 3Year relative to increase in coverage
Unskilled labor Skilled laborResidual coverage rate
Note: Baseline firm sample over the period 2001-2007, consisting of joint-stock firms recorded in the internet survey.
Sampling weights are used to ensure representative results for the population of joint-stock firms. Coverage rates are
residuals from a regression of municipality-level broadband coverage on municipality, industry and year fixed effects. Time
zero represents the year with the strongest growth in residual coverage rates in a given municipality. In each time period,
we estimate production functions and wage regressions while controlling for municipality, industry and year fixed effects.
Graph (a) reports period-specific OLS estimates of the output elasticity of skilled and unskilled labor. Graph (b) reports
period-specific LP estimates of the output elasticity of skilled and unskilled labor. In each graph, the output elasticities are
normalized so that they equal one at t = −1 .
21

Table 2. Production function estimates with two levels of skill
Output elasticitiesOLS IV LP
Capital 0.108*** 0.113*** 0.232***(0.0069) (0.0170) (0.032)
Unskilled 0.302*** 0.322*** 0.256***(0.0131) (0.0248) (0.0214)
Skilled 0.335*** 0.310*** 0.231***(0.0155) (0.0253) (0.0196)
Internet×Capital -0.0016 -0.0074 -0.0070(0.0086) (0.0248) (0.0202)
Internet×Unskilled -0.0198 -0.0553 -0.0574*(0.0145) (0.0396) (0.0333)
Internet×Skilled 0.136*** 0.202*** 0.141***(0.0143) (0.0433) (0.0373)
Null hypothesis P-valuesNo absolute skill bias: βs1 ≤ 0 0.000 0.000 0.000No relative skill bias: βs1
βs0≤ βu1
βu00.000 0.001 0.001
No strong skill bias: βs1 ≤ 0 and/or βu1 ≥ 0 0.087 0.081 0.042* p < 0.10, ** < 0.05, *** p < 0.01.
Note: Baseline firm sample over the period 2001-2007, consisting of 18,675 joint-stock firms recorded in the internet
survey. Sampling weights are used to ensure representative results for the population of joint-stock firms. (Un)Skilled
comprises workers with(out) high school diploma. The standard errors are clustered at the municipality level and robust to
heteroskedasticity. All regressions include fixed effect for year, municipality and industry. To test for strong skill bias, we
use the method of Holm (1979).
22
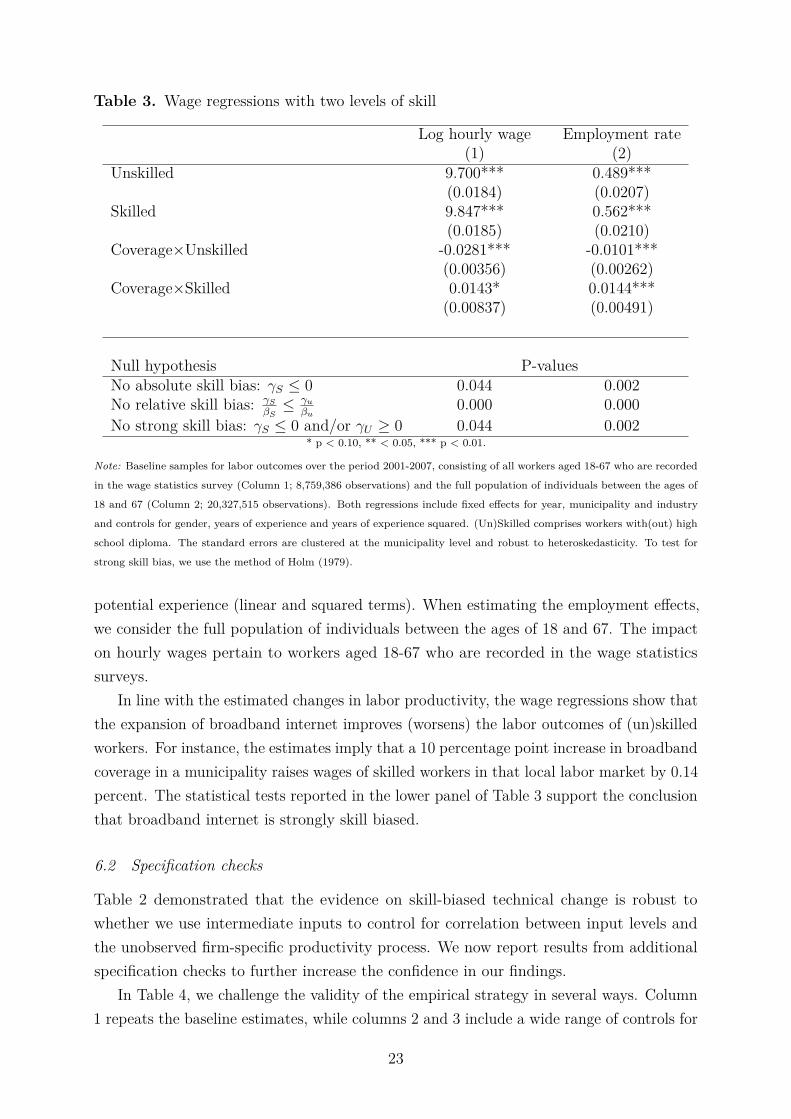
Table 3. Wage regressions with two levels of skill
Log hourly wage Employment rate(1) (2)
Unskilled 9.700*** 0.489***(0.0184) (0.0207)
Skilled 9.847*** 0.562***(0.0185) (0.0210)
Coverage×Unskilled -0.0281*** -0.0101***(0.00356) (0.00262)
Coverage×Skilled 0.0143* 0.0144***(0.00837) (0.00491)
Null hypothesis P-valuesNo absolute skill bias: γS ≤ 0 0.044 0.002No relative skill bias: γS
βS≤ γu
βu0.000 0.000
No strong skill bias: γS ≤ 0 and/or γU ≥ 0 0.044 0.002* p < 0.10, ** < 0.05, *** p < 0.01.
Note: Baseline samples for labor outcomes over the period 2001-2007, consisting of all workers aged 18-67 who are recorded
in the wage statistics survey (Column 1; 8,759,386 observations) and the full population of individuals between the ages of
18 and 67 (Column 2; 20,327,515 observations). Both regressions include fixed effects for year, municipality and industry
and controls for gender, years of experience and years of experience squared. (Un)Skilled comprises workers with(out) high
school diploma. The standard errors are clustered at the municipality level and robust to heteroskedasticity. To test for
strong skill bias, we use the method of Holm (1979).
potential experience (linear and squared terms). When estimating the employment effects,we consider the full population of individuals between the ages of 18 and 67. The impacton hourly wages pertain to workers aged 18-67 who are recorded in the wage statisticssurveys.
In line with the estimated changes in labor productivity, the wage regressions show thatthe expansion of broadband internet improves (worsens) the labor outcomes of (un)skilledworkers. For instance, the estimates imply that a 10 percentage point increase in broadbandcoverage in a municipality raises wages of skilled workers in that local labor market by 0.14percent. The statistical tests reported in the lower panel of Table 3 support the conclusionthat broadband internet is strongly skill biased.
6.2 Specification checks
Table 2 demonstrated that the evidence on skill-biased technical change is robust towhether we use intermediate inputs to control for correlation between input levels andthe unobserved firm-specific productivity process. We now report results from additionalspecification checks to further increase the confidence in our findings.
In Table 4, we challenge the validity of the empirical strategy in several ways. Column1 repeats the baseline estimates, while columns 2 and 3 include a wide range of controls for
23

time-varying demographic and industry characteristics. When we include these covariates,we find that the estimated output elasticities are quite similar to our baseline estimates.
An important requirement for our instrument to be valid is that the expansion ofbroadband internet is unrelated to different underlying time trends in firm productivityacross municipalities. Columns 4-6 of Table 4 address this threat to identification. Wefirst interact baseline (year 2000) covariates with a linear (column 4) and quadratic timetrend (column 5). By including these controls in both the first and second stages, we allowthe expansion of broadband internet to be related to different underlying time trends inproductivity across municipalities, depending on their initial characteristics. A limitationof these robustness checks is that baseline characteristics may not adequately capturedifferential time trends across municipalities. Column 6 includes linear municipality-specifictime trends in both the first and second stages. It is reassuring to find that neither the IVestimates nor the LP estimates change significantly when allowing for differential timetrends across municipalities.
In Table 5, we perform the same specification checks for the wage regressions. Consistentwith the baseline estimates, the alternative specifications suggest that the expansion ofbroadband internet improves (worsens) the labor outcomes of skilled (unskilled) workers.
24

Table 4. Specification checks for production function
Time interactedwith covariates Linear
Baseline Covariates Linear Quadratic municipality trends(1) (2) (3) (4) (5) (6)
Panel A: Internet ×Capital -0.00741 -0.0104 -0.0132 -0.0183 -0.0187 -0.00101IV (0.0248) (0.0253) (0.0248) (0.0275) (0.0265) (0.0236)
Internet ×Unskilled -0.0553 -0.0600 -0.0598 -0.0677 -0.0664 -0.0305(0.0396) (0.0406) (0.0403) (0.0422) (0.0420) (0.0431)
Internet ×Skilled 0.202*** 0.202*** 0.192*** 0.195*** 0.190*** 0.163***(0.0433) (0.0441) (0.0438) (0.0451) (0.0445) (0.0410)
Panel B: Internet ×Capital -0.00701 -0.00950 -0.0113 -0.0188 -0.0184 -0.00247LP (0.0202) (0.0205) (0.0199) (0.0216) (0.0209) (0.0202)
Internet ×Unskilled -0.0574* -0.0608* -0.0624* -0.0707** -0.0692** -0.0412(0.0333) (0.0340) (0.0339) (0.0352) (0.0348) (0.0334)
Internet ×Skilled 0.141*** 0.140*** 0.132*** 0.134*** 0.129*** 0.105***(0.0373) (0.0377) (0.0370) (0.0375) (0.0373) (0.0369)
Controls Demographic√ √ √ √ √
Industry√ √ √ √
* p < 0.10, ** < 0.05, *** p < 0.01.
Note: Baseline firm sample over the period 2001-2007, consisting of 18,675 joint-stock firms recorded in the internet survey. Sampling weights are used to ensure representative results for
the population of joint-stock firms. (Un)Skilled comprises workers with(out) high school diploma. The standard errors are clustered at the municipality level and robust to heteroskedasticity.
All regressions include fixed effect for year, municipality and industry. Column (2) adds demographic controls to the baseline model, including municipality-level information on average
household income, mean years of schooling, share of population residing in a densely populated locality, size of population and level of unemployment. Column (3) also includes industry
controls, consisting of municipality averages of revenues, intermediates, capital stock, number of workers and wage bills as well as employment share in manufacturing, employment share in
wholesale, employment share in services, and shares of wages and workers by skill level. Columns (4) and (5) interact linear and quadratic time trends with baseline values (year 2000) of
these covariates. Column (6) includes municipality-specific linear time trends.
25

Table 5. Specification checks for wage regression
Time interactedwith covariates Linear
Baseline Covariates Linear Quadratic muncipality trends(1) (2) (3) (4) (5) (6)
Panel A: Cov×Unskilled -0.0101*** -0.00885*** -0.00893*** -0.0141*** -0.0147*** -0.0128***Employment rate (0.00262) (0.00221) (0.00235) (0.00330) (0.00346) (0.00338)
Cov×Skilled 0.0144*** 0.0155*** 0.0154*** 0.0103*** 0.00974*** 0.0116***(0.00491) (0.00373) (0.00359) (0.00262) (0.00252) (0.00260)
Panel B: Cov×Unskilled -0.0281*** -0.0270*** -0.0271*** -0.0282*** -0.0283*** -0.0310***Log hourly wage (0.00356) (0.00392) (0.00410) (0.00634) (0.00636) (0.00620)
Cov×Skilled 0.0143* 0.0152* 0.0152** 0.0134*** 0.0133*** 0.0106**(0.00837) (0.00786) (0.00756) (0.00498) (0.00504) (0.00535)
Demographic√ √ √ √ √
Industry√ √ √ √
* p < 0.10, ** < 0.05, *** p < 0.01.
Note: Baseline samples of labor outcomes over the period 2001-2007, consisting of all workers aged 18-67 who are recorded in the wage statistics survey (Panel B; 8,759,386 observations) and
the full population of individuals between the ages of 18 and 67 (Panel A; 20,327,515 observations). All regressions include fixed effects for year, municipality and industry, and controls for
gender, years of experience and years of experience squared. (Un)Skilled comprises workers with(out) high school diploma. The standard errors are clustered at the municipality level and
robust to heteroskedasticity. Column (2) adds demographic controls to the baseline model, including municipality-level information on average household income, mean years of schooling,
share of population residing in a densely populated locality, size of population and level of unemployment. Column (3) also includes industry controls, consisting of municipality averages
of revenues, intermediates, capital stock, number of workers and wage bills as well as employment share in manufacturing, employment share in wholesale, employment share in services,
and shares of wages and workers by skill level. Columns (4) and (5) interact linear and quadratic time trends with baseline values (year 2000) of these covariates. Column (6) includes
municipality-specific linear time trends.
26

6.3 Understanding the pattern of adoption
Following Imbens and Angrist (1994), our IV and LP estimates should be interpreted as thelocal average treatment effects (LATE) for the sub-population of firms that quickly adoptbroadband when it becomes accessible (often called “compliers”). To characterize thesecompliers and understand the pattern of broadband adoption, we estimate the followingregression model separately for different types of firms:
Dimkt = δZmt + γm + θt + σk + νimkt. (9)
We partition the baseline sample into ten mutually exclusive groups by industry and shareof workers with high school diploma (above and below median within each industry).Column 1 of Table 6 displays the proportion of the sample in each industry–skill group.The estimates of δ for the different types of firms are shown in the second column ofTable 6. The proportion of the compliers of a given type is then calculated as the ratio ofδ for that subgroup to the δ in the overall sample, multiplied by the proportion of thesample in the industry–skill group. Column 3 shows the distribution of the compliers byindustry and skill intensity. We see that firms with a large share of high skilled workersare overrepresented among the compliers in every industry compared to the sample offirms at large.
Columns 4–6 of Table 6 report the characteristics of each industry–skill group prior tothe roll-out (in year 2000). Column 4 shows that in every industry the complier firms tendto be relatively large or productive (as measured by value added), while columns 5 and 6show that they are more likely to deploy high skilled labor and use computers intensively.These findings suggest that when broadband internet becomes available, it is not randomlyadopted; instead, it is more quickly adopted in firms in which complementary factorsare abundent, including computers and skilled workers. This conforms to the predictionsof a model of endogenous technology adoption where firms’ choices reflect principles ofcomparative advantage (see e.g. Beaudry and Green, 2003, 2005; Beaudry, Doms, andLewis, 2010). The pattern of broadband adoption illustrates that the estimated effectspertain to a selective subgroup of early adopters of broadband internet; as a result, weneed to be cautious in extrapolating these local estimates to the longer-run impact ofbroadband adoption for the population of firms at large.26
26For the same reason, we also need to be cautious in comparing the OLS estimates to the IV or LPestimates. The OLS estimates differ either because of endogeneity bias or because of heterogeneity acrossfirms in the impact of adopting broadband internet.
27

Table 6. Characterizing complier firms
Composition Composition of Log value Share of skilled Share of workers Numberof sample δ compliers added workers using PC of obs.
(1) (2) (3) (4) (5) (6) (7)ManufacturingLow skill 0.13 0.17 0.10 7.06 0.35 0.33 2,377High skill 0.13 0.21 0.12 7.23 0.62 0.54 2,384
WholesaleLow skill 0.16 0.16 0.11 6.40 0.38 0.56 3,019High skill 0.16 0.25 0.17 6.67 0.60 0.68 3,019
Business servicesLow skill 0.06 0.11 0.03 6.50 0.49 0.62 1,055High skill 0.06 0.17 0.04 7.06 0.81 0.95 1,055
ConstructionLow skill 0.07 0.36 0.11 6.65 0.43 0.23 1,318High skill 0.07 0.39 0.12 6.63 0.65 0.31 1,318
OthersLow skill 0.08 0.18 0.07 6.50 0.38 0.27 1,565High skill 0.08 0.21 0.08 6.50 0.62 0.49 1,565
Overall 1.00 0.23 1.00 6.68 0.50 0.50 18,675Note: We partition the baseline firm sample into ten mutually exclusive groups by industry and share of workers with high school diploma (above and below median within each industry).
Column (1) displays the proportion of the sample in each industry–skill group. Column (2) reports estimates of δ from equation (9) for each group. The proportion of the compliers of a
given type is then calculated as the ratio of δ for that subgroup to the δ in the overall sample, multiplied by the proportion of the sample in the industry–skill group. Column (3) shows the
distribution of the compliers by industry and skill intensity. Columns (4)–(6) report characteristics of each industry–skill group prior to the roll-out (in year 2000). Sampling weights are used
to ensure representative results for the population of joint-stock firms.
28

6.4 Economic significance
To put the size of our estimates into perspective, we calculate counterfactual outputelasticities and labor outcomes that would have occurred in the absence of the broadbandexpansion. A counterfactual outcome is measured as the actual outcome minus thepredicted effect of broadband internet on the outcome (of compliers). Consider thepredicted effect on the output elasticity of (un)skilled labor. In each year, we computethis as the broadband coverage rate Zmt multiplied by the coefficient δ on coverage ratein equation (9) times the coefficient on the interaction between broadband adoption and(un)skilled labor in equation (7). Similarly, the predicted effect on (un)skilled wages oremployment is calculated as the broadband coverage rate times the coefficient γS (γU) onthe interaction between broadband coverage and (un)skilled in equation (8).
Panel (a) of Figure 5 shows the actual time trends for the estimated output elasticties,as well as the predicted counterfactual time trends. While these graphs are based on theLP estimates, the trends change little if we instead use the IV estimates. The outputelasticity of skilled labor has increased over time, in part because of the expansion ofbroadband coverage. By comparison, unskilled workers experienced an initial decline intheir labor productivity due to the expansion of broadband internet. In the last year ofour sample, we predict the output elasticity of (un)skilled workers would have been 0.34instead of 0.30 (0.23 instead of 0.24) in the absence of the broadband expansion.
Panels (b) and (c) of Figure 5 show similar graphs for employment rates and hourlywages. Due to a sluggish Norwegian economy, the employment rates are declining between2000 and 2004. While the expansion of broadband internet mitigates the fall in employmentrates among skilled workers, unskilled workers experience a larger decline than in theabsence of the expansion. In 2005, for example, the employment rate for (un)skilled workerswas 1.3 (0.9) percentage points higher (lower) than it otherwise would have been. Bycomparison, hourly wages increase throughout our sample period. In 2007, our estimatessuggest the wages are (2.8 % lower) 1.4 % higher for (un)skilled workers than they wouldhave been in the absence of the broadband expansion.
6.5 Implications for TFP
Another way to quantify the importance of productivity-influencing factors is to comparethe dispersion in TFP estimates from production functions with and without these factors(see e.g. Syverson, 2011). We examine the contribution from broadband internet bycomparing the results from a standard production function:
yimkt = x′imktβ0 + ηm + τt + λk + νimkt (10)
29

Figure 5. Economic significance of changes in output elasticities and labor outcomes
(a) Output elasticities
.25
.3.3
5O
utpu
t ela
stic
ity
2000 2001 2002 2003 2004 2005 2006 2007year
Skilled
.15
.2.2
5O
utpu
t ela
stic
ity
2000 2001 2002 2003 2004 2005 2006 2007year
Unskilled
(b) Employment rates
.78
.8.8
2E
mpl
oym
ent r
ate
2000 2001 2002 2003 2004 2005 2006 2007year
Skilled
.56
.58
.6.6
2E
mpl
oym
ent r
ate
2000 2001 2002 2003 2004 2005 2006 2007year
Unskilled
(c) Log hourly wages
1010
.110
.2H
ourly
wag
e (lo
g)
2000 2001 2002 2003 2004 2005 2006 2007year
Skilled
9.8
9.9
10H
ourly
wag
e (lo
g)
2000 2001 2002 2003 2004 2005 2006 2007year
Unskilled
Note: Solid line = actual outome. Dashed line = counterfactual outcome in the absence of broadband internet expansion.
A counterfactual outcome is measured as the actual outcome minus the predicted effect of broadband internet on the
outcome. In each year, we compute the predicted effect on the output elasticity of (un)skilled labor as the broadband
coverage rate Zmt multiplied by the coefficient δ on coverage rate in equation (9) times the coefficient on the interaction
between broadband adoption and (un)skilled labor in equation (7). In each year, we compute the predicted effect on
(un)skilled wages or employment as the broadband coverage rate times the coefficient γS (γU ) on the interaction between
broadband coverage and (un)skilled in equation (8).
30

Table 7. Dispersion of TFP with and without broadband internet
Production function estimation:OLS IV LP
Without With Without With Without WithBroadband internet: (1) (2) (3) (4) (5) (6)
Standard deviation 0.84 0.77 0.84 0.82 1.12 1.0690/50 percentiles 1.73 1.70 1.73 1.71 2.04 2.0050/10 percentiles 1.61 1.59 1.61 1.61 1.96 1.96
Note: Baseline firm sample over the period 2001-2007, consisting of 18,675 joint-stock firms recorded in the internet survey.
Sampling weights are used to ensure representative results for the population of joint-stock firms. Columns (1), (3) and
(5) report results in the case where TFP is constructed from the production function in equation (10) without broadband
internet. Columns (2), (4) and (6) report results in the case where TFP is constructed from the production function in
equation (3) with broadband internet. Standard deviation measures dispersion across firms from their average TFP. 90/50
and 50/10 ratios refer to percentiles in the distribution of TFP across firms.
to those produced by equation (3) where we allow broadband internet to shift the productiontechnology. We define
A0it ≡ eνimkt
A1it ≡ eεimkt
as measures of TFP in firms according to the specification with (A1it) and without (A0
it)broadband adoption in the production function.
To measure the extent to which broadband internet accounts for firm productivity, wecompare the dispersion of A0
it and A1it across firms in our baseline sample. The results
are reported in Table 7. Given that equation (3) nests equation (10), we expect lessdispersion in A1
it as compared to A0it. Indeed, the dispersion in TFP across firms is reduced
by including broadband internet in the production function estimation. When applyingthe IV and LP estimates, we find the standard deviation in TFP declines from 0.84 to0.82 (2.4 percent) and from 1.12 to 1.06 (5.3 percent), respectively. By comparing the90/50 and 50/10 ratios, we find that broadband internet is more important in explainingdifferences in the upper part of the TFP distribution.
6.6 Worker heterogeneity
Our estimates of how broadband adoption affects productivity and labor outcomes areconsistent with the widespread view that ICT is complementary with human capital;therefore, falls in quality-adjusted ICT prices increase skill demand and the returns to skill.We now explore what types of human capital that are complementary with broadbandinternet.
Since we have access to detailed information on educational attainment, we are able
31

Table 8. Production function estimates with 3 skill categories and field of study
Production functionOLS IV LP
Panel AInternet×Unskilled -0.0338* -0.103** -0.0832*
(0.0190) (0.0523) (0.0427)Internet×Medium skilled 0.0404*** 0.0209 -0.0149
(0.0137) (0.0465) (0.0372)Internet×High skilled 0.0856*** 0.158*** 0.126***
(0.00761) (0.0438) (0.0360)Panel BInternet×Unskilled -0.00121 -0.190** -0.147*
(0.0359) (0.0929) (0.0800)Internet×Medium skilled -0.00161 0.00285 -0.0259
(0.0368) (0.0682) (0.0649)Internet×High skilled low return field 0.0131 0.0735 0.0594
(0.0163) (0.0473) (0.0431)Internet×High skilled high return field 0.0797*** 0.208*** 0.164***
(0.0164) (0.0671) (0.0620)* p < 0.10, ** < 0.05, *** p < 0.01.
Note: We restrict the baseline firm sample to firms with at least one employee in each skill category. As a result, Panel
A (B) consists of 16,249 (11,449) joint-stock firms recorded in the internet survey. Sampling weights are used to ensure
representative results for the population of joint-stock firms with at least one employee in each skill category. Unskilled
comprises workers without high school diploma; medium skilled consists of high school graduates (with no post-secondary
education); high skilled includes individuals with post-secondary education. High return fields comprise science, technology,
engineering, and social sciences including law and economics; low return fields include teaching, health, humanities, primary
sector, transport and communication (for more details, see Appendix Table A5). The standard errors are clustered at the
municipality level and robust to heteroskedasticity. All regressions include fixed effect for year, municipality and industry.
32

Table 9. Wage regressions with 3 skill categories and field of study
Employment rate Log hourly wage(1) (2)
Panel A:Cov×Unskilled -0.00782*** -0.0122***
(0.00251) (0.00323)Cov×Medium skilled 0.00322 -0.00921
(0.00252) (0.00600)Cov×High skilled 0.0245*** 0.0221***
(0.00787) (0.00736)
Panel B:Cov×Unskilled -0.00748*** -0.0102***
(0.00254) (0.00373)Cov×Medium skilled 0.00356 -0.00734
(0.00259) (0.00666)Cov×High skilled low return field 0.0185*** 0.00749**
(0.00503) (0.00336)Cov×High skilled high return field 0.0329*** 0.0478***
(0.0119) (0.0172)
* p < 0.10, ** < 0.05, *** p < 0.01.
Note: Baseline samples of labor outcomes over the period 2001-2007, consisting of all workers aged 18-67 who are recorded
in the wage statistics survey (Column 1; 8,759,386 observations) and the full population of individuals between the ages
of 18 and 67 (Column 2; 20,327,515 observations). All regressions include fixed effects for year, municipality and industry
and controls for gender, years of experience and years of experience squared. Unskilled comprises individuals without
high school diploma; medium skilled consists of high school graduates (with no post-secondary education); high skilled
includes individuals with post-secondary education. High return fields comprise science, technology, engineering, and social
sciences including law and economics; low return fields include teaching, health, humanities, primary sector, transport and
communication (for more details, see Appendix Table A5). The standard errors are clustered at the municipality level and
robust to heteroskedasticity.
33

to make the distinction between high (post secondary education), middle (high schoolgraduates) and low (without high school diploma) skilled labor. Moreover, we are ableto differentiate between field of study among college graduates. To gain precision, weconsider two types of college graduates: high return fields (consisting of science, technology,engineering, business and social sciences including law and economics) vs. low return fields(all other fields such as teaching, health, humanities, etc.). Appendix Table A5 forms thebasis for the categorization of fields of study by their returns, demonstrating that workerswith high vs. low return fields had systematically different wages prior to the expansion ofbroadband internet.
Table 8 reports production function estimates where we differentiate between threelevels of education as well as field of study among college graduates.27 Panel A suggeststhe skill complementarity of broadband internet mainly pertains to workers with post-secondary education. Panel B shows the increase in labor productivity is especially strongfor college graduates in high return fields. In Table 9, we augment the wage regression inequation (8) to include three levels of skills and interactions between high skilled and fieldof study. Consistent with the estimated changes in output elasticities, we find the gains ofbroadband internet are largest for college graduates in high return fields.
7 Mechanisms
We explore several channels through which broadband internet can affect labor productivityand labor outcomes.
The first possible channel is that expansion of broadband internet changes demand forgoods in favor of skilled labor. For example, broadband internet may facilitate e-commerce,either through online sales of final goods or online procurement of intermediate goods.To investigate this, we use information for our baseline sample of firms on whether theyprocure intermediate goods online or receive orders online. Using these variables asdependent variables, we estimate an IV model in which the second stage equation is
Yimkt = ζDimkt + ηm + τt + λk + εimkt, (11)
and the first stage equation is given by equation (9). Panel A of Appendix Table A6reports the IV estimates. There is no evidence of a significant effect of broadband adoptionon the probability of procuring online or receiving orders online. Another piece of evidenceagainst this channel is provided in Appendix Table A9. In this table, we examine howbroadband adoption affects labor productivity among firms in the tradeable sector where
27In Table 8, we refine the baseline sample to be appropriate for the estimation of these productionfunctions by focusing on firms with at least one employee in each skill category. As a result, Panel Aconsists of 16,249 firms, whereas Panel B uses 11,449 firms.
34

demand is given by the world market.28 Consistent with the baseline results, we find thatbroadband adoption increases (decreases) the productivity of (un)skilled labor.
A second possible channel is that our findings are driven by changes in labor productivityand wages in firms that may have been directly affected by the expansion of broadbandaccess. However, both the output elasticities and the wage regression results barely moveif we exclude telecom firms (including Telenor) or IT consultancy companies from theestimation sample (see Appendix Tables A7 and A8). It could also be that broadbandadoption coincides with general technical upgrading in firms. For example, the estimatedchanges in labor productivity might be due to investments in computers at the timebroadband is adopted. We investigate this by estimating equations (11) and (9) with theshare of workers using PC as the dependent variable in the second stage. The IV estimatereported in Panel B of Appendix Table A6 does not support this channel.
Instead, our findings are consistent with the task approach to skill biased technologicalchange. Starting with Autor, Levy, and Murnane (2003), a growing literature suggest thatICT substitutes for workers in performing routine tasks – more amenable to automatization– and complements workers in executing nonroutine abstract tasks. To explore this channel,we use the wage statistics surveys with information on occupation codes at the 4-digitlevel.29 We link these occupation codes with job task requirements from the DOT data baseprovided by Autor and Dorn (2013). The measured job task intensities are (nonroutine)abstract tasks, routine tasks and (nonroutine) manual tasks. Appendix Table A10 providesexamples of workplace activities with different task intensities.30
We find two pieces of evidence in support of the task based explanation of skill biasedtechnological change. We first show that workers of different educational backgroundindeed cluster disproportionately in occupations that require different tasks. Table 10shows the occupational types, wages and task intensities for each skill category.31 Wefind that college graduates tend to move into professional and managerial occupationsthat are pervasive at abstract tasks and pay more. The sorting is especially strong amongindividuals with college degrees in high return fields. By comparison, low educated workers
28Appendix Table A9 uses two measures of tradability. In Columns (1) and (2), we measure tradabilityin each 4-digit industry by dividing total levels of exports and imports by the value added of firms. InColumns (3) og (4), we follow Jensen and Kletzer (2005) in measuring tradability by the geographicconcentration of an industry, defined as the Herfindahl index of employment shares across municipalitiesin each 4-digit industry. For both measures, we estimate the production function separately for firms inindustries with values of tradability above and below the median in the baseline firm sample.
29We observe occupation codes for about 52% of the workers in the wage statistics surveys. As a result,Tables 10 and 11 are based on a subsample of the baseline sample used in the main wage regressions.When estimating the main wage regressions on this subsample, the conclusions about skill-biased technicalchange hold. Specifically, the estimated coefficient on the interaction between skilled and coverage ratesmoves from 0.0143 (s.e. = 0.008) to 0.0135 (s.e. = 0.008), whereas that for unskilled and coverage rateschanges from -0.0281 (s.e. = 0.004) to -0.0423 (s.e. = 0.009).
30See Autor, Levy, and Murnane (2003) and Autor and Dorn (2009) for detailed descriptions of how thetask intensities are measured and intepreted.
31Following Autor and Dorn (2013), we define professional and managerial occupations as white-collarmanagerial, professional specialists, technical, finance, and public safety occupations.
35

are over-represented in poorly paid occupations that involve relatively little abstract tasks,but require more routine or manual tasks.
Next, we estimate wage regressions which include interactions between broadbandinternet and the tasks performed in jobs rather than (or in addition to) the educationalcredentials of workers performing those jobs. All regressions control for time, municipality,and industry fixed effects as well as (potential) experience and gender. The estimates areprovided in Table 11. Column 1 shows the expansion of broadband internet re-enforced thewage premiums to workers performing abstract tasks. By comparison, the wages paid tojobs requiring routine tasks declined because of the broadband expansion. The estimatesimply that, holding everything else equal, a 10 percentage point increase in broadbandcoverage in a municipality raises (lowers) hourly wages of workers with abstract (routine)task intensity at the 75th percentile by 0.9 (0.2) percent, as compared to workers at the25th percentile of the task intensity. Columns 2-4 show the estimates are quite similarwhen we control for skill levels and their interaction with broadband coverage. Takentogether, the results presented in Tables 10 and 11 suggest an important channel behindthe skill bias of broadband internet is that it complements non-routine abstract tasks butsubstitutes for routine tasks whilst not affecting manual tasks.
36

Table 10. Occupation types, wages and task intensities by skill category.
Occupation types Mean relative wage Relative task intensities
Professional & Professional &
Managerial Other All Managerial Other M/A R/A Number
(1) (2) (3) (4) (5) (6) (7) of obs.
A. 2 skill categories
Unskilled 0.12 0.88 -0.13 0.16 -0.17 0.15 0.24 1,730,625
Skilled 0.41 0.59 0.08 0.29 -0.07 -0.09 -0.14 2,855,708
B. 3 skill categories
Unskilled 0.12 0.88 -0.13 0.16 -0.17 0.15 0.24 1,730,625
Medium skilled 0.17 0.83 -0.05 0.22 -0.10 0.11 0.18 1,446,022
High skilled 0.66 0.34 0.21 0.30 0.02 -0.30 -0.47 1,409,686
C. 3 skill categories with low/high return fields
Unskilled 0.12 0.88 -0.13 0.16 -0.17 0.15 0.24 1,730,625
Medium skilled 0.17 0.83 -0.05 0.22 -0.10 0.11 0.18 1,446,022
High skilled low return field 0.68 0.32 0.09 0.15 -0.05 0.03 -0.30 613,708
High skilled high return field 0.65 0.35 0.30 0.43 0.07 -0.55 -0.61 795,978
Note: We restrict the baseline worker sample to individuals for which we observe occupation code at the 4-digit level in the wage statistics surveys. The occupation codes are linked
with measures of task intensity from the Dictionary of Occupational Title, as reported by Autor and Dorn (2013). Unskilled comprises individuals without high school diploma; medium
skilled consists of high school graduates (with no post-secondary education); high skilled includes individuals with post-secondary education. High return fields comprise science, technology,
engineering, and social sciences including law and economics; low return fields include teaching, health, humanities, primary sector, transport and communication. Columns (1) and (2)
show the occupation distribution by skill category. Following Autor and Dorn (2013), we define professional and managerial occupations as white-collar managerial, professional specialists,
technical, finance, and public safety occupations. Columns (3)-(5) provide mean relative wage by type of occupation and skill category. The mean relative wage is defined as the average
log hourly wage within each skill-occupation group relative to the overall sample mean. Columns (6) and (7) report relative task intensities by skill level. Following Autor and Dorn (2009,
2013), we calculate M/A (R/A) as the mean of the logarithm of the ratio of the manual (routine) task content in an occupation to the abstract task content in the same occupation. Both
measures are standardized with mean zero and variance one.
37

Table 11. Wage regressions with task intensities
Skill categories3 skill levels and
2 skill levels 3 skill levels low & high return fieldsDep. variable: Log hourly wage (1) (2) (3) (4)Abstract 0.364*** 0.326*** 0.265*** 0.271***
(0.0143) (0.0137) (0.0142) (0.0139)Routine -0.0579*** -0.0627*** -0.0633*** -0.0583***
(0.00605) (0.00575) (0.00534) (0.00500)Manual 0.0287*** 0.0241*** 0.0169** 0.0181***
(0.00785) (0.00756) (0.00726) (0.00642)Coverage×Abstract 0.178*** 0.170*** 0.161*** 0.158***
(0.0325) (0.0293) (0.0300) (0.0291)Coverage×Routine -0.0347*** -0.0358*** -0.0340*** -0.0340***
(0.00740) (0.00750) (0.00737) (0.00739)Coverage×Manual -0.00183 -0.00100 -0.000867 0.00859
(0.0121) (0.0117) (0.0107) (0.00930)Controls:Skill categories
√ √ √
Coverage*Skill category√ √ √
* p < 0.10, ** < 0.05, *** p < 0.01.
Note: We restrict the baseline worker sample to individuals for which we observe occupation code at the 4-digit level in the wage statistics surveys (4,586,333 observations). The occupation
codes are linked with measures of task intensity from the Dictionary of Occupational Title (DOT), as reported by Autor and Dorn (2013). Following Autor, Levy, and Murnane (2003), we
convert the DOT measures into percentiles of the task distribution. Unskilled comprises individuals without high school diploma; medium skilled consists of high school graduates (with no
post-secondary education); high skilled includes individuals with post-secondary education. High return fields comprise science, technology, engineering, and social sciences including law and
economics; low return fields include teaching, health, humanities, primary sector, transport and communication. Column (1) presents results from a regression of log hourly wages on task
intensities and their interaction with broadband coverage in the local labor market. Column (2) adds indicator variables for two levels of skill and their interaction with broadband coverage.
Column 3 includes indicator variables for three levels of skills and their interaction with broadband coverage. Column (4) includes indicator variables for three levels of skill, high return and
low return field of study, and their interaction with broadband coverage. All regressions include fixed effects for year, municipality and industry, and controls for gender, years of experience
and years of experience squared. Standard errors are heteroskedasticity robust and clustered at the municipality level.
38

8 Conclusion
In 2009, the U.S. Congress asked for a plan that would provide affordable broadband serviceto all America’s citizens. In other OECD countries, there has been similar calls for publicfunding to roll out broadband infrastructure. While government agencies are projectingbroadband penetration rates to be important for productivity and job creation, there islittle scientific evidence to substantiate these claims. We contribute by examining howadoption of broadband internet in firms shifts their production technology and changes theproductivity and labor outcomes of different types of workers. Our analysis employs severaldata sources from Norway that we can link through unique firm and individual identifiers.Using firm-level information on value added, capital, labor by skill level and broadbandadoption, we estimate production functions where firms can change their technology byadopting broadband internet. We complement these production function estimates withwage regressions which include interactions between broadband internet and skill levels.A public program with limited funding rolled out broadband access points, and providesplausibly exogenous variation of broadband adoption in firms.
We find that broadband adoption favors skilled labor over unskilled labor by increasingits relative productivity. The estimated increase in productivity of skilled labor is especiallylarge for college graduates in high return fields such as science, technology, engineeringand business. By comparison, broadband internet is a substitute for workers withouthigh school diploma, lowering their marginal productivity. Consistent with the estimatedchanges in labor productivity, wage regressions show that the expansion of broadbandinternet improves (worsens) the labor outcomes of skilled (unskilled) workers. We exploreseveral possible explanations for the skill-bias of broadband internet. We find suggestiveevidence that broadband internet complements skilled workers in executing nonroutineabstract tasks, and substitutes for unskilled workers in performing routine tasks. Whenwe use our production function estimates to construct measures of firm level productivity,we find that broadband internet accounts for a few percent of the standard deviation intotal factor productivity across firms.
Taken together, these findings have important implications for the debate about therole of government policies in encouraging productivity growth. Our estimates suggestthat policy increasing the broadband penetration rates could enhance firm productivity.A related issue is why policy changes, even if they encourage productivity, do not alwayshappen. One explanation is that established interests earning rents in the unreformedenvironment could be able to stave off reform. Examining who wins, who loses, and byhow much could inform about the nature of these barriers and how to design compensationschemes. Our study points to the skill bias of broadband induced shift in productiontechnology as a barrier to government investment in broadband infrastructure.
39

References
Acemoglu, D. (2003): “Patterns of Skill Premia,” Review of Economic Studies, 70(2),199–230.
Acemoglu, D., and D. H. Autor (2011): “Skills, Tasks and Technologies: Implica-tions for Employment and Earnings,” in Handbook of Labor Economics Vol. 4, ed. byO. Ashenfelter, and D. E. Card, chap. 12, pp. 1043–1171. Elsevier, Amsterdam.
Atkinson, A. B., L. Rainwater, and T. M. Smeeding (1995): Income Distributionin OECD Countries: Evidence from the Luxembourg Income Study. Organisation forEconomic Co-operation and Development Paris.
Autor, D. H., and D. Dorn (2009): “This Job is ‘Getting Old’: Measuring Changesin Job Opportunities using Occupational Age Structure,” American Economic Review:Papers & Proceedings, 99(2), 45–51.
(2013): “The Growth of Low-Skill Service Jobs and the Polarization of the USLabor Market,” American Economic Review, 103(5), 1553–1597.
Autor, D. H., L. F. Katz, and M. S. Kearney (2006): “The Polarization of the U.S.Labor Market,” American Economic Review Papers and Proceedings, 96(2), 189–194.
(2008): “Trends in US Wage Inequality: Revising the Revisionists,” Review ofEconomics and Statistics, 90(2), 300–323.
Autor, D. H., L. F. Katz, and A. B. Krueger (1998): “Computing Inequality:Have Computers Changed the Labor Market?,” Quarterly Journal of Economics, 113(4),1169–1213.
Autor, D. H., F. Levy, and R. J. Murnane (2003): “The Skill Content of RecentTechnological Change: An Empirical Exploration,” Quarterly Journal of Economics,118(4), 1279–1333.
Beaudry, P., M. Doms, and E. Lewis (2010): “Should the Personal ComputerBe Considered a Technological Revolution? Evidence from U.S. Metropolitan Areas,”Journal of Political Economy, 118(5), 988 – 1036.
Beaudry, P., and D. A. Green (2003): “The Changing Structure of Wages in the USand Germany: What Explains the Differences?,” American Economic Review, 93(3),573–602.
(2005): “Changes in U.S. Wages, 1976–2000: Ongoing Skill Bias or MajorTechnological Change?,” Journal of Labor Economics, 23(3), 609–648.
40

Berman, E. (2000): “Does Factor-Biased Technological Change Stifle InternationalConvergence? Evidence from Manufacturing,” NBER Working Paper 7964.
Berman, E., J. Bound, and Z. Griliches (1994): “Changes in the Demand for SkilledLabor within US Manufacturing: Evidence from the Annual Survey of Manufactures,”Quarterly Journal of Economics, 109(2), 367–397.
Bhuller, M., T. Havnes, E. Leuven, and M. Mogstad (forthcoming): “BroadbandInternet: An Information Superhighway to Sex Crime?,” Review of Economic Studies.
Black, S. E., and A. Spitz-Oener (2010): “Explaining Women’s Success: TechnologicalChange and the Skill Content of Women’s Work,” Review of Economics and Statistics,92(1), 187–194.
Bloom, N., L. Garicano, R. Sadun, and J. Van Reenen (2009): “The Distinct Ef-fects of Information Technology and Communication Technology on Firm Organization,”NBER Working Paper 14975.
Bloom, N., R. Sadun, and J. Van Reenen (2012): “Americans Do IT Better: USMultinationals and the Productivity Miracle,” American Economic Review, 102(1),167–201.
Bond, S., and J. Van Reenen (2007): “Microeconometric Models of Investment andEmployment,” in Handbook of Econometrics, ed. by J. J. Heckman, and E. E. Leamer,pp. 4417–4498. North Holland, London.
Bresnahan, T. F., E. Brynjolfsson, and L. M. Hitt (2002): “Information Technol-ogy, Workplace Organization, and the Demand for Skilled Labor: Firm-level evidence,”Quarterly Journal of Economics, 117(1), 339–376.
Brynjolfsson, E., and L. M. Hitt (2003): “Computing Productivity: Firm-levelEvidence,” Review of Economics and Statistics, 85(4), 793–808.
Caroli, E., and J. Van Reenen (2001): “Skill Biased Organizational Change? Evidencefrom a Panel of British and French Establishments,” Quarterly Journal of Economics,116(4), 1449–1492.
Czernich, N., O. Falck, T. Kretschmer, and L. Woessmann (2011): “BroadbandInfrastructure and Economic Growth,” Economic Journal, 121(May), 505–532.
DiNardo, J. E., and J.-S. Pischke (1997): “The Returns to Computer Use Revisited:Have Pencils Changed the Wage Structure Too?,” Quarterly Journal of Economics,112(1), 291–303.
41

Draca, M., R. Sadun, and J. Van Reenen (2007): “Productivity and ICTs: A Reviewof the Evidence,” in Oxford Handbook of Information and Communication Technologies,ed. by R. Mansell, C. Avgerou, D. Quah, and R. Silverstone, pp. 100–147. OxfordUniversity Press.
Firpo, S., N. M. Fortin, and T. Lemieux (2011): “Occupational Tasks and Changesin the Wage Structure,” IZA Discussion Paper 5542.
Forman, C., A. Goldfarb, and S. Greenstein (2012): “The Internet and LocalWages: A Puzzle,” American Economic Review, 102(1), 556–575.
Fox, J. T., and V. Smeets (2011): “Does Input Quality Drive Measured Differences InFirm Productivity?,” International Economic Review, 52(4), 961–989.
Goldin, C., and L. F. Katz (2007): “Long-Run Changes in the Wage Structure:Narrowing, Widening, Polarizing,” Brookings Papers on Economic Activity, 38(2),135–168.
Goos, M., and A. Manning (2007): “Lousy and Lovely Jobs: The Rising Polarizationof Work in Britain,” Review of Economics and Statistics, 89(1), 118–133.
Holm, S. (1979): “A Simple Sequentially Rejective Multiple Test Procedure,” Scandina-vian Journal of Statistics, 6(2), 65–70.
Imbens, G. W., and J. D. Angrist (1994): “Identification and Estimation of LocalAverage Treatment Effects,” Econometrica, 62(2), 467–475.
Jensen, J. B., and L. G. Kletzer (2005): “Tradable Services: Understanding the Scopeand Impact of Services Outsourcing,” Institute for International Economics WorkingPaper 05-9.
Jorgenson, D. W., M. S. Ho, and K. J. Stiroh (2008): “A Retrospective Look atthe U.S. Productivity Growth Resurgence,” Journal of Economic Perspectives, 22(1),3–24.
Krueger, A. B. (1993): “How Computers Have Changed the Wage Structure: Evidencefrom Microdata, 1984-1989,” Quarterly Journal of Economics, 108(1), 33–60.
Levinsohn, J., and A. Petrin (2003): “Estimating Production Functions Using Inputsto Control for Unobservables,” Review of Economic Studies, 70(2), 317–341.
Machin, S., and J. Van Reenen (1998): “Technology and Changes in Skill Structure:Evidence from Seven OECD Countries,” Quarterly Journal of Economics, 113(4), 1215–1244.
42

Michaels, G., A. Natraj, and J. Van Reenen (forthcoming): “Has ICT PolarizedSkill Demand? Evidence from Eleven Countries over 25 years,” Review of Economicsand Statistics.
Oliner, S. D., D. E. Sichel, and K. J. Stiroh (2007): “Explaining a ProductiveDecade,” Brookings Papers on Economic Activity, 38(1), 81–152.
Olley, S. G., and A. Pakes (1996): “The Dynamics of Productivity in the Telecommu-nications Equipment Industry,” Econometrica, 64(6), 1263–1297.
Pavcnik, N. (2002): “Trade Liberalization, Exit, and Productivity Improvements: Evi-dence from Chilean plants,” Review of Economic Studies, 69(1), 245–276.
St.meld.nr. 38 (1997–1998): “IT-kompetanse i et regionalt perspektiv [A regionalperspective on IT-competency],” Ministry of Trade and Industry.
St.meld.nr. 49 (2003): “Breiband for kunnskap og vekst [Broadband for knowledge andgrowth],” Ministry of Trade and Industry.
Syverson, C. (2011): “What Determines Productivity?,” Journal of Economic Literature,49(2), 326–365.
Van Beveren, I. (2012): “Total Factor Productivity Estimation: A Practical Review,”Journal of Economic Surveys, 26(1), 98–128.
43

Appendix A: Additional Tables and Figures
Figure A1. Distribution of firms by industry
0 .1 .2 .3 .4
Public administrationCommunications
AgricultureUtilities
TransportOther
Hotels and restaurantsReal estate and business services
ConstructionManufacturing
Wholesale/retail
Firm−year observations
0 .1 .2 .3
Public administrationCommunications
AgricultureUtilities
TransportOther
Hotels and restaurantsReal estate and business services
ConstructionManufacturing
Wholesale/retail
Value added
0 .1 .2 .3
Public administrationCommunications
AgricultureUtilities
TransportOther
Hotels and restaurantsReal estate and business services
ConstructionManufacturing
Wholesale/retail
Employees
0 .1 .2 .3
Public administrationCommunications
AgricultureUtilities
TransportOther
Hotels and restaurantsReal estate and business services
ConstructionManufacturing
Wholesale/retail
Wage bills
Industry distribution
Weighted survey Population
Note: The survey sample consists of joint-stock firms recorded in the internet survey. Sampling weights are used to ensure
representative results for the population of joint-stock firms. We exclude firms that are carrying out extraction of natural
resources (including oil, gas and fish).

Figure A2. Cross-sectional distribution of key firm variables
0.1
.2.3
.4K
erne
l den
sity
0 5 10 15Revenues (log)
0.1
.2.3
.4K
erne
l den
sity
−5 0 5 10 15Value added (log)
0.0
5.1
.15
.2.2
5K
erne
l den
sity
−5 0 5 10 15Intermediates (log)
0.0
5.1
.15
.2.2
5K
erne
l den
sity
−5 0 5 10 15Capital (log)
Input−output
Population Unweighted surveyWeighted survey
0.1
.2.3
.4K
erne
l den
sity
0 5 10 15Total wages (log)
0.1
.2.3
.4K
erne
l den
sity
−5 0 5 10 15Wages to unskilled (log)
0.1
.2.3
.4K
erne
l den
sity
−5 0 5 10 15Wages to skilled (log)
Wage bills
Population Unweighted surveyWeighted survey
0.1
.2.3
.4.5
Ker
nel d
ensi
ty
0 2 4 6 8 10All workers (log)
0.1
.2.3
.4K
erne
l den
sity
0 2 4 6 8 10Unskilled workers (log)
0.1
.2.3
Ker
nel d
ensi
ty
0 2 4 6 8 10Skilled workers (log)
Number of workers
Population Unweighted surveyWeighted survey
Note: The survey sample consists of joint-stock firms recorded in the internet survey over the period 2001-2007. The
weighted survey uses sampling weights to ensure representative results for the population of joint-stock firms. We exclude
firms that are carrying out extraction of natural resources (including oil, gas and fish). Detailed descriptions of the variables
are given in Appendix Table A1.

Figure A3. Time trends in key firm variables
7.5
88.
59
Rev
enue
s (lo
g)
2000 2002 2004 2006 2008year
6.5
77.
58
Val
ue a
dded
(lo
g)
2000 2002 2004 2006 2008year
6.5
77.
58
Inte
rmed
iate
s (lo
g)
2000 2002 2004 2006 2008year
44.
55
5.5
6C
apita
l (lo
g)
2000 2002 2004 2006 2008year
Input−output
Population Unweighted surveyWeighted survey
12.5
1313
.514
14.5
Tot
al w
ages
(lo
g)
2000 2002 2004 2006 2008year
11.5
1212
.513
Wag
es to
uns
kille
d (lo
g)
2000 2002 2004 2006 2008year
1212
.513
13.5
14W
ages
to s
kille
d (lo
g)
2000 2002 2004 2006 2008year
Wage bills
Population Unweighted surveyWeighted survey
2.5
33.
54
All
wor
kers
(lo
g)
2000 2002 2004 2006 2008year
1.5
22.
53
Uns
kille
d w
orke
rs (
log)
2000 2002 2004 2006 2008year
1.5
22.
53
3.5
Ski
lled
wor
kers
(lo
g)
2000 2002 2004 2006 2008year
Number of workers
Population Unweighted surveyWeighted survey
Note: The survey sample consists of joint-stock firms recorded in the internet survey over the period 2001-2007. The
weighted survey uses sampling weights to ensure representative results for the population of joint-stock firms. We exclude
firms that are carrying out extraction of natural resources (including oil, gas and fish). Detailed descriptions of the variables
are given in Appendix Table A1

Figure A4. Geographical distribution of broadband coverage rates.
[0,.25)[.25,.5)[.5,.75)[.75,1]No data
2001 2003 2005
Note: The graphs show the geographical distribution of broadband coverage rates of households in 2001, 2003 and 2005.

Figure A5. Timing of broadband expansion and baseline covariates
−1
01
2001 2003 2005 2007year
Income (log)
−.2
0.2
2001 2003 2005 2007year
Education (log)
−.5
0.5
2001 2003 2005 2007year
Urbanization−
10
1
2001 2003 2005 2007year
Population (log)
−5
05
2001 2003 2005 2007year
Unemployment
Demography−
20
2
2001 2003 2005 2007year
Average revenues (log)
−.5
0.5
2001 2003 2005 2007year
Average intermediates (log)
−.5
0.5
2001 2003 2005 2007year
Average capital stock (log)
−1
01
2001 2003 2005 2007year
Average number of workers (log)
−2
02
4
2001 2003 2005 2007year
Average wage bill (log)
Input and output
−.1
0.1
2001 2003 2005 2007year
Number of firms (log)
−.5
0.5
2001 2003 2005 2007year
Empl. share in manufacturing
−.5
0.5
2001 2003 2005 2007year
Empl. share in wholesale
−.5
0.5
2001 2003 2005 2007year
Empl. share in construction
−.5
0.5
2001 2003 2005 2007year
Empl. share in services
Industry structure
−1
01
2001 2003 2005 2007year
Share high skilled wages
−1
01
2001 2003 2005 2007year
Share high skilled workers
Skill structure
Note: We report estimates from equation (5) of the vector ψt for every t (and the associated 95 % confidence intervals).
Demography includes income level, education, share of population residing in a densely populated locality (an urbanization
indictor), size of population and level of unemployment. As measures of industry structure, we use number of firms,
employment share in manufacturing, employment share in wholesale, and employment share in services. For inputs and
output we have included municipality averages of revenues, intermediates, capital stock, number of workers and wage bill.

Figure A6. Period-specific LP estimates of output elasticities, pre and post expansion
(a) Output elasticity: Skilled labor
−.2
−.1
0.1
.2R
esid
ual c
over
age
rate
.15
.2.2
5.3
.35
Out
put e
last
icity
−3 −2 −1 0 1 2 3Year relative to increase in coverage
Skilled labor Residual coverage rate
(b) Output elasticity: Unskilled labor
−.2
−.1
0.1
.2R
esid
ual c
over
age
rate
.1.1
5.2
.25
.3O
utpu
t ela
stic
ity
−3 −2 −1 0 1 2 3Year relative to increase in coverage
Unskilled labor Residual coverage rate
Note: Baseline firm sample over the period 2001-2007, consisting of joint-stock firms recorded in the internet survey.
Sampling weights are used to ensure representative results for the population of joint-stock firms. Coverage rates are
residuals from a regression of municipality-level broadband coverage on municipality, industry and year fixed effects. Time
zero represents the year with the strongest growth in residual coverage rates in a given municipality. In each time period, we
estimate production functions while controlling for municipality, industry and year fixed effects. Graphs (a) and (b) report
period-specific LP estimates of the output elasticity of skilled and unskilled labor. The grey areas show 95% confidence
intervals.

Table A1. Variable definitions
Variable DescriptionFirm accounts Source: The Account Statistics.Revenues Total sales by a firm in year t.Intermediates Procurement of materials and intermediate inputs of a firm in year t.Capital Value of total fixed assets of a firm in year t.Value added Sales minus intermediates of a firm in year t.Industry 4-digit code classifying a firm’s main activity in year t according to the
Standard Industry Classification (SIC2002) system.Municipality 4-digit code for the municipality in which a firm is located in year t.Exports Total value of exported goods of a firm in year t.Imports Total value of imported goods of a firm in year t.Internet variables Source: The community survey on ICT in firmsBroadband Dummy variable for whether a firm has adopted broadband internet
(speed at or above 256 kilobits per second) in year t.Procurementdone online
Dummy variable for whether a firm conducts at least part of itsprocurement online in year t.
Revenues fromonline orders
Dummy variable for whether at least part of a firm’s total revenuescomes from online orders in year t.
Employees Source: Register of Employers and Employees and the Wage StatisticsSurvey.
Annual wages Annual pre-tax wages in year tEmploymentstatus
Dummy variable for whether annual wages exceed the substantialgainful activity threshold in year t (USD 6,850 in 2001), which definesemployment in the Social Security System.
Hourly wages Hourly pre-tax wage per October in year t.Occupation 4-digit occupation code of a job in year t.Individualcharacteristics
Source: National Education Database and Central Population Register.
Education level Years of schooling.Field of study Post-secondary field of study.Municipality Municipality of residence in year t.Age The age of a worker in year t.Potentialexperience
Age in year t - years of schooling - 7
Gender The gender of a worker.

Variable DescriptionInternet coverage Source: Norwegian Ministry of Government Administration.Coverage rate Fraction of households in a given municipality with access to broadband
internet (speed at or above 256 kilobits per second) in year t.Demographiccontrols
Source: Central Population Register.
Urbanization Population share living in densely populated area in a givenmunicipality in year t.
Income Average annual disposable income across individuals aged 16–59 yearsin a given municipality in year t.
Education Average years of schooling across individuals aged 16–59 in a givenmunicipality in year t.
Unemployment Unemployment rate among individuals aged 16–59 in a givenmunicipality in year t.
Industry and firmcontrols
Source: The Account Statistics and Register of Employers andEmployees.
Share of skilledworkers
Share of employed workers with high school diploma in a givenmunicipality in year t.
Share of totalwages to skilledworkers
Share of the total wage bill paid to workers with high school diploma ina given municipality in year t.
Share ofemployment byindustry
Share of workers in the manufacturing/wholesale/service industry in agiven municipality in year t.
Average inputlevels
Average level of capital stock/value added/number of workers/wagespaid/revenues across firms in a given municipality in year t.
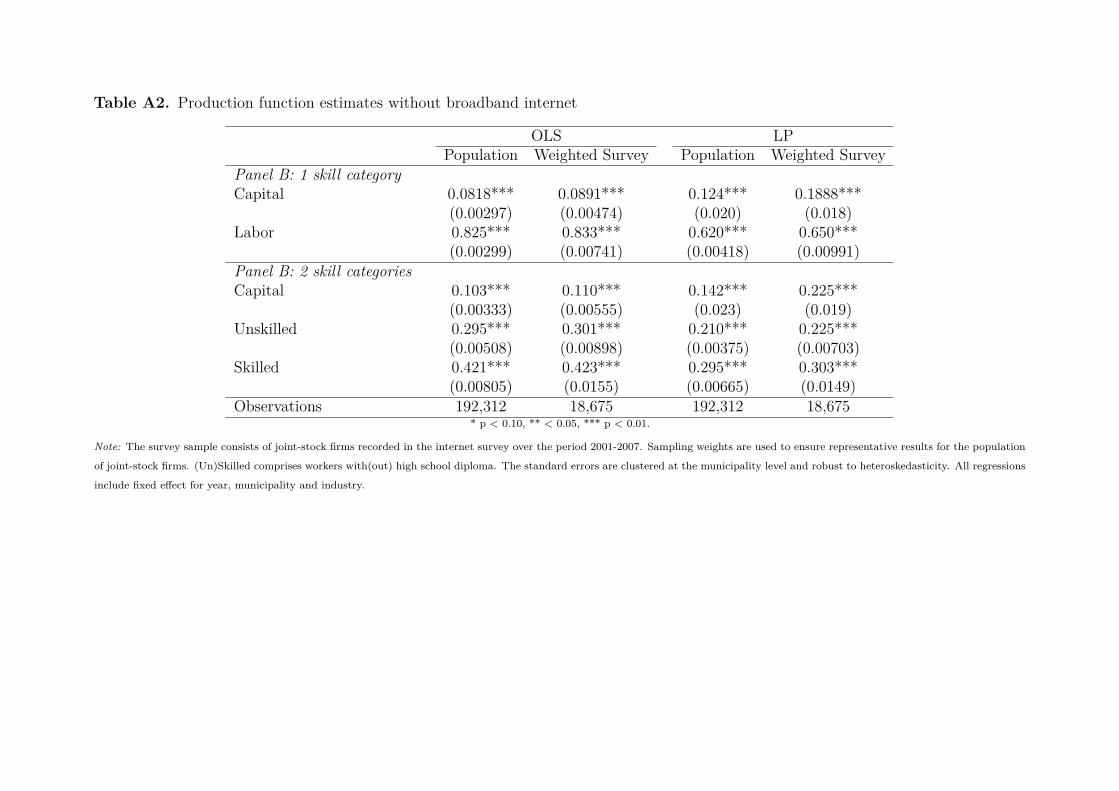
Table A2. Production function estimates without broadband internet
OLS LPPopulation Weighted Survey Population Weighted Survey
Panel B: 1 skill categoryCapital 0.0818*** 0.0891*** 0.124*** 0.1888***
(0.00297) (0.00474) (0.020) (0.018)Labor 0.825*** 0.833*** 0.620*** 0.650***
(0.00299) (0.00741) (0.00418) (0.00991)Panel B: 2 skill categoriesCapital 0.103*** 0.110*** 0.142*** 0.225***
(0.00333) (0.00555) (0.023) (0.019)Unskilled 0.295*** 0.301*** 0.210*** 0.225***
(0.00508) (0.00898) (0.00375) (0.00703)Skilled 0.421*** 0.423*** 0.295*** 0.303***
(0.00805) (0.0155) (0.00665) (0.0149)Observations 192,312 18,675 192,312 18,675
* p < 0.10, ** < 0.05, *** p < 0.01.
Note: The survey sample consists of joint-stock firms recorded in the internet survey over the period 2001-2007. Sampling weights are used to ensure representative results for the population
of joint-stock firms. (Un)Skilled comprises workers with(out) high school diploma. The standard errors are clustered at the municipality level and robust to heteroskedasticity. All regressions
include fixed effect for year, municipality and industry.

Table A3. Descriptive statistics of baseline sample
2001 2004 2007 TotalEmployment rate (level) (level) (level) (level)Total 0.72 0.70 0.72 0.71
(0.45) (0.46) (0.45) (0.45)Unskilled 0.60 0.56 0.58 0.58
(0.49) (0.50) (0.49) (0.49)Skilled 0.82 0.80 0.82 0.81
(0.38) (0.40) (0.39) (0.39)Hourly wage (log) (log) (log) (log)Total 2.95 3.05 3.12 3.04
(0.27) (0.28) (0.30) (0.30)Unskilled 2.83 2.92 2.98 2.91
(0.21) (0.22) (0.23) (0.24)Skilled 3.02 3.11 3.18 3.10
(0.28) (0.29) (0.30) (0.31)Number of individuals, aged 18-67 2,829,739 2,899,342 2,991,389 20,327,515Number of workers in wage survey, aged 18-67 1,161,912 1,246,036 1,349,481 8,759,386
Note: (Un)Skilled comprises workers with(out) high school diploma. Detailed descriptions of the variables are given in
Appendix Table A1.

Table A4. First stage regressions: 2 skill categories.
Internet × Internet × Internet ×Dependent variable: Internet Capital Unskilled Skilled
(1) (2) (3) (4)Panel A: Capital 0.0237*** 0.223*** 0.294*** 0.283***IV (0.00810) (0.0454) (0.0937) (0.0949)
Unskilled 0.0341*** 0.236*** 0.527*** 0.485***(0.0122) (0.0585) (0.134) (0.146)
Skilled 0.0596*** 0.392*** 0.784*** 0.877***(0.0136) (0.0647) (0.160) (0.168)
Coverage 0.589*** 1.709** -0.270 0.393(0.167) (0.806) (1.964) (1.987)
Coverage ×Capital -0.0159* 0.609*** -0.192* -0.176(0.00928) (0.0500) (0.109) (0.110)
Coverage ×Unskilled -0.0294** -0.167** 0.317* -0.355**(0.0150) (0.0690) (0.162) (0.177)
Coverage ×Skilled 0.00536 -0.114 0.0206 0.620***(0.0171) (0.0745) (0.198) (0.202)
F-value (instruments) 18.3 48.8 14.3 13.0Panel B: Capital 0.0589** -0.227** 0.551* 0.504*LP (0.0247) (0.113) (0.282) (0.295)
Unskilled 0.0251** 0.169*** 0.409*** 0.352**(0.0122) (0.0575) (0.133) (0.146)
Skilled 0.0493*** 0.310*** 0.643*** 0.717***(0.0136) (0.0645) (0.159) (0.166)
Coverage 0.596*** 1.936** 0.0365 0.824(0.166) (0.790) (1.955) (1.976)
Coverage ×Capital -0.0143 0.602*** -0.182* -0.168(0.00910) (0.0479) (0.106) (0.107)
Coverage ×Unskilled -0.0277* -0.170** 0.329** -0.344*(0.0150) (0.0669) (0.161) (0.176)
Coverage ×Skilled 0.00256 -0.128* -0.0204 0.571***(0.0169) (0.0734) (0.196) (0.199)
F-value (instruments) 18.8 51.8 15.0 13.5* p < 0.10, ** < 0.05, *** p < 0.01.
Note: Baseline firm sample over the period 2001-2007, consisting of 18,675 joint-stock firms recorded in the internet
survey. Sampling weights are used to ensure representative results for the population of joint-stock firms. (Un)Skilled
comprises workers with(out) high school diploma. The standard errors are clustered at the municipality level and robust to
heteroskedasticity. Panel A (B) provides the first stage results for the IV (LP) method.

Table A5. Wage regressions with educationan levels and fields of study
Dependent variable: Log hourly wage(1) (2)
Medium skilled 0.0886*** 0.0932***(0.00319) (0.00385)
High skilled 0.296*** 0.153***(0.00929) (0.0110)
High skilledinteracted with:Humanities 0.0990***
(0.00819)Teacher 0.0897***
(0.0134)Social Sciences 0.223***
(0.0113)Business 0.215***
(0.0175)STEM 0.259***
(0.00515)Health 0.0864***
(0.00916)Primary 0.174***
(0.0127)Trans/Comm. 0.0820***
(0.00805)* p < 0.10, ** < 0.05, *** p < 0.01.
Note: The sampel consists of workers recorded in the wage statistics survey in year 2000 (1,108,504 observations). We report
results from regressions of log hourly wages in education levels and post-secondary fields of study. Unskilled comprises
workers without high school diploma; medium skilled consists of high school graduates (with no post-secondary education);
high skilled includes workers with post-secondary education. The reference category for education levels is unskilled workers.
The reference category for field of study is “other/unspecified”. All regressions include fixed effects for municipality and
industry, and controls for gender, years of experience and years of experience squared. Standard errors are heteroskedasticity
robust and clustered at the municipality level.

Table A6. IV estimates of broadband adoption on E-commerce and computerization
IV Dependent mean(1) (2)
Panel A: E-commerce:Dep. variable: Procuring online 0.0480 0.50
(0.118)Dep. variable: Receiving orders online -0.00424 0.24
(0.117)
Panel B: Technical upgradingDep. variable: Share of workers using a PC -0.0199 0.53
(0.0850)* p < 0.10, ** < 0.05, *** p < 0.01.
Note: Baseline firm sample over the period 2001-2007. Sampling weights are used to ensure representative results for the
population of joint-stock firms. All regressions include fixed effect for year, municipality and industry. Standard errors are
heteroskedasticity robust and clustered at the municipality level. The estimated coefficient on the instrument (broadband
coverage) in the first stage regression is 0.23 with a standard error of 0.04.
Table A7. Production function estimates excluding telecom firms and IT consultancycompanies
No No ITBaseline telecom consultancy
(1) (2) (3)IV Internet ×Capital -0.00741 -0.00823 -0.0121
(0.0248) (0.0246) (0.0243)Internet ×Unskilled -0.0553 -0.0547 -0.0518
(0.0396) (0.0394) (0.0397)Internet ×Skilled 0.202*** 0.202*** 0.200***
(0.0433) (0.0435) (0.0418)LP Internet ×Capital -0.00701 -0.00735 -0.00999
(0.0202) (0.0199) (0.0194)Internet ×Unskilled -0.0574* -0.0581* -0.0543
(0.0333) (0.0332) (0.0335)Internet ×Skilled 0.141*** 0.140*** 0.137***
(0.0373) (0.0376) (0.0358)N 18,675 18,520 18,192
* p < 0.10, ** < 0.05, *** p < 0.01.
Note: Column 1 uses the baseline firm sample over the period 2001-2007, consisting of 18,675 joint-stock firms recorded in
the internet survey. Column 2 excludes telecom firms (NACE code 64), whereas Column 3 excludes IT consultancy firms
(NACE code 72). Sampling weights are used to ensure representative results for the corresponding population of joint-stock
firms. (Un)Skilled comprises workers with(out) high school diploma. The standard errors are clustered at the municipality
level and robust to heteroskedasticity. All regressions include fixed effect for year, municipality and industry.

Table A8. Wage regression estimates excluding telecom firms and IT consultancycompanies
No telecom No computerBaseline employees workers
(1) (2) (3)Panel A: Cov×Unskilled -0.0101*** -0.00997*** -0.00959***Employment rate (0.00262) (0.00262) (0.00261)
Cov×Skilled 0.0144*** 0.0141*** 0.0147***(0.00491) (0.00479) (0.00500)
N 20,327,515 20,049,183 20,247,710Panel B: Cov×Unskilled -0.0281*** -0.0286*** -0.0280***Log hourly wage (0.00356) (0.00359) (0.00359)
Cov×Skilled 0.0143* 0.0138* 0.0144*(0.00837) (0.00817) (0.00838)
N 8,759,386 8,627,632 8,679,582Experience
√ √ √
Female√ √ √
* p < 0.10, ** < 0.05, *** p < 0.01.
Note: Column 1 uses baseline samples of labor outcomes over the period 2001-2007. Column 2 excludes workers in
telecom firms (NACE code 64), whereas Column 3 excludes workers in IT consultancy firms (NACE code 72). (Un)Skilled
comprises workers with(out) high school diploma. The standard errors are clustered at the municipality level and robust to
heteroskedasticity. All regressions include fixed effects for year, municipality and industry and controls for gender, years of
experience and years of experience squared.

Table A9. Production function estimates in tradable and non-tradable sectors
Trade/Revenues Geographic concentrationHigh Low High Low(1) (2) (3) (4)
Panel A: Internet ×Unskilled -0.0656 -0.0219 -0.107 -0.0221IV (0.0596) (0.0476) (0.0676) (0.0458)
Internet ×Skilled 0.323*** 0.170*** 0.248*** 0.208***(0.0736) (0.0446) (0.0752) (0.0401)
Panel B: Internet ×Unskilled -0.0728 -0.0225 -0.0886 -0.0347LP (0.0521) (0.0419) (0.0578) (0.0398)
Internet ×Skilled 0.257*** 0.117*** 0.189** 0.147***(0.0693) (0.0426) (0.0738) (0.0364)
Mean of tradability measure 0.31 0.02 0.00025 0.00006N 9,329 9,346 9,030 9,645
* p < 0.10, ** < 0.05, *** p < 0.01.
Note: Baseline firm sample over the period 2001-2007, consisting of 18,675 joint-stock firms recorded in the internet
survey. Sampling weights are used to ensure representative results for the population of joint-stock firms. (Un)Skilled
comprises workers with(out) high school diploma. The standard errors are clustered at the municipality level and robust
to heteroskedasticity. All regressions include fixed effect for year, municipality and industry. We use two measures of
tradability. In Columns (1) and (2), we measure tradability in each 4-digit industry by dividing total levels of exports and
imports by the value added of firms. In Columns (3) og (4), we follow Jensen and Kletzer (2005) in measuring tradability
by the geographic concentration of an industry, defined as the Herfindahl index of employment shares across municipalities
in each 4-digit industry. For both measures, we estimate the production function separately for firms in industries with
values of tradability above and below the median in the baseline firm sample.
Table A10. Examples of workplace tasks
Task measuresRoutine Abstract Manual
Record-keeping Forming/testing hypotheses Picking/sortingCalculation Medical diagnosis Repetitive assemblyRepetitive customer service Legal writing Janitorial services(e.g., bank teller) Persuading/selling Truck driving
Managing others
Source: Autor, Levy, and Murnane (2003).

Appendix B: Estimation details
By simultaneous estimation of equations (4) and (7), we obtain consistent estimates of βu0,βs0, βk1, βu1,βs1, and Φt (aimkt, kimkt) = βk0kimkt + ωt(aimkt, kimkt). While these outputelasticities are sufficient to assess how broadband adoption affects labor productivity,we need to identify βk0 to recover the full shift in production technology. Because kimktis colinear with the non-parametric function ωt(aimkt, kimkt), further assumptions arenecessary.
Assuming that ωimkt follows a first-order Markow process, we can write
ωimkt = E [ωimkt|ωimkt−1] + ξimkt.
This simply decomposes ωimkt into its conditional expectation at time t−1, E [ωimkt|ωimkt−1],and a deviation from that expectation, ξimkt. If the capital stock is pre-determined andcurrent investment (which will react to productivity shocks) takes one period before itcomes productive, it follows that
E [ξimktkimkt] = 0.
This is the moment which LP use to identify the capital coefficient. Roughly speaking,variation in kimkt conditional on ωimkt−1 is the exogenous variation used for identification.To operationalize this approach in a GMM context, note that given a guess on the capitalcoefficient βk0, we can rewrite unobserved productivity as
ωimkt(βk0) = Φimkt − βk0kimkt.
Given these ωimkt(βk0), we compute ξimkt by non-parametrically regressing ωimkt(βk0)’s onωimkt−1(βko)’s and a constant term; we then form the residual
ξimkt(βk0) = ωimkt(βk0)− Ψ (ωimkt−1(βk0))
where Ψ (ωimkt−1(βk0)) are predicted values from the non-parametric regression.The ξimkt(βk0)’s are used to form a sample analogue to the above moment. i.e.
1T
1N
∑t
∑i
ξimkt (βk0) · kimkt.
We estimate βk0 by minimizing the GMM criterion function
Q (βk0) = minβk0
1N
1Ti1
∑i
Ti1∑t=Ti0
ξimkt (βk0) · kimkt
2

where i indexing firms and Ti0 and Ti1 index the second and last period in which firm i isobserved.
Because our baseline sample is a repeated cross-section (rather than panel data), weadjust the above estimation procedure. Exploiting the random sampling of firms, we canidentify βk0 from the moment
E[ξmkt, kmkt
]= 0.
where the municipality average of a variable is denoted by upper bar. By applying theabove procedure to our panel data at the municipality level, we obtain the GMM criterionfunction
Q (βk0) = minβk0
1M
1Tm1
∑m
Tm1∑t=Tm0
√Nmktξmkt (βk0) · kmkt
2
where Tm0 and Tm1 index the second and last period municipality m is observed and Nmkt
is the number of firms in municipality m in period t. To obtain standard errors on βk0 inTable 2, we use bootstrap while clustering by municipality.