the south florida condominium market - zell/lurie...
TRANSCRIPT

T H E S O U T H F L O R I D A condo-
minium market has attracted much atten-
tion from real estate investors across the
world in the past three years. Prices have
risen more than 112 percent since 2000,
new construction and conversions have
soared, and the media has highlighted the
easy money to be made by the “day trad-
er” in condos. To many experienced
investment professionals, this market
appears to be a speculative real estate
investment bubble, but most analysts
(including Fed chairman Alan Greenspan)
take the view that you cannot identify an
investment bubble until after it bursts. We
disagree. The purpose of this paper is to
identify the indicators that show a real
The South FloridaCondominium Market
The anatomy of a bubble.
K E N N E T H T . R O S E N
C H A R L I E H . R O S E
R E V I E W 2 3
investment bubble has formed in the South
Florida condominium market. We will also
forecast the fallout from the bursting of the
bubble that will inevitably take place.
The huge boom in condo construction
that is taking place in South Florida has all
the classic signs of an asset price bubble.
While definitions of bubbles differ, it is
our view that a bubble can be defined as
market conditions in which new supply
becomes disconnected from fundamental
demand and a significant portion of pur-
chases are made for speculative purposes,
not occupancy by the purchaser. Other
characteristics of a real estate bubble
include rapid price increases, massive
media coverage, participation in the mar-
ket by naive investors (e.g., the shoeshine
boy, taxi drivers, flight attendants, doctors,
and dentists), rapid resales of units, flip-
ping of units not yet built or occupied,
easy credit conditions, a belief that prices
only rise, and a massive entry of new pro-
fessionals into the real estate industry
(more brokers, developers, financers, etc.).
This paper provides an anatomy of the
South Florida condo bubble and will dis-
cuss the consequences and timing of a
potential bursting of the bubble.
D Y N A M I C S O F D E M A N D
Demand for condominium housing
comes from a number of sources. New
entrants to the market come from the
existing population who are now renters
or possibly from existing single-family
homeowners who want to move to the
condominium lifestyle. New migrants to
the area add to the fundamental demand
for units. Part-time residents from the
North (snowbirds) are especially promi-
nent as consumers of the full-service
condo lifestyle. Part-time residents from
abroad are also an important part of this
market, representing both demographic
demand but also safe haven demand from
Latin American political and economic
instability. Move-up demand from exist-
ing condo owners trying to leverage up
their existing equity also provides a sig-
nificant portion of demand. Finally, dur-
ing parts of the real estate cycle there can
be massive amounts of demand from
speculators taking advantage of the pecu-
liar institutional weaknesses of the condo
development and financing process.
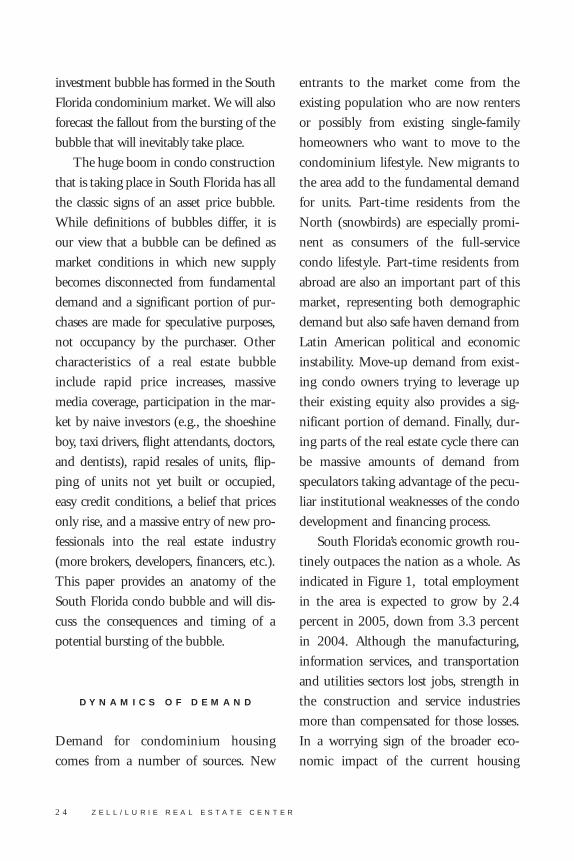
South Florida’s economic growth rou-
tinely outpaces the nation as a whole. As
indicated in Figure 1, total employment
in the area is expected to grow by 2.4
percent in 2005, down from 3.3 percent
in 2004. Although the manufacturing,
information services, and transportation
and utilities sectors lost jobs, strength in
the construction and service industries
more than compensated for those losses.
In a worrying sign of the broader eco-
nomic impact of the current housing
2 4 Z E L L / L U R I E R E A L E S T A T E C E N T E R
bubble, a large portion of recent job
growth has been concentrated in real
estate-related employment sectors.
In general, the economy is strongest in
Broward County, followed by Palm Beach
and Miami-Dade Counties, respectively.
In the past year, Broward added 18,500
jobs, Palm Beach added 15,800, and
Miami-Dade 14,000. We believe employ-
ment growth in the area will continue to
outpace national levels during the next
three years, with 50,000 new jobs added in
the three-county area per year.
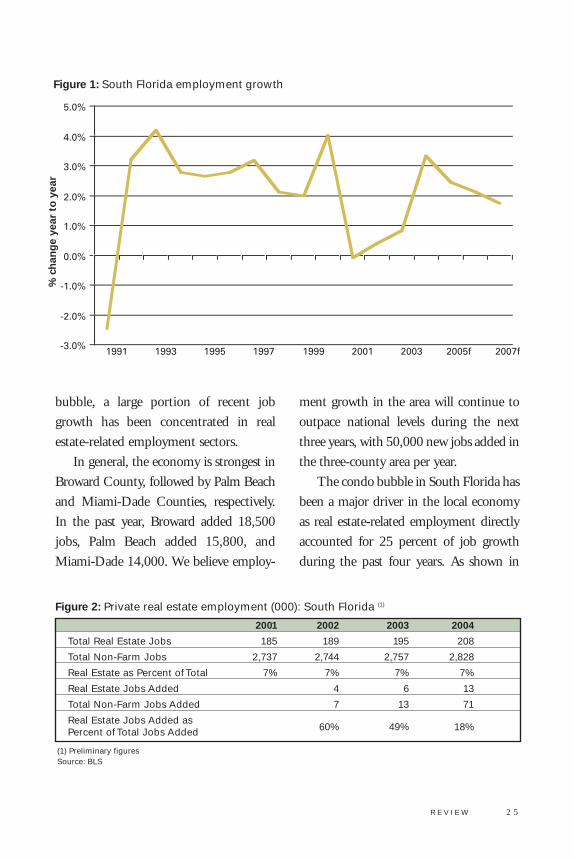
The condo bubble in South Florida has
been a major driver in the local economy
as real estate-related employment directly
accounted for 25 percent of job growth
during the past four years. As shown in
R E V I E W 2 5
Figure 1: South Florida employment growth
% c
han
ge
year
to
yea
r
-3.0%
-2.0%
-1.0%
0.0%
1.0%
2.0%
3.0%
4.0%
5.0%
1991 1993 1995 1997 1999 2001 2003 2005f 2007f
2001 2002 2003 2004
Total Real Estate Jobs 185 189 195 208
Total Non-Farm Jobs 2,737 2,744 2,757 2,828
Real Estate as Percent of Total 7% 7% 7% 7%
Real Estate Jobs Added 4 6 13
Total Non-Farm Jobs Added 7 13 71
Real Estate Jobs Added as60% 49% 18%Percent of Total Jobs Added
Figure 2: Private real estate employment (000): South Florida (1)
(1) Preliminary figuresSource: BLS
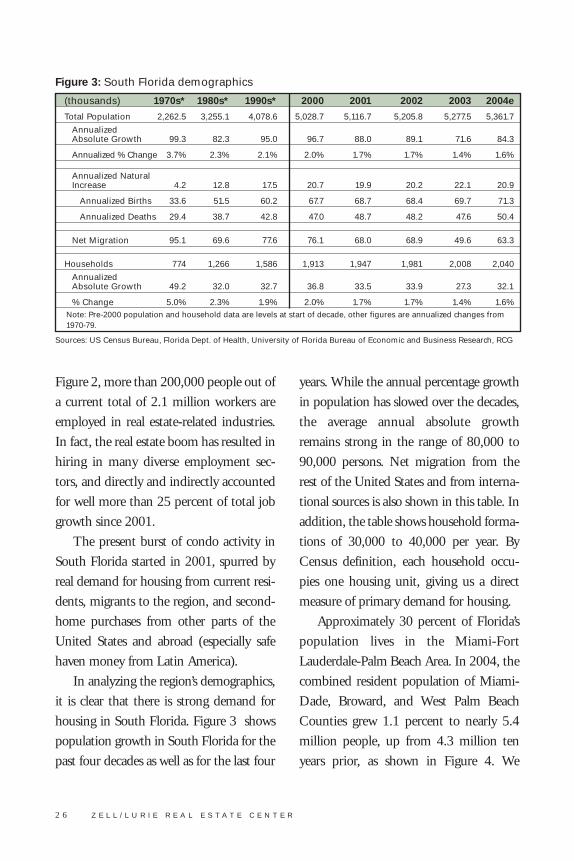
Figure 2, more than 200,000 people out of
a current total of 2.1 million workers are
employed in real estate-related industries.
In fact, the real estate boom has resulted in
hiring in many diverse employment sec-
tors, and directly and indirectly accounted
for well more than 25 percent of total job
growth since 2001.
The present burst of condo activity in
South Florida started in 2001, spurred by
real demand for housing from current resi-
dents, migrants to the region, and second-
home purchases from other parts of the
United States and abroad (especially safe
haven money from Latin America).
In analyzing the region’s demographics,
it is clear that there is strong demand for
housing in South Florida. Figure 3 shows
population growth in South Florida for the
past four decades as well as for the last four
years. While the annual percentage growth
in population has slowed over the decades,
the average annual absolute growth
remains strong in the range of 80,000 to
90,000 persons. Net migration from the
rest of the United States and from interna-
tional sources is also shown in this table. In
addition, the table shows household forma-
tions of 30,000 to 40,000 per year. By
Census definition, each household occu-
pies one housing unit, giving us a direct
measure of primary demand for housing.
Approximately 30 percent of Florida’s
population lives in the Miami-Fort
Lauderdale-Palm Beach Area. In 2004, the
combined resident population of Miami-
Dade, Broward, and West Palm Beach
Counties grew 1.1 percent to nearly 5.4
million people, up from 4.3 million ten
years prior, as shown in Figure 4. We
2 6 Z E L L / L U R I E R E A L E S T A T E C E N T E R
(thousands) 1970s* 1980s* 1990s* 2000 2001 2002 2003 2004e
Total Population 2,262.5 3,255.1 4,078.6 5,028.7 5,116.7 5,205.8 5,277.5 5,361.7
Annualized Absolute Growth 99.3 82.3 95.0 96.7 88.0 89.1 71.6 84.3
Annualized % Change 3.7% 2.3% 2.1% 2.0% 1.7% 1.7% 1.4% 1.6%
Annualized NaturalIncrease 4.2 12.8 17.5 20.7 19.9 20.2 22.1 20.9
Annualized Births 33.6 51.5 60.2 67.7 68.7 68.4 69.7 71.3
Annualized Deaths 29.4 38.7 42.8 47.0 48.7 48.2 47.6 50.4
Net Migration 95.1 69.6 77.6 76.1 68.0 68.9 49.6 63.3
Households 774 1,266 1,586 1,913 1,947 1,981 2,008 2,040
Annualized Absolute Growth 49.2 32.0 32.7 36.8 33.5 33.9 27.3 32.1
% Change 5.0% 2.3% 1.9% 2.0% 1.7% 1.7% 1.4% 1.6%Note: Pre-2000 population and household data are levels at start of decade, other figures are annualized changes from1970-79.
Figure 3: South Florida demographics
Sources: US Census Bureau, Florida Dept. of Health, University of Florida Bureau of Economic and Business Research, RCG
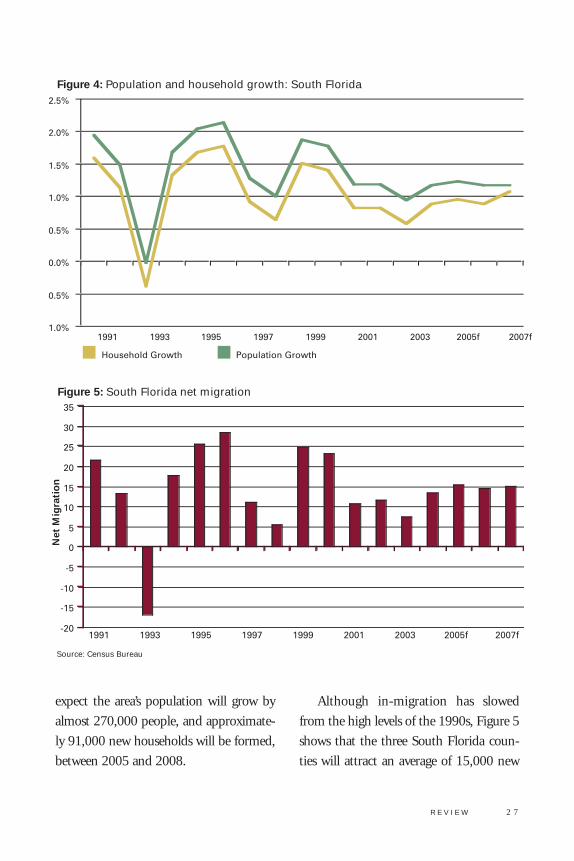
expect the area’s population will grow by
almost 270,000 people, and approximate-
ly 91,000 new households will be formed,
between 2005 and 2008.
Although in-migration has slowed
from the high levels of the 1990s, Figure 5
shows that the three South Florida coun-
ties will attract an average of 15,000 new
R E V I E W 2 7
Figure 4: Population and household growth: South Florida
% c
han
ge
year
to
yea
r
-1.0%
-0.5%
0.0%
0.5%
1.0%
1.5%
2.0%
2.5%
1991 1993 1995 1997 1999 2001 2003 2005f 2007f
Household Growth Population Growth
Figure 5: South Florida net migration
-20
-15
-10
-5
0
5
10
15
20
25
30
35
1991 1993 1995 1997 1999 2001 2003 2005f 2007f
Net
Mig
rati
on
Source: Census Bureau

residents annually through the forecast
horizon. We expect the area’s strong econ-
omy and high quality of life to draw new
residents, leading net migration to acceler-
ate through the horizon forecast.
South Florida is an area of significant
economic disparity, consisting of both
wealthy celebrities and thousands of immi-
grants living below the poverty line.
Incomes steadily rise from south to north,
with an average household income of
$84,400 in Miami-Dade all the way up to
$110,200 in Palm Beach County.
Many homeowners in South Florida
were once the area’s vacationing visitors.
Likewise, many speculative investors
have ties to the region through family,
vacationing, or business. As such, the vis-
itor profiles of each of the three counties
help inform our understanding of the
sources of demand in the different areas.
Miami-Dade County is the most visited
of the three South Florida counties, with
Latin American visitors accounting for
the largest percentage of total visits, fol-
lowed by domestic visitors from the
Northeast. In contrast, Broward County
experiences far more domestic and
European visitors, with the majority of
domestic visitors originating from New
York, New Jersey, and Connecticut. In
Palm Beach County, visitors are almost
entirely domestic, and business rather
than vacation is a much more common
reason for being in town.
As the area’s population has increased,
housing affordability has steadily declined.
Rapid house price growth has dramatically
reduced affordability. As shown in Figure
6, only 26 percent of Miami households
2 8 Z E L L / L U R I E R E A L E S T A T E C E N T E R
Figure 6: South Florida single-family home affordability
20%
25%
30%
35%
40%
45%
50%
55%
60%
65%
1993 1995 1997 1999 2001 2003 Mar-05
Miami Broward West Palm
Pri
ce G
row
th

could afford the median-priced single-
family home in the first quarter of 2005,
down from 53 percent in 1998.
Affordability has fallen just as much in
Broward County and even more in Palm
Beach County. This is due exclusively to
the rapid run-up in prices since 2002.
Miami had the fourth-lowest home own-
ership rate in 2004 of all major U.S. met-
ropolitan areas and, when interest rates
rise, the area will be in an ever-more pre-
carious position.
Through interviews with developers,
appraisers, consultants, and brokers in the
South Florida market, we have generated
an analysis of buyer profiles and sources of
condominium demand. Approximately 70
percent of buyers of new condominiums
and condominium conversions are either
investors or speculators; the remaining
buyers are individuals purchasing units as
primary or secondary residences. Of the
70 percent of buyers who are not owner-
users, approximately one-half are pure
speculators intending to flip their units.
The other half are more stable investors
who are probably capable of holding the
unit for an extended period of time, as
shown in Figure 7.
Of those purchasing the units for per-
sonal use, approximately half are either
snowbirds or second-home buyers intend-
ing to use the unit either year-round or as
a vacation residence. Approximately 25
percent of owner-users are empty-nesters
trading from single-family homes in sub-
urban South Florida to low-maintenance
condos. The remaining 25 percent of
owner-users are young professionals and
two-income childless couples who are
attracted to the amenities and convenience
of urban condominiums.
R E V I E W 2 9
SuburbanEmpty-Nesters
8%
-
Young Urban Professionals
8%
Snowbirds and Second Home Buyers
15%
Investors35%
Speculators35%
Other30%
Figure 7: Buyer profiles

3 0 Z E L L / L U R I E R E A L E S T A T E C E N T E R
As in much of the rest of the country,
the current condominium development
in the area is being targeted towards a
few specific groups of buyers. Along the
beaches, most of the projects are targeted
towards snowbirds: wealthy retirees and
second-home buyers from the Northeast
and Midwest. In the outlying downtown
areas, including downtown Fort
Lauderdale, downtown West Palm
Beach, downtown Dadeland in Kendall,
and others, the presumed buyers are local
empty-nesters and childless two-income
couples who want to move from large
suburban homes to low-maintenance
condos in vibrant, walkable communi-
ties. However, it remains to be seen
whether demand among this group for
this type of development is sustainable.
Although interest seems to be high at this
point, high-density residential is a new
product in the traditionally low-density,
automobile-oriented suburban commu-
nities of Southern Florida.
The blighted areas of Central Miami,
including downtown, the Arts District,
and Edgewater, are gaining new interest
from both developers and buyers. From
in-flight magazines and hotel television
stations to billboards and national-
circulation magazines, advertising for these
new projects is significant and is mostly
targeted to a young, hip buyer. As almost
none of these projects have yet to be com-
pleted and developers are generally reluc-
tant to reveal demographic information on
their buyers, it is hard to get data on
demand from this demographic. It is pos-
sible that the sleek architecture of the
buildings and the format of the marketing
is designed more to appeal to speculative
investors than to the purported target
audience. If the perception among
investors is that this type of sleek, ultra-
modern product is in high demand by
young and upwardly mobile buyers, mar-
ket participants say it would make sense
for developers to exploit this market.
S P E C U L A T I V E I N V E S T M E N T
The Downtown Development Authority
of Miami commissioned a survey of resi-
dential developers in the Brickell area, but
found that the majority of respondents
reported close to 100 percent of units to be
lived in, while in reality it is clear to those
in the market that many of the units are
being held by investors. In many develop-
ers’ sales offices the buyer has little or no
choice of finishes in the unit, leading some
market observers to speculate that the bulk
of buyers will never live in the building
and have little interest in the interior
details. Most developers are simply happy
to accept a down-payment and secure a
contract.
It is clear that speculative buyers have
been an important factor in the current
condominium boom. Foreign investors,
some of whom intend to flip the units as
prices appreciate, have fueled Miami con-
dominium sales. However, many investors
from Latin America are investing in
Miami condominiums for second homes
and as a long-term safe haven for invest-
ment capital. Brokers and developers
report that 50 percent or more of buyers in
some projects hail from Latin America.
Although some developers now claim not
to sell to investors and go so far as to have
visitors to their sales centers fill out forms
asserting that they are not speculators,
many more developers are actively court-
ing the market. Development companies
hire real estate agencies to specifically mar-
ket properties through brokers in
Colombia, Venezuela, Brazil, Mexico, and,
to a lesser extent, Chile.
Latin American investors are particu-
larly interested in South Florida real estate
because it is a familiar market and is per-
ceived to be a safe haven for capital. Miami
is known as one of the premier Latin
American financial, trade, and cultural
centers. With 29 percent of visitors to
Miami coming from Latin America, most
wealthy Latin Americans have been to the
city at some point and many have relatives
there. Real estate prices are also lower in
the area than in other internationally rec-
ognized markets such as New York or
London. In recent years, weakness in Latin
American economies has coincided with
capital flows to South Florida condomini-
um markets.
According to a recent report by Credit
Suisse First Boston (CSFB), the Miami-Ft.
Lauderdale-West Palm Beach area is one of
the most active markets for housing specu-
lation across the board. Using numbers
that included single-family residences, and
relied to some degree on self-reporting by
R E V I E W 3 1
1998 1999 2000 2001 2002 2003 2004 1Q05
Florida
Daytona 16% 12% 15% 14% 21% 27% 32% 19%
Fort Myers 32% 31% 35% 35% 31% 32% 37% 38%
Jacksonville 9% 7% 7% 7% 12% 16% 19% 23%
Miami/BrowardPalm Bch. 11% 9% 9% 11% 15% 19% 22% 26%
Naples 40% 37% 38% 43% 41% 38% 47% 52%
Orlando 11% 9% 9% 10% 14% 18% 22% 2 7%
Sarasota 22% 20% 18% 28% 25% 29% 32% 29%
Tampa 12% 9% 9% 10% 15% 18% 24% 27%
United States 8% 7% 6% 8% 10% 12% 14% 17%
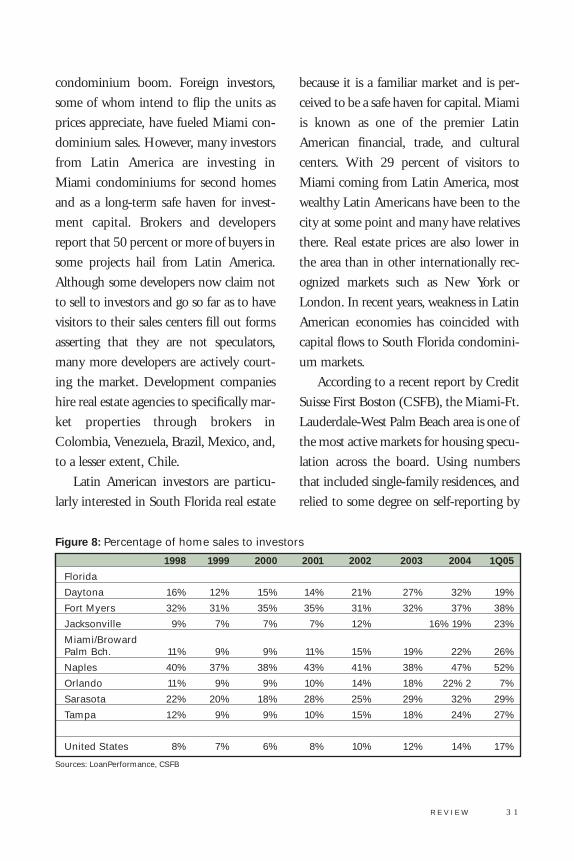
Figure 8: Percentage of home sales to investors
Sources: LoanPerformance, CSFB
investors in loan documents, the report
found that 26 percent of first-quarter 2005
sales were to investors, well above the
national average, as shown in Figure 8. We
believe this number is at the lower bounds
of the range; we also believe that specula-
tion is much more focused in the condo-
minium product segment.
I N D I C A T I O N S O F
A B U B B L E
New condominium sales accelerated rap-
idly from 2002 through early 2005.
Between 1995 and 2001, new condomini-
um sales in the three-county area averaged
approximately 6,500 units per year. The
pace of Miami condominium sales acceler-
ated through the first quarter of 2005. In
the year to March 2005, 20,295 new con-
dominium units were sold in South
Florida, an increase of 81.4 percent above
the 11,186 units sold in the same period a
year earlier. This acceleration follows a
31.0 percent increase in new sales between
2002 and 2003. High new sale and resale
activity is one clear sign of speculative
activity.
Growth in new condominium sales has
outstripped existing condominium sales
and both new and existing single-family
sales in recent years. Existing condomini-
um sales volumes have risen steadily in
response to the low interest rate environ-
ment and decreasing single-family home
affordability. In 2004, 74,164 existing
condominiums traded hands in South
Florida, a 3.1 percent increase above 2003.
Existing condominium resales have
increased every year since 1995 with sales
of existing condominiums in South
Florida growing by an average of 7.3 per-
cent per year during that time.
Sales volume data is calculated from
newly recorded deeds once transactions
have closed. The majority of new high-rise
luxury condominiums do not break
ground until a certain number of units
have been pre-sold. Many developments in
South Florida have been entirely pre-sold
long before completion of the project. Pre-
sales, however, are contracts to buy rather
than final sales, so do not show up in the
data described above. The buyer puts
down a 20 percent deposit (often in two
installments) and sometimes signs a non-
assignable contract, preventing flipping
before the building is completed. Other
developers allow resales before the comple-
tion of the building, but only through
their sales office and with restrictions to
limit competition for the units they are
trying to sell. The buyer closes on the deal
and pre-sold units are recorded as sales
when construction has been completed.
Much of the activity in South Florida is
concentrated in pre-sales, and deliveries
will not peak until 2005-2007. As these
buildings come online and pre-sales buy-
3 2 Z E L L / L U R I E R E A L E S T A T E C E N T E R
ers are asked to close, new condominium
sales volumes may rise further. We esti-
mate that 50 percent to 70 percent of pre-
sold units are flipped before construction
is even started.
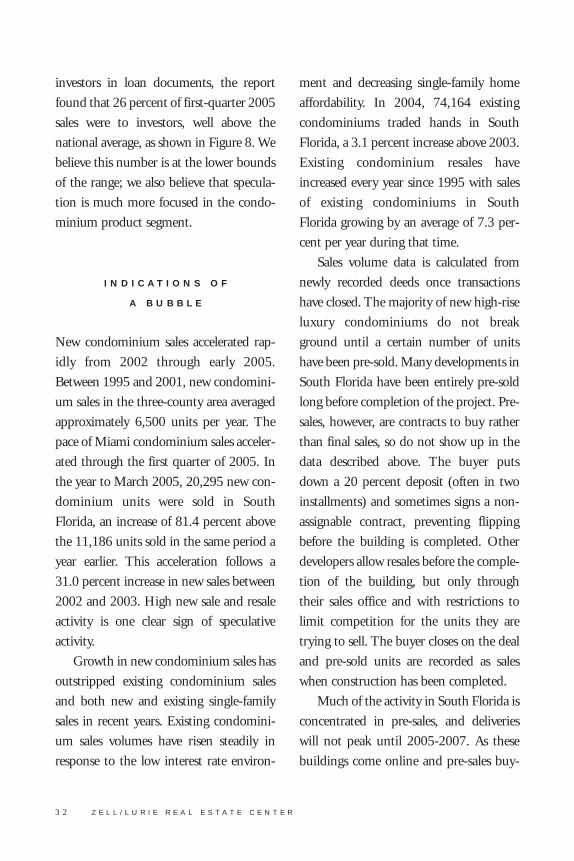
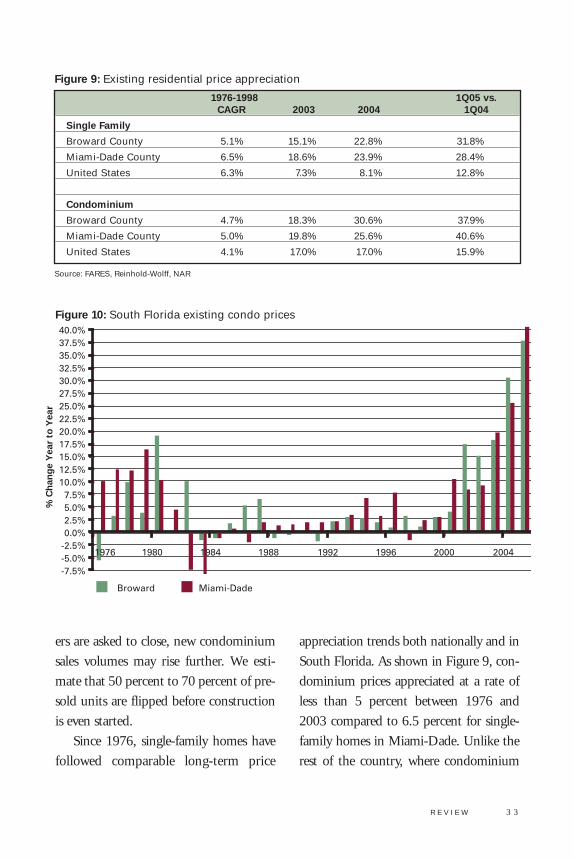
Since 1976, single-family homes have
followed comparable long-term price
appreciation trends both nationally and in
South Florida. As shown in Figure 9, con-
dominium prices appreciated at a rate of
less than 5 percent between 1976 and
2003 compared to 6.5 percent for single-
family homes in Miami-Dade. Unlike the
rest of the country, where condominium
R E V I E W 3 3
1976-1998 1Q05 vs.CAGR 2003 2004 1Q04
Single Family
Broward County 5.1% 15.1% 22.8% 31.8%
Miami-Dade County 6.5% 18.6% 23.9% 28.4%
United States 6.3% 7.3% 8.1% 12.8%
Condominium
Broward County 4.7% 18.3% 30.6% 37.9%
Miami-Dade County 5.0% 19.8% 25.6% 40.6%
United States 4.1% 17.0% 17.0% 15.9%
Figure 9: Existing residential price appreciation
Source: FARES, Reinhold-Wolff, NAR
Figure 10: South Florida existing condo prices
-7.5%-5.0%-2.5%0.0%2.5%5.0%7.5%
10.0%12.5%15.0%17.5%20.0%22.5%25.0%27.5%30.0%32.5%35.0%37.5%40.0%
1976 1980 1984 1988 1992 1996 2000 2004
Broward Miami-Dade
% C
han
ge
Yea
r to
Yea
r
price growth historically outpaced single-
family home prices, South Florida condo-
minium prices have generally accelerated
less rapidly than single-family homes.
A recent explosion in condominium
prices is the main reason for the belief that
a speculative bubble has developed. As
shown in Figure 10, existing condo prices
rose 112 percent since 2000, and the accel-
eration was especially rapid in 2003, with
prices up 18 percent to 20 percent year-
over-year; 2004 with prices up 25 percent
to 31 percent; and early 2005, with prices
up 37 percent to 41 percent. The pace of
price appreciation in the area is a cause for
concern, as the only period of comparable
price appreciation for condominiums in
the area was followed by a sharp decline in
prices and years of stagnation. In addition,
pre-sales prices have been pushed to high
levels in some projects marketed heavily to
speculative investors. Anecdotes of prices
doubling in luxury high-rises over the
course of a year or less are common.
The initial increase in the supply of
housing in this cycle was clearly in
response to unmet fundamental demand.
However, as prices began to rise for several
years in a row, a new set of speculative
demanders entered the market. They
bought multiple units with no intention of
occupancy or rental but with pure specula-
tive desire to bet on price increases of
units. The speculative fever was abetted by
the structure of the market. Only a 10 per-
cent deposit on value of the unit is made at
the time of purchase (which is held in an
escrow account), with another 10 percent
due on start of construction. The remain-
ing payment is not due until completion
of the unit, which may be two to four years
in the future. Thus the investor has a high-
ly leveraged way to acquire a “futures con-
tract” on the housing market. Until recent-
ly, these futures contracts were traded easi-
ly, a process known as flipping. A number
of more responsible developers have tried
to discourage speculation by various
restrictions on resale.
There are three sources of supply in the
condominium market. The biggest com-
ponent of supply is the existing stock of
units now occupied or owned and used
seasonally or rented to others. In normal
markets, the turnover of this stock supplies
80 percent of supply to the market on a
turnover basis. The second source of sup-
ply is new construction, which, in normal
times, is about 3 percent of the stock and
represents 20 percent of supply on a
turnover basis. Finally, the net conversion
of existing rental apartments or possibly
hotels, office buildings, or warehouses to
condominiums in non-boom times repre-
sents a small portion of new supply.
During the absorption phase (phase I)
of the housing market cycle, new demand
is met by the existing excess supply from
the last cycle. There is virtually no new con-
struction or conversion supply. In the
3 4 Z E L L / L U R I E R E A L E S T A T E C E N T E R

growth phase of the cycle (phase II)
demand surges and exceeds existing and
new supply, creating a shortage of housing
units at the margin, and prices surge. In
phase III of the cycle, new construction
and conversion response gears up dramati-
cally, and existing owners put units on the
market trying to cash in on the surge in
prices. Prices may continue to surge as
speculators pour into the market, and com-
pleted supply falls short of fundamental
and speculative demand. In the overshoot-
ing phase (phase IV) of the cycle, over-
building is apparent as completions now
exceed fundamental demand and specula-
tors are the predominant end-buyers. Prices
begin to flatten and may even begin to
decline. The inventory of existing units
rises sharply as owners try to sell at yester-
day’s prices. In the decline phase (phase V)
of the cycle, the glut of oversupply becomes
apparent to even the naive speculators, and
foreclosures and bulk auction sales follow.
Existing owners may withdraw units from
the market. Sales prices plunge and new
construction and conversion stops.
We believe the South Florida condo-
minium market is currently in the late
part of phase III and is about to enter the
overshooting phase of the housing market
cycle. Supply is surging on two fronts:
new construction and conversions. New
construction accounted for 31.9 percent
of turnover during the first quarter of
2005, up from 18.1 percent in 2004 and
a 10.1 percent in 2003. We expect this
share will increase as the current con-
struction pipeline materializes, as deliver-
ies and pre-sale contracts become deeded
sales. New construction has surged past
normal levels and, when annualized, the
first quarter’s new sales total more than 5
percent of existing South Florida condo-
minium stock.
P R E V I O U S R E S I D E N T I A L
C Y C L E S
Construction activity in South Florida has
always been cyclical. After World War I,
Florida experienced a land boom when
wealthy Northeasterners turned to Florida
as an alternative to vacationing in Europe,
and Miami became an important trade
hub with Cuba, the Caribbean, and Latin
America. Developers created master-
planned communities and most of the
activity was along a 100-mile stretch from
Palm Beach to Miami Beach.
Speculative investment led land prices
to increase by a factor of six between 1923
and 1925. Rapid capital flows from the
Northeast, the Midwest, and Europe,
including $500 million in capital from the
Northeast alone, contributed to price
appreciation. A lag period of several
months between the payment of an initial
5 percent deposit and closing allowed
enough time for values to appreciate sig-
R E V I E W 3 5

nificantly before deals closed. High prices
and a major hurricane in 1926 led to a real
estate crash before the beginning of the
Great Depression.
Rapid development has likewise been
the norm. Arvida, a St. Joe Company,
developed Weston, a master-planned com-
munity of almost 60,000 residents, begin-
ning in the 1980s. The project sold out in
sixteen years, half the time originally pro-
jected. At its peak, the company was clos-
ing on about 1,400 new homes and almost
600 resales per year.
However, multifamily building booms
in the early 1980s and early 1990s led to
oversupply in the market. Looking at per-
mits issued for multifamily units, a statistic
that includes both units for sale and rental
apartment units, current levels of con-
struction are high by historical standards
but do not approach the levels reached in
the 1980s. Construction peaked in 1987
when a total of 59,900 permits were
issued, a level of total construction 32 per-
cent above 2004. Multifamily permits
peaked at 33,700 in 1987, 61 percent
more than issued in 2004.
This burst of construction coincided
with declining condo prices, which came
after Miami-Dade County prices more
than doubled between the first quarter of
1976 and the fourth quarter of 1981. This
was the only period of comparable price
appreciation for condominiums in the
county and was followed by a sharp
decline in prices and years of stagnation.
Prices in Miami-Dade County doubled in
the five years to 1981 before falling a total
of 14.0 percent in 1982 and 1983. Prices
declined an additional 3 percent through
1986 and did not match 1981 levels for
the next twelve years. During the same
period, price appreciation was much more
moderate in Broward County. The
Broward condominium index rose by 42.6
percent in the five years to 1981 before
falling by 1.2 percent in 1983 and 1984.
However, we must discount this com-
parison to some extent because of the
extraordinary circumstances leading to a
nationwide apartment building boom in
the early-to-mid-1980s. The high levels of
activity during that period were largely an
effect of the Reagan tax reform of 1981
that created tax incentives for real estate
investment and led to a movement of cap-
ital into real estate, especially through syn-
dications or limited partnerships and espe-
cially into multifamily (apartments) and
hotels/motels. Investment and construc-
tion surged through the mid-1980s until
Congress reversed much of the Reagan tax
changes in 1986 and values declined.
During this period, over-development,
even as prices of individual condominium
units were declining, led to a surplus of
unsold condos in the Brickell Avenue cor-
ridor of Miami.
Although the condominium market in
the 1980s is perhaps the best analogy to
3 6 Z E L L / L U R I E R E A L E S T A T E C E N T E R

R E V I E W 3 7
today’s market in South Florida, recent
episodes of home price appreciation in Los
Angeles and Houston are also informative.
The median home price in Los Angeles
during the early 1990s aerospace recession
declined by a cumulative 23.4 percent in
five years. In Houston during the mid-
1980s oil price collapse, the median home
price declined 23.7 percent in three years.
Both of these cycles were caused by reces-
sions and major job losses in the respective
local economies, a scenario that we are not
predicting for South Florida. However, ris-
ing interest rates, excess supply, and a shift
of investor asset allocations away from
South Florida real estate could provide a
similar shock to the housing market as was
caused by the recessions in Houston and
Los Angeles. Furthermore, while interest
rates were declining during both of those
episodes, we expect interest rates to rise
through the forecast horizon, adding addi-
tional strain to the market.
L A N D S U P P L Y
The density of both population and exist-
ing residential development in South
Florida will put pressure on the area to
build high-density housing to accommo-
date both the current population and
future growth in the area. South Florida is
one of the densest metropolitan areas in
terms of both population and housing
units per square mile. The geography of the
area, sandwiched between the Atlantic
Ocean to the East and South and the
Everglades to the West, puts further con-
straints on the area’s lateral growth. Miami-
Ft Lauderdale-West Palm Beach ranks
fourteenth among the most densely popu-
lated Consolidated Metropolitan Areas in
the United States. However, much of the
land area in the three counties is located
within the Everglades and is sparsely popu-
lated and largely undevelopable.
Fully 41 percent of Miami-Dade
County’s land area is within the boundaries
of the Everglades National Park; an addi-
tional 16 percent of the land area is within
the South Florida Water Management
District’s Water Conservation Impound-
ment Area. Similarly, Broward County
has a total area of 1,211 square miles, 34
percent or 410 square miles of which are
located to the east of the county’s
Conservation Area. In Palm Beach
County, Loxahatchee Wildlife Refuge,
Lake Okeechobee, and the county’s Urban
Service Boundary put pressure on sprawl.
By removing undevelopable land from
the density equation, Miami-Fort
Lauderdale-West Palm Beach becomes the
third-densest Consolidated Metropolitan
Area in the United States in terms of pop-
ulation per square mile. Excluding the
Everglades, the area has 2,040 residents per
square mile, fewer than only the Los
Angeles and New York areas, with 2,620
and 2,840 residents per square mile,
respectively.
Zooming in to the place level, 38 of the
50 densest places in Florida are located in
Miami-Dade, Broward, or Palm Beach
Counties. Nine of the top ten places by
housing per square mile of land are located
in South Florida. These are places where
developable land is scarce and new housing
must rise vertically. In the city of Sunny
Isles Beach, the place with the highest
housing density in the state, there were
12,875 housing units per square mile of
developable land at the time of the 2000
Census. Since that time, more than 700
additional high-rise condominium units
have been added in the area and close to
1,400 more are currently under construc-
tion. Miami Beach, North Bay Village, Bal
Harbor, Surfside, Aventura, and Bay
Harbor Islands, the other beach towns in
Dade County, have an average density of
more than 8,300 housing units per square
mile. By contrast, the city of San Francisco
had 7,421 housing units per square mile,
New York City had a density of 10,553,
and Manhattan registered 34,757 units per
square mile at the time of the 2000 Census.
Even more pertinent to high-rise con-
dominium development is the area’s devel-
opable shoreline. Demand has historically
been and will continue to be strongest for
beachfront property, and the waterfront
high-rise condominium is a well-estab-
lished product type in the region. In total,
Palm Beach County has 45 miles of linear
shoreline, Broward County 23 miles, and
Miami-Dade County 84 miles of shore-
line, but only 22 miles of prime beaches.
The combined total number of multi-
family permits issued in the Miami, Fort
Lauderdale, and West Palm Beach MSAs
reached 10,300 in the first half of 2005, up
25.1 percent from the same period a year
ago. As shown in Figure 11, multifamily
permits totaled 20,875 in 2004 and 16,800
in 2003, up from an average of 11,500
units per year in the 1990s, a period of
strong household growth. Significantly, the
majority of multifamily units currently
under way are for sale-condominiums.
Therefore, while total multifamily con-
struction is not as high as it was in much of
the 1980s, the total number of condomini-
ums is relatively higher. We believe that,
based on current demographic and con-
struction trends, the condominium supply
overhang will reach 23,000 units during
the next three years as construction deliver-
ies far outpace real demand.
Condo conversions significantly added
to supply in Miami-Dade County as
investors purchased 10,391 apartment
units for conversion during 2004 and
4,870 units during the first half of 2005.
In total, at least 34 major communities
were purchased for condo conversion dur-
ing the 18 months ended June 2005, and
many smaller condo conversion deals like-
ly added further to condominium supply.
3 8 Z E L L / L U R I E R E A L E S T A T E C E N T E R

R E V I E W 3 9
Broward and Palm Beach Counties were
less active condo conversion markets dur-
ing 2004, but as convertible inventory ran
low in Miami-Dade, conversions accelerat-
ed in the two northern counties during the
first half of 2005. In Broward County,
major property sales for the purpose of
condo conversion totaled 4,314 units in
the first half of 2005, surpassing in six
months the 4,238 converted in 2004. In
Palm Beach County, condo conversion
transactions totaled 2,075 units in the first
half of 2005, up from 1,805 in 2004.
Miami-Dade County was by far the
most active condo conversion market in
the United States during 2004, and
although other markets outpaced Miami-
Dade during the first half of 2005, com-
bined conversion activity in the three
South Florida counties was more than
double the activity recorded in any other
single market during that period. With a
grand total of 27,693 units sold to
investors for the purpose of conversion
during the 18 months ended June 2005, it
is clear that conversion activity is fueling
the condo bubble.
W H E N T H E B U B B L E
W I L L B U R S T
The housing bubble in South Florida
started with strong fundamental demand
Figure 11: South Florida residential permits issued
Th
ou
san
ds
0
10
20
30
40
50
60
70
84 87 90 93 96 99 02 1H05*
Single Family Multifamily*YTD Annualized
Source: Census
in the single-family-for-sale market trig-
gered by low interest rates and easy credit.
As price appreciation accelerated,
increased numbers of purchases were made
by investors buying purely on the expecta-
tion that another buyer would buy the
unit at a higher price. As the media mag-
nified the easy money available in the
condo and single-family-for-sale market,
investment turned to pure speculation.
Flippers, the day traders of the real estate
market, exploited the housing finance sys-
tem that tries to make homeownership
available to every American. Low or no
down-payment loans, interest only or neg-
ative amortization mortgages, and option
ARMs all reduce the monthly payment
requirements for the buyer. Because of
construction lags, the condo market is real-
ly a housing futures contract with a 10 per-
cent down-payment. This magnifies the
speculators’ leverage, especially useful in a
rising market.
The key to the continued expansion of
the bubble is the expectation that future
purchasers will pay ever-higher prices for
property. The bubble will burst when this
expectation changes and investors try to
sell and property prices flatten out or fall.
Sales volumes fall, time on the market
expands dramatically, and property prices
fall. Loans are foreclosed, unsold units are
auctioned, and prices fall further. The
bursting of the bubble could be triggered
by higher interest rates, tighter credit, or
the internal dynamics of the housing mar-
ket affordability. As housing prices rise,
affordability often drops dramatically,
reducing the potential pool of buyers.
Simultaneously, an increasing number of
existing owners try to cash in on high
prices by selling their units. Thus, even
without a rise in interest rates or a tighten-
ing of mortgage credit, the internal
dynamics of the housing market reduce
demand and increase supply in response to
a sharp rise in housing prices. Housing
bubbles are thus self-deflating, even
though they often last longer than experts
analyzing fundamentals predict.
The internal dynamics of the housing
market respond to rapid-rise price increas-
es in ways that are initially self-reinforcing
and therefore help create the bubble.
Eventually, however, the dynamics of the
market reach an inflection point and turn,
becoming self-correcting even without an
external shock such as changes in interest
rates or credit standards. The initial
response to a rapid price run-up may
encourage more demand from existing
owners as they leverage up their newfound
equity and are able to buy a larger and
more expensive house. Potential new
entrants to the market will be adversely
affected by the price-up but may rush to
buy anyway to take advantage of an expec-
tation of future price increases. Speculators
and investors also may rush to buy in
anticipation of future price gains.
4 0 Z E L L / L U R I E R E A L E S T A T E C E N T E R

At some point, this self-reinforcing
price increase, or bubble expansion,
becomes self-correcting. This phase starts
with a reduction in demand from poten-
tial new buyers as they are squeezed by a
lack of affordability because of the price
run-up. They can no longer qualify for a
mortgage to purchase the unit and the
relative cost of renting versus owning
becomes more attractive. (For a graphical
representation of the current disconnect
between prices and rents, see Figure 12.)
By both choice and necessity, more and
more people remain renters. In this phase
of the market an increasing number of
existing homeowners decide to cash in
on the boom and sell their houses at
these new higher price levels. At the same
time, developers of new units finally
catch up with the initial burst in demand
and complete more units than needed to
meet fundamental demand, increasingly
building to meet (speculative) demand.
As the inventory of unsold existing and
new units increases, price growth at first
moderates and then turns negative.
Condo values may fall below outstand-
ing mortgage amounts, and defaults and
foreclosures begin. Lenders then start to
auction properties and prices fall further
as speculators try to unload. Thus, the
very dynamics that started the bubble
turn into dynamics that cause the bubble
to burst.
R E V I E W 4 1
Figure 12: Existing condo prices vs. rents
% C
han
ge
Yea
r to
Yea
r
-10%
0%
10%
20%
30%
40%
1985 1989 1993 1997 2001 1Q05
Miami Condos Rents
Source: MRAC, Reinhold Wolff, BLS
C O N C L U S I O N
Looking forward, South Florida’s increas-
ingly diverse economy will benefit from its
strong trade ties to Latin America, its
importance as a tourist center, and its
growing service sector. The relative afford-
ability of the area and its high quality of
life will attract businesses. Strong demo-
graphic trends do not show signs of slow-
ing and will create steady demand for new
housing. The combination of the area’s
tropical climate, existing tourist infrastruc-
ture, and convenient location at the inter-
section of the United States, the
Caribbean, and Latin America will con-
tribute to future strength in the tourism
industry. Similarly, South Florida is
expected to draw increasing numbers of
second-home buyers and retirees as baby
boomers age.
These positive economic and demo-
graphic trends and the limited supply of
developable land will create a positive envi-
ronment for condominium construction
in the long term. Additionally, as estab-
lished high-density residential nodes reach
capacity, the revitalization of central neigh-
borhoods and residential infill will be nec-
essary to accommodate growth in
demand. Suburban and urban downtowns
and underutilized industrial areas will be
prime areas for residential development.
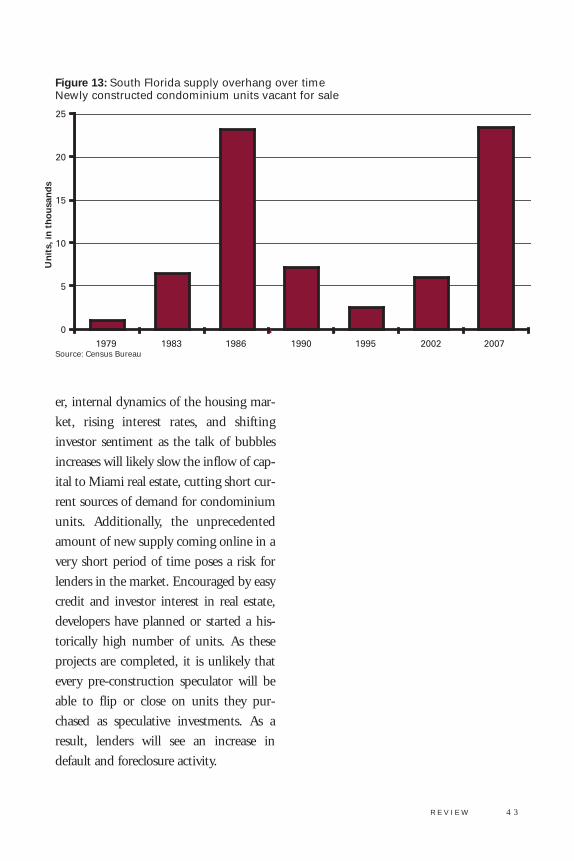
However, the volume and intensity of
current activity points to a bubble. It is
unlikely that sufficient demand exists to
absorb the projected new stock of as many
as 50,000 units during the next three
years. Depending on the number of cur-
rent projects that reach completion, a large
number of investors could put their units
on the market at a time when rising inter-
est rates are dampening consumer
demand. We project a supply overhang
(shown in Figure 13) of approximately
23,000 unoccupied newly constructed
units by 2007 as units initially purchased
by speculators come online.
The rapid acceleration of prices is also
a cause for concern. We believe that price
appreciation in recent years has led to a
premium in condominium values nation-
ally, and the situation is even more severe
in South Florida. Although asset bubbles
are notoriously hard to predict, we suspect
condominium prices may fall dramatically
in the next three years.
We identify a number of risk factors in
the South Florida condominium market.
First among these is the sustainability of
the current levels of demand. Although
developers report selling out new projects
in hours or days, many—if not most—of
the buyers at these projects are investors
and speculators who intend to flip the
units without ever occupying them.
In the long term, we are bullish on
South Florida’s economy and real estate
markets and expect the area to grow steadi-
ly in the future. In the short term, howev-
4 2 Z E L L / L U R I E R E A L E S T A T E C E N T E R
er, internal dynamics of the housing mar-
ket, rising interest rates, and shifting
investor sentiment as the talk of bubbles
increases will likely slow the inflow of cap-
ital to Miami real estate, cutting short cur-
rent sources of demand for condominium
units. Additionally, the unprecedented
amount of new supply coming online in a
very short period of time poses a risk for
lenders in the market. Encouraged by easy
credit and investor interest in real estate,
developers have planned or started a his-
torically high number of units. As these
projects are completed, it is unlikely that
every pre-construction speculator will be
able to flip or close on units they pur-
chased as speculative investments. As a
result, lenders will see an increase in
default and foreclosure activity.
R E V I E W 4 3
Figure 13: South Florida supply overhang over timeNewly constructed condominium units vacant for sale
0
5
10
15
20
25
1979 1983 1986 1990 1995 2002 2007
Un
its,
in t
ho
usa
nd
s
Source: Census Bureau