the spe foundation through member donations and a ... · •drilling and completion on same surface...
TRANSCRIPT

Primary funding is provided by
The SPE Foundation through member donations
and a contribution from Offshore Europe
The Society is grateful to those companies that allow their
professionals to serve as lecturers
Additional support provided by AIME
Society of Petroleum Engineers
Distinguished Lecturer Programwww.spe.org/dl

Multiple Pay Tight Gas Sands
Can the Lessons Learned in the
Rockies Help You?
Mike Eberhard P.E.Halliburton Energy Services
Society of Petroleum Engineers
Distinguished Lecturer Programwww.spe.org/dl

Agenda
• Rocky Mountain Tight Gas
• “Factory” Completions for Efficiency
• Reservoir Considerations for Factory Completions
• Fracture Treatment Considerations
• Post Frac Evaluation
• Results
• Summary
Rocky Mountain Tight Gas 4
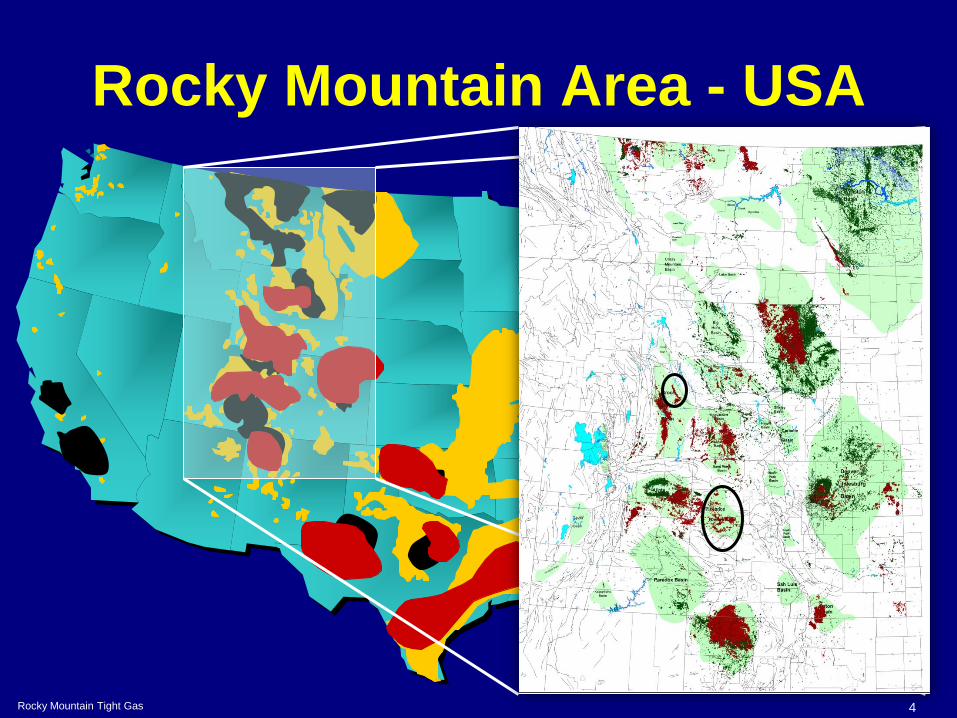
Rocky Mountain Area - USA
Rocky Mountain Tight Gas 5
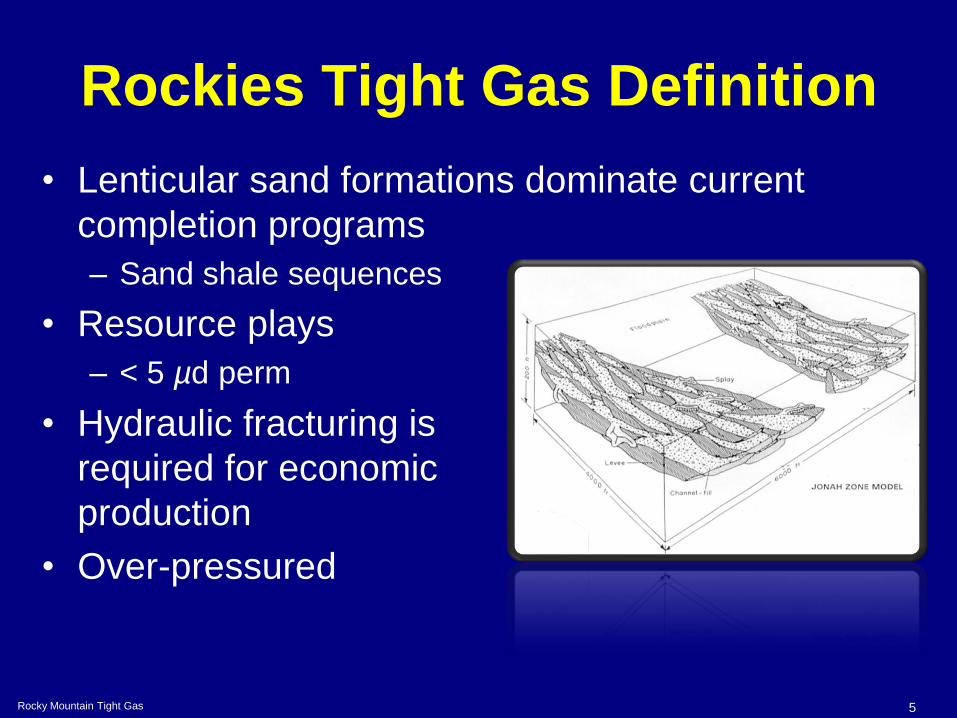
Rockies Tight Gas Definition
• Resource plays
– < 5 µd perm
• Hydraulic fracturing is
required for economic
production
• Over-pressured
• Lenticular sand formations dominate current
completion programs
– Sand shale sequences

Rocky Mountain Tight Gas 6
LiDAR-Orthophoto Composite
Outcrop Photo – Piceance
Figure provided by Matt Pranter (University of Colorado at Boulder) and Rex Cole (Mesa State College)
1,2
00’

Rocky Mountain Tight Gas 7
Pinedale/Jonah Area
• Up to 40 wellbores
from a single pad
• 3,000 to 5,000 ft of
gross interval
– 30 to 60% net
– TOOP 8 - 10,000’
• Up to 60 individual
sands

Rocky Mountain Tight Gas 8
Stacked Pay Geology – Rockies
30 Individual sands
13 Frac Stages

Rocky Mountain Tight Gas 9
Tight Gas Sand Issues
• Marginal economics
– High decline wells
– Small drainage areas (reservoirs)
• A large number of wells required for economic
programs
– High density drilling programs
• Cost reduction by efficiencies
– Factory “assembly line” approach
Rocky Mountain Tight Gas 10
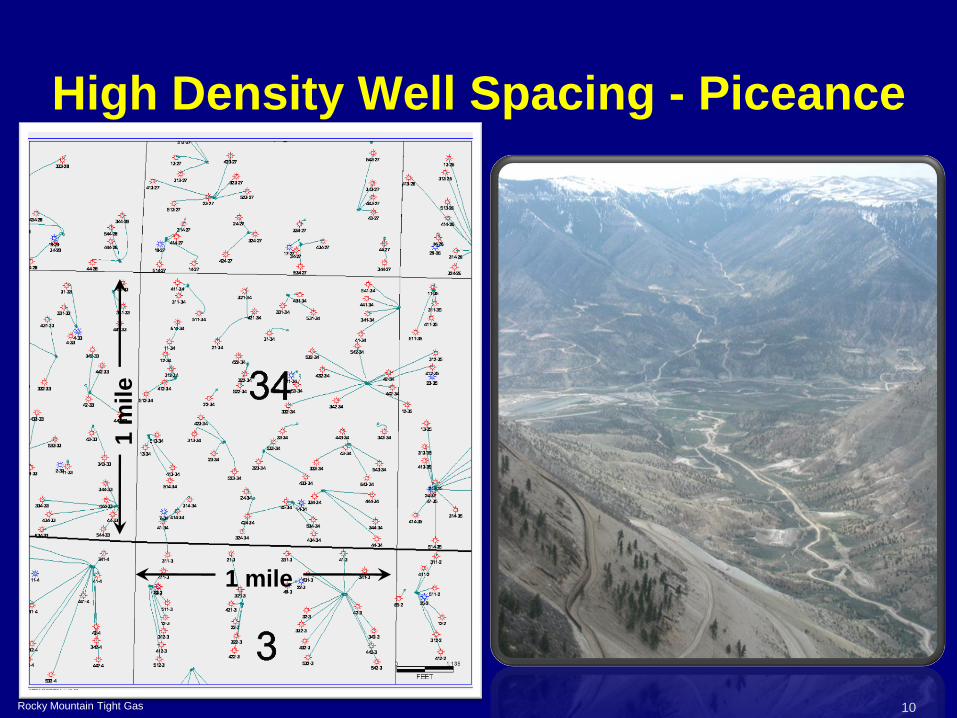
High Density Well Spacing - Piceance
1 mile
1 m
ile

Rocky Mountain Tight Gas 11
High Efficiency Operations
“Frac Factories”
• Simultaneous operations
– Drilling, perforating, fracing, completing,
producing

Rocky Mountain Tight Gas 12
High Efficiency Operations
“Frac Factories”
• Simultaneous operations
– Drilling, perforating, fracing, completing,
producing
• Multiple wells on a single surface pad
• Multiple wells treated from a single frac
equipment location
• Goal - Multiple fracture treatments done per
crew every day

“Factory” Completions for Efficiency 13
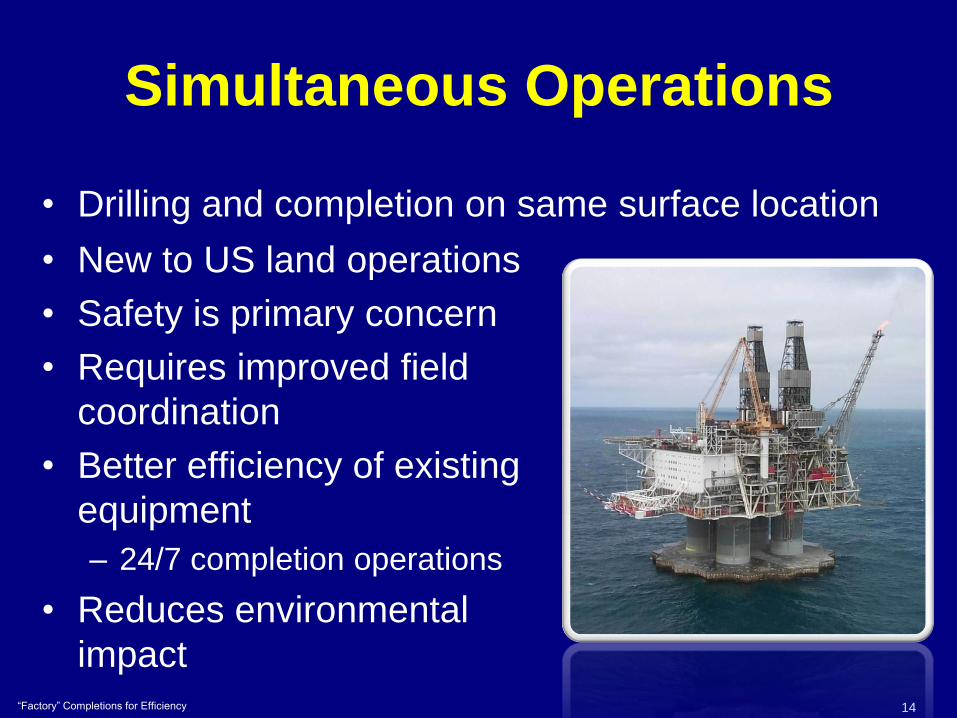
Simultaneous Operations
• Drilling and completion on same surface location
Photo courtesy of Ultra Petroleum
“Factory” Completions for Efficiency 14
Simultaneous Operations
• Drilling and completion on same surface location
• New to US land operations
• Safety is primary concern
• Requires improved field
coordination
• Better efficiency of existing
equipment
– 24/7 completion operations
• Reduces environmental
impact

“Factory” Completions for Efficiency 15
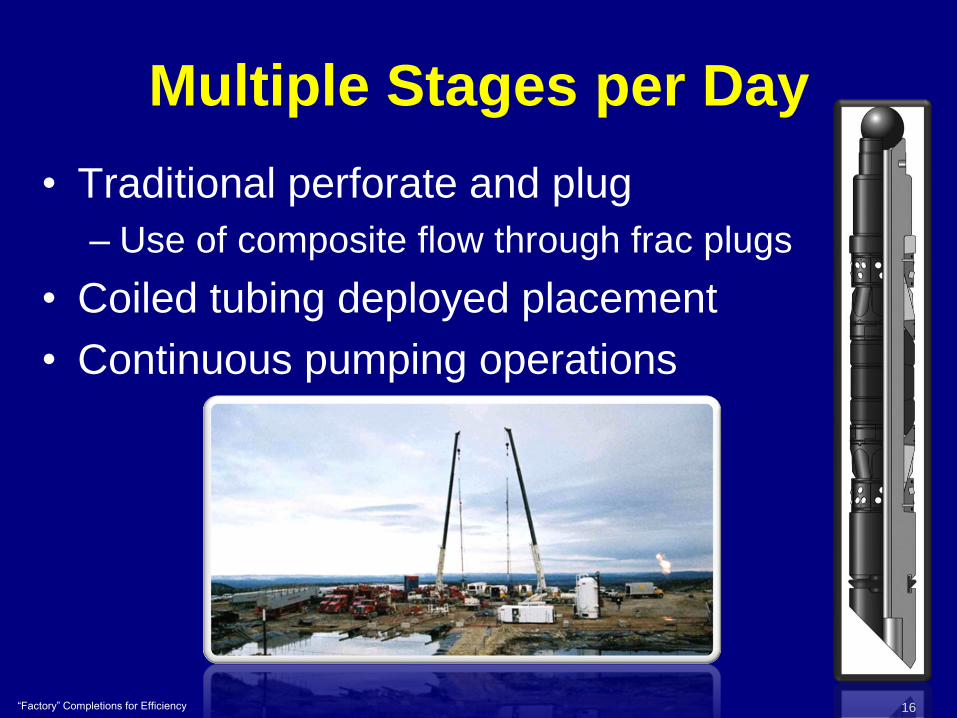
Multiple Stages per Day
• Traditional perforate and plug
– Use of composite flow through frac plugs
“Factory” Completions for Efficiency 16
Multiple Stages per Day
• Traditional perforate and plug
– Use of composite flow through frac plugs
• Coiled tubing deployed placement
• Continuous pumping operations

“Factory” Completions for Efficiency 17
Multiple Pad Completions
32 335-32
9-32
11-32
15-32
13-32
11-33
15-3313-33
7-32 5-33 7-33
10-33
6-33
14-33
71-32
11-33X
13-32W
16-32
14-32
10-32
8-32
6-32
12-33
59-32
55-32
38-32
44-3246-32
35-32
53-32
56-32
57-32 61-32
73-33
62-3263-32
50-32
64-32
51-32
47-32
49-32
48-32
41-32
39-3233-32
42-33
60-33
74-33 75-33
70-33
76-33
58-33
68-33
77-33
71-33
45-33
43-33
37-33
46-3344-33
40-33
41-33
52-32
25-32
26-32 27-32
28-32 29-32 31-32
32-32
36-32
37-32
60-32
25-33
26-33
27-33 28-33 29-33
35-33
36-33
52-33
59-33
74-32 75-32
48-32X
42-32
67-32
76-3277-32
38-33
53-33
61-33
72-32
66-32
79-32 80-32
65-32
78-32
70-3269-32
58-32
67-33
54-32
40-32
12-32
34-32
39-33
54-33
7-3343-32
72-33
FEET
0 872
PETRA 04/14/2006 9:54:24 AM
10 remote sites
40 wells
406 frac stages
Map Courtesy of EnCana

“Factory” Completions for Efficiency 18
Pitfalls with Factory Completions
• Ignoring the reservoir
• “Cookbook” frac designs become standard
• Logistics start to mandate completions
• Well cost becomes main concern
Reservoir Considerations for Factory Completions 19
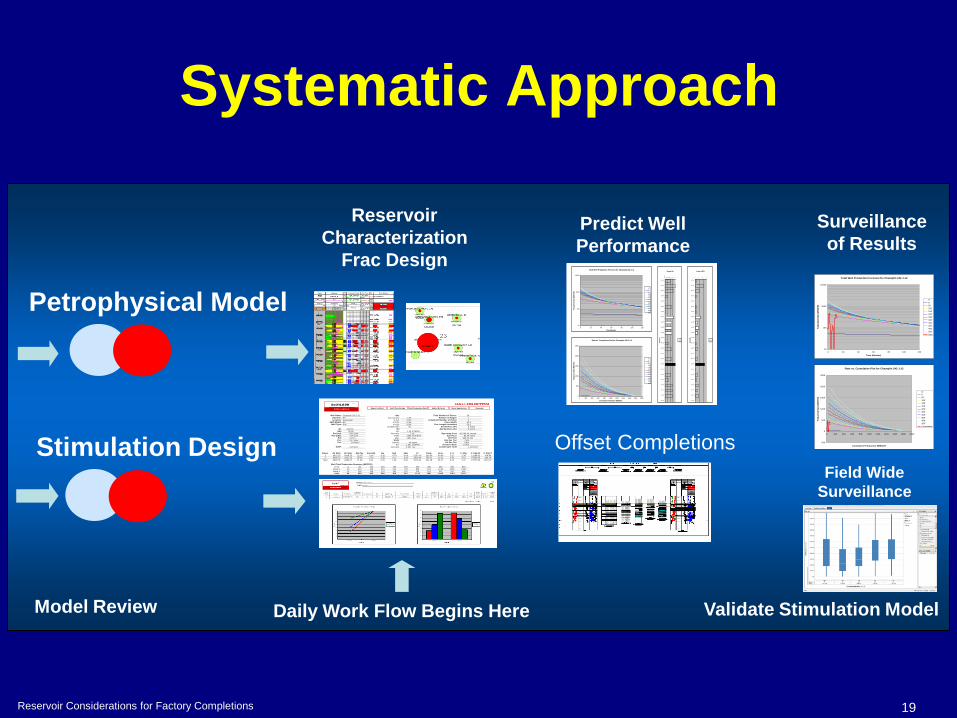
Systematic Approach
Stimulation Design
Petrophysical Model
Model Review Validate Stimulation Model
Surveillance
of Results
Total Well Production Forecast for Champlin 242 J-12
10
100
1000
10000
0 20 40 60 80 100 120
Time (Months)
Pro
du
cti
on
Ra
te (
MS
CF
/D)
Lf
0'
50'
100'
150'
200'
250'
300'
350'
400'
450'
500'
Gas
Rate vs. Cumulative Plot for Champlin 242 J-12
-500
0
500
1000
1500
2000
2500
0 200 400 600 800 1000 1200 1400 1600 1800 2000
Cumulative Production (MMSCF)
Pro
du
cti
on
Ra
te (
MS
CF
/D)
Lf
0'
50'
100'
150'
200'
250'
300'
350'
400'
450'
500'
Cumulative
Field Wide
Surveillance
Reservoir
Characterization
Frac Design
Daily Work Flow Begins Here
Well Name: Champlin 242 J-12 Gas Total Number of Zones: 24Operator: BP Gas Gravity: 0.65 Number of Stages: 2Location: Wamsutter % N2: 0.0% Completed Number of Zones: 5
Swift Model: BP % CO2 0.0% Frac Length: 50 ftWell Type: Gas % H2S 0.0% Frac Length Increment: 50 ft
Condensate? No Economic Limit: 9 mcf/dWI: 100.0% Oil Mechanical Limit: 9 mcf/d
NRI: 75.0% Bo: 1.25 STB/RBPwf (ini): 1292 psia Viscosity: 2 cp Operating Cost: $1,000.00 /month
Pwf (abn): 100 psia GOR: 2500 SCF/STB Gas Price: $3.50 mcf/dRw: 0.25 ft Pbp: 1001 psia Oil Price: $60.00 /bbl
Psc: 14.7 psia Water Gas Sev Tax: 7.5%Tsc: 60 deg F Salinity: 40 kppm Oil Sev Tax: 4.6%
Bw: 1.001 STB/RB Discount Rate: 10.0%OGIP: 2.28 BCF Viscosity: 0.341 cps Condensate Yield: 1 bo/mmcf
Stage Zn Start Zn Stop Net Pay Porosity Sw kgh kwh Pi Temp Area F -h F -hSg F -hSg-Pi F -hSg-T
1 9315.25 9338.25 22.50 0.14 0.26 0.79 0.00 5167.00 203.00 40.00 3.17 2.36 12189.32 478.892 9090.75 9181.25 48.50 0.10 0.40 0.27 0.00 5005.39 199.75 33.22 5.04 3.01 15058.54 600.48
Tota l 9090.75 9338.25 71.00 0.12 0.35 1.06 0.00 5076.42 201.38 35.37 8.22 5.37 27247.86 1079.37
Well Total Production Summary (MSCF/D)
Lf (ft) 0 50 100 150 200 250 300 350 400 450 500Stage 1 40 320 420 515 613 720 839 975 1135 1326 1562
Stage 2 13 105 139 170 202 237 276 321 374 437 515Total 54 425 559 685 816 957 1115 1297 1509 1764 2077
SwiftLOOK SM
StimulationReset ApplicationAdd Production Data Adjust B-Factor SummarySwift Frac DesignExport to Word
Predict Well
Performance
Offset Completions
Total Well Production Forecast for Champlin 242 J-12
10
100
1000
10000
0 20 40 60 80 100 120
Time (Months)
Pro
duc
tio
n R
ate
(M
SC
F/D
)
Lf
0'
50'
100'
150'
200'
250'
300'
350'
400'
450'
500'
Rate vs. Cumulative Plot for Champlin 242 J-12
0
500
1000
1500
2000
2500
0 200 400 600 800 1000 1200 1400 1600 1800 2000
Cumulative Production (MMSCF)
Pro
duc
tio
n R
ate
(M
SC
F/D
)
Lf
0'
50'
100'
150'
200'
250'
300'
350'
400'
450'
500'
Zone kh
1E-
04 0.001 0.01 0.1 1
8962.75
8972.25
9008.25
9030.75
9039.25
9052.75
9070.75
9090.75
9114.25
9128.75
9166.25
9199.25
9209.75
9235.75
9278.75
9285.25
9315.25
9355.75
9370.25
9397.25
9404.75
9421.75
9432.75
9457.75
Depth
(ft
)
Zn Data
Stage 1
Stage 2
Zone HPV
0 1 2 3
8962.75
8972.25
9008.25
9030.75
9039.25
9052.75
9070.75
9090.75
9114.25
9128.75
9166.25
9199.25
9209.75
9235.75
9278.75
9285.25
9315.25
9355.75
9370.25
9397.25
9404.75
9421.75
9432.75
9457.75
Dep
th (ft
)
Zn Data
Stage 1
Stage 2
Reservoir Considerations for Factory Completions 20
A Petrophysical Model Will…
• Assist with determining completion intervals
– “What-if” scenarios
• Incorporate reservoir potential into frac
design considerations
– Proppant type, job size, etc.
• Predict well performance based on
completion program

Reservoir Considerations for Factory Completions 21
Building a Petrophysical Model
• Core analysis
– Corrected for bottom hole conditions
• Diagnostic Fracture Injection Tests (DFIT)
– Before and after closure
• Treating pressures
• Production results
Sh2005ag - X-Permeability (md)
01/01/1980 00:00:00 0.0000 days
0.020
0.018
0.016
0.014
0.012
0.010
0.008
0.006
0.004
0.002
0.000

Reservoir Considerations for Factory Completions 22
Unconventional Pressure Transient
Testing
Fracture-Injection/Falloff Tests
• Pre-frac or Refrac Evaluation
• Falloff Analysis
– Reservoir Properties
– Fracture Properties
• Multilayer models

Fracture Treatment Considerations 23
Stimulation Issues
• Very long completion intervals
• Optimization of stimulation design
• Supply chain management
– Water, proppant
• Consistent improvement in a large scale
project

Fracture Treatment Considerations 24
Design and Operations
• Traditional issues
– Fluid systems
– Proppant types
– Additives
• Single or multiple well completion program
• When to flow back and for how long
• Reuse of frac and/or formation fluids
Fracture Treatment Considerations 25
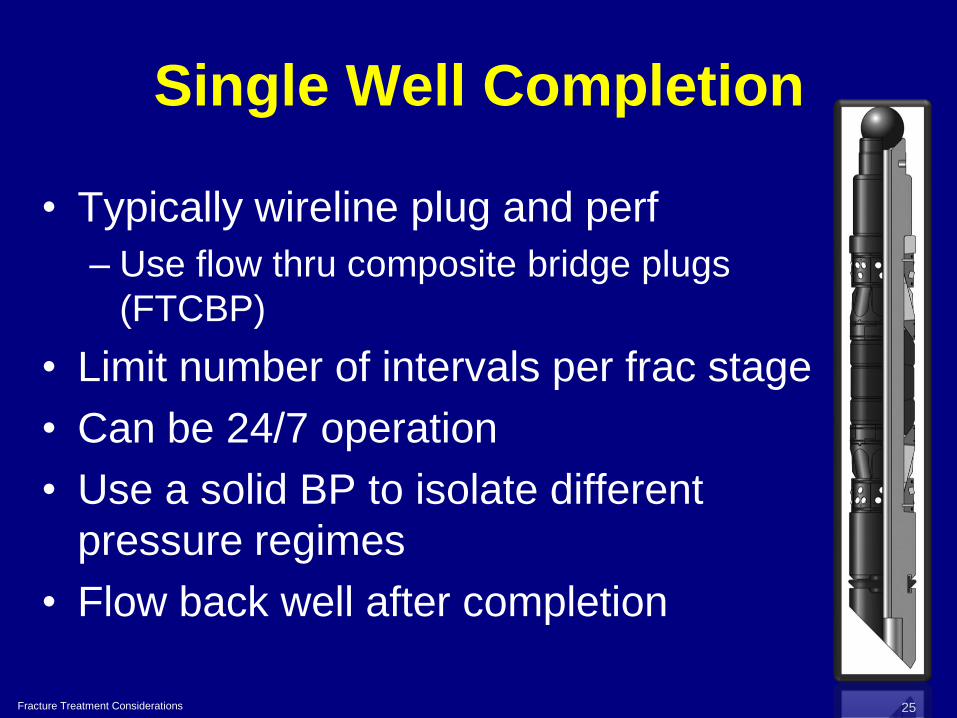
Single Well Completion
• Typically wireline plug and perf
– Use flow thru composite bridge plugs
(FTCBP)
• Limit number of intervals per frac stage
• Can be 24/7 operation
• Use a solid BP to isolate different
pressure regimes
• Flow back well after completion

Fracture Treatment Considerations 26
Multiple Well Completions
• Treat several wells from a single location
– Requires close proximity
• Complete one or two stages then flow the
well back
• Only move frac iron not equipment
• Use FTCBP for frac stage isolation

Post Frac Evaluation 27
More Frac Factory Concerns
• No time to review results from changes
• Several wells completed before a problem is
noticed
• Science is not done up front
– High density drilling
• High change over of personnel

Post Frac Evaluation 28
Diagnostics for Design
• Tiltmeters
• Microseismic monitoring

Post Frac Evaluation 29
Diagnostics for Design
• Tiltmeters
• Microseismic monitoring
• Chemical/radioactive tracers
• Temperature distribution analysis
• Production Logs

Post Frac Evaluation 30
Monitor and Adjust
• Does the actual production match predicted?
• Does the stimulation treatment pressure
history matches predicted?
• Does the production profile look reasonable?
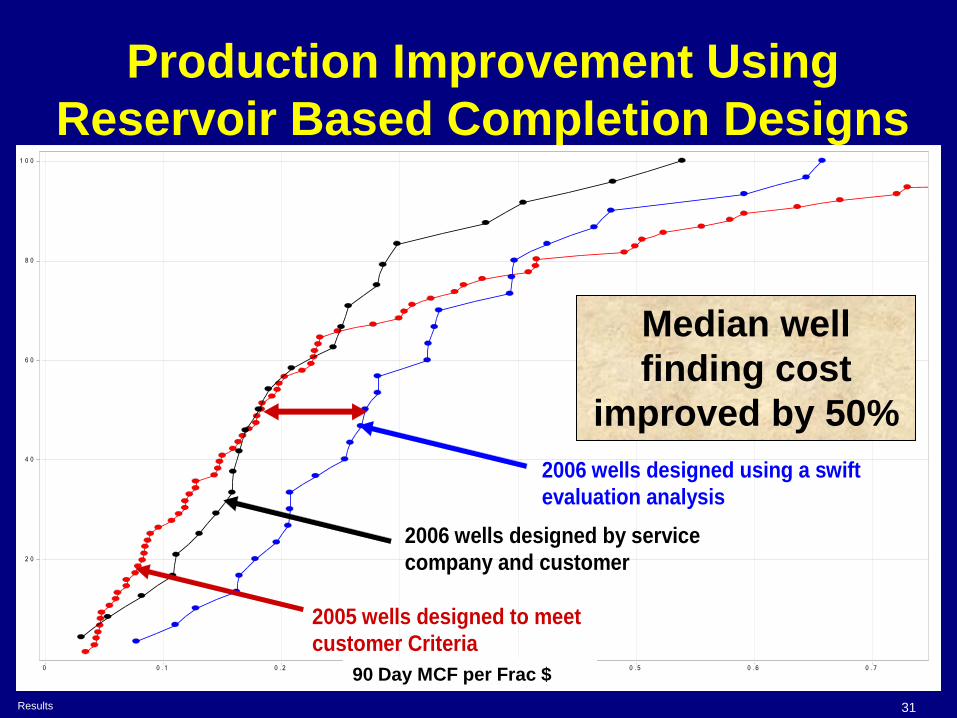
Results 31
Production Improvement Using
Reservoir Based Completion Designs
G a s p e r D o lla r S p e n t
0 0 . 1 0 . 2 0 . 3 0 . 4 0 . 5 0 . 6 0 . 7
2 0
4 0
6 0
8 0
1 0 0
G a s p e r D o lla r S p e n t
0 0 . 1 0 . 2 0 . 3 0 . 4 0 . 5 0 . 6 0 . 7
2 0
4 0
6 0
8 0
1 0 0
The median well produces 50%
more gas per frac dollar spent
than the average well with only
customer input.
2005 wells designed to meet
customer Criteria
2006 wells designed using a swift
evaluation analysis
2006 wells designed by service
company and customer
90 DAY MCF per Frac $90 DAY MCF per Frac $
Median well
finding cost
improved by 50%
90 Day MCF per Frac $

Results 32
Benchmark ChangesC
um
ula
tive F
req
uen
cy
EUR, BSCF
Slick Water with
Microemulsion
Gel System
Slick Water Frac
Hybrid Frac

33
Summary
• Efficient drilling/completion programs
• Effective stimulation of multiple intervals
• Watch out for pitfalls of factory mentality
• Calibrated petrophysical models
• Unconventional PTA used
• Consideration well completion strategy
• Use of diagnostic tools and lookback studies