the state of facilities at cicu institutions
TRANSCRIPT

CenterUniversity of Missouri – ColumbiaUniversity of Missouri – Kansas CityUniversity of Missouri – St. LouisUniversity of Nebraska at KearneyUniversity of Nebraska at LincolnUniversity of Nebraska Medical CenterUniversity of New BrunswickUniversity of New HampshireUniversity of New HavenUniversity of North TexasUniversity of Northern IowaUniversity of Notre DameUniversity of OregonUniversity of PennsylvaniaUniversity of RedlandsUniversity of Rhode IslandUniversity of RochesterUniversity of San DiegoUniversity of San FranciscoUniversity of Southern MaineUniversity of Southern MississippiUniversity of St. ThomasUniversity of Tennessee, KnoxvilleUniversity of Texas at DallasUniversity of the PacificUniversity of the Sciences in
PhiladelphiaUniversity of ToledoUniversity of VermontVanderbilt UniversityVassar CollegeVirginia Commonwealth UniversityVirginia Department of General
ServicesVirginia State UniversityWagner CollegeWake Forest UniversityWashburn UniversityWashington University in St. LouisWellesley CollegeWesleyan UniversityWest Chester UniversityWest Liberty UniversityWest Virginia Institute of TechnologyWest Virginia School of Osteopathic
The State of Facilities at cIcuInstitutions
Introducing Our Presenters
Jay PearlmanAssociate Vice PresidentSightlines
Steve BellonaAssociate Vice President, Facilities & PlanningHamilton College
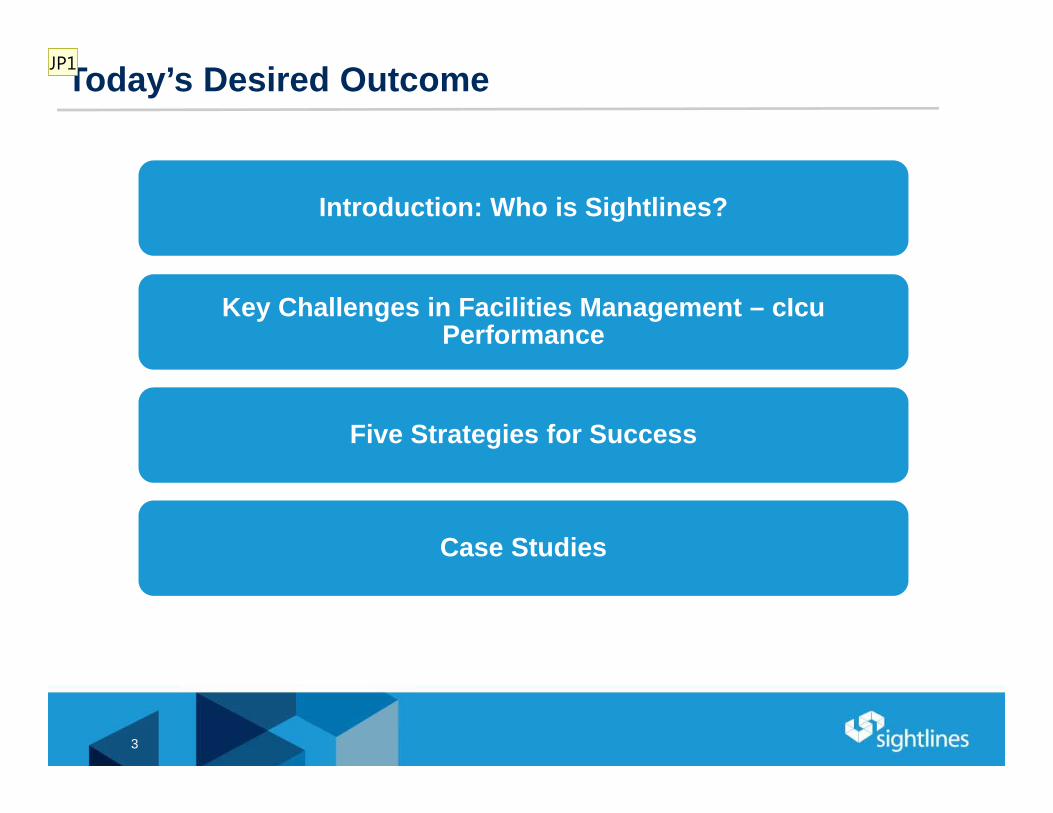
Today’s Desired Outcome
Introduction: Who is Sightlines?
Key Challenges in Facilities Management – cIcuPerformance
Five Strategies for Success
Case Studies
3
JP1

Who is Sightlines?

Sightlines is a Facility Asset Advisory Firm
Identify ways to use capital more strategically and identify opportunities to improve operational effectiveness.
Separate fact from fiction on key issues – operational performance, annual funding needs, and project backlogs.
Document trends, provide consistent measurement, credible benchmarking and track progress to goals.
Analytical Rigor, Common Vocabulary, Consistent Methodology, Common Platform

Comprehensive Facilities Intelligence Solutions

7
Who Partners with Sightlines?Robust membership includes colleges, universities, consortiums and state systems
Serving the Nation’s Leading Institutions:
• 14 of the Top 20 Colleges*• 15 of the Top 20 Universities*• 34 Flagship State Universities• 12 of the 14 Big 10 Institutions• 8 of the 12 Ivy Plus Institutions• 8 of 13 Selective Liberal Arts Colleges
* U.S. News 2015 Rankings
Sightlines is proud to announce that:
• 450 colleges, universities and K-12 institutions are Sightlines clients including over 325 ROPA members.
• 93% of ROPA members renewed in 2014
• We have clients in 43 states, the District of Columbia and Canada
• 100 institutions became new members since 2013
Sightlines advises state systems in:
• Alaska• California• Connecticut• Hawaii• Maine• Massachusetts• Minnesota• Mississippi• Missouri• New Hampshire• New Jersey• Oregon• Pennsylvania• Texas• West Virginia
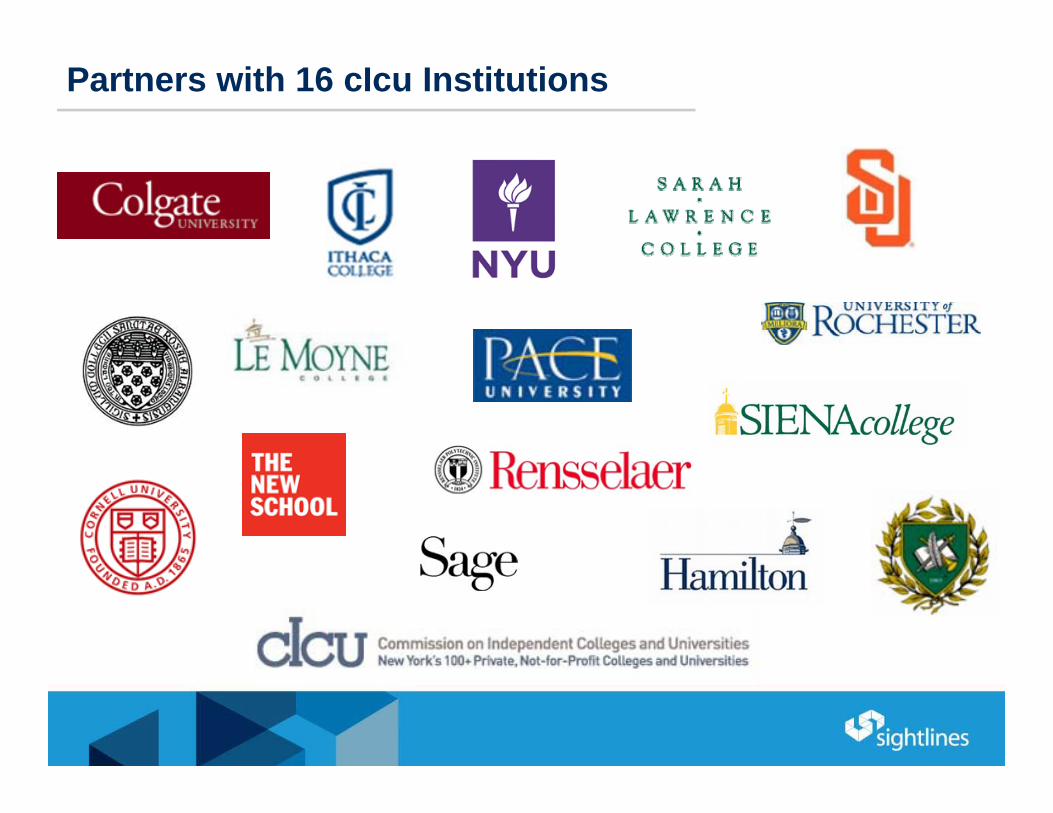
Partners with 16 cIcu Institutions

Key Challenges in Facilities Management

The Sustainability of Higher Education is in QuestionHigher education stakeholders are faced with…
Federal and state funding levels for higher education have fallen to historic lows with no near term vision for recovery.
Demographic shifts have led to level or declining enrollments in traditional students.
Affordability of education has expanded student debt, capped tuition growth, and increased dependency on Pell Grants.
Tuition dependency has grown, tuition discounting (privates) increasing, operating margins have fallen, and balance sheets have weakened.
Administrative and support costs have grown compared to education costs.
10

“Approximately one-third of all colleges and universities have financial statements that are significantly weaker than they were several years ago.”
Denneen & Dretler, The Financially Sustainable University
Higher Education’s Liquidity Crisis
11
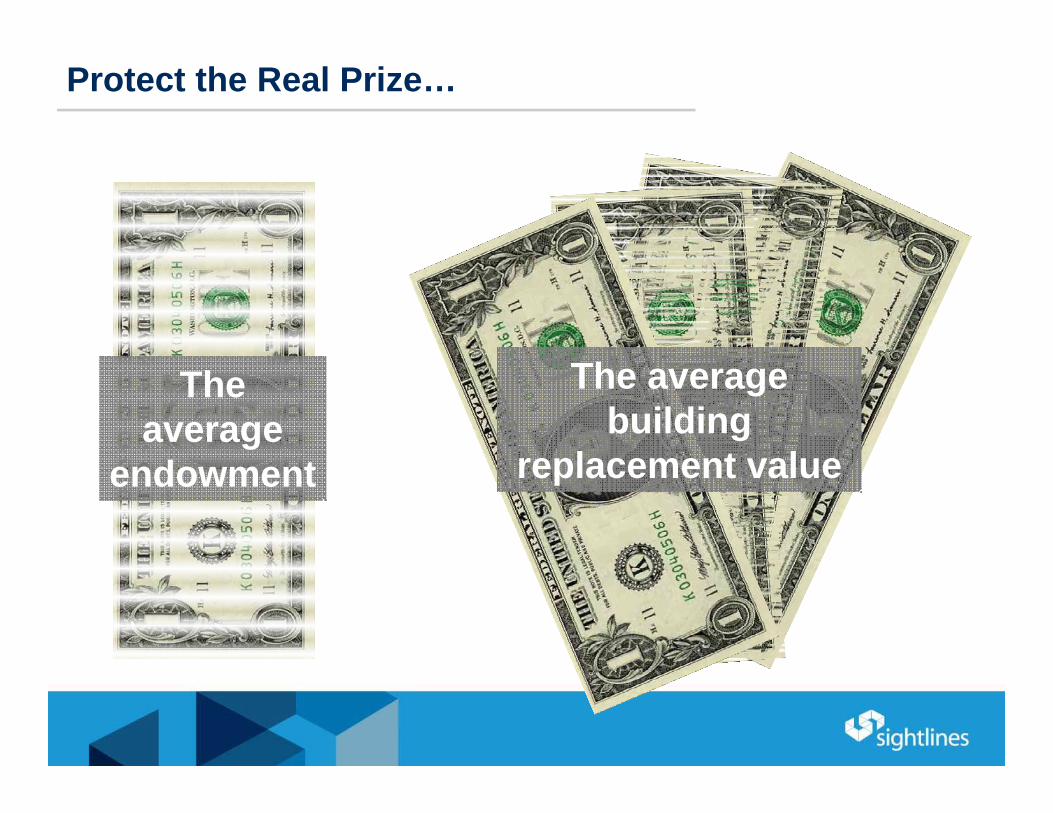
Protect the Real Prize…
The average
endowment
The average building
replacement value
“One side effect of this rapid growth has been the creation of an increasingly large obligation for the future renewal and replacement of the physical plant.”
Rick Biedenwig – 1980Founder, Pacific Partners Consulting Group
Source: Before the Roof Caves In II: Published with assistance from APPA and Stanford University
An Accurate Prediction

0%
2%
4%
6%
8%
10%
12%
% o
f Con
stru
cted
Spa
ce
Constructed Space 1880-2015
Sightlines Database
What’s Your Plan?
14
Pre-
War Built before 1951
Durable constructionOlder but typically lasts longer Po
st-W
ar Built between 1951 and 1975Lower-quality constructionAlready needing more repairs and renovations
Mod
ern Built between 1975 and
1990Quick-flash constructionLow-quality building components\
Com
plex
Built in 1991 and newerTechnically complex spacesHigher-quality, more expensive to maintain & repair
Pre-War Post-War Modern Complex

Campus Space and EnrollmentNational average for enrollment and space growth
0%
2%
4%
6%
8%
10%
12%
2007 2008 2009 2010 2011 2012 2013
Perc
ent C
hang
e of
Enr
ollm
ent &
Spa
ce
National Space Growth National Enrollment Growth

Capital Investment is Down
$0.00
$0.50
$1.00
$1.50
$2.00
$2.50
$3.00
$3.50
$4.00
$4.50
$5.00
2007 2008 2009 2010 2011 2012 2013 2007 2008 2009 2010 2011 2012 2013
$/ G
SF
Public Private

$0
$1,000
$2,000
$3,000
$4,000
$5,000
$6,000
2007 2008 2009 2010 2011 2012 2013 2007 2008 2009 2010 2011 2012 2013
Tota
l Dol
lars
(Mill
ions
)
Existing Space New Space
Capital Investment into Existing Space
Public Average Private Average
51%49%
62%
38%
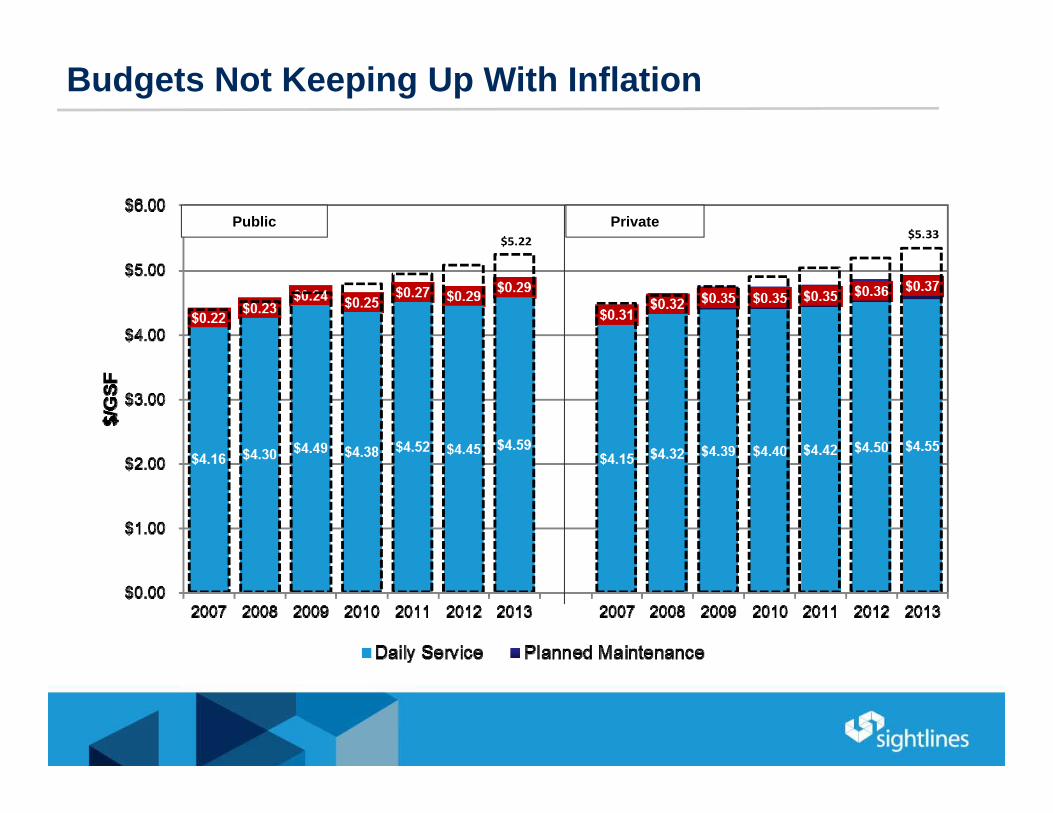
Budgets Not Keeping Up With Inflation
$5.22 $5.33 Public Private

Facilities Backlogs Continue to Rise
$77 $79 $80 $82 $84 $87 $90
0%
2%
4%
6%
8%
10%
12%
14%
16%
18%
20%
$-
$10
$20
$30
$40
$50
$60
$70
$80
$90
$100
2007 2008 2009 2010 2011 2012 2013
$/G
SF
Backlog $/GSF
Backlog/GSF Percentage Change of Backlog
19

Significant Reductions in Normalized Consumption

Normalized Utility Emissions FallingBoth normalized metrics falling at similar rates
How does the cIcuCompare?
0%
2%
4%
6%
8%
10%
12%
% o
f Con
stru
cted
Spa
ce
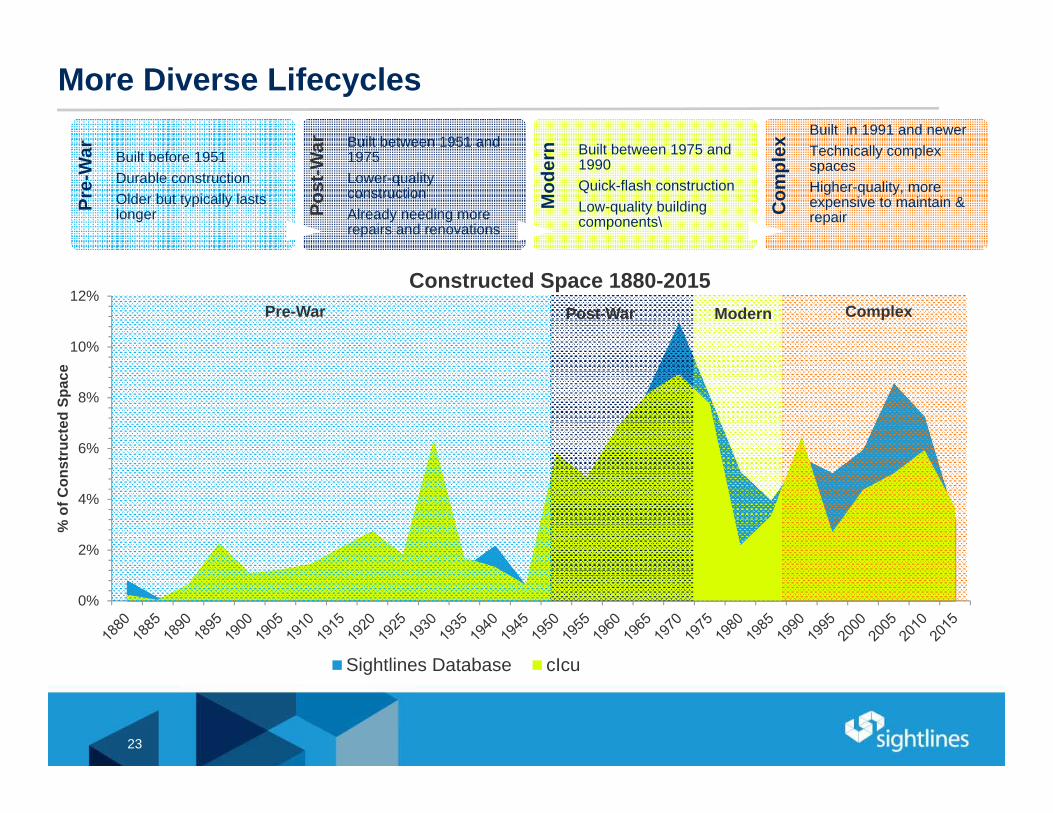
Constructed Space 1880-2015
Sightlines Database cIcu
More Diverse Lifecycles
23
Pre-
War Built before 1951
Durable constructionOlder but typically lasts longer Po
st-W
ar Built between 1951 and 1975Lower-quality constructionAlready needing more repairs and renovations
Mod
ern Built between 1975 and
1990Quick-flash constructionLow-quality building components\
Com
plex
Built in 1991 and newerTechnically complex spacesHigher-quality, more expensive to maintain & repair
Pre-War Post-War Modern Complex

0%
2%
4%
6%
8%
10%
12%
14%
16%
18%
20%
% o
f Con
stru
cted
Spa
ce
Constructed Space 1880-2015
Sightlines Database Hamilton
Hamilton - More Diverse Lifecycles
24
Pre-
War Built before 1951
Durable constructionOlder but typically lasts longer Po
st-W
ar Built between 1951 and 1975Lower-quality constructionAlready needing more repairs and renovations
Mod
ern Built between 1975 and
1990Quick-flash constructionLow-quality building components\
Com
plex
Built in 1991 and newerTechnically complex spacesHigher-quality, more expensive to maintain & repair
Pre-War Post-War Modern Complex

Energy Consumption Decreases
0
30,000
60,000
90,000
120,000
150,000
2008 2009 2010 2011 2012 2013 2014
Fossil Fuel Electric
BTU
/GSF

A Focus on Electric Usage
0.00
10.00
20.00
30.00
40.00
50.00
2008 2009 2010 2011 2012 2013 2014
Fossil Fuel Electric
$/M
MB
TU

Hamilton - Utilities In Context of Institutional GrowthUtility use has decreased despite growth in campus GSF and users
-1%
4%3%
-5%
-8%
-6%
-4%
-2%
0%
2%
4%
6%
Gross Utility Use Campus GSF Campus FTEs
Hamilton % Change 2009-2014
25.8 24.9 24.8
23.1 24.3 24.6
-
5.0
10.0
15.0
20.0
25.0
30.0
2009 2010 2011 2012 2013 2014
kWh
in M
illio
ns
Hamilton Electricity Use
Total Electricity
27
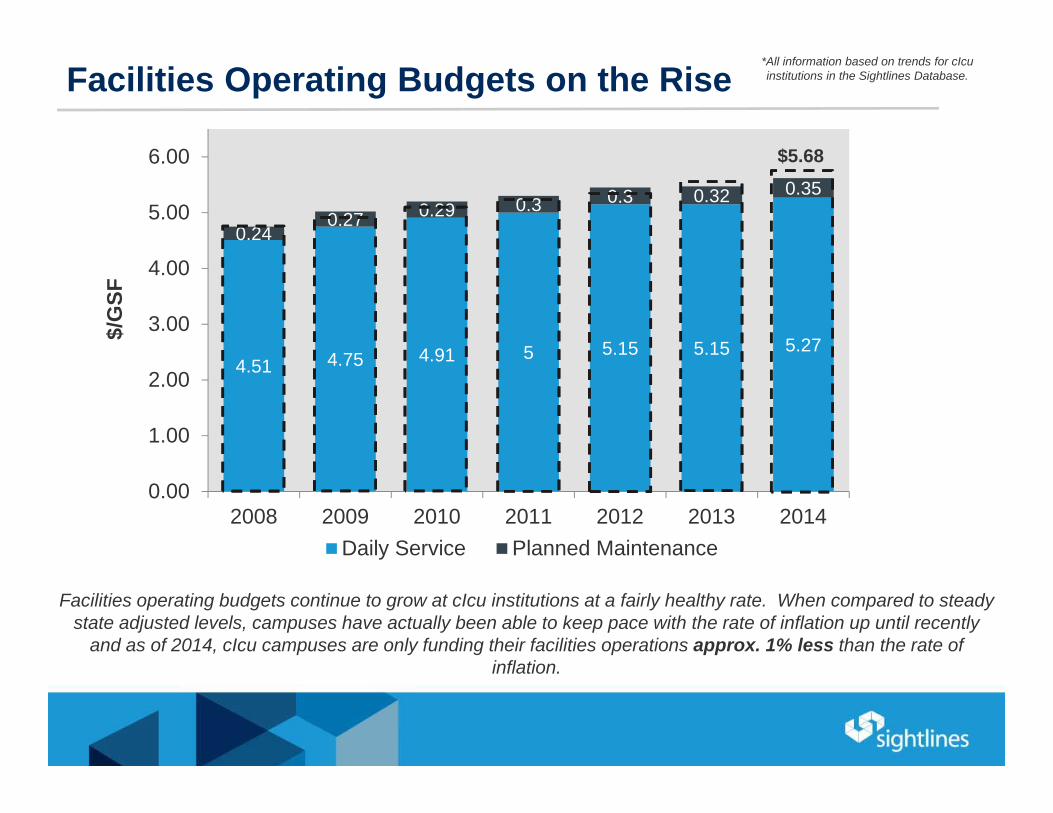
Facilities Operating Budgets on the Rise
4.51 4.75 4.91 5 5.15 5.15 5.27
0.240.27 0.29 0.3 0.3 0.32 0.35
0.00
1.00
2.00
3.00
4.00
5.00
6.00
2008 2009 2010 2011 2012 2013 2014Daily Service Planned Maintenance
$/G
SF
*All information based on trends for cIcuinstitutions in the Sightlines Database.
$5.68
Facilities operating budgets continue to grow at cIcu institutions at a fairly healthy rate. When compared to steady state adjusted levels, campuses have actually been able to keep pace with the rate of inflation up until recently
and as of 2014, cIcu campuses are only funding their facilities operations approx. 1% less than the rate of inflation.

Five Strategies for Success

Changing the Conversation in Higher Education

Five Strategies for Success
Build strategically
Less can be more
Look ahead Keep-up
Reward savings

Less Can be More

> “No Net New Space” – A policy rooted in sustainability, it states that no new space on campus will be built without the removal of an equal amount of deficient square footage.
> “No Net New Backlog” – A variation of no net new space that states that no new construction can occur without the mitigation of an equal value of backlog.
New Policies to Control Overhead

Tracking Backlog Progress Since 2005

Build Strategically

Sample: Nearly Double Peers’ Users
7,500More users on campus versus peer campuses
Liberal Arts Comprehensive University Urban/City School Community College
Users/100K GSF

Insufficient Classroom Space?
0%10%20%30%40%50%60%70%80%90%
100%
%
Room Utilization – General Classrooms
Room Utilization
Difficult Scheduling During Most of Day

Functional Obsolescence is the Real IssueMany Small Courses, Few Small Rooms
0% 2%
43%
38%
17%
44%
23%
29%
4% 1%
41%
23%27%
9%0%
0%
5%
10%
15%
20%
25%
30%
35%
40%
45%
50%
0-25 26-30 31-35 36-40 40+
Distribution of Rooms
Room Capacity Fall '13 Enrollment Spring '14 Enrollment

Build Strategically

Technical Assessment
Project Selection
Traditional Facilities Assessment
Today: No Integration in the Process
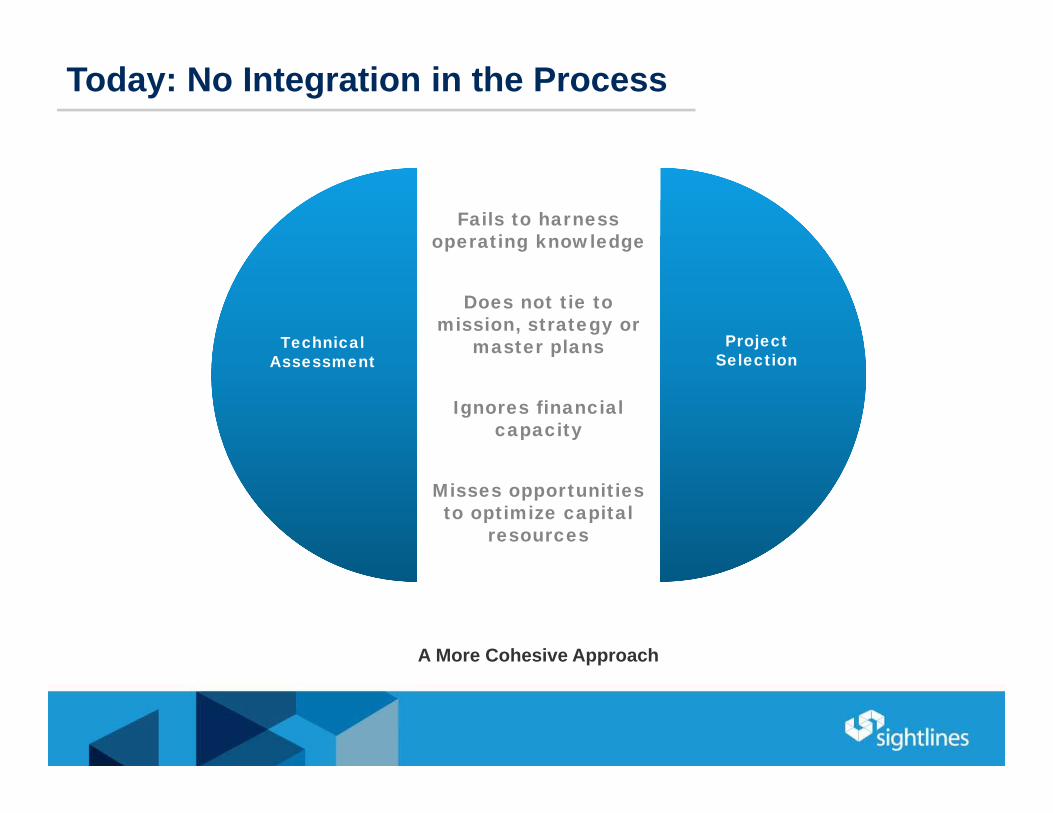
Fails to harness operating knowledge
Does not tie to mission, strategy or
master plans
Ignores financial capacity
Misses opportunities to optimize capital
resources
A More Cohesive Approach
Technical Assessment
Project Selection
Today: No Integration in the Process

Tie to Operations, Mission & Finance
Technical Assessment: Conduct Building walk-throughs and component inventory to develop initial list of needs.
Step 1: Integrate Technical NeedsIntegrate operational perspective to target inspections and reduce overall capital needs
Step 2: Create Building PortfoliosSegment the backlog and tie projects to mission and institutional strategy
Step 3: Develop Multi-year Capital PlanCreate outcome based strategies by portfolio
Step 4: Project SectionPick projects that support mission, operations, and financial capacity

Example: Blended Functional and Investment Portfolios
Aligning needs with funding opportunities
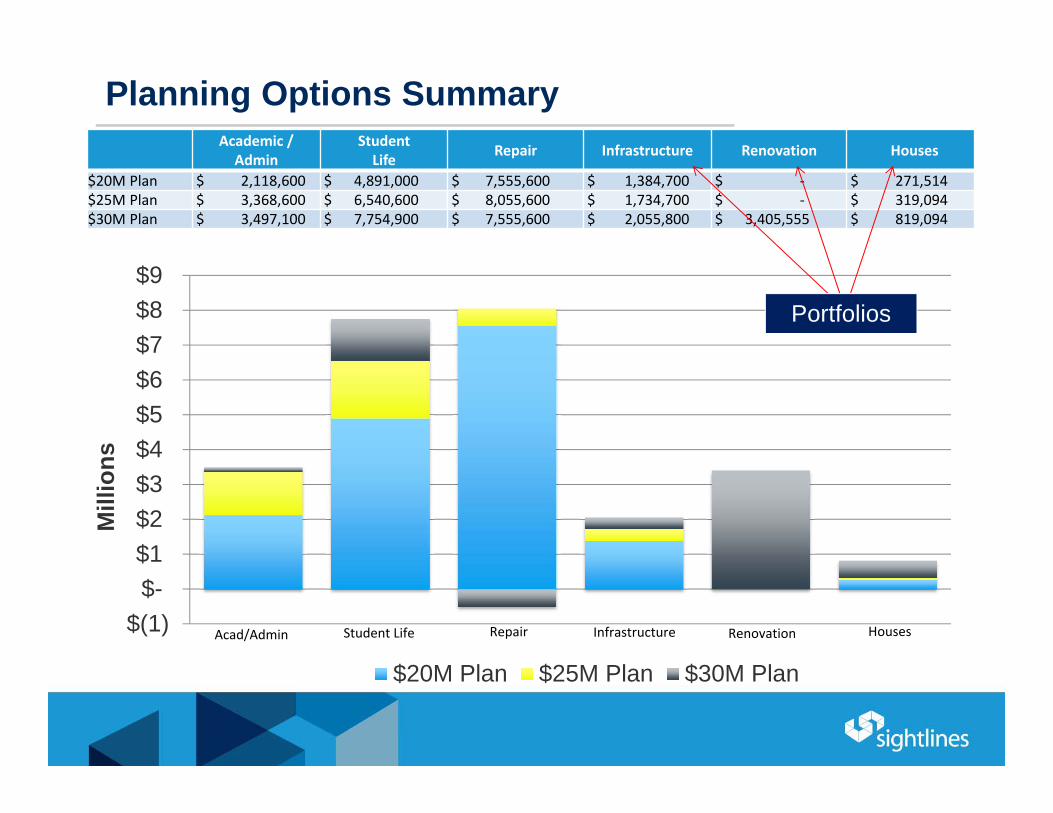
Academic / Admin
Student Life Repair Infrastructure Renovation Houses
$20M Plan $ 2,118,600 $ 4,891,000 $ 7,555,600 $ 1,384,700 $ ‐ $ 271,514 $25M Plan $ 3,368,600 $ 6,540,600 $ 8,055,600 $ 1,734,700 $ ‐ $ 319,094 $30M Plan $ 3,497,100 $ 7,754,900 $ 7,555,600 $ 2,055,800 $ 3,405,555 $ 819,094
$(1) $- $1 $2 $3 $4 $5 $6 $7 $8 $9
Mill
ions
$20M Plan $25M Plan $30M Plan
Acad/Admin Student Life Repair Infrastructure Renovation Houses
Planning Options Summary
Portfolios

Look Ahead

25% 31%21%
45%45%
23%
31% 24%
34%
22%
0%
10%
20%
30%
40%
50%
60%
70%
80%
90%
100%
ConstructionAge
RenovationAge
Peer RenovationAge
Buildings Under 10Little work, “honeymoon”
period.Low Risk
Buildings 10 to 25Lower cost space renewal updates and initial signs of
program pressures Medium Risk
Buildings 25 to 50Life cycles are coming due in envelope
and mechanical systems. Functional obsolescence prevalent.
Higher Risk
Buildings over 50Life cycles of major building components are
past due. Failures are possible. Core modernization cycles are missed.
Highest risk
Unique Campus Age Profile
Under 10 10 to 25 25 to 50 Over 50
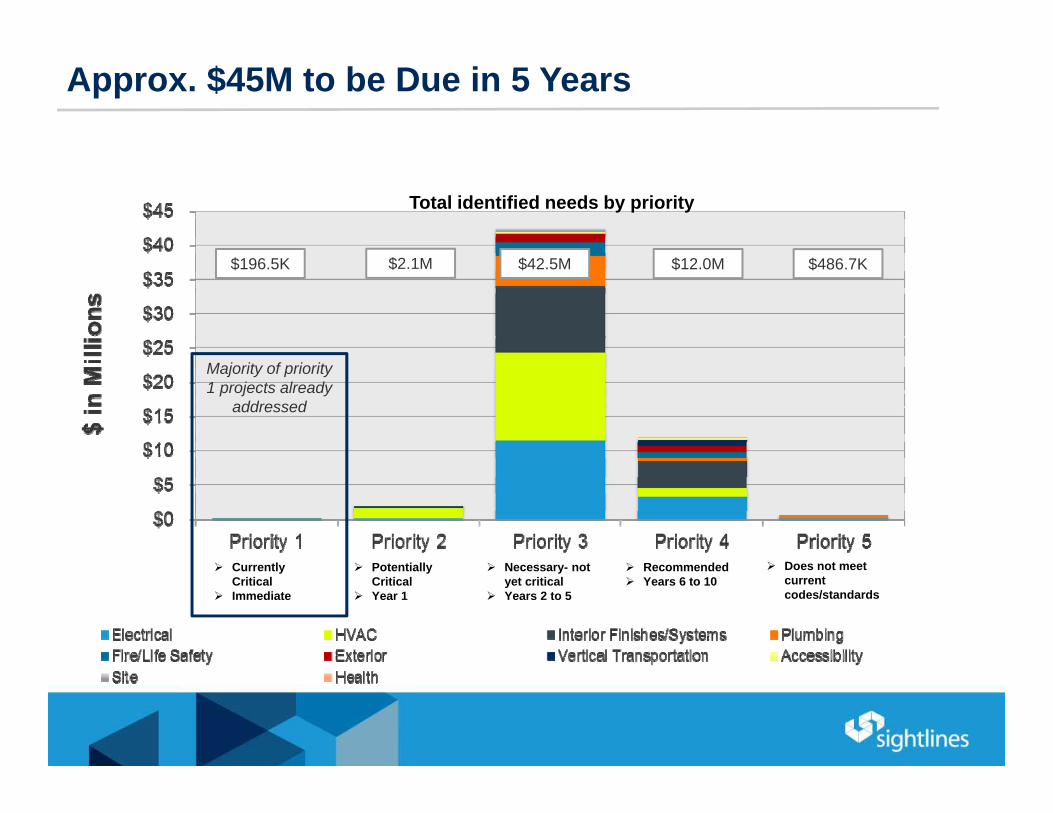
Approx. $45M to be Due in 5 Years
Currently Critical
Immediate
Potentially Critical
Year 1
Necessary- not yet critical
Years 2 to 5
Recommended Years 6 to 10
Does not meet current codes/standards
$196.5K
Total identified needs by priority
$2.1M $42.5M $12.0M $486.7K
Majority of priority 1 projects already
addressed

10 Year Capital Renewal Curve

10-Year Needs vs. Investment Capacity
$0
$5
$10
$15
$20
$25
$30
Tota
l Dol
lars
(Mill
ions
)
10 Year Total Capital Need by Year
$107$120
$23
$100
$0
$50
$100
$150
$200
$250
Total 10 Year Need ProjectedInvestmentCapacity
Tota
l Dol
lars
(Mill
ions
)
10 Year Total Capital Need & Capacity

Keep Up
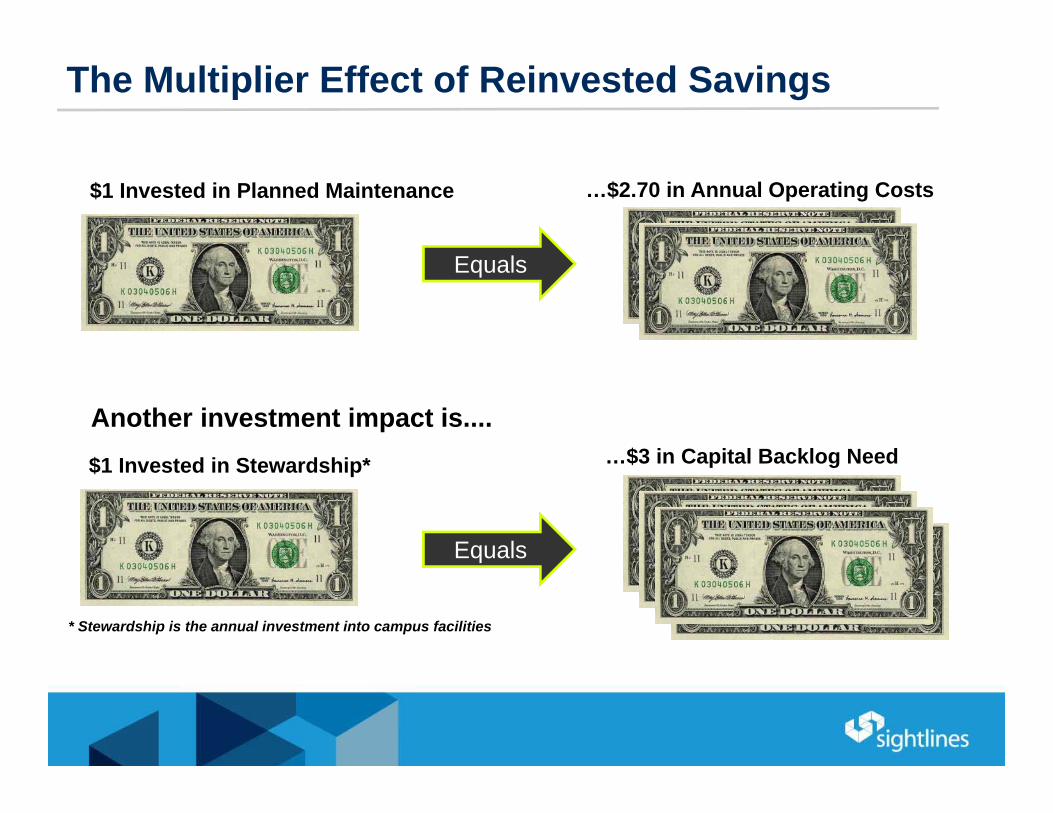
The Multiplier Effect of Reinvested Savings
* Stewardship is the annual investment into campus facilities
$1 Invested in Stewardship* …$3 in Capital Backlog Need
Equals
…$2.70 in Annual Operating Costs
Equals
$1 Invested in Planned Maintenance
Another investment impact is....

Reward Savings

Low Energy Consumption Keeps DroppingIncrease in PM supports lower energy consumption
Regional Peer Avg.
Regional Peer Avg.
Among the top 10% of lowest consuming institutions in Sightlines’
database

Increasing Focus on Systems, Envelope, & Infrastructure
0.0
0.5
1.0
1.5
2.0
2.5
3.0
3.5
4.0
FY08 FY09 FY10 FY11 FY12
$/G
SF
Project Spending $/GSF
“The State of Facilities in Higher Education”Sightlines’ annual publication on broad industry trends
Questions & Discussion