the state of mobile gaming 2021 - sensor tower
TRANSCRIPT

The State of Mobile Gaming 2021— An Analysis of Mobile Gaming Market Trends and Top Titles in the U.S., Europe, and Asia

© 2021 Sensor Tower Inc. - All Rights Reserved
Table of Contents 03 - Market Overview: Worldwide 15 - Market Overview: United States 21 - Market Overview: Europe 32 - Market Overview: Asia 43 - Market Forecast 49 - Game Genre Trends 57 - Monetization Trends 64 - Advertising Trends 73 - Conclusion

— An Overview of Mobile Gaming Worldwide
Market Overview: Worldwide

$0
$5B
$10B
$15B
$20B
$25B
Q1 2018
Q2 2018
Q3 2018
Q4 2018
Q1 2019
Q2 2019
Q3 2019
Q4 2019
Q1 2020
Q2 2020
Q3 2020
Q4 2020
Q1 2021
$9.2B$8.6B$8.4B
$8.1B
$7.0B
$6.5B$6.5B
$6.1B$6.0B$5.7B$5.4B
$5.3B$5.2B
$13.0B$12.4B$12.4B$12.1B$10.8B
$9.9B$10.0B$9.1B$9.0B$8.4B$8.2B$7.8B$7.9B
App Store Google Play
Global Game Revenue Surged During the Pandemic
Mobile game revenue spiked during the start of the COVID-19 pandemic, seeing its largest year-over-year growth in Q2 2020 at 33 percent. Games earned more than $20 billion globally for the first time that quarter.
Strong revenue growth continued in the following quarters. The 25 percent Y/Y growth in Q1 2021 easily outpaced the growth during the prior two years.
Market Overview: Worldwide
Worldwide quarterly consumer spending in mobile games on the App Store and Google Play
+16%
+25%
4
© 2021 Sensor Tower Inc. - All Rights Reserved
+18%
Note: Revenue figures are gross revenue (including the cut taken by Apple or Google).

Genshin Impact Shakes Up the Global Revenue Ranking and Eyes Tencent’s Top TitlesTop mobile games by worldwide revenue on the App Store and Google Play
5
© 2021 Sensor Tower Inc. - All Rights Reserved
-
-3
-
-
NEW
-
NEW
1
2
3
4
5
6
7
8
9
10
-
-3
-
1
2
3
4
5
6
7
8
9
10 -2
NEW
-1
-1
NEW
-
-
+1
-
-2
-7
NEW
-2
NEW
+3
-1
+11
2
3
4
5
6
7
8
9
10
NEW
NEW
-2
1
2
3
4
5
6
7
8
9
10
Honor of Kings Tencent
Monster Strike Mixi
Fate/Grand Order Sony
Candy Crush Saga King
LineageM NCSOFT
Pokémon GO Niantic
Fantasy WW Journey NetEase
DBZ Dokkan Battle BANDAI NAMCO
Clash of Clans Supercell
Clash Royale Supercell
PUBG Mobile Tencent
Honor of Kings Tencent
Pokémon GO Niantic
Coin Master Moon Active
Roblox Roblox
Candy Crush Saga King
Monster Strike Mixi
Rise of Kingdoms Lilith Games
Gardenscapes Playrix
Fate/Grand Order Sony
PUBG Mobile Tencent
Honor of Kings Tencent
Genshin Impact miHoYo
Pokémon GO Niantic
Roblox Roblox
Coin Master Moon Active
Candy Crush Saga King
Garena Free Fire Garena
Fate/Grand Order Sony
Rise of Kingdoms Lilith Games
Honor of Kings Tencent
PUBG Mobile Tencent
Fate/Grand Order Sony
Candy Crush Saga King
Monster Strike Mixi
Pokémon GO Niantic
Fantasy WW Journey NetEase
LineageM NCSOFT
Clash of Clans Supercell
Homescapes Playrix
2018 2019 2020 1Q21
Market Overview: Worldwide

$0
$1B
$2B
$3B
$4B
$5B
$6B
$7B
Q1 2017
Q2 2017
Q3 2017
Q4 2017
Q1 2018
Q2 2018
Q3 2018
Q4 2018
Q1 2019
Q2 2019
Q3 2019
Q4 2019
Q1 2020
Q2 2020
Q3 2020
Q4 2020
Q1 2021
Top countries by mobile game spending, App Store and Google Play
The U.S. Remains the Top Market for Mobile Game Spending
The U.S. remains the top market for mobile games having outpaced Japan in Q2 2019, and surpassed $6 billion in revenue during Q1 2021. COVID-19 boosted player spending 35 percent Q/Q in Q2 2020. Although revenue fell slightly over the next two quarters, growth picked back up again in Q1 2021.
Japan and China were the next largest markets, well ahead of any other countries. Japan’s revenue climbed 35 percent Y/Y in Q1 2021, while China’s total in particularly impressive considering Google Play is not available in the country.
6
© 2021 Sensor Tower Inc. - All Rights Reserved
U.S. Japan China South Korea Taiwan
U.S. +34% Y/Y
China +6% Y/Y
Japan +35% Y/Y
South Korea +16% Y/Y
Taiwan +23% Y/Y
Market Overview: Worldwide
Note: Revenue figures are gross revenue (including the cut taken by Apple or Google). China numbers only include the App Store as Google Play is not available there.

Market share for top countries by mobile game spending, App Store and Google Play
The U.S. is Also Gaining Market Share for Revenue
The U.S. passed Japan to become the largest mobile games market in 2019. Its market share has continued to grow since, reaching 28 percent in 2020.
Countries outside of the top five have also slowly gained market share, suggesting that mobile game publishers have turned to less-tapped markets with higher growth potential.
7
© 2021 Sensor Tower Inc. - All Rights Reserved
Market Overview: Worldwide
Note: Revenue figures are gross revenue (including the cut taken by Apple or Google). China numbers only include the App Store as Google Play is not available there.
2017
2018
2019
2020
0% 25% 50% 75% 100%
23%
22%
22%
21%
3%
3%
3%
2%
7%
6%
6%
7%
18%
20%
19%
21%
22%
23%
26%
26%
28%
26%
24%
23%
U.S. Japan China South Korea Taiwan Other

Top countries by Y/Y mobile game spending growth in Q1 2021, App Store and Google Play
Spending Grew by More than $1 Billion in the U.S. and Japan
Consumer spending in mobile games in the U.S. grew by more than $1.5 billion Y/Y in Q1 2021. This growth was more than all but Japan and China earned in total during the quarter.
The top countries by growth included four of the top five countries by overall revenue. The one exception was Germany, the top country in Europe, with 33 percent Y/Y growth to nearly $600 million.
8
© 2021 Sensor Tower Inc. - All Rights Reserved
Market Overview: Worldwide
$0
$1B
$2B
$3B
$4B
$5B
$6B
$7B
U.S.
Japan
China
South Korea
Germany
$593M
$1.5B
$3.9B
$5.2B
$6.1B
$445M
$1.3B
$3.6B$3.8B
$4.6B
Q1 2020 Q1 2021
+34%
+35%
+6%
+16%
+33%
Note: Top growing countries are determined and sorted by the difference in gross revenue in Q1 2021 vs. Q1 2020, not percentage growth.
Note: Revenue figures are gross revenue (including the cut taken by Apple or Google). China numbers only include the App Store as Google Play is not available there.

0
2B
4B
6B
8B
10B
12B
14B
16B
Q1 2018
Q2 2018
Q3 2018
Q4 2018
Q1 2019
Q2 2019
Q3 2019
Q4 2019
Q1 2020
Q2 2020
Q3 2020
Q4 2020
Q1 2021
11.8B11.5B
11.8B12.4B
10.4B
8.8B8.7B8.2B
7.5B7.2B7.2B7.8B7.1B
2.3B2.1B2.3B2.7B3.0B2.3B2.4B2.2B2.2B2.1B2.3B2.1B2.4B
App Store Google Play
Mobile Game Adoption Soared 39% Amid the Pandemic
The surge in mobile game downloads preceded that for revenue, with big gains starting in Q1 2020 right at the beginning of the pandemic. Consumers turned to mobile games for entertainment during office and school closures.
Although mobile game adoption has slowed since the peak in Q2 2020, it remained well above pre-pandemic levels. This suggests that some of the gains may persist even as countries begin to re-open in 2021.
Market Overview: Worldwide
Worldwide quarterly downloads of mobile games on the App Store and Google Play
+1%
+5%
9
© 2021 Sensor Tower Inc. - All Rights Reserved
+39%

Hypercasual and Shooter Titles Frequent the Top 10 for DownloadsTop mobile games by worldwide downloads on the App Store and Google Play
10
© 2021 Sensor Tower Inc. - All Rights Reserved
NEW
NEW
NEW
-
NEW
+1
NEW
1
2
3
4
5
6
7
8
9
10
NEW
NEW
NEW
1
2
3
4
5
6
7
8
9
10 NEW
NEW
-4
NEW
NEW
-1
NEW
NEW
-3
NEW
-
NEW
NEW
-3
-
-
NEW1
2
3
4
5
6
7
8
9
10
NEW
NEW
NEW
1
2
3
4
5
6
7
8
9
10
Helix Jump Voodoo
PUBG Mobile Tencent
Subway Surfers Sybo Games
Garena Free Fire Garena
Rise Up Serkan Ozyilmaz
Love Balls Lion Studios
Candy Crush Saga King
Sniper 3D Wildlife Studios
Kick the Buddy Playgendary
My Talking Tom Outfit7
Among Us InnerSloth
Garena Free Fire Garena
Subway Surfers Sybo Games
PUBG Mobile Tencent
Hunter Assassin Ruby Game Studio
Gardenscapes Playrix
Brain Out Focus Apps
Ludo King Gametion
Tiles Hop Amanotes
Homescapes Playrix
Join Clash 3D Supersonic Studios
Among Us InnerSloth
DOP 2 SayGames
Phone Case DIY Crazy Labs
Garena Free Fire Garena
High Heels Zynga
Subway Surfers Sybo Games
Water Sort Puzzle Ice Global
Project Makeover Magic Tavern
Giant Rush Tapnation
PUBG Mobile Tencent
Garena Free Fire Garena
Subway Surfers Sybo Games
Fun Race 3D Good Job Games
Color Bump 3D Good Job Games
Call of Duty: Mobile Activision Blizzard
My Talking Tom 2 Outfit7
Run Race 3D Good Job Games
Sand Balls SayGames
Homescapes Playrix
2018 2019 2020 1Q21
Market Overview: Worldwide
ShooterHypercasual

0
1B
2B
3B
Q1 2017
Q2 2017
Q3 2017
Q4 2017
Q1 2018
Q2 2018
Q3 2018
Q4 2018
Q1 2019
Q2 2019
Q3 2019
Q4 2019
Q1 2020
Q2 2020
Q3 2020
Q4 2020
Q1 2021
Top countries by mobile game downloads, App Store and Google Play
India’s Mobile Games Market Pulled Away from the Pack
As smartphone penetration in India increased in recent years, it has become the largest market for mobile game downloads. COVID-19 boosted game adoption in the market by 64 percent from 1.7 billion in Q1 2020 to 2.9 billion in Q3 2020.
Emerging markets such as India, Brazil, and Russia achieved double-digit year-over-year download growth in Q1 2021. Meanwhile, relatively mature mobile markets like the U.S. had lower growth.
11
© 2021 Sensor Tower Inc. - All Rights Reserved
India U.S. Brazil Indonesia Russia
India +28% Y/Y
Brazil +10% Y/Y
U.S. -7% Y/Y
Indonesia +6% Y/Y
Russia +16% Y/Y
Market Overview: Worldwide

Market share for top countries by mobile game downloads, App Store and Google Play
India Accounted for 12 Percent of Game Downloads in 2020
India became the only country to gain more than 10 percent of the global game install market since 2017 in 2020, reaching 12 percent of downloads. The U.S. was next with 7 percent, followed by Brazil at 6 percent.
While 77 percent of mobile game revenue in 2020 was concentrated among the five largest markets, the top five countries by downloads combined for only 32 percent of the installs. This demonstrates how getting users to spend in mobile games remains more challenging than new user adoption in most markets.
12
© 2021 Sensor Tower Inc. - All Rights Reserved
Market Overview: Worldwide
2017
2018
2019
2020
0% 25% 50% 75% 100%
68%
71%
70%
70%
4%
4%
4%
4%
4%
3%
3%
3%
6%
5%
5%
6%
7%
8%
8%
9%
12%
9%
9%
8%
India U.S. Brazil Indonesia Russia Other

Top countries by Y/Y mobile game download growth in Q1 2021, App Store and Google Play
Google Play Drove Download Growth in Top Markets
Game downloads in India climbed by nearly half a billion year-over-year in Q1 2021. Indonesia, Mexico, and Brazil also saw downloads grow by more than 100 million.
Each of the top five countries by download growth had at least 90 percent of their installs from Google Play, with less than 10 percent from the App Store. This reflected the trends on each platform, as Google Play installs climbed 66 percent between Q1 2018 and Q1 2021, while App Store download growth was flat over this period.
13
© 2021 Sensor Tower Inc. - All Rights Reserved
Market Overview: Worldwide
0
500M
1.0B
1.5B
2.0B
2.5B
India
Indonesia
Mexico
Brazil
Philippines
351M
1.2B
604M790M
2.2B
269M
1.1B
493M628M
1.7B
Q1 2020 Q1 2021
+28%
+26%
+23%
+10%
+31%
Note: Top growing countries are determined and sorted by the difference in downloads in Q1 2021 vs. Q1 2020, not percentage growth.

© 2021 Sensor Tower Inc. - All Rights Reserved
Key Takeaways: Worldwide
1. The mobile games market is booming, as game revenue growth accelerated during the pandemic. Consumer spending surpassed $22 billion in Q1 2021, representing an all-time high and 25 percent year-over-year growth.
2. Mobile game downloads also surged during the pandemic. This was primarily led by developing markets like India and Brazil.
3. While more than two-thirds of mobile game revenue comes from just three countries (the U.S., Japan, and China), growth in some smaller markets in Europe and Southeast Asia have exceeded that in these largest markets. It is unlikely that any other country will compete with the top three anytime soon. However, these fast-growing alternatives will provide opportunities for game developers looking to expand to new regions.
14

Market Overview: United States— An Overview of Mobile Gaming in the U.S.

$0
$1B
$2B
$3B
$4B
$5B
$6B
$7B
Q1 2018
Q2 2018
Q3 2018
Q4 2018
Q1 2019
Q2 2019
Q3 2019
Q4 2019
Q1 2020
Q2 2020
Q3 2020
Q4 2020
Q1 2021
$2.8B$2.6B$2.6B
$2.6B
$1.9B$1.9B$1.8B
$1.8B$1.7B
$1.6B$1.4B$1.3B
$1.2B
$3.3B$3.2B$3.3B$3.5B
$2.6B$2.4B$2.3B$2.2B$2.1B$2.0B$1.9B$1.8B$1.7B
App Store Google Play
U.S. Game Revenue Growth Outpaced the Global Rate
U.S. mobile game consumer spending surpassed $6 billion for only the second time in Q1 2021, just below the $6.1 billion spent in Q2 2020. There was a notable increase at the start of the pandemic that persisted into 2021.
The U.S. is still the top market for mobile gaming. Its revenue has more than doubled since the start of 2018, higher growth than the worldwide rate.
Market Overview: U.S.
U.S. quarterly gross revenue from mobile games on the App Store and Google Play
+28%
+34%
16
© 2021 Sensor Tower Inc. - All Rights Reserved
+22%
Note: Revenue figures are gross revenue (including the cut taken by Apple or Google).

Roblox Became the Top Grossing Mobile Game in the U.S. in 2020 Top mobile games by U.S. revenue on the App Store and Google Play
17
© 2021 Sensor Tower Inc. - All Rights Reserved
-2
NEW
-1
+1
+5
-
-2
1
2
3
4
5
6
7
8
9
10
-7
NEW
+4
1
2
3
4
5
6
7
8
9
10 NEW
NEW
NEW
NEW
-
-
-
-4
-1
-
NEW
-1
-4
-
+2
-1
+11
2
3
4
5
6
7
8
9
10
-1
NEW
-
1
2
3
4
5
6
7
8
9
10
Candy Crush Saga King
Fortnite Epic Games
Pokémon GO Niantic
Clash of Clans Supercell
Slotomania Playtika
Candy Crush Soda Saga King
Roblox Roblox
Toon Blast Peak Games
Final Fantasy XV Epic Action
Homescapes Playrix
Roblox Roblox
Candy Crush Saga King
Coin Master Moon Active
Pokémon GO Niantic
Gardenscapes Playrix
Homescapes Playrix
Clash of Clans Supercell
Slotomania Playtika
PUBG Mobile Tencent
Call of Duty: Mobile Activision Blizzard
Roblox Roblox
Candy Crush Saga King
Coin Master Moon Active
Lords Mobile IGG
Pokémon GO Niantic
Homescapes Playrix
Garena Free Fire Garena
Genshin Impact miHoYo
Gardenscapes Playrix
State of Survival FunPlus
Candy Crush Saga King
Roblox Roblox
Clash of Clans Supercell
Pokémon GO Niantic
Coin Master Moon Active
Homescapes Playrix
Slotomania Playtika
PUBG Mobile Tencent
Fortnite Epic Games
Toon Blast Peak Games
2018 2019 2020
Market Overview: U.S.
1Q21

0
500M
1.0B
1.5B
Q1 2018
Q2 2018
Q3 2018
Q4 2018
Q1 2019
Q2 2019
Q3 2019
Q4 2019
Q1 2020
Q2 2020
Q3 2020
Q4 2020
Q1 2021
640M623M
628M
682M645M
596M601M560M
544M560M546M588M
606M
665M647M698M
761M756M674M650M629M
576M548M522M510M535M
App Store Google Play
U.S. Game Installs Fell Slightly From a Mid-Pandemic Peak
While U.S. mobile game revenue remained high each quarter during the pandemic, downloads fell off from their peak in the first few quarters of the pandemic. Q1 2021 downloads were still slightly higher than the pre-pandemic quarters.
Download growth had started to pick up in 2019 even before the spread of COVID-19. Quarter-over-quarter growth in Q1 2021 also shows promise for the upcoming quarters.
U.S. quarterly downloads from mobile games on the App Store and Google Play
-2%
-7%
18
© 2021 Sensor Tower Inc. - All Rights Reserved
+25%
Market Overview: U.S.

Top Apps by U.S. Downloads Included Many New LaunchesTop mobile games by U.S. downloads on the App Store and Google Play
19
© 2021 Sensor Tower Inc. - All Rights Reserved
NEW
+1
NEW
NEW
NEW
NEW
NEW
1
2
3
4
5
6
7
8
9
10
NEW
NEW
NEW
1
2
3
4
5
6
7
8
9
10 -7
NEW
NEW
-2
-2
NEW
NEW
NEW
NEW
NEW
NEW
NEW
NEW
NEW
-2
+3
NEW1
2
3
4
5
6
7
8
9
10
NEW
NEW
NEW
1
2
3
4
5
6
7
8
9
10
Helix Jump Voodoo
Fortnite Epic Games
PUBG Mobile Tencent
Rise Up Serkan Ozyilmaz
Hole.io Voodoo
Roblox Roblox
Love Balls Lion Studios
Happy Glass Lion Studios
Granny DVloper
Hello Stars Fastone Games
Among Us InnerSloth
Roblox Roblox
Call of Duty: Mobile Activision Blizzard
Subway Surfers Sybo Games
Brain Test Unico Studios
Coin Master Moon Active
Magic Tiles 3 Amanotes
Fishdom Playrix
Woodturning Voodoo
Tangle Master 3D Zynga
Project Makeover Magic Tavern
High Heels Zynga
Among Us InnerSloth
Roblox Roblox
Crash Bandicoot: OTR King
Blob Runner 3D Zynga
Giant Rush Tapnation
Sushi Roll 3D SayGames
Oh God Alictus
Call of Duty: Mobile Activision Blizzard
Call of Duty: Mobile Activision Blizzard
Color Bump 3D Good Job Games
Aquapark.io Voodoo
Mario Kart Tour Nintendo
Roblox Roblox
Wordscapes PeopleFun
Fun Race 3D Good Job Games
Run Race 3D Good Job Games
Mr Bullet Lion Studios
Polysphere Playgendary
2018 2019 2020
Market Overview: U.S.
1Q21

© 2021 Sensor Tower Inc. - All Rights Reserved
Key Takeaways: U.S.
1. The U.S. was already the largest market for mobile games revenue and looks to likely hold this position for the foreseeable future. U.S. game revenue growth has exceeded the worldwide rate for each of the past three years, reaching 34 percent Y/Y growth in Q1 2021.
2. While game revenue continues to climb, expect more modest growth for U.S. mobile game adoption. U.S. game installs have mostly fallen off from the spike seen early in the pandemic. However, steady growth in 2019 plus a strong Q1 2021 suggests that the market may still see steady growth in the coming quarters.
3. The COVID-19 pandemic revealed how games can benefit from having a strong social component. Many multiplayer games like Roblox and Among Us had a breakthrough year in 2020.
20

— An Overview of Mobile Gaming in Europe
Market Overview: Europe

$0
$1B
$2B
$3B
Q1 2018
Q2 2018
Q3 2018
Q4 2018
Q1 2019
Q2 2019
Q3 2019
Q4 2019
Q1 2020
Q2 2020
Q3 2020
Q4 2020
Q1 2021
$1.5B$1.5B
$1.4B$1.4B
$1.2B$1.1B
$1.1B$1.0B$991M$961M$931M
$869M$875M
$1.2B$1.1B$1.0B$1.1B
$905M$891M$845M$785M$754M$757M$732M$704M$696M
App Store Google Play
The Pandemic Accelerated Europe’s Game Revenue Growth
Mobile game consumer spending in Europe reached $2.7 billion in Q1 2021, an all-time high and up 27 percent year-over-year. Revenue was boosted during the pandemic, though to a lesser extent than in the U.S.
Growth was similar on both platforms, with App Store revenue up 28 percent Y/Y in Q1 2021 compared to 27 percent Y/Y growth on Google Play. Google Play still took the majority of spending between the two platforms.
Market Overview: Europe
Europe quarterly gross revenue from mobile games on the App Store and Google Play
+11%
+27%
22
© 2021 Sensor Tower Inc. - All Rights Reserved
+21%
Note: Revenue figures are gross revenue (including the cut taken by Apple or Google).

Coin Master Led All Mobile Games In EuropeTop mobile games by Europe revenue on the App Store and Google Play
23
© 2021 Sensor Tower Inc. - All Rights Reserved
-3
-2
NEW
+2
-1
NEW
-8
1
2
3
4
5
6
7
8
9
10
+1
-
+1
1
2
3
4
5
6
7
8
9
10 NEW
-3
+1
+6
+3
+1
-
-2
-3
-2
NEW
-2
-5
+1
NEW
+2
-1
2
3
4
5
6
7
8
9
10
-6
+2
NEW
1
2
3
4
5
6
7
8
9
10
Candy Crush Saga King
Clash Royale Supercell
Gardenscapes Playrix
Pokémon GO Niantic
Clash of Clans Supercell
Lords Mobile IGG
Homescapes Playrix
Empires & Puzzles Small Giant Games
Candy Crush Soda Saga King
Guns of Glory FunPlus
Coin Master Moon Active
Brawl Stars Supercell
PUBG Mobile Tencent
Gardenscapes Playrix
Pokémon GO Niantic
Roblox Roblox
Candy Crush Saga King
Homescapes Playrix
Clash of Clans Supercell
State of Survival FunPlus
Coin Master Moon Active
PUBG Mobile Tencent
Roblox Roblox
State of Survival FunPlus
Brawl Stars Supercell
Gardenscapes Playrix
Homescapes Playrix
Pokémon GO Niantic
Candy Crush Saga King
Lords Mobile IGG
Coin Master Moon Active
Candy Crush Saga King
Clash of Clans Supercell
Brawl Stars Supercell
Gardenscapes Playrix
Homescapes Playrix
Pokémon GO Niantic
Empires & Puzzles Small Giant Games
Guns of Glory FunPlus
Clash Royale Supercell
2018 2019 2020
Market Overview: Europe
1Q21
$0
$100M
$200M
$300M
$400M
$500M
$600M
Q1 2017
Q2 2017
Q3 2017
Q4 2017
Q1 2018
Q2 2018
Q3 2018
Q4 2018
Q1 2019
Q2 2019
Q3 2019
Q4 2019
Q1 2020
Q2 2020
Q3 2020
Q4 2020
Q1 2021
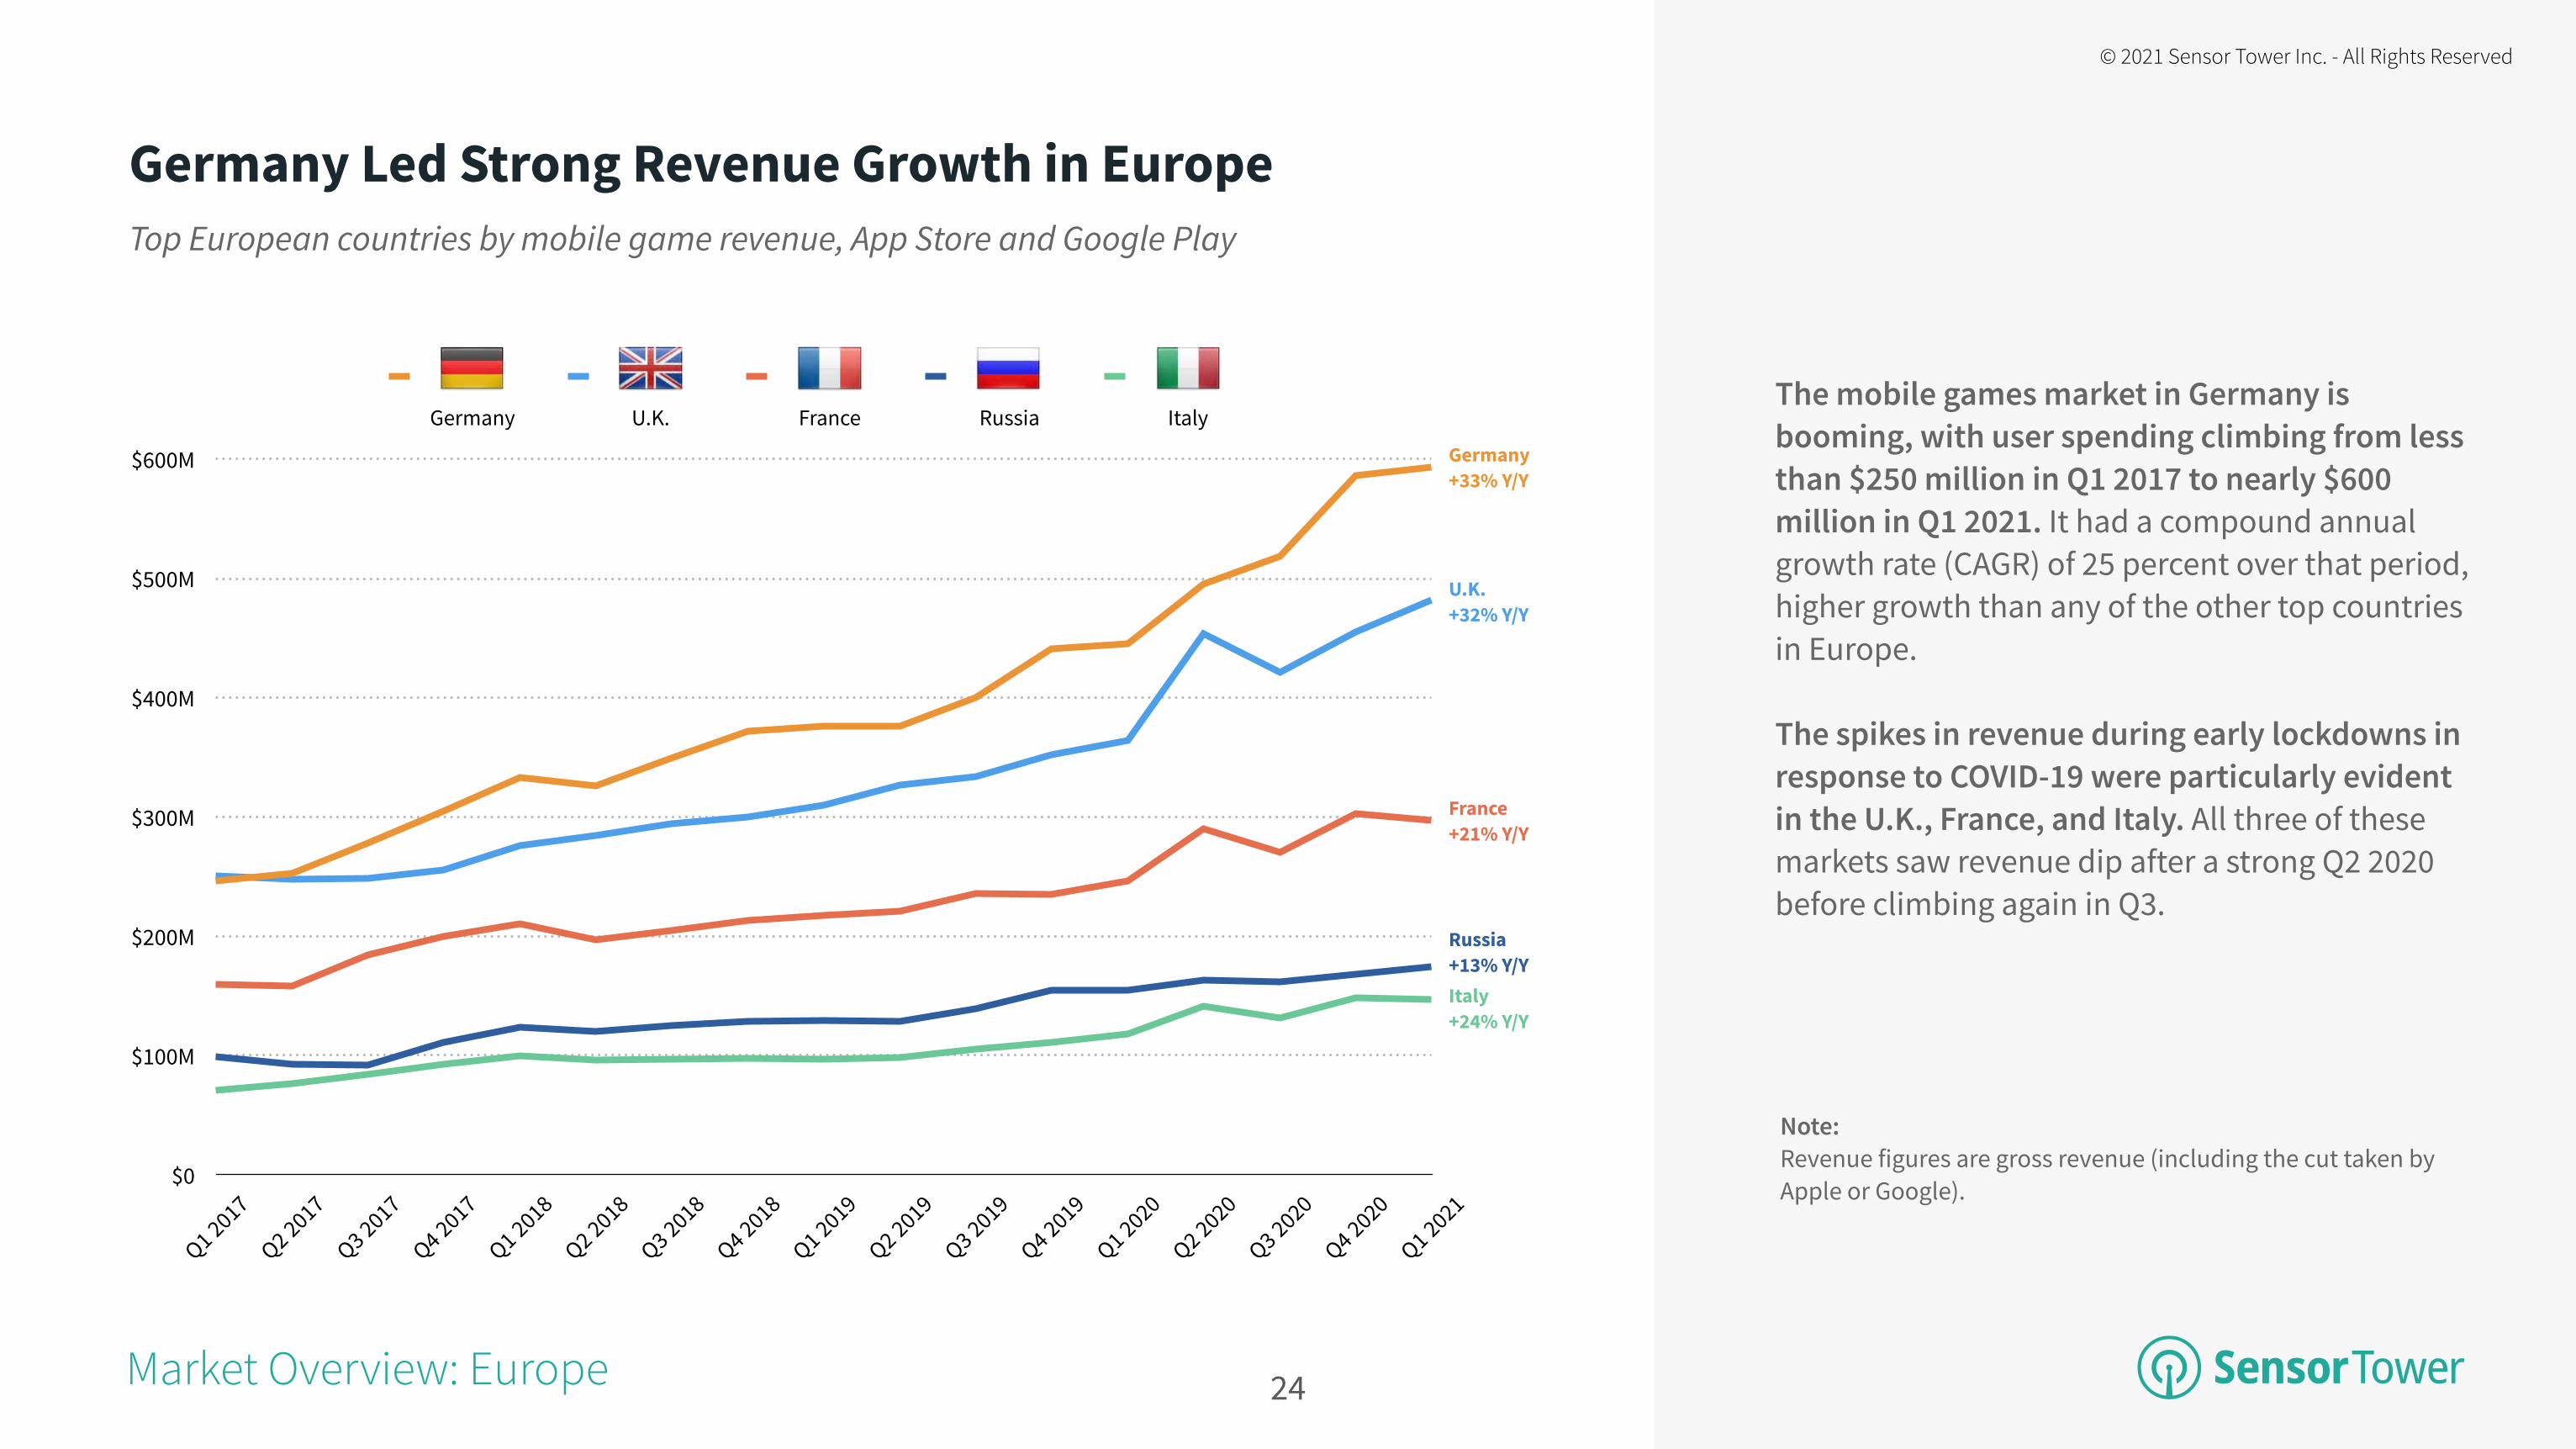
Top European countries by mobile game revenue, App Store and Google Play
Germany Led Strong Revenue Growth in Europe
The mobile games market in Germany is booming, with user spending climbing from less than $250 million in Q1 2017 to nearly $600 million in Q1 2021. It had a compound annual growth rate (CAGR) of 25 percent over that period, higher growth than any of the other top countries in Europe.
The spikes in revenue during early lockdowns in response to COVID-19 were particularly evident in the U.K., France, and Italy. All three of these markets saw revenue dip after a strong Q2 2020 before climbing again in Q3.
24
© 2021 Sensor Tower Inc. - All Rights Reserved
Germany U.K. France Russia Italy
Germany +33% Y/Y
France +21% Y/Y
U.K. +32% Y/Y
Russia +13% Y/YItaly +24% Y/Y
Market Overview: Europe
Note: Revenue figures are gross revenue (including the cut taken by Apple or Google).

Top European countries by Y/Y game revenue growth in Q1 2021, App Store and Google Play
Germany and the U.K. Saw Substantial Y/Y Revenue Growth
Germany’s mobile game revenue grew by nearly $150 million Y/Y in Q1 2021, followed by the U.K. at $118 million and France at $51 million. No other country in Europe had Y/Y/ growth of more than $40 million.
Switzerland, a smaller market in Europe, was among the top five by revenue growth with 38 percent Y/Y growth. Netherlands just missed the top five with revenue climbing by $26 million Y/Y, or 39 percent.
25
© 2021 Sensor Tower Inc. - All Rights Reserved
$0
$100M
$200M
$300M
$400M
$500M
$600M
Germany United Kingdom France Switzerland
«
Italy
$147M$133M
$297M
$482M
$593M
$118M$96M
$246M
$364M
$445M
Q1 2020 Q1 2021+33%
+32%
+21%
+38%+24%
Market Overview: Europe
Note: Revenue figures are gross revenue (including the cut taken by Apple or Google).
Note: Top growing countries are determined and sorted by the difference in gross revenue in Q1 2021 vs. Q1 2020, not percentage growth.

Top games publishers by European revenue in 2020 on the App Store and Google Play
Top Publishers by European Revenue are Based in the Region
Two Europe-based publishers had the most revenue in Europe in 2020, with the popular puzzle and decorate developer Playrix and strategy game publisher Supercell leading the way. There were also two Israel-based publishers among the top 10.
Outside of Europe, publishers from the U.S. and China found the most success. Tencent and Roblox revenue in the region each grew by more than 100 percent.
26
© 2021 Sensor Tower Inc. - All Rights Reserved
$0
$100M
$200M
$300M
$400M
$500M
$600M
$700M
Playrix
Supercell
Activision Blizzard
Zynga
Moon Active
FunPlus
Tencent
Playtika
Niantic
Roblox
$204M$209M$209M$264M
$387M$398M$447M$463M
$571M$605M
$89M
$159M$174M$121M
$231M$214M
$413M$432M
$530M
$435M
2019 2020
+39%
+8%
+7%+8%
+86% +68%
+118%
+21% +31% +128%
Note: Revenue figures are gross revenue (including the cut taken by Apple or Google).
Market Overview: Europe

0
1B
2B
3B
4B
Q1 2018
Q2 2018
Q3 2018
Q4 2018
Q1 2019
Q2 2019
Q3 2019
Q4 2019
Q1 2020
Q2 2020
Q3 2020
Q4 2020
Q1 2021
2.7B2.5B
2.3B
2.6B2.6B
2.2B2.1B
1.9B2.0B1.9B1.8B1.8B
1.9B
556M545M536M616M673M603M575M531M539M531M520M492M547M
App Store Google Play
European Game Installs Approached the Early Pandemic Peak
Q1 2021 mobile game installs in Europe were down just one percent from their peak in Q1 2020 at the start of the coronavirus pandemic. Downloads were above the pre-pandemic high for the past five quarters, suggesting that a portion of the pandemic boost will likely persist.
The majority of game installs in Europe were from Google Play. Mobile game adoption on Google Play reached a new high in Q1 2021, while App Store downloads fell 17 percent Y/Y.
European quarterly downloads from mobile games on the App Store and Google Play
+3%
-1%
27
© 2021 Sensor Tower Inc. - All Rights Reserved
+28%
Market Overview: Europe

Many Hypercasual and Puzzle Titles Were Among the Top Games in EuropeTop mobile games by Europe downloads on the App Store and Google Play
28
© 2021 Sensor Tower Inc. - All Rights Reserved
NEW
NEW
NEW
NEW
NEW
NEW
-8
1
2
3
4
5
6
7
8
9
10
-4
NEW
NEW
1
2
3
4
5
6
7
8
9
10 NEW
+5
NEW
NEW
NEW
-1
NEW
-7
NEW
NEW
NEW
NEW
+2
NEW
NEW
-1
NEW1
2
3
4
5
6
7
8
9
10
NEW
+5
NEW
1
2
3
4
5
6
7
8
9
10
Helix Jump Voodoo
Subway Surfers Sybo Games
Love Balls Lion Studios
Rise Up Serkan Ozyilmaz
PUBG Mobile Tencent
Paper.io 2 Voodoo
Knife Hit Ubisoft
Kick the Buddy Playgendary
Happy Glass Lion Studios
Granny DVloper
Among Us InnerSloth
Brawl Stars Supercell
Gardenscapes Playrix
Brain Test Unico Studios
Subway Surfers Sybo Games
Roblox Roblox
PUBG Mobile Tencent
Brain Out Focus Apps
Woodturning Voodoo
Tiles Hop Amanotes
DOP 2 SayGames
Among Us InnerSloth
Phone Case DIY Crazy Labs
Join Clash 3D Supersonic Studios
Project Makeover Magic Tavern
Water Sort Puzzle Ice Global
Giant Rush Tapnation
Homescapes Playrix
Brawl Stars Supercell
Stacky Dash Supersonic Studios
Brawl Stars Supercell
Color Bump 3D Good Job Games
Fun Race 3D Good Job Games
Call of Duty: Mobile Activision Blizzard
Homescapes Playrix
Run Race 3D Good Job Games
Sand Balls SayGames
Aquapark.io Voodoo
PUBG Mobile Tencent
Subway Surfers Sybo Games
2018 2019 2020
Market Overview: Europe
1Q21

0
100M
200M
300M
400M
500M
600M
700M
800M
Q1 2017
Q2 2017
Q3 2017
Q4 2017
Q1 2018
Q2 2018
Q3 2018
Q4 2018
Q1 2019
Q2 2019
Q3 2019
Q4 2019
Q1 2020
Q2 2020
Q3 2020
Q4 2020
Q1 2021
Top European countries by mobile game downloads, App Store and Google Play
Russia and Turkey Drove European Game Downloads
Russia was the top European market in Q1 2021 with 758 million downloads, followed by Turkey at 537 million installs. This was more than double the No. 3 market, the U.K., which had 248 million downloads in the quarter.
Many of the top countries in Europe saw downloads decline year-over-year from the early pandemic highs in Q1 2020. Turkey was a notable exception with 17 percent Y/Y growth, and Germany also managed to experience slightly positive growth.
29
© 2021 Sensor Tower Inc. - All Rights Reserved
Russia Turkey U.K. Germany France
Russia -1% Y/Y
United Kingdom -7% Y/Y
Turkey +17% Y/Y
Germany +0.1% Y/YFrance -11% Y/Y
Market Overview: Europe

Top European countries by Y/Y game download growth in 1Q21, App Store and Google Play
Turkey Led Download Growth in Europe
As overall downloads in Europe decreased one percent year-over-year in Q1 2021, most countries saw little to no growth. Turkey was the exception, with downloads up by nearly 80 million.
The rest of the top countries by growth were smaller markets such as Ukraine, Portugal, and Ireland. Only eight countries in Europe had positive Y/Y growth in Q1 2021.
30
© 2021 Sensor Tower Inc. - All Rights Reserved
0
100M
200M
300M
400M
500M
600M
Turkey
Ukraine
Portugal
Ireland
Greece
33M16M43M
198M
537M
32M15M41M
196M
458M
Q1 2020 Q1 2021
+17%
+1%
+5% +7% +1%15M 16M
Market Overview: Europe
Note: Top growing countries are determined and sorted by the difference in downloads in Q1 2021 vs. Q1 2020, not percentage growth.

© 2021 Sensor Tower Inc. - All Rights Reserved
Key Takeaways: Europe
1. Mobile game revenue also accelerated in Europe in 2020, reaching a record $2.7 billion in Q1 2021 with 27 percent year-over-year growth. While this Y/Y growth was lower than in the U.S. (which saw a particularly pronounced boost from COVID-19), it was still slightly higher than the global growth rate.
2. Germany, the top European country by mobile game revenue, reached nearly $600 million in consumer spending in Q1 2021. Revenue growth was strong across top European markets, with the U.K., France, and Italy joining Germany with more than 20 percent Y/Y revenue growth in Q1 2021.
3. Mobile game installs in Q1 2021 were just 1 percent lower than their peak from Q1 2020. However, most countries have seen installs decline from this pandemic-fueled peak, with Turkey as a notable exception.
31

— An Overview of Mobile Gaming in Asia
Market Overview: Asia

$0
$5B
$10B
$15B
Q1 2018
Q2 2018
Q3 2018
Q4 2018
Q1 2019
Q2 2019
Q3 2019
Q4 2019
Q1 2020
Q2 2020
Q3 2020
Q4 2020
Q1 2021
$4.3B
$4.0B$3.9B
$3.5B$3.3B
$3.1B$3.1B
$2.8B$2.9B
$2.7B$2.6B$2.7B$2.7B
$7.8B$7.3B$7.4B$6.7B$6.7B
$6.0B$6.2B$5.6B$5.7B
$5.2B$5.1B$4.8B$5.1B
App Store Google Play
Asia’s Game Revenue Growth is Picking Up
Asia’s mobile game revenue surpassed $12 billion for the first time in Q1 2021, up 21 percent year-over-year Growth has only accelerated in recent years.
Mobile game revenue growth in Asia lagged behind that seen in the U.S. and Europe. Still, it remains by far the largest region for mobile game revenue, led by China and Japan.
Market Overview: Asia
Asia’s quarterly gross revenue from mobile games on the App Store and Google Play
+11%
+21%
33
© 2021 Sensor Tower Inc. - All Rights Reserved
+15%
Note: Revenue figures are gross revenue (including the cut taken by Apple or Google).

-1
-
-2
NEW
+1
-
-
1
2
3
4
5
6
7
8
9
10
-2
NEW
-2
1
2
3
4
5
6
7
8
9
10 -2
NEW
-2
+2
NEW
-
-
+4
-1
-3
NEW
-3
NEW
-2
+1
+1
-1
2
3
4
5
6
7
8
9
10
-
NEW
-
1
2
3
4
5
6
7
8
9
10
Honor of Kings Tencent
Monster Strike Mixi
Fate/Grand Order Sony
LineageM NCSOFT
Fantasy WW Journey NetEase
Puzzle & Dragons GungHo
Knives Out NetEase
QQ Speed Tencent
Lineage2 Revolution Netmarble
DBZ Dokkan Battle Bandai Namco
Honor of Kings Tencent
PUBG Mobile Tencent
Monster Strike Mixi
Fate/Grand Order Sony
3 Kingdoms Tactics Alibaba
LineageM NCSOFT
Lineage2M NCSOFT
Fantasy WW Journey NetEase
Knives Out NetEase
AFK Arena Lilith Games
Honor of Kings Tencent
PUBG Mobile Tencent
Genshin Impact miHoYo
LineageM NCSOFT
Fate/Grand Order Sony
Monster Strike Mixi
3 Kingdoms Tactics Alibaba
Pro Baseball Spirts A Konami
Puzzle & Dragons GungHo
Fantasy WW Journey NetEase
Honor of Kings Tencent
Fate/Grand Order Sony
PUBG Mobile Tencent
Monster Strike Mixi
Fantasy WW Journey NetEase
LineageM NCSOFT
Puzzle & Dragons GungHo
Perfect World Tencent
Knives Out NetEase
DBZ Dokkan Battle Bandai Namco
Genshin Impact Emerged as a Top Game in Asia with a Strong Q1 2021Top mobile games by Asia revenue on the App Store and Google Play
34
© 2021 Sensor Tower Inc. - All Rights Reserved
2018 2019 2020
Market Overview: Asia
1Q21

$0
$1B
$2B
$3B
$4B
$5B
$6B
Q1 2017
Q2 2017
Q3 2017
Q4 2017
Q1 2018
Q2 2018
Q3 2018
Q4 2018
Q1 2019
Q2 2019
Q3 2019
Q4 2019
Q1 2020
Q2 2020
Q3 2020
Q4 2020
Q1 2021
Top Asian countries by mobile game revenue, App Store and Google Play
Japan’s Game Revenue Surpassed $5 Billion in Q1 2021
Four of the top five countries globally by mobile game revenue are in Asia, with the U.S. as the only exception. Japan surpassed $5 billion in Q1 2021, followed by China at $3.9 billion and South Korea at $1.5 billion.
While China’s mobile game adoption has decreased in recent years, revenue has continued to grow. Note that China’s revenue also only includes the App Store, as Google Play is not available in the country.
35
© 2021 Sensor Tower Inc. - All Rights Reserved
Japan China South Korea Taiwan Hong Kong
Japan +35% Y/Y
South Korea +16% Y/Y
China +6% Y/Y
Taiwan +23% Y/Y
Hong Kong +23% Y/Y
Market Overview: Asia
Note: Revenue figures are gross revenue (including the cut taken by Apple or Google). China numbers only include the App Store as Google Play is not available there.

Top Asian countries by Y/Y game revenue growth in Q1 2021, App Store and Google Play
Japan Saw 35 Percent Y/Y Revenue Growth in Q1 2021
Japan’s game revenue increased by more than $1.3 billion in Q1 2021 vs. Q1 2020, an increase of 35 percent. China, the No. 2 country by growth, was well behind with year-over-year growth of $236 million.
Thailand was the No. 5 country in Asia by growth, with user spending up nearly 50 percent Y/Y. Spending surpassed $200 million in the country for the first time, more than double the total from just two years prior in Q1 2019.
36
© 2021 Sensor Tower Inc. - All Rights Reserved
$0
$1B
$2B
$3B
$4B
$5B
$6B
Japan
China
South Korea
Taiwan
Thailand
$204M$630M
$1.5B
$3.9B
$5.2B
$137M$511M
$1.3B
$3.6B$3.8B
Q1 2020 Q1 2021
+35%
+6%
+16%
+23%
+49%
Market Overview: Asia
$137M
Note: Top growing countries are determined and sorted by the difference in gross revenue in Q1 2021 vs. Q1 2020, not percentage growth.

Top games publishers by SEA revenue in 2020 on the App Store and Google Play
Half of the Top SEA Publishers are Based in China
Singapore-based Garena remained the dominant publisher in Southeast Asia (SEA) with more than double the revenue of the next closest publisher (Moonton). It had strong revenue growth at 37 percent year-over-year.
China represented half of the top 10 publishers by revenue in SEA in 2020. Interestingly, half of the top 10 publishers in SEA were also among the top 10 in Europe: Tencent, Moon Active, FunPlus, Playrix, and Supercell.
37
© 2021 Sensor Tower Inc. - All Rights Reserved
$0
$50M
$100M
$150M
$200M
$250M
$300M
$350M
Garena
Moonton
Lilith Games
Tencent
Netmarble
Moon Active
FunPlus
Playrix
miHoYo
Supercell
$41M$47M$48M$54M$56M$59M
$89M$97M
$143M
$314M
$40M$9M
$33M$21M$6M
$29M
$66M$49M
$102M
$229M
2019 2020
+37%
+40%
+99%+36%
+103% +765% +155% +48% +440%+1%
$9M$6M Note: Revenue figures are gross revenue (including the cut taken by Apple or Google).
Market Overview: Asia

0
1B
2B
3B
4B
5B
6B
7B
Q1 2018
Q2 2018
Q3 2018
Q4 2018
Q1 2019
Q2 2019
Q3 2019
Q4 2019
Q1 2020
Q2 2020
Q3 2020
Q4 2020
Q1 2021
4.9B4.9B
5.3B5.4B
4.1B
3.5B3.4B3.4B
2.8B2.7B2.8B
3.3B2.6B
762M613M745M904M1.2B
746M893M790M822M755M954M866M1.1B
App Store Google Play
Asia’s Mobile Game Adoption Surged in 2020
Quarterly mobile game downloads in Asia surpassed 5 billion for the first time in Q1 2020, and then climbed to 6.3 billion in Q2 2020. Although installs dropped off a bit from this peak, they still surpassed 5.5 billion for each of the next three quarters.
The vast majority of game installs in Asia came from Google Play, driven largely by countries like India and Indonesia where Android phones are much more popular than iPhones. About 86 percent of the downloads in Q1 2021 were from Google Play, up from 71 percent in Q1 2018.
Asia’s quarterly downloads from mobile games on the App Store and Google Play
-4%
+7%
38
© 2021 Sensor Tower Inc. - All Rights Reserved
+46%
Market Overview: Asia

Top Battle Royale Games Were Popular in AsiaTop mobile games by Asia downloads on the App Store and Google Play
39
© 2021 Sensor Tower Inc. - All Rights Reserved
NEW
+1
-1
-1
+3
-
-2
1
2
3
4
5
6
7
8
9
10
NEW
-1
NEW
1
2
3
4
5
6
7
8
9
10 -7
+4
-
NEW
-1
-1
NEW
NEW
NEW
-1
NEW
+1
NEW
NEW
-2
-
+21
2
3
4
5
6
7
8
9
10
NEW
-1
NEW
1
2
3
4
5
6
7
8
9
10
PUBG Mobile Tencent
Ludo King Gametion
Subway Surfers Sybo Games
Helix Jump Voodoo
Garena Free Fire Garena
Mobile Legends: Bang Bang Moonton
Temple Run 2 Imangi Studios
Candy Crush Saga King
Honor of Kings Tencent
My Talking Tom Outfit7
Ludo King Gametion
Garena Free Fire Garena
PUBG Mobile Tencent
Hunter Assassin Ruby Games
Subway Surfers Sybo Games
Brain Out Focus Apps
Worms Zone.io Azur Interactive
Carrom Pool Miniclip
Gardenscapes Playrix
Among Us InnerSloth
Join Clash 3D Supersonic Studios
Ludo King Gametion
Garena Free Fire Garena
Bubble Shooter Miniclip
Subway Princess Runner Ivy
Subway Surfers Sybo Games
Worms Zone.io Azur Interactive
Candy Crush Saga King
Phone Case DIY Crazy Labs
PUBG Mobile Tencent
PUBG Mobile Tencent
Garena Free Fire Garena
Ludo King Gametion
Subway Surfers Sybo Games
Mobile Legends: Bang Bang Moonton
Fun Race 3D Good Job Games
My Talking Tom 2 Outfit7
Temple Run 2 Imangi Studios
Carrom Pool Miniclip
Candy Crush Saga King
2018 2019 2020
Market Overview: Asia
1Q21

0
1B
2B
3B
Q1 2017
Q2 2017
Q3 2017
Q4 2017
Q1 2018
Q2 2018
Q3 2018
Q4 2018
Q1 2019
Q2 2019
Q3 2019
Q4 2019
Q1 2020
Q2 2020
Q3 2020
Q4 2020
Q1 2021
Top Asian countries by mobile game downloads, App Store and Google Play
India’s Game Installs Dwarfed All Other Markets
India is the largest mobile games market by downloads in the world. It has seen rapid growth since the start of 2019, climbing from 1.2 billion in Q1 2019 to nearly 2.9 billion in Q3 2020.
Indonesia has also experienced strong growth of 26 percent year-over-year in Q1 2021. China’s installs have declined since 2017, with a surge at the start of COVID-19 in Q1 2020 as an exception. However, China’s mobile game user spending has continued to climb despite its decline in adoption.
40
© 2021 Sensor Tower Inc. - All Rights Reserved
India Indonesia China Vietnam Philippines
India +28% Y/Y
China -44% Y/Y
Indonesia +26% Y/Y
Vietnam -21% Y/YPhilippines +31% Y/Y
Market Overview: Asia
Note: China numbers only include the App Store as Google Play is not available there.

Top Asian countries by Y/Y game download growth in Q1 2021, App Store and Google Play
India and Indonesia Top Install Growth in Asia
Mobile game installs in India have grown by roughly half a billion year-over-year in Q1 2021. Indonesia was the only other country with growth of more than 100 million downloads.
Pakistan, the No. 7 country in Asia by downloads in Q1 2021, was No. 4 by Y/Y growth that quarter. Kazakhstan, the 10th largest market in Asia by downloads, was another notable country with strong Y/Y growth.
41
© 2021 Sensor Tower Inc. - All Rights Reserved
0
500M
1.0B
1.5B
2.0B
2.5B
India
Indonesia
Philippines
Pakistan
Kazakhstan
144M232M351M
790M
2.2B
114M164M269M
628M
1.7B
Q1 2020 Q1 2021
+28%
+26%
+31%+41%
+26%
Market Overview: Asia
Note: Top growing countries are determined and sorted by the difference in downloads in Q1 2021 vs. Q1 2020, not percentage growth.

© 2021 Sensor Tower Inc. - All Rights Reserved
Key Takeaways: Asia
1. Asia is the top region for mobile games. Mobile game consumer spending surpassed $12 billion there for the first time in Q1 2021, an increase of 21 percent year-over-year. Asia’s mobile game revenue growth accelerated during COVID-19, similar to the pattern seen in other regions.
2. Four of the top five countries by mobile game revenue are in Asia, including Japan, China, and South Korea. Japan has seen particularly strong growth in recent quarters, as its revenue has climbed 35 percent Y/Y in Q1 2021.
3. India is the primary driver of mobile game download trends in Asia, reaching nearly 3 billion installs in Q3 2020. Some other countries including Indonesia, Philippines, and Pakistan have also seen really strong download growth.
42
— 3-Year Revenue and Download Forecast
Market Forecast:

Consumer Spending in Mobile Games Will Reach $117 Billion by 2023Three-year consumer spending forecast for the Games category on the App Store and Google Play
44
© 2021 Sensor Tower Inc. - All Rights Reserved
Market Forecast
$117 Billion App Store + Google Play Revenue
By 2023
$67 Billion App Store Revenue
By 2023
$50 Billion Google Play Revenue
By 2023
$0
$25B
$50B
$75B
$100B
$125B
2019 2020 2021F 2022F 2023F
$117B$106B
$95B$80B
$63B
+13.5% CAGR
$0
$25B
$50B
$75B
$100B
$125B
2019 2020 2021F 2022F 2023F
$67B$62B$55B$48B$38B
$0
$25B
$50B
$75B
$100B
$125B
2019 2020 2021F 2022F 2023F
$50B$44B$40B$32B$25B
+12.3% CAGR
+15.9% CAGR
Worldwide App Store and Google Play Spending
Worldwide App Store Spending
Worldwide Google Play Spending
Note: Revenue figures are gross revenue (including the cut taken by Apple or Google).

Mobile Game Installs are Projected to Rise Steadily to 67.2 Billion by 2023Three-year download forecast for the Games category on the App Store and Google Play
45
© 2021 Sensor Tower Inc. - All Rights Reserved
Market Forecast
67.2 Billion App Store + Google Play Downloads
By 2023
11.9 Billion App Store Downloads
By 2023
55.3 Billion Google Play Downloads
By 2023
0
10B
20B
30B
40B
50B
60B
70B
80B
2019 2020 2021F 2022F 2023F
67.2B61.8B57.5B56.3B42.7B
+6.1% CAGR
0
10B
20B
30B
40B
50B
60B
70B
80B
2019 2020 2021F 2022F 2023F
11.9B11.4B10.5B10.1B9.2B
+5.7% CAGR
0
10B
20B
30B
40B
50B
60B
70B
80B
2019 2020 2021F 2022F 2023F
55.3B50.4B47.0B46.2B33.5B
+6.2% CAGR
Worldwide App Store and Google Play Downloads
Worldwide App Store Downloads
Worldwide Google Play Downloads

Germany is projected to gain the most market share for mobile game revenue by 2023 with annual growth of 18 percent. Four other European countries will join Germany among the top 10, including the U.K., France, Netherlands, and Italy.
Southeast Asia has three countries among the top 10 by market share growth. Malaysia and Philippines are projected for a compound annual growth rate (CAGR) of 30 percent or higher, while Thailand is projected for a CAGR of 24 percent.
Top 10 countries by projected market share growth between 2020 - 2023
European and Asian Markets Projected for Strong Growth
46
© 2021 Sensor Tower Inc. - All Rights Reserved
Germany .
Canada .
United Kingdom .
Malaysia .
Thailand .
Philippines .
France .
Netherlands .
Italy .
Australia .
$0 $500M $1.0B $1.5B $2.0B $2.5B $3.0B $3.5B
2020 2023F
+18.0% CAGR
+19.4% CAGR
+18.5% CAGR
+30.7% CAGR
+23.9% CAGR
+18.3% CAGR
+30.0% CAGR
+27.3% CAGR
+21.6% CAGR
+17.3% CAGR
Market Forecast
Note: Revenue figures are gross revenue (including the cut taken by Apple or Google).

0%
10%
20%
30%
40%
50%
60%
70%
80%
90%
2020 2021F 2022F 2023F
Worldwide Southeast Asia Europe North America Rest of Asia
Revenue growth by region, App Store and Google Play
Southeast Asia Game Revenue to Rise 90% by 2023
When looking at projected mobile game revenue growth by region, Southeast Asia and Europe are expected to far exceed the worldwide rate. Southeast Asia revenue will grow by 88 percent between 2020 and 2023, while Europe is projected for 76 percent growth over the same period.
North America revenue growth will be similar to the worldwide rate. Meanwhile, slower growth in mature gaming markets like China and Japan will result in a slightly lower growth rate in the rest of Asia (excluding Southeast Asia).
47
© 2021 Sensor Tower Inc. - All Rights Reserved
Southeast Asia
Worldwide
Europe
North America
Rest of Asia
Market Forecast

© 2021 Sensor Tower Inc. - All Rights Reserved
Key Takeaways: Market Forecast
1. Mobile game revenue will reach $117 billion by 2023, a CAGR of 13.5 percent. The App Store will contribute $67 billion with a 12.3 percent CAGR, while Google Play will reach $50 billion with a 15.9 percent CAGR.
2. Mobile game downloads will surpass 67 billion by 2023, or an annual growth rate of 6.1 percent. More than 55 billion of these installs will be from Google Play, with the App Store contributing around 12 billion.
3. Europe and Southeast Asia are key markets for mobile game developers, as revenue growth in these regions are expected to easily outpace the worldwide rate over the next three years. Currently, Europe-based publishers have found the most success in Europe, while some top China-based publishers have emerged as key players in Southeast Asia.
48

— Worldwide Trends by Mobile Game Genre
Game Genre Trends

Top 10 game genres by worldwide gross revenue, App Store and Google Play
RPG Was the Top Game Genre by Revenue in 2020
RPG led all genres by mobile game revenue in 2020, followed by Strategy and Puzzle. RPG revenue grew by $3.6B year-over-year, while Strategy was close behind with growth of $3.4B.
Among top genres, Simulation led the way by Y/Y growth at 53 percent, followed by Shooter with 50 percent and Casino at 46 percent. Each of these genres had one of the top five games by revenue in 2020, with PUBG Mobile (Shooter), Coin Master (Casino), and Roblox (Simulation).
50
© 2021 Sensor Tower Inc. - All Rights Reserved
Game Genre Trends
RPG
Strategy
Puzzle
Casino
Shooter
Simulation
Lifestyle
Sports
Action
Geolocation AR
$0 $5B $10B $15B $20B $25B
$1.9B
$2.2B
$2.9B
$3.0B
$4.1B
$5.7B
$7.2B
$8.5B
$15.1B
$21.9B
$1.3B
$1.7B
$2.1B
$2.2B
$2.7B
$3.8B
$4.9B
$7.0B
$11.7B
$18.3B
2019 2020 Top Game:
Monster Strike
Honor of Kings
Candy Crush Saga
Coin Master
PUBG Mobile
Roblox
Disney: Twisted-Wonderland
Pro Baseball Spirits A
Genshin Impact
Pokémon GO
Top Country:
34%
30%
52%
64%
32%
50%
48%
47%
39%
52%$1.9B
Top Sub-Genre:
MMORPG
4X Strategy
Puzzle & Decorate
Slots
Battle Royale
Sandbox
Music / Band
Realistic Sports
Fighting
Geolocation AR
$2.2B
$2.2B$3.0B
$2.1B$2.9B
$1.7B
$1.3B
$2.7B
+19%
+30%
+23%
+46%
+50%
+53%
+33%
+36%
+39%
+44%
Note: Revenue figures are gross revenue (including the cut taken by Apple or Google).

$0
$1B
$2B
$3B
$4B
$5B
$6B
$7B
Q1 2018
Q2 2018
Q3 2018
Q4 2018
Q1 2019
Q2 2019
Q3 2019
Q4 2019
Q1 2020
Q2 2020
Q3 2020
Q4 2020
Q1 2021
RPG Strategy Puzzle Casino Shooter Simulation
Worldwide revenue by game genre, App Store and Google Play
Strategy’s Growth Has Kept Pace with RPG Since 2018
Strategy has been able to stay within $1.4 billion of RPG gross revenue each quarter since 2018. Strategy has a CAGR of 25 percent since Q1 2018 vs. RPG’s CAGR of 15 percent.
Casino and Simulation benefited from a few hit titles gaining traction during the pandemic. Coin Master contributed to much of Casino’s revenue gains in 2020, while Roblox was responsible for a large portion of Simulation’s growth.
51
© 2021 Sensor Tower Inc. - All Rights Reserved
RPG +17% Y/Y
Puzzle +24% Y/Y
Strategy +27% Y/Y
Casino +32% Y/YShooter +14% Y/YSimulation +38% Y/Y
Game Genre Trends
Note: Revenue figures are gross revenue (including the cut taken by Apple or Google).

4X Strategy
Open World Adventure
Squad RPG
MMORPG
Puzzle & Decorate
MOBA
Slots
Sandbox
Geolocation AR
Music / Band
$0 $100M $200M $300M $400M $500M $600M $700M
Strategy Action RPG Puzzle Casino Simulation Geolocation AR Lifestyle
Top 10 game sub-genres by year-over-year revenue growth in Q1 2021
4X Strategy is the Fastest Growing Sub-Genre
4X Strategy is the fastest growing sub-genre by revenue, followed by Open World Adventure. Six different 4X Strategy games earned at least $100 million in Q1 2021, while Open World Adventure was boosted by the hugely successful launch of Genshin Impact.
Top growing sub-genres were spread across many different genres. Sub-genres from eight different genres were among the top 10 by growth, with Strategy and RPG as the only two genres with multiple sub-genres.
52
© 2021 Sensor Tower Inc. - All Rights Reserved
Game Genre Trends
Note: Revenue figures are gross revenue (including the cut taken by Apple or Google).
4X Strategy (Strategy)
Open World Adventure (Action)
Squad RPG (RPG)
MMORPG (RPG)
Puzzle & Decorate (Puzzle)
MOBA (Strategy)
Slots (Casino)
Sandbox (Simulation)
Geolocation AR (Geolocation AR)
Music / Band (Lifestyle)

Top 10 game genres by worldwide downloads, App Store and Google Play
The Assent of Hypercasual Continued in 2020
Hypercasual install growth continued in 2020, rising 60 percent year-over-year. Most of the growth occurred early in 2020 as downloads rose 35 percent between Q4 2019 and Q1 2020.
Other top growing genres included Simulation and Lifestyle with 57 percent and 52 percent Y/Y growth, respectively. India was the top country by downloads for both of these genres, followed by Brazil and the U.S.
53
© 2021 Sensor Tower Inc. - All Rights Reserved
Game Genre Trends
Hypercasual
Puzzle
Arcade
Simulation
Lifestyle
Shooter
Tabletop
Racing
Sports
Strategy
0 2B 4B 6B 8B 10B 12B 14B
1.6B
1.6B
1.9B
2.1B
2.8B
3.9B
4.7B
5.2B
5.5B
12.0B
1.4B
1.5B
1.6B
1.6B
2.2B
2.6B
3.0B
4.4B
4.2B
7.5B
2019 2020 Top Game:
Tiles Hop 3D
Gardenscapes
Among Us
Roblox
My Talking Tom 2
Garena Free Fire
Ludo King
Hill Climb Racing
8 Ball Pool
Brawl Stars
Top Country:
16%
20%
18%
15%
26%
31%
28%
18%
9%
Top Sub-Genre:
Puzzle
Other Puzzle
Platformer / Runner
Driving / Flight Simulator
Lifestyle Simulator
FPS / 3PS
Board
Realistic Racing
Realistic Sports
4X Strategy
14%
1.6B
1.6B
1.6B
1.5B
1.6B1.4B
+60%
+31%
+20%
+57%
+52%
+24%
+32%
+23%
+7%
+12%

0
1B
2B
3B
4B
Q1 2018
Q2 2018
Q3 2018
Q4 2018
Q1 2019
Q2 2019
Q3 2019
Q4 2019
Q1 2020
Q2 2020
Q3 2020
Q4 2020
Q1 2021
Hypercasual Puzzle Arcade Simulation Lifestyle Shooter
Worldwide download growth by game genre, App Store and Google Play
Hypercasual Has Seen Staggering Growth Since 2018
Hypercasual installs have skyrocketed, climbing from 757 million in Q1 2018 to more than 3.4 billion in Q1 2021. The genre was responsible for 31 percent of downloads in Q1 2021; no other genre had more than 12 percent.
Other genres like Puzzle, Arcade, and Shooter saw downloads dip compared to the highs seen during the start of the pandemic. Most genres still saw solid growth compared to 2019 totals.
54
© 2021 Sensor Tower Inc. - All Rights Reserved
Hypercasual +17% Y/Y
Arcade -2% Y/Y
Puzzle -7% Y/Y
Simulation +9% Y/YLifestyle +19% Y/YShooter -17% Y/Y
Game Genre Trends

Traversal
Action
Lifestyle Simulator
Simulation
Simulator
Social Party
Puzzle
Driving / Flight Simulator
Arcade Driving
Arcade
0 50M 100M 150M 200M 250M 300M
Hypercasual Lifestyle Simulation Arcade
Top 10 game sub-genres by year-over-year download growth in Q1 2021
Hypercasual Sub-Genres Drove Adoption Growth
Five of the top 10 fastest growing sub-genres by Y/Y growth in Q1 2021 were in the Hypercasual genre, including the top two. Simulation and Arcade each had two sub-genres represented.
The top game in Q1 2021 was Join Clash 3D from Supersonic Studios with more than 81 million downloads, representing the Hypercasual - Traversal sub-genre. Among Us drove nearly all of the growth for the Arcade - Social Party sub-genre.
55
© 2021 Sensor Tower Inc. - All Rights Reserved
Traversal (Hypercasual)
Action (Hypercasual)
Lifestyle Simulator (Lifestyle)
Simulation (Hypercasual)
Simulator (Simulation)
Social Party (Arcade)
Puzzle (Hypercasual)
Driving / Flight Simulator (Simulation)
Arcade Driving (Arcade)
Arcade (Hypercasual)
Game Genre Trends

© 2021 Sensor Tower Inc. - All Rights Reserved
Key Takeaways: Game Genre Trends
1. RPG and Strategy were the top two genres by revenue in 2020 at $21.9 billion and $15.1 billion, respectively. No other genre had more than $10 billion in revenue that year.
2. Revenue growth was strong across top genres in 2020, with Simulation (53 percent year-over-year growth), Shooter (50 percent), and Casino (46 percent) leading the way. Eight different genres had one of the top 10 sub-genres by revenue growth in Q1 2021.
3. When it comes to mobile games installs, hypercasual has seen staggering growth in recent years. While hypercasual game download growth slowed after a large spike in Q1 2020, downloads still reached a record high 3.4 billion in Q1 2021, up 17 percent from a year prior. More than 30 percent of game installs in Q1 2021 were from hypercasual games.
56

— Trends in Mobile Game Monetization Strategies
Monetization Trends

© 2021 Sensor Tower Inc. - All Rights Reserved
Monetization Trends: Mobile Monetization Strategies
Early on, mobile games primarily monetized by offering a fixed price for full access. Monetization strategies have evolved since, with many top mobile games utilizing different in-app purchase (IAP) and advertising strategies to boost revenue far beyond the levels reached by premium (paid) games at the launch of the app stores. This section explores current strategies used by the leaders in mobile gaming.
Minecraft Heads Up!
Bloons TD 6
Paid GamesFree Games With IAPs
Free Games With Ads
PUBG Mobile Roblox
Pokémon GO
Tie Dye Tiles Hop
Join Clash 3D
Monetization Trends
1 2 3

Paid game shares relative to free games on the App Store
Freemium Has Edged Out Premium in Mobile Gaming
Since the start of 2014, paid (or premium) games have continued to lose market share to free games. By Q4 2020, only five percent of newly released games were paid games, and the share of paid games on the App Store had fallen to 12 percent (down from 43 percent in Q1 2014).
Freemium games have held an edge in monetizing since 2014, explaining the transition away from the premium model. Paid games only accounted for eight percent of mobile game revenue on the App Store at the start of 2014. By Q4 2020 this share had fallen to one percent.
59
© 2021 Sensor Tower Inc. - All Rights Reserved
Monetization Trends
0%
10%
20%
30%
40%
50%
60%
70%
80%
90%
100%
Q1 2014
Q1 2015
Q1 2016
Q1 2017
Q1 2018
Q1 2019
Q1 2020
Paid Free
0%
10%
20%
30%
40%
50%
60%
70%
80%
90%
100%
Q1 2014
Q1 2015
Q1 2016
Q1 2017
Q1 2018
Q1 2019
Q1 2020
Paid Free
0%
10%
20%
30%
40%
50%
60%
70%
80%
90%
100%
Q1 2014
Q1 2015
Q1 2016
Q1 2017
Q1 2018
Q1 2019
Q1 2020
Paid Free
% of Available Games % of Newly Released Games % of App Store Revenue

0%
20%
40%
60%
80%
100%
20172018
20192020
71%73%
83%91%
29%27%
17%9%
Subscription No Subscription
Subscription Model is On the Rise
By 2020, 29 percent of the top games by U.S. revenue on the App Store had a subscription. This number has climbed steadily, up from just 9 percent in 2017.
More games have begun to adopt the subscription model, including some top titles like Roblox, Clash of Clans, and PUBG Mobile. While the subscription is no the top in-app purchase for most of these games, it does provide a boost to the freemium model when implemented correctly.
Share of the top 100 games by U.S. App Store revenue in 2020 that have a subscription
60
© 2021 Sensor Tower Inc. - All Rights Reserved
Monetization Trends

Most Mobile Games Don’t Rely on Subscriptions
Even games that have successfully implemented the subscription model tend to get the bulk of their revenue from one-time purchases. Roblox is an exception, with monthly recurring subscription as its top three IAPs. Roblox also give subscribers a discount on additional Robux, the in game currency, as an extra incentive to subscribe.
Other top games like Clash of Clans, PUBG Mobile, and Rise of Kingdoms have their subscription among the top 10 IAPs but outside the top three spots. The subscriptions contribute to these games’ success but are not the only monetization strategy they use.
Top in-app purchases (IAPs) for games with subscriptions
61
© 2021 Sensor Tower Inc. - All Rights Reserved
Monetization Trends
Roblox Roblox
Clash of Clans Supercell
PUBG Mobile Tencent
Rise of Kingdoms Lilith Games
Note: In-app purchase rankings are as of the end of Q1 2021

Number of Hypercasual games reaching 50 million worldwide downloads by year
More Than 50 Hypercasual Titles Crossed 50M Installs in 2020
The rise of Hypercasual games illustrates how more and more developers are monetizing primarily through ads. 56 different Hypercasual games surpassed 50 million downloads in 2020, up from just 14 Hypercasual games that reached that threshold in 2018.
It is yet to be seen what the impact of IDFA will be on the Hypercasual games space, and mobile games advertising more broadly.
62
© 2021 Sensor Tower Inc. - All Rights Reserved
2018
2019
2020
0 10 20 30 40 50 60
41
24
9
12
6
2
3
6
3
150M+ 100MM-150M 50M-100M
Monetization Trends

© 2021 Sensor Tower Inc. - All Rights Reserved
Key Takeaways: Monetization Trends
1. The vast majority of mobile games utilize the freemium model over the premium model. By Q4 2020, freemium games earned 99 percent of the revenue on the App Store compared to just one percent from premium games.
2. Some top games have found success using the subscription model, with examples including Roblox, PUBG Mobile, Clash of Clans, and Mario Kart Tour. While a subscription can help boost the revenue for games when it fits into the overall monetization strategy, most still rely on one time in-app purchases.
3. More and more games are monetizing through ads, with 56 different Hypercasual games adding at least 50 million users in 2020. The impact of IDFA on this strategy is yet to be seen.
63

— Trends in Mobile Game Advertising
Advertising Trends

© 2021 Sensor Tower Inc. - All Rights Reserved
Advertising: Definitions
Advertising Trends
Stack Ball Azur Interactive
Ad Publisher The app monetizing its platform by displaying ads to its users
Advertiser Apps that are running mobile ad campaigns
Game Developer Developer that publishes the advertising app
High Heels Zynga
Shortcut Run Voodoo
Snake.io Kooapps

2020 U.S. share of voice by game genre of the ad publishers on iOS
Hypercasual and Puzzle Genres Rely on Ads the Most
Puzzle was the top genre by ad publishing share of voice on five of the eight ad networks studies, and Hypercasual had the highest share of voice on the remaining three. Hypercasual games in particular monetize through showing ads, so it is not surprising that this genre publishes a high percentage of ads in mobile games.
Tabletop was the No. 2 genre by ad publishing share of voice on MoPub, and it ranked third on AdMob, Facebook, ironSource, and Vungle. Arcade also ranked among the top five on six of the eight networks.
66
© 2021 Sensor Tower Inc. - All Rights Reserved
Advertising Trends
HypercasualPuzzleSports
SimulationCasino 5%
10%13%
20%38%
AdColony
HypercasualArcadePuzzle
TabletopSimulation 7%
11%13%14%
28%
AppLovin
PuzzleHypercasual
TabletopArcadeSports 8%
8%10%
18%22%
A
AdMob
PuzzleHypercasual
TabletopActionSports 3%
9%15%
23%31%
PuzzleHypercasual
TabletopSimulation
Arcade 7%8%
16%18%19%
ironSource
PuzzleTabletop
HypercasualAction
Arcade 4%7%
24%28%28%
MoPub
HypercasualPuzzle
SimulationArcade
Tabletop 8%9%10%
22%22%
Unity
PuzzleHypercasual
TabletopSimulation
Arcade 9%9%12%
24%30%
Vungle
5%
3%
4%
Note: Share of voice is calculated among game ad publishers only. Non-game ad publishers are excluded.

2020 U.S. share of voice by game genre of the advertiser on iOS
Puzzle Advertises the Most Across the Majority of Networks
When it comes to advertising, Puzzle games advertise frequently on mobile to drive adoption. Puzzle games were responsible for more than 30 percent of the mobile game advertising share of voice (SOV) on six of the 10 ad networks studied, including 42 percent on MoPub and 36 percent on ironSource.
Strategy and Hypercasual game genres also advertise considerably. Hypercasual was the top genre by SOV on AppLovin and it ranked among the top three genres on six other networks. Meanwhile, Strategy was the top genre on YouTube and was the No. 2 genre on four other ad networks.
67
© 2021 Sensor Tower Inc. - All Rights Reserved
Advertising Trends
PuzzleCasino
TabletopSimulation
Shooter 4%13%14%
24%28%
AdColony
HypercasualPuzzle
SimulationCasinoArcade 5%
6%6%
31%37%
AppLovin
PuzzleStrategy
CasinoSimulation
RPG 8%11%11%12%
20%
PuzzleStrategy
HypercasualRPG
Tabletop 7%8%10%
14%34%
A
AdMob
PuzzleStrategy
HypercasualCasino
RPG 8%9%11%13%
23%
PuzzleHypercasual
CasinoArcade
Tabletop 7%7%10%
15%36%
ironSource
PuzzleStrategy
HypercasualCasino
Tabletop 5%6%10%12%
42%
MoPub
PuzzleHypercasual
StrategyTabletop
Casino 6%7%9%
22%35%
Unity
PuzzleHypercasual
LifestyleStrategyShooter 6%
6%8%
19%35% Strategy
RPGAction
ShooterSimulation 8%
9%10%
15%23%
YouTubeVungle
4%
6%5%
6%5%
Note: Share of voice is calculated among game advertisers only. Non-game advertisers are excluded.

AppLovin and Activision Blizzard Are Among the Top Ad Publishing DevelopersTop ad publishing developers by U.S. advertising share of voice on iOS
68
© 2021 Sensor Tower Inc. - All Rights Reserved
Electronic Arts
AppLovin
Activision Blizzard
zplay
InnerSloth
1
2
3
4
5
1
2
3
4
5
Activision Blizzard
Habby
Zynga
Voodoo
Miniclip
AppLovin
RobTop Games
Ubisoft
Playgendary
Elokence
1
2
3
4
5
1
2
3
4
5
Ninja Kiwi
Miniclip
Take-Two Interactive
Ubisoft
Sybo Games
AppLovin
Voodoo
Zynga
InnerSloth
Stillfront Group
1
2
3
4
5
1
2
3
4
5
X-Flow
Easybrain
Voodoo
Zynga
AppLovin
1
2
3
4
5
1
2
3
4
5
X-Flow
Zynga
Habby
Voodoo
Easybrain
AdColony AdMob AppLovin Facebook
MoPub Unity Vungle ironSource
Activision Blizzard
Miniclip
Jam City
MobilityWare
Take-Two Interactive
Advertising Trends

Zynga Was a Top Advertiser Following Its Rollic Games AcquisitionTop game developers by U.S. advertising share of voice on iOS
69
© 2021 Sensor Tower Inc. - All Rights Reserved
Playrix
Zynga
Easybrain
AppLovin
Activision Blizzard
1
2
3
4
5
1
2
3
4
5
Zynga
AppLovin
Voodoo
Habby
Topwar Studio
AppLovin
Voodoo
Easybrain
SayGames
Good Job Games
1
2
3
4
5
1
2
3
4
5
Playrix
Stillfront Group
Nordcurrent
Big Run Studios
Tether Studios
Zynga
Playrix
Easybrain
Playgendary
BitMango
1
2
3
4
5
1
2
3
4
5
Playrix
Activision Blizzard
Voodoo
Zynga
Crazy Labs
1
2
3
4
5
1
2
3
4
5
Playrix
Zynga
Activision Blizzard
AppLovin
Easybrain
AdColony AdMob AppLovin Facebook
MoPub Unity Vungle YouTube
Activision Blizzard
miHoYo
Lilith Games
Aristocrat Technologies
Moon Active
Advertising Trends

Homescapes Saw Steady Advertising Across Many NetworksTop apps by U.S. advertising share of voice on iOS
70
© 2021 Sensor Tower Inc. - All Rights Reserved
1
2
3
4
5
1
2
3
4
5
1
2
3
4
5
1
2
3
4
5
1
2
3
4
5
1
2
3
4
5
1
2
3
4
5
1
2
3
4
5
AdColony AdMob AppLovin Facebook
MoPub Unity Vungle YouTube
Homescapes Playrix
Toon Blast Peak Games
Double Down Double Down
Happy Color X-Flow
Gardenscapes Playrix
Archero Habby
Top War Topwar Studio
Toon Blast Peak Games
CSR 2 NaturalMotion
Wordscapes PeopleFun
Wordscapes PeopleFun
Brain Test Unico Studios
Ink Inc Lion Studios
Save the Girl Lion Studios
Cooking Fever NordCurrent
Homescapes Playrix
BitLife Candywriter
Gardenscapes Playrix
Blackout Bingo Big Run Studios
Marvel Contest of Champions Kabam
Homescapes Playrix
Gardenscapes Playrix
Happy Color X-Flow
Word Collect Super Lucky Games
Pokémon GO Niantic
Call of Duty: Mobile Activision Blizzard
Genshin Impact miHoYo
RAID: Shadow Legends Plarium
Coin Master Moon Active
Rise of Kingdoms Lilith Games
Homescapes Playrix
Call of Duty: Mobile Activision Blizzard
Fishdom Playrix
Episode Episode Interactive
State of Survival FunPlus
Homescapes Playrix
Fishdom Playrix
Call of Duty: Mobile Activision Blizzard
Township Playrix
Gardenscapes Playrix
Advertising Trends

Zynga’s U.S. share of voice by ad network
0%
5%
10%
15%
20%
Q1 2019
Q2 2019
Q3 2019
Q4 2019
Q1 2020
Q2 2020
Q3 2020
Q4 2020
Q1 20210%
5%
10%
15%
20%
Q1 2019
Q2 2019
Q3 2019
Q4 2019
Q1 2020
Q2 2020
Q3 2020
Q4 2020
Q1 2021
Ad Network Share of Voice Average Share of Voice Across Ad Networks
0%
5%
10%
15%
20%
Q1 2019
Q2 2019
Q3 2019
Q4 2019
Q1 2020
Q2 2020
Q3 2020
Q4 2020
Q1 2021
0%
5%
10%
15%
20%
Q1 2019
Q2 2019
Q3 2019
Q4 2019
Q1 2020
Q2 2020
Q3 2020
Q4 2020
Q1 20210%
5%
10%
15%
20%
Q1 2019
Q2 2019
Q3 2019
Q4 2019
Q1 2020
Q2 2020
Q3 2020
Q4 2020
Q1 20210%
5%
10%
15%
20%
Q1 2019
Q2 2019
Q3 2019
Q4 2019
Q1 2020
Q2 2020
Q3 2020
Q4 2020
Q1 2021
Zynga Advertising Increased After Hypercasual Acquisition
Zynga’s advertising surged in Q4 2020 along with its acquisition of hypercasual games publisher Rollic Games. While its share of voice dipped somewhat in Q1 2021, it was still higher than it had been in Q1 2019 through Q3 2020.
Zynga’s ad push in Q4 2020 was most pronounced on networks including AdMob, AppLovin, Facebook, and YouTube.
71
© 2021 Sensor Tower Inc. - All Rights Reserved
Advertising Trends
Note: Share of voice includes advertising from all games currently owned by Zynga, even if it was prior to the acquisition. Average share of voice takes the mean across 10 ad networks (AdMob, AppLovin, Chartboost, Facebook, Instagram, ironSource, MoPub, Unity, Vungle, and YouTube).
AdMob
MoPub
AppLovin Facebook
Unity YouTube

© 2021 Sensor Tower Inc. - All Rights Reserved
Key Takeaways: Advertising Trends
1. Hypercasual and Puzzle games published the most ads across ad networks. Meanwhile, Puzzle games had the highest share of voice among game advertisers, suggested that these games are particularly reliant on advertising for user acquisition. Strategy and Hypercasual games also had a large portion of the share of voice on a few networks.
2. Playrix continued to be one of the top advertisers in the U.S., with the highest share of voice on Adcolony, AdMob, and Vungle networks. Its puzzle and decorate game Homescapes was the top advertising game on each of these networks, and it also advertised heavily for Gardenscapes and Fishdom.
3. Zynga’s acquisition of Hypercasual games publisher Rollic Games suggests that it still believes in the value of the genre despite the concerns around IDFA. Zynga’s share of voice surged following this acquisition.
72

— Key Takeaways from the Report
Conclusion

© 2021 Sensor Tower Inc. - All Rights Reserved
Conclusion
● The mobile games market was larger than ever in 2020 and shows no signs of slowing down. In fact, revenue growth only accelerated during the COVID-19 pandemic and users spent more than $22 billion in mobile games in Q1 2021.
● The U.S. continues to be the top market for mobile game spending. Mobile game revenue in the country surged at the start of the pandemic, and the U.S. accounted for 28 percent of global game revenue in 2020. Meanwhile, Europe and Southeast Asia are also projected for strong growth over the next several years and are key regions for game developers to expand.
● Mobile game monetization has trended away from premium apps and towards the freemium and ad models in recent years. Some top games have had success with subscriptions, demonstrating how being creative with monetization strategies can give game developers an edge in such a competitive space. It will also be important to monitor how IDFA impacts mobile game advertising and genres such as Hypercasual and Puzzle that rely heavily on ads.
Conclusion 74
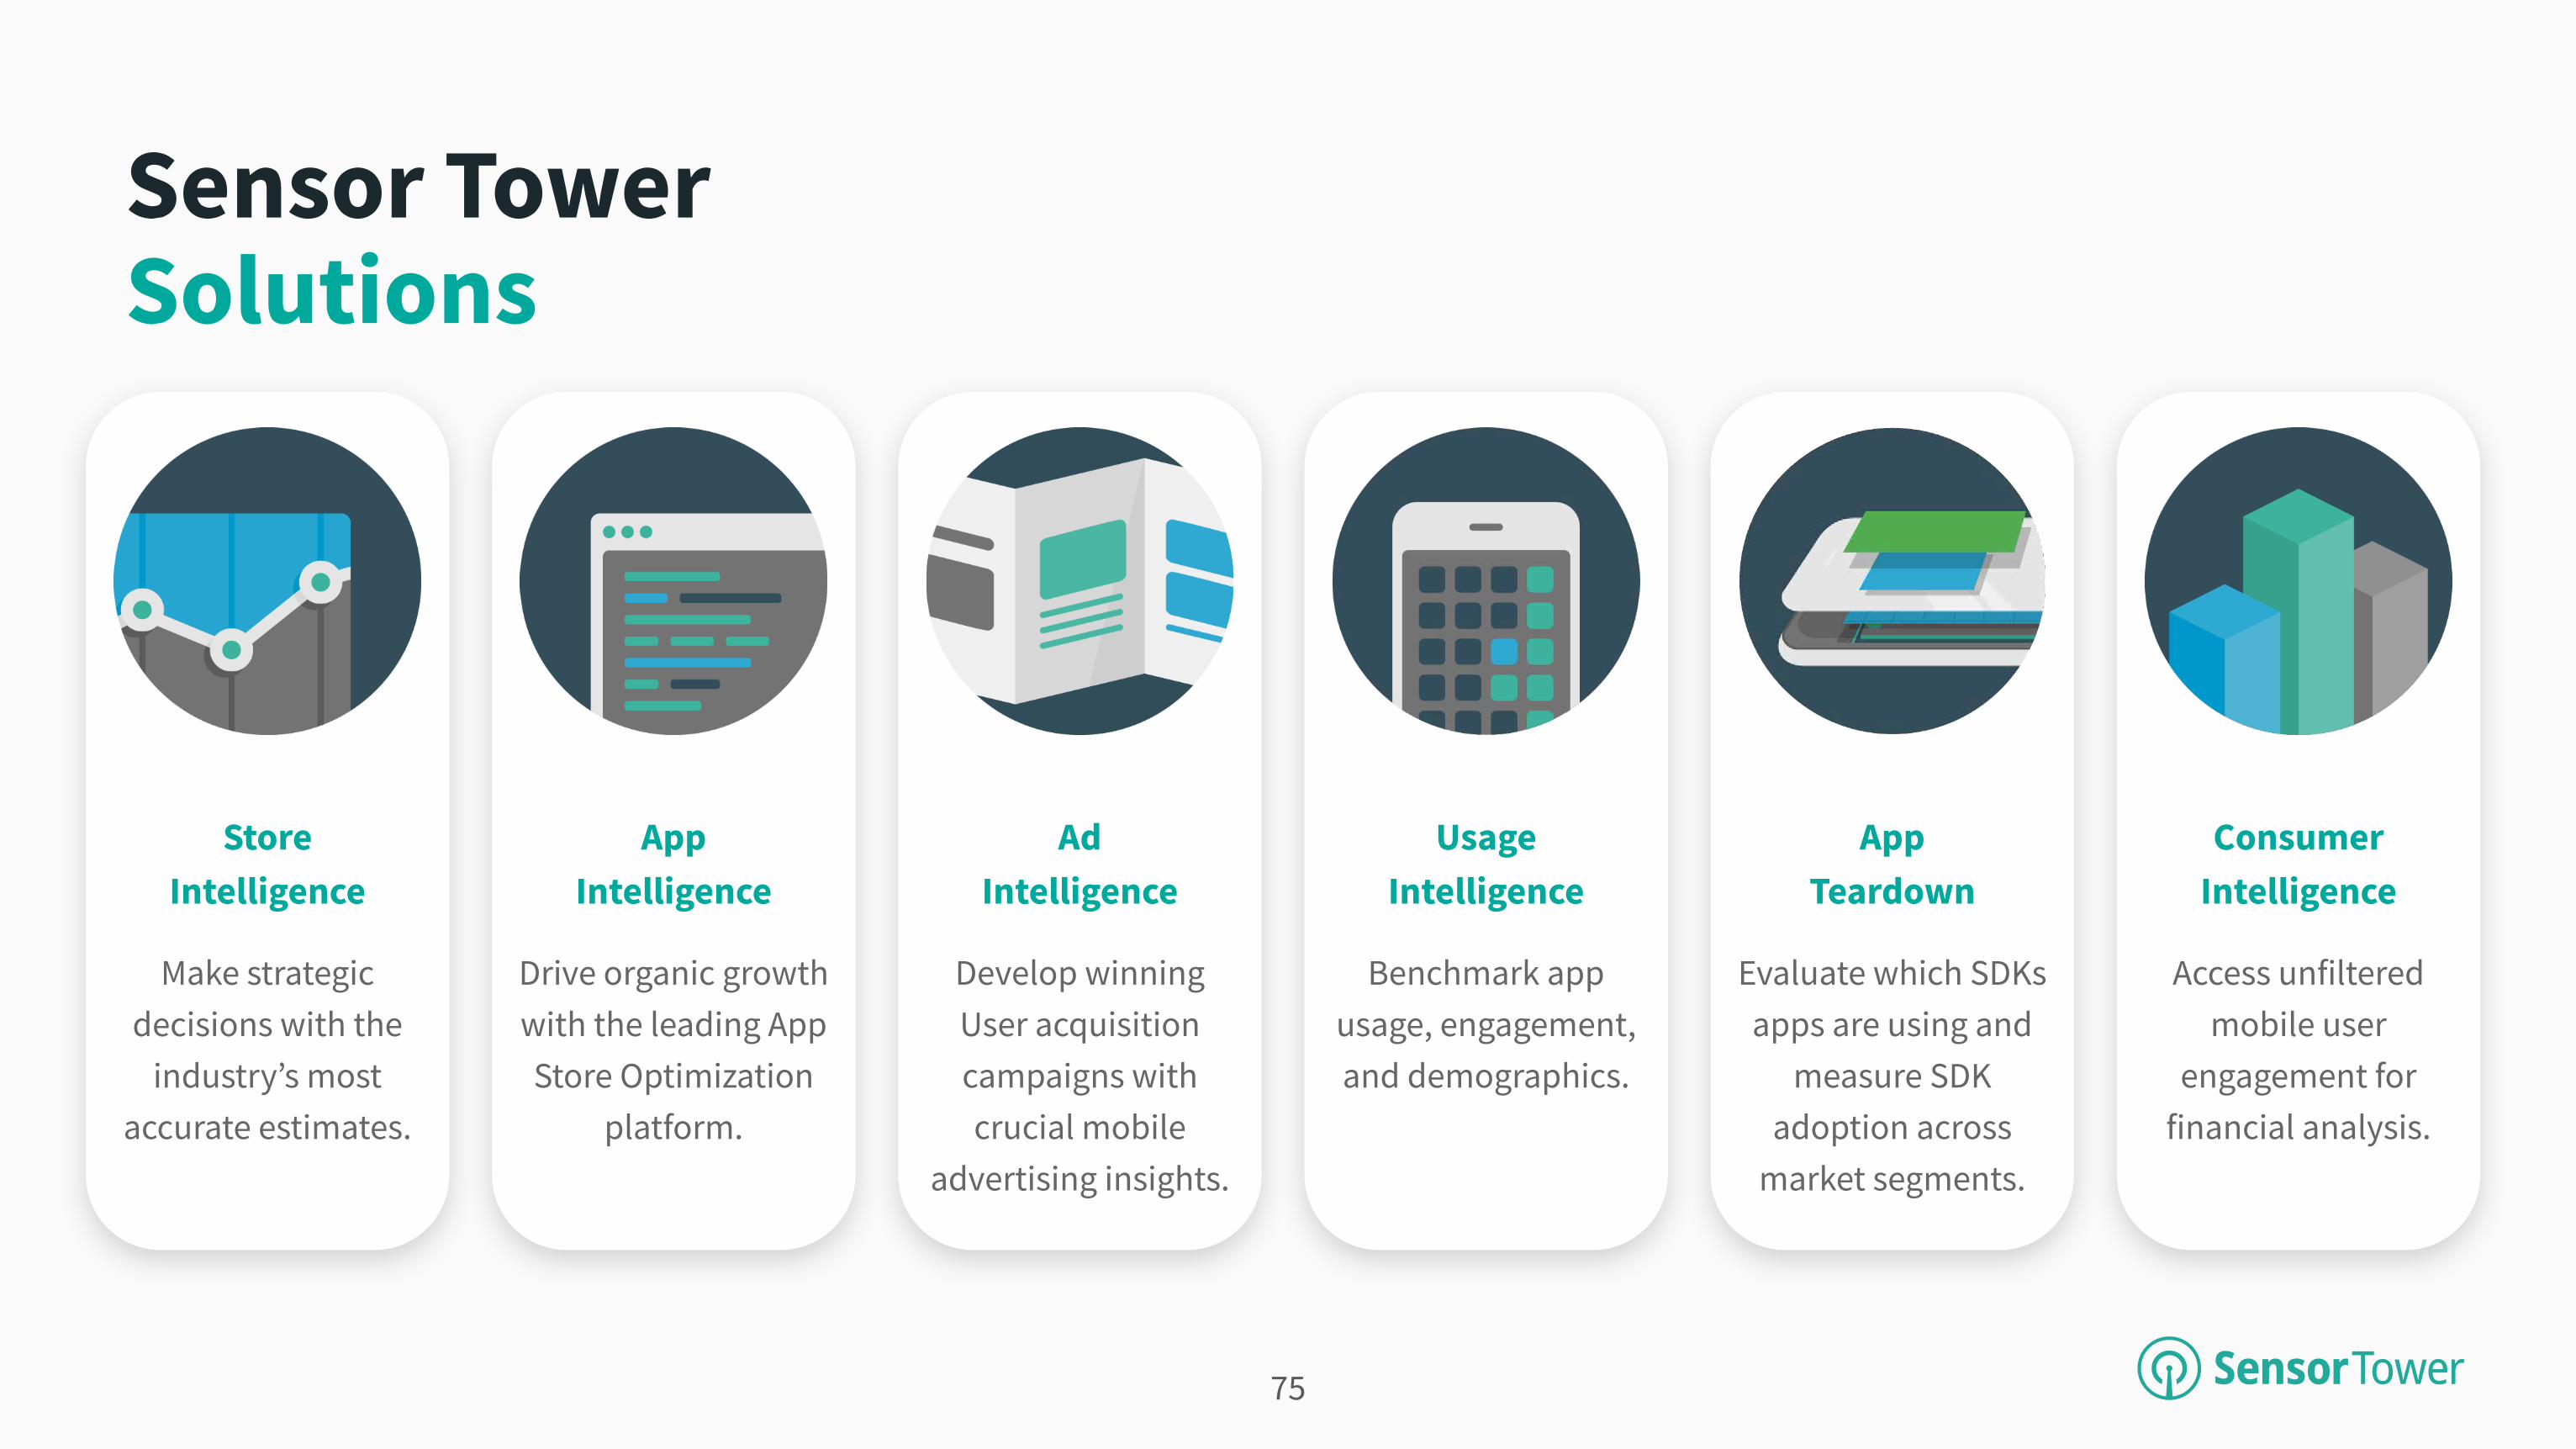
Sensor Tower Solutions
Store Intelligence
Make strategic decisions with the
industry’s most accurate estimates.
App Intelligence
Drive organic growth with the leading App Store Optimization
platform.
Ad Intelligence
Develop winning User acquisition campaigns with crucial mobile
advertising insights.
Usage Intelligence
Benchmark app usage, engagement, and demographics.
App Teardown
Evaluate which SDKs apps are using and
measure SDK adoption across
market segments.
Consumer Intelligence
Access unfiltered mobile user
engagement for financial analysis.
75

Sensor Tower Terms of UseThis report and all original content contained within are wholly owned by Sensor Tower, Inc. © 2021.
Modification, republication, distribution, or other unauthorized usage violate this copyright, unless express permission has been granted.
App icons, images, and other branding assets are property of their respective publishers and are used expressly for the purpose of editorial commentary.
© 2021 Sensor Tower Inc. - All Rights Reserved
LOOKING FOR MORE INSIGHTS? Download our latest Store Intelligence Data Digest report on the mobile market at sensortower.com/reports
76

About UsSensor Tower is the leading solution for mobile marketers, app developers, and industry analysts who demand competitive insights on the mobile economy. Sensor Tower’s product suite includes: Top Charts, App Intelligence, Store Intelligence, Ad Intelligence, Usage Intelligence, and Consumer Intelligence.
Office Locations:
San Francisco, London, Shanghai, Seoul
Contact Info:
sensortower.com
@sensortower
© 2021 Sensor Tower Inc. - All Rights Reserved
77

78