the state of renewable energies in europe 2017 · solid biomass 134 • conclusion 138 res...
TRANSCRIPT

THE STATE OF RENEWABLE ENERGIES IN EUROPE
EDITION 201717th EurObserv’ER Report
This barometer was prepared by the EurObserv’ER consortium, which groups together Observ’ER (FR), ECN (NL), RENAC (DE), Frankfurt School of Finance and Management (DE), Fraunhofer ISI (DE) and Statistics Netherlands (NL).
The information and views set out in this publication are those of the author(s) and do not necessarily reflect the official opinion of the Commission. The Commission does not guarantee the accuracy of the data included in this study. Neither the Commission nor any person acting on the Commission’s behalf may be held responsible for the use which may be made of the information contained therein.
This project is funded by the European Union under
contract no ENER/C2/2016-487/SI2.742173
THE STATE OF RENEWABLE ENERGIES IN EUROPE
EDITION 201717th EurObserv’ER Report
2 3
EUROBSERV ’ER – THE STATE OF RENEWABLE ENERGIES IN EUROPE – 2017 EDITIONEUROBSERV ’ER – THE STATE OF RENEWABLE ENERGIES IN EUROPE – 2017 EDITION
EDITORIAL by Vincent Jacques le Seigneur 4
Energy indicators 7
Wind power 8 Photovoltaic 14 Solar thermal 20 Small hydropower 26 Geothermal energy 30 Heat pumps 36 Biogas 42 Biofuels 50 Renewable urban waste 56 Solid biomass 62 Concentrated solar power 70 Ocean energy 76
Integration of RES in the building stock and urban infrastructure 81
• Conclusion 88
Socio-economic indicators 99
Wind power 102 Photovoltaics 106 Solar thermal 110 Small hydropower 114 Geothermal energy 118 Heat pumps 120 Biogas 124 Biofuels 128 Renewable urban waste 132 Solid biomass 134
• Conclusion 138
RES development impact on fossil fuel sectors 148
Investment Indicators 151
Investment in Renewable Energy Capacity 153
Wind power 154 Photovoltaic 158 Biogas 162 Geothermal energy 166 Solid biomass 168 Renewable urban waste 170
International comparison of investment costs 172
Public finance programmes for RES investments 176
Investment in Renewable Energy Technology 180
Venture capital – private equity 182
Performance of RES technology firms and RES assets 186
On the whole 190
Renewable energy costs, prices and cost competitiveness 193
Avoided fossil fuel use and resulting avoided costs 201
Indicators on innovation and competitiveness 211
R&D Investments 212
• Public R&D Investments Wind Energy 214 Solar Energy 215 Geothermal energy 216 Hydropower 217 Biofuels 218 Ocean energy 219 Renewable Energy Technologies in Total 220
• Private R&D Investments Wind Energy 221 Solar Energy 222 Hydropower 223 Geothermal energy 224 Biofuels 225 Ocean energy 226 Renewable Energy Technologies in Total 227
• Conclusions 228
Patent filings 230 Wind Energy 232 Solar Energy 234 Hydropower 236 Geothermal energy 238 Biofuels 240 Ocean energy 242 Renewable Energy Technologies in Total 244
• Conclusion 246
International Trade 249 All RES 250 Wind Energy 252 Photovoltaics 254 Hydropower 256 Biofuels 258
• Conclusion 260
Indicators on the flexibility of the electricity system 263
Sources & references 274
4 5
EUROBSERV ’ER – THE STATE OF RENEWABLE ENERGIES IN EUROPE – 2017 EDITIONEUROBSERV ’ER – THE STATE OF RENEWABLE ENERGIES IN EUROPE – 2017 EDITION
EDITORIALEDITORIAL
...Germany carries the day! Once again, the European
economy’s powerhouse can claim that it deserves this
title in the renewable energies sector, with a third of
Europe’s installed wind energy capacity. Germany is
followed just as it was last year, by Spain and the UK.
This threesome accounts for half the EU’s wind power
output. The situation is hardly any different in the
solar photovoltaic ranking where 40% of the instal-
led photovoltaic capacity is in Germany, while Italy
replaces Spain in the top three PV producer countries
that provide 70% of Europe’s output.
German supremacy in the areas of photovoltaic,
wind energy, solar thermal – half the collectors are
mounted on German roofs –, not to mention biogas,
biomass, or energy-from-waste is a timely reminder
that public policies and the ensuing finances rather
than natural amenities and weather conditions are
what really underpin the growth of renewables.
We have used the data collected and analysed in this
new barometer to refine our appraisal and classify
the Member States into three categories. The first, in
the minority, consists of “can doers”, who year in year
out, apply their conviction and resolve to developing
a purposeful renewable energy mix. While conten-
ders for Germany’s position are few and far between,
we should mention Denmark, Portugal and the UK,
who have enjoyed the strongest growth in renewable
energies over the past decade.
The second category – the “opportunists” – covers
the countries that have plumped for one or other
new energy source founded on natural availability,
sometimes only to abandon it straight away. Patent
examples of this are Spain’s wind energy and Italy’s
photovoltaic power. As for the remainder, they are
living off their natural asset-based givens, be they
geothermal or hydraulic sources.
The last category comprises those “sitting on the
bench” – countries like France, Poland and even Aus-
tria betting a little scattered over all the renewable
energy sources and that primarily bank on their
hydraulic capacities. The paradox of this situation
can be summarized by a single figure. Germany’s
solar and wind power output is four times higher
than that of France, yet the latter’s climate and natu-
ral assets are better than its important neighbour the
other side of the Rhine.
Now, this rating of the European situation is a little
fuzzy, because being the champion of one or more
specialities or producing a lot of electricity says
nothing about the country’s actual energy transition.
The point that this barometer brings home is that
the current growth pace across the European Union
is too slow to achieve the 2020 target. When we now
need +0,75 point every year, it was only 0,3 between
2015 and 2016. While eleven Member States have
already met the target set on the basis of their ori-
ginal situations, their renewables energy potentials
and economic performance levels and most of the
others are on track with their indicative trajecto-
ries for 2016, some of the EU heavyweights, such as
France and the UK are respectively 7 and 5.7 points
away from their goals... which taxes the final result
to an unwarranted degree.
While the EU’s 17% share of renewable energy in
its final energy consumption is twice its 2004 level
POWERHOUSE Vincent Jacques le Seigneur, President of Observ’ER
(8.5%), the missing 3 points seem difficult to achieve
in the short window of four years if no new policies
are put in place in the countries lagging behind. It
is all the more important that the European Parlia-
ment and the Council reach a new and challenging
agreement in the next Climate & Energy Package. This
higher target would send a strong signal of renewed
collective resolve and set a shared ambitious goal in
line with the Paris agreement that would generate
hope, business and jobs, all of which Old Man Europe
sorely needs.
Energy indicators
EUROBSERV ’ER – THE STATE OF RENEWABLE ENERGIES IN EUROPE – 2017 EDITIONEUROBSERV ’ER – THE STATE OF RENEWABLE ENERGIES IN EUROPE – 2017 EDITION
6 7
EurObserv’ER has been collecting data on the European Union’s renewable energy sources for eighteen years to describe the state and thrust of the various sectors in theme-based barometers. The first part of this assessment is a summary of the barometers published in 2017 for the wind energy, photovoltaic, solar thermal, concentrated solar power, biogas, biofuel and solid biomass sectors. The data drawn from these barometers has been consolidated with the official data avai-lable at the very end of the year.
The sectors that were not covered by indi-vidual barometers have also been analysed in detail and statistically monitored using data published in 2016. They cover small hydropower, heat pumps, geothermal energy, the incineration of renewable muni-cipal waste and ocean energies.
This work offers a full synopsis of the energy dimension of the twelve renewable sectors now developed at an industrial scale within the European Union.
The tables reproduce the most recent figures avai-
lable for each sector. In publishing this edition,
the EurObserv’ER data was fully reconciled with
the Eurostat data provided by the SHARES (Short
Assessment of Renewable Energy Sources) tool
published on 26 January 2018. This reconciliation
covers the indicators for electricity output, electri-
cal capacity, final energy consumption and derived
heat from heating or cogeneration plants. Since the
SHARES tool does not provide indicators on primary
energy and primary energy consumption, no statis-
tical reconciliation was attempted.
As for market indicators, such as market data for
different types of heat pumps or solar thermal col-
lectors, the EurObserv’ER source or indicators was
exclusively used.
As for the “heat” data, a distinction is made
between derived heat from the processing sec-
tor and final energy consumption in line with
Eurostat definitions. Derived heat covers the
total production of heat in heating plants and
cogeneration plants (combined heat and power
plants). It includes heat used by the auxiliaries of
the installation which use hot fluid (space heating,
liquid fuel heating, etc.) and losses in the installa-
tion/network heat exchanges. For auto-producing
entities i.e. entities generating electricity and/or
heat wholly or partially for their own use as an
activity which supports their primary activity) the
heat used by the undertaking for its own processes
is not included.
Final energy consumption is the total energy consu-
med by end users, such as households, industry and
agriculture. It is the energy which reaches the final
consumer’s door and excludes that which is used
by the energy sector itself including for deliveries,
and transformation. It also excludes fuel transfor-
med in the electrical power stations of industrial
auto-producers and coke transformed into blast-fur-
nace gas where this is not part of overall industrial
consumption but of the transformation sector. Final
energy consumption in «households, services, etc.»
covers quantities consumed by private households,
commerce, public administration, services, agricul-
ture and fisheries.
A distinction is also made with regard to electricity
and derived heat production data between output
from plants solely producing either electricity or
heat and the output from cogeneration plants
simultaneously producing heat and electricity.
Methodological note
ENERGY INDICATORS

Energy indicators
EUROBSERV ’ER – THE STATE OF RENEWABLE ENERGIES IN EUROPE – 2017 EDITIONEUROBSERV ’ER – THE STATE OF RENEWABLE ENERGIES IN EUROPE – 2017 EDITION
8 9
WIND POWER
MULTISPEED EUROPEUndeterred by the difficulties crea-
ted by weak demand and produc-
tion overcapacity in the electricity
market, the European Union wind
energy market pushed ahead by
commissioning almost 13 000 MW
in 2016 (12 939 MW to be precise) of
additional capacity (installed capa-
city less decommissioned capa-
city). This took total wind turbine
capacity to 154.4 GW at the end
of 2016. Once again, the buoyant
German market spearheaded the
installation drive. According to
AGEE-Stat, it installed 5 292 MW
and decommissioned 280 MW.
The resulting additional capacity
of 5 012 MW took the German wind
turbine base to 49.6 GW at the end
of 2016. The United Kingdom is the
second largest European market.
According to the BEIS (the Busi-
ness, Energy and Industrial Stra-
tegies Department) it installed
an additional 1 901 MW including
200 MW offshore for 16 217 MW of
capacity to date.
The French market finally picked
up again in 2016. Data released
by the French Ministry of Ecolo-
gical and Solidarity Transition’s
Statistics Division, SDES, shows
that nett installed capacity outs-
tripped the 1 GW mark (1 250 MW)
setting a new installation record.
Other EU markets performed parti-
cularly well including the Nether-
lands, which joined the ranks of
the global wind energy market
Top 10 with 866 MW (according
to Statistics Netherlands), on the
strength of hooking up the second
biggest offshore wind energy farm
ever installed (the 600-MW Gemini
project). Finland, which also
broke its own installation record
by adding 560 MW (according to
Statistics Finland), increased
its wind turbine base by more
than 50% over the twelve-month
period. Sweden, for its part, added
almost 594 MW (according to Sta-
tistics Sweden). We should point
out that in relation to their size,
the market momentum of these
countries is outstanding and has
been setting new trends with
regards to their electricity mix.
This upbeat news contrasts sharply
with the apathy that reigns in seve-
ral European Union markets. We
Sti
ftu
ng
Off
sho
re-
Win
den
erg
ie
Energy indicators
EUROBSERV ’ER – THE STATE OF RENEWABLE ENERGIES IN EUROPE – 2017 EDITIONEUROBSERV ’ER – THE STATE OF RENEWABLE ENERGIES IN EUROPE – 2017 EDITION
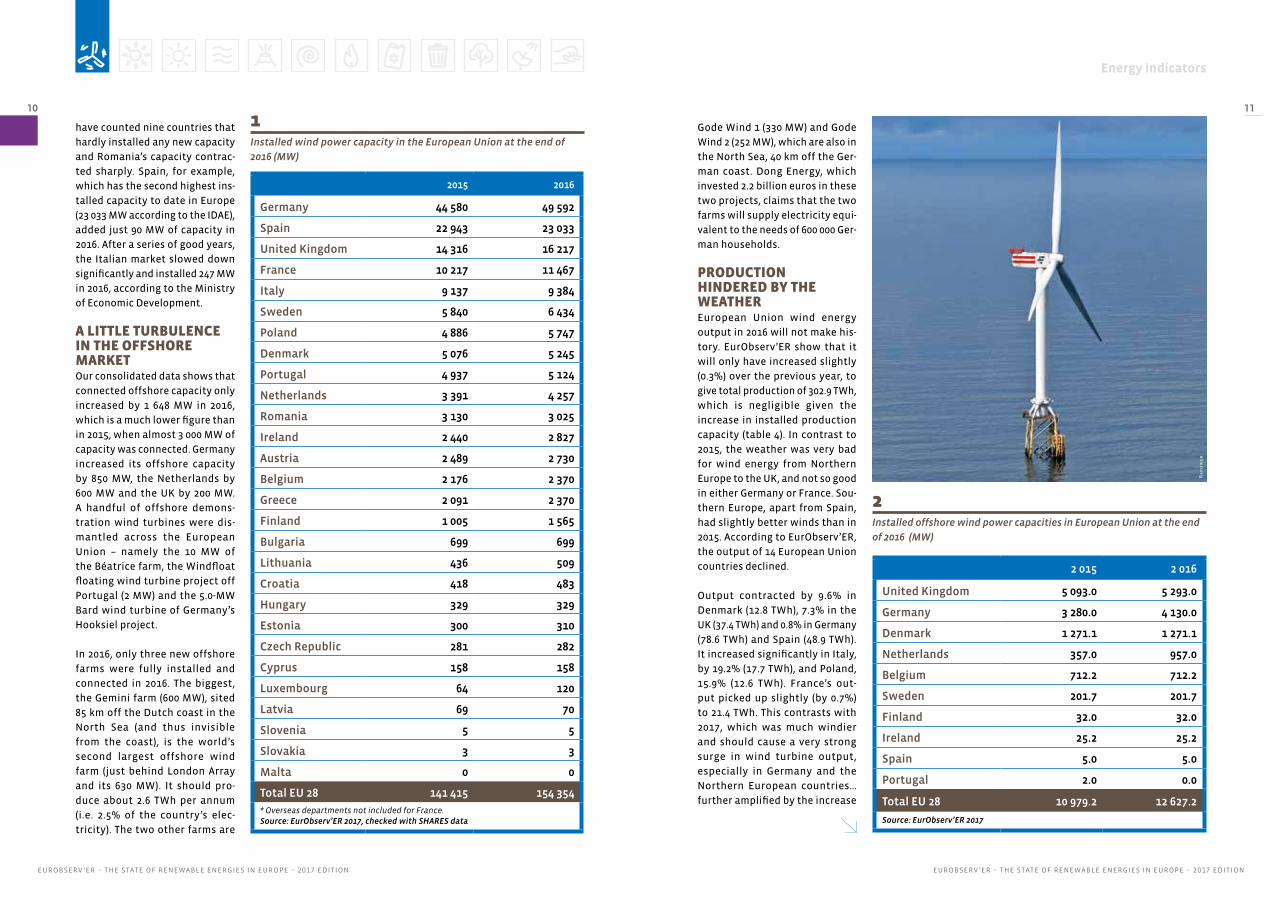
10 111Installed wind power capacity in the European Union at the end of
2016 (MW)
2 015 2 016
United Kingdom 5 093.0 5 293.0
Germany 3 280.0 4 130.0
Denmark 1 271.1 1 271.1
Netherlands 357.0 957.0
Belgium 712.2 712.2
Sweden 201.7 201.7
Finland 32.0 32.0
Ireland 25.2 25.2
Spain 5.0 5.0
Portugal 2.0 0.0
Total EU 28 10 979.2 12 627.2
Source: EurObserv’ER 2017
Gode Wind 1 (330 MW) and Gode
Wind 2 (252 MW), which are also in
the North Sea, 40 km off the Ger-
man coast. Dong Energy, which
invested 2.2 billion euros in these
two projects, claims that the two
farms will supply electricity equi-
valent to the needs of 600 000 Ger-
man households.
PRODUCTION HINDERED BY THE WEATHEREuropean Union wind energy
output in 2016 will not make his-
tory. EurObserv’ER show that it
will only have increased slightly
(0.3%) over the previous year, to
give total production of 302.9 TWh,
which is negligible given the
increase in installed production
capacity (table 4). In contrast to
2015, the weather was very bad
for wind energy from Northern
Europe to the UK, and not so good
in either Germany or France. Sou-
thern Europe, apart from Spain,
had slightly better winds than in
2015. According to EurObserv’ER,
the output of 14 European Union
countries declined.
Output contracted by 9.6% in
Denmark (12.8 TWh), 7.3% in the
UK (37.4 TWh) and 0.8% in Germany
(78.6 TWh) and Spain (48.9 TWh).
It increased significantly in Italy,
by 19.2% (17.7 TWh), and Poland,
15.9% (12.6 TWh). France’s out-
put picked up slightly (by 0.7%)
to 21.4 TWh. This contrasts with
2017, which was much windier
and should cause a very strong
surge in wind turbine output,
especially in Germany and the
Northern European countries…
further amplified by the increase
have counted nine countries that
hardly installed any new capacity
and Romania’s capacity contrac-
ted sharply. Spain, for example,
which has the second highest ins-
talled capacity to date in Europe
(23 033 MW according to the IDAE),
added just 90 MW of capacity in
2016. After a series of good years,
the Italian market slowed down
significantly and installed 247 MW
in 2016, according to the Ministry
of Economic Development.
A LITTLE TURBULENCE IN THE OFFSHORE MARKET Our consolidated data shows that
connected offshore capacity only
increased by 1 648 MW in 2016,
which is a much lower figure than
in 2015, when almost 3 000 MW of
capacity was connected. Germany
increased its offshore capacity
by 850 MW, the Netherlands by
600 MW and the UK by 200 MW.
A handful of offshore demons-
tration wind turbines were dis-
mantled across the European
Union – namely the 10 MW of
the Béatrice farm, the Windfloat
floating wind turbine project off
Portugal (2 MW) and the 5.0-MW
Bard wind turbine of Germany’s
Hooksiel project.
In 2016, only three new offshore
farms were fully installed and
connected in 2016. The biggest,
the Gemini farm (600 MW), sited
85 km off the Dutch coast in the
North Sea (and thus invisible
from the coast), is the world’s
second largest offshore wind
farm (just behind London Array
and its 630 MW). It should pro-
duce about 2.6 TWh per annum
(i.e. 2.5% of the country’s elec-
tricity). The two other farms are
2015 2016
Germany 44 580 49 592
Spain 22 943 23 033
United Kingdom 14 316 16 217
France 10 217 11 467
Italy 9 137 9 384
Sweden 5 840 6 434
Poland 4 886 5 747
Denmark 5 076 5 245
Portugal 4 937 5 124
Netherlands 3 391 4 257
Romania 3 130 3 025
Ireland 2 440 2 827
Austria 2 489 2 730
Belgium 2 176 2 370
Greece 2 091 2 370
Finland 1 005 1 565
Bulgaria 699 699
Lithuania 436 509
Croatia 418 483
Hungary 329 329
Estonia 300 310
Czech Republic 281 282
Cyprus 158 158
Luxembourg 64 120
Latvia 69 70
Slovenia 5 5
Slovakia 3 3
Malta 0 0
Total EU 28 141 415 154 354
* Overseas departments not included for France. Source: EurObserv’ER 2017, checked with SHARES data
2Installed offshore wind power capacities in European Union at the end
of 2016 (MW)
Rep
ow
er

Energy indicators
EUROBSERV ’ER – THE STATE OF RENEWABLE ENERGIES IN EUROPE – 2017 EDITIONEUROBSERV ’ER – THE STATE OF RENEWABLE ENERGIES IN EUROPE – 2017 EDITION
12 13
128.5
210 213.6
2014 2015 2016 2020
NR
EA
P
141.4
154.4143.2
NR
EA
P
Source: EurObserv’ER 2017
2015 2016
Germany 79.206 78.598
Spain 49.325 48.906
United Kingdom 40.317 37.367
France** 21.249 21.400
Italy 14.844 17.689
Sweden 16.268 15.479
Denmark 14.133 12.782
Poland 10.858 12.588
Portugal 11.607 12.474
Netherlands 7.550 8.170
Romania 7.063 6.590
Ireland 6.573 6.149
Belgium 5.574 5.436
Austria 4.840 5.235
Greece 4.621 5.146
Finland 2.327 3.068
Bulgaria 1.452 1.425
Lithuania 0.810 1.136
Croatia 0.796 1.014
Hungary 0.693 0.684
Estonia 0.715 0.594
Czech Republic 0.573 0.497
Cyprus 0.221 0.226
Latvia 0.147 0.128
Luxembourg 0.102 0.101
Slovakia 0.006 0.006
Slovenia 0.006 0.006
Malta 0.000 0.000
Total EU 28 301.877 302.893
* Overseas departments not included for France. Source: EurObserv’ER 2017, amended with SHARES data
in installed new capacity. Preli-
minary results released by AGEB
(AG Energiebilanzen), suggest that
Germany generated 105.5 TWh
in 2017 (including 18.3 TWh off-
shore), which amounts to a 34.2%
increase. It is important to remem-
ber that the renewable energy
directive targets for 2020 make
allowance for normalized produc-
tion for wind energy and hydro-
power to even out the variations
caused by climate events.
2030 – SIGHTS ARE SET ON ELECTRIFYING THE HEAT AND TRANSPORT SECTORS The European Commission rec-
kons that the renewable energy
share could be as much as 50%
of electricity production and
that wind energy could well
claim the lion’s share of that by
the 2030 timeline. WindEurope
forecasts that wind energy alone
could cover 24–28% of electricity
demand (i.e. about 778 TWh), in
the case of a “central scenario”
of 320 GW.
Yet there are some lingering uncer-
tainties because the wind energy
deployment pace will depend on
the robustness of the European
energy policy and the implemen-
tation of new operating rules for
the electricity market. Another
key factor is the roll-out and com-
mitment of the investments nee-
ded in the grid infrastructures and
electricity supply management
systems. The straitjacket of weak
European electricity growth will
also have to be gotten rid of by
implementing new policies that
encourage the electrification
of other energy sectors, namely
heat, refrigeration and transport,
with a view to decarbonizing the
energy market. Gradual conver-
sion of these sectors to producing
renewable electricity would open
new horizons for the sector, which
has no long-term limits. n
3Electricity production from wind power in the European Union in 2015
et 2016 (TWh)
4Comparison of the current trend against the NREAP
(National Renewable Energy Action Plans) roadmaps (in GW)
a2s
ea

Energy indicators
EUROBSERV ’ER – THE STATE OF RENEWABLE ENERGIES IN EUROPE – 2017 EDITIONEUROBSERV ’ER – THE STATE OF RENEWABLE ENERGIES IN EUROPE – 2017 EDITION
14 15
While China and the USA
took full advantage of the
price competitivity of solar PV
power and enjoyed a twofold
increase in their markets (China
rose to 34.5 GW in 2016 compa-
red to 15.1 GW in 2015 and the
USA to 14.8 GW in 2016 compared
to 7.5 GW in 2015), the European
Union’s newly connected installed
capacity dropped sharply again in
2016. According to EurObserv’ER,
it increased by only 6 122 MW in
2016 compared to 8 006 MW in 2015,
which equates to a 23.5% slower
growth pace. The slowdown in the
connection pace of the British and
French markets is largely to blame.
Nonetheless the additional capa-
city took the EU’s PV base past the
100 GW market at the very end of
the year with 100 800 MW.
THE UK’S CONNECTION PACE FALLSFor the third year running, the UK
has led the European market. Accor-
ding to the BEIS (Department for
Business, Energy & Industrial Stra-
tegy), solar PV capacity increased by
2 364 MW in 2016, but the year-on-
year grid connection pace dropped
by 41%. Most of the new connec-
tions were from Renewable Obliga-
tion-accredited sites and occurred
during the first quarter of the year,
before the RO system closed on
1 April 2016. The connection pace
was much slower over the following
three quarters and was essentially
made up of connections of smaller
sites remunerated by the Feed-in
Tariff system.
SIGNIFICANT FALL IN BID PRICES FOR SOLAR POWER IN GERMANYThe year 2016 ended on a high note
in Germany, putting an end to the
steady decline in the amount of
capacity connected annually since
2013. According to the German
Environmental agency that now
coordinates the working group on
renewable energy statistics (AGEE-
Stat), the country added 1 471 MW
of additional capacity in 2016
(compared to 1 345 MW in 2015),
which took its total base up to 40
714 MW. The increase in the num-
ber of connections at the end of
the year was caused in part by the
sharp drop in the market price of PV
panels, and in part by a change to
PHOTOVOLTAIC
Sto
ck
ho
lms
Ha
mn
ar
Energy indicators
EUROBSERV ’ER – THE STATE OF RENEWABLE ENERGIES IN EUROPE – 2017 EDITIONEUROBSERV ’ER – THE STATE OF RENEWABLE ENERGIES IN EUROPE – 2017 EDITION
16 17
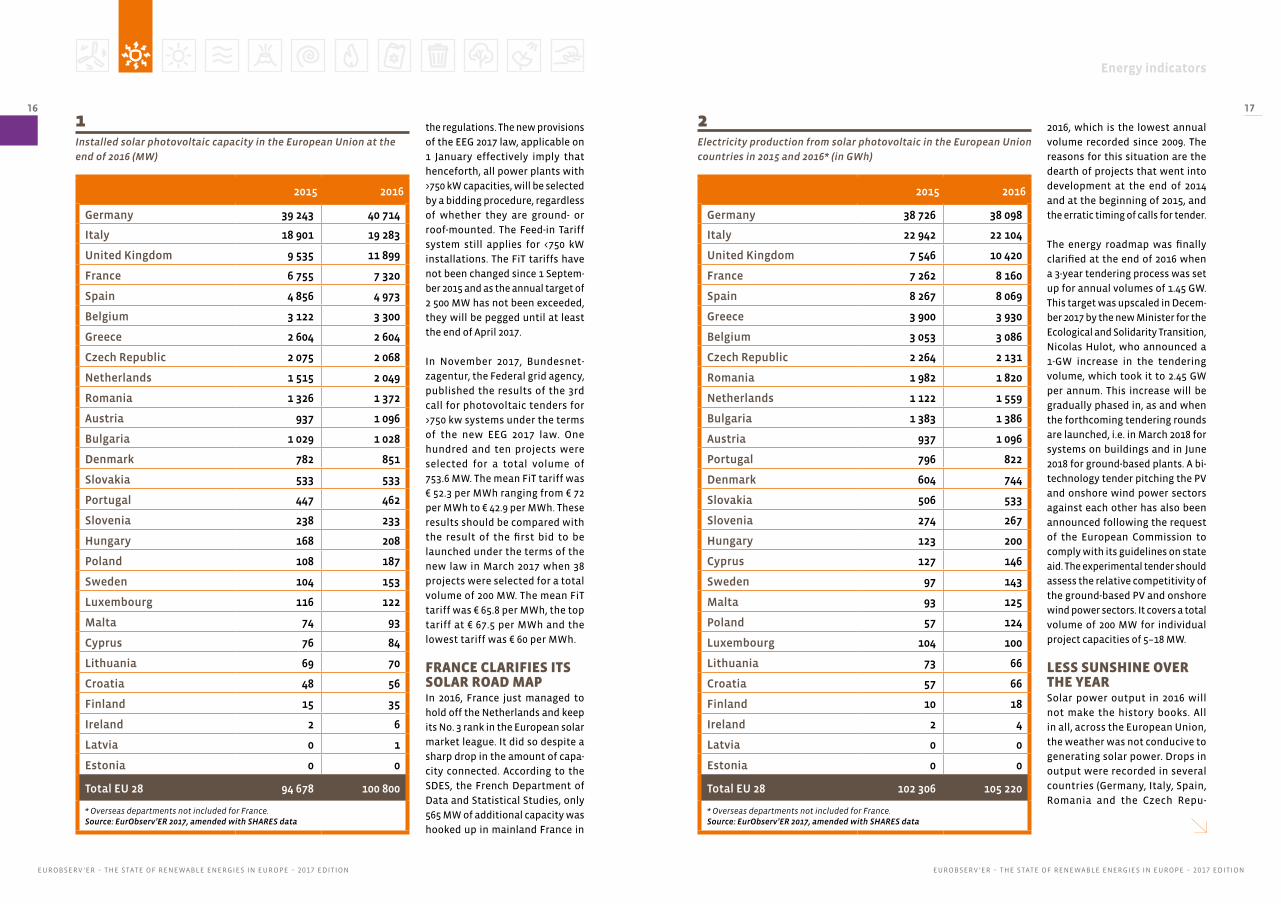
2015 2016
Germany 39 243 40 714
Italy 18 901 19 283
United Kingdom 9 535 11 899
France 6 755 7 320
Spain 4 856 4 973
Belgium 3 122 3 300
Greece 2 604 2 604
Czech Republic 2 075 2 068
Netherlands 1 515 2 049
Romania 1 326 1 372
Austria 937 1 096
Bulgaria 1 029 1 028
Denmark 782 851
Slovakia 533 533
Portugal 447 462
Slovenia 238 233
Hungary 168 208
Poland 108 187
Sweden 104 153
Luxembourg 116 122
Malta 74 93
Cyprus 76 84
Lithuania 69 70
Croatia 48 56
Finland 15 35
Ireland 2 6
Latvia 0 1
Estonia 0 0
Total EU 28 94 678 100 800
* Overseas departments not included for France. Source: EurObserv’ER 2017, amended with SHARES data
2015 2016
Germany 38 726 38 098
Italy 22 942 22 104
United Kingdom 7 546 10 420
France 7 262 8 160
Spain 8 267 8 069
Greece 3 900 3 930
Belgium 3 053 3 086
Czech Republic 2 264 2 131
Romania 1 982 1 820
Netherlands 1 122 1 559
Bulgaria 1 383 1 386
Austria 937 1 096
Portugal 796 822
Denmark 604 744
Slovakia 506 533
Slovenia 274 267
Hungary 123 200
Cyprus 127 146
Sweden 97 143
Malta 93 125
Poland 57 124
Luxembourg 104 100
Lithuania 73 66
Croatia 57 66
Finland 10 18
Ireland 2 4
Latvia 0 0
Estonia 0 0
Total EU 28 102 306 105 220
* Overseas departments not included for France. Source: EurObserv’ER 2017, amended with SHARES data
the regulations. The new provisions
of the EEG 2017 law, applicable on
1 January effectively imply that
henceforth, all power plants with
>750 kW capacities, will be selected
by a bidding procedure, regardless
of whether they are ground- or
roof-mounted. The Feed-in Tariff
system still applies for <750 kW
installations. The FiT tariffs have
not been changed since 1 Septem-
ber 2015 and as the annual target of
2 500 MW has not been exceeded,
they will be pegged until at least
the end of April 2017.
In November 2017, Bundesnet-
zagentur, the Federal grid agency,
published the results of the 3rd
call for photovoltaic tenders for
>750 kw systems under the terms
of the new EEG 2017 law. One
hundred and ten projects were
selected for a total volume of
753.6 MW. The mean FiT tariff was
€ 52.3 per MWh ranging from € 72
per MWh to € 42.9 per MWh. These
results should be compared with
the result of the first bid to be
launched under the terms of the
new law in March 2017 when 38
projects were selected for a total
volume of 200 MW. The mean FiT
tariff was € 65.8 per MWh, the top
tariff at € 67.5 per MWh and the
lowest tariff was € 60 per MWh.
FRANCE CLARIFIES ITS SOLAR ROAD MAPIn 2016, France just managed to
hold off the Netherlands and keep
its No. 3 rank in the European solar
market league. It did so despite a
sharp drop in the amount of capa-
city connected. According to the
SDES, the French Department of
Data and Statistical Studies, only
565 MW of additional capacity was
hooked up in mainland France in
2016, which is the lowest annual
volume recorded since 2009. The
reasons for this situation are the
dearth of projects that went into
development at the end of 2014
and at the beginning of 2015, and
the erratic timing of calls for tender.
The energy roadmap was finally
clarified at the end of 2016 when
a 3-year tendering process was set
up for annual volumes of 1.45 GW.
This target was upscaled in Decem-
ber 2017 by the new Minister for the
Ecological and Solidarity Transition,
Nicolas Hulot, who announced a
1-GW increase in the tendering
volume, which took it to 2.45 GW
per annum. This increase will be
gradually phased in, as and when
the forthcoming tendering rounds
are launched, i.e. in March 2018 for
systems on buildings and in June
2018 for ground-based plants. A bi-
technology tender pitching the PV
and onshore wind power sectors
against each other has also been
announced following the request
of the European Commission to
comply with its guidelines on state
aid. The experimental tender should
assess the relative competitivity of
the ground-based PV and onshore
wind power sectors. It covers a total
volume of 200 MW for individual
project capacities of 5–18 MW.
LESS SUNSHINE OVER THE YEARSolar power output in 2016 will
not make the history books. All
in all, across the European Union,
the weather was not conducive to
generating solar power. Drops in
output were recorded in several
countries (Germany, Italy, Spain,
Romania and the Czech Repu-
1Installed solar photovoltaic capacity in the European Union at the
end of 2016 (MW)
2Electricity production from solar photovoltaic in the European Union
countries in 2015 and 2016* (in GWh)

Energy indicators
EUROBSERV ’ER – THE STATE OF RENEWABLE ENERGIES IN EUROPE – 2017 EDITIONEUROBSERV ’ER – THE STATE OF RENEWABLE ENERGIES IN EUROPE – 2017 EDITION
18 19
3Comparison of the current trend of photovoltaic capacity installed
against the NREAP (National Renewable Energy Action Plans) roadmap
(in GWp)
blic). The most active markets
leaving aside Germany – the UK
and France – had the highest out-
puts. According to EurObserv’ER,
European Union PV output rose
to 105.2 TW in 2016, which repre-
sents 2.8% year-on-year growth.
Yet while output increased by
almost 10 TWh between 2014 and
2015, it only increased by 2.9 TWh
between 2015 and 2016.
CONSUMERS WILL BE AT THE CENTRE OF THE FORTHCOMING ENERGY UNIONCurrent developments in support
mechanisms, which are geared
to market mechanisms, have an
impact on the grid connection
figures. The auction system, which
has become the rule for medium-
and high-capacity installations,
gives Member States better
control of their markets while
limiting the increase in the price
of electricity to consumers. It also
prepares the ground for the next
installation rounds that will be
required to achieve the individual
country renewable energy targets,
which were set under the terms
of the European RES Directive.
Additionally, it meets the demand
from the major utilities to limit
the financial burden on the profi-
tability of their production means
caused by generating variable
renewable electricity. In effect,
the influx of solar or wind power
onto the market at zero marginal
cost, exerts downward pressure
on the price of electricity and
may even lead to negative prices
during periods of overproduction.
PV development has been faster
than most of the Member States
expected when they set their
National Renewable Energy Action
Plan PV targets. Most of these
countries have exceeded their pro-
duction forecasts. Furthermore, if
we add up all the European Union
countries’ photovoltaic targets for
2020, the combined target was
outstripped at the end of 2015
and could reach 130 GW by 2020
compared to the initial combined
forecast of 84.4 GW.
The PV sector is now adjusting to
a new market structure, where
“prosumers” (consumer-produ-
cers) will play an increasing role.
The movement is inspired by eco-
citizenship… wanting to produce
the electricity to cover their needs
locally as well as for financial gain.
It is in consumers’ interests to pro-
duce their own electricity for less
than the purchase price invoiced
by the utility companies and sell
their surplus electricity onto the
electricity market. n
100.8
130
84.4
NR
EA
P
2014 2015 2016 2020
86.894.7
54.4
NR
EA
P
Source: EurObserv’ER 2017
ED
F

Energy indicators
EUROBSERV ’ER – THE STATE OF RENEWABLE ENERGIES IN EUROPE – 2017 EDITIONEUROBSERV ’ER – THE STATE OF RENEWABLE ENERGIES IN EUROPE – 2017 EDITION
20 21
The European solar thermal
market’s foundations are being
increasingly eroded, as the Euro-
pean Union market now stands at
2.6 million m2, which is 2 million m2
less than it was in the reference
year, 2008 (4.6 million m2). EurOb-
serv’ER puts the thermal capacity
of newly-installed solar thermal
facilities at 1 810 MWth in 2016,
which is 5.1% less than in 2015.
Taking 2008 as the reference year,
the market has been contracting
by an annual average of 7%. Flat
plate collectors still account for
most of the installed surface area
(92.3%), followed by vacuum collec-
tors (6.4%) and unglazed collectors
(1.3%). The total surface area of the
European Union’s solar thermal
base was about 50.4 million m2
(35 287 MWth), which is 3.6% more
than in 2015.
The underlying reasons for the
trend decline are constant. The
solar thermal market is directly
hit by the low prices of natural
gas and heating oil that affect
solar heat’s ability to compete by
giving the advantage to the mul-
tiservice condensing gas boiler
market. The stop-start, degressive
SOLAR THERMAL
subsidy policies operating in some
countries have also hit solar ther-
mal’s momentum in the residential
sector segment. Solar thermal also
competes badly with other easier-
to-install, renewable solutions
whose purchase price is lower,
such as thermodynamic hot water
heaters and AGHP. PV’s continuing
appeal to private homeowners and
investors also stands in the way of
solar thermal’s development. As
photovoltaic power self-consump-
tion has been given the green light,
PV is also entering the domestic
hot water production segment as
an electric hot water tank can use
any surplus electricity generated.
Market forces are roughly the same
as they were last year. The German
market is still well placed in Euro-
pean solar thermal market; as yet
again, it accommodates almost 30%
of the newly-installed collector area
in the European Union. However, it
has failed to stem its own domestic
market’s decline. Denmark, which
promotes the construction of vast
collector fields to supply heating
networks, is clearly blazing the
trail for solar thermal. The main
change with regard to last year
THE GERMAN MARKET CONTINUES TO SLIDE Despite the efforts made to prop up
the sector, the solar thermal mar-
ket’s downward trend could not be
stemmed. According to AGEE-Stat,
the Working Group on Renewable
has been felt in the Polish mar-
ket, which having grown in 2015,
took a nose dive in 2016. The state
of play in France is now causing
great concern, where as a result
of the policy of promoting electri-
cal hot water production systems
(such as thermodynamic hot water
heaters) that are attractive for
installers who consider this type
of system easier to install, solar
thermal has become a niche mar-
ket for domestic hot-water produc-
tion or solar heating. In a couple of
markets – Spain and Italy – where
solar thermal is a priority energy
source in new build, the low level
of construction activity also casts a
shadow over the prospects for sec-
tor development. Only Greece is a
safe bet and can be trusted to main-
tain a 270 000-m2 installation level
from year to year, partly as it needs
to replace existing equipment.
SOLAR HEAT WARMS UP DANISH NETWORKSDenmark had an exceptional year
in 2016. It installed 478 297 m2 of
collectors, 99% of which were
intended to supply heating
networks while the remaining
one percent was for individual
domestic hot water production.
This newly-installed area is almost
double the previous year’s figure
(260 161 m2). Denmark has built
31 new solar heating networks
and extended the collector field
to 5 other networks. It had already
built 15 heating networks and
extended 3 networks the previous
year. According to PlanEnergi cal-
culations there are 104 solar hea-
ting networks in Denmark supplied
by 1 301 000 m2 of collectors. The
town of Silkeborg holds the record
for the biggest solar heating
network in the country (and the
world) since December 2016.
Est
if
Energy indicators
EUROBSERV ’ER – THE STATE OF RENEWABLE ENERGIES IN EUROPE – 2017 EDITIONEUROBSERV ’ER – THE STATE OF RENEWABLE ENERGIES IN EUROPE – 2017 EDITION
22 23
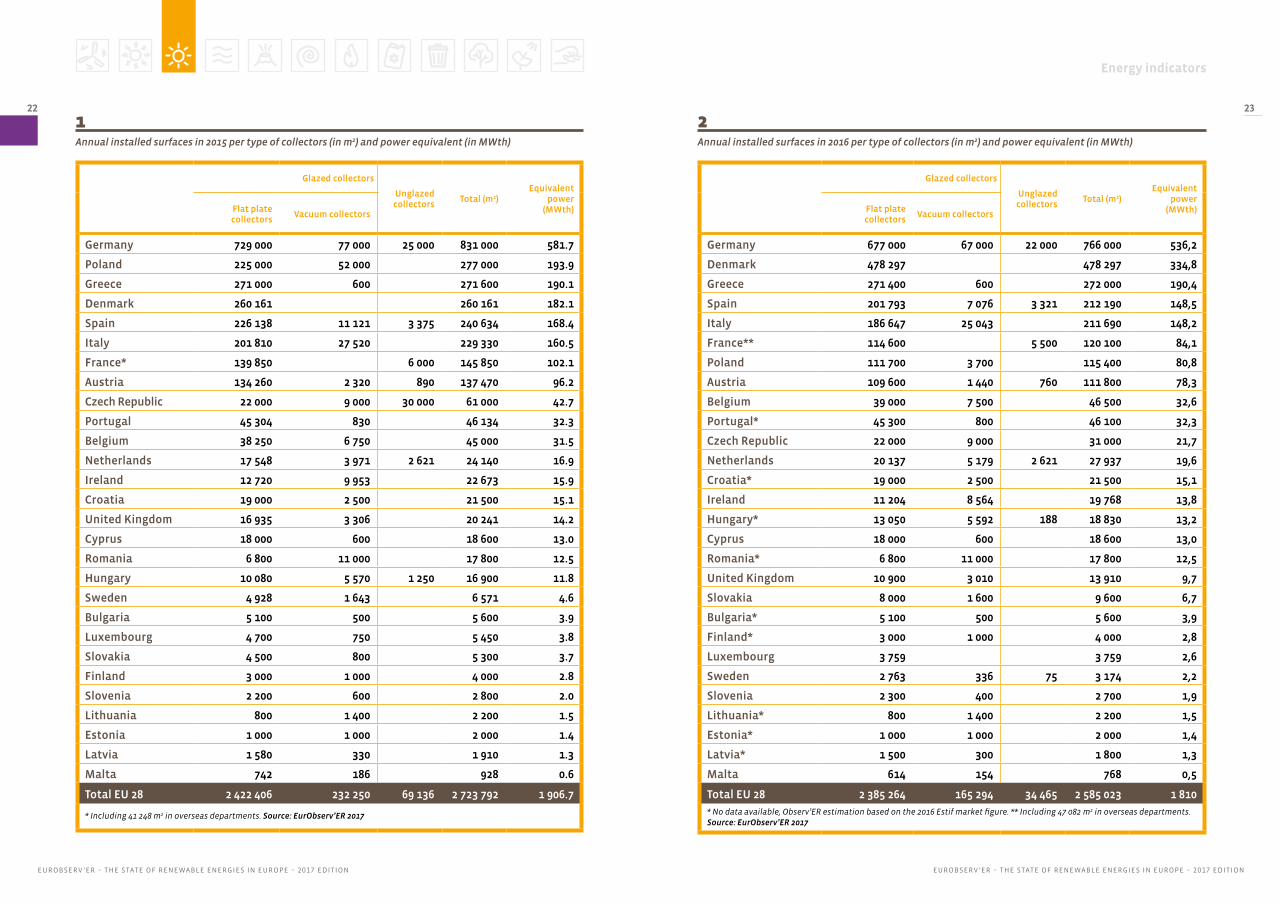
2Annual installed surfaces in 2016 per type of collectors (in m2) and power equivalent (in MWth)
1Annual installed surfaces in 2015 per type of collectors (in m2) and power equivalent (in MWth)
Glazed collectors
Unglazed collectors
Total (m2)Equivalent
power (MWth)Flat plate
collectorsVacuum collectors
Germany 729 000 77 000 25 000 831 000 581.7
Poland 225 000 52 000 277 000 193.9
Greece 271 000 600 271 600 190.1
Denmark 260 161 260 161 182.1
Spain 226 138 11 121 3 375 240 634 168.4
Italy 201 810 27 520 229 330 160.5
France* 139 850 6 000 145 850 102.1
Austria 134 260 2 320 890 137 470 96.2
Czech Republic 22 000 9 000 30 000 61 000 42.7
Portugal 45 304 830 46 134 32.3
Belgium 38 250 6 750 45 000 31.5
Netherlands 17 548 3 971 2 621 24 140 16.9
Ireland 12 720 9 953 22 673 15.9
Croatia 19 000 2 500 21 500 15.1
United Kingdom 16 935 3 306 20 241 14.2
Cyprus 18 000 600 18 600 13.0
Romania 6 800 11 000 17 800 12.5
Hungary 10 080 5 570 1 250 16 900 11.8
Sweden 4 928 1 643 6 571 4.6
Bulgaria 5 100 500 5 600 3.9
Luxembourg 4 700 750 5 450 3.8
Slovakia 4 500 800 5 300 3.7
Finland 3 000 1 000 4 000 2.8
Slovenia 2 200 600 2 800 2.0
Lithuania 800 1 400 2 200 1.5
Estonia 1 000 1 000 2 000 1.4
Latvia 1 580 330 1 910 1.3
Malta 742 186 928 0.6
Total EU 28 2 422 406 232 250 69 136 2 723 792 1 906.7
* Including 41 248 m2 in overseas departments. Source: EurObserv’ER 2017
Glazed collectors
Unglazed collectors
Total (m2)Equivalent
power (MWth)Flat plate
collectorsVacuum collectors
Germany 677 000 67 000 22 000 766 000 536,2
Denmark 478 297 478 297 334,8
Greece 271 400 600 272 000 190,4
Spain 201 793 7 076 3 321 212 190 148,5
Italy 186 647 25 043 211 690 148,2
France** 114 600 5 500 120 100 84,1
Poland 111 700 3 700 115 400 80,8
Austria 109 600 1 440 760 111 800 78,3
Belgium 39 000 7 500 46 500 32,6
Portugal* 45 300 800 46 100 32,3
Czech Republic 22 000 9 000 31 000 21,7
Netherlands 20 137 5 179 2 621 27 937 19,6
Croatia* 19 000 2 500 21 500 15,1
Ireland 11 204 8 564 19 768 13,8
Hungary* 13 050 5 592 188 18 830 13,2
Cyprus 18 000 600 18 600 13,0
Romania* 6 800 11 000 17 800 12,5
United Kingdom 10 900 3 010 13 910 9,7
Slovakia 8 000 1 600 9 600 6,7
Bulgaria* 5 100 500 5 600 3,9
Finland* 3 000 1 000 4 000 2,8
Luxembourg 3 759 3 759 2,6
Sweden 2 763 336 75 3 174 2,2
Slovenia 2 300 400 2 700 1,9
Lithuania* 800 1 400 2 200 1,5
Estonia* 1 000 1 000 2 000 1,4
Latvia* 1 500 300 1 800 1,3
Malta 614 154 768 0,5
Total EU 28 2 385 264 165 294 34 465 2 585 023 1 810
* No data available, Observ’ER estimation based on the 2016 Estif market figure. ** Including 47 082 m2 in overseas departments. Source: EurObserv’ER 2017

Energy indicators
EUROBSERV ’ER – THE STATE OF RENEWABLE ENERGIES IN EUROPE – 2017 EDITIONEUROBSERV ’ER – THE STATE OF RENEWABLE ENERGIES IN EUROPE – 2017 EDITION
24 254Comparison of the current trend against the NREAP (National Renewable
Energy Action Plans) roadmap (in ktoe)
3Cumulated capacity of thermal solar collectors* installed in the European Union in 2015 and 2016**
(in m2 and in MWth)
Energy-Statistics, 766 000 m2 (inclu-
ding 22 000 m2 unglazed) of collec-
tors were installed in Germany in
2016, compared to 831 000 m2 in 2015
(including 25 000 m2 of unglazed col-
lectors), which equates to a 7.8%
decline. The full raft of aids targe-
ting the residential, collective seg-
ments and industrial heating were
to no avail. BAFA (the Federal Office
for Economic Affairs and Export
Control) ascribes the solar thermal
market contraction to low heating
oil and gas prices which erode the
competitiveness of solar thermal
solutions.
THE POLISH MARKET PLUMMETS IN THE ABSENCE OF INCENTIVESAlthough the Polish solar ther-
mal market was resilient in 2015,
expanding by 6.5% to 277 000 m2,
it took a nose dive in 2016 plum-
meting to 115 400 m2 according to
data released by SPIUG (Associa-
tion of Manufacturers and Impor-
ters of Heating Appliances). The
market was expected to decline
but on a much smaller scale. The
reason for this fall is that the
subsidies awarded to solar ther-
mal under the “transient” natio-
nal Prosument programme were
discontinued in the summer of
2016. The remaining funds of the
NFOSiGW (National Fund for Envi-
ronmental Protection and Water
management) residential subsidy
programme that formed the basis
of the Prosument programme were
transferred to regional funds res-
ponsible for setting up this policy.
SOLAR THERMAL IS LOSING GROUNDThe downward trend of the market
witnessed since 2009 has seen the
gap with the National Renewable
Energy Action Plan (NREAP) trajec-
tory open up. What is of even more
concern, is that in a few countries
(Austria, Sweden and Cyprus) the
area of collectors in service is ten-
ding to contract as their newly-ins-
talled areas do not make up for the
areas that have been decommissio-
ned. The capacity and surface area
of decommissioned installations
tends to rise every year, because
the solar thermal market built up
gradually in the second half of
the 1990s, peaking at about one
million m2 of newly-installed col-
lectors per annum. As the service
life of these collectors ends and
if market recovery does not come
about, growth in the contribution
of solar heat can only decline.
The intermediate trajectory of the
NREAP plans was set at 3 Mtoe
for solar heat in 2015, yet it only
scraped past the 2.1-Mtoe mark
in 2016. EurObserv’ER reckons
that if nothing is done to reverse
the trend quickly, the difference
between reality and the targets
could be much wider than pre-
viously feared and could even fall
below 50% of the NREAP commit-
ments for 2020 (graph 2).
While the outlook is grim, it is not
disastrous, for while the indivi-
dual home segment cannot deli-
ver to expectations, the growth
prospects for solar thermal in the
collective housing hot water pro-
duction, industrial heat production
and district heating are much more
promising. In fact, they are under-
pinned by stricter European regu-
lations and the offer of suitable
equipment by the manufacturers
to slash production costs (large col-
lectors, suitable technologies). n
2015 2016
m2 MWth m2 MWth
Germany 18 625 000 13 038 19 121 000 13 385
Austria 5 221 342 3 655 5 210 202 3 647
Greece 4 390 375 3 073 4 477 375 3 134
Spain 3 693 638 2 586 3 905 928 2 734
Italy 3 724 000 2 607 3 891 000 2 724
France*** 2 929 960 2 051 3 018 040 2 113
Poland 2 017 337 1 412 2 132 467 1 493
Danemark 1 016 000 711 1 369 000 958
Portugal 1 121 104 785 1 167 204 817
Czech Republic 1 106 542 775 1 137 542 796
United Kingdom 702 342 492 715 252 501
Belgium 661 000 463 705 000 494
Netherlands 647 397 453 652 205 457
Cyprus 659 224 461 647 824 453
Sweden 478 000 335 475 000 333
Ireland 320 000 224 343 000 240
Hungary 269 000 188 287 296 201
Slovenia 238 800 167 241 500 169
Romania 203 670 143 221 300 155
Croatia 183 000 128 204 500 143
Slovakia 171 420 120 181 020 127
Bulgaria 84 800 59 85 000 60
Luxembourg 55 590 39 59 349 42
Finland 50 000 35 55 000 39
Malta 50 904 36 51 671 36
Latvia 20 920 15 22 720 16
Lithuania 15 750 11 17 950 13
Estonia 12 120 8 14 120 10
Total EU 28 48 669 235 34 068 50 409 465 35 287
* All technologies including unglazed collectors. ** Estimate. *** Overseas department included. Source: EurObserv’ER 2017
1 940 2 0552 697
6 348
2014 2015 2016 2020
NR
EA
P
2 055
3 041.5
NR
EA
P
Source: EurObserv’ER 2017

Energy indicators
EUROBSERV ’ER – THE STATE OF RENEWABLE ENERGIES IN EUROPE – 2017 EDITIONEUROBSERV ’ER – THE STATE OF RENEWABLE ENERGIES IN EUROPE – 2017 EDITION
26 27
1Small hydraulic capacity (≤10 MW) in running in the European Union
countries in 2015 and in 2016* (in MW)
SMALL HYDROPOWER
This sector includes installations
of up to 10 MW of capacity that
usually operate as run-of-the-river
plants, without a retaining dam
in place. Yet they are generally
equipped with a small dam that
does not store water but creates
a vertical drop. The height of the
water created, combined with the
speed at which it flows determine
the amount of energy produced.
This method offers several advan-
tages such as positive contribution
to grid stability. It enables local
energy sources to be used, which
secure the local power supply.
However, the potential for develo-
ping small hydropower is hampe-
red by environmental legislation,
such as the framework directive,
Natura 2000, which covers water
and planning protected areas.
The European Commission and
the public powers seek to reconcile
the issues of producing renewable
electricity while applying the
best conservation practices to
watercourses. The regulations
concerning hydropower facilities
focus on the best possible energy
optimisation combined with miti-
gating the impacts on biodiversity
as much as possible.
EurObserv’ER puts the net capacity
of small hydropower facilities in the
European Union at 14 294 MW based
on official data. Yet again, capacity
rose in 2016 by 282 MW, which
equates a 1.9% increased (it rose
by 256 MW in 2015). By way of com-
parison, at the end of 2016, the com-
bined net capacity of large, >10 MW
hydropower facilities, excluding
pumped-storage plants was
90 384 MW (89 549 MW at the end
of 2015). Thus, at the close of 2016
small- and large-scale hydropower
in the European Union offered
combined capacity of 104 678 MW
(103 561 MW a year earlier). This
capacity is of the same magnitude
as the European Union’s solar capa-
city (PV and CSP), but with a much
higher load factor and thus much
higher output (see further on).
The top three countries for small
hydropower capacity are Italy
(3 299 MW), France (2 096 MW) and
Spain (1 947 MW). In 2016 Austria
(1 332 MW) managed to overtake
Germany (1 326 MW) to take fourth
place. Looking at the main changes,
Italy enjoyed the most significant
2015 2016
Italy 3 208 3 299
France 2 065 2 096
Spain 1 953 1 947
Austria 1 280 1 332
Germany 1 327 1 326
Sweden 961 961
Romania 518 535
United Kingdom 368 426
Portugal 394 404
Czech Republic 335 337
Bulgaria 301 321
Finland 306 307
Poland 279 279
Greece 223 223
Slovenia 157 155
Slovakia 75 77
Belgium 66 69
Ireland 41 41
Croatia 36 37
Luxembourg 34 34
Latvia 29 29
Lithuania 27 27
Hungary 16 16
Denmark 7 10
Estonia 6 6
Total EU 28 14 012 14 294
Source: EurObserv’ER 2017, amended with SHARES data
Pix
ab
ay
Energy indicators
EUROBSERV ’ER – THE STATE OF RENEWABLE ENERGIES IN EUROPE – 2017 EDITIONEUROBSERV ’ER – THE STATE OF RENEWABLE ENERGIES IN EUROPE – 2017 EDITION
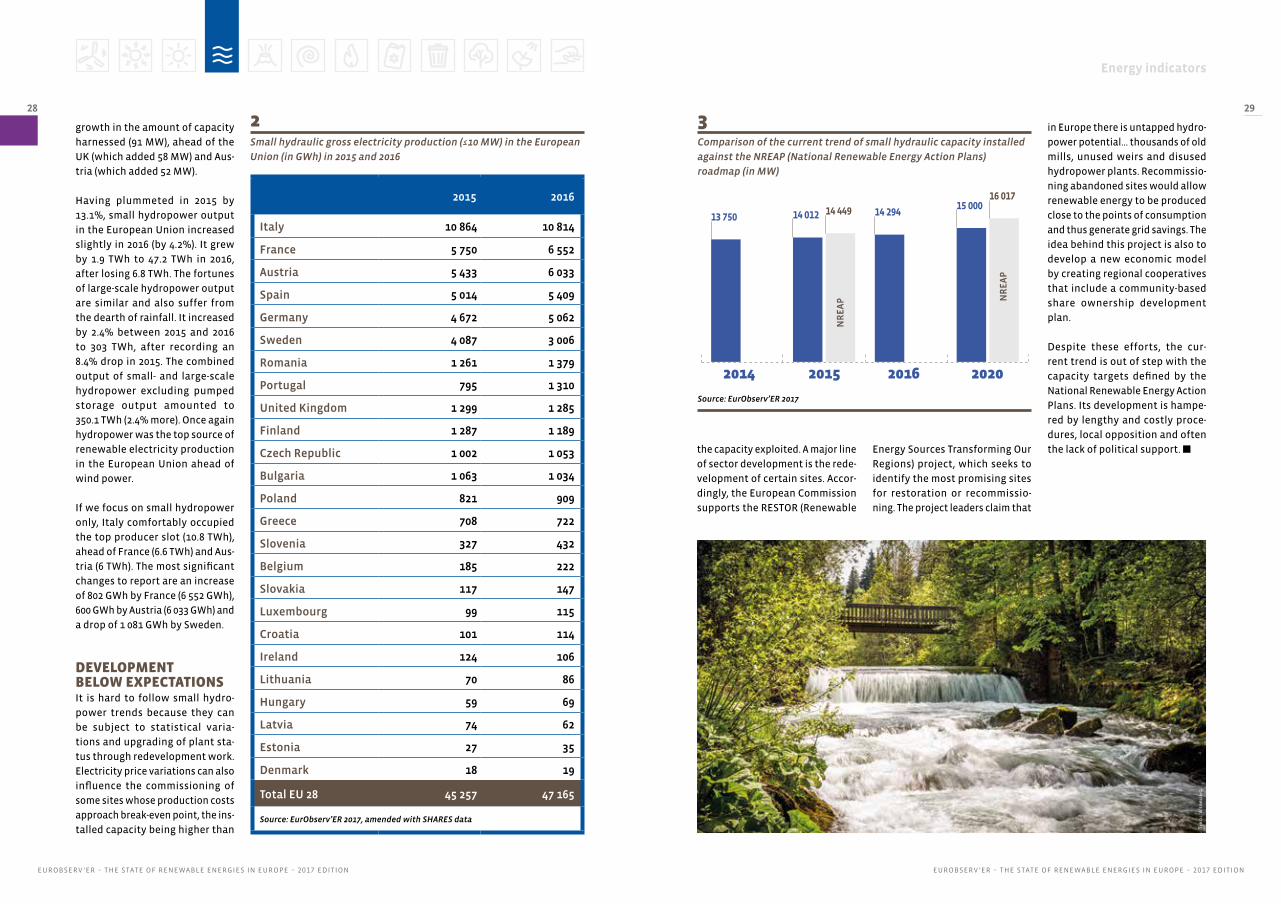
28 292Small hydraulic gross electricity production (≤10 MW) in the European
Union (in GWh) in 2015 and 2016
3Comparison of the current trend of small hydraulic capacity installed
against the NREAP (National Renewable Energy Action Plans)
roadmap (in MW)
growth in the amount of capacity
harnessed (91 MW), ahead of the
UK (which added 58 MW) and Aus-
tria (which added 52 MW).
Having plummeted in 2015 by
13.1%, small hydropower output
in the European Union increased
slightly in 2016 (by 4.2%). It grew
by 1.9 TWh to 47.2 TWh in 2016,
after losing 6.8 TWh. The fortunes
of large-scale hydropower output
are similar and also suffer from
the dearth of rainfall. It increased
by 2.4% between 2015 and 2016
to 303 TWh, after recording an
8.4% drop in 2015. The combined
output of small- and large-scale
hydropower excluding pumped
storage output amounted to
350.1 TWh (2.4% more). Once again
hydropower was the top source of
renewable electricity production
in the European Union ahead of
wind power.
If we focus on small hydropower
only, Italy comfortably occupied
the top producer slot (10.8 TWh),
ahead of France (6.6 TWh) and Aus-
tria (6 TWh). The most significant
changes to report are an increase
of 802 GWh by France (6 552 GWh),
600 GWh by Austria (6 033 GWh) and
a drop of 1 081 GWh by Sweden.
DEVELOPMENT BELOW EXPECTATIONSIt is hard to follow small hydro-
power trends because they can
be subject to statistical varia-
tions and upgrading of plant sta-
tus through redevelopment work.
Electricity price variations can also
influence the commissioning of
some sites whose production costs
approach break-even point, the ins-
talled capacity being higher than
2015 2016
Italy 10 864 10 814
France 5 750 6 552
Austria 5 433 6 033
Spain 5 014 5 409
Germany 4 672 5 062
Sweden 4 087 3 006
Romania 1 261 1 379
Portugal 795 1 310
United Kingdom 1 299 1 285
Finland 1 287 1 189
Czech Republic 1 002 1 053
Bulgaria 1 063 1 034
Poland 821 909
Greece 708 722
Slovenia 327 432
Belgium 185 222
Slovakia 117 147
Luxembourg 99 115
Croatia 101 114
Ireland 124 106
Lithuania 70 86
Hungary 59 69
Latvia 74 62
Estonia 27 35
Denmark 18 19
Total EU 28 45 257 47 165
Source: EurObserv’ER 2017, amended with SHARES data
Source: EurObserv’ER 2017
the capacity exploited. A major line
of sector development is the rede-
velopment of certain sites. Accor-
dingly, the European Commission
supports the RESTOR (Renewable
14 29415 000
16 017
2014 2015 2016 2020
NR
EA
P
13 750 14 012 14 449
NR
EA
P
Tir
ol
Wer
bun
g
Energy Sources Transforming Our
Regions) project, which seeks to
identify the most promising sites
for restoration or recommissio-
ning. The project leaders claim that
in Europe there is untapped hydro-
power potential… thousands of old
mills, unused weirs and disused
hydropower plants. Recommissio-
ning abandoned sites would allow
renewable energy to be produced
close to the points of consumption
and thus generate grid savings. The
idea behind this project is also to
develop a new economic model
by creating regional cooperatives
that include a community-based
share ownership development
plan.
Despite these efforts, the cur-
rent trend is out of step with the
capacity targets defined by the
National Renewable Energy Action
Plans. Its development is hampe-
red by lengthy and costly proce-
dures, local opposition and often
the lack of political support. n
Energy indicators
EUROBSERV ’ER – THE STATE OF RENEWABLE ENERGIES IN EUROPE – 2017 EDITIONEUROBSERV ’ER – THE STATE OF RENEWABLE ENERGIES IN EUROPE – 2017 EDITION
30 31
1Capacity installed and net capacity usable of geothermal electricity
plants in the EU in 2015 and 2016 (in MWe)
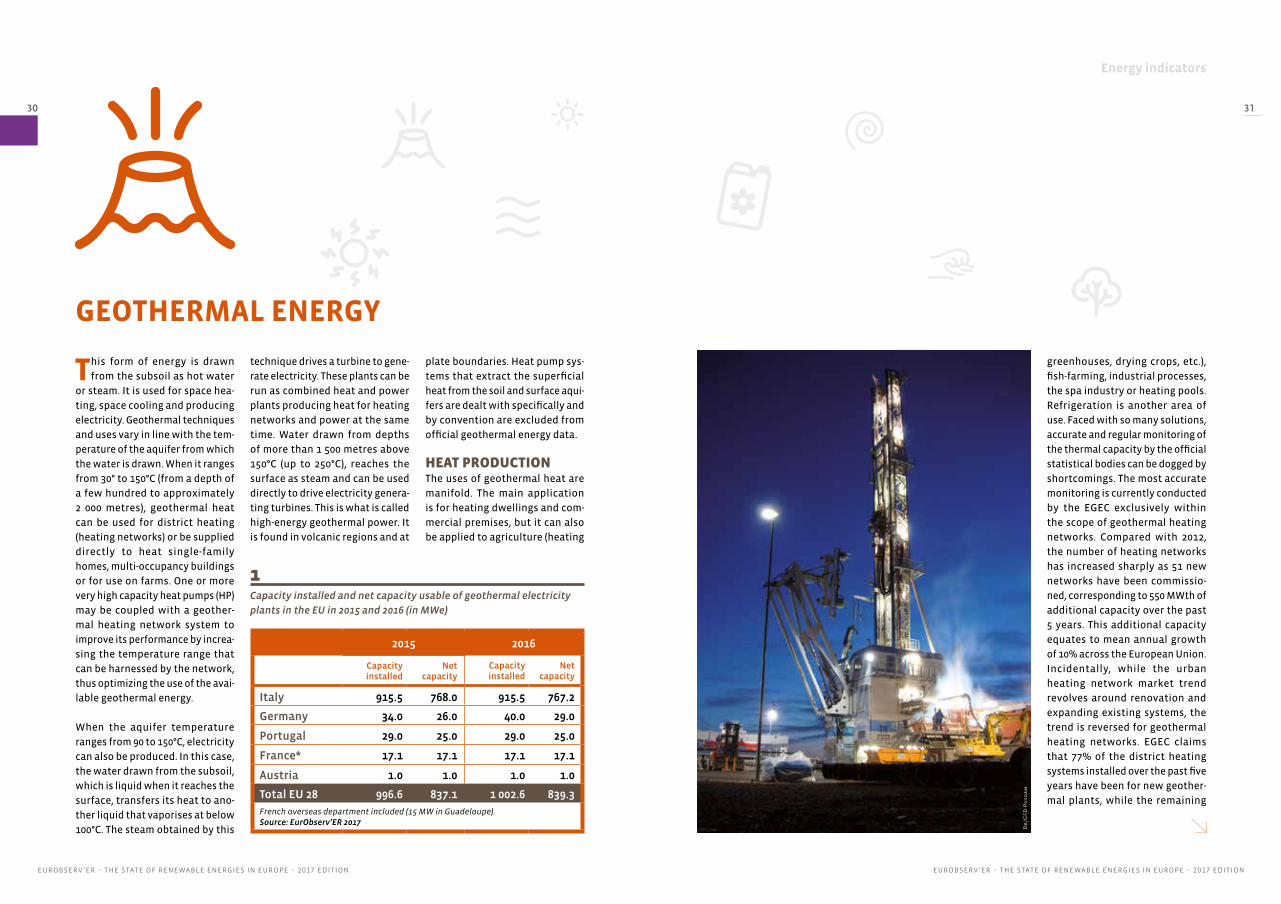
This form of energy is drawn
from the subsoil as hot water
or steam. It is used for space hea-
ting, space cooling and producing
electricity. Geothermal techniques
and uses vary in line with the tem-
perature of the aquifer from which
the water is drawn. When it ranges
from 30° to 150°C (from a depth of
a few hundred to approximately
2 000 metres), geothermal heat
can be used for district heating
(heating networks) or be supplied
directly to heat single-family
homes, multi-occupancy buildings
or for use on farms. One or more
very high capacity heat pumps (HP)
may be coupled with a geother-
mal heating network system to
improve its performance by increa-
sing the temperature range that
can be harnessed by the network,
thus optimizing the use of the avai-
lable geothermal energy.
When the aquifer temperature
ranges from 90 to 150°C, electricity
can also be produced. In this case,
the water drawn from the subsoil,
which is liquid when it reaches the
surface, transfers its heat to ano-
ther liquid that vaporises at below
100°C. The steam obtained by this
GEOTHERMAL ENERGY
2015 2016
Capacity installed
Net capacity
Capacity installed
Net capacity
Italy 915.5 768.0 915.5 767.2
Germany 34.0 26.0 40.0 29.0
Portugal 29.0 25.0 29.0 25.0
France* 17.1 17.1 17.1 17.1
Austria 1.0 1.0 1.0 1.0
Total EU 28 996.6 837.1 1 002.6 839.3
French overseas department included (15 MW in Guadeloupe). Source: EurObserv’ER 2017
technique drives a turbine to gene-
rate electricity. These plants can be
run as combined heat and power
plants producing heat for heating
networks and power at the same
time. Water drawn from depths
of more than 1 500 metres above
150°C (up to 250°C), reaches the
surface as steam and can be used
directly to drive electricity genera-
ting turbines. This is what is called
high-energy geothermal power. It
is found in volcanic regions and at
plate boundaries. Heat pump sys-
tems that extract the superficial
heat from the soil and surface aqui-
fers are dealt with specifically and
by convention are excluded from
official geothermal energy data.
HEAT PRODUCTION The uses of geothermal heat are
manifold. The main application
is for heating dwellings and com-
mercial premises, but it can also
be applied to agriculture (heating
greenhouses, drying crops, etc.),
fish-farming, industrial processes,
the spa industry or heating pools.
Refrigeration is another area of
use. Faced with so many solutions,
accurate and regular monitoring of
the thermal capacity by the official
statistical bodies can be dogged by
shortcomings. The most accurate
monitoring is currently conducted
by the EGEC exclusively within
the scope of geothermal heating
networks. Compared with 2012,
the number of heating networks
has increased sharply as 51 new
networks have been commissio-
ned, corresponding to 550 MWth of
additional capacity over the past
5 years. This additional capacity
equates to mean annual growth
of 10% across the European Union.
Incidentally, while the urban
heating network market trend
revolves around renovation and
expanding existing systems, the
trend is reversed for geothermal
heating networks. EGEC claims
that 77% of the district heating
systems installed over the past five
years have been for new geother-
mal plants, while the remaining
Dr
/GF
D P
osd
am

Energy indicators
EUROBSERV ’ER – THE STATE OF RENEWABLE ENERGIES IN EUROPE – 2017 EDITIONEUROBSERV ’ER – THE STATE OF RENEWABLE ENERGIES IN EUROPE – 2017 EDITION
32 33
23% activity focused on renovation
or extending existing systems.
The year 2016 was very busy for
commissioning new heating
networks and network extensions
involving 15 plants, essentially
in France, but also in Germany,
Italy, the Netherlands, Romania
and Slovakia. The combined addi-
tional capacity of these systems
is about 139 MW. France is cur-
rently the most active European
Union country in this area, having
connected and extended nine
heating networks, eight of which
are in Greater Paris (Bagneux
12 MWth, Ivry sur Seine 12.5 MWth,
Le Blanc Mesnil 12 MWth, Clichy
Batignolles 5 MWth, Tremblay en
France 13.9 MWth, Val d’Europe
19.5 MWth, Villejuif 10 MWth and
Villepinte 10 MWth and one loca-
ted in the Grand-Est region at Rit-
tershoffen which is a deep, EGS
(Enhanced Geothermal System)
geothermal project. The plant
was inaugurated by Électricité de
Strasbourg, Roquette and Caisse
des Dépôts. It uses geothermal
fluid at 165°C extracted at a depth
of 2 500 m to supply heat to the
industrial processes of a factory
located 15 km away. Its 24-MW
capacity will reduce the factory’s
CO2 emissions by 39 000 tonnes. As
the first of a kind in the world and
a model for energy transition, the
plant marks a major step towards
the more widespread develop-
ment of Enhanced Geothermal
Systems, which enable deep geo-
thermal energy to be tapped in
new areas. In 2016, two geother-
mal networks were also inaugura-
ted in Bavaria, Germany – one at
Munich Freiham (20 MWth) and the
2Heat consumption from geothermal energy in the countries of the European Union in 2015 and 2016
2015 2016
Total heat consumption
of which final energy
consumption
of which derived
heat*
Total heat consumption
of which final energy
consumption
of which derived
heat*
Italy 132.8 114.1 18.6 144.1 124.7 19.3
France 121.7 29.5 92.1 134.6 29.5 105.0
Hungary 95.7 53.5 42.3 115.0 50.5 64.5
Germany 83.3 68.4 15.0 100.1 81.1 19.0
Netherlands 58.5 58.5 0.0 67.9 67.9 0.0
Slovenia 38.5 38.0 0.5 43.9 43.4 0.5
Bulgaria 33.4 33.4 0.0 34.6 34.6 0.0
Romania 25.7 19.7 6.0 31.7 25.6 6.1
Poland 21.7 21.7 0.0 22.2 22.2 0.0
Austria 21.0 7.2 13.8 20.4 7.2 13.3
Spain 18.8 18.8 0.0 18.8 18.8 0.0
Greece 9.9 9.9 0.0 10.1 10.1 0.0
Croatia 8.9 8.9 0.0 9.1 9.1 0.0
Slovakia 4.2 1.3 2.9 4.9 1.6 3.3
Denmark 1.7 0.0 1.7 2.7 0.0 2.7
Belgium 1.5 0.0 1.5 1.6 0.0 1.6
Cyprus 1.6 1.6 0.0 1.6 1.6 0.0
Portugal 1.5 1.5 0.0 1.4 1.4 0.0
Lithuania 0.8 0.0 0.8 1.0 0.0 1.0
United Kingdom 0.8 0.8 0.0 0.8 0.8 0.0
Czech Republic 0.0 0.0 0.0 0.0 0.0 0.0
Estonia 0.0 0.0 0.0 0.0 0.0 0.0
Ireland 0.0 0.0 0.0 0.0 0.0 0.0
Latvia 0.0 0.0 0.0 0.0 0.0 0.0
Luxembourg 0.0 0.0 0.0 0.0 0.0 0.0
Malta 0.0 0.0 0.0 0.0 0.0 0.0
Finland 0.0 0.0 0.0 0.0 0.0 0.0
Sweden 0.0 0.0 0.0 0.0 0.0 0.0
Total EU 28 681.9 486.8 195.1 766.4 530.0 236.4
Source: EurObserv’ER 2017, amended with SHARES data
3Comparison of the geothermal heat generation trend against the
NREAP (National Renewable Energy Action Plan) roadmap (in ktoe)
766.4
1200
2 631
2014 2015 2016 2020
NR
EA
P
646.3 681.9
1 348
NR
EA
P
Source: EurObserv’ER 2017
RA
G A
ust
ria
Energy indicators
EUROBSERV ’ER – THE STATE OF RENEWABLE ENERGIES IN EUROPE – 2017 EDITIONEUROBSERV ’ER – THE STATE OF RENEWABLE ENERGIES IN EUROPE – 2017 EDITION
34 35
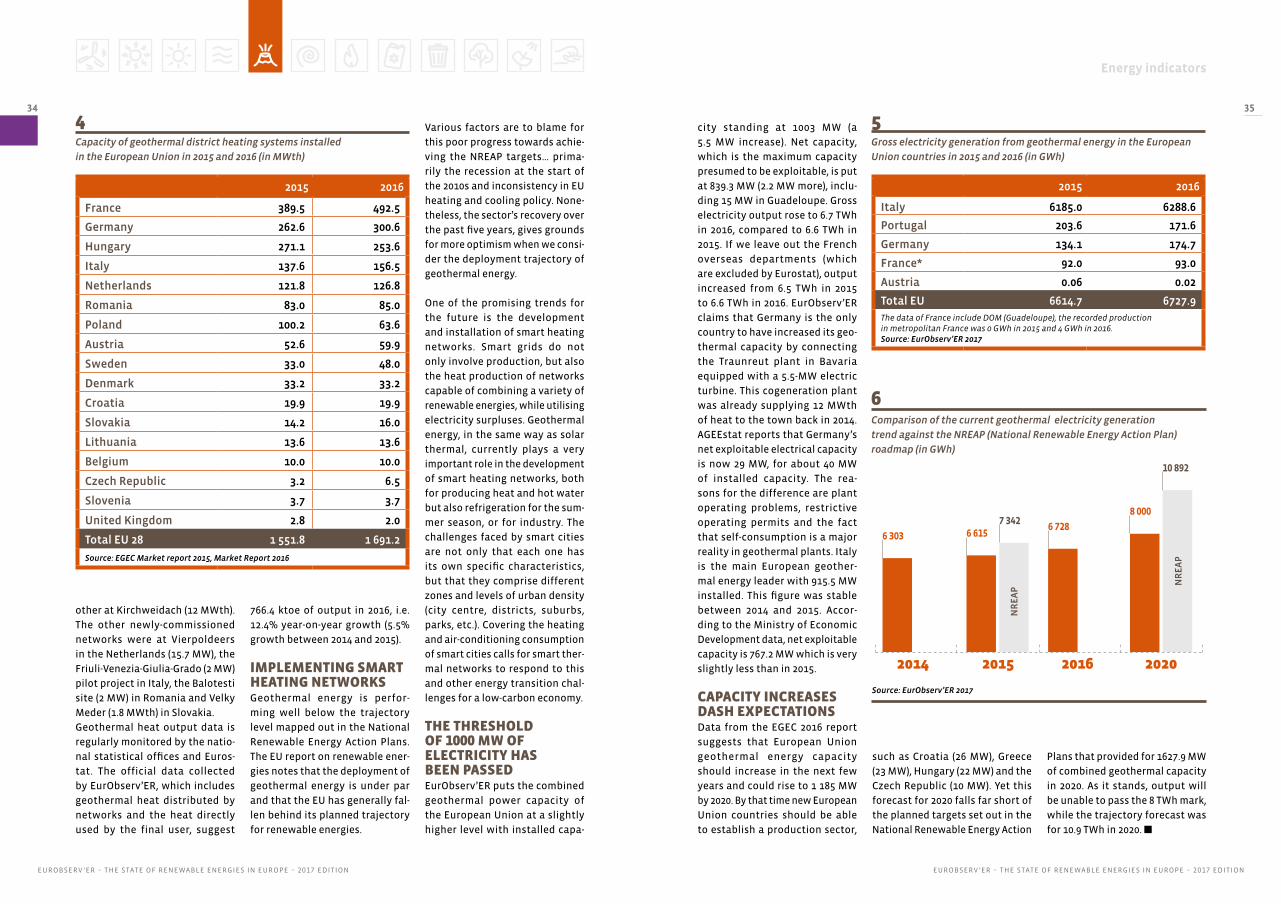
city standing at 1003 MW (a
5.5 MW increase). Net capacity,
which is the maximum capacity
presumed to be exploitable, is put
at 839.3 MW (2.2 MW more), inclu-
ding 15 MW in Guadeloupe. Gross
electricity output rose to 6.7 TWh
in 2016, compared to 6.6 TWh in
2015. If we leave out the French
overseas departments (which
are excluded by Eurostat), output
increased from 6.5 TWh in 2015
to 6.6 TWh in 2016. EurObserv’ER
claims that Germany is the only
country to have increased its geo-
thermal capacity by connecting
the Traunreut plant in Bavaria
equipped with a 5.5-MW electric
turbine. This cogeneration plant
was already supplying 12 MWth
of heat to the town back in 2014.
AGEEstat reports that Germany’s
net exploitable electrical capacity
is now 29 MW, for about 40 MW
of installed capacity. The rea-
sons for the difference are plant
operating problems, restrictive
operating permits and the fact
that self-consumption is a major
reality in geothermal plants. Italy
is the main European geother-
mal energy leader with 915.5 MW
installed. This figure was stable
between 2014 and 2015. Accor-
ding to the Ministry of Economic
Development data, net exploitable
capacity is 767.2 MW which is very
slightly less than in 2015.
CAPACITY INCREASES DASH EXPECTATIONSData from the EGEC 2016 report
suggests that European Union
geothermal energy capacity
should increase in the next few
years and could rise to 1 185 MW
by 2020. By that time new European
Union countries should be able
to establish a production sector,
2015 2016
France 389.5 492.5
Germany 262.6 300.6
Hungary 271.1 253.6
Italy 137.6 156.5
Netherlands 121.8 126.8
Romania 83.0 85.0
Poland 100.2 63.6
Austria 52.6 59.9
Sweden 33.0 48.0
Denmark 33.2 33.2
Croatia 19.9 19.9
Slovakia 14.2 16.0
Lithuania 13.6 13.6
Belgium 10.0 10.0
Czech Republic 3.2 6.5
Slovenia 3.7 3.7
United Kingdom 2.8 2.0
Total EU 28 1 551.8 1 691.2
Source: EGEC Market report 2015, Market Report 2016
4Capacity of geothermal district heating systems installed
in the European Union in 2015 and 2016 (in MWth)
other at Kirchweidach (12 MWth).
The other newly-commissioned
networks were at Vierpoldeers
in the Netherlands (15.7 MW), the
Friuli-Venezia-Giulia-Grado (2 MW)
pilot project in Italy, the Balotesti
site (2 MW) in Romania and Velky
Meder (1.8 MWth) in Slovakia.
Geothermal heat output data is
regularly monitored by the natio-
nal statistical offices and Euros-
tat. The official data collected
by EurObserv’ER, which includes
geothermal heat distributed by
networks and the heat directly
used by the final user, suggest
Various factors are to blame for
this poor progress towards achie-
ving the NREAP targets… prima-
rily the recession at the start of
the 2010s and inconsistency in EU
heating and cooling policy. None-
theless, the sector’s recovery over
the past five years, gives grounds
for more optimism when we consi-
der the deployment trajectory of
geothermal energy.
One of the promising trends for
the future is the development
and installation of smart heating
networks. Smart grids do not
only involve production, but also
the heat production of networks
capable of combining a variety of
renewable energies, while utilising
electricity surpluses. Geothermal
energy, in the same way as solar
thermal, currently plays a very
important role in the development
of smart heating networks, both
for producing heat and hot water
but also refrigeration for the sum-
mer season, or for industry. The
challenges faced by smart cities
are not only that each one has
its own specific characteristics,
but that they comprise different
zones and levels of urban density
(city centre, districts, suburbs,
parks, etc.). Covering the heating
and air-conditioning consumption
of smart cities calls for smart ther-
mal networks to respond to this
and other energy transition chal-
lenges for a low-carbon economy.
THE THRESHOLD OF 1000 MW OF ELECTRICITY HAS BEEN PASSEDEurObserv’ER puts the combined
geothermal power capacity of
the European Union at a slightly
higher level with installed capa-
766.4 ktoe of output in 2016, i.e.
12.4% year-on-year growth (5.5%
growth between 2014 and 2015).
IMPLEMENTING SMART HEATING NETWORKSGeothermal energy is perfor-
ming well below the trajectory
level mapped out in the National
Renewable Energy Action Plans.
The EU report on renewable ener-
gies notes that the deployment of
geothermal energy is under par
and that the EU has generally fal-
len behind its planned trajectory
for renewable energies.
such as Croatia (26 MW), Greece
(23 MW), Hungary (22 MW) and the
Czech Republic (10 MW). Yet this
forecast for 2020 falls far short of
the planned targets set out in the
National Renewable Energy Action
Plans that provided for 1627.9 MW
of combined geothermal capacity
in 2020. As it stands, output will
be unable to pass the 8 TWh mark,
while the trajectory forecast was
for 10.9 TWh in 2020. n
5Gross electricity generation from geothermal energy in the European
Union countries in 2015 and 2016 (in GWh)
2015 2016
Italy 6185.0 6288.6
Portugal 203.6 171.6
Germany 134.1 174.7
France* 92.0 93.0
Austria 0.06 0.02
Total EU 6614.7 6727.9The data of France include DOM (Guadeloupe), the recorded production in metropolitan France was 0 GWh in 2015 and 4 GWh in 2016. Source: EurObserv’ER 2017
6 3036 728
8 000
10 892
2014 2015 2016 2020
NR
EA
P
6 6157 342
NR
EA
P
Source: EurObserv’ER 2017
6Comparison of the current geothermal electricity generation
trend against the NREAP (National Renewable Energy Action Plan)
roadmap (in GWh)

Energy indicators
EUROBSERV ’ER – THE STATE OF RENEWABLE ENERGIES IN EUROPE – 2017 EDITIONEUROBSERV ’ER – THE STATE OF RENEWABLE ENERGIES IN EUROPE – 2017 EDITION
36 37
HEAT PUMPS
If we are to grasp how the market
is developing, we must identify
the various types of heat pumps
(HPs). They are differentiated both
by the energy source used (ground,
water, air), by the types of heating
unit used (fan-coil unit, underfloor
heating, low- or high-temperature
radiators), and also their applica-
tion. Heat pumps can be used
solely for heating purposes, but
and air-source heat pump market
for home heating with or without
the cooling option, the recovery
started in 2015 was clearly pursued
in 2016. According to EurObserv’ER,
more than 3.3 million units were
sold in the European Union in 2016,
which equates to 26.1% growth
(compared to 20% between 2014
and 2015). This estimate includes
all HP systems including those pri-
marily used for cooling purposes
provided that the countries consi-
der that the energy efficiency cri-
teria set by the European Directive
are upheld and that these units
actually produce renewable heat.
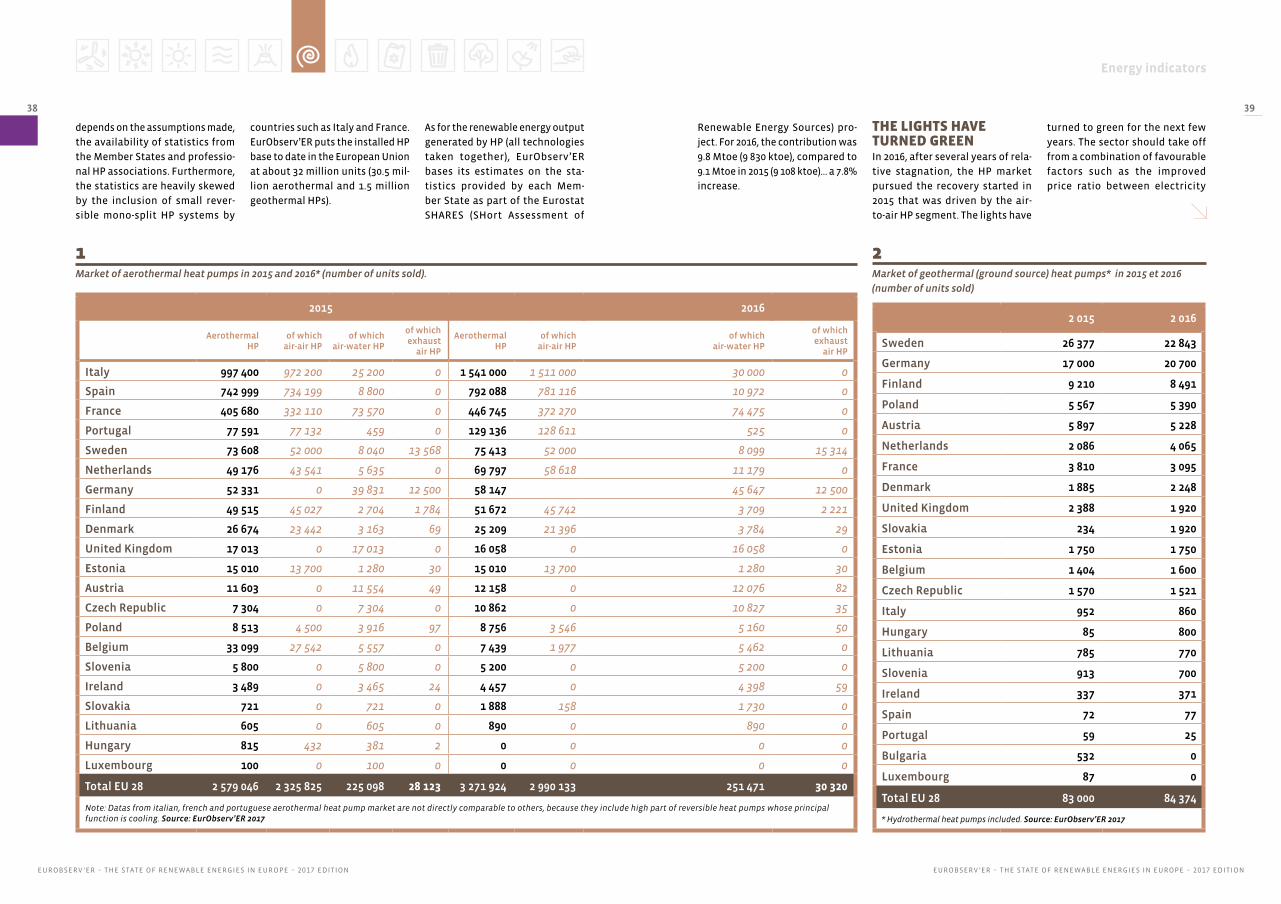
Most of the HP sales on the Euro-
pean market – 2 990 133 units in
2016 – were of the air-to-air type…
amounting to 28.6% growth Their
heat transfer unit is the fan coil
(that blows hot or cold air). The
success of this type of HP can be
ascribed to their low installation
costs, easier installation and the
increasing demand from househol-
ders for space cooling.
Practically all the air-to-air HPs
sold nowadays are reversible, but
their main application as meeting
if they are reversible, can expel a
dwelling’s heat to cool it down.
Heat pumps are generally grou-
ped into three main categories,
namely ground source heat pumps
(GSHPs), which extract heat from
the ground (via horizontal or ver-
tical sensors), hydrothermal HPs,
that draw heat from water (the
water table, rivers or lakes), and
air source (ASHPs), whose heat
source is air (outside, exhaust or
indoor air). We have amalgama-
ted the hydrothermal and ground
source HP statistics for the sake of
convenience
AIR-SOURCE TECHNOLOGIES DOMINATE THE MARKETIf we look at the ground-source
heating or cooling needs can dif-
fer widely between the Northern
European and Southern European
regions near the Mediterranean.
The real picture in the various
European Union markets often
defies direct comparison. This
may also apply within a single
country, such as France where
the uses differ between the north
and the south. For the time being,
some countries such as Germany
and Austria have decided not to
include air-to-air HPs in their sta-
tistics, which also contributes to
bias in market comparisons.
Just as in 2015, the 2016 market
took advantage of the summer
heat waves in countries such as
Italy, France, Spain and Portugal,
as sales of reversible air-to-air sys-
tems are very closely correlated
to the need for air-conditioning.
In Northern Europe – Sweden and
Denmark – the air-to-air HP market
essentially meets heating requi-
rements with products that are
perfectly suited to cold climates.
The 2016 market performed well
but was generally stable in Swe-
den and Finland, while it dipped
slightly in Denmark.
The market for hydrothermal HPs
that transfer heat through water
via radiators or underfloor pipes
primarily caters for heating needs.
Their market, which includes geo-
thermal HPs and air-to-water HPs
is also expanding. The air-to-water
HP market expanded by 11.7% with
251 471 units sold (a 12.3% increase
in 2015) and the geothermal HP seg-
ment gained 1.5% with 84 374 units
sold in 2016 after several years of
decline. Some countries intro-
duced new policies that account
for significant variations in their
sales figures. A new incentive
system has been in force since 1
January 2016 in the Netherlands for
renewable heating appliances for
homeowners and small companies,
known as ISDE, which has proven
to be very positive. The amount
of grant awarded depends on the
type of appliance and its energy
performance. It ranges from € 1 000
to € 2 500 for heat pumps.
THE EUROPEAN HP BASE WAS 32 MILLION IN 2016Gauging the size of the HP base in
service is a difficult exercise, as it
Am
prio
n/A
ch
im B
laz
y
Energy indicators
EUROBSERV ’ER – THE STATE OF RENEWABLE ENERGIES IN EUROPE – 2017 EDITIONEUROBSERV ’ER – THE STATE OF RENEWABLE ENERGIES IN EUROPE – 2017 EDITION
38 39
1Market of aerothermal heat pumps in 2015 and 2016* (number of units sold).
2Market of geothermal (ground source) heat pumps* in 2015 et 2016
(number of units sold)
depends on the assumptions made,
the availability of statistics from
the Member States and professio-
nal HP associations. Furthermore,
the statistics are heavily skewed
by the inclusion of small rever-
sible mono-split HP systems by
countries such as Italy and France.
EurObserv’ER puts the installed HP
base to date in the European Union
at about 32 million units (30.5 mil-
lion aerothermal and 1.5 million
geothermal HPs).
As for the renewable energy output
generated by HP (all technologies
taken together), EurObserv’ER
bases its estimates on the sta-
tistics provided by each Mem-
ber State as part of the Eurostat
SHARES (SHort Assessment of
2 015 2 016
Sweden 26 377 22 843
Germany 17 000 20 700
Finland 9 210 8 491
Poland 5 567 5 390
Austria 5 897 5 228
Netherlands 2 086 4 065
France 3 810 3 095
Denmark 1 885 2 248
United Kingdom 2 388 1 920
Slovakia 234 1 920
Estonia 1 750 1 750
Belgium 1 404 1 600
Czech Republic 1 570 1 521
Italy 952 860
Hungary 85 800
Lithuania 785 770
Slovenia 913 700
Ireland 337 371
Spain 72 77
Portugal 59 25
Bulgaria 532 0
Luxembourg 87 0
Total EU 28 83 000 84 374
* Hydrothermal heat pumps included. Source: EurObserv’ER 2017
2015 2016
Aerothermal HP
of which air-air HP
of which air-water HP
of which exhaust
air HP
Aerothermal HP
of which air-air HP
of which air-water HP
of which exhaust
air HP
Italy 997 400 972 200 25 200 0 1 541 000 1 511 000 30 000 0
Spain 742 999 734 199 8 800 0 792 088 781 116 10 972 0
France 405 680 332 110 73 570 0 446 745 372 270 74 475 0
Portugal 77 591 77 132 459 0 129 136 128 611 525 0
Sweden 73 608 52 000 8 040 13 568 75 413 52 000 8 099 15 314
Netherlands 49 176 43 541 5 635 0 69 797 58 618 11 179 0
Germany 52 331 0 39 831 12 500 58 147 45 647 12 500
Finland 49 515 45 027 2 704 1 784 51 672 45 742 3 709 2 221
Denmark 26 674 23 442 3 163 69 25 209 21 396 3 784 29
United Kingdom 17 013 0 17 013 0 16 058 0 16 058 0
Estonia 15 010 13 700 1 280 30 15 010 13 700 1 280 30
Austria 11 603 0 11 554 49 12 158 0 12 076 82
Czech Republic 7 304 0 7 304 0 10 862 0 10 827 35
Poland 8 513 4 500 3 916 97 8 756 3 546 5 160 50
Belgium 33 099 27 542 5 557 0 7 439 1 977 5 462 0
Slovenia 5 800 0 5 800 0 5 200 0 5 200 0
Ireland 3 489 0 3 465 24 4 457 0 4 398 59
Slovakia 721 0 721 0 1 888 158 1 730 0
Lithuania 605 0 605 0 890 0 890 0
Hungary 815 432 381 2 0 0 0 0
Luxembourg 100 0 100 0 0 0 0 0
Total EU 28 2 579 046 2 325 825 225 098 28 123 3 271 924 2 990 133 251 471 30 320
Note: Datas from italian, french and portuguese aerothermal heat pump market are not directly comparable to others, because they include high part of reversible heat pumps whose principal function is cooling. Source: EurObserv’ER 2017
Renewable Energy Sources) pro-
ject. For 2016, the contribution was
9.8 Mtoe (9 830 ktoe), compared to
9.1 Mtoe in 2015 (9 108 ktoe)… a 7.8%
increase.
THE LIGHTS HAVE TURNED GREENIn 2016, after several years of rela-
tive stagnation, the HP market
pursued the recovery started in
2015 that was driven by the air-
to-air HP segment. The lights have
turned to green for the next few
years. The sector should take off
from a combination of favourable
factors such as the improved
price ratio between electricity

Energy indicators
EUROBSERV ’ER – THE STATE OF RENEWABLE ENERGIES IN EUROPE – 2017 EDITIONEUROBSERV ’ER – THE STATE OF RENEWABLE ENERGIES IN EUROPE – 2017 EDITION
40 41
3Total number of heat pumps in operation in 2015 and 2016*
4Current trend of renewable energy from heat pumps compared with the
National renewable energy action plans (NREAP) (in ktoe)
and gas, the economic recovery
that increases homeowners’
investment capacities and the
more stable construction market.
We share this optimism with the
EHPA (European Heat Pump Asso-
ciation). Its figures differ from ours
as the association only includes
HP primarily dedicated to heating
applications, leaving aside those
systems essentially used for air-
conditioning. EHPA estimates that
in 2016 one million units were sold
for heat production purposes (12%
more than in 2015). It is confident
about the outlook for future sales.
Its forecasts point to market
growth for the next three years
of 14%, 14% and 13% respectively.
Development of the HP market
could also profit from the advent
of the PV self-consumption market
as the production of solar power is
the perfect match to the cooling
requirements of reversible HP
technologies. The unused surplus
solar power could also be chan-
nelled to top up HPs assigned to
domestic hot water and heating
production. The air source HP
market should also take advan-
tage of the implementation of
new thermal regulations as venti-
lation technologies become more
integrated, in conjunction with
the improvements to building air
quality. The run of generally milder
winters resulting from climatic
warming, should also be beneficial
to the development of aerothermal
technologies. n
2015 2016
Aerothermal heat pumps
Ground source heat
pumpsTotal FIP
Aerothermal heat pumps
Ground source heat
pumpsTotal FIP
Italy 18 436 500 14 000 18 450 500 19 045 000 14 200 19 059 200
France 4 638 908 148 675 4 787 583 5 085 653 151 770 5 237 423
Spain 1 497 344 1 216 1 498 560 2 289 432 1 293 2 290 725
Sweden 988 191 497 658 1 485 849 1 057 666 514 038 1 571 704
Germany 567 327 330 244 897 571 612 820 349 623 962 443
Finland 577 808 94 504 672 312 629 480 102 995 732 475
Denmark 245 291 56 023 301 314 272 470 60 691 333 161
Netherlands 248 051 47 407 295 458 316 899 50 943 367 842
Portugal 254 944 832 255 776 384 080 857 384 937
Bulgaria 214 971 4 272 219 243 214 971 4 272 219 243
Austria 66 907 95 860 162 767 79 065 101 088 180 153
United Kingdom 114 794 27 263 142 057 130 852 29 183 160 035
Estonia 101 707 10 625 112 332 116 717 12 375 129 092
Belgium 84 499 7 774 92 273 91 938 9 374 101 312
Czech Republic 44 148 21 628 65 776 54 975 23 149 78 124
Poland 21 982 36 605 58 587 45 361 41 995 87 356
Slovenia 19 800 9 350 29 150 24 900 10 050 34 950
Ireland 9 027 3 453 12 480 13 484 3 824 17 308
Slovakia 6 607 3 073 9 680 8 495 4 993 13 488
Hungary 5 200 510 5 710 5 200 1 310 6 510
Lithuania 1 870 3 693 5 563 2 760 4 463 7 223
Luxembourg 1 195 420 1 615 1 195 420 1 615
Total EU 28 28 147 071 1 415 085 29 562 156 30 483 412 1 492 906 31 976 318
Note: Data from Italian, French and Portuguese aerothermal heat pump markets are not directly comparable to others, because they include the heat pumps whose principal function is cooling. Source: EurObserv’ER 2017
9 830
12 500 12 156
2014 2015 2016 2020
NR
EA
P
8 1519 108
7 246
NR
EA
P
Source: EurObserv’ER 2017
Wei
sha
upt
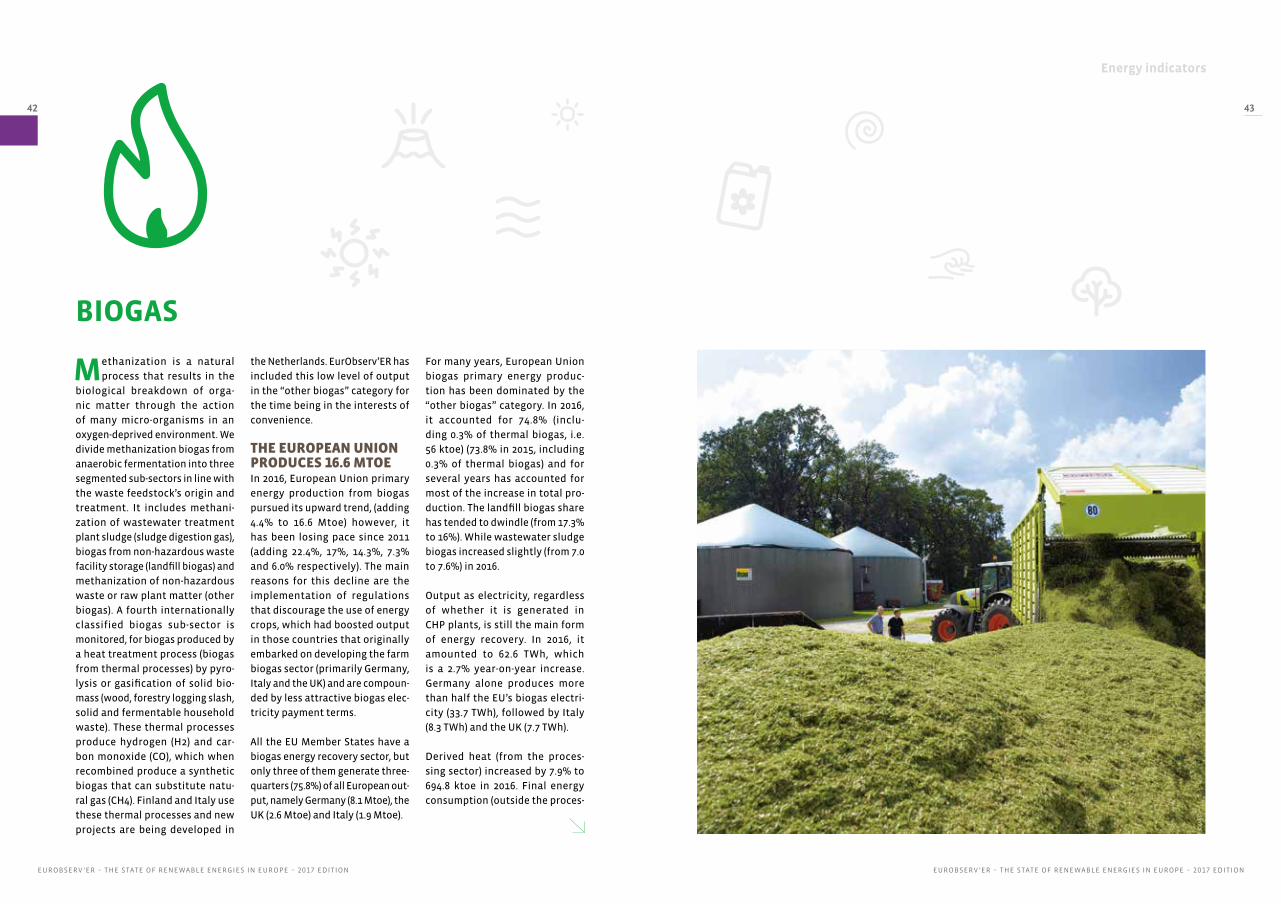
Energy indicators
EUROBSERV ’ER – THE STATE OF RENEWABLE ENERGIES IN EUROPE – 2017 EDITIONEUROBSERV ’ER – THE STATE OF RENEWABLE ENERGIES IN EUROPE – 2017 EDITION
42 43
Methanization is a natural
process that results in the
biological breakdown of orga-
nic matter through the action
of many micro-organisms in an
oxygen-deprived environment. We
divide methanization biogas from
anaerobic fermentation into three
segmented sub-sectors in line with
the waste feedstock’s origin and
treatment. It includes methani-
zation of wastewater treatment
plant sludge (sludge digestion gas),
biogas from non-hazardous waste
facility storage (landfill biogas) and
methanization of non-hazardous
waste or raw plant matter (other
biogas). A fourth internationally
classified biogas sub-sector is
monitored, for biogas produced by
a heat treatment process (biogas
from thermal processes) by pyro-
lysis or gasification of solid bio-
mass (wood, forestry logging slash,
solid and fermentable household
waste). These thermal processes
produce hydrogen (H2) and car-
bon monoxide (CO), which when
recombined produce a synthetic
biogas that can substitute natu-
ral gas (CH4). Finland and Italy use
these thermal processes and new
projects are being developed in
BIOGAS
the Netherlands. EurObserv’ER has
included this low level of output
in the “other biogas” category for
the time being in the interests of
convenience.
THE EUROPEAN UNION PRODUCES 16.6 MTOE In 2016, European Union primary
energy production from biogas
pursued its upward trend, (adding
4.4% to 16.6 Mtoe) however, it
has been losing pace since 2011
(adding 22.4%, 17%, 14.3%, 7.3%
and 6.0% respectively). The main
reasons for this decline are the
implementation of regulations
that discourage the use of energy
crops, which had boosted output
in those countries that originally
embarked on developing the farm
biogas sector (primarily Germany,
Italy and the UK) and are compoun-
ded by less attractive biogas elec-
tricity payment terms.
All the EU Member States have a
biogas energy recovery sector, but
only three of them generate three-
quarters (75.8%) of all European out-
put, namely Germany (8.1 Mtoe), the
UK (2.6 Mtoe) and Italy (1.9 Mtoe).
Cla
as
For many years, European Union
biogas primary energy produc-
tion has been dominated by the
“other biogas” category. In 2016,
it accounted for 74.8% (inclu-
ding 0.3% of thermal biogas, i.e.
56 ktoe) (73.8% in 2015, including
0.3% of thermal biogas) and for
several years has accounted for
most of the increase in total pro-
duction. The landfill biogas share
has tended to dwindle (from 17.3%
to 16%). While wastewater sludge
biogas increased slightly (from 7.0
to 7.6%) in 2016.
Output as electricity, regardless
of whether it is generated in
CHP plants, is still the main form
of energy recovery. In 2016, it
amounted to 62.6 TWh, which
is a 2.7% year-on-year increase.
Germany alone produces more
than half the EU’s biogas electri-
city (33.7 TWh), followed by Italy
(8.3 TWh) and the UK (7.7 TWh).
Derived heat (from the proces-
sing sector) increased by 7.9% to
694.8 ktoe in 2016. Final energy
consumption (outside the proces-

Energy indicators
EUROBSERV ’ER – THE STATE OF RENEWABLE ENERGIES IN EUROPE – 2017 EDITIONEUROBSERV ’ER – THE STATE OF RENEWABLE ENERGIES IN EUROPE – 2017 EDITION
44 45
1Primary energy production from biogas in the European Union in 2015 and 2016 (in ktoe)
2015 2016
Landfill gasSewage
sludge gas4
Others biogas from anaerobic
fermentation
Thermal biogas
Total Landfill gasSewage
sludge gas5
Others biogas from anaerobic
fermentation
Thermal biogas
Total
Germany 94 452 7 308 0 7 854 84 463 7 548 0 8 094
United Kingdom 1 451 330 556 0 2 337 1 401 345 855 0 2 601
Italy 369 54 1 442 6 1 871 365 53 1 450 7 1 875
France 282 73 370 0 725 286 72 402 0 760
Czech Republic 27 40 546 0 613 25 42 534 0 601
Netherlands 19 55 252 0 327 16 58 245 0 319
Austria 4 11 284 0 300 4 13 296 0 313
Poland 51 97 82 0 229 58 120 84 0 261
Spain 141 70 51 0 262 132 66 47 0 245
Belgium 26 24 177 0 227 22 26 179 0 227
Denmark 4 22 127 0 153 5 25 189 0 218
Sweden 6 75 86 0 167 7 76 91 0 174
Slovakia 3 15 130 0 149 3 15 130 0 148
Finland 28 15 20 40 103 23 15 25 49 112
Greece 70 16 6 0 91 72 17 13 0 102
Latvia 8 2 77 0 88 8 3 79 0 90
Hungary 14 20 45 0 80 14 20 46 0 81
Portugal 71 3 9 0 83 68 3 9 0 80
Bulgaria 5 14 0 0 19 0 60 0 0 60
Ireland 41 8 6 0 55 40 8 7 0 56
Croatia 5 3 27 0 36 6 4 33 0 43
Lithuania 8 7 8 0 23 9 8 16 0 32
Slovenia 5 2 22 0 30 4 2 24 0 30
Luxembourg 0 2 16 0 18 0 2 18 0 20
Romania 1 0 17 0 18 1 0 17 0 18
Cyprus 0 0 12 0 12 0 0 12 0 12
Estonia 12 2 0 0 13 7 4 0 0 11
Malta 0 0 2 0 2 0 0 2 0 2
Total EU 28 2 746 1 412 11 680 46 15 884 2 659 1 519 12 350 56 16 585
Source: EurObserv’ER 2017
sing sector) must be added to that
and is put at about 2 882 ktoe in
2016 (8.4% up on the 2015 figure).
Biogas can also be purified and
converted into biomethane. It is
then converted in the same way
as natural gas can be, namely as
electricity in CHP plants and by
natural gas vehicles (NGV) or even
injected into the natural gas grid.
In recent years, biomethane injec-
tion has gradually taken on impor-
tance in the biogas market. At the
end of 2016, the sector had some
480 plants injecting biomethane
into Europe’s natural gas grids, in
the 9 countries monitored by the
European Biomethane Observa-
tory. The number of injection plants
increased by 13% in 2016, and Ger-
many has made the most progress
in biomethane injection. According
to the DENA (German environmen-
tal agency) biomethane barometer,
194 plants were counted at the end
of November 2016 that produce a
little less than 1 billion Nm3 of
gas. DENA claims that the injected
biomethane energy content was
about 9.4 TWh in 2016 compared to
8.5 TWh in 2015. In Sweden, much of
the biomethane output is used as
fuel for natural gas-driven vehicles.
According to Statistics Sweden,
roughly 100 000 toe of biomethane
was used (1 150 GWh to be precise)
for road transport in 2016.
OUTPUT COULD DOUBLE BY 2030Growth scenarios have been hard
hit by the main European producer
countries’ decision to reduce their
use of energy crops. Nowadays,
optimized use of waste underpins
the growth scenarios more than
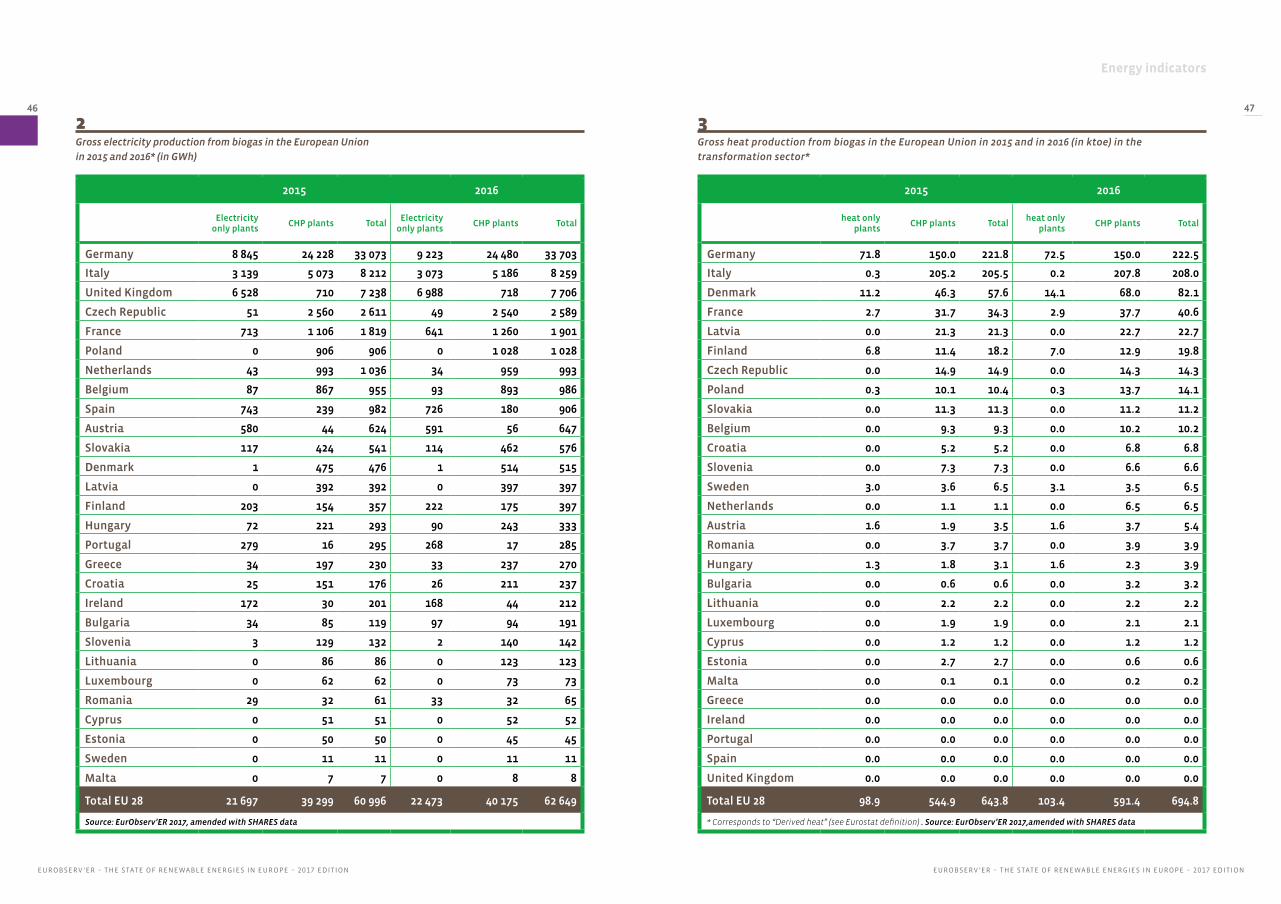
Energy indicators
EUROBSERV ’ER – THE STATE OF RENEWABLE ENERGIES IN EUROPE – 2017 EDITIONEUROBSERV ’ER – THE STATE OF RENEWABLE ENERGIES IN EUROPE – 2017 EDITION
46 47
2Gross electricity production from biogas in the European Union
in 2015 and 2016* (in GWh)
3Gross heat production from biogas in the European Union in 2015 and in 2016 (in ktoe) in the
transformation sector*
2015 2016
Electricity only plants
CHP plants TotalElectricity
only plantsCHP plants Total
Germany 8 845 24 228 33 073 9 223 24 480 33 703
Italy 3 139 5 073 8 212 3 073 5 186 8 259
United Kingdom 6 528 710 7 238 6 988 718 7 706
Czech Republic 51 2 560 2 611 49 2 540 2 589
France 713 1 106 1 819 641 1 260 1 901
Poland 0 906 906 0 1 028 1 028
Netherlands 43 993 1 036 34 959 993
Belgium 87 867 955 93 893 986
Spain 743 239 982 726 180 906
Austria 580 44 624 591 56 647
Slovakia 117 424 541 114 462 576
Denmark 1 475 476 1 514 515
Latvia 0 392 392 0 397 397
Finland 203 154 357 222 175 397
Hungary 72 221 293 90 243 333
Portugal 279 16 295 268 17 285
Greece 34 197 230 33 237 270
Croatia 25 151 176 26 211 237
Ireland 172 30 201 168 44 212
Bulgaria 34 85 119 97 94 191
Slovenia 3 129 132 2 140 142
Lithuania 0 86 86 0 123 123
Luxembourg 0 62 62 0 73 73
Romania 29 32 61 33 32 65
Cyprus 0 51 51 0 52 52
Estonia 0 50 50 0 45 45
Sweden 0 11 11 0 11 11
Malta 0 7 7 0 8 8
Total EU 28 21 697 39 299 60 996 22 473 40 175 62 649
Source: EurObserv’ER 2017, amended with SHARES data
2015 2016
heat only plants
CHP plants Totalheat only
plantsCHP plants Total
Germany 71.8 150.0 221.8 72.5 150.0 222.5
Italy 0.3 205.2 205.5 0.2 207.8 208.0
Denmark 11.2 46.3 57.6 14.1 68.0 82.1
France 2.7 31.7 34.3 2.9 37.7 40.6
Latvia 0.0 21.3 21.3 0.0 22.7 22.7
Finland 6.8 11.4 18.2 7.0 12.9 19.8
Czech Republic 0.0 14.9 14.9 0.0 14.3 14.3
Poland 0.3 10.1 10.4 0.3 13.7 14.1
Slovakia 0.0 11.3 11.3 0.0 11.2 11.2
Belgium 0.0 9.3 9.3 0.0 10.2 10.2
Croatia 0.0 5.2 5.2 0.0 6.8 6.8
Slovenia 0.0 7.3 7.3 0.0 6.6 6.6
Sweden 3.0 3.6 6.5 3.1 3.5 6.5
Netherlands 0.0 1.1 1.1 0.0 6.5 6.5
Austria 1.6 1.9 3.5 1.6 3.7 5.4
Romania 0.0 3.7 3.7 0.0 3.9 3.9
Hungary 1.3 1.8 3.1 1.6 2.3 3.9
Bulgaria 0.0 0.6 0.6 0.0 3.2 3.2
Lithuania 0.0 2.2 2.2 0.0 2.2 2.2
Luxembourg 0.0 1.9 1.9 0.0 2.1 2.1
Cyprus 0.0 1.2 1.2 0.0 1.2 1.2
Estonia 0.0 2.7 2.7 0.0 0.6 0.6
Malta 0.0 0.1 0.1 0.0 0.2 0.2
Greece 0.0 0.0 0.0 0.0 0.0 0.0
Ireland 0.0 0.0 0.0 0.0 0.0 0.0
Portugal 0.0 0.0 0.0 0.0 0.0 0.0
Spain 0.0 0.0 0.0 0.0 0.0 0.0
United Kingdom 0.0 0.0 0.0 0.0 0.0 0.0
Total EU 28 98.9 544.9 643.8 103.4 591.4 694.8
* Corresponds to “Derived heat” (see Eurostat definition) . Source: EurObserv’ER 2017,amended with SHARES data

Energy indicators
EUROBSERV ’ER – THE STATE OF RENEWABLE ENERGIES IN EUROPE – 2017 EDITIONEUROBSERV ’ER – THE STATE OF RENEWABLE ENERGIES IN EUROPE – 2017 EDITION
48 49
5Comparison of the current trend of biogas heat consumption against
the NREAP (National Renewable Energy Action Plans) roadmap (in ktoe)
4Comparison of the current trend of electricity biogas generation
against the NREAP (National Renewable Energy Action Plans) roadmap
(in GWh)
greater use of energy crops or
developing gasification biogas. In
February 2017, the European Com-
mission published a study entitled
“Optimal use of biogas from waste
streams. An assessment of the
potential of biogas from digestion
in the EU beyond 2020” commissio-
ned to gauge this potential.
The originality of this paper comes
from the fact that it concentrated
exclusively on the production of
biogas from the digestion of local
waste flows, such as wastewater
sludge, landfill gas and organic
waste from farming, the food
industry and households. Bio-
mass gasification and renewable
methane production from energy
crops were excluded from the stu-
dy’s scenario modelling section.
Four scenarios covering different
biogas development assumptions
were analysed. The first scenario,
“Local use + electricity”, assumes
local use of the biogas via coge-
neration combined with regu-
lar deployment of feedstocks,
reduction in investment costs
and an increase in energy yields.
The second scenario “Local use
+ electricity, with accelerated
deployment and innovation” is
based on the assumption of local
use of the biogas via cogenera-
tion and accelerated deployment
of raw materials, reduction in
investment costs and an increase
in conversion yields. A third scena-
rio, “Biomethane to grid” is based
on the purification of the biogas
injected into the grid, used in the
transport of building sectors, with
regular deployment of feedstocks,
reduction in investment costs and
conversion efficiency. The last
scenario, “Biomethane to grid,
with accelerated deployment and
62 649
70 00064 238
2014 2015 2016 2020N
RE
AP
57 86160 996
44 112
NR
EA
P
3 577
4 500 4 456
2014 2015 2016 2020
NR
EA
P
3 0583 301
2 676
NR
EA
P
Source: EurObserv’ER 2017
Source: EurObserv’ER 2017
Nat
ur
e E
ner
gy
innovation” relies on the conver-
sion of the biogas into injected
biomethane combined with accele-
rated deployment of raw materials,
reduction in investment costs and
enhanced conversion efficiency.
Based on these potentials, the
assessment demonstrates that
biogas production in the European
Union could rise from 14.9 Mtoe in
2014 to 28.8 (scenarios 1 and 3) or
to 40.2 Mtoe (scenarios 2 and 4)
in 2030, depending on the quan-
tity of useable raw material and
the learning effects taken into
consideration. Compared to the
2016 level (16 Mtoe), this repre-
sents multiplication by 1.8 and 2.5
times respectively of the primary
energy produced. These scenarios
would lead to 2030 biogas and bio-
methane output levels of between
2.7 and 3.7% of the EU’s energy
consumption. n
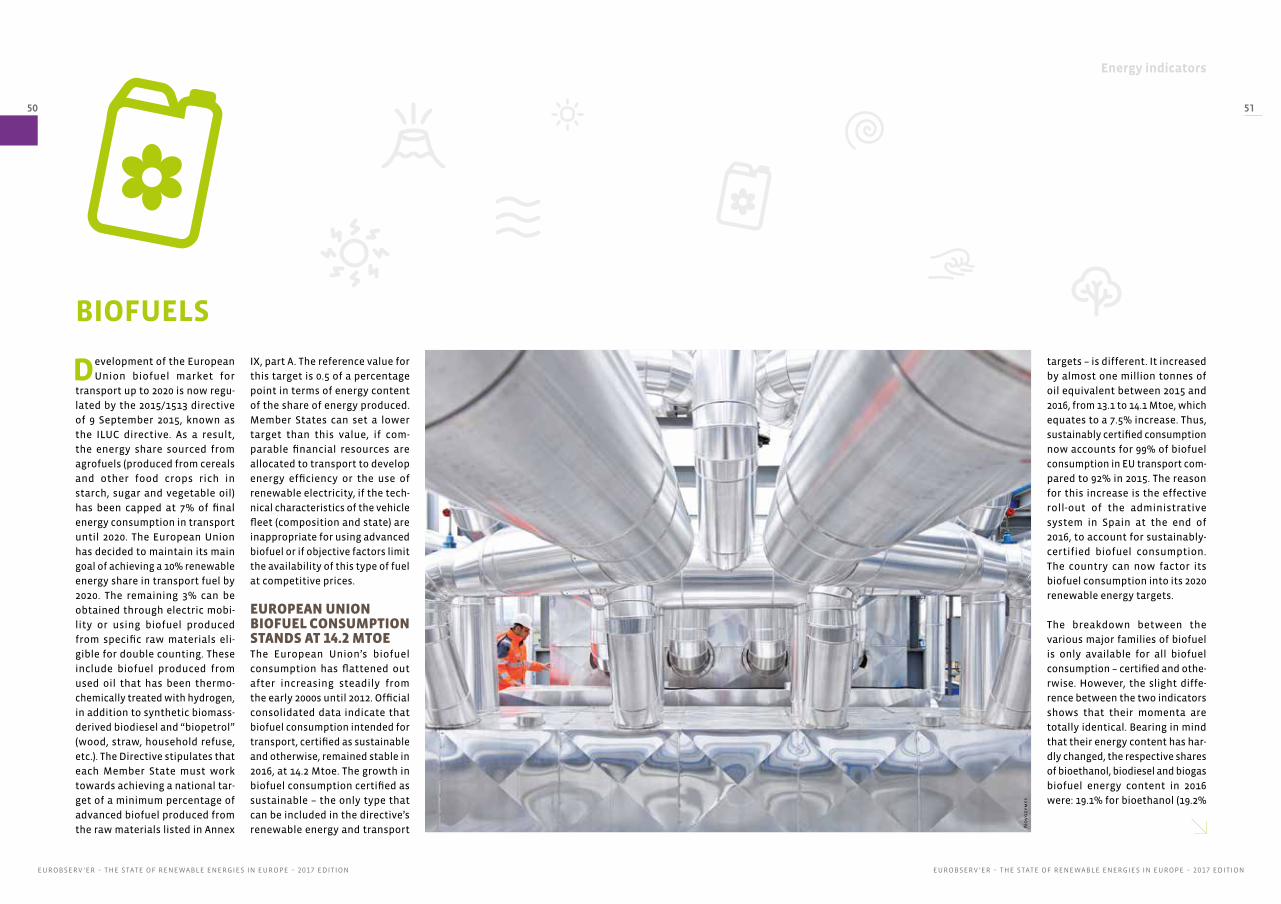
Energy indicators
EUROBSERV ’ER – THE STATE OF RENEWABLE ENERGIES IN EUROPE – 2017 EDITIONEUROBSERV ’ER – THE STATE OF RENEWABLE ENERGIES IN EUROPE – 2017 EDITION
50 51
Development of the European
Union biofuel market for
transport up to 2020 is now regu-
lated by the 2015/1513 directive
of 9 September 2015, known as
the ILUC directive. As a result,
the energy share sourced from
agrofuels (produced from cereals
and other food crops rich in
starch, sugar and vegetable oil)
has been capped at 7% of final
energy consumption in transport
until 2020. The European Union
has decided to maintain its main
goal of achieving a 10% renewable
energy share in transport fuel by
2020. The remaining 3% can be
obtained through electric mobi-
lity or using biofuel produced
from specific raw materials eli-
gible for double counting. These
include biofuel produced from
used oil that has been thermo-
chemically treated with hydrogen,
in addition to synthetic biomass-
derived biodiesel and “biopetrol”
(wood, straw, household refuse,
etc.). The Directive stipulates that
each Member State must work
towards achieving a national tar-
get of a minimum percentage of
advanced biofuel produced from
the raw materials listed in Annex
IX, part A. The reference value for
this target is 0.5 of a percentage
point in terms of energy content
of the share of energy produced.
Member States can set a lower
target than this value, if com-
parable financial resources are
allocated to transport to develop
energy efficiency or the use of
renewable electricity, if the tech-
nical characteristics of the vehicle
fleet (composition and state) are
inappropriate for using advanced
biofuel or if objective factors limit
the availability of this type of fuel
at competitive prices.
EUROPEAN UNION BIOFUEL CONSUMPTION STANDS AT 14.2 MTOE The European Union’s biofuel
consumption has flattened out
after increasing steadily from
the early 2000s until 2012. Official
consolidated data indicate that
biofuel consumption intended for
transport, certified as sustainable
and otherwise, remained stable in
2016, at 14.2 Mtoe. The growth in
biofuel consumption certified as
sustainable – the only type that
can be included in the directive’s
renewable energy and transport
BIOFUELS
targets – is different. It increased
by almost one million tonnes of
oil equivalent between 2015 and
2016, from 13.1 to 14.1 Mtoe, which
equates to a 7.5% increase. Thus,
sustainably certified consumption
now accounts for 99% of biofuel
consumption in EU transport com-
pared to 92% in 2015. The reason
for this increase is the effective
roll-out of the administrative
system in Spain at the end of
2016, to account for sustainably-
certified biofuel consumption.
The country can now factor its
biofuel consumption into its 2020
renewable energy targets.
The breakdown between the
various major families of biofuel
is only available for all biofuel
consumption – certified and othe-
rwise. However, the slight diffe-
rence between the two indicators
shows that their momenta are
totally identical. Bearing in mind
that their energy content has har-
dly changed, the respective shares
of bioethanol, biodiesel and biogas
biofuel energy content in 2016
were: 19.1% for bioethanol (19.2%
No
voz
ymes
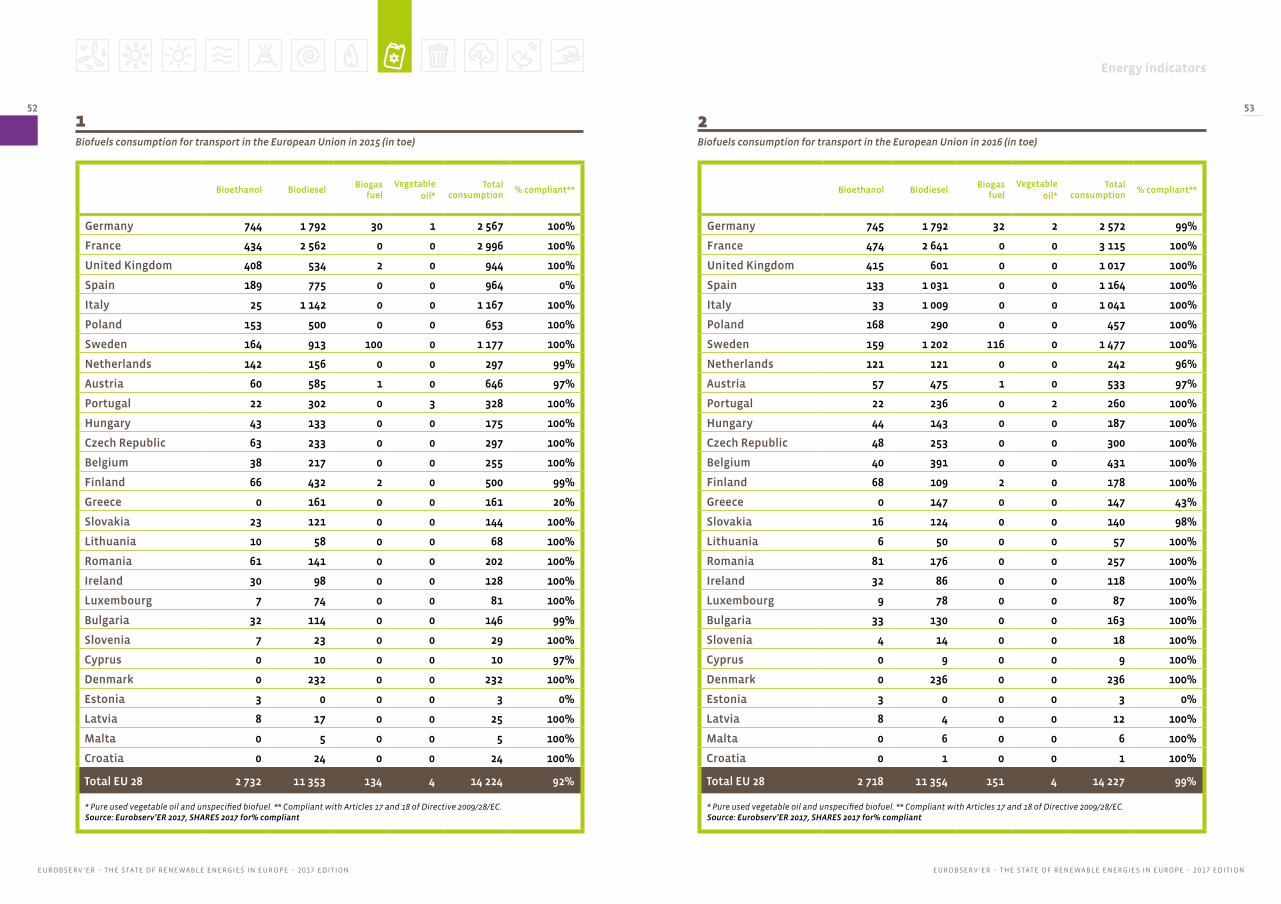
Energy indicators
EUROBSERV ’ER – THE STATE OF RENEWABLE ENERGIES IN EUROPE – 2017 EDITIONEUROBSERV ’ER – THE STATE OF RENEWABLE ENERGIES IN EUROPE – 2017 EDITION
52 53
2Biofuels consumption for transport in the European Union in 2016 (in toe)
1Biofuels consumption for transport in the European Union in 2015 (in toe)
Bioethanol BiodieselBiogas
fuelVegetable
oil*Total
consumption% compliant**
Germany 744 1 792 30 1 2 567 100%
France 434 2 562 0 0 2 996 100%
United Kingdom 408 534 2 0 944 100%
Spain 189 775 0 0 964 0%
Italy 25 1 142 0 0 1 167 100%
Poland 153 500 0 0 653 100%
Sweden 164 913 100 0 1 177 100%
Netherlands 142 156 0 0 297 99%
Austria 60 585 1 0 646 97%
Portugal 22 302 0 3 328 100%
Hungary 43 133 0 0 175 100%
Czech Republic 63 233 0 0 297 100%
Belgium 38 217 0 0 255 100%
Finland 66 432 2 0 500 99%
Greece 0 161 0 0 161 20%
Slovakia 23 121 0 0 144 100%
Lithuania 10 58 0 0 68 100%
Romania 61 141 0 0 202 100%
Ireland 30 98 0 0 128 100%
Luxembourg 7 74 0 0 81 100%
Bulgaria 32 114 0 0 146 99%
Slovenia 7 23 0 0 29 100%
Cyprus 0 10 0 0 10 97%
Denmark 0 232 0 0 232 100%
Estonia 3 0 0 0 3 0%
Latvia 8 17 0 0 25 100%
Malta 0 5 0 0 5 100%
Croatia 0 24 0 0 24 100%
Total EU 28 2 732 11 353 134 4 14 224 92%
* Pure used vegetable oil and unspecified biofuel. ** Compliant with Articles 17 and 18 of Directive 2009/28/EC. Source: Eurobserv’ER 2017, SHARES 2017 for% compliant
Bioethanol BiodieselBiogas
fuelVegetable
oil*Total
consumption% compliant**
Germany 745 1 792 32 2 2 572 99%
France 474 2 641 0 0 3 115 100%
United Kingdom 415 601 0 0 1 017 100%
Spain 133 1 031 0 0 1 164 100%
Italy 33 1 009 0 0 1 041 100%
Poland 168 290 0 0 457 100%
Sweden 159 1 202 116 0 1 477 100%
Netherlands 121 121 0 0 242 96%
Austria 57 475 1 0 533 97%
Portugal 22 236 0 2 260 100%
Hungary 44 143 0 0 187 100%
Czech Republic 48 253 0 0 300 100%
Belgium 40 391 0 0 431 100%
Finland 68 109 2 0 178 100%
Greece 0 147 0 0 147 43%
Slovakia 16 124 0 0 140 98%
Lithuania 6 50 0 0 57 100%
Romania 81 176 0 0 257 100%
Ireland 32 86 0 0 118 100%
Luxembourg 9 78 0 0 87 100%
Bulgaria 33 130 0 0 163 100%
Slovenia 4 14 0 0 18 100%
Cyprus 0 9 0 0 9 100%
Denmark 0 236 0 0 236 100%
Estonia 3 0 0 0 3 0%
Latvia 8 4 0 0 12 100%
Malta 0 6 0 0 6 100%
Croatia 0 1 0 0 1 100%
Total EU 28 2 718 11 354 151 4 14 227 99%
* Pure used vegetable oil and unspecified biofuel. ** Compliant with Articles 17 and 18 of Directive 2009/28/EC. Source: Eurobserv’ER 2017, SHARES 2017 for% compliant

Energy indicators
EUROBSERV ’ER – THE STATE OF RENEWABLE ENERGIES IN EUROPE – 2017 EDITIONEUROBSERV ’ER – THE STATE OF RENEWABLE ENERGIES IN EUROPE – 2017 EDITION
54 55
in 2015), 79.8% for biodiesel (79.8%
in 2015) and 1.1% for biogas (0.9% in
2015). The share of the other types
of biofuel is unrepresentative.
If we analyse the changes in
consumption of the various types
of biofuels of the different Member
States, we note that the changes
have been far more contrasted
than across the European Union,
in terms of total consumption,
and distribution between the
types consumed. In 2016, bio-
fuel consumption in half of the
countries (15 of the 28) was lower
than the previous year. Some of
them even decided to radically
reduce their biofuel consump-
tion. The drops in energy content
were particularly sharp in Finland
(64.3%), Poland (30%), Portugal
(20.7%), the Netherlands (18.7%),
Austria (17.5%), Greece (8.9%) and
many of the Eastern European
We can conclude that some sort
of redistribution occurred in the
European Union.
STRUGGLE FOR INFLUENCE OVER BIOFUEL’S FUTURE The ILUC Directive adopted in
September 2015 clarified the
requirements, which should
naturally enable those Member
States that have not already done
so, to set their incorporation rate
roadmap through to 2020. EurOb-
serv’ER believes that if Europe’s
commitments are met, the effec-
tive (conventional and advanced)
biofuel incorporation rate should
range from 7 to 8% by that time-
line. However, the lack of clear
prospects for the future of edible
crop feedstock biofuel after 2020
is leading some States – those
whose economies are least affec-
ted by agrofuel production – to
revise their commitments or defy
the 2009 renewable energy direc-
tive’s demands for transport. Cer-
tain Member States’ consumption
woes would appear to lend their
weight to this theory. According
to the Eurostat estimates released
at the end of January 2018, the
renewable energy share in trans-
port fuel, factoring in the accoun-
ting adjustments and electricity
consumption amounted to 7.1%
in 2016 (6.6% in 2015).
The European Commission’s policy
formulated in the new draft Direc-
tive is to offer the Member States
greater freedom on how they
achieve their national targets. They
will have to be negotiated under
the terms of a common European
Union-wide target. So which types
of biofuel will be available on the
market from 2021 and through
to 2030 and in what proportion?
The answer is at the crux of the
on-going political negotiations
within the European institutions.
The European Commission’s draft
renewable energies directive revi-
sion of 30 November 2016 removes
the renewable energy target for
transport and leaves countries
free to choose the proportion
devoted to transport, producing
renewable electricity and heat, as
part of a common European Union
target (with efforts negotiated
between the Member States) of at
least 27% of renewable energy in
the European Union’s total energy
consumption by 2030.
Additionally, the European Com-
mission wants to impose a gradual
reduction in the “agrofuel” share
and cap it at 3.8% by 2030. The pro-
posal is to introduce an annual 0.3
of a percentage point reduction
from 2021 to 2025 and increase this
reduction to 0.4 of a percentage
point from 2026 to 2030. Another
important aspect of the project is
that the Member States are obli-
ged to demand their fuel suppliers
to include a minimum share of
renewable energy and low-carbon
fuels in the total quantity of fuel
used for transport. These include
advanced biofuel, non-biologically
sourced fuels (e.g. hydrogen), fuels
produced from waste or renewable
electricity-sourced fuel. The mini-
mum share must be no less than
1.5% in 2021 and must rise to at
least 6.8% in 2030 along a pre-2021
trajectory.
For its part the European Parlia-
ment made new proposals on
17 January 2018 for revising the
Renewable Energies Directive that
set the targets to be achieved by
2030. By that date, each Member
State will have to ensure that 12%
of the energy consumed in trans-
port is renewably-sourced. The
contribution of so-called “first-
generation” biofuel (subsistence
and fodder crops) should be cap-
ped at 2017 levels with a maximum
of 7% in road and rail transport.
The MPs also want to ban palm
oil from 2021 onwards. The share
of advanced biofuel (that has less
impact on land use than those
based on subsistence crops), non-
organic renewable transport fuel,
non-fossil waste-based fuel and
renewable electricity should be
at least 1.5% in 2021 and increase
to 10% in 2030. The next stage will
be to embark on negotiations with
the European Council, which will
have the final word. n
countries such as Croatia, Latvia,
Estonia, Slovenia, Lithuania and
Slovakia. These sharp falls were
offset by increased use of biofuel
in the major consumer countries
such as France (4%), the UK (7.7%),
Spain (20.8%), Belgium (69.2%),
Sweden (25.4%), and even Romania
(27%) and Bulgaria (11.6%).
In some countries, the decline
in consumption hit a specific
type of biofuel. Accordingly,
biodiesel consumption contrac-
ted significantly in Finland (by
74.8%), Poland (by 42%) and Italy
(by 11.7%) while their bioethanol
consumption rose (by 3.1% in Fin-
land, by 9.2% in Poland, by 31.2% in
Italy). The reverse applies to Spain
(29.5% less bioethanol, 33% more
biodiesel), the Czech Republic
(24.5% less bioethanol, 8.3% more
biodiesel) and Slovakia (32.2% less
bioethanol, 2.9% more biodiesel).
20 000
29 888
2016 2020
TOTA
L N
RE
AP
Bioethanol
Biodiesel
Other biofuels
14 227
2014 2015
14 205
19 850
TOTA
L N
RE
AP
14 224
Source: EurObserv’ER 2017
2Comparison of the current biofuel consumption for transport trend
against the NREAP (National Renewable Energy Action Plans) roadmap
(in ktoe)
No
voz
ymes

Energy indicators
EUROBSERV ’ER – THE STATE OF RENEWABLE ENERGIES IN EUROPE – 2017 EDITIONEUROBSERV ’ER – THE STATE OF RENEWABLE ENERGIES IN EUROPE – 2017 EDITION
30 31
1Capacity installed and net capacity usable of geothermal electricity
plants in the EU in 2015 and 2016 (in MWe)
This form of energy is drawn
from the subsoil as hot water
or steam. It is used for space hea-
ting, space cooling and producing
electricity. Geothermal techniques
and uses vary in line with the tem-
perature of the aquifer from which
the water is drawn. When it ranges
from 30° to 150°C (from a depth of
a few hundred to approximately
2 000 metres), geothermal heat
can be used for district heating
(heating networks) or be supplied
directly to heat single-family
homes, multi-occupancy buildings
or for use on farms. One or more
very high capacity heat pumps (HP)
may be coupled with a geother-
mal heating network system to
improve its performance by increa-
sing the temperature range that
can be harnessed by the network,
thus optimizing the use of the avai-
lable geothermal energy.
When the aquifer temperature
ranges from 90 to 150°C, electricity
can also be produced. In this case,
the water drawn from the subsoil,
which is liquid when it reaches the
surface, transfers its heat to ano-
ther liquid that vaporises at below
100°C. The steam obtained by this
GEOTHERMAL ENERGY
2015 2016
Capacity installed
Net capacity
Capacity installed
Net capacity
Italy 915.5 768.0 915.5 767.2
Germany 34.0 26.0 40.0 29.0
Portugal 29.0 25.0 29.0 25.0
France* 17.1 17.1 17.1 17.1
Austria 1.0 1.0 1.0 1.0
Total EU 28 996.6 837.1 1 002.6 839.3
French overseas department included (15 MW in Guadeloupe). Source: EurObserv’ER 2017
technique drives a turbine to gene-
rate electricity. These plants can be
run as combined heat and power
plants producing heat for heating
networks and power at the same
time. Water drawn from depths
of more than 1 500 metres above
150°C (up to 250°C), reaches the
surface as steam and can be used
directly to drive electricity genera-
ting turbines. This is what is called
high-energy geothermal power. It
is found in volcanic regions and at
plate boundaries. Heat pump sys-
tems that extract the superficial
heat from the soil and surface aqui-
fers are dealt with specifically and
by convention are excluded from
official geothermal energy data.
HEAT PRODUCTION The uses of geothermal heat are
manifold. The main application
is for heating dwellings and com-
mercial premises, but it can also
be applied to agriculture (heating
greenhouses, drying crops, etc.),
fish-farming, industrial processes,
the spa industry or heating pools.
Refrigeration is another area of
use. Faced with so many solutions,
accurate and regular monitoring of
the thermal capacity by the official
statistical bodies can be dogged by
shortcomings. The most accurate
monitoring is currently conducted
by the EGEC exclusively within
the scope of geothermal heating
networks. Compared with 2012,
the number of heating networks
has increased sharply as 51 new
networks have been commissio-
ned, corresponding to 550 MWth of
additional capacity over the past
5 years. This additional capacity
equates to mean annual growth
of 10% across the European Union.
Incidentally, while the urban
heating network market trend
revolves around renovation and
expanding existing systems, the
trend is reversed for geothermal
heating networks. EGEC claims
that 77% of the district heating
systems installed over the past five
years have been for new geother-
mal plants, while the remaining
Dr
/GF
D P
osd
am
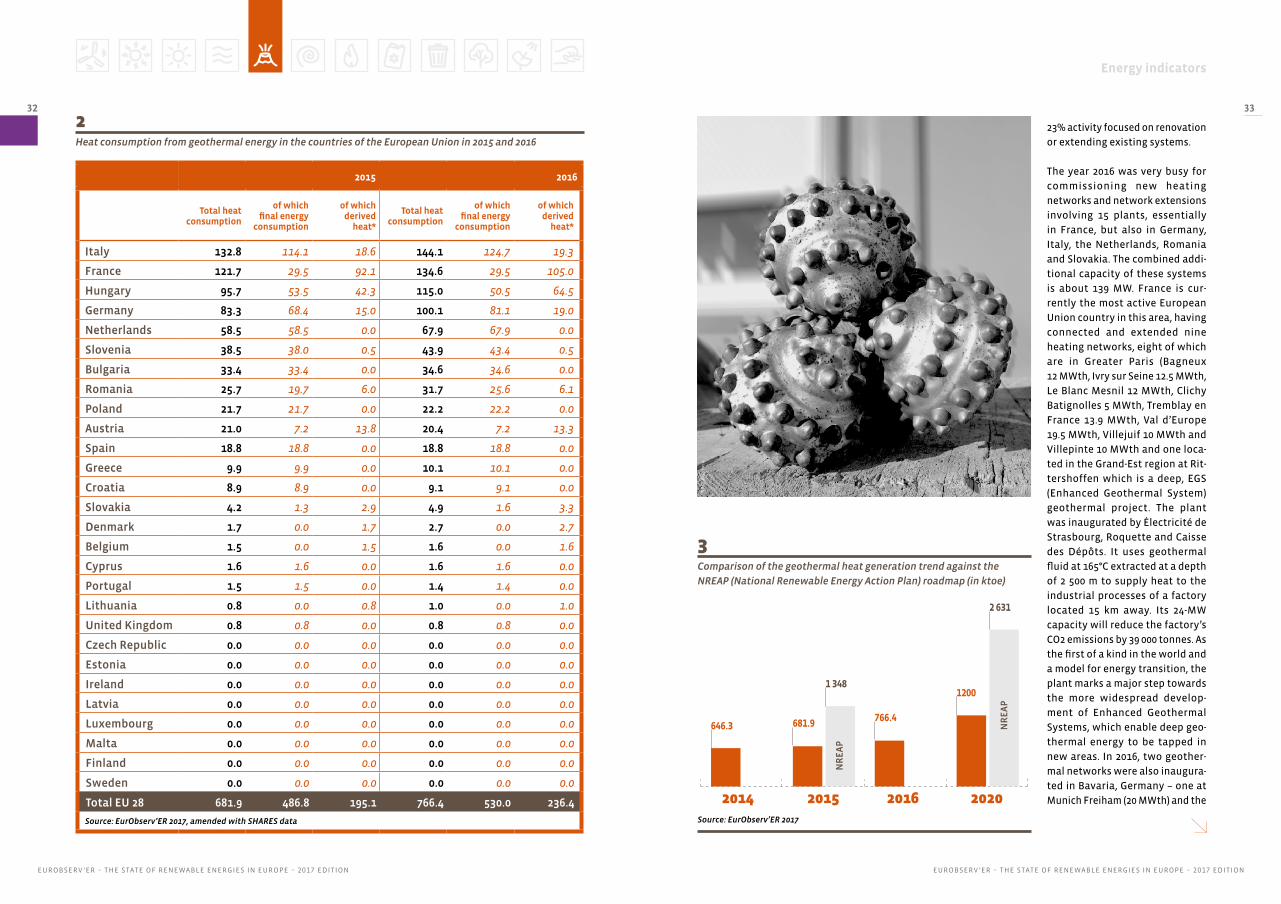
Energy indicators
EUROBSERV ’ER – THE STATE OF RENEWABLE ENERGIES IN EUROPE – 2017 EDITIONEUROBSERV ’ER – THE STATE OF RENEWABLE ENERGIES IN EUROPE – 2017 EDITION
32 33
23% activity focused on renovation
or extending existing systems.
The year 2016 was very busy for
commissioning new heating
networks and network extensions
involving 15 plants, essentially
in France, but also in Germany,
Italy, the Netherlands, Romania
and Slovakia. The combined addi-
tional capacity of these systems
is about 139 MW. France is cur-
rently the most active European
Union country in this area, having
connected and extended nine
heating networks, eight of which
are in Greater Paris (Bagneux
12 MWth, Ivry sur Seine 12.5 MWth,
Le Blanc Mesnil 12 MWth, Clichy
Batignolles 5 MWth, Tremblay en
France 13.9 MWth, Val d’Europe
19.5 MWth, Villejuif 10 MWth and
Villepinte 10 MWth and one loca-
ted in the Grand-Est region at Rit-
tershoffen which is a deep, EGS
(Enhanced Geothermal System)
geothermal project. The plant
was inaugurated by Électricité de
Strasbourg, Roquette and Caisse
des Dépôts. It uses geothermal
fluid at 165°C extracted at a depth
of 2 500 m to supply heat to the
industrial processes of a factory
located 15 km away. Its 24-MW
capacity will reduce the factory’s
CO2 emissions by 39 000 tonnes. As
the first of a kind in the world and
a model for energy transition, the
plant marks a major step towards
the more widespread develop-
ment of Enhanced Geothermal
Systems, which enable deep geo-
thermal energy to be tapped in
new areas. In 2016, two geother-
mal networks were also inaugura-
ted in Bavaria, Germany – one at
Munich Freiham (20 MWth) and the
2Heat consumption from geothermal energy in the countries of the European Union in 2015 and 2016
2015 2016
Total heat consumption
of which final energy
consumption
of which derived
heat*
Total heat consumption
of which final energy
consumption
of which derived
heat*
Italy 132.8 114.1 18.6 144.1 124.7 19.3
France 121.7 29.5 92.1 134.6 29.5 105.0
Hungary 95.7 53.5 42.3 115.0 50.5 64.5
Germany 83.3 68.4 15.0 100.1 81.1 19.0
Netherlands 58.5 58.5 0.0 67.9 67.9 0.0
Slovenia 38.5 38.0 0.5 43.9 43.4 0.5
Bulgaria 33.4 33.4 0.0 34.6 34.6 0.0
Romania 25.7 19.7 6.0 31.7 25.6 6.1
Poland 21.7 21.7 0.0 22.2 22.2 0.0
Austria 21.0 7.2 13.8 20.4 7.2 13.3
Spain 18.8 18.8 0.0 18.8 18.8 0.0
Greece 9.9 9.9 0.0 10.1 10.1 0.0
Croatia 8.9 8.9 0.0 9.1 9.1 0.0
Slovakia 4.2 1.3 2.9 4.9 1.6 3.3
Denmark 1.7 0.0 1.7 2.7 0.0 2.7
Belgium 1.5 0.0 1.5 1.6 0.0 1.6
Cyprus 1.6 1.6 0.0 1.6 1.6 0.0
Portugal 1.5 1.5 0.0 1.4 1.4 0.0
Lithuania 0.8 0.0 0.8 1.0 0.0 1.0
United Kingdom 0.8 0.8 0.0 0.8 0.8 0.0
Czech Republic 0.0 0.0 0.0 0.0 0.0 0.0
Estonia 0.0 0.0 0.0 0.0 0.0 0.0
Ireland 0.0 0.0 0.0 0.0 0.0 0.0
Latvia 0.0 0.0 0.0 0.0 0.0 0.0
Luxembourg 0.0 0.0 0.0 0.0 0.0 0.0
Malta 0.0 0.0 0.0 0.0 0.0 0.0
Finland 0.0 0.0 0.0 0.0 0.0 0.0
Sweden 0.0 0.0 0.0 0.0 0.0 0.0
Total EU 28 681.9 486.8 195.1 766.4 530.0 236.4
Source: EurObserv’ER 2017, amended with SHARES data
3Comparison of the geothermal heat generation trend against the
NREAP (National Renewable Energy Action Plan) roadmap (in ktoe)
766.4
1200
2 631
2014 2015 2016 2020
NR
EA
P
646.3 681.9
1 348
NR
EA
P
Source: EurObserv’ER 2017
RA
G A
ust
ria

Energy indicators
EUROBSERV ’ER – THE STATE OF RENEWABLE ENERGIES IN EUROPE – 2017 EDITIONEUROBSERV ’ER – THE STATE OF RENEWABLE ENERGIES IN EUROPE – 2017 EDITION
34 35
city standing at 1003 MW (a
5.5 MW increase). Net capacity,
which is the maximum capacity
presumed to be exploitable, is put
at 839.3 MW (2.2 MW more), inclu-
ding 15 MW in Guadeloupe. Gross
electricity output rose to 6.7 TWh
in 2016, compared to 6.6 TWh in
2015. If we leave out the French
overseas departments (which
are excluded by Eurostat), output
increased from 6.5 TWh in 2015
to 6.6 TWh in 2016. EurObserv’ER
claims that Germany is the only
country to have increased its geo-
thermal capacity by connecting
the Traunreut plant in Bavaria
equipped with a 5.5-MW electric
turbine. This cogeneration plant
was already supplying 12 MWth
of heat to the town back in 2014.
AGEEstat reports that Germany’s
net exploitable electrical capacity
is now 29 MW, for about 40 MW
of installed capacity. The rea-
sons for the difference are plant
operating problems, restrictive
operating permits and the fact
that self-consumption is a major
reality in geothermal plants. Italy
is the main European geother-
mal energy leader with 915.5 MW
installed. This figure was stable
between 2014 and 2015. Accor-
ding to the Ministry of Economic
Development data, net exploitable
capacity is 767.2 MW which is very
slightly less than in 2015.
CAPACITY INCREASES DASH EXPECTATIONSData from the EGEC 2016 report
suggests that European Union
geothermal energy capacity
should increase in the next few
years and could rise to 1 185 MW
by 2020. By that time new European
Union countries should be able
to establish a production sector,
2015 2016
France 389.5 492.5
Germany 262.6 300.6
Hungary 271.1 253.6
Italy 137.6 156.5
Netherlands 121.8 126.8
Romania 83.0 85.0
Poland 100.2 63.6
Austria 52.6 59.9
Sweden 33.0 48.0
Denmark 33.2 33.2
Croatia 19.9 19.9
Slovakia 14.2 16.0
Lithuania 13.6 13.6
Belgium 10.0 10.0
Czech Republic 3.2 6.5
Slovenia 3.7 3.7
United Kingdom 2.8 2.0
Total EU 28 1 551.8 1 691.2
Source: EGEC Market report 2015, Market Report 2016
4Capacity of geothermal district heating systems installed
in the European Union in 2015 and 2016 (in MWth)
other at Kirchweidach (12 MWth).
The other newly-commissioned
networks were at Vierpoldeers
in the Netherlands (15.7 MW), the
Friuli-Venezia-Giulia-Grado (2 MW)
pilot project in Italy, the Balotesti
site (2 MW) in Romania and Velky
Meder (1.8 MWth) in Slovakia.
Geothermal heat output data is
regularly monitored by the natio-
nal statistical offices and Euros-
tat. The official data collected
by EurObserv’ER, which includes
geothermal heat distributed by
networks and the heat directly
used by the final user, suggest
Various factors are to blame for
this poor progress towards achie-
ving the NREAP targets… prima-
rily the recession at the start of
the 2010s and inconsistency in EU
heating and cooling policy. None-
theless, the sector’s recovery over
the past five years, gives grounds
for more optimism when we consi-
der the deployment trajectory of
geothermal energy.
One of the promising trends for
the future is the development
and installation of smart heating
networks. Smart grids do not
only involve production, but also
the heat production of networks
capable of combining a variety of
renewable energies, while utilising
electricity surpluses. Geothermal
energy, in the same way as solar
thermal, currently plays a very
important role in the development
of smart heating networks, both
for producing heat and hot water
but also refrigeration for the sum-
mer season, or for industry. The
challenges faced by smart cities
are not only that each one has
its own specific characteristics,
but that they comprise different
zones and levels of urban density
(city centre, districts, suburbs,
parks, etc.). Covering the heating
and air-conditioning consumption
of smart cities calls for smart ther-
mal networks to respond to this
and other energy transition chal-
lenges for a low-carbon economy.
THE THRESHOLD OF 1000 MW OF ELECTRICITY HAS BEEN PASSEDEurObserv’ER puts the combined
geothermal power capacity of
the European Union at a slightly
higher level with installed capa-
766.4 ktoe of output in 2016, i.e.
12.4% year-on-year growth (5.5%
growth between 2014 and 2015).
IMPLEMENTING SMART HEATING NETWORKSGeothermal energy is perfor-
ming well below the trajectory
level mapped out in the National
Renewable Energy Action Plans.
The EU report on renewable ener-
gies notes that the deployment of
geothermal energy is under par
and that the EU has generally fal-
len behind its planned trajectory
for renewable energies.
such as Croatia (26 MW), Greece
(23 MW), Hungary (22 MW) and the
Czech Republic (10 MW). Yet this
forecast for 2020 falls far short of
the planned targets set out in the
National Renewable Energy Action
Plans that provided for 1627.9 MW
of combined geothermal capacity
in 2020. As it stands, output will
be unable to pass the 8 TWh mark,
while the trajectory forecast was
for 10.9 TWh in 2020. n
5Gross electricity generation from geothermal energy in the European
Union countries in 2015 and 2016 (in GWh)
2015 2016
Italy 6185.0 6288.6
Portugal 203.6 171.6
Germany 134.1 174.7
France* 92.0 93.0
Austria 0.06 0.02
Total EU 6614.7 6727.9The data of France include DOM (Guadeloupe), the recorded production in metropolitan France was 0 GWh in 2015 and 4 GWh in 2016. Source: EurObserv’ER 2017
6 3036 728
8 000
10 892
2014 2015 2016 2020
NR
EA
P
6 6157 342
NR
EA
P
Source: EurObserv’ER 2017
6Comparison of the current geothermal electricity generation
trend against the NREAP (National Renewable Energy Action Plan)
roadmap (in GWh)
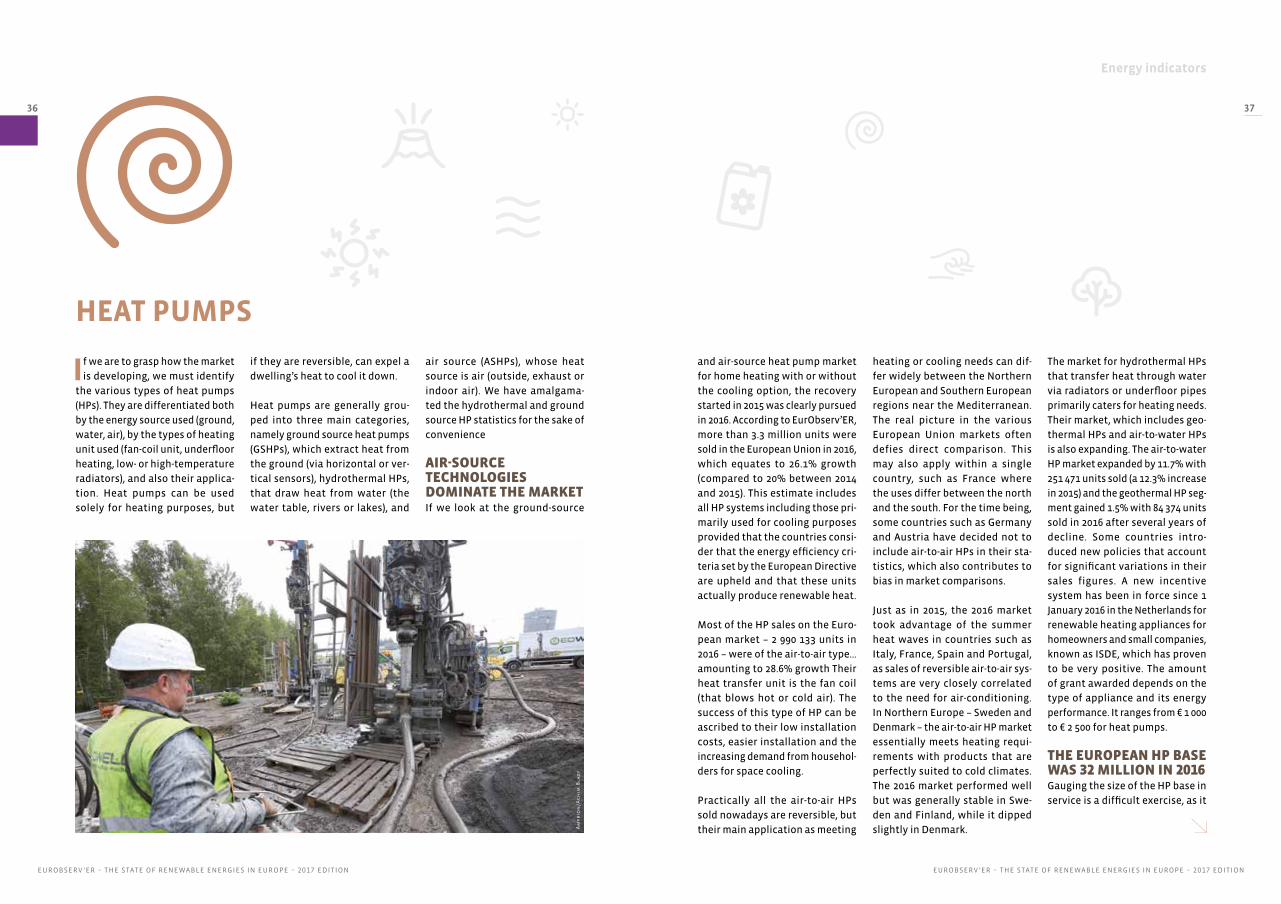
Energy indicators
EUROBSERV ’ER – THE STATE OF RENEWABLE ENERGIES IN EUROPE – 2017 EDITIONEUROBSERV ’ER – THE STATE OF RENEWABLE ENERGIES IN EUROPE – 2017 EDITION
36 37
HEAT PUMPS
If we are to grasp how the market
is developing, we must identify
the various types of heat pumps
(HPs). They are differentiated both
by the energy source used (ground,
water, air), by the types of heating
unit used (fan-coil unit, underfloor
heating, low- or high-temperature
radiators), and also their applica-
tion. Heat pumps can be used
solely for heating purposes, but
and air-source heat pump market
for home heating with or without
the cooling option, the recovery
started in 2015 was clearly pursued
in 2016. According to EurObserv’ER,
more than 3.3 million units were
sold in the European Union in 2016,
which equates to 26.1% growth
(compared to 20% between 2014
and 2015). This estimate includes
all HP systems including those pri-
marily used for cooling purposes
provided that the countries consi-
der that the energy efficiency cri-
teria set by the European Directive
are upheld and that these units
actually produce renewable heat.
Most of the HP sales on the Euro-
pean market – 2 990 133 units in
2016 – were of the air-to-air type…
amounting to 28.6% growth Their
heat transfer unit is the fan coil
(that blows hot or cold air). The
success of this type of HP can be
ascribed to their low installation
costs, easier installation and the
increasing demand from househol-
ders for space cooling.
Practically all the air-to-air HPs
sold nowadays are reversible, but
their main application as meeting
if they are reversible, can expel a
dwelling’s heat to cool it down.
Heat pumps are generally grou-
ped into three main categories,
namely ground source heat pumps
(GSHPs), which extract heat from
the ground (via horizontal or ver-
tical sensors), hydrothermal HPs,
that draw heat from water (the
water table, rivers or lakes), and
air source (ASHPs), whose heat
source is air (outside, exhaust or
indoor air). We have amalgama-
ted the hydrothermal and ground
source HP statistics for the sake of
convenience
AIR-SOURCE TECHNOLOGIES DOMINATE THE MARKETIf we look at the ground-source
heating or cooling needs can dif-
fer widely between the Northern
European and Southern European
regions near the Mediterranean.
The real picture in the various
European Union markets often
defies direct comparison. This
may also apply within a single
country, such as France where
the uses differ between the north
and the south. For the time being,
some countries such as Germany
and Austria have decided not to
include air-to-air HPs in their sta-
tistics, which also contributes to
bias in market comparisons.
Just as in 2015, the 2016 market
took advantage of the summer
heat waves in countries such as
Italy, France, Spain and Portugal,
as sales of reversible air-to-air sys-
tems are very closely correlated
to the need for air-conditioning.
In Northern Europe – Sweden and
Denmark – the air-to-air HP market
essentially meets heating requi-
rements with products that are
perfectly suited to cold climates.
The 2016 market performed well
but was generally stable in Swe-
den and Finland, while it dipped
slightly in Denmark.
The market for hydrothermal HPs
that transfer heat through water
via radiators or underfloor pipes
primarily caters for heating needs.
Their market, which includes geo-
thermal HPs and air-to-water HPs
is also expanding. The air-to-water
HP market expanded by 11.7% with
251 471 units sold (a 12.3% increase
in 2015) and the geothermal HP seg-
ment gained 1.5% with 84 374 units
sold in 2016 after several years of
decline. Some countries intro-
duced new policies that account
for significant variations in their
sales figures. A new incentive
system has been in force since 1
January 2016 in the Netherlands for
renewable heating appliances for
homeowners and small companies,
known as ISDE, which has proven
to be very positive. The amount
of grant awarded depends on the
type of appliance and its energy
performance. It ranges from € 1 000
to € 2 500 for heat pumps.
THE EUROPEAN HP BASE WAS 32 MILLION IN 2016Gauging the size of the HP base in
service is a difficult exercise, as it
Am
prio
n/A
ch
im B
laz
y

Energy indicators
EUROBSERV ’ER – THE STATE OF RENEWABLE ENERGIES IN EUROPE – 2017 EDITIONEUROBSERV ’ER – THE STATE OF RENEWABLE ENERGIES IN EUROPE – 2017 EDITION
38 39
1Market of aerothermal heat pumps in 2015 and 2016* (number of units sold).
2Market of geothermal (ground source) heat pumps* in 2015 et 2016
(number of units sold)
depends on the assumptions made,
the availability of statistics from
the Member States and professio-
nal HP associations. Furthermore,
the statistics are heavily skewed
by the inclusion of small rever-
sible mono-split HP systems by
countries such as Italy and France.
EurObserv’ER puts the installed HP
base to date in the European Union
at about 32 million units (30.5 mil-
lion aerothermal and 1.5 million
geothermal HPs).
As for the renewable energy output
generated by HP (all technologies
taken together), EurObserv’ER
bases its estimates on the sta-
tistics provided by each Mem-
ber State as part of the Eurostat
SHARES (SHort Assessment of
2 015 2 016
Sweden 26 377 22 843
Germany 17 000 20 700
Finland 9 210 8 491
Poland 5 567 5 390
Austria 5 897 5 228
Netherlands 2 086 4 065
France 3 810 3 095
Denmark 1 885 2 248
United Kingdom 2 388 1 920
Slovakia 234 1 920
Estonia 1 750 1 750
Belgium 1 404 1 600
Czech Republic 1 570 1 521
Italy 952 860
Hungary 85 800
Lithuania 785 770
Slovenia 913 700
Ireland 337 371
Spain 72 77
Portugal 59 25
Bulgaria 532 0
Luxembourg 87 0
Total EU 28 83 000 84 374
* Hydrothermal heat pumps included. Source: EurObserv’ER 2017
2015 2016
Aerothermal HP
of which air-air HP
of which air-water HP
of which exhaust
air HP
Aerothermal HP
of which air-air HP
of which air-water HP
of which exhaust
air HP
Italy 997 400 972 200 25 200 0 1 541 000 1 511 000 30 000 0
Spain 742 999 734 199 8 800 0 792 088 781 116 10 972 0
France 405 680 332 110 73 570 0 446 745 372 270 74 475 0
Portugal 77 591 77 132 459 0 129 136 128 611 525 0
Sweden 73 608 52 000 8 040 13 568 75 413 52 000 8 099 15 314
Netherlands 49 176 43 541 5 635 0 69 797 58 618 11 179 0
Germany 52 331 0 39 831 12 500 58 147 45 647 12 500
Finland 49 515 45 027 2 704 1 784 51 672 45 742 3 709 2 221
Denmark 26 674 23 442 3 163 69 25 209 21 396 3 784 29
United Kingdom 17 013 0 17 013 0 16 058 0 16 058 0
Estonia 15 010 13 700 1 280 30 15 010 13 700 1 280 30
Austria 11 603 0 11 554 49 12 158 0 12 076 82
Czech Republic 7 304 0 7 304 0 10 862 0 10 827 35
Poland 8 513 4 500 3 916 97 8 756 3 546 5 160 50
Belgium 33 099 27 542 5 557 0 7 439 1 977 5 462 0
Slovenia 5 800 0 5 800 0 5 200 0 5 200 0
Ireland 3 489 0 3 465 24 4 457 0 4 398 59
Slovakia 721 0 721 0 1 888 158 1 730 0
Lithuania 605 0 605 0 890 0 890 0
Hungary 815 432 381 2 0 0 0 0
Luxembourg 100 0 100 0 0 0 0 0
Total EU 28 2 579 046 2 325 825 225 098 28 123 3 271 924 2 990 133 251 471 30 320
Note: Datas from italian, french and portuguese aerothermal heat pump market are not directly comparable to others, because they include high part of reversible heat pumps whose principal function is cooling. Source: EurObserv’ER 2017
Renewable Energy Sources) pro-
ject. For 2016, the contribution was
9.8 Mtoe (9 830 ktoe), compared to
9.1 Mtoe in 2015 (9 108 ktoe)… a 7.8%
increase.
THE LIGHTS HAVE TURNED GREENIn 2016, after several years of rela-
tive stagnation, the HP market
pursued the recovery started in
2015 that was driven by the air-
to-air HP segment. The lights have
turned to green for the next few
years. The sector should take off
from a combination of favourable
factors such as the improved
price ratio between electricity
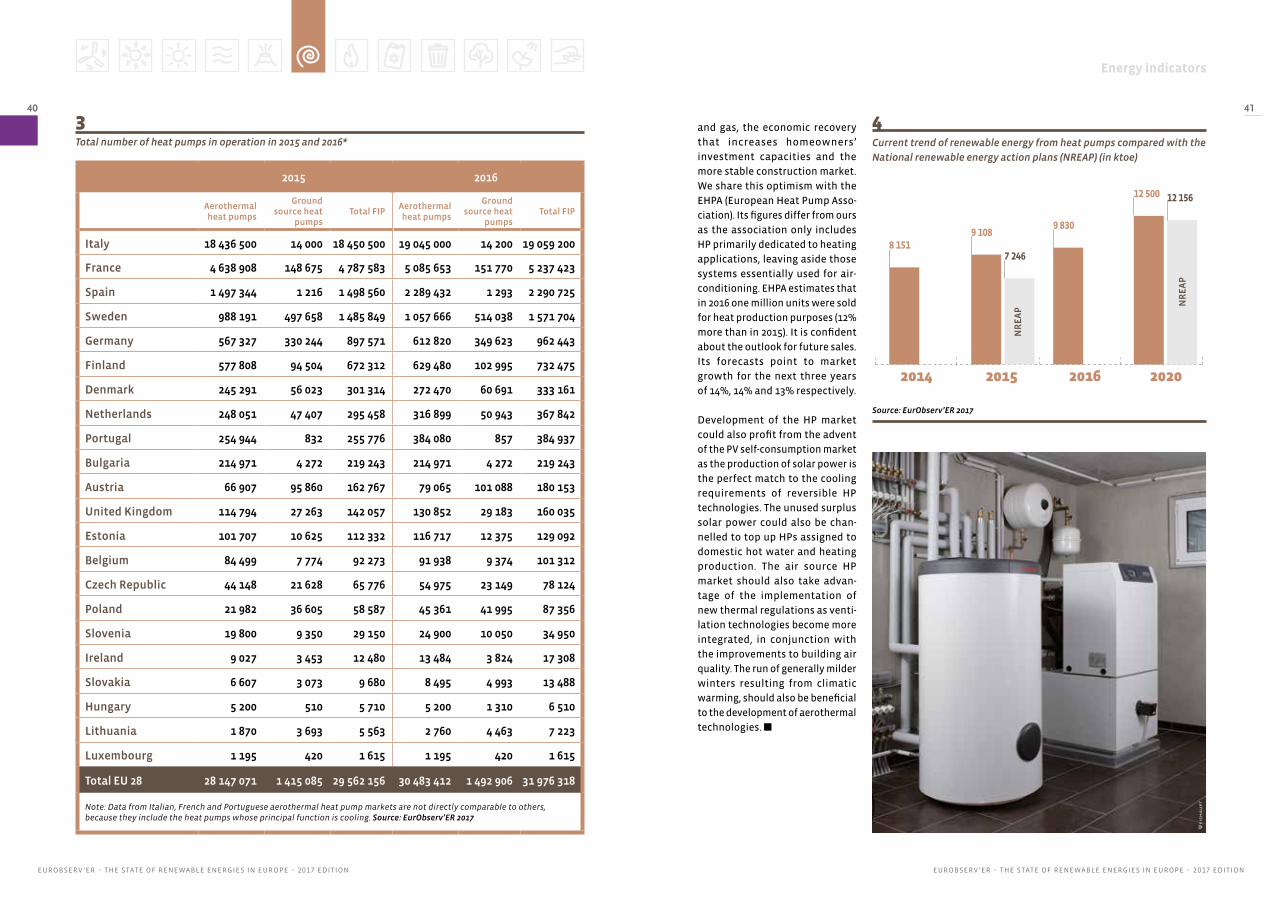
Energy indicators
EUROBSERV ’ER – THE STATE OF RENEWABLE ENERGIES IN EUROPE – 2017 EDITIONEUROBSERV ’ER – THE STATE OF RENEWABLE ENERGIES IN EUROPE – 2017 EDITION
40 41
3Total number of heat pumps in operation in 2015 and 2016*
4Current trend of renewable energy from heat pumps compared with the
National renewable energy action plans (NREAP) (in ktoe)
and gas, the economic recovery
that increases homeowners’
investment capacities and the
more stable construction market.
We share this optimism with the
EHPA (European Heat Pump Asso-
ciation). Its figures differ from ours
as the association only includes
HP primarily dedicated to heating
applications, leaving aside those
systems essentially used for air-
conditioning. EHPA estimates that
in 2016 one million units were sold
for heat production purposes (12%
more than in 2015). It is confident
about the outlook for future sales.
Its forecasts point to market
growth for the next three years
of 14%, 14% and 13% respectively.
Development of the HP market
could also profit from the advent
of the PV self-consumption market
as the production of solar power is
the perfect match to the cooling
requirements of reversible HP
technologies. The unused surplus
solar power could also be chan-
nelled to top up HPs assigned to
domestic hot water and heating
production. The air source HP
market should also take advan-
tage of the implementation of
new thermal regulations as venti-
lation technologies become more
integrated, in conjunction with
the improvements to building air
quality. The run of generally milder
winters resulting from climatic
warming, should also be beneficial
to the development of aerothermal
technologies. n
2015 2016
Aerothermal heat pumps
Ground source heat
pumpsTotal FIP
Aerothermal heat pumps
Ground source heat
pumpsTotal FIP
Italy 18 436 500 14 000 18 450 500 19 045 000 14 200 19 059 200
France 4 638 908 148 675 4 787 583 5 085 653 151 770 5 237 423
Spain 1 497 344 1 216 1 498 560 2 289 432 1 293 2 290 725
Sweden 988 191 497 658 1 485 849 1 057 666 514 038 1 571 704
Germany 567 327 330 244 897 571 612 820 349 623 962 443
Finland 577 808 94 504 672 312 629 480 102 995 732 475
Denmark 245 291 56 023 301 314 272 470 60 691 333 161
Netherlands 248 051 47 407 295 458 316 899 50 943 367 842
Portugal 254 944 832 255 776 384 080 857 384 937
Bulgaria 214 971 4 272 219 243 214 971 4 272 219 243
Austria 66 907 95 860 162 767 79 065 101 088 180 153
United Kingdom 114 794 27 263 142 057 130 852 29 183 160 035
Estonia 101 707 10 625 112 332 116 717 12 375 129 092
Belgium 84 499 7 774 92 273 91 938 9 374 101 312
Czech Republic 44 148 21 628 65 776 54 975 23 149 78 124
Poland 21 982 36 605 58 587 45 361 41 995 87 356
Slovenia 19 800 9 350 29 150 24 900 10 050 34 950
Ireland 9 027 3 453 12 480 13 484 3 824 17 308
Slovakia 6 607 3 073 9 680 8 495 4 993 13 488
Hungary 5 200 510 5 710 5 200 1 310 6 510
Lithuania 1 870 3 693 5 563 2 760 4 463 7 223
Luxembourg 1 195 420 1 615 1 195 420 1 615
Total EU 28 28 147 071 1 415 085 29 562 156 30 483 412 1 492 906 31 976 318
Note: Data from Italian, French and Portuguese aerothermal heat pump markets are not directly comparable to others, because they include the heat pumps whose principal function is cooling. Source: EurObserv’ER 2017
9 830
12 500 12 156
2014 2015 2016 2020
NR
EA
P
8 1519 108
7 246
NR
EA
P
Source: EurObserv’ER 2017
Wei
sha
upt

Energy indicators
EUROBSERV ’ER – THE STATE OF RENEWABLE ENERGIES IN EUROPE – 2017 EDITIONEUROBSERV ’ER – THE STATE OF RENEWABLE ENERGIES IN EUROPE – 2017 EDITION
42 43
Methanization is a natural
process that results in the
biological breakdown of orga-
nic matter through the action
of many micro-organisms in an
oxygen-deprived environment. We
divide methanization biogas from
anaerobic fermentation into three
segmented sub-sectors in line with
the waste feedstock’s origin and
treatment. It includes methani-
zation of wastewater treatment
plant sludge (sludge digestion gas),
biogas from non-hazardous waste
facility storage (landfill biogas) and
methanization of non-hazardous
waste or raw plant matter (other
biogas). A fourth internationally
classified biogas sub-sector is
monitored, for biogas produced by
a heat treatment process (biogas
from thermal processes) by pyro-
lysis or gasification of solid bio-
mass (wood, forestry logging slash,
solid and fermentable household
waste). These thermal processes
produce hydrogen (H2) and car-
bon monoxide (CO), which when
recombined produce a synthetic
biogas that can substitute natu-
ral gas (CH4). Finland and Italy use
these thermal processes and new
projects are being developed in
BIOGAS
the Netherlands. EurObserv’ER has
included this low level of output
in the “other biogas” category for
the time being in the interests of
convenience.
THE EUROPEAN UNION PRODUCES 16.6 MTOE In 2016, European Union primary
energy production from biogas
pursued its upward trend, (adding
4.4% to 16.6 Mtoe) however, it
has been losing pace since 2011
(adding 22.4%, 17%, 14.3%, 7.3%
and 6.0% respectively). The main
reasons for this decline are the
implementation of regulations
that discourage the use of energy
crops, which had boosted output
in those countries that originally
embarked on developing the farm
biogas sector (primarily Germany,
Italy and the UK) and are compoun-
ded by less attractive biogas elec-
tricity payment terms.
All the EU Member States have a
biogas energy recovery sector, but
only three of them generate three-
quarters (75.8%) of all European out-
put, namely Germany (8.1 Mtoe), the
UK (2.6 Mtoe) and Italy (1.9 Mtoe).
Cla
as
For many years, European Union
biogas primary energy produc-
tion has been dominated by the
“other biogas” category. In 2016,
it accounted for 74.8% (inclu-
ding 0.3% of thermal biogas, i.e.
56 ktoe) (73.8% in 2015, including
0.3% of thermal biogas) and for
several years has accounted for
most of the increase in total pro-
duction. The landfill biogas share
has tended to dwindle (from 17.3%
to 16%). While wastewater sludge
biogas increased slightly (from 7.0
to 7.6%) in 2016.
Output as electricity, regardless
of whether it is generated in
CHP plants, is still the main form
of energy recovery. In 2016, it
amounted to 62.6 TWh, which
is a 2.7% year-on-year increase.
Germany alone produces more
than half the EU’s biogas electri-
city (33.7 TWh), followed by Italy
(8.3 TWh) and the UK (7.7 TWh).
Derived heat (from the proces-
sing sector) increased by 7.9% to
694.8 ktoe in 2016. Final energy
consumption (outside the proces-
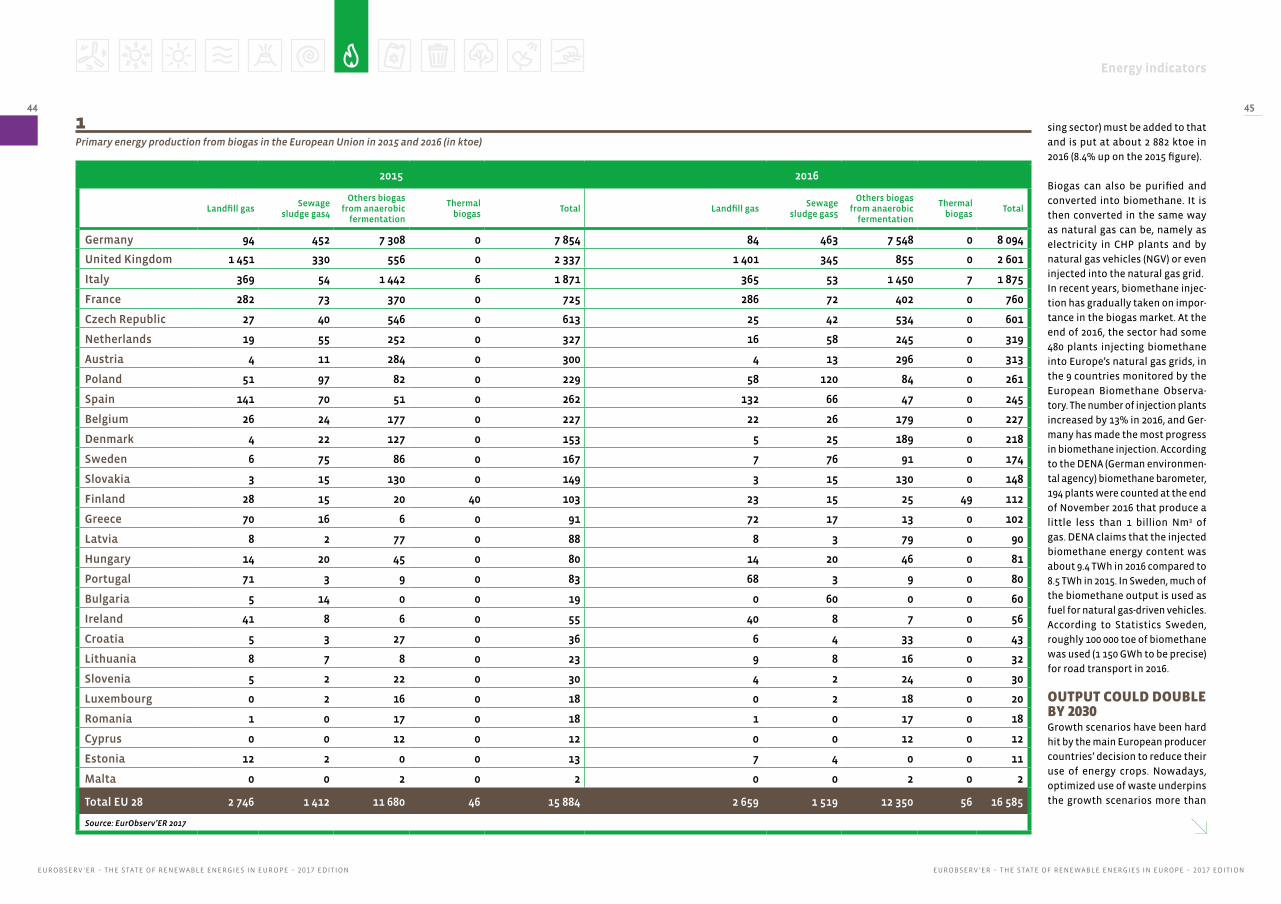
Energy indicators
EUROBSERV ’ER – THE STATE OF RENEWABLE ENERGIES IN EUROPE – 2017 EDITIONEUROBSERV ’ER – THE STATE OF RENEWABLE ENERGIES IN EUROPE – 2017 EDITION
44 45
1Primary energy production from biogas in the European Union in 2015 and 2016 (in ktoe)
2015 2016
Landfill gasSewage
sludge gas4
Others biogas from anaerobic
fermentation
Thermal biogas
Total Landfill gasSewage
sludge gas5
Others biogas from anaerobic
fermentation
Thermal biogas
Total
Germany 94 452 7 308 0 7 854 84 463 7 548 0 8 094
United Kingdom 1 451 330 556 0 2 337 1 401 345 855 0 2 601
Italy 369 54 1 442 6 1 871 365 53 1 450 7 1 875
France 282 73 370 0 725 286 72 402 0 760
Czech Republic 27 40 546 0 613 25 42 534 0 601
Netherlands 19 55 252 0 327 16 58 245 0 319
Austria 4 11 284 0 300 4 13 296 0 313
Poland 51 97 82 0 229 58 120 84 0 261
Spain 141 70 51 0 262 132 66 47 0 245
Belgium 26 24 177 0 227 22 26 179 0 227
Denmark 4 22 127 0 153 5 25 189 0 218
Sweden 6 75 86 0 167 7 76 91 0 174
Slovakia 3 15 130 0 149 3 15 130 0 148
Finland 28 15 20 40 103 23 15 25 49 112
Greece 70 16 6 0 91 72 17 13 0 102
Latvia 8 2 77 0 88 8 3 79 0 90
Hungary 14 20 45 0 80 14 20 46 0 81
Portugal 71 3 9 0 83 68 3 9 0 80
Bulgaria 5 14 0 0 19 0 60 0 0 60
Ireland 41 8 6 0 55 40 8 7 0 56
Croatia 5 3 27 0 36 6 4 33 0 43
Lithuania 8 7 8 0 23 9 8 16 0 32
Slovenia 5 2 22 0 30 4 2 24 0 30
Luxembourg 0 2 16 0 18 0 2 18 0 20
Romania 1 0 17 0 18 1 0 17 0 18
Cyprus 0 0 12 0 12 0 0 12 0 12
Estonia 12 2 0 0 13 7 4 0 0 11
Malta 0 0 2 0 2 0 0 2 0 2
Total EU 28 2 746 1 412 11 680 46 15 884 2 659 1 519 12 350 56 16 585
Source: EurObserv’ER 2017
sing sector) must be added to that
and is put at about 2 882 ktoe in
2016 (8.4% up on the 2015 figure).
Biogas can also be purified and
converted into biomethane. It is
then converted in the same way
as natural gas can be, namely as
electricity in CHP plants and by
natural gas vehicles (NGV) or even
injected into the natural gas grid.
In recent years, biomethane injec-
tion has gradually taken on impor-
tance in the biogas market. At the
end of 2016, the sector had some
480 plants injecting biomethane
into Europe’s natural gas grids, in
the 9 countries monitored by the
European Biomethane Observa-
tory. The number of injection plants
increased by 13% in 2016, and Ger-
many has made the most progress
in biomethane injection. According
to the DENA (German environmen-
tal agency) biomethane barometer,
194 plants were counted at the end
of November 2016 that produce a
little less than 1 billion Nm3 of
gas. DENA claims that the injected
biomethane energy content was
about 9.4 TWh in 2016 compared to
8.5 TWh in 2015. In Sweden, much of
the biomethane output is used as
fuel for natural gas-driven vehicles.
According to Statistics Sweden,
roughly 100 000 toe of biomethane
was used (1 150 GWh to be precise)
for road transport in 2016.
OUTPUT COULD DOUBLE BY 2030Growth scenarios have been hard
hit by the main European producer
countries’ decision to reduce their
use of energy crops. Nowadays,
optimized use of waste underpins
the growth scenarios more than

Energy indicators
EUROBSERV ’ER – THE STATE OF RENEWABLE ENERGIES IN EUROPE – 2017 EDITIONEUROBSERV ’ER – THE STATE OF RENEWABLE ENERGIES IN EUROPE – 2017 EDITION
46 47
2Gross electricity production from biogas in the European Union
in 2015 and 2016* (in GWh)
3Gross heat production from biogas in the European Union in 2015 and in 2016 (in ktoe) in the
transformation sector*
2015 2016
Electricity only plants
CHP plants TotalElectricity
only plantsCHP plants Total
Germany 8 845 24 228 33 073 9 223 24 480 33 703
Italy 3 139 5 073 8 212 3 073 5 186 8 259
United Kingdom 6 528 710 7 238 6 988 718 7 706
Czech Republic 51 2 560 2 611 49 2 540 2 589
France 713 1 106 1 819 641 1 260 1 901
Poland 0 906 906 0 1 028 1 028
Netherlands 43 993 1 036 34 959 993
Belgium 87 867 955 93 893 986
Spain 743 239 982 726 180 906
Austria 580 44 624 591 56 647
Slovakia 117 424 541 114 462 576
Denmark 1 475 476 1 514 515
Latvia 0 392 392 0 397 397
Finland 203 154 357 222 175 397
Hungary 72 221 293 90 243 333
Portugal 279 16 295 268 17 285
Greece 34 197 230 33 237 270
Croatia 25 151 176 26 211 237
Ireland 172 30 201 168 44 212
Bulgaria 34 85 119 97 94 191
Slovenia 3 129 132 2 140 142
Lithuania 0 86 86 0 123 123
Luxembourg 0 62 62 0 73 73
Romania 29 32 61 33 32 65
Cyprus 0 51 51 0 52 52
Estonia 0 50 50 0 45 45
Sweden 0 11 11 0 11 11
Malta 0 7 7 0 8 8
Total EU 28 21 697 39 299 60 996 22 473 40 175 62 649
Source: EurObserv’ER 2017, amended with SHARES data
2015 2016
heat only plants
CHP plants Totalheat only
plantsCHP plants Total
Germany 71.8 150.0 221.8 72.5 150.0 222.5
Italy 0.3 205.2 205.5 0.2 207.8 208.0
Denmark 11.2 46.3 57.6 14.1 68.0 82.1
France 2.7 31.7 34.3 2.9 37.7 40.6
Latvia 0.0 21.3 21.3 0.0 22.7 22.7
Finland 6.8 11.4 18.2 7.0 12.9 19.8
Czech Republic 0.0 14.9 14.9 0.0 14.3 14.3
Poland 0.3 10.1 10.4 0.3 13.7 14.1
Slovakia 0.0 11.3 11.3 0.0 11.2 11.2
Belgium 0.0 9.3 9.3 0.0 10.2 10.2
Croatia 0.0 5.2 5.2 0.0 6.8 6.8
Slovenia 0.0 7.3 7.3 0.0 6.6 6.6
Sweden 3.0 3.6 6.5 3.1 3.5 6.5
Netherlands 0.0 1.1 1.1 0.0 6.5 6.5
Austria 1.6 1.9 3.5 1.6 3.7 5.4
Romania 0.0 3.7 3.7 0.0 3.9 3.9
Hungary 1.3 1.8 3.1 1.6 2.3 3.9
Bulgaria 0.0 0.6 0.6 0.0 3.2 3.2
Lithuania 0.0 2.2 2.2 0.0 2.2 2.2
Luxembourg 0.0 1.9 1.9 0.0 2.1 2.1
Cyprus 0.0 1.2 1.2 0.0 1.2 1.2
Estonia 0.0 2.7 2.7 0.0 0.6 0.6
Malta 0.0 0.1 0.1 0.0 0.2 0.2
Greece 0.0 0.0 0.0 0.0 0.0 0.0
Ireland 0.0 0.0 0.0 0.0 0.0 0.0
Portugal 0.0 0.0 0.0 0.0 0.0 0.0
Spain 0.0 0.0 0.0 0.0 0.0 0.0
United Kingdom 0.0 0.0 0.0 0.0 0.0 0.0
Total EU 28 98.9 544.9 643.8 103.4 591.4 694.8
* Corresponds to “Derived heat” (see Eurostat definition) . Source: EurObserv’ER 2017,amended with SHARES data
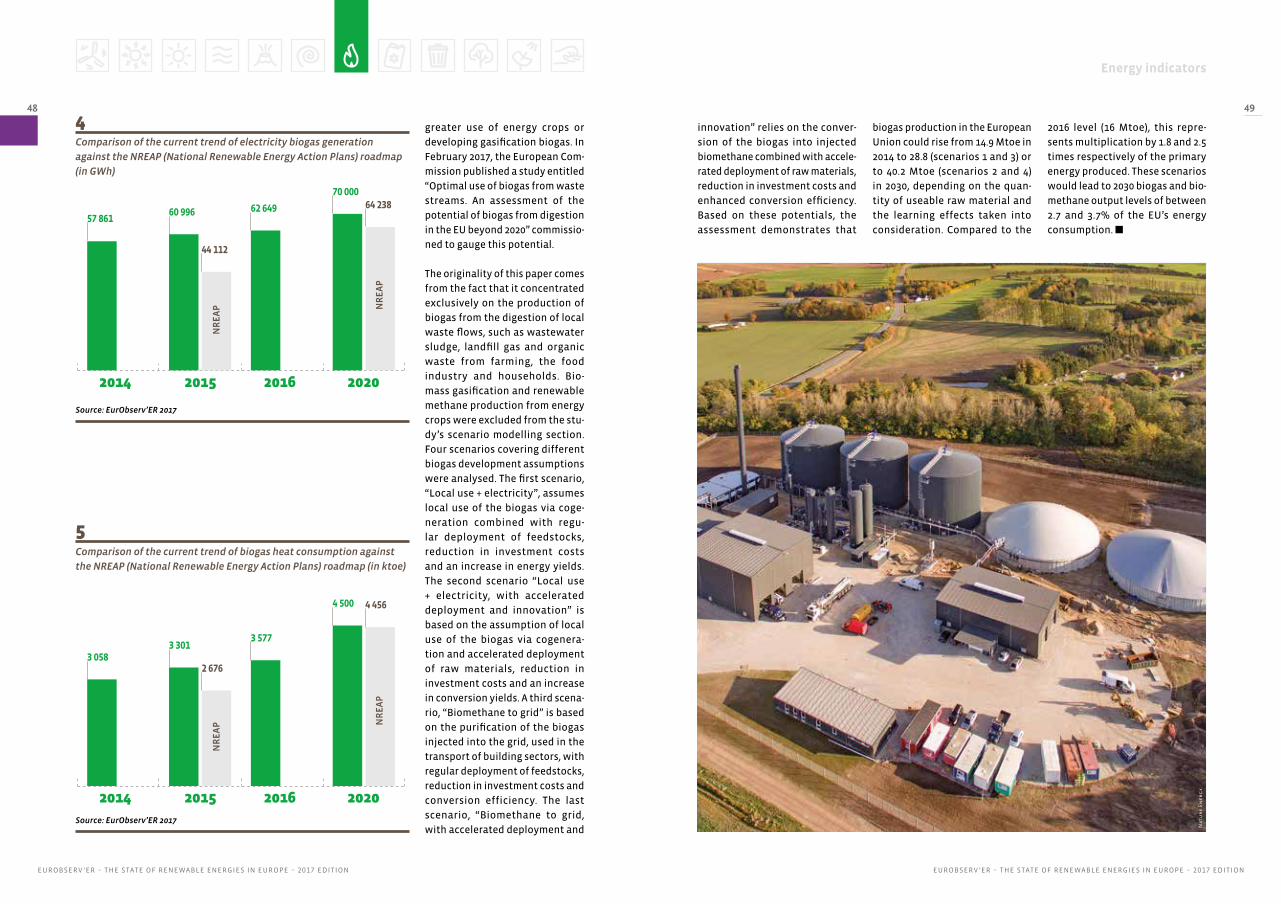
Energy indicators
EUROBSERV ’ER – THE STATE OF RENEWABLE ENERGIES IN EUROPE – 2017 EDITIONEUROBSERV ’ER – THE STATE OF RENEWABLE ENERGIES IN EUROPE – 2017 EDITION
48 49
5Comparison of the current trend of biogas heat consumption against
the NREAP (National Renewable Energy Action Plans) roadmap (in ktoe)
4Comparison of the current trend of electricity biogas generation
against the NREAP (National Renewable Energy Action Plans) roadmap
(in GWh)
greater use of energy crops or
developing gasification biogas. In
February 2017, the European Com-
mission published a study entitled
“Optimal use of biogas from waste
streams. An assessment of the
potential of biogas from digestion
in the EU beyond 2020” commissio-
ned to gauge this potential.
The originality of this paper comes
from the fact that it concentrated
exclusively on the production of
biogas from the digestion of local
waste flows, such as wastewater
sludge, landfill gas and organic
waste from farming, the food
industry and households. Bio-
mass gasification and renewable
methane production from energy
crops were excluded from the stu-
dy’s scenario modelling section.
Four scenarios covering different
biogas development assumptions
were analysed. The first scenario,
“Local use + electricity”, assumes
local use of the biogas via coge-
neration combined with regu-
lar deployment of feedstocks,
reduction in investment costs
and an increase in energy yields.
The second scenario “Local use
+ electricity, with accelerated
deployment and innovation” is
based on the assumption of local
use of the biogas via cogenera-
tion and accelerated deployment
of raw materials, reduction in
investment costs and an increase
in conversion yields. A third scena-
rio, “Biomethane to grid” is based
on the purification of the biogas
injected into the grid, used in the
transport of building sectors, with
regular deployment of feedstocks,
reduction in investment costs and
conversion efficiency. The last
scenario, “Biomethane to grid,
with accelerated deployment and
62 649
70 00064 238
2014 2015 2016 2020N
RE
AP
57 86160 996
44 112
NR
EA
P
3 577
4 500 4 456
2014 2015 2016 2020
NR
EA
P
3 0583 301
2 676
NR
EA
P
Source: EurObserv’ER 2017
Source: EurObserv’ER 2017
Nat
ur
e E
ner
gy
innovation” relies on the conver-
sion of the biogas into injected
biomethane combined with accele-
rated deployment of raw materials,
reduction in investment costs and
enhanced conversion efficiency.
Based on these potentials, the
assessment demonstrates that
biogas production in the European
Union could rise from 14.9 Mtoe in
2014 to 28.8 (scenarios 1 and 3) or
to 40.2 Mtoe (scenarios 2 and 4)
in 2030, depending on the quan-
tity of useable raw material and
the learning effects taken into
consideration. Compared to the
2016 level (16 Mtoe), this repre-
sents multiplication by 1.8 and 2.5
times respectively of the primary
energy produced. These scenarios
would lead to 2030 biogas and bio-
methane output levels of between
2.7 and 3.7% of the EU’s energy
consumption. n

Energy indicators
EUROBSERV ’ER – THE STATE OF RENEWABLE ENERGIES IN EUROPE – 2017 EDITIONEUROBSERV ’ER – THE STATE OF RENEWABLE ENERGIES IN EUROPE – 2017 EDITION
50 51
Development of the European
Union biofuel market for
transport up to 2020 is now regu-
lated by the 2015/1513 directive
of 9 September 2015, known as
the ILUC directive. As a result,
the energy share sourced from
agrofuels (produced from cereals
and other food crops rich in
starch, sugar and vegetable oil)
has been capped at 7% of final
energy consumption in transport
until 2020. The European Union
has decided to maintain its main
goal of achieving a 10% renewable
energy share in transport fuel by
2020. The remaining 3% can be
obtained through electric mobi-
lity or using biofuel produced
from specific raw materials eli-
gible for double counting. These
include biofuel produced from
used oil that has been thermo-
chemically treated with hydrogen,
in addition to synthetic biomass-
derived biodiesel and “biopetrol”
(wood, straw, household refuse,
etc.). The Directive stipulates that
each Member State must work
towards achieving a national tar-
get of a minimum percentage of
advanced biofuel produced from
the raw materials listed in Annex
IX, part A. The reference value for
this target is 0.5 of a percentage
point in terms of energy content
of the share of energy produced.
Member States can set a lower
target than this value, if com-
parable financial resources are
allocated to transport to develop
energy efficiency or the use of
renewable electricity, if the tech-
nical characteristics of the vehicle
fleet (composition and state) are
inappropriate for using advanced
biofuel or if objective factors limit
the availability of this type of fuel
at competitive prices.
EUROPEAN UNION BIOFUEL CONSUMPTION STANDS AT 14.2 MTOE The European Union’s biofuel
consumption has flattened out
after increasing steadily from
the early 2000s until 2012. Official
consolidated data indicate that
biofuel consumption intended for
transport, certified as sustainable
and otherwise, remained stable in
2016, at 14.2 Mtoe. The growth in
biofuel consumption certified as
sustainable – the only type that
can be included in the directive’s
renewable energy and transport
BIOFUELS
targets – is different. It increased
by almost one million tonnes of
oil equivalent between 2015 and
2016, from 13.1 to 14.1 Mtoe, which
equates to a 7.5% increase. Thus,
sustainably certified consumption
now accounts for 99% of biofuel
consumption in EU transport com-
pared to 92% in 2015. The reason
for this increase is the effective
roll-out of the administrative
system in Spain at the end of
2016, to account for sustainably-
certified biofuel consumption.
The country can now factor its
biofuel consumption into its 2020
renewable energy targets.
The breakdown between the
various major families of biofuel
is only available for all biofuel
consumption – certified and othe-
rwise. However, the slight diffe-
rence between the two indicators
shows that their momenta are
totally identical. Bearing in mind
that their energy content has har-
dly changed, the respective shares
of bioethanol, biodiesel and biogas
biofuel energy content in 2016
were: 19.1% for bioethanol (19.2%
No
voz
ymes

Energy indicators
EUROBSERV ’ER – THE STATE OF RENEWABLE ENERGIES IN EUROPE – 2017 EDITIONEUROBSERV ’ER – THE STATE OF RENEWABLE ENERGIES IN EUROPE – 2017 EDITION
52 53
2Biofuels consumption for transport in the European Union in 2016 (in toe)
1Biofuels consumption for transport in the European Union in 2015 (in toe)
Bioethanol BiodieselBiogas
fuelVegetable
oil*Total
consumption% compliant**
Germany 744 1 792 30 1 2 567 100%
France 434 2 562 0 0 2 996 100%
United Kingdom 408 534 2 0 944 100%
Spain 189 775 0 0 964 0%
Italy 25 1 142 0 0 1 167 100%
Poland 153 500 0 0 653 100%
Sweden 164 913 100 0 1 177 100%
Netherlands 142 156 0 0 297 99%
Austria 60 585 1 0 646 97%
Portugal 22 302 0 3 328 100%
Hungary 43 133 0 0 175 100%
Czech Republic 63 233 0 0 297 100%
Belgium 38 217 0 0 255 100%
Finland 66 432 2 0 500 99%
Greece 0 161 0 0 161 20%
Slovakia 23 121 0 0 144 100%
Lithuania 10 58 0 0 68 100%
Romania 61 141 0 0 202 100%
Ireland 30 98 0 0 128 100%
Luxembourg 7 74 0 0 81 100%
Bulgaria 32 114 0 0 146 99%
Slovenia 7 23 0 0 29 100%
Cyprus 0 10 0 0 10 97%
Denmark 0 232 0 0 232 100%
Estonia 3 0 0 0 3 0%
Latvia 8 17 0 0 25 100%
Malta 0 5 0 0 5 100%
Croatia 0 24 0 0 24 100%
Total EU 28 2 732 11 353 134 4 14 224 92%
* Pure used vegetable oil and unspecified biofuel. ** Compliant with Articles 17 and 18 of Directive 2009/28/EC. Source: Eurobserv’ER 2017, SHARES 2017 for% compliant
Bioethanol BiodieselBiogas
fuelVegetable
oil*Total
consumption% compliant**
Germany 745 1 792 32 2 2 572 99%
France 474 2 641 0 0 3 115 100%
United Kingdom 415 601 0 0 1 017 100%
Spain 133 1 031 0 0 1 164 100%
Italy 33 1 009 0 0 1 041 100%
Poland 168 290 0 0 457 100%
Sweden 159 1 202 116 0 1 477 100%
Netherlands 121 121 0 0 242 96%
Austria 57 475 1 0 533 97%
Portugal 22 236 0 2 260 100%
Hungary 44 143 0 0 187 100%
Czech Republic 48 253 0 0 300 100%
Belgium 40 391 0 0 431 100%
Finland 68 109 2 0 178 100%
Greece 0 147 0 0 147 43%
Slovakia 16 124 0 0 140 98%
Lithuania 6 50 0 0 57 100%
Romania 81 176 0 0 257 100%
Ireland 32 86 0 0 118 100%
Luxembourg 9 78 0 0 87 100%
Bulgaria 33 130 0 0 163 100%
Slovenia 4 14 0 0 18 100%
Cyprus 0 9 0 0 9 100%
Denmark 0 236 0 0 236 100%
Estonia 3 0 0 0 3 0%
Latvia 8 4 0 0 12 100%
Malta 0 6 0 0 6 100%
Croatia 0 1 0 0 1 100%
Total EU 28 2 718 11 354 151 4 14 227 99%
* Pure used vegetable oil and unspecified biofuel. ** Compliant with Articles 17 and 18 of Directive 2009/28/EC. Source: Eurobserv’ER 2017, SHARES 2017 for% compliant
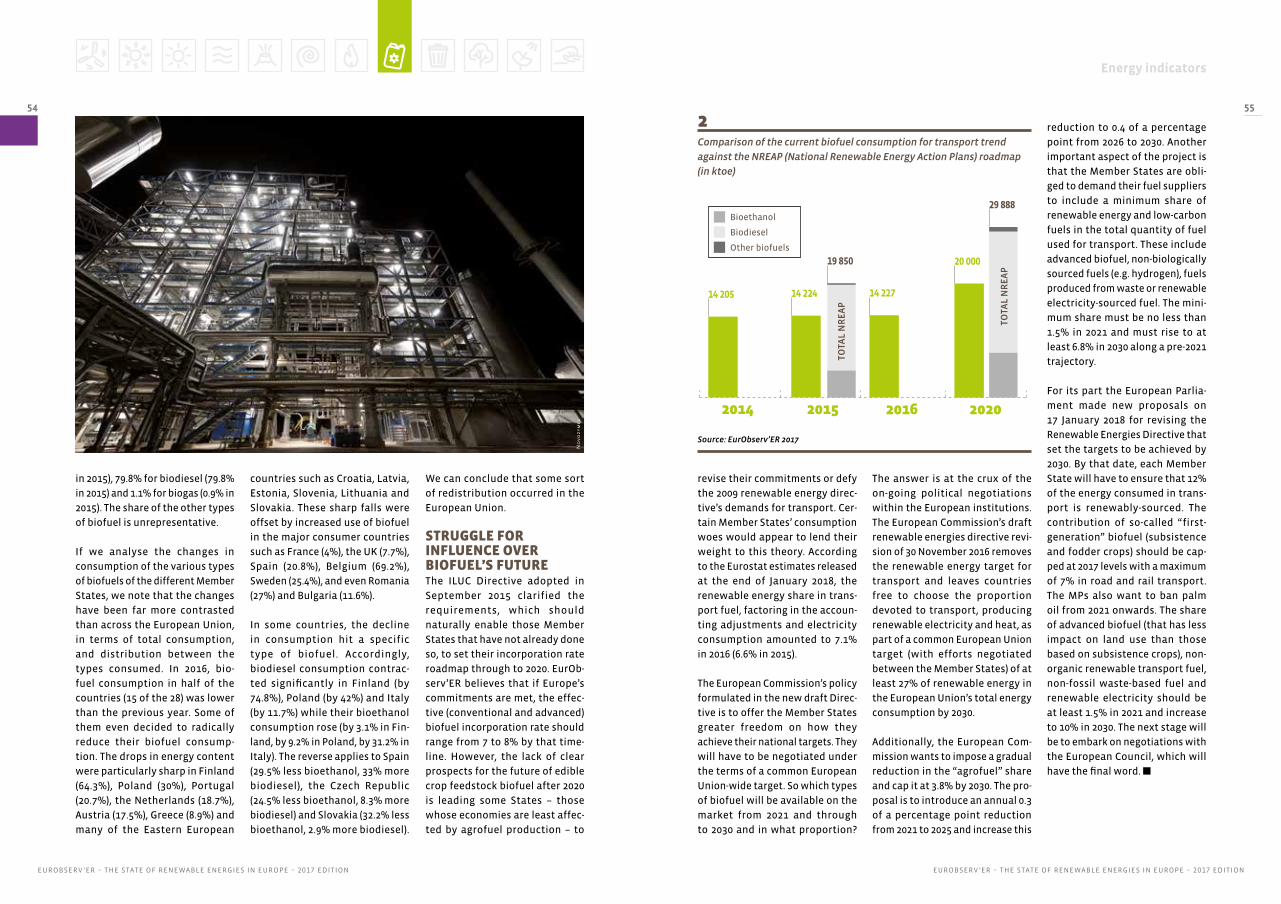
Energy indicators
EUROBSERV ’ER – THE STATE OF RENEWABLE ENERGIES IN EUROPE – 2017 EDITIONEUROBSERV ’ER – THE STATE OF RENEWABLE ENERGIES IN EUROPE – 2017 EDITION
54 55
in 2015), 79.8% for biodiesel (79.8%
in 2015) and 1.1% for biogas (0.9% in
2015). The share of the other types
of biofuel is unrepresentative.
If we analyse the changes in
consumption of the various types
of biofuels of the different Member
States, we note that the changes
have been far more contrasted
than across the European Union,
in terms of total consumption,
and distribution between the
types consumed. In 2016, bio-
fuel consumption in half of the
countries (15 of the 28) was lower
than the previous year. Some of
them even decided to radically
reduce their biofuel consump-
tion. The drops in energy content
were particularly sharp in Finland
(64.3%), Poland (30%), Portugal
(20.7%), the Netherlands (18.7%),
Austria (17.5%), Greece (8.9%) and
many of the Eastern European
We can conclude that some sort
of redistribution occurred in the
European Union.
STRUGGLE FOR INFLUENCE OVER BIOFUEL’S FUTURE The ILUC Directive adopted in
September 2015 clarified the
requirements, which should
naturally enable those Member
States that have not already done
so, to set their incorporation rate
roadmap through to 2020. EurOb-
serv’ER believes that if Europe’s
commitments are met, the effec-
tive (conventional and advanced)
biofuel incorporation rate should
range from 7 to 8% by that time-
line. However, the lack of clear
prospects for the future of edible
crop feedstock biofuel after 2020
is leading some States – those
whose economies are least affec-
ted by agrofuel production – to
revise their commitments or defy
the 2009 renewable energy direc-
tive’s demands for transport. Cer-
tain Member States’ consumption
woes would appear to lend their
weight to this theory. According
to the Eurostat estimates released
at the end of January 2018, the
renewable energy share in trans-
port fuel, factoring in the accoun-
ting adjustments and electricity
consumption amounted to 7.1%
in 2016 (6.6% in 2015).
The European Commission’s policy
formulated in the new draft Direc-
tive is to offer the Member States
greater freedom on how they
achieve their national targets. They
will have to be negotiated under
the terms of a common European
Union-wide target. So which types
of biofuel will be available on the
market from 2021 and through
to 2030 and in what proportion?
The answer is at the crux of the
on-going political negotiations
within the European institutions.
The European Commission’s draft
renewable energies directive revi-
sion of 30 November 2016 removes
the renewable energy target for
transport and leaves countries
free to choose the proportion
devoted to transport, producing
renewable electricity and heat, as
part of a common European Union
target (with efforts negotiated
between the Member States) of at
least 27% of renewable energy in
the European Union’s total energy
consumption by 2030.
Additionally, the European Com-
mission wants to impose a gradual
reduction in the “agrofuel” share
and cap it at 3.8% by 2030. The pro-
posal is to introduce an annual 0.3
of a percentage point reduction
from 2021 to 2025 and increase this
reduction to 0.4 of a percentage
point from 2026 to 2030. Another
important aspect of the project is
that the Member States are obli-
ged to demand their fuel suppliers
to include a minimum share of
renewable energy and low-carbon
fuels in the total quantity of fuel
used for transport. These include
advanced biofuel, non-biologically
sourced fuels (e.g. hydrogen), fuels
produced from waste or renewable
electricity-sourced fuel. The mini-
mum share must be no less than
1.5% in 2021 and must rise to at
least 6.8% in 2030 along a pre-2021
trajectory.
For its part the European Parlia-
ment made new proposals on
17 January 2018 for revising the
Renewable Energies Directive that
set the targets to be achieved by
2030. By that date, each Member
State will have to ensure that 12%
of the energy consumed in trans-
port is renewably-sourced. The
contribution of so-called “first-
generation” biofuel (subsistence
and fodder crops) should be cap-
ped at 2017 levels with a maximum
of 7% in road and rail transport.
The MPs also want to ban palm
oil from 2021 onwards. The share
of advanced biofuel (that has less
impact on land use than those
based on subsistence crops), non-
organic renewable transport fuel,
non-fossil waste-based fuel and
renewable electricity should be
at least 1.5% in 2021 and increase
to 10% in 2030. The next stage will
be to embark on negotiations with
the European Council, which will
have the final word. n
countries such as Croatia, Latvia,
Estonia, Slovenia, Lithuania and
Slovakia. These sharp falls were
offset by increased use of biofuel
in the major consumer countries
such as France (4%), the UK (7.7%),
Spain (20.8%), Belgium (69.2%),
Sweden (25.4%), and even Romania
(27%) and Bulgaria (11.6%).
In some countries, the decline
in consumption hit a specific
type of biofuel. Accordingly,
biodiesel consumption contrac-
ted significantly in Finland (by
74.8%), Poland (by 42%) and Italy
(by 11.7%) while their bioethanol
consumption rose (by 3.1% in Fin-
land, by 9.2% in Poland, by 31.2% in
Italy). The reverse applies to Spain
(29.5% less bioethanol, 33% more
biodiesel), the Czech Republic
(24.5% less bioethanol, 8.3% more
biodiesel) and Slovakia (32.2% less
bioethanol, 2.9% more biodiesel).
20 000
29 888
2016 2020
TOTA
L N
RE
AP
Bioethanol
Biodiesel
Other biofuels
14 227
2014 2015
14 205
19 850
TOTA
L N
RE
AP
14 224
Source: EurObserv’ER 2017
2Comparison of the current biofuel consumption for transport trend
against the NREAP (National Renewable Energy Action Plans) roadmap
(in ktoe)
No
voz
ymes
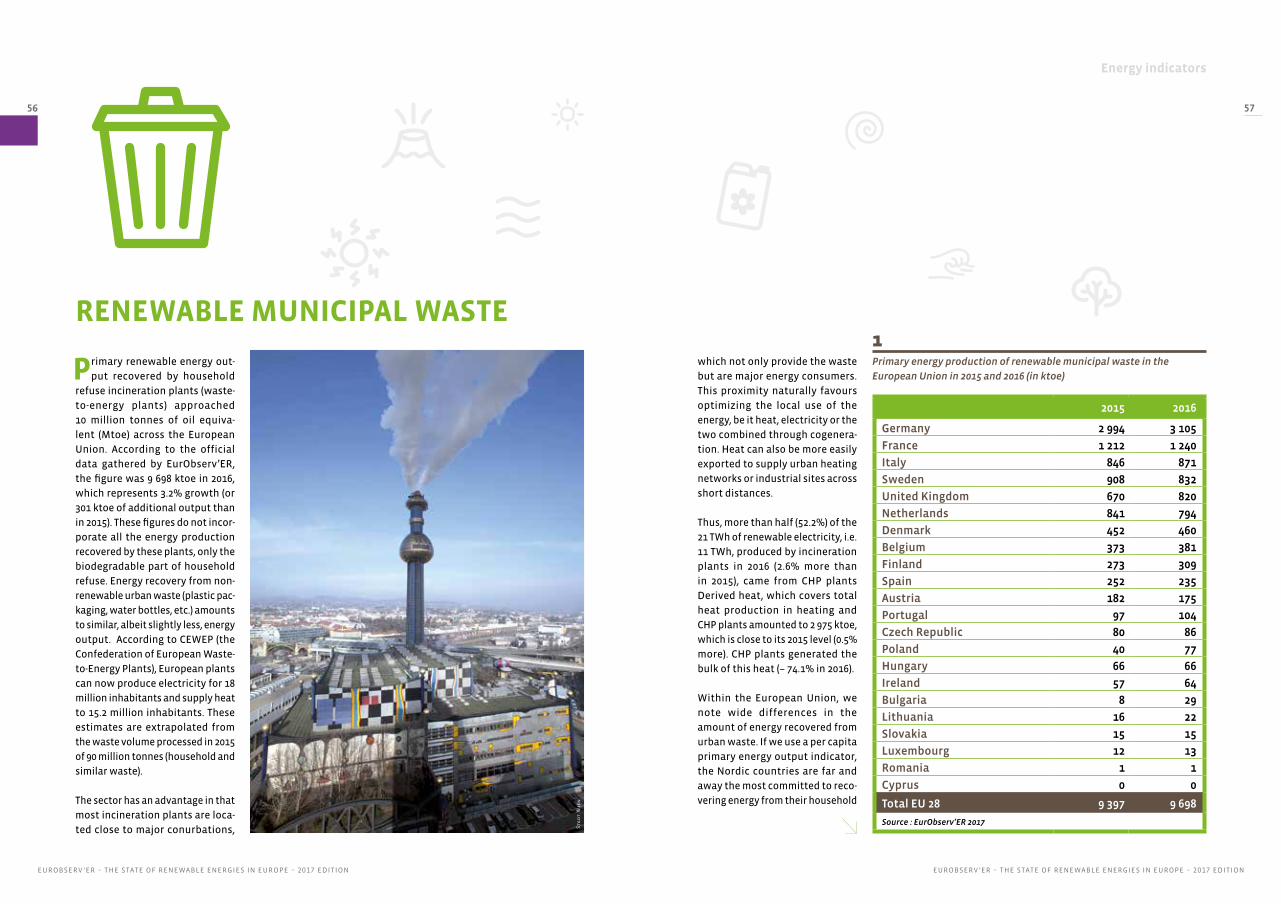
Energy indicators
EUROBSERV ’ER – THE STATE OF RENEWABLE ENERGIES IN EUROPE – 2017 EDITIONEUROBSERV ’ER – THE STATE OF RENEWABLE ENERGIES IN EUROPE – 2017 EDITION
56 57
1Primary energy production of renewable municipal waste in the
European Union in 2015 and 2016 (in ktoe)Primary renewable energy out-
put recovered by household
refuse incineration plants (waste-
to-energy plants) approached
10 million tonnes of oil equiva-
lent (Mtoe) across the European
Union. According to the official
data gathered by EurObserv’ER,
the figure was 9 698 ktoe in 2016,
which represents 3.2% growth (or
301 ktoe of additional output than
in 2015). These figures do not incor-
porate all the energy production
recovered by these plants, only the
biodegradable part of household
refuse. Energy recovery from non-
renewable urban waste (plastic pac-
kaging, water bottles, etc.) amounts
to similar, albeit slightly less, energy
output. According to CEWEP (the
Confederation of European Waste-
to-Energy Plants), European plants
can now produce electricity for 18
million inhabitants and supply heat
to 15.2 million inhabitants. These
estimates are extrapolated from
the waste volume processed in 2015
of 90 million tonnes (household and
similar waste).
The sector has an advantage in that
most incineration plants are loca-
ted close to major conurbations,
RENEWABLE MUNICIPAL WASTE
2015 2016
Germany 2 994 3 105
France 1 212 1 240
Italy 846 871
Sweden 908 832
United Kingdom 670 820
Netherlands 841 794
Denmark 452 460
Belgium 373 381
Finland 273 309
Spain 252 235
Austria 182 175
Portugal 97 104
Czech Republic 80 86
Poland 40 77
Hungary 66 66
Ireland 57 64
Bulgaria 8 29
Lithuania 16 22
Slovakia 15 15
Luxembourg 12 13
Romania 1 1
Cyprus 0 0
Total EU 28 9 397 9 698
Source : EurObserv’ER 2017
which not only provide the waste
but are major energy consumers.
This proximity naturally favours
optimizing the local use of the
energy, be it heat, electricity or the
two combined through cogenera-
tion. Heat can also be more easily
exported to supply urban heating
networks or industrial sites across
short distances.
Thus, more than half (52.2%) of the
21 TWh of renewable electricity, i.e.
11 TWh, produced by incineration
plants in 2016 (2.6% more than
in 2015), came from CHP plants
Derived heat, which covers total
heat production in heating and
CHP plants amounted to 2 975 ktoe,
which is close to its 2015 level (0.5%
more). CHP plants generated the
bulk of this heat (– 74.1% in 2016).
Within the European Union, we
note wide differences in the
amount of energy recovered from
urban waste. If we use a per capita
primary energy output indicator,
the Nordic countries are far and
away the most committed to reco-
vering energy from their household
Sta
dt
Wie
n
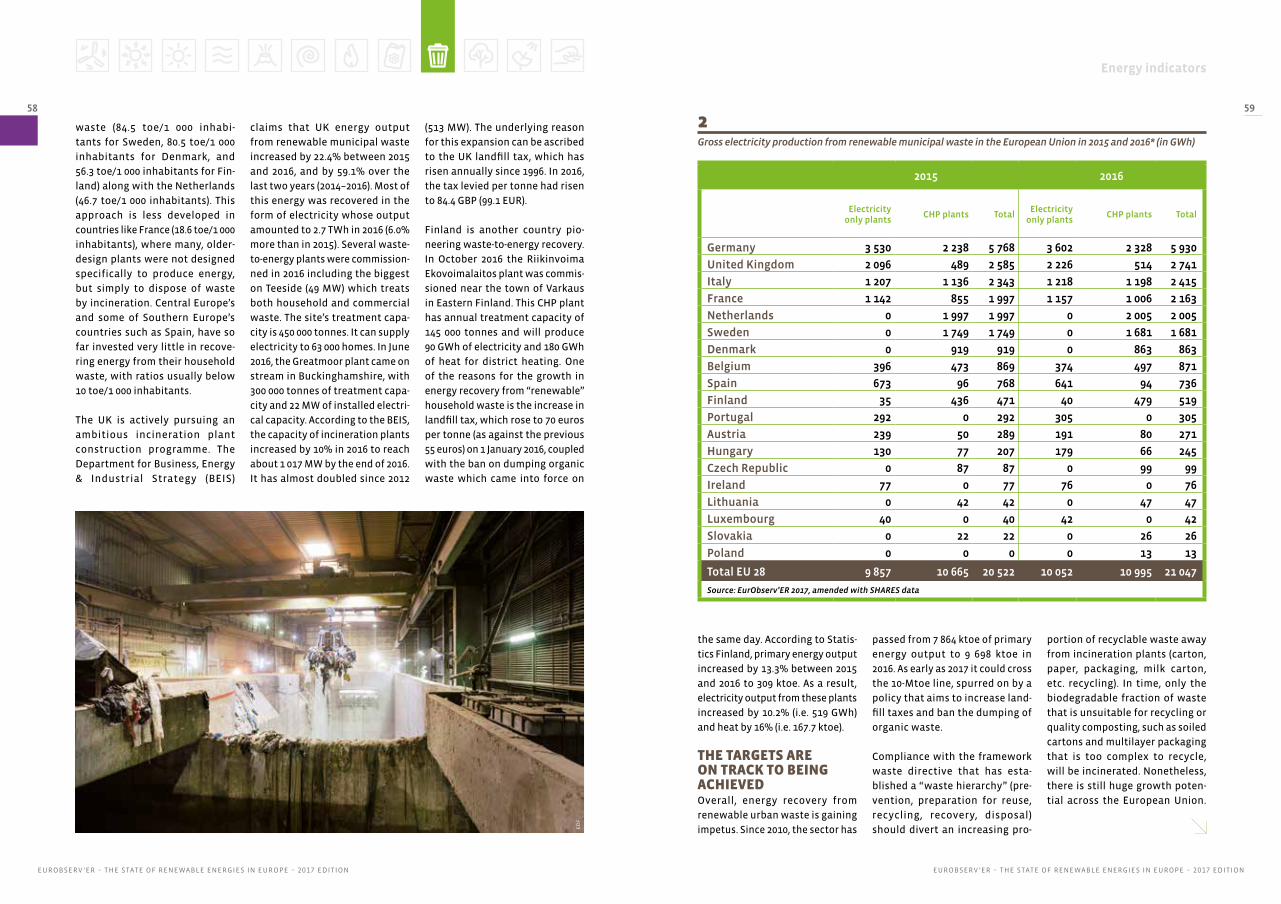
Energy indicators
EUROBSERV ’ER – THE STATE OF RENEWABLE ENERGIES IN EUROPE – 2017 EDITIONEUROBSERV ’ER – THE STATE OF RENEWABLE ENERGIES IN EUROPE – 2017 EDITION
58 59
waste (84.5 toe/1 000 inhabi-
tants for Sweden, 80.5 toe/1 000
inhabitants for Denmark, and
56.3 toe/1 000 inhabitants for Fin-
land) along with the Netherlands
(46.7 toe/1 000 inhabitants). This
approach is less developed in
countries like France (18.6 toe/1 000
inhabitants), where many, older-
design plants were not designed
specifically to produce energy,
but simply to dispose of waste
by incineration. Central Europe’s
and some of Southern Europe’s
countries such as Spain, have so
far invested very little in recove-
ring energy from their household
waste, with ratios usually below
10 toe/1 000 inhabitants.
The UK is actively pursuing an
ambitious incineration plant
construction programme. The
Department for Business, Energy
& Industrial Strategy (BEIS)
claims that UK energy output
from renewable municipal waste
increased by 22.4% between 2015
and 2016, and by 59.1% over the
last two years (2014–2016). Most of
this energy was recovered in the
form of electricity whose output
amounted to 2.7 TWh in 2016 (6.0%
more than in 2015). Several waste-
to-energy plants were commission-
ned in 2016 including the biggest
on Teeside (49 MW) which treats
both household and commercial
waste. The site’s treatment capa-
city is 450 000 tonnes. It can supply
electricity to 63 000 homes. In June
2016, the Greatmoor plant came on
stream in Buckinghamshire, with
300 000 tonnes of treatment capa-
city and 22 MW of installed electri-
cal capacity. According to the BEIS,
the capacity of incineration plants
increased by 10% in 2016 to reach
about 1 017 MW by the end of 2016.
It has almost doubled since 2012
(513 MW). The underlying reason
for this expansion can be ascribed
to the UK landfill tax, which has
risen annually since 1996. In 2016,
the tax levied per tonne had risen
to 84.4 GBP (99.1 EUR).
Finland is another country pio-
neering waste-to-energy recovery.
In October 2016 the Riikinvoima
Ekovoimalaitos plant was commis-
sioned near the town of Varkaus
in Eastern Finland. This CHP plant
has annual treatment capacity of
145 000 tonnes and will produce
90 GWh of electricity and 180 GWh
of heat for district heating. One
of the reasons for the growth in
energy recovery from “renewable”
household waste is the increase in
landfill tax, which rose to 70 euros
per tonne (as against the previous
55 euros) on 1 January 2016, coupled
with the ban on dumping organic
waste which came into force on
the same day. According to Statis-
tics Finland, primary energy output
increased by 13.3% between 2015
and 2016 to 309 ktoe. As a result,
electricity output from these plants
increased by 10.2% (i.e. 519 GWh)
and heat by 16% (i.e. 167.7 ktoe).
THE TARGETS ARE ON TRACK TO BEING ACHIEVEDOverall, energy recovery from
renewable urban waste is gaining
impetus. Since 2010, the sector has
passed from 7 864 ktoe of primary
energy output to 9 698 ktoe in
2016. As early as 2017 it could cross
the 10-Mtoe line, spurred on by a
policy that aims to increase land-
fill taxes and ban the dumping of
organic waste.
Compliance with the framework
waste directive that has esta-
blished a “waste hierarchy” (pre-
vention, preparation for reuse,
recycling, recovery, disposal)
should divert an increasing pro-
portion of recyclable waste away
from incineration plants (carton,
paper, packaging, milk carton,
etc. recycling). In time, only the
biodegradable fraction of waste
that is unsuitable for recycling or
quality composting, such as soiled
cartons and multilayer packaging
that is too complex to recycle,
will be incinerated. Nonetheless,
there is still huge growth poten-
tial across the European Union.
2015 2016
Electricity only plants
CHP plants TotalElectricity
only plantsCHP plants Total
Germany 3 530 2 238 5 768 3 602 2 328 5 930
United Kingdom 2 096 489 2 585 2 226 514 2 741
Italy 1 207 1 136 2 343 1 218 1 198 2 415
France 1 142 855 1 997 1 157 1 006 2 163
Netherlands 0 1 997 1 997 0 2 005 2 005
Sweden 0 1 749 1 749 0 1 681 1 681
Denmark 0 919 919 0 863 863
Belgium 396 473 869 374 497 871
Spain 673 96 768 641 94 736
Finland 35 436 471 40 479 519
Portugal 292 0 292 305 0 305
Austria 239 50 289 191 80 271
Hungary 130 77 207 179 66 245
Czech Republic 0 87 87 0 99 99
Ireland 77 0 77 76 0 76
Lithuania 0 42 42 0 47 47
Luxembourg 40 0 40 42 0 42
Slovakia 0 22 22 0 26 26
Poland 0 0 0 0 13 13
Total EU 28 9 857 10 665 20 522 10 052 10 995 21 047
Source: EurObserv’ER 2017, amended with SHARES data
2Gross electricity production from renewable municipal waste in the European Union in 2015 and 2016* (in GWh)
ED
F

Energy indicators
EUROBSERV ’ER – THE STATE OF RENEWABLE ENERGIES IN EUROPE – 2017 EDITIONEUROBSERV ’ER – THE STATE OF RENEWABLE ENERGIES IN EUROPE – 2017 EDITION
60 61
3Gross heat production from renewable municipal waste in the European Union in 2015 and in 2016 (in ktoe) in
the transformation sector*
2015 2016
Heat only plants
CHP plants TotalHeat only
plantsCHP plants Total
Germany 280.9 442.4 723.3 271.5 461.0 732.4
France 347.3 210.2 557.5 346.5 255.4 602.0
Sweden 57.8 575.1 632.9 56.3 509.8 566.1
Denmark 39.0 318.6 357.6 45.9 321.4 367.3
Netherlands 0.0 279.2 279.2 0.0 265.2 265.2
Finland 19.2 125.3 144.5 22.4 145.3 167.7
Italy 0.0 107.9 107.9 0.0 117.1 117.1
Austria 13.6 43.3 56.9 14.0 43.7 57.7
Czech Republic 0.0 37.3 37.3 0.0 35.9 35.9
Belgium 0.0 29.2 29.2 0.0 26.8 26.8
United Kingdom 12.4 0.0 12.4 12.5 0.0 12.5
Hungary 0.0 11.5 11.5 0.0 12.1 12.1
Lithuania 0.0 9.1 9.1 0.0 10.4 10.4
Slovakia 0.0 0.0 0.0 1.5 0.0 1.5
Poland 0.2 0.0 0.2 0.0 0.4 0.4
Romania 0.1 0.0 0.1 0.0 0.0 0.0
Total EU 28 770.4 2 189.2 2 959.6 770.7 2 204.4 2 975.1
* Corresponds to “Derived heat” (see Eurostat definition). Source: EurObserv’ER 2017, amended with SHARES data
According to CEWEP, twelve Mem-
ber States still bury most of their
municipal waste. This has major
consequences for GHG emissions
such as methane, and, when badly
managed, potential leachate pollu-
tion with associated health issues.
However, the association reckons
that if they are to achieve their
targets these countries will require
financial support and European
Union aid.
Looking to forecasts for 2020,
CEWEP believes that the energy
contribution of waste towards the
renewable energy directive targets
could realistically reach 67 TWh by
2020, with 25 TWh of electricity and
42 TWh (3.6 Mtoe) of heat output.
EurObserv’ER reckons that in 2016,
total heat consumption (heat from
the processing sector and final
heat consumption) had already
reached 3.8 Mtoe (including 3 Mtoe
of heat sold to networks). The
CEWEP 2020 heat target, which is
perfectly realistic, could easily be
exceeded. The forthcoming com-
missioning of new incineration
plants in the UK, combined with
improved energy efficiency at the
existing plants, should also ensure
that the desired 25 TWh is achieved
by 2020. n
ED
F

Energy indicators
EUROBSERV ’ER – THE STATE OF RENEWABLE ENERGIES IN EUROPE – 2017 EDITIONEUROBSERV ’ER – THE STATE OF RENEWABLE ENERGIES IN EUROPE – 2017 EDITION
62 63
Solid biomass is an umbrella
term for all solid organic com-
ponents to be used as fuels. They
include wood, wood chips, timber
industry by-products (off-cuts,
sawdust, etc.) black liquor from
the paper industry, wood pellets,
straw, bagasse, animal waste and
other solid plant residues. Char-
coal, derived from solid biomass,
is subject to specific statistical
treatment and is not included in
our study data. By the same token,
renewable municipal waste which
is similar to solid biomass, and
treated in incineration plants, is
also subject to specific statistical
treatment.
The succession of mild years and
winters in Europe – a quantifiable
consequence of climate warming
– obfuscates efforts to read the
impact of the policies introduced
to promote the use of solid bio-
mass in high-performance hea-
ting appliances, as heating needs
are directly correlated with the
average temperature level. Accor-
ding to the World Meteorological
Organization (WMO) readings,
the last three years – 2014, 2015
and 2016 – have been the hottest
SOLID BIOMASS
European Union Member States’
gross consumption of biomass
primary energy, measured at
98.4 Mtoe in 2016 is now at the 100-
Mtoe threshold, and equates to a
3% (2.9-Mtoe) rise over 2015. Over
the past two years, consumption
has increased by 7.2 Mtoe which
is a strong sign that consumption
has picked up.
The production of solid biomass
primary energy, equating to solid
biomass sourced on European
Union soil, has increased at a
slightly faster pace – 3.4% – to
95 Mtoe (an increase of 3.1 Mtoe
between 2015 and 2016). The dif-
ference, comprising net imports,
mainly consists of wood pellet
imports from the USA, Canada
or the Ukraine. Incidentally after
steadily rising from 2009 to 2014
(from 1.3 Mtoe in 2008 to 3.9 Mtoe
in 2014), the net import balance has
tended to slip over the past two
years, settling at 3.5 Mtoe in 2016.
EurObserv’ER distinguishes
between final energy use origina-
ting from solid biomass, namely
on record in Europe… the hottest
being 2014, followed by 2015 and
2016, the third hottest. The hapless
record for being the hottest year
ever registered on the planet goes
to 2016, which was amplified by a
strong El Niño event, with a record
temperature level more than 1.1°C
higher than normal for the prein-
dustrial period.
Another factor to be considered
is that in a number of Northern
European countries logging is a
major economic activity, and the
European market’s requirements
for timber products (construction,
pulping, furniture, etc.) governs
the availability of solid biomass
for conversion into energy (wood
offcuts, black liquor, conversion
of valorisation logging residue).
Therefore, part of the available
biomass energy is linked to the
forestry industry’s activity level,
although another part is totally
earmarked for supplying biomass
to the energy sector.
Lastly, we need to bear in mind that
new studies, mostly surveys on
household wood energy consump-
tion have improved solid biomass
consumption monitoring. Inciden-
tally, over and above climate condi-
tions, average home consumption
of wood is falling, mainly because
of improved appliance perfor-
mance. Sometimes these surveys
lead to significant statistical
consolidations over several years.
SIGHTS SET ON 100 MTOE OF BIOMASS CONSUMPTION This preamble considers changes
over a longer number of years.
Nonetheless, it can be confirmed
that solid biomass production
and consumption have retur-
ned to cruising speed across the
European Union. Solid biomass
consumption has contracted only
twice since the start of the millen-
nium… in 2011 and in 2014. These
falls were directly linked to the
significant drops in heating needs
compared to the previous years
2010 and 2013. The trend over the
past two years confirms that solid
biomass consumption is picking
up. It is caused by an increase in
the demand for heat.
According to the official data
gathered by EurObserv’ER, the 28 Po
nse
e

Energy indicators
EUROBSERV ’ER – THE STATE OF RENEWABLE ENERGIES IN EUROPE – 2017 EDITIONEUROBSERV ’ER – THE STATE OF RENEWABLE ENERGIES IN EUROPE – 2017 EDITION
64 65
2Gross electricity production from solid biomass* in the European Union
in 2015 and 2016 (in TWh)
2015 2016
Production Consommation Production Consommation
Germany 12.062 12.062 12.181 12.181
France 9.667 9.667 11.097 11.097
Sweden 9.129 9.129 9.418 9.418
Italy 7.340 8.578 7.232 8.441
Finland 7.901 7.927 8.309 8.333
Poland 6.597 6.884 6.415 6.620
United Kingdom 3.835 6.109 3.840 6.370
Spain 5.261 5.261 5.304 5.304
Austria 4.500 4.664 4.698 4.792
Romania 3.521 3.514 3.521 3.514
Czech Republic 2.954 2.874 2.970 2.906
Denmark 1.631 2.584 1.588 2.793
Hungary 2.510 2.479 2.983 2.586
Portugal 2.603 2.340 2.605 2.403
Belgium 1.171 1.942 1.292 2.058
Latvia 2.005 1.262 2.311 1.296
Croatia 1.532 1.258 1.532 1.258
Netherlands 1.357 1.179 1.366 1.209
Lithuania 1.205 1.204 1.200 1.206
Bulgaria 1.160 1.035 1.120 1.056
Estonia 1.209 0.825 1.396 0.898
Slovakia 0.890 0.879 0.890 0.879
Greece 0.952 1.013 0.797 0.855
Slovenia 0.590 0.590 0.608 0.608
Ireland 0.201 0.228 0.226 0.271
Luxembourg 0.057 0.066 0.063 0.069
Cyprus 0.007 0.010 0.007 0.010
Malta 0.000 0.001 0.000 0.001
Total EU 28 91.848 95.563 94.970 98.433
* Excluding charcoal. Source: Eurobserv’ER 2017
2015 2016
Electricity only CHP Total Electricity only CHP Total
United Kingdom 19.418 0.000 19.418 19.597 0.000 19.597
Germany 4.795 6.238 11.033 4.775 6.019 10.794
Finland 1.217 9.372 10.589 1.004 9.599 10.603
Sweden 0.000 8.977 8.977 0.000 9.750 9.750
Poland 1.957 7.070 9.027 2.052 4.861 6.913
Italy 2.089 1.858 3.947 2.226 1.899 4.125
Spain 3.126 0.888 4.014 3.212 0.836 4.048
Austria 1.232 2.264 3.497 0.896 2.789 3.685
Denmark 0.000 2.803 2.803 0.000 3.481 3.481
Belgium 2.298 1.256 3.554 2.156 1.233 3.390
France 0.098 2.051 2.149 0.405 2.664 3.069
Portugal 0.795 1.723 2.518 0.760 1.721 2.481
Czech Republic 0.049 2.042 2.091 0.014 2.053 2.068
Netherlands 1.724 0.173 1.897 1.116 0.791 1.907
Hungary 1.011 0.650 1.661 0.827 0.666 1.493
Slovakia 0.004 1.095 1.099 0.003 1.126 1.129
Estonia 0.069 0.641 0.710 0.127 0.713 0.840
Romania 0.107 0.355 0.462 0.077 0.388 0.466
Latvia 0.000 0.378 0.378 0.000 0.427 0.427
Ireland 0.184 0.013 0.197 0.377 0.016 0.393
Lithuania 0.000 0.318 0.318 0.000 0.262 0.262
Croatia 0.000 0.089 0.089 0.000 0.194 0.194
Bulgaria 0.003 0.148 0.151 0.003 0.160 0.163
Slovenia 0.000 0.131 0.131 0.000 0.137 0.137
Luxembourg 0.000 0.024 0.024 0.000 0.025 0.025
Greece 0.001 0.000 0.001 0.005 0.000 0.005
Cyprus 0.000 0.000 0.000 0.000 0.000 0.000
Malta 0.000 0.000 0.000 0.000 0.000 0.000
Total EU 28 40.177 50.556 90.734 39.632 51.811 91.443
* Excluding charcoal. Source: Eurobserv’ER 2017, amended with SHARES data
1Primary energy production and gross inland consumption of solid biomass in the European Union
in 2015 and 2016 (in Mtoe)

Energy indicators
EUROBSERV ’ER – THE STATE OF RENEWABLE ENERGIES IN EUROPE – 2017 EDITIONEUROBSERV ’ER – THE STATE OF RENEWABLE ENERGIES IN EUROPE – 2017 EDITION
66 67
3Gross heat production from solid biomass* in the European Union in 2015 and in 2016 (in Mtoe) in the
transformation sector**
electricity and heat. Solid bio-
mass heat is broken down by
direct use by the final consumer
in heating appliances (boilers,
wood-burners, inserts, etc.), that
account for most of the consump-
tion, to distinguish it from heat
supplied by the processing sec-
tor and distributed via heating
networks. EurObserv’ER reckons
that the consumption of heat
directly used by final consumers
increased by 2.7% (1.8 Mtoe) in the
twelve-month period to achieve
68.4 Mtoe in 2016. Gross produc-
tion of solid biomass heat sold to
heating networks appears to have
increased by 9.9% (0.9 Mtoe), driven
by the higher demand for heating.
It reached 10.3 Mtoe in 2016 and
61% of the production facilities
were cogeneration plants. If these
two elements are taken together,
total final energy consumption
as biomass heat increased by
3.6% between 2015 and 2016 to
78.8 Mtoe (an additional 2.7 Mtoe).
European Union solid biomass
electricity production is less vulne-
rable to vagaries of climate, and
more dependent on the policies
of certain member countries to
develop biomass electricity, either
by converting former coal-fired
power plants or by developing
biomass cogeneration. Howe-
ver, the new European biomass
electricity policy, unveiled in the
“clean energy” package should
severely curb the conversion of
coal-fired power plants into bio-
mass power plants not operating
as CHPs after 2020. Serious statis-
tical consolidations were made at
the end of the year, showing that
the increase in electricity output
was less than anticipated in 2016.
It only increased by 0.8% between
2015 and 2016, to reach 91.4 TWh
(i.e. an additional 0.7 TWh). This is
a much slower growth pace than
was observed between 2014 and
2015 when growth was assessed
at 6.9% based on 90.7 TWh of out-
put (i.e. an additional 5.9 TWh). The
lacklustre performance in 2016 was
partly down to much less growth
in the UK’s biomass electricity
output, but primarily due to the
drop in Poland’s biomass electri-
city output (which fell 23,4% from
its 2015 level), i.e. a 2.1-TWh drop
in contribution. The reason for
this drop was the fall in the price
of green certificates – the system
set up to encourage the produc-
tion of renewable electricity and
can be explained by the Polish
Government’s decision to restrict
the demand for certificates (and
thus the country’s renewable
electricity requirement). The out-
come was a glut of certificates. This
surplus that can be used in succes-
sive years will no longer be able to
finance the production of biomass
electricity, which is falling through
lack of profitability.
2030… AN INCREASE IN SOLID BIOMASS CONTRIBUTION IS POSSIBLE All things considered, 2016 was
positive for expanding the solid
biomass sectors as it consolida-
ted the previous year’s pick-up in
consumption even though heating
requirements have dwindled in
recent years. Solid biomass heat
consumption is ahead of the tra-
jectory set out for it in the Euro-
pean Union National Renewable
Energy Action Plans (NREAP) (see
graph). The reason for this impor-
tant positive difference is that
the member countries have made
efforts to develop solid biomass
heat, for individual, collective and
industrial use and have also been
assisted in this by initially having
underestimated their consump-
tion. We note that since the NREAP
plans were published in 2010, many
countries have revised their esti-
mates of biomass heat consump-
tion upwards and retroactively,
primarily on the strength of more
detailed surveys of household
wood energy consumption. The
forthcoming European direc-
tive target dates for 2020 gene-
rally encourage the countries to
improve their appraisals of solid
biomass consumption and the
impacts of their energy policies.
These statistical consolidations
are usually revised upwards up
and have had a positive impact on
the renewable energy trajectory of
the countries in question.
Turning to electricity production,
the countries with major forestry
industries are politically committed
to keeping up their major drives to
develop biomass cogeneration
and to making better use of their
forestry potential (by implemen-
ting Climate Plans), which should
also result in steady growth. It is
difficult to make accurate fore-
casts for 2020 because several ope-
rators have or are in the process
of converting their thermal power
plants so that they can be relatively
flexible in their use of feedstocks.
Biomass electricity production
may well accelerate over the last
two to three years of the decade,
as AEBIOM projections suggest. The
forecast of 130 TWh made by EurOb-
serv’ER (which includes household
waste-to-energy recovery) is more
2015 2016
Heat only plants
CHP plants
TotalHeat only
plantsCHP
plantsTotal
Sweden 0.704 1.614 2.318 0.711 1.765 2.477
Finland 0.599 1.012 1.612 0.668 1.092 1.760
Denmark 0.451 0.602 1.053 0.473 0.664 1.137
France 0.325 0.398 0.722 0.423 0.497 0.920
Austria 0.496 0.347 0.843 0.535 0.335 0.870
Germany 0.184 0.399 0.583 0.217 0.399 0.616
Italy 0.070 0.461 0.531 0.078 0.464 0.542
Lithuania 0.346 0.100 0.445 0.392 0.095 0.487
Poland 0.029 0.268 0.297 0.030 0.289 0.319
Estonia 0.075 0.140 0.215 0.157 0.150 0.308
Latvia 0.095 0.106 0.201 0.114 0.137 0.251
Czech Republic 0.030 0.123 0.153 0.023 0.138 0.161
Slovakia 0.043 0.076 0.119 0.045 0.080 0.125
Hungary 0.050 0.055 0.106 0.064 0.060 0.124
Romania 0.034 0.035 0.069 0.037 0.035 0.072
Netherlands 0.018 0.014 0.032 0.027 0.022 0.049
Slovenia 0.008 0.018 0.027 0.009 0.019 0.028
Croatia 0.000 0.015 0.015 0.000 0.022 0.022
Bulgaria 0.007 0.004 0.011 0.010 0.005 0.015
Luxembourg 0.004 0.009 0.013 0.004 0.009 0.013
Belgium 0.000 0.006 0.006 0.000 0.006 0.006
United Kingdom 0.004 0.000 0.004 0.003 0.000 0.003
Total EU 28 3.572 5.802 9.375 4.022 6.284 10.305
* Excluding charcoal. ** Corresponds to “Derived heat” (see Eurostat definition). Source: EurObserv’ER 2017, amended with SHARES data

Energy indicators
EUROBSERV ’ER – THE STATE OF RENEWABLE ENERGIES IN EUROPE – 2017 EDITIONEUROBSERV ’ER – THE STATE OF RENEWABLE ENERGIES IN EUROPE – 2017 EDITION
68 69
6Comparison of the current trend of heat consumption from solid
biomass against the NREAP (National Renewable Energy Action Plans)
roadmap (in Mtoe)
5Comparison of the current trend of electricity production from solid
biomass against the NREAP (National Renewable Energy Action Plans)
roadmap (in TWh)
4Heat consumption from solid biomass* in the countries of the European Union in 2015 and 2016
2015 2016
Totalof which
final energy consumption
of which derived
heat**Total
of which final energy
consumption
of which derived
heat**
France 8.936 8.214 0.722 9.822 8.902 0.920
Germany 9.254 8.671 0.583 9.565 8.949 0.616
Sweden 7.689 5.371 2.318 7.852 5.376 2.477
Italy 7.331 6.800 0.531 7.123 6.582 0.542
Finland 6.432 4.820 1.612 6.897 5.137 1.760
Poland 4.896 4.599 0.297 5.170 4.851 0.319
Austria 3.826 2.983 0.843 4.085 3.215 0.870
Spain 3.926 3.926 0.000 3.981 3.981 0.000
Romania 3.375 3.306 0.069 3.465 3.393 0.072
United Kingdom 2.606 2.602 0.004 2.864 2.861 0.003
Czech Republic 2.405 2.251 0.153 2.438 2.278 0.161
Denmark 2.222 1.169 1.053 2.347 1.210 1.137
Hungary 2.026 1.921 0.106 2.013 1.889 0.124
Portugal 1.719 1.719 0.000 1.773 1.773 0.000
Belgium 1.217 1.211 0.006 1.318 1.312 0.006
Croatia 1.207 1.192 0.015 1.171 1.149 0.022
Latvia 1.107 0.906 0.201 1.121 0.870 0.251
Lithuania 1.065 0.620 0.445 1.109 0.621 0.487
Bulgaria 1.003 0.992 0.011 1.008 0.993 0.015
Greece 1.010 1.010 0.000 0.849 0.849 0.000
Netherlands 0.685 0.653 0.032 0.712 0.662 0.049
Estonia 0.692 0.477 0.215 0.711 0.404 0.308
Slovenia 0.565 0.538 0.027 0.585 0.556 0.028
Slovakia 0.564 0.445 0.119 0.513 0.388 0.125
Ireland 0.193 0.193 0.000 0.192 0.192 0.000
Luxembourg 0.060 0.047 0.013 0.063 0.050 0.013
Cyprus 0.008 0.008 0.000 0.006 0.006 0.000
Malta 0.001 0.001 0.000 0.001 0.001 0.000
Total EU 28 76.020 66.646 9.375 78.755 68.450 10.305
* Excluding charcoal. ** Essentially district heating (see Eurostat definition). Source: EurObserv’ER 2017, amended with SHARES data
112.5
130.0
154.9
2014 2015 2016 2020
NR
EA
P
104.5111.3 113.8
NR
EA
P
These data include an estimate of the renewable electricity from waste incineration units. Source: EurObserv’ER 2017
82.5
95.0
81.0
2014 2015 2016 2020
NR
EA
P
75.479.7
66.2
NR
EA
P
These data include an estimate of the renewable heat from incineration plants of municipal waste. Source: EurObserv’ER 2017
conservative and is based on the
current growth trend. As it stands,
the trend is too weak to achieve the
initial NREAP solid biomass electri-
city deployment targets.
The development pace for the
forthcoming years and the lon-
ger term after 2020 will prima-
rily depend on new measures
to implement energy policies in
line with the member countries’
Climate Plans, and primarily
those that aim to gradually levy
heavy carbon taxes. Many experts
believe that solid biomass is most
likely to increase its contribution
significantly in the forthcoming
years and decades with the same
forested area, through more ratio-
nal exploitation and the develop-
ment of agroforestry, a farming
practice that consists of replan-
ting trees in the middle of crops
and also on restoring hedgerows.
This development will have to be
controlled to ensure that the bio-
diversity of forest environments
remains unchanged, to qualify
as sustainable, with impacts on
forestry management methods
and the tree species chosen for
planting. From 2020 to 2030, solid
biomass should mainly be used for
heating buildings and to a lesser
extent for producing methane by
gasification for injection into the
natural gas grid – a technology that
will become more profitable as the
rate of carbon tax rises. n
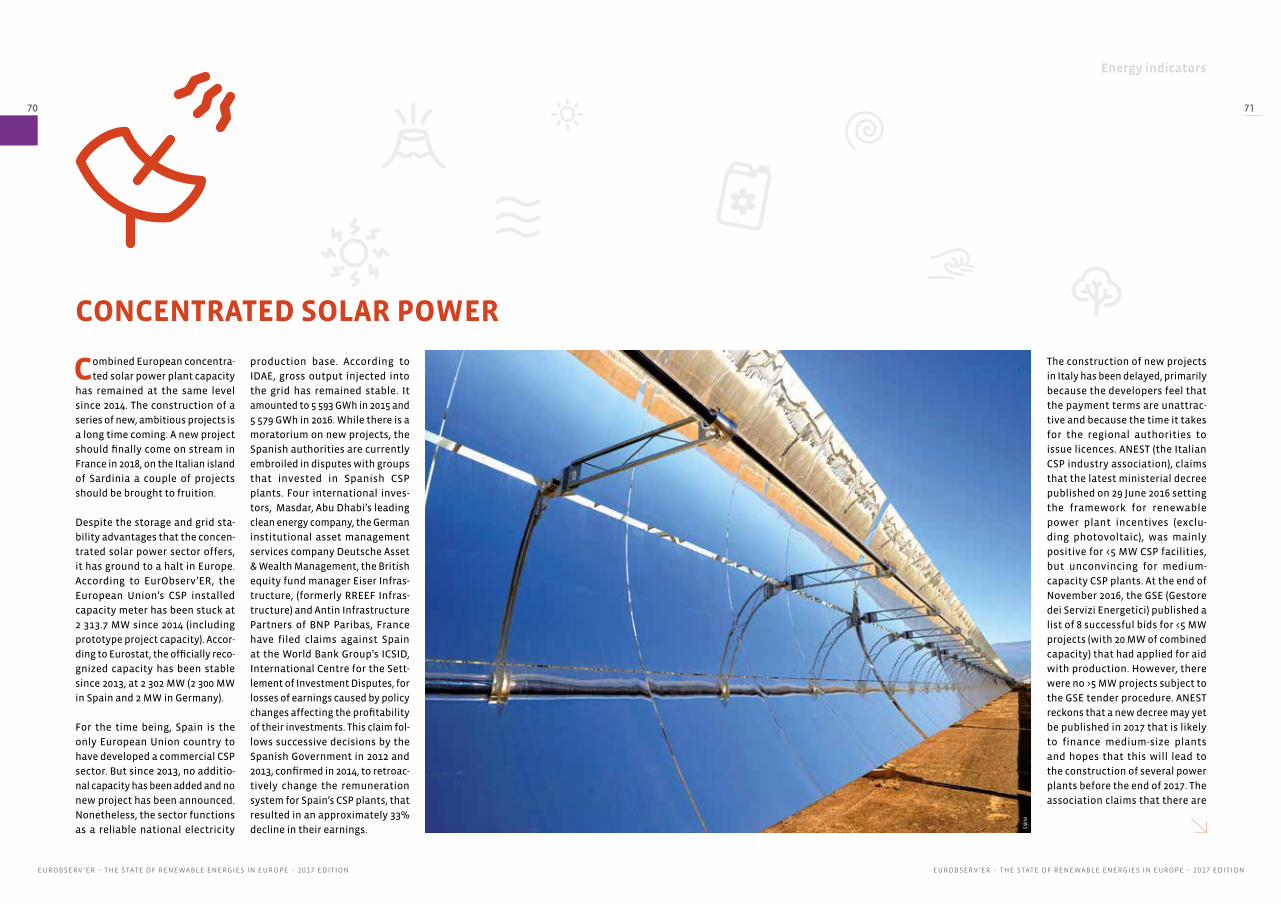
Energy indicators
EUROBSERV ’ER – THE STATE OF RENEWABLE ENERGIES IN EUROPE – 2017 EDITIONEUROBSERV ’ER – THE STATE OF RENEWABLE ENERGIES IN EUROPE – 2017 EDITION
70 71
Combined European concentra-
ted solar power plant capacity
has remained at the same level
since 2014. The construction of a
series of new, ambitious projects is
a long time coming. A new project
should finally come on stream in
France in 2018, on the Italian island
of Sardinia a couple of projects
should be brought to fruition.
Despite the storage and grid sta-
bility advantages that the concen-
trated solar power sector offers,
it has ground to a halt in Europe.
According to EurObserv’ER, the
European Union’s CSP installed
capacity meter has been stuck at
2 313.7 MW since 2014 (including
prototype project capacity). Accor-
ding to Eurostat, the officially reco-
gnized capacity has been stable
since 2013, at 2 302 MW (2 300 MW
in Spain and 2 MW in Germany).
For the time being, Spain is the
only European Union country to
have developed a commercial CSP
sector. But since 2013, no additio-
nal capacity has been added and no
new project has been announced.
Nonetheless, the sector functions
as a reliable national electricity
production base. According to
IDAE, gross output injected into
the grid has remained stable. It
amounted to 5 593 GWh in 2015 and
5 579 GWh in 2016. While there is a
moratorium on new projects, the
Spanish authorities are currently
embroiled in disputes with groups
that invested in Spanish CSP
plants. Four international inves-
tors, Masdar, Abu Dhabi’s leading
clean energy company, the German
institutional asset management
services company Deutsche Asset
& Wealth Management, the British
equity fund manager Eiser Infras-
tructure, (formerly RREEF Infras-
tructure) and Antin Infrastructure
Partners of BNP Paribas, France
have filed claims against Spain
at the World Bank Group’s ICSID,
International Centre for the Sett-
lement of Investment Disputes, for
losses of earnings caused by policy
changes affecting the profitability
of their investments. This claim fol-
lows successive decisions by the
Spanish Government in 2012 and
2013, confirmed in 2014, to retroac-
tively change the remuneration
system for Spain’s CSP plants, that
resulted in an approximately 33%
decline in their earnings.
The construction of new projects
in Italy has been delayed, primarily
because the developers feel that
the payment terms are unattrac-
tive and because the time it takes
for the regional authorities to
issue licences. ANEST (the Italian
CSP industry association), claims
that the latest ministerial decree
published on 29 June 2016 setting
the framework for renewable
power plant incentives (exclu-
ding photovoltaic), was mainly
positive for <5 MW CSP facilities,
but unconvincing for medium-
capacity CSP plants. At the end of
November 2016, the GSE (Gestore
dei Servizi Energetici) published a
list of 8 successful bids for <5 MW
projects (with 20 MW of combined
capacity) that had applied for aid
with production. However, there
were no >5 MW projects subject to
the GSE tender procedure. ANEST
reckons that a new decree may yet
be published in 2017 that is likely
to finance medium-size plants
and hopes that this will lead to
the construction of several power
plants before the end of 2017. The
association claims that there are
CONCENTRATED SOLAR POWER
SW
M
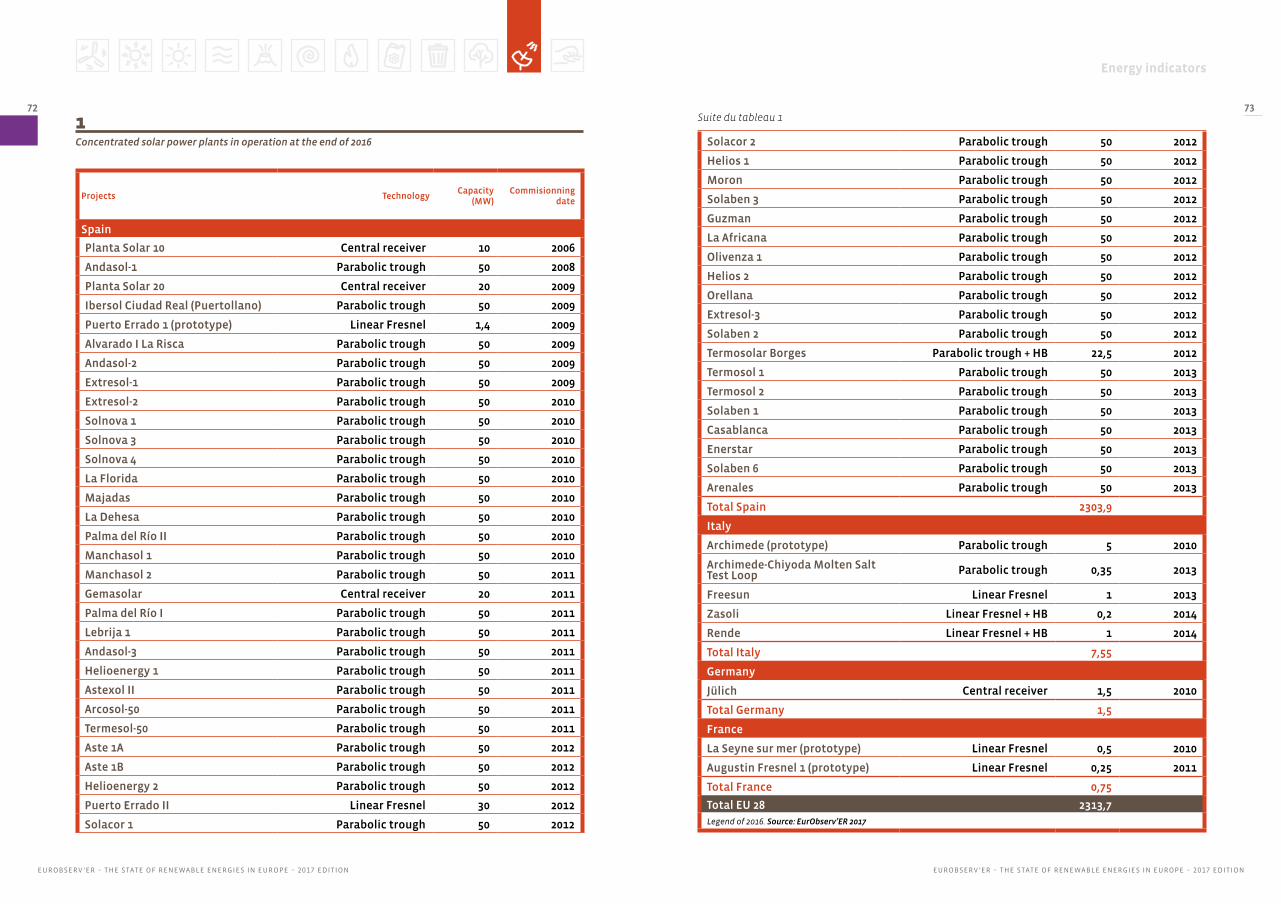
Energy indicators
EUROBSERV ’ER – THE STATE OF RENEWABLE ENERGIES IN EUROPE – 2017 EDITIONEUROBSERV ’ER – THE STATE OF RENEWABLE ENERGIES IN EUROPE – 2017 EDITION
72 73
1Concentrated solar power plants in operation at the end of 2016
Suite du tableau 1
Solacor 2 Parabolic trough 50 2012
Helios 1 Parabolic trough 50 2012
Moron Parabolic trough 50 2012
Solaben 3 Parabolic trough 50 2012
Guzman Parabolic trough 50 2012
La Africana Parabolic trough 50 2012
Olivenza 1 Parabolic trough 50 2012
Helios 2 Parabolic trough 50 2012
Orellana Parabolic trough 50 2012
Extresol-3 Parabolic trough 50 2012
Solaben 2 Parabolic trough 50 2012
Termosolar Borges Parabolic trough + HB 22,5 2012
Termosol 1 Parabolic trough 50 2013
Termosol 2 Parabolic trough 50 2013
Solaben 1 Parabolic trough 50 2013
Casablanca Parabolic trough 50 2013
Enerstar Parabolic trough 50 2013
Solaben 6 Parabolic trough 50 2013
Arenales Parabolic trough 50 2013
Total Spain 2303,9
Italy
Archimede (prototype) Parabolic trough 5 2010
Archimede-Chiyoda Molten Salt Test Loop Parabolic trough 0,35 2013
Freesun Linear Fresnel 1 2013
Zasoli Linear Fresnel + HB 0,2 2014
Rende Linear Fresnel + HB 1 2014
Total Italy 7,55
Germany
Jülich Central receiver 1,5 2010
Total Germany 1,5
France
La Seyne sur mer (prototype) Linear Fresnel 0,5 2010
Augustin Fresnel 1 (prototype) Linear Fresnel 0,25 2011
Total France 0,75
Total EU 28 2313,7Legend of 2016. Source: EurObserv’ER 2017
Projects TechnologyCapacity
(MW)Commisionning
date
Spain
Planta Solar 10 Central receiver 10 2006
Andasol-1 Parabolic trough 50 2008
Planta Solar 20 Central receiver 20 2009
Ibersol Ciudad Real (Puertollano) Parabolic trough 50 2009
Puerto Errado 1 (prototype) Linear Fresnel 1,4 2009
Alvarado I La Risca Parabolic trough 50 2009
Andasol-2 Parabolic trough 50 2009
Extresol-1 Parabolic trough 50 2009
Extresol-2 Parabolic trough 50 2010
Solnova 1 Parabolic trough 50 2010
Solnova 3 Parabolic trough 50 2010
Solnova 4 Parabolic trough 50 2010
La Florida Parabolic trough 50 2010
Majadas Parabolic trough 50 2010
La Dehesa Parabolic trough 50 2010
Palma del Río II Parabolic trough 50 2010
Manchasol 1 Parabolic trough 50 2010
Manchasol 2 Parabolic trough 50 2011
Gemasolar Central receiver 20 2011
Palma del Río I Parabolic trough 50 2011
Lebrija 1 Parabolic trough 50 2011
Andasol-3 Parabolic trough 50 2011
Helioenergy 1 Parabolic trough 50 2011
Astexol II Parabolic trough 50 2011
Arcosol-50 Parabolic trough 50 2011
Termesol-50 Parabolic trough 50 2011
Aste 1A Parabolic trough 50 2012
Aste 1B Parabolic trough 50 2012
Helioenergy 2 Parabolic trough 50 2012
Puerto Errado II Linear Fresnel 30 2012
Solacor 1 Parabolic trough 50 2012
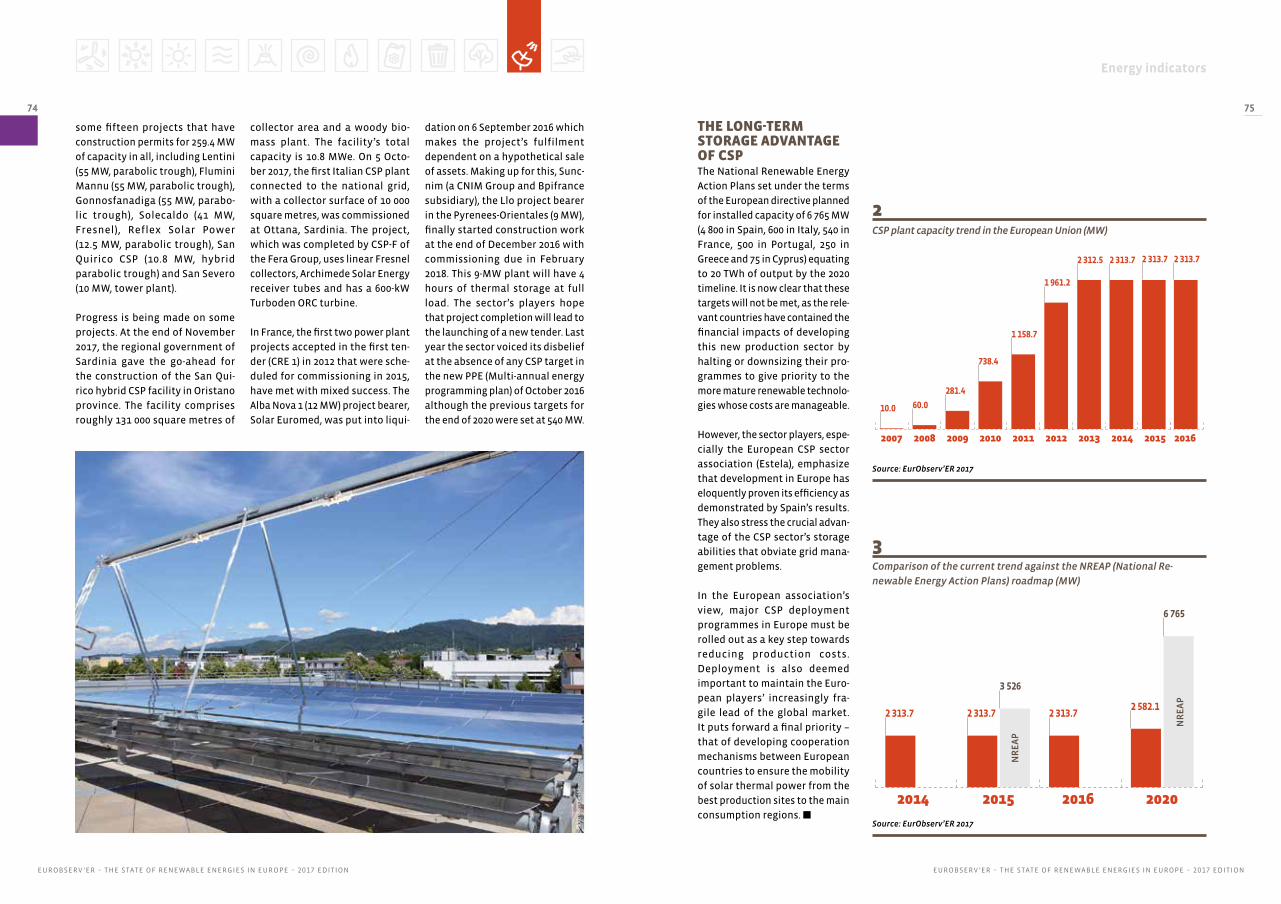
Energy indicators
EUROBSERV ’ER – THE STATE OF RENEWABLE ENERGIES IN EUROPE – 2017 EDITIONEUROBSERV ’ER – THE STATE OF RENEWABLE ENERGIES IN EUROPE – 2017 EDITION
74 75
2CSP plant capacity trend in the European Union (MW)
3Comparison of the current trend against the NREAP (National Re-
newable Energy Action Plans) roadmap (MW)
some fifteen projects that have
construction permits for 259.4 MW
of capacity in all, including Lentini
(55 MW, parabolic trough), Flumini
Mannu (55 MW, parabolic trough),
Gonnosfanadiga (55 MW, parabo-
lic trough), Solecaldo (41 MW,
Fresnel), Reflex Solar Power
(12.5 MW, parabolic trough), San
Quirico CSP (10.8 MW, hybrid
parabolic trough) and San Severo
(10 MW, tower plant).
Progress is being made on some
projects. At the end of November
2017, the regional government of
Sardinia gave the go-ahead for
the construction of the San Qui-
rico hybrid CSP facility in Oristano
province. The facility comprises
roughly 131 000 square metres of
collector area and a woody bio-
mass plant. The facility’s total
capacity is 10.8 MWe. On 5 Octo-
ber 2017, the first Italian CSP plant
connected to the national grid,
with a collector surface of 10 000
square metres, was commissioned
at Ottana, Sardinia. The project,
which was completed by CSP-F of
the Fera Group, uses linear Fresnel
collectors, Archimede Solar Energy
receiver tubes and has a 600-kW
Turboden ORC turbine.
In France, the first two power plant
projects accepted in the first ten-
der (CRE 1) in 2012 that were sche-
duled for commissioning in 2015,
have met with mixed success. The
Alba Nova 1 (12 MW) project bearer,
Solar Euromed, was put into liqui-
dation on 6 September 2016 which
makes the project’s fulfilment
dependent on a hypothetical sale
of assets. Making up for this, Sunc-
nim (a CNIM Group and Bpifrance
subsidiary), the Llo project bearer
in the Pyrenees-Orientales (9 MW),
finally started construction work
at the end of December 2016 with
commissioning due in February
2018. This 9-MW plant will have 4
hours of thermal storage at full
load. The sector’s players hope
that project completion will lead to
the launching of a new tender. Last
year the sector voiced its disbelief
at the absence of any CSP target in
the new PPE (Multi-annual energy
programming plan) of October 2016
although the previous targets for
the end of 2020 were set at 540 MW.
THE LONG-TERM STORAGE ADVANTAGE OF CSP The National Renewable Energy
Action Plans set under the terms
of the European directive planned
for installed capacity of 6 765 MW
(4 800 in Spain, 600 in Italy, 540 in
France, 500 in Portugal, 250 in
Greece and 75 in Cyprus) equating
to 20 TWh of output by the 2020
timeline. It is now clear that these
targets will not be met, as the rele-
vant countries have contained the
financial impacts of developing
this new production sector by
halting or downsizing their pro-
grammes to give priority to the
more mature renewable technolo-
gies whose costs are manageable.
However, the sector players, espe-
cially the European CSP sector
association (Estela), emphasize
that development in Europe has
eloquently proven its efficiency as
demonstrated by Spain’s results.
They also stress the crucial advan-
tage of the CSP sector’s storage
abilities that obviate grid mana-
gement problems.
In the European association’s
view, major CSP deployment
programmes in Europe must be
rolled out as a key step towards
reducing production costs.
Deployment is also deemed
important to maintain the Euro-
pean players’ increasingly fra-
gile lead of the global market.
It puts forward a final priority –
that of developing cooperation
mechanisms between European
countries to ensure the mobility
of solar thermal power from the
best production sites to the main
consumption regions. n
10.0 60.0
281.4
738.4
1 158.7
1 961.2
2 312.5 2 313.7 2 313.7 2 313.7
2007 2008 2009 2010 2011 2012 2013 2015 20162014
2 313.72 582.1
6 765
2014 2015 2016 2020
NR
EA
P
2 313.7 2 313.7
3 526
NR
EA
P
Source: EurObserv’ER 2017
Source: EurObserv’ER 2017Fra
un
ho
fer
IS
E

Energy indicators
EUROBSERV ’ER – THE STATE OF RENEWABLE ENERGIES IN EUROPE – 2017 EDITIONEUROBSERV ’ER – THE STATE OF RENEWABLE ENERGIES IN EUROPE – 2017 EDITION
76 77
Europe, with its many kilometres
of continental and far-flung
coastlines, leads the world in har-
nessing the various forms of energy
that the seas have to offer. Tidal
energy (tidal power), currents (unde-
rwater turbines) or waves (wave
energy converters), energy recove-
red from temperature (thermal) or
salt content differences between
two bodies of water (osmosis)...
all offer enormous potential. The
Ocean Energy Forum verdict that it
gave in the ocean energy roadmap
delivered to the European Commis-
sion in 2016, is that these sources
could meet up to 10% of the EU’s
electricity demand by 2050.
Tidal power is the only commer-
cially harnessed form of ocean
energy. Since 1966, France’s 240-
MW la Rance (Ille-et-Vilaine) tidal
barrage has been operating across
the Rance river estuary. More
recently, the Netherlands success-
fully commissioned its Eastern
Scheldt storm surge barrier with
five 250-kW T2 turbines (1.25 MW)
in November 2015. Then in January
2017, the former UK Energy Minis-
ter, Charles Hendry, published his
tidal lagoon review that came out in
OCEAN ENERGY
favour of experimental tidal power
projects. This prompted the Duchy
of Lancaster to grant a long-term
lease to Atlantis Resources and
its co-developer Natural Energy
Wyre (NEW) in November 2017 to
construct a tidal 160-MW barrage
across the River Wyre estuary, near
Fleetwood, North-West England.
Other technologies are under
development to harness tides,
essentially through tidal lagoon
projects. Construction on a 320-
MW prototype led by Tidal Lagoon
Power should commence in 2018 in
the UK’s Swansea Bay.
As commercially viable projects
take time to get off the ground,
the other forms of ocean energy
are still in research and develop-
ment or industrial pilot phase. Work
on osmotic and thermal energy
remains limited, while experimen-
tation on underwater turbine and
wave energy converter techno-
logies is well underway. Several
countries have prototype machines
installed off their coasts, but the
particularly strong potential of the
UK and French waters means that
they dominate most of this activity.
The hotspot is the European Marine
Energy Centre (EMEC) in Scotland,
which was set up over a decade
ago, and regularly accepts different
types of test machines or devices
hooked up to the grid to put them
through their paces. In the sum-
mer of 2018, the American com-
pany GWave should be deploying
its 9 MW power generation vessel
at the Wave Hub in Cornwall.
The UK’s generous marine
resources enables it to accom-
modate other large-scale pilot
projects such as the Atlantis
Resources Corporation 398-MW
tidal array project MeyGen, which
is being developed in the waters
off Stroma Island (construction of
the first 4-machine pilot phase is
nearing completion pending the
launch of the commercial phase).
Last November, the Australian
developer Bombora announced
that it would be investing 20 mil-
lion euros in a wave energy project
to be run off South Wales.
In France, the prefecture of
Manche signed several authori-
ED
F
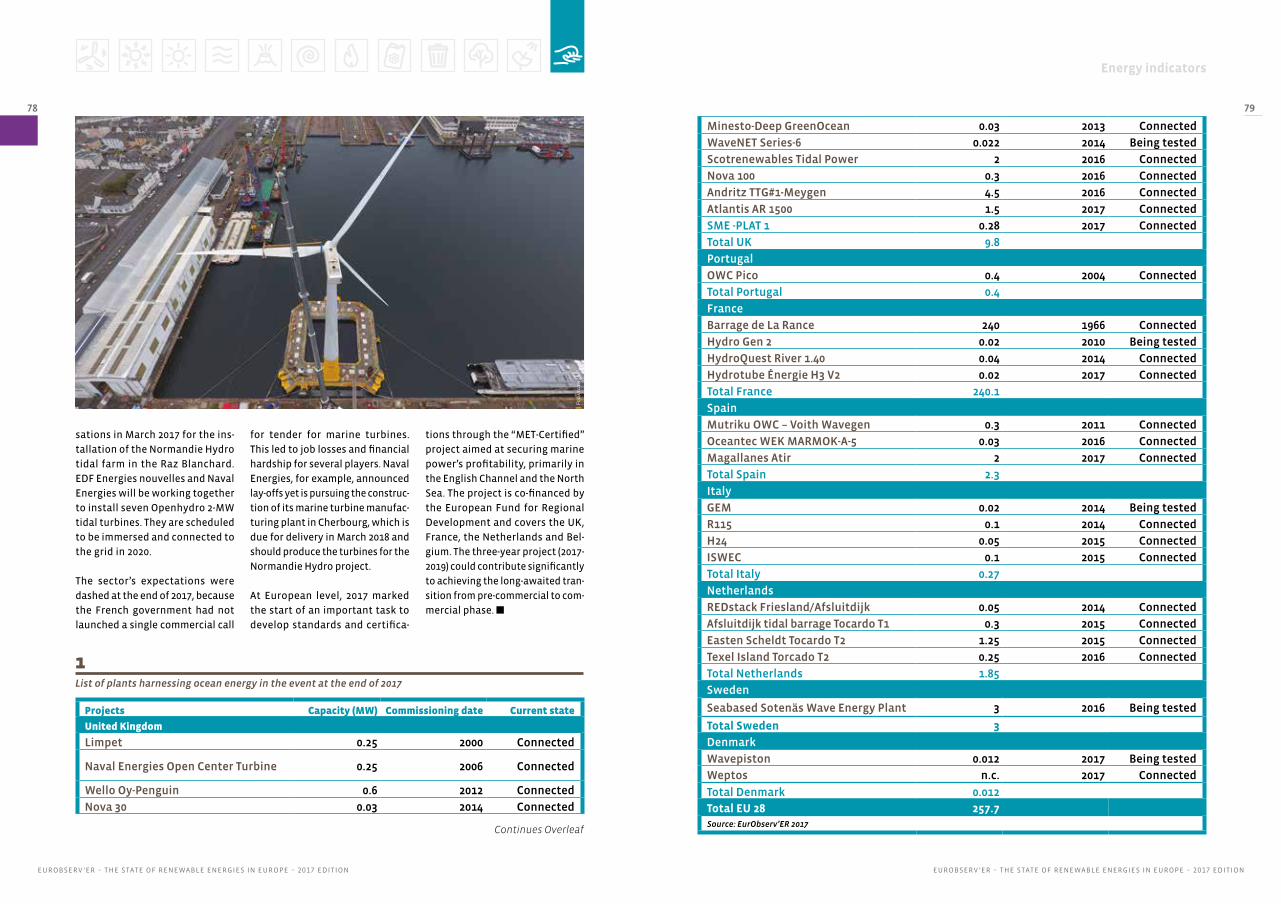
Energy indicators
EUROBSERV ’ER – THE STATE OF RENEWABLE ENERGIES IN EUROPE – 2017 EDITIONEUROBSERV ’ER – THE STATE OF RENEWABLE ENERGIES IN EUROPE – 2017 EDITION
78 79
1List of plants harnessing ocean energy in the event at the end of 2017
sations in March 2017 for the ins-
tallation of the Normandie Hydro
tidal farm in the Raz Blanchard.
EDF Energies nouvelles and Naval
Energies will be working together
to install seven Openhydro 2-MW
tidal turbines. They are scheduled
to be immersed and connected to
the grid in 2020.
The sector’s expectations were
dashed at the end of 2017, because
the French government had not
launched a single commercial call
for tender for marine turbines.
This led to job losses and financial
hardship for several players. Naval
Energies, for example, announced
lay-offs yet is pursuing the construc-
tion of its marine turbine manufac-
turing plant in Cherbourg, which is
due for delivery in March 2018 and
should produce the turbines for the
Normandie Hydro project.
At European level, 2017 marked
the start of an important task to
develop standards and certifica-
tions through the “MET-Certified”
project aimed at securing marine
power’s profitability, primarily in
the English Channel and the North
Sea. The project is co-financed by
the European Fund for Regional
Development and covers the UK,
France, the Netherlands and Bel-
gium. The three-year project (2017-
2019) could contribute significantly
to achieving the long-awaited tran-
sition from pre-commercial to com-
mercial phase. n
Projects Capacity (MW) Commissioning date Current state
United Kingdom
Limpet 0.25 2000 Connected
Naval Energies Open Center Turbine 0.25 2006 Connected
Wello Oy-Penguin 0.6 2012 Connected
Nova 30 0.03 2014 Connected
Flo
atg
en
Minesto-Deep GreenOcean 0.03 2013 Connected
WaveNET Series-6 0.022 2014 Being tested
Scotrenewables Tidal Power 2 2016 Connected
Nova 100 0.3 2016 Connected
Andritz TTG#1-Meygen 4.5 2016 Connected
Atlantis AR 1500 1.5 2017 Connected
SME -PLAT 1 0.28 2017 Connected
Total UK 9.8
Portugal
OWC Pico 0.4 2004 Connected
Total Portugal 0.4
France
Barrage de La Rance 240 1966 Connected
Hydro Gen 2 0.02 2010 Being tested
HydroQuest River 1.40 0.04 2014 Connected
Hydrotube Énergie H3 V2 0.02 2017 Connected
Total France 240.1
Spain
Mutriku OWC – Voith Wavegen 0.3 2011 Connected
Oceantec WEK MARMOK-A-5 0.03 2016 Connected
Magallanes Atir 2 2017 Connected
Total Spain 2.3
Italy
GEM 0.02 2014 Being tested
R115 0.1 2014 Connected
H24 0.05 2015 Connected
ISWEC 0.1 2015 Connected
Total Italy 0.27
Netherlands
REDstack Friesland/Afsluitdijk 0.05 2014 Connected
Afsluitdijk tidal barrage Tocardo T1 0.3 2015 Connected
Easten Scheldt Tocardo T2 1.25 2015 Connected
Texel Island Torcado T2 0.25 2016 Connected
Total Netherlands 1.85
Sweden
Seabased Sotenäs Wave Energy Plant 3 2016 Being tested
Total Sweden 3
Denmark
Wavepiston 0.012 2017 Being tested
Weptos n.c. 2017 Connected
Total Denmark 0.012
Total EU 28 257.7Source: EurObserv’ER 2017
Continues Overleaf

Energy indicators
EUROBSERV ’ER – THE STATE OF RENEWABLE ENERGIES IN EUROPE – 2017 EDITIONEUROBSERV ’ER – THE STATE OF RENEWABLE ENERGIES IN EUROPE – 2017 EDITION
80 81
Currently, heating and cooling is mainly pro-vided by onsite technologies integrated in buildings. For the further decarbonisation of the heating sector especially in highly popu-lated areas, the integration of RES in district heating grids is gaining in importance. The consumption and market indicators on RES integration in the building stock and urban structure are designed to show the status quo of RES use and the development of RES deployment in this respect. Due to the large building stock and the long life cycle of heating systems, the consumption shares changes slowly while the market shares reflects changes at the margin.
RES integrated in buildings or urban infras-tructure comprises various technologies that are applied to provide heating, cooling and electricity. Decentralized technologies in buildings include heat pumps, biomass boi-lers, and solar thermal collectors. Relevant urban infrastructure for the integration of RES comprises mainly district heating plants including biomass CHP and heat only plants, geothermal plants, innovative applications such as solar thermal collector fields and large-scale heat pumps.
INTEGRATION OF RES IN THE BUILDING STOCK AND URBAN INFRASTRUCTURE
The consumption shares of RES in the building
stock shows the significance of the respective RES
in the building sector, and its use. It is the quotient
of final renewable energy demand for heating and
cooling in building and total final energy demand
in buildings including electricity for heating.
In addition, the market stock shares of RES are
depicted. They show the installed heating units as a
percentage of all dwellings. As solar power is mainly
applied in combination with other technologies, it
is not counted here as an alone standing system. In
contrast, electric heating is included in the market
stock share as an alone-standing system. It is an
important technology for heating in some countries.
In contrast to consumption shares of RES, market
sales shares of RES depict the dynamics and deve-
lopment of RES at the edge. Market shares show
the share of technologies sold in relation to the
total of all sold heating units. They may vary from
year to year in each country. As data on sales were
not available for all technologies or countries, the
number of system exchanges is assessed based
on the average exchange rate of systems of those
countries, for which data was available. Although
solar thermal energy is mainly used in combination
with other systems, it is separately listed here to
show its significance and dynamics.
A more detailed description on the methodological
approach of the market and consumption shares can
be found under (eurobserv-er.org) and on Eurostat’s
methodology on consumption shares (see http://
ec.europa.eu/eurostat/web/energy/data/shares).
Because Eurostat data for 2016 were not published
at the time this chapter was written, the shares are
shown for 2015 only.
Methodological approach
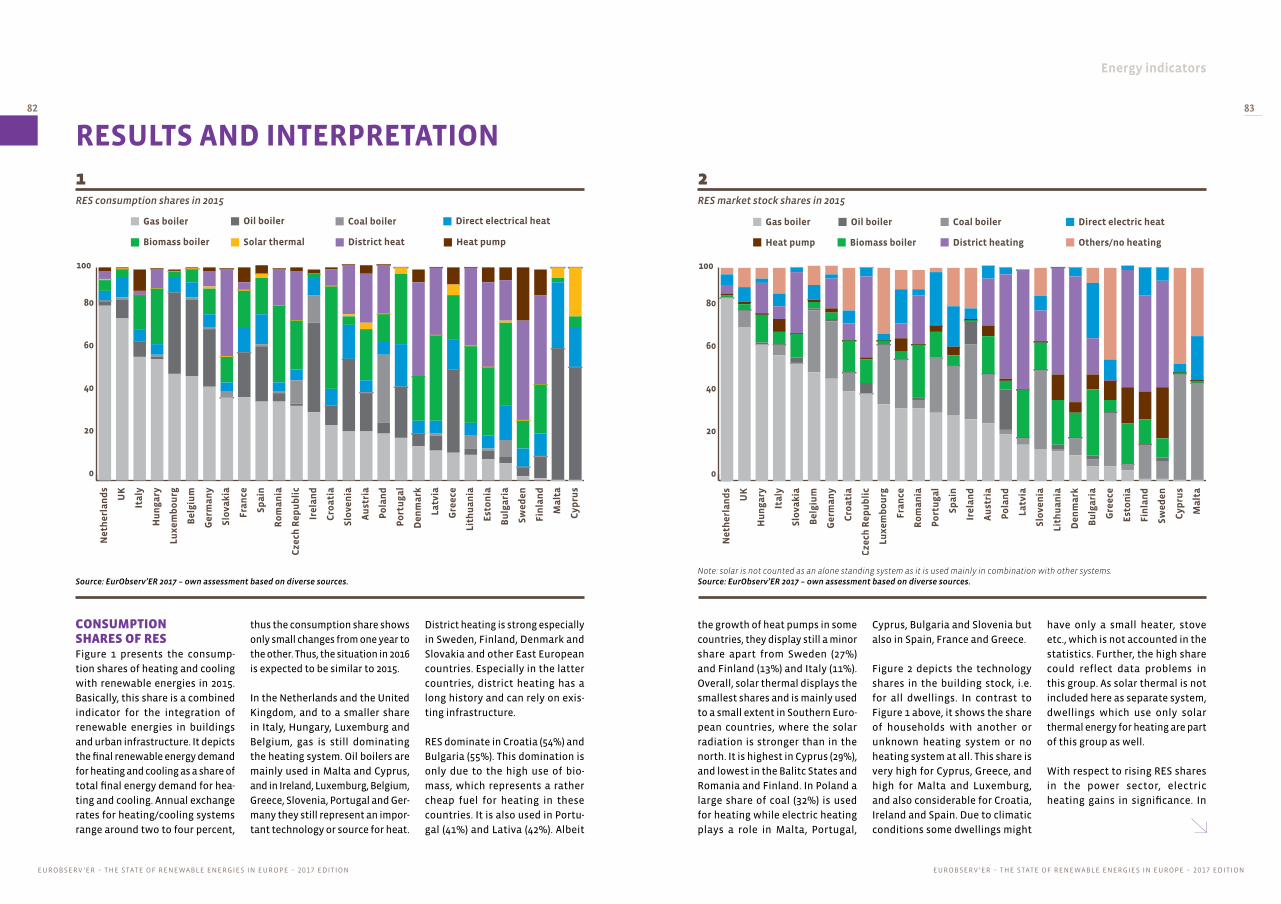
Energy indicators
EUROBSERV ’ER – THE STATE OF RENEWABLE ENERGIES IN EUROPE – 2017 EDITIONEUROBSERV ’ER – THE STATE OF RENEWABLE ENERGIES IN EUROPE – 2017 EDITION
82 83
1RES consumption shares in 2015
2RES market stock shares in 2015
Ne
the
rla
nd
s
UK
Ita
ly
Hu
ng
ary
Lux
em
bo
urg
Be
lgiu
m
Ge
rma
ny
Slo
vak
ia
Fra
nce
Sp
ain
Ro
ma
nia
Cze
ch R
ep
ub
lic
Ire
lan
d
Cro
ati
a
Slo
ven
ia
Au
stri
a
Po
lan
d
Po
rtu
ga
l
De
nm
ark
Latv
ia
Gre
ece
Lith
ua
nia
Est
on
ia
Bu
lga
ria
Sw
ed
en
Fin
lan
d
Ma
lta
Cyp
rus
0
20
40
60
80
100
Oil boiler Coal boilerGas boiler Direct electrical heat
Biomass boiler Solar thermal District heat Heat pump
Ne
the
rla
nd
s
UK
Hu
ng
ary
Ita
ly
Slo
vak
ia
Be
lgiu
m
Ge
rma
ny
Cro
ati
a
Cze
ch R
ep
ub
lic
Lux
em
bo
urg
Fra
nce
Ro
ma
nia
Po
rtu
ga
l
Sp
ain
Ire
lan
d
Au
stri
a
Po
lan
d
Latv
ia
Slo
ven
ia
Lith
ua
nia
De
nm
ark
Bu
lga
ria
Gre
ece
Est
on
ia
Fin
lan
d
Sw
ed
en
Cyp
rus
Ma
lta
Coal boilerOil boilerGas boiler
Biomass boilerHeat pump District heating
Direct electric heat
Others/no heating
0
20
40
60
80
100
Source: EurObserv’ER 2017 – own assessment based on diverse sources.Note: solar is not counted as an alone standing system as it is used mainly in combination with other systems. Source: EurObserv’ER 2017 – own assessment based on diverse sources.
RESULTS AND INTERPRETATION
CONSUMPTION SHARES OF RES Figure 1 presents the consump-
tion shares of heating and cooling
with renewable energies in 2015.
Basically, this share is a combined
indicator for the integration of
renewable energies in buildings
and urban infrastructure. It depicts
the final renewable energy demand
for heating and cooling as a share of
total final energy demand for hea-
ting and cooling. Annual exchange
rates for heating/cooling systems
range around two to four percent,
thus the consumption share shows
only small changes from one year to
the other. Thus, the situation in 2016
is expected to be similar to 2015.
In the Netherlands and the United
Kingdom, and to a smaller share
in Italy, Hungary, Luxemburg and
Belgium, gas is still dominating
the heating system. Oil boilers are
mainly used in Malta and Cyprus,
and in Ireland, Luxemburg, Belgium,
Greece, Slovenia, Portugal and Ger-
many they still represent an impor-
tant technology or source for heat.
District heating is strong especially
in Sweden, Finland, Denmark and
Slovakia and other East European
countries. Especially in the latter
countries, district heating has a
long history and can rely on exis-
ting infrastructure.
RES dominate in Croatia (54%) and
Bulgaria (55%). This domination is
only due to the high use of bio-
mass, which represents a rather
cheap fuel for heating in these
countries. It is also used in Portu-
gal (41%) and Lativa (42%). Albeit
the growth of heat pumps in some
countries, they display still a minor
share apart from Sweden (27%)
and Finland (13%) and Italy (11%).
Overall, solar thermal displays the
smallest shares and is mainly used
to a small extent in Southern Euro-
pean countries, where the solar
radiation is stronger than in the
north. It is highest in Cyprus (29%),
and lowest in the Balitc States and
Romania and Finland. In Poland a
large share of coal (32%) is used
for heating while electric heating
plays a role in Malta, Portugal,
Cyprus, Bulgaria and Slovenia but
also in Spain, France and Greece.
Figure 2 depicts the technology
shares in the building stock, i.e.
for all dwellings. In contrast to
Figure 1 above, it shows the share
of households with another or
unknown heating system or no
heating system at all. This share is
very high for Cyprus, Greece, and
high for Malta and Luxemburg,
and also considerable for Croatia,
Ireland and Spain. Due to climatic
conditions some dwellings might
have only a small heater, stove
etc., which is not accounted in the
statistics. Further, the high share
could reflect data problems in
this group. As solar thermal is not
included here as separate system,
dwellings which use only solar
thermal energy for heating are part
of this group as well.
With respect to rising RES shares
in the power sector, electric
heating gains in significance. In

Energy indicators
EUROBSERV ’ER – THE STATE OF RENEWABLE ENERGIES IN EUROPE – 2017 EDITIONEUROBSERV ’ER – THE STATE OF RENEWABLE ENERGIES IN EUROPE – 2017 EDITION
84 85
Bulgaria, Portugal and Malta the
shares range significantly above
ten percent, while in Spain, Ire-
land, France and Finland they are
slightly above this threshold. This
means a rising RES share in elec-
tricity contributes to low-carbon
heating/cooling in these countries.
MARKET SALES SHARES OF RESFigure 3 and Figure 4 depict the
market sales share of RES techno-
logies used for heating and coo-
ling. In contrast to Figure 2 above,
Figure 3 shows the recent develop-
ments in RES by illustrating the
sales shares of RES heating/coo-
ling in the respective year. Thus, it
shows the dynamic in the market.
Heat pumps show a very high
dynamic in Estonia, Finland, Swe-
den and France. Biomass boilers,
although at a lower level than heat
pumps, display a high dynamic in
the Baltic States, Slovakia, Slove-
nia and Czech Republic. Solar ther-
mal energy shows a high dynamic
in countries where it has already
a high share, such as Cyprus and
Greece. But it displays the highest
dynamic in Denmark (solar district
heating) while Austria, Germany,
Poland and Spain reveal a mode-
rate development.
Overall, in many EU countries, the
dynamic of RES in the heating/coo-
ling sector is low.
CONCLUSIONSOverall, natural gas is the most
commonly used heating system,
followed by oil boilers, while coal
boilers are slowly disappearing as
the consumption shares as well as
3RES market sales shares in 2015
4RES market sales shares in 2016
* Gas, oil and SEB_CHP, calculated for all EU countries based on average share of sales of AT, BE, FR, DE, IT, NL, PL, ES, UK. ** Stoves, electric panel heaters, coal boilers, micro-CHP etc. *** One unit of solar thermal contains 4 m2 per household (added just for visualization purposes). Source: EurObserv’ER 2017 – own assessment based on diverse sources.
* Gas, oil and SEB_CHP, calculated for all EU countries based on average share of sales of AT, BE, FR, DE, IT, NL, PL, ES, UK. ** Stoves, electric panel heaters, coal boilers, micro-CHP etc. *** One unit of solar thermal contains 4 m2 per household (added just for visualization purposes). Source: EurObserv’ER 2017 – own assessment based on diverse sources.
Bu
lga
ria
Ro
ma
nia UK
Ne
the
rla
nd
s
Ma
lta
Be
lgiu
m
Cro
ati
a
Hu
ng
ary
Ita
ly
Po
rtu
ga
l
Lux
em
bu
rg
Ire
lan
d
Latv
ia
Slo
vak
ia
Sp
ain
Fra
nce
Lith
ua
nia
Slo
ven
ia
Gre
ece
Cyp
rus
Cze
ch R
ep
ub
lic
Po
lan
d
Ge
rma
ny
Au
stri
a
Sw
ed
en
De
nm
ark
Fin
lan
d
Est
on
ia
0
20
40
60
80
100
Condensing gas boilers Standard gas boilersOther than RES heating*
Condensing oil boilers
Standard oil boilers Biomass boilers Heat pumps SEB_CHP** Solar thermal***
Bu
lga
ria
Ro
ma
nia
Ma
lta
Ne
the
rla
nd
s
UK
Be
lgiu
m
Cro
ati
a
Hu
ng
ary
Ita
ly
Lux
em
bu
rg
Ire
lan
d
Po
rtu
ga
l
Latv
ia
Slo
vak
ia
Sp
ain
Slo
ven
ia
Lith
ua
nia
Cyp
rus
Gre
ece
Fra
nce
Cze
ch R
ep
ub
lic
Ge
rma
ny
Po
lan
d
Au
stri
a
Sw
ed
en
De
nm
ark
Fin
lan
d
Est
on
ia
0
20
40
60
80
100
0
20
40
60
80
100
Condensing gas boilers Standard gas boilersOther than RES heating*
Condensing oil boilers
Standard oil boilers Biomass boilers Heat pumps SEB_CHP** Solar thermal***
Est
if

Energy indicators
EUROBSERV ’ER – THE STATE OF RENEWABLE ENERGIES IN EUROPE – 2017 EDITIONEUROBSERV ’ER – THE STATE OF RENEWABLE ENERGIES IN EUROPE – 2017 EDITION
86 87
Country 2015 2016
Austria 2.60% 2.67%
Belgium 5.16% 5.36%
France 3.14% 3.17%
Germany 1.73% 1.82%
Italy 4.72% 4.73%
Netherlands 4.92% 5.43%
Poland 2.53% 2.81%
Spain 1.89% 1.85%
Sweden 2.24% 2.31%
United Kingdom 5.68% 6.36%
Total EU (10) 3.37% 3.55%
Source: EurObserv’ER 2017 – own assessment based on diverse sources.
5Heating systems exchange rates as a percentage of households
the market sale shares indicate. In
addition, there is a high dynamic
in sales of condensing gas and oil
boilers, indicating that they will
play a significant role in heating
even in the future.
Albeit the relatively high dyna-
mic of heat pumps in some of the
countries, the consumption shares
are small compared to fossil fuel
based heating. Solar thermal
power has quite some potentials
even in northern countries as the
case of Denmark shows but its
dynamic as well as share in the
stock is low.
In Table 5 an overview of the hea-
ting systems exchange rates for
the selected EU MS is presented.
It can be observed that in countries
like Belgium, Italy, Netherlands,
and the UK where the share of
district heating is very low, the
exchange rates are higher than in
the countries with high shares of
households supplied by a district
heating network.
In summary, in some countries,
RES consumption as well as the
dynamic in sales of RES systems
is high. In particular, heat pumps
are increasingly employed in Scan-
dinavian countries while biomass
plays an increasingly role in some
Eastern European countries. In
Romania, Bulgaria and Hungary
the dynamics in RES-H seems to
be low, but traditionally heating
relies already to a certain share
on biomass. In light of the decar-
bonisation of heating and cooling,
electricity is gaining in significance
if it is based on renewable energy
source. However, deployment rates
of electric heating are still low. n
Der
om
e
Energy indicators
EUROBSERV ’ER – THE STATE OF RENEWABLE ENERGIES IN EUROPE – 2017 EDITIONEUROBSERV ’ER – THE STATE OF RENEWABLE ENERGIES IN EUROPE – 2017 EDITION
88 89
According to the World Meteorological Orga-
nization (WMO) readings, Europe’s last three
years – 2014, 2015 and 2016 – have been the hottest
on record in ascending order. These climate events
have affected the final energy consumption trends
for heating. The data released through the Euros-
tat SHARES (SHort Assessment of Renewable Energy
Sources) tool shows that after bottoming out at
1 100.6 Mtoe in 2014, gross final energy consumption
gradually picked up in 2015 (1 126 Mtoe) and 2016
(1 147.4 Mtoe) to return to a level resembling its 2011,
2012 and 2013 levels. This upturn can be correlated
to a relative increase in heating requirements across
the European Union, and the rebound in the actual
GDP growth of the EU-of-28 (2.3% in 2015 and 2.0%
in 2016, according to Eurostat). Total final energy
consumption remained below the levels recorded
between 2004 and 2008, prior to the financial and
banking crisis of Autumn 2008.
ALMOST 1 000 TWH OF RENEWABLE ELECTRICITY GENERATED IN 2016Weather conditions were generally unconducive to
producing renewable electricity in 2016. The latest
data on actual renewable electricity output (upda-
ted in January 2018), i.e. non-normalized for wind
energy and hydropower, shows a 1.7% increase
between 2015 and 2016, resulting in total electricity
output of 951.4 TWh in 2016 (graph 1). This growth
amounts to a year-on-year gain of 15.8 TWh and is
much lower than the previous years’ – increases of
4.0%, or 35.8 TWh in 2015 and of 5%, or43 TWh in 2014.
Part of the explanation for this poor performance can
be ascribed to the low winds across the European
Union. The wind energy sector only increased output
by 1 TWh between 2015 and 2016 to reach 302.9 TWh
(0.3% more than in 2015), compared to the increase
of 48.8 TWh between 2014 and 2015 for 301.9 TWh of
output (19.3% more than in 2014). The 2015 weather
conditions were far more conducive, primarily in
Northern Europe and the British Isles. The growth
in wind energy output in 2016 was lower although
the additional wind energy capacity connected was
high, i.e. 12.9 GW (a similar level of additional capacity
was connected in 2015). This lower growth hit the
wind energy share in the total renewable electricity
share with the loss of 0.4 of a percentage point to
31.8%. Preliminary estimates available in January
2018 suggest that 2017 will be much more positive
for the sector. The imbalance appears to have been
corrected, with production records announced in the
main producer countries, Germany and the UK as well
as the Northern European countries.
JUST THREE POINTS SHORT OF THE 2020 TARGET
The adversity that hit wind energy was partly off-
set by the positive hydropower production trend,
although it must be admitted that having plum-
meted in 2015 (because of historically low rainfall),
hydropower output only made up part of its loss of
production in 2016. SHARES data reports that hydro-
power output excluding pumped-storage output1,
increased by 2.7% between 2015 and 2016 (9 TWh) to
reach 350.1 TWh. This should be viewed against the
historic 9% decline between 2014 and 2015 (33.8 TWh
less output than in 2014). Pumped-storage output
remained stable at 30.1 TWh.
The year 2016 can also be described as lacklustre for
solar energy production. Solar PV only contributed
another 2.9 TWh in 2016 (2.8% more than in 2015) to
reach 105.2 TWh. In 2015 performance was much bet-
ter with 10.8% growth and 10 TWh more output than
in 2014. Part of photovoltaic’s weaker growth can be
ascribed to a reduction in the capacity connected
in 2016, i.e. 6.1 GW, compared to 8 GW in 2015, com-
pounded by slightly poorer sunshine conditions. In
contrast, CSP capacity remained the same and is still
concentrated in Spain (2 302 MW) where production is
stable at 5.6 TWh. The combined solar power output
figure was 110.8 TWh, and its share of total renewable
electricity increased slightly (by 0.1 of a percentage
point) to 11.6%.
Taking biomass energy as a whole, its electricity out-
put for 2016 reached 180.4 TWh, which is 1.5% (2.7 TWh)
more than in 2015. Once again, the European Union-
wide growth pace slowed down. In 2015, biomass
electricity had increased by 6.3% compared to 2014,
which equated to 10.6 TWh more output.
When we break down the results of the various bio-
mass sectors we find in order of magnitude: biogas
electricity whose output increased by 1.7 TWh in 2016
to 62.6 TWh (a 2.7% gain). The biogas sector is a long
way ahead of the solid biomass sector which only
added 0.7 TWh to 91.4 TWh (0.8%) over the twelve-
month period. Part of the explanation for the weaker
growth of solid biomass electricity can be put down
to the significant drop (2.1 TWh) in Poland’s output,
because of the curb on incentives (see the sector
article) and lower growth in output in the UK, prima-
rily through maintenance downtime in the country’s
main production plant, Drax. The renewable waste sec-
tor maintained its 2.6% growth pace, which enabled it
to add a further 0.5 TWh, resulting in a total of 21 TWh.
While the liquid biomass contribution declined by
3.9% (0.2 TWh) to 5.3 TWh, the global biomass share
did not change and still accounts for 19% of total
renewable electricity output. Geothermal energy
output also increased very slightly with an additio-
nal 116 GWh (compared to 6.6 TWh in 2015) and the
renewable ocean energy contribution, essentially
1. Pumped-storage is an electrical energy storage technique
based on the principal of pumping water to stock it in
impoundment basins when energy demand is low. When
demand is high, this water is later released through tur-
bines to generate electricity.
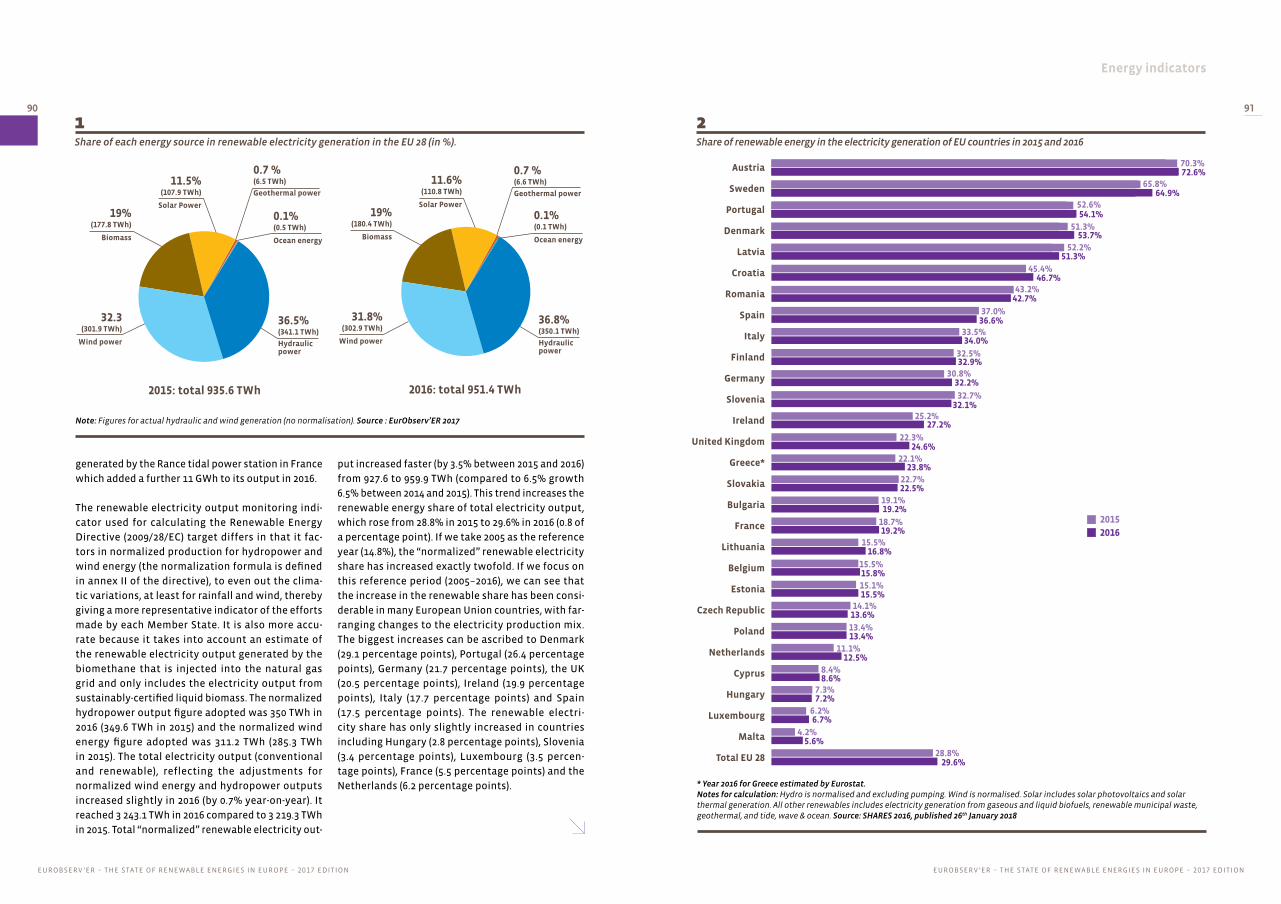
Energy indicators
EUROBSERV ’ER – THE STATE OF RENEWABLE ENERGIES IN EUROPE – 2017 EDITIONEUROBSERV ’ER – THE STATE OF RENEWABLE ENERGIES IN EUROPE – 2017 EDITION
90 91
1Share of each energy source in renewable electricity generation in the EU 28 (in %).
2Share of renewable energy in the electricity generation of EU countries in 2015 and 2016
2016: total 951.4 TWh
31.8%(302.9 TWh)
Wind power
36.8%(350.1 TWh)
Hydraulic power
19%(180.4 TWh)
Biomass
11.6%(110.8 TWh)
Solar Power
0.7 %(6.6 TWh)
Geothermal power
0.1%(0.1 TWh)
Ocean energy
* Year 2016 for Greece estimated by Eurostat. Notes for calculation: Hydro is normalised and excluding pumping. Wind is normalised. Solar includes solar photovoltaics and solar thermal generation. All other renewables includes electricity generation from gaseous and liquid biofuels, renewable municipal waste, geothermal, and tide, wave & ocean. Source: SHARES 2016, published 26th January 2018
20152016
72.6%
64.9%
54.1%
53.7%
51.3%
46.7%
42.7%
36.6%
34.0%
32.9%
32.2%
32.1%
27.2%
24.6%
23.8%
22.5%
19.2%
19.2%
7.2%
6.7%
5.6%
29.6%
70.3%
65.8%
52.6%
51.3%
52.2%
45.4%
43.2%
37.0%
33.5%
32.5%
30.8%
32.7%
25.2%
22.3%
22.1%
22.7%
19.1%
18.7%
7.3%
6.2%
4.2%
28.8%
15.8%
15.5%
13.6%
13.4%
12.5%
8.6%
15.5%
16.8%15.5%
15.1%
14.1%
13.4%
11.1%
8.4%
Austria
Sweden
Portugal
Denmark
Latvia
Croatia
Romania
Spain
Italy
Finland
Germany
Slovenia
Ireland
United Kingdom
Greece*
Slovakia
Bulgaria
France
Lithuania
Belgium
Estonia
Czech Republic
Poland
Netherlands
Cyprus
Hungary
Luxembourg
Malta
Total EU 28
Note: Figures for actual hydraulic and wind generation (no normalisation). Source : EurObserv’ER 2017
32.3(301.9 TWh)
Wind power
2015: total 935.6 TWh
36.5%(341.1 TWh)
Hydraulic power
19%(177.8 TWh)
Biomass
11.5%(107.9 TWh)
Solar Power
0.7 %(6.5 TWh)
Geothermal power
0.1%(0.5 TWh)
Ocean energy
generated by the Rance tidal power station in France
which added a further 11 GWh to its output in 2016.
The renewable electricity output monitoring indi-
cator used for calculating the Renewable Energy
Directive (2009/28/EC) target differs in that it fac-
tors in normalized production for hydropower and
wind energy (the normalization formula is defined
in annex II of the directive), to even out the clima-
tic variations, at least for rainfall and wind, thereby
giving a more representative indicator of the efforts
made by each Member State. It is also more accu-
rate because it takes into account an estimate of
the renewable electricity output generated by the
biomethane that is injected into the natural gas
grid and only includes the electricity output from
sustainably-certified liquid biomass. The normalized
hydropower output figure adopted was 350 TWh in
2016 (349.6 TWh in 2015) and the normalized wind
energy figure adopted was 311.2 TWh (285.3 TWh
in 2015). The total electricity output (conventional
and renewable), reflecting the adjustments for
normalized wind energy and hydropower outputs
increased slightly in 2016 (by 0.7% year-on-year). It
reached 3 243.1 TWh in 2016 compared to 3 219.3 TWh
in 2015. Total “normalized” renewable electricity out-
put increased faster (by 3.5% between 2015 and 2016)
from 927.6 to 959.9 TWh (compared to 6.5% growth
6.5% between 2014 and 2015). This trend increases the
renewable energy share of total electricity output,
which rose from 28.8% in 2015 to 29.6% in 2016 (0.8 of
a percentage point). If we take 2005 as the reference
year (14.8%), the “normalized” renewable electricity
share has increased exactly twofold. If we focus on
this reference period (2005–2016), we can see that
the increase in the renewable share has been consi-
derable in many European Union countries, with far-
ranging changes to the electricity production mix.
The biggest increases can be ascribed to Denmark
(29.1 percentage points), Portugal (26.4 percentage
points), Germany (21.7 percentage points), the UK
(20.5 percentage points), Ireland (19.9 percentage
points), Italy (17.7 percentage points) and Spain
(17.5 percentage points). The renewable electri-
city share has only slightly increased in countries
including Hungary (2.8 percentage points), Slovenia
(3.4 percentage points), Luxembourg (3.5 percen-
tage points), France (5.5 percentage points) and the
Netherlands (6.2 percentage points).

Energy indicators
EUROBSERV ’ER – THE STATE OF RENEWABLE ENERGIES IN EUROPE – 2017 EDITIONEUROBSERV ’ER – THE STATE OF RENEWABLE ENERGIES IN EUROPE – 2017 EDITION
92 93
3Share of each energy source in renewable heat and cooling consumption in the EU 28 (in %).
4Share of renewable energy in heating and cooling of EU countries in 2015 and 2016
2016: total 99.3 Mtep
0.4%(0.4 Mtep)
Liquid biomass
0.2%(0.2 Mtep)
Charcoal
79.3%(78.8 Mtep)
Solid biomass
3.8%(3.8 Mtep)
Renewable municipal
waste
3.5%(3.4 Mtep)
Biogas
9.9%(9.8 Mtep)
Heat pumps
2.1%(2.1 Mtep)
Solar
0.8%(0.8 Mtep)
Geothermal energy
Source : EurObserv’ER 2017
2015: total 95.3 Mtep
0.4%(0.4 Mtep)
Liquid biomass
0.2%(0.2 Mtep)
Charcoal
79.7%(76.0 Mtep)
Solid biomass
3.9 %(3.7 Mtep)
Renewable municipal waste
3.3%(3.2 Mtep)
Biogas
9.6%(9.1 Mtep)
Heat pumps
2.2%(2.1 Mtep)
Solar0.7%(0.7 Mtep)
Geothermal energy
20152016
68.6%
53.7%
51.9%
51.2%
46.5%
41.7%
37.6%
35.1%
34.0%
33.3%
30.0%
26.9%
24.5%
23.0%
21.1%
20.8%
19.9%
18.9%
16.8%
15.3%
14.7%
13.0%
9.9%
8.1%
7.3%
7.0%
6.8%
5.5%
19.1%
68.6%
52.5%
51.8%
49.6%
46.1%
40.1%
38.5%
33.4%
33.9%
32.4%
28.6%
25.9%
25.6%
22.5%
19.7%
21.2%
19.6%
19.3%
16.8%
14.1%
14.5%
12.9%
10.8%
7.8%
7.1%
6.3%
6.6%
5.5%
18.7%
Sweden
Finland
Latvia
Estonia
Lithuania
Denmark
Croatia
Portugal
Slovenia
Austria
Bulgaria
Romania
Greece*
Cyprus
France
Hungary
Czech Republic
Italy
Spain
Malta
Poland
Germany
Slovakia
Belgium
Luxembourg
United Kingdom
Ireland
Netherlands
Total EU 28
* Year 2016 for Greece estimated by Eurostat. Source: SHARES 2016, published 26th January 2018
Graph 2 shows that the renewable electricity share
can vary wildly in line with the Member States’
potential and renewable energy support policies.
Renewable production dominates in the top five ran-
ked countries: Austria (72.6% in 2016), Sweden (64.9%),
Portugal (54.1%), Denmark (53.7%) and Latvia (51.3%).
However, it is less than 10% in the four bottom-ranking
countries: Cyprus, Hungary, Luxembourg and Malta.
ALMOST 100 MTOE OF RENEWABLE HEATThe data released through the Eurostat SHARES tool
shows that the main renewable energy contribution
in 2016 was achieved by the heat and cooling sec-
tor. The sector excludes processing sector heat but
includes the energy directly used by the final user
(e.g.: the consumption of wood energy by households
in domestic heating appliances), derived heat from
heating and cogeneration plants and the renewable
output delivered by heat pumps. Heat and cooling
output thus contributed 99.3 Mtoe in 2016, which
represents 4.2% growth (an additional 4 Mtoe). This
increase is lower than it was the previous year, when
5.7 Mtoe was added (a 6.2% increase between 2014
and 2015 to 95.3 Mtoe).
The variations in renewable heat consumption
should be analysed as a trend. Since the succession
of mild years and winters in Europe – a quantifiable
consequence of climate warming – obfuscates efforts
to read the impact of the policies introduced to pro-
mote the use of renewable heat. Heating needs can be
directly correlated to mean temperature levels. Ano-
ther major element to be considered in the trend and
analysis of renewable heat is that new studies, mostly
surveys on household wood energy consumption have
improved solid biomass consumption monitoring and
the monitoring of the amount of renewable energy
produced by heat pumps, primarily reversible ASHPs
of the air-to-air type. Until recently, several Southern
European countries did not include them in their
renewable energy statistics. Over and above climate
conditions, efforts to improve building insulation and
appliance and heating plant performance enhance pri-
mary renewable energy yield.
If we examine the individual sector trends, the
additional solid biomass contributions (of 2.7 Mtoe)
provided the main source of the increase is and to
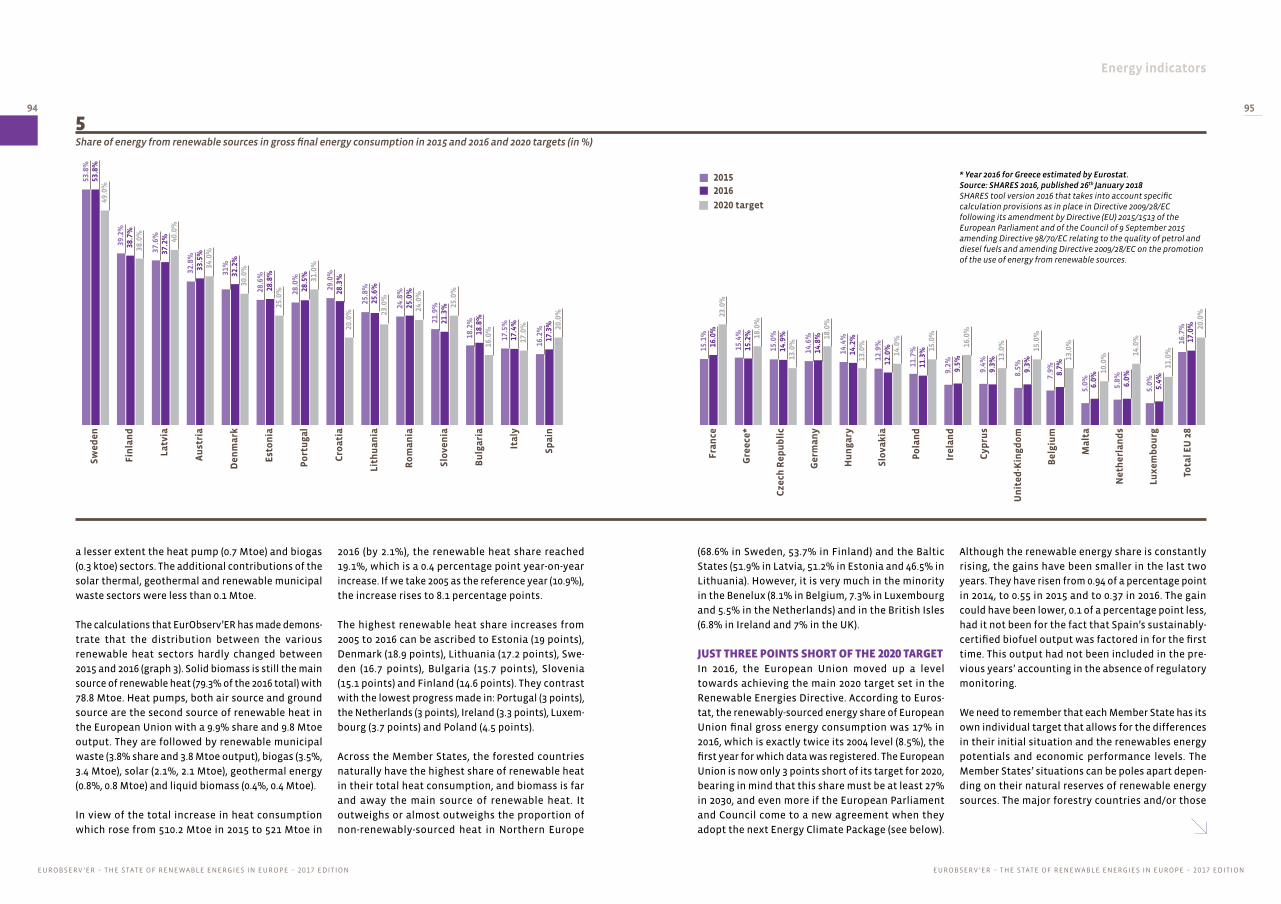
Energy indicators
EUROBSERV ’ER – THE STATE OF RENEWABLE ENERGIES IN EUROPE – 2017 EDITIONEUROBSERV ’ER – THE STATE OF RENEWABLE ENERGIES IN EUROPE – 2017 EDITION
94 95
5Share of energy from renewable sources in gross final energy consumption in 2015 and 2016 and 2020 targets (in %)
0
10
20
30
40
50
60
Sw
ed
en
Fin
lan
d
Latv
ia
Au
stri
a
De
nm
ark
Est
on
ia
Po
rtu
ga
l
Cro
ati
a
Lith
ua
nia
Ro
ma
nia
Slo
ven
ia
Bu
lga
ria
Ita
ly
Sp
ain
Fra
nce
Gre
ece
*
Cze
ch R
ep
ub
lic
Ge
rma
ny
Hu
ng
ary
Slo
vak
ia
Po
lan
d
Ire
lan
d
Cyp
rus
Un
ite
d-K
ing
do
m
Be
lgiu
m
Ma
lta
Ne
the
rla
nd
s
Lux
em
bo
urg
Tota
l EU
28
20152016
2020 target
53.8
%53
.8%
49.0
%
39.2
%38
.7%
38.0
%
37.6
%37
.2% 40
.0%
32.8
%33
.5%
34.0
%
31%
32.2
%30
.0%
28.6
%28
.8%
25.0
% 28.0
%28
.5% 31
.0%
29.0
%28
.3%
20.0
%
25.8
%25
.6%
23.0
%
24.8
%25
.0%
24.0
%
21.9
%21
.3% 25
.0%
18.2
%18
.8%
16.0
%
17.5
%17
.4%
17.0
%
16.2
%17
.3% 20
.0%
15.1
%16
.0%
23.0
%
15.4
%15
.2% 18
.0%
15.0
%14
.9%
13.0
%
14.6
%14
.8% 18
.0%
14.4
%14
.2%
13.0
%
12.9
%12
.0%
14.0
%
11.7
%11
.3% 15
.0%
9.2%
9.5%
16.0
%
9.4%
9.3%
13.0
%
8.5% 9.
3%15
.0%
7.9% 8.
7%13
.0%
5.0% 6.
0%
5.8%
6.0%
5.0% 5.4%
16.7
%17
.0%
10.0
% 14.0
%
11.0
%
20.0
%
a lesser extent the heat pump (0.7 Mtoe) and biogas
(0.3 ktoe) sectors. The additional contributions of the
solar thermal, geothermal and renewable municipal
waste sectors were less than 0.1 Mtoe.
The calculations that EurObserv’ER has made demons-
trate that the distribution between the various
renewable heat sectors hardly changed between
2015 and 2016 (graph 3). Solid biomass is still the main
source of renewable heat (79.3% of the 2016 total) with
78.8 Mtoe. Heat pumps, both air source and ground
source are the second source of renewable heat in
the European Union with a 9.9% share and 9.8 Mtoe
output. They are followed by renewable municipal
waste (3.8% share and 3.8 Mtoe output), biogas (3.5%,
3.4 Mtoe), solar (2.1%, 2.1 Mtoe), geothermal energy
(0.8%, 0.8 Mtoe) and liquid biomass (0.4%, 0.4 Mtoe).
In view of the total increase in heat consumption
which rose from 510.2 Mtoe in 2015 to 521 Mtoe in
2016 (by 2.1%), the renewable heat share reached
19.1%, which is a 0.4 percentage point year-on-year
increase. If we take 2005 as the reference year (10.9%),
the increase rises to 8.1 percentage points.
The highest renewable heat share increases from
2005 to 2016 can be ascribed to Estonia (19 points),
Denmark (18.9 points), Lithuania (17.2 points), Swe-
den (16.7 points), Bulgaria (15.7 points), Slovenia
(15.1 points) and Finland (14.6 points). They contrast
with the lowest progress made in: Portugal (3 points),
the Netherlands (3 points), Ireland (3.3 points), Luxem-
bourg (3.7 points) and Poland (4.5 points).
Across the Member States, the forested countries
naturally have the highest share of renewable heat
in their total heat consumption, and biomass is far
and away the main source of renewable heat. It
outweighs or almost outweighs the proportion of
non-renewably-sourced heat in Northern Europe
(68.6% in Sweden, 53.7% in Finland) and the Baltic
States (51.9% in Latvia, 51.2% in Estonia and 46.5% in
Lithuania). However, it is very much in the minority
in the Benelux (8.1% in Belgium, 7.3% in Luxembourg
and 5.5% in the Netherlands) and in the British Isles
(6.8% in Ireland and 7% in the UK).
JUST THREE POINTS SHORT OF THE 2020 TARGET In 2016, the European Union moved up a level
towards achieving the main 2020 target set in the
Renewable Energies Directive. According to Euros-
tat, the renewably-sourced energy share of European
Union final gross energy consumption was 17% in
2016, which is exactly twice its 2004 level (8.5%), the
first year for which data was registered. The European
Union is now only 3 points short of its target for 2020,
bearing in mind that this share must be at least 27%
in 2030, and even more if the European Parliament
and Council come to a new agreement when they
adopt the next Energy Climate Package (see below).
Although the renewable energy share is constantly
rising, the gains have been smaller in the last two
years. They have risen from 0.94 of a percentage point
in 2014, to 0.55 in 2015 and to 0.37 in 2016. The gain
could have been lower, 0.1 of a percentage point less,
had it not been for the fact that Spain’s sustainably-
certified biofuel output was factored in for the first
time. This output had not been included in the pre-
vious years’ accounting in the absence of regulatory
monitoring.
We need to remember that each Member State has its
own individual target that allows for the differences
in their initial situation and the renewables energy
potentials and economic performance levels. The
Member States’ situations can be poles apart depen-
ding on their natural reserves of renewable energy
sources. The major forestry countries and/or those
* Year 2016 for Greece estimated by Eurostat. Source: SHARES 2016, published 26th January 2018SHARES tool version 2016 that takes into account specific calculation provisions as in place in Directive 2009/28/EC following its amendment by Directive (EU) 2015/1513 of the European Parliament and of the Council of 9 September 2015 amending Directive 98/70/EC relating to the quality of petrol and diesel fuels and amending Directive 2009/28/EC on the promotion of the use of energy from renewable sources.
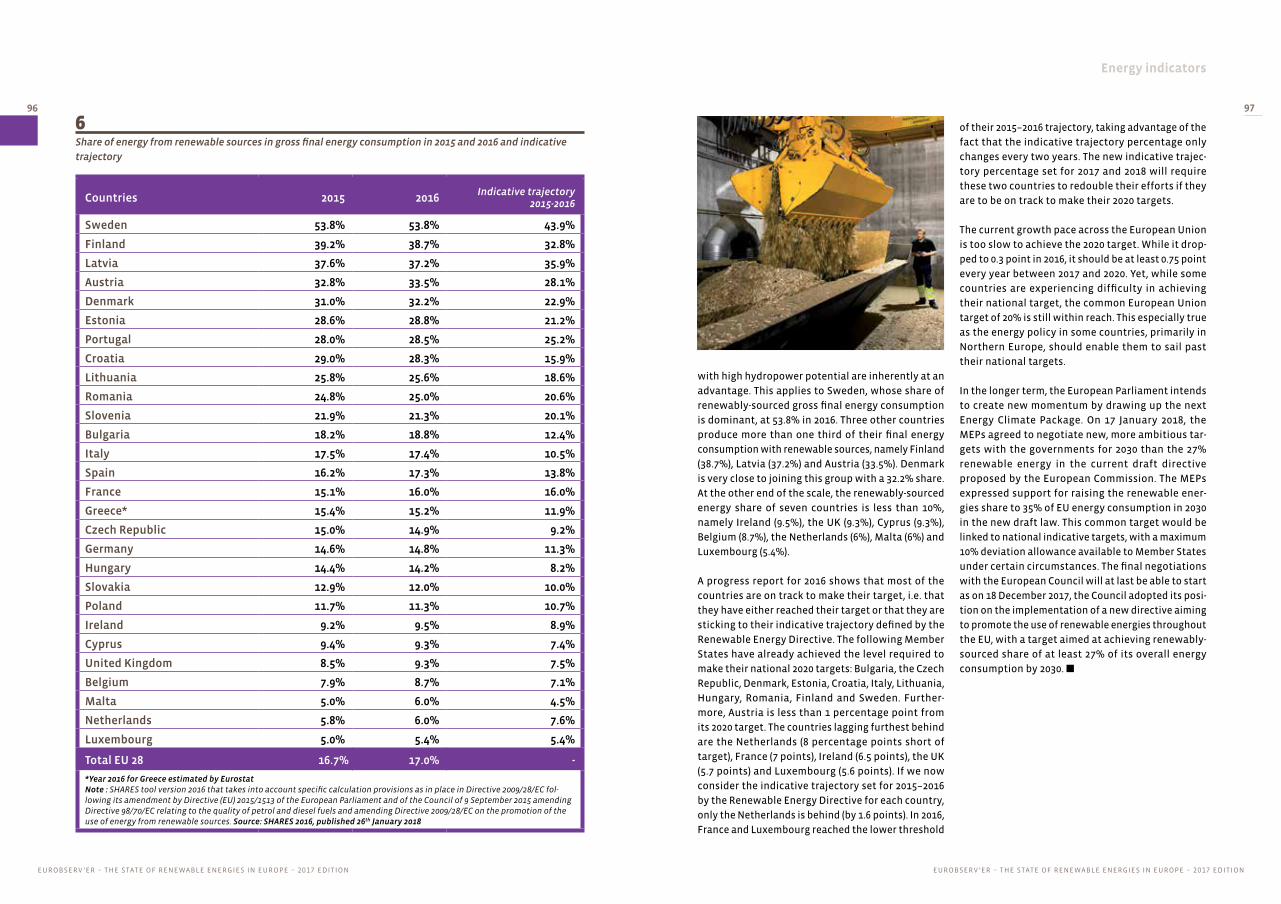
Energy indicators
EUROBSERV ’ER – THE STATE OF RENEWABLE ENERGIES IN EUROPE – 2017 EDITIONEUROBSERV ’ER – THE STATE OF RENEWABLE ENERGIES IN EUROPE – 2017 EDITION
96 97
6Share of energy from renewable sources in gross final energy consumption in 2015 and 2016 and indicative
trajectory
Countries 2015 2016Indicative trajectory
2015-2016
Sweden 53.8% 53.8% 43.9%
Finland 39.2% 38.7% 32.8%
Latvia 37.6% 37.2% 35.9%
Austria 32.8% 33.5% 28.1%
Denmark 31.0% 32.2% 22.9%
Estonia 28.6% 28.8% 21.2%
Portugal 28.0% 28.5% 25.2%
Croatia 29.0% 28.3% 15.9%
Lithuania 25.8% 25.6% 18.6%
Romania 24.8% 25.0% 20.6%
Slovenia 21.9% 21.3% 20.1%
Bulgaria 18.2% 18.8% 12.4%
Italy 17.5% 17.4% 10.5%
Spain 16.2% 17.3% 13.8%
France 15.1% 16.0% 16.0%
Greece* 15.4% 15.2% 11.9%
Czech Republic 15.0% 14.9% 9.2%
Germany 14.6% 14.8% 11.3%
Hungary 14.4% 14.2% 8.2%
Slovakia 12.9% 12.0% 10.0%
Poland 11.7% 11.3% 10.7%
Ireland 9.2% 9.5% 8.9%
Cyprus 9.4% 9.3% 7.4%
United Kingdom 8.5% 9.3% 7.5%
Belgium 7.9% 8.7% 7.1%
Malta 5.0% 6.0% 4.5%
Netherlands 5.8% 6.0% 7.6%
Luxembourg 5.0% 5.4% 5.4%
Total EU 28 16.7% 17.0% -
*Year 2016 for Greece estimated by Eurostat Note : SHARES tool version 2016 that takes into account specific calculation provisions as in place in Directive 2009/28/EC fol-lowing its amendment by Directive (EU) 2015/1513 of the European Parliament and of the Council of 9 September 2015 amending Directive 98/70/EC relating to the quality of petrol and diesel fuels and amending Directive 2009/28/EC on the promotion of the use of energy from renewable sources. Source: SHARES 2016, published 26th January 2018
with high hydropower potential are inherently at an
advantage. This applies to Sweden, whose share of
renewably-sourced gross final energy consumption
is dominant, at 53.8% in 2016. Three other countries
produce more than one third of their final energy
consumption with renewable sources, namely Finland
(38.7%), Latvia (37.2%) and Austria (33.5%). Denmark
is very close to joining this group with a 32.2% share.
At the other end of the scale, the renewably-sourced
energy share of seven countries is less than 10%,
namely Ireland (9.5%), the UK (9.3%), Cyprus (9.3%),
Belgium (8.7%), the Netherlands (6%), Malta (6%) and
Luxembourg (5.4%).
A progress report for 2016 shows that most of the
countries are on track to make their target, i.e. that
they have either reached their target or that they are
sticking to their indicative trajectory defined by the
Renewable Energy Directive. The following Member
States have already achieved the level required to
make their national 2020 targets: Bulgaria, the Czech
Republic, Denmark, Estonia, Croatia, Italy, Lithuania,
Hungary, Romania, Finland and Sweden. Further-
more, Austria is less than 1 percentage point from
its 2020 target. The countries lagging furthest behind
are the Netherlands (8 percentage points short of
target), France (7 points), Ireland (6.5 points), the UK
(5.7 points) and Luxembourg (5.6 points). If we now
consider the indicative trajectory set for 2015–2016
by the Renewable Energy Directive for each country,
only the Netherlands is behind (by 1.6 points). In 2016,
France and Luxembourg reached the lower threshold
of their 2015–2016 trajectory, taking advantage of the
fact that the indicative trajectory percentage only
changes every two years. The new indicative trajec-
tory percentage set for 2017 and 2018 will require
these two countries to redouble their efforts if they
are to be on track to make their 2020 targets.
The current growth pace across the European Union
is too slow to achieve the 2020 target. While it drop-
ped to 0.3 point in 2016, it should be at least 0.75 point
every year between 2017 and 2020. Yet, while some
countries are experiencing difficulty in achieving
their national target, the common European Union
target of 20% is still within reach. This especially true
as the energy policy in some countries, primarily in
Northern Europe, should enable them to sail past
their national targets.
In the longer term, the European Parliament intends
to create new momentum by drawing up the next
Energy Climate Package. On 17 January 2018, the
MEPs agreed to negotiate new, more ambitious tar-
gets with the governments for 2030 than the 27%
renewable energy in the current draft directive
proposed by the European Commission. The MEPs
expressed support for raising the renewable ener-
gies share to 35% of EU energy consumption in 2030
in the new draft law. This common target would be
linked to national indicative targets, with a maximum
10% deviation allowance available to Member States
under certain circumstances. The final negotiations
with the European Council will at last be able to start
as on 18 December 2017, the Council adopted its posi-
tion on the implementation of a new directive aiming
to promote the use of renewable energies throughout
the EU, with a target aimed at achieving renewably-
sourced share of at least 27% of its overall energy
consumption by 2030. n
En
ova

Socio-economic indicators
EUROBSERV ’ER – THE STATE OF RENEWABLE ENERGIES IN EUROPE – 2017 EDITIONEUROBSERV ’ER – THE STATE OF RENEWABLE ENERGIES IN EUROPE – 2017 EDITION
98 99
For the socio-economic indicators, an important
methodological change has been implemented
in the 2017 Edition of ‘The State of Renewable
Energy in Europe’ by setting up a modeling envi-
ronment that formalises the assessment proce-
dure of employment and turnover. The model
was developed by the Energy research Centre
of the Netherlands (ECN).
The new methodological approach is based
on an evaluation of the economic activity of
each renewable sector covered, which is then
expressed into full-time equivalent (FTE) employ-
ment. This new approach focuses on money
flows from four distinct activities:
1. Investments in new installations;
2. Operational and maintenance activities for
existing plants including the newly added
plants;
3. Production and trading of renewable energy
equipment;
4. Production and trading of biomass feedstock.
Proper characteristics of the economic sectors
of each EU Member State are taken into account
when determining the renewable employment
and turnover effects by using input-output
tables. The new methodology uses a consistent
and mathematical approach to define the
employment and turnover effects, allowing
for a comparison between the European Union
Member States. Underlying used databases stem
from Eurostat, JRC and EurObserv’ER. Employ-
ment related to energy efficiency measures is
outside of the scope of the analysis. Below, some
important methodological issues are briefly
highlighted:
The following chapter sheds a light on the European renewable energy sectors in terms of socioeconomic impacts. All 28 Member States are covered for 2015 and 2016. Figures for 2015 are different than those given for 2015 in the 2016 edition of “The State of Renewable Energies in Europe” as the methodology has been reviewed in depth (see below).
SOCIO-ECONOMIC INDICATORS
Methodological note
Socio-economic indicators
EUROBSERV ’ER – THE STATE OF RENEWABLE ENERGIES IN EUROPE – 2017 EDITIONEUROBSERV ’ER – THE STATE OF RENEWABLE ENERGIES IN EUROPE – 2017 EDITION
100 101
• Employment data presented in each RES chap-
ter refers to gross employment, i.e. not taking
into account developments in non-renewable
energy sectors or reduced expenditure in other
sectors.
• Data include both direct and indirect employ-
ment. Direct employment includes RES equip-
ment manufacturing, RES plants construction,
engineering and management, operation and
maintenance, biomass supply and exploitation.
Indirect employment refers to secondary activi-
ties, such as transport and other services.
• Socio economic indicators for the bioenergy
sectors (biofuels, biomass and biogas) include
the upstream activities in the agricultural, far-
ming and forestry sectors.
• Turnover figures are expressed in current mil-
lion euros (€m). Turnover data found in non-
Euro currency countries were converted into
Euro, based on averaged annual conversion
rates for 2016 as published by Eurostat.
• Taking data accuracy into account, the socio-
economic indicators have been rounded to 100
for employment figures and to 10 million euros
for turnover data.
In consideration of the methodological change,
the 2015 employment and turnover figures,
published in the Edition of “ The State of
Renewable Energy in Europe”, have been re-eva-
luated for the present edition in order to have
coherent 2015 and 2016 series for all RES sectors
in the EU28.
The employment and turnover data were obtai-
ned from a ‘living model’, still under deve-
lopment and open for comments and further
improvement. One of the challenging issues
when setting up a model is to incorporate the
numerous remarks received from modeling
experts, the renewable energy industry, policy
makers and country representatives. Therefore,
the methodology used will be enhanced in the
following months, incorporating improvements
of the data presented in the current release.
The socio-economic chapter of this edition
includes a new indicator: the employment
effects in the fossil fuel chains based on the
energy replaced by increased renewables pro-
duction. This indicator only takes into account
direct jobs in fossil sectors, not replaced invest-
ment or the indirect effects.
For more information regarding the methodo-
logy used in this chapter, interested readers are
referred to a separate methodology paper that
explains the new approach in more detail. This
paper can be downloaded from the EurObserv’ER
project website.

Socio-economic indicators
EUROBSERV ’ER – THE STATE OF RENEWABLE ENERGIES IN EUROPE – 2017 EDITIONEUROBSERV ’ER – THE STATE OF RENEWABLE ENERGIES IN EUROPE – 2017 EDITION
102 103
WIND POWER
Wind power sector remains
an important contributor to
the EU-wide socioeconomic figures.
While turnover amounts to an estimated € 39.3 billion in 2016
(a decrease of € 1 billion from the
2015 estimate of € 40.3 billion),
EurObserv’ER estimates the resul-
ting employment at 309 000 jobs for the same year, down from
315 900 in 2015. The new model
(see methodology note) used to
estimate socio-economic indi-
cators in this chapter considers
three main activities: investments
in new installations, operation and
maintenance activities for existing
and newly installed turbines, and
the production and trading of
renewable energy equipment. This
has been assessed for both the ons-
hore wind sector as well as for the
offshore wind power sector.
With an estimated 121 700 full
time equivalent jobs (FTE) and a
€ 16 billion turnover, the German
wind power sector remains the
European leader representing
39% of the EU-wide wind sector
employment. These results are in
line with the German renewable
energy statistics working group
(AGEE-Stat) that claims invest-
ments of € 10.1 billion for 2016 and
a further economic stimulus from
operation of wind power plants of
€ 2.3 billion. Typical for this country
are the important offshore wind
activities, combined with a strong
wind power equipment manufactu-
ring sector, resulting in significant
trade figure. However, despite Ger-
man market performed well in 2016
(4 625 MW of onshore wind turbine
capacity newly connected), the esti-
mated total sector employment has
seen a significant reduction with a
-22% decrease compared to 2015.
This phenomenon is mainly due
to the slow-down observed in the
offshore sector which is much more
capital-intensive than the onshore
sector. In 2017, employment figures
should be improved. BWE, the Ger-
man Wind Energy Association, is
expecting a 2017 for onshore ins-
tallation level of 4 500 – 5 000 MW
and for offshore wind, based on the
project pipeline. EurObserv’ER can
announce a recovery in the instal-
lation pace for 2017.
Second comes United Kingdom with 42 900 jobs, represen-
ting around 14% of the EU-wide
employment and a sector turno-
ver of € 4.5 billion. The underlying
pattern is similar to the German
one (a strong reduction in the
offshore market combined with
onshore uptake, the market of
which almost tripled in 2016). The
difference however is that the UK
market has a net growth, resulting
in an increased estimated employ-
ment effect (+26%).
Next is Denmark with a labour force estimated at 26 600 per-sons and a € 4,6 billion turno-ver. The country was in many ways
pioneering in wind power industry
but since nearly a decade its
domestic onshore market is satu-
rated. The activity is continuing
through repowering operations,
offshore plants and a national
manufacturing players, as Vestas,
which is still among top world
players.
These dynamic countries are dog-
ged by the apathy that prevails in
a few European Union markets.
Spain for example, which is the
second European country regarding
Vat
ten
fall
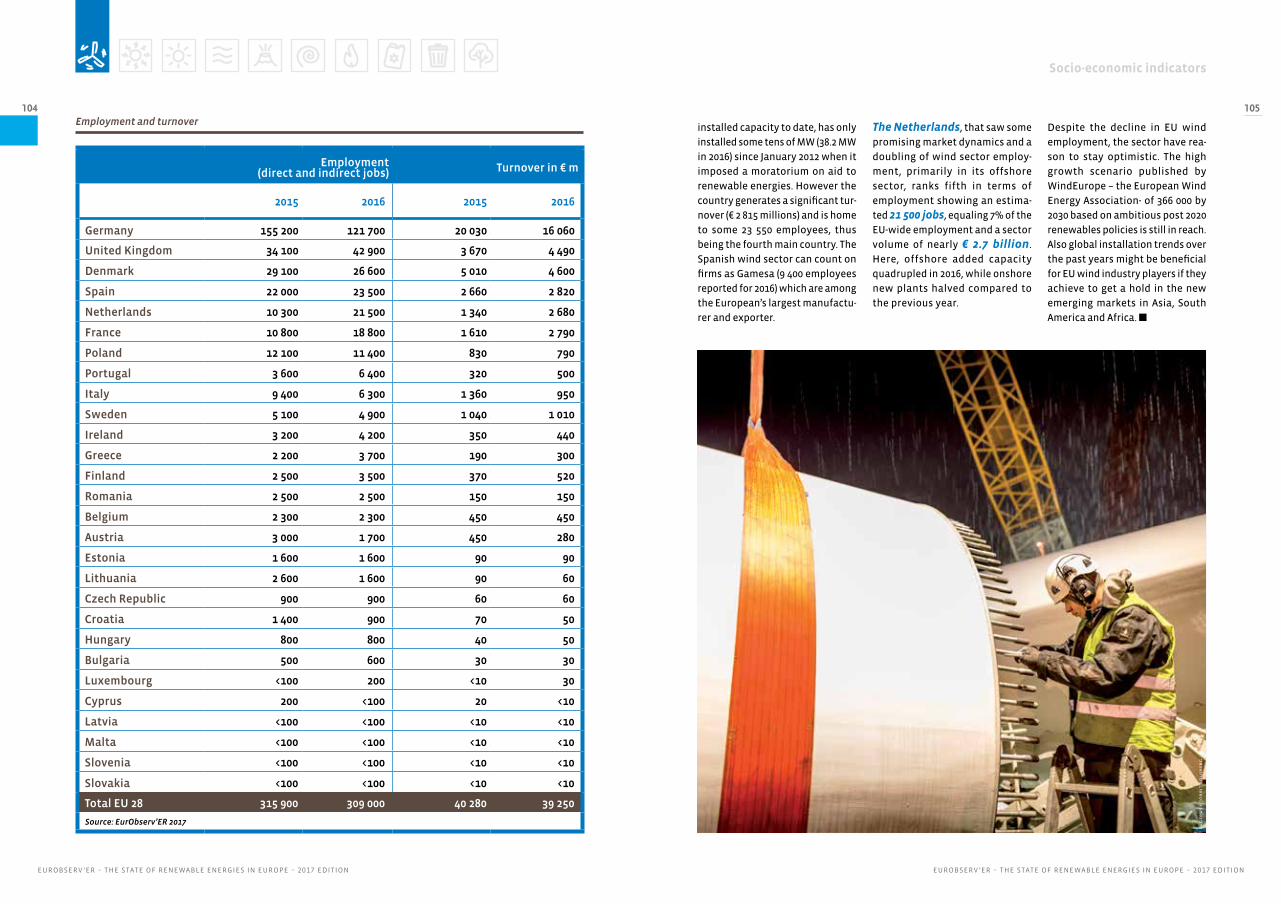
Socio-economic indicators
EUROBSERV ’ER – THE STATE OF RENEWABLE ENERGIES IN EUROPE – 2017 EDITIONEUROBSERV ’ER – THE STATE OF RENEWABLE ENERGIES IN EUROPE – 2017 EDITION
104 105
Employment(direct and indirect jobs) Turnover in € m
2015 2016 2015 2016
Germany 155 200 121 700 20 030 16 060
United Kingdom 34 100 42 900 3 670 4 490
Denmark 29 100 26 600 5 010 4 600
Spain 22 000 23 500 2 660 2 820
Netherlands 10 300 21 500 1 340 2 680
France 10 800 18 800 1 610 2 790
Poland 12 100 11 400 830 790
Portugal 3 600 6 400 320 500
Italy 9 400 6 300 1 360 950
Sweden 5 100 4 900 1 040 1 010
Ireland 3 200 4 200 350 440
Greece 2 200 3 700 190 300
Finland 2 500 3 500 370 520
Romania 2 500 2 500 150 150
Belgium 2 300 2 300 450 450
Austria 3 000 1 700 450 280
Estonia 1 600 1 600 90 90
Lithuania 2 600 1 600 90 60
Czech Republic 900 900 60 60
Croatia 1 400 900 70 50
Hungary 800 800 40 50
Bulgaria 500 600 30 30
Luxembourg <100 200 <10 30
Cyprus 200 <100 20 <10
Latvia <100 <100 <10 <10
Malta <100 <100 <10 <10
Slovenia <100 <100 <10 <10
Slovakia <100 <100 <10 <10
Total EU 28 315 900 309 000 40 280 39 250
Source: EurObserv’ER 2017
Employment and turnoverinstalled capacity to date, has only
installed some tens of MW (38.2 MW
in 2016) since January 2012 when it
imposed a moratorium on aid to
renewable energies. However the
country generates a significant tur-
nover (€ 2 815 millions) and is home
to some 23 550 employees, thus
being the fourth main country. The
Spanish wind sector can count on
firms as Gamesa (9 400 employees
reported for 2016) which are among
the European’s largest manufactu-
rer and exporter.
The Netherlands, that saw some
promising market dynamics and a
doubling of wind sector employ-
ment, primarily in its offshore
sector, ranks fifth in terms of
employment showing an estima-
ted 21 500 jobs, equaling 7% of the
EU-wide employment and a sector
volume of nearly € 2.7 billion.
Here, offshore added capacity
quadrupled in 2016, while onshore
new plants halved compared to
the previous year.
Despite the decline in EU wind
employment, the sector have rea-
son to stay optimistic. The high
growth scenario published by
WindEurope – the European Wind
Energy Association- of 366 000 by
2030 based on ambitious post 2020
renewables policies is still in reach.
Also global installation trends over
the past years might be beneficial
for EU wind industry players if they
achieve to get a hold in the new
emerging markets in Asia, South
America and Africa. n
Lag
erw
ey/J
or
rit
Lo
usb
erg
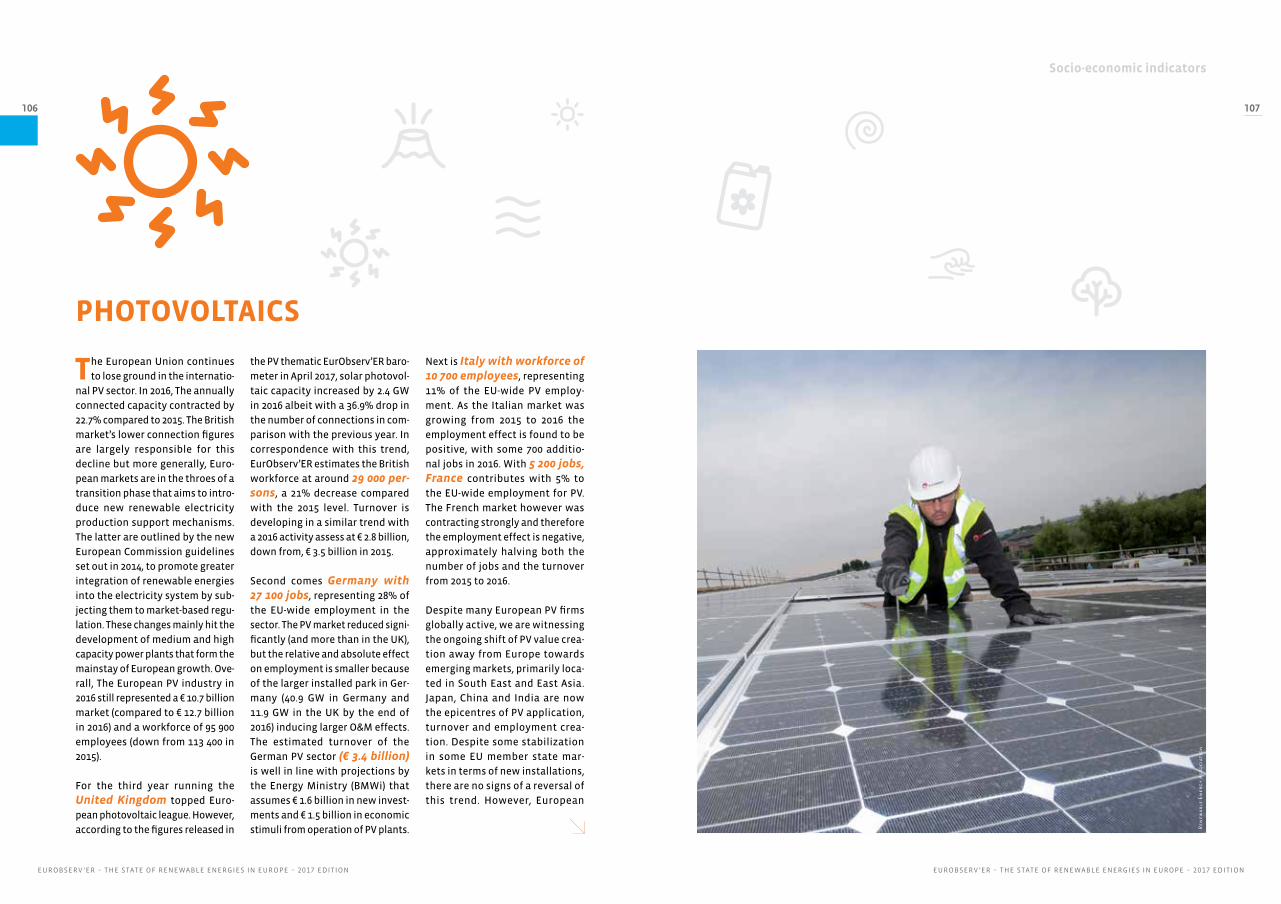
Socio-economic indicators
EUROBSERV ’ER – THE STATE OF RENEWABLE ENERGIES IN EUROPE – 2017 EDITIONEUROBSERV ’ER – THE STATE OF RENEWABLE ENERGIES IN EUROPE – 2017 EDITION
106 107
PHOTOVOLTAICS
The European Union continues
to lose ground in the internatio-
nal PV sector. In 2016, The annually
connected capacity contracted by
22.7% compared to 2015. The British
market’s lower connection figures
are largely responsible for this
decline but more generally, Euro-
pean markets are in the throes of a
transition phase that aims to intro-
duce new renewable electricity
production support mechanisms.
The latter are outlined by the new
European Commission guidelines
set out in 2014, to promote greater
integration of renewable energies
into the electricity system by sub-
jecting them to market-based regu-
lation. These changes mainly hit the
development of medium and high
capacity power plants that form the
mainstay of European growth. Ove-
rall, The European PV industry in
2016 still represented a € 10.7 billion
market (compared to € 12.7 billion
in 2016) and a workforce of 95 900
employees (down from 113 400 in
2015).
For the third year running the
United Kingdom topped Euro-
pean photovoltaic league. However,
according to the figures released in
the PV thematic EurObserv’ER baro-
meter in April 2017, solar photovol-
taic capacity increased by 2.4 GW
in 2016 albeit with a 36.9% drop in
the number of connections in com-
parison with the previous year. In
correspondence with this trend,
EurObserv’ER estimates the British
workforce at around 29 000 per-sons, a 21% decrease compared
with the 2015 level. Turnover is
developing in a similar trend with
a 2016 activity assess at € 2.8 billion,
down from, € 3.5 billion in 2015.
Second comes Germany with 27 100 jobs, representing 28% of
the EU-wide employment in the
sector. The PV market reduced signi-
ficantly (and more than in the UK),
but the relative and absolute effect
on employment is smaller because
of the larger installed park in Ger-
many (40.9 GW in Germany and
11.9 GW in the UK by the end of
2016) inducing larger O&M effects.
The estimated turnover of the
German PV sector (€ 3.4 billion)
is well in line with projections by
the Energy Ministry (BMWi) that
assumes € 1.6 billion in new invest-
ments and € 1.5 billion in economic
stimuli from operation of PV plants.
Next is Italy with workforce of 10 700 employees, representing
11% of the EU-wide PV employ-
ment. As the Italian market was
growing from 2015 to 2016 the
employment effect is found to be
positive, with some 700 additio-
nal jobs in 2016. With 5 200 jobs, France contributes with 5% to
the EU-wide employment for PV.
The French market however was
contracting strongly and therefore
the employment effect is negative,
approximately halving both the
number of jobs and the turnover
from 2015 to 2016.
Despite many European PV firms
globally active, we are witnessing
the ongoing shift of PV value crea-
tion away from Europe towards
emerging markets, primarily loca-
ted in South East and East Asia.
Japan, China and India are now
the epicentres of PV application,
turnover and employment crea-
tion. Despite some stabilization
in some EU member state mar-
kets in terms of new installations,
there are no signs of a reversal of
this trend. However, European
Ren
ewa
ble
En
erg
y A
sso
cia
tio
n
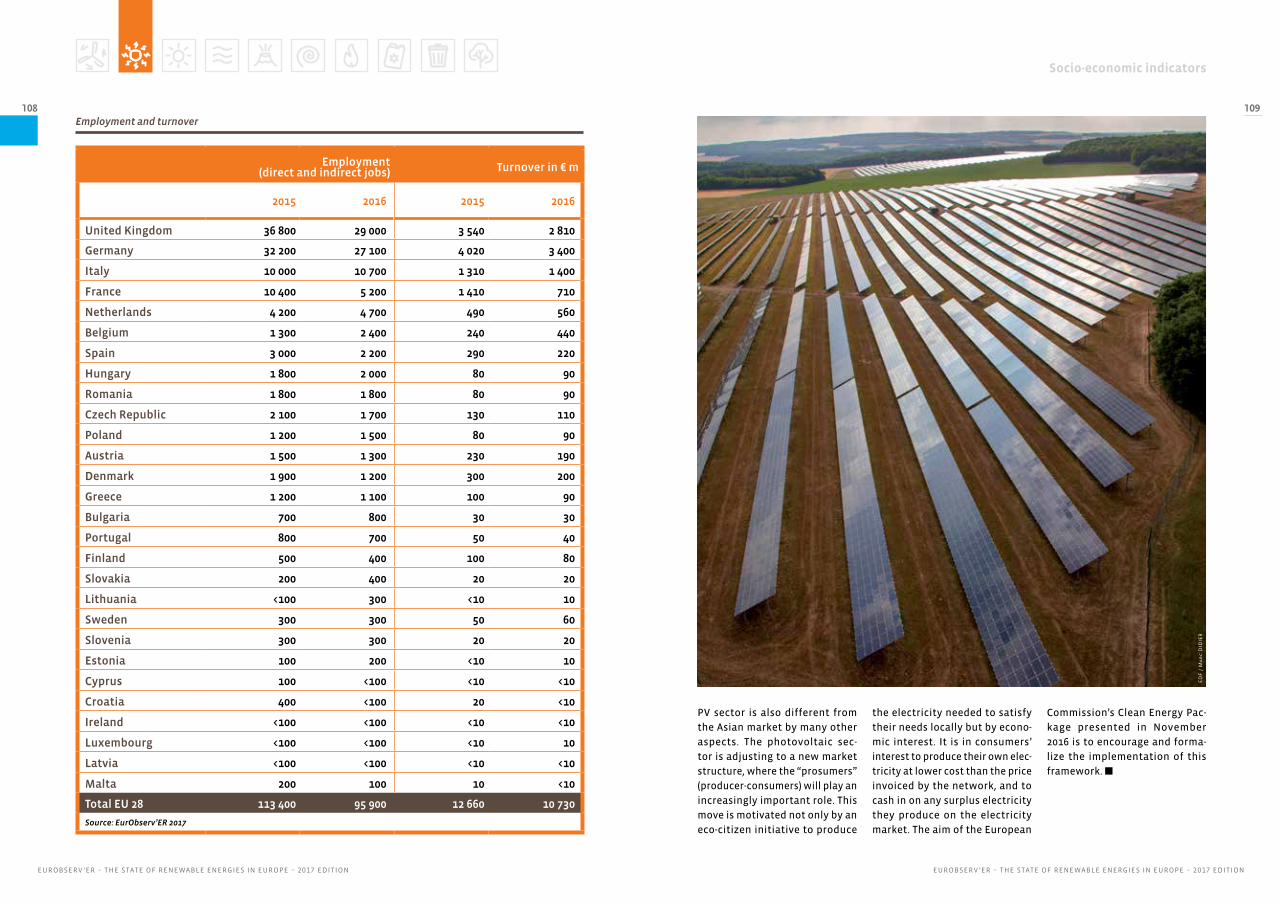
Socio-economic indicators
EUROBSERV ’ER – THE STATE OF RENEWABLE ENERGIES IN EUROPE – 2017 EDITIONEUROBSERV ’ER – THE STATE OF RENEWABLE ENERGIES IN EUROPE – 2017 EDITION
108 109
Employment(direct and indirect jobs) Turnover in € m
2015 2016 2015 2016
United Kingdom 36 800 29 000 3 540 2 810
Germany 32 200 27 100 4 020 3 400
Italy 10 000 10 700 1 310 1 400
France 10 400 5 200 1 410 710
Netherlands 4 200 4 700 490 560
Belgium 1 300 2 400 240 440
Spain 3 000 2 200 290 220
Hungary 1 800 2 000 80 90
Romania 1 800 1 800 80 90
Czech Republic 2 100 1 700 130 110
Poland 1 200 1 500 80 90
Austria 1 500 1 300 230 190
Denmark 1 900 1 200 300 200
Greece 1 200 1 100 100 90
Bulgaria 700 800 30 30
Portugal 800 700 50 40
Finland 500 400 100 80
Slovakia 200 400 20 20
Lithuania <100 300 <10 10
Sweden 300 300 50 60
Slovenia 300 300 20 20
Estonia 100 200 <10 10
Cyprus 100 <100 <10 <10
Croatia 400 <100 20 <10
Ireland <100 <100 <10 <10
Luxembourg <100 <100 <10 10
Latvia <100 <100 <10 <10
Malta 200 100 10 <10
Total EU 28 113 400 95 900 12 660 10 730
Source: EurObserv’ER 2017
Employment and turnover
PV sector is also different from
the Asian market by many other
aspects. The photovoltaic sec-
tor is adjusting to a new market
structure, where the “prosumers”
(producer-consumers) will play an
increasingly important role. This
move is motivated not only by an
eco-citizen initiative to produce
the electricity needed to satisfy
their needs locally but by econo-
mic interest. It is in consumers’
interest to produce their own elec-
tricity at lower cost than the price
invoiced by the network, and to
cash in on any surplus electricity
they produce on the electricity
market. The aim of the European
Commission’s Clean Energy Pac-
kage presented in November
2016 is to encourage and forma-
lize the implementation of this
framework. n
ED
F /
Ma
rc
DID
IER
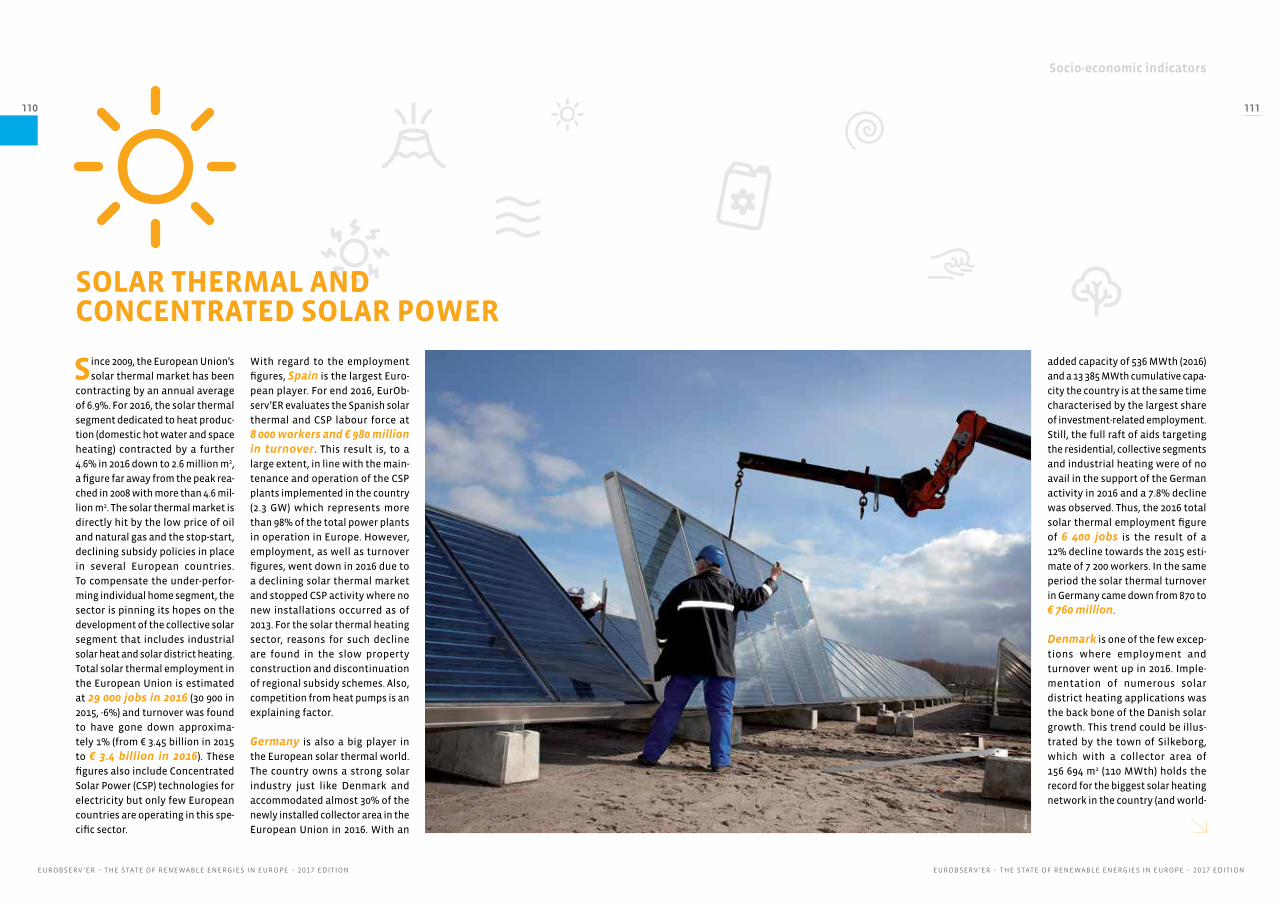
Socio-economic indicators
EUROBSERV ’ER – THE STATE OF RENEWABLE ENERGIES IN EUROPE – 2017 EDITIONEUROBSERV ’ER – THE STATE OF RENEWABLE ENERGIES IN EUROPE – 2017 EDITION
110 111
Since 2009, the European Union’s
solar thermal market has been
contracting by an annual average
of 6.9%. For 2016, the solar thermal
segment dedicated to heat produc-
tion (domestic hot water and space
heating) contracted by a further
4.6% in 2016 down to 2.6 million m2,
a figure far away from the peak rea-
ched in 2008 with more than 4.6 mil-
lion m2. The solar thermal market is
directly hit by the low price of oil
and natural gas and the stop-start,
declining subsidy policies in place
in several European countries.
To compensate the under-perfor-
ming individual home segment, the
sector is pinning its hopes on the
development of the collective solar
segment that includes industrial
solar heat and solar district heating.
Total solar thermal employment in
the European Union is estimated
at 29 000 jobs in 2016 (30 900 in
2015, -6%) and turnover was found
to have gone down approxima-
tely 1% (from € 3.45 billion in 2015
to € 3.4 billion in 2016). These
figures also include Concentrated
Solar Power (CSP) technologies for
electricity but only few European
countries are operating in this spe-
cific sector.
With regard to the employment
figures, Spain is the largest Euro-
pean player. For end 2016, EurOb-
serv’ER evaluates the Spanish solar
thermal and CSP labour force at
8 000 workers and € 980 million in turnover. This result is, to a
large extent, in line with the main-
tenance and operation of the CSP
plants implemented in the country
(2.3 GW) which represents more
than 98% of the total power plants
in operation in Europe. However,
employment, as well as turnover
figures, went down in 2016 due to
a declining solar thermal market
and stopped CSP activity where no
new installations occurred as of
2013. For the solar thermal heating
sector, reasons for such decline
are found in the slow property
construction and discontinuation
of regional subsidy schemes. Also,
competition from heat pumps is an
explaining factor.
Germany is also a big player in
the European solar thermal world.
The country owns a strong solar
industry just like Denmark and
accommodated almost 30% of the
newly installed collector area in the
European Union in 2016. With an
SOLAR THERMAL AND CONCENTRATED SOLAR POWER
added capacity of 536 MWth (2016)
and a 13 385 MWth cumulative capa-
city the country is at the same time
characterised by the largest share
of investment-related employment.
Still, the full raft of aids targeting
the residential, collective segments
and industrial heating were of no
avail in the support of the German
activity in 2016 and a 7.8% decline
was observed. Thus, the 2016 total
solar thermal employment figure
of 6 400 jobs is the result of a
12% decline towards the 2015 esti-
mate of 7 200 workers. In the same
period the solar thermal turnover
in Germany came down from 870 to
€ 760 million.
Denmark is one of the few excep-
tions where employment and
turnover went up in 2016. Imple-
mentation of numerous solar
district heating applications was
the back bone of the Danish solar
growth. This trend could be illus-
trated by the town of Silkeborg,
which with a collector area of
156 694 m2 (110 MWth) holds the
record for the biggest solar heating
network in the country (and world-
Nu
on

Socio-economic indicators
EUROBSERV ’ER – THE STATE OF RENEWABLE ENERGIES IN EUROPE – 2017 EDITIONEUROBSERV ’ER – THE STATE OF RENEWABLE ENERGIES IN EUROPE – 2017 EDITION
112 113
Employment(direct and indirect jobs) Turnover in € m
2015 2016 2015 2016
Spain 8 400 8 000 1 010 980
Germany 7 200 6 400 870 760
Denmark 1 300 3 200 210 530
Austria 2 600 2 000 420 330
Greece 1 700 1 500 130 110
Italy 1 400 1 400 170 170
Bulgaria 1 500 1 300 40 40
Poland 2 200 1 100 130 70
France 1 400 1 100 190 150
Czech Republic 600 400 30 20
Hungary 200 400 <10 20
Portugal 500 200 30 10
United Kingdom 200 200 20 10
Belgium 100 200 30 30
Romania 100 200 <10 <10
Croatia 200 100 <10 <10
Ireland 200 100 10 10
Netherlands 100 100 10 10
Cyprus 100 100 <10 <10
Slovenia <100 200 <10 <10
Sweden <100 <100 <10 20
Estonia <100 <100 <10 <10
Finland <100 <100 <10 <10
Latvia <100 <100 <10 <10
Lithuania <100 <100 <10 <10
Luxembourg <100 <100 <10 <10
Malta <100 <100 <10 <10
Slovakia <100 <100 <10 <10
Total EU 28 30 900 29 000 3 450 3 380
Source: EurObserv’ER 2017
Employment and turnoverwide) since December 2016. Accor-
dingly, EurObserv’ER estimates the
Danish sector at 3 200 jobs and € 530 million in turnover.
One of the main changes with
regard to last year has been obser-
ved in Poland, where the solar
thermal water heater market more
than halved from 2015 to 2016, yiel-
ding a similar pattern for employ-
ment (from 2 200 jobs in 2015 to 1 100 in 2016) and sector turnover
(from € 130 to 70 million). Multiple
reasons account for this: reducing
subsidies, low gas prices, competi-
tion from electric thermodynamic
hot water heaters and an increased
interest in heat pumps and PV.
Although solar heat is still losing
ground, the European Union is
trying to keep this sector on the
map. The Commission reiterates
that heating and cooling amount
to 50% of the EU’s energy demand
and that 75% of this demand is met
by fossil fuel. The lack of coordi-
nated renewable heating and coo-
ling policy has resulted in highly
fragmented markets and curbed
investor confidence. One of the
possible changes could be the
introduction of a new dedicated
tool to stimulate the deployment
of renewable heat technologies
such as solar thermal energy.
Article 23 of the revised directive
proposes that each Member State
should try to increase the share
of the energy produced from
renewable sources for heating
and cooling purposes by at least
one percentage point (of the
national final energy consump-
tion share) every year until 2030.
Article 24 opens rights of access to
local heating networks and coo-
ling systems to renewable energy
producers– which opens up signi-
ficant development prospects for
solar district heating. The sector
has given a warm welcome to this
legislative roadmap but market
players are waiting for the practi-
cal implementation of regulatory
and subsidy measures. n
Pa
ul
Lan
gr
oc
k

Socio-economic indicators
EUROBSERV ’ER – THE STATE OF RENEWABLE ENERGIES IN EUROPE – 2017 EDITIONEUROBSERV ’ER – THE STATE OF RENEWABLE ENERGIES IN EUROPE – 2017 EDITION
114 115
HYDROPOWER
For hydropower, the scope
of the analysis has changed
compared to last years’ method.
The new approach covers the
complete hydropower sector.
Large hydropower plants (with
an installed plant capacity of
more than 10 MW) as well as small
hydropower plants (10 MW and
below) are considered in the pro-
vided data. Roughly speaking, this
results in some tens of thousand
additional jobs throughout the
European Union compared to the
previous indicators which were
only related to small hydropower
plants activity.
EurObserv’ER reports a 2016 labor situation at around 75 900 jobs, down from an esti-
mated 94 800 jobs in 2015. For tur-
nover, the trend is similar with a
decrease from 9.5 to € 8.6 billion.
These results are mainly driven
by a decline observed in installa-
tion capacities, for large as well
as small hydro plants, in most
of the European Union Member
States. Although most suitable
hydropower sites are already uti-
lised and new constructions being
hindered by numerous regulation
constraints or environmental obs-
tacles, a minimum activity level is
maintained with the repowering of
the oldest plants.
Italy, Spain and France make
up the European top three in
terms of jobs. These countries
have in common significant ins-
talled capacities (around 20 GW
and more) combined with a quite
active hydropower industry.
Italy maintains its top slot in
hydropower for years both in
terms of installed capacity as well
as in socioeconomic impacts for its
economy. Estimated 2016 employ-
ment for small and large hydro-
power plants in Italy amounts to
13 400 persons and a turnover of € 1.8 billion (down from 19
100 jobs and up from € 1.5 billion),
a result from lower installation
activities. For Spain EurObserv’ER
reduces its estimate from 16 000 to 10 900 workers and € 1.5 to 1.1 billion turnover. France, on
the other hand, shows a stable
employment and turnover esti-
mate slightly above 10 thousand people employed and € 1.5 billion turnover. The German
estimate finds a reduction from
6 300 jobs in 2015 to 5 200 in 2016 with a small negative effect
on turnover (from € 0.8 to 0.7 bil-lion). These four countries toge-
ther represent more than half of
the 2016 hydropower employment
estimate for the European Union.
The future of hydropower activity
is much more in the side of small
plants sector rather than on the
largest dams. A comprehensive
roadmap has been compiled and
coordinated by ESHA (European
Small Hydropower Association).
The report reckons that installed
small hydropower capacity could
rise to 17.3 GW by 2020 yielding
59.7 TWh of energy generated,
which is higher than the NREAP
forecasts. Not surprisingly, the
most promising countries are
Italy, France, Spain, Austria,
Portugal, Romania and Greece.
However, this development over
the next five is also not assured as
it faces increasingly often to the
implementation of the Framework
Directive on water quality and
lack of political support. n
Jen
s S
ch
wa
rz
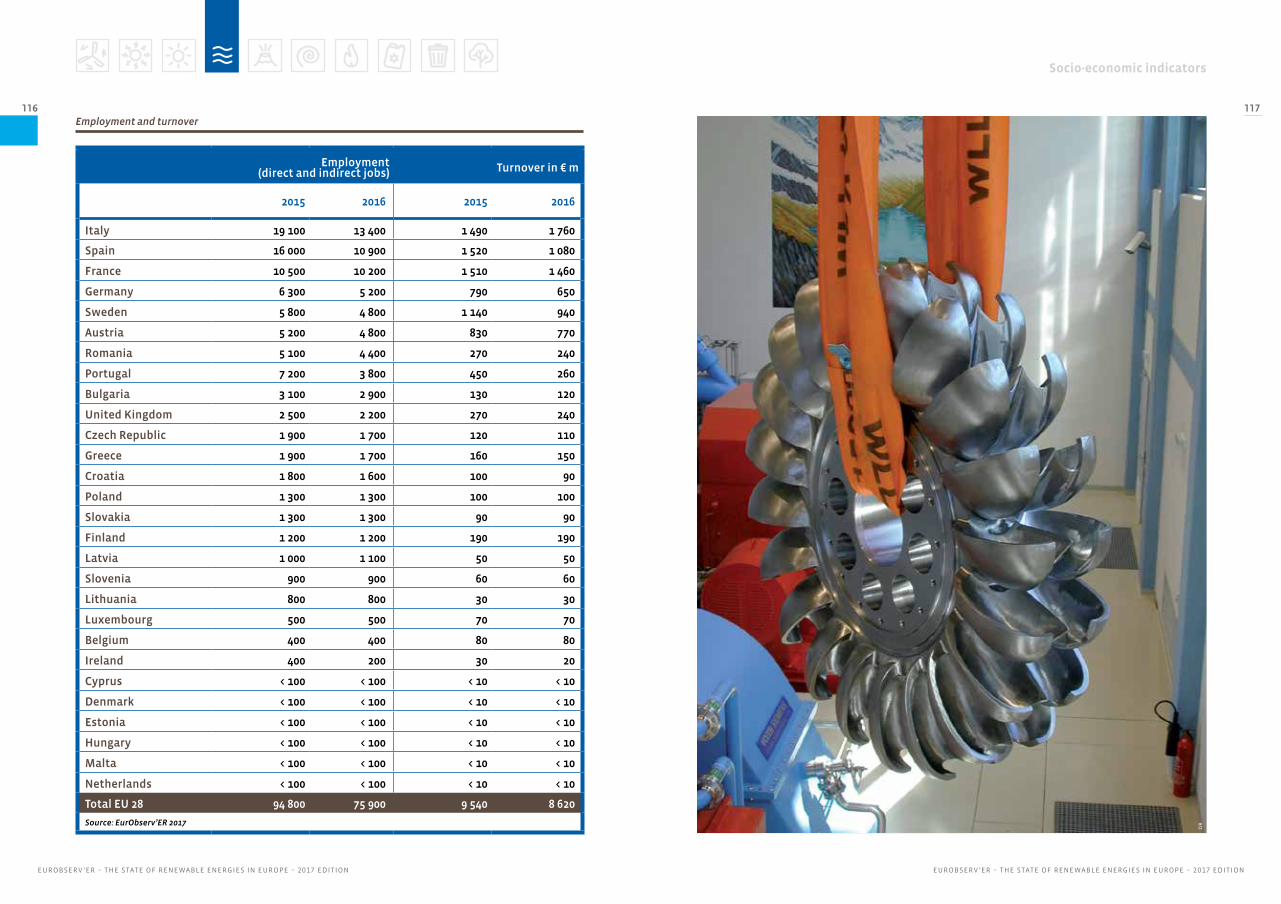
Socio-economic indicators
EUROBSERV ’ER – THE STATE OF RENEWABLE ENERGIES IN EUROPE – 2017 EDITIONEUROBSERV ’ER – THE STATE OF RENEWABLE ENERGIES IN EUROPE – 2017 EDITION
116 117Employment and turnover
Employment(direct and indirect jobs) Turnover in € m
2015 2016 2015 2016
Italy 19 100 13 400 1 490 1 760
Spain 16 000 10 900 1 520 1 080
France 10 500 10 200 1 510 1 460
Germany 6 300 5 200 790 650
Sweden 5 800 4 800 1 140 940
Austria 5 200 4 800 830 770
Romania 5 100 4 400 270 240
Portugal 7 200 3 800 450 260
Bulgaria 3 100 2 900 130 120
United Kingdom 2 500 2 200 270 240
Czech Republic 1 900 1 700 120 110
Greece 1 900 1 700 160 150
Croatia 1 800 1 600 100 90
Poland 1 300 1 300 100 100
Slovakia 1 300 1 300 90 90
Finland 1 200 1 200 190 190
Latvia 1 000 1 100 50 50
Slovenia 900 900 60 60
Lithuania 800 800 30 30
Luxembourg 500 500 70 70
Belgium 400 400 80 80
Ireland 400 200 30 20
Cyprus < 100 < 100 < 10 < 10
Denmark < 100 < 100 < 10 < 10
Estonia < 100 < 100 < 10 < 10
Hungary < 100 < 100 < 10 < 10
Malta < 100 < 100 < 10 < 10
Netherlands < 100 < 100 < 10 < 10
Total EU 28 94 800 75 900 9 540 8 620
Source: EurObserv’ER 2017
DR
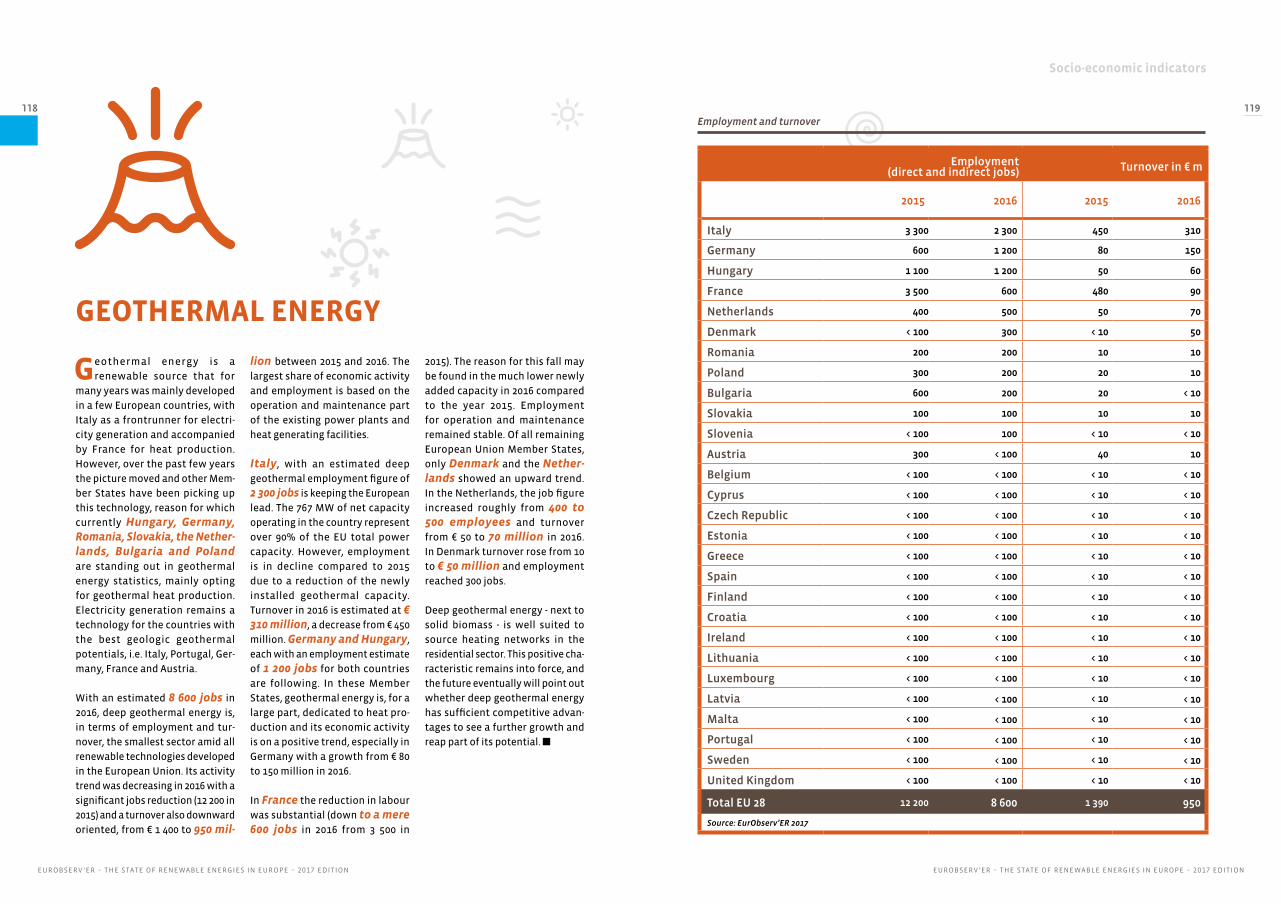
Socio-economic indicators
EUROBSERV ’ER – THE STATE OF RENEWABLE ENERGIES IN EUROPE – 2017 EDITIONEUROBSERV ’ER – THE STATE OF RENEWABLE ENERGIES IN EUROPE – 2017 EDITION
118 119
GEOTHERMAL ENERGY
Geothermal energy is a
renewable source that for
many years was mainly developed
in a few European countries, with
Italy as a frontrunner for electri-
city generation and accompanied
by France for heat production.
However, over the past few years
the picture moved and other Mem-
ber States have been picking up
this technology, reason for which
currently Hungary, Germany, Romania, Slovakia, the Nether-lands, Bulgaria and Poland
are standing out in geothermal
energy statistics, mainly opting
for geothermal heat production.
Electricity generation remains a
technology for the countries with
the best geologic geothermal
potentials, i.e. Italy, Portugal, Ger-
many, France and Austria.
With an estimated 8 600 jobs in
2016, deep geothermal energy is,
in terms of employment and tur-
nover, the smallest sector amid all
renewable technologies developed
in the European Union. Its activity
trend was decreasing in 2016 with a
significant jobs reduction (12 200 in
2015) and a turnover also downward
oriented, from € 1 400 to 950 mil-
Employment(direct and indirect jobs) Turnover in € m
2015 2016 2015 2016
Italy 3 300 2 300 450 310
Germany 600 1 200 80 150
Hungary 1 100 1 200 50 60
France 3 500 600 480 90
Netherlands 400 500 50 70
Denmark < 100 300 < 10 50
Romania 200 200 10 10
Poland 300 200 20 10
Bulgaria 600 200 20 < 10
Slovakia 100 100 10 10
Slovenia < 100 100 < 10 < 10
Austria 300 < 100 40 10
Belgium < 100 < 100 < 10 < 10
Cyprus < 100 < 100 < 10 < 10
Czech Republic < 100 < 100 < 10 < 10
Estonia < 100 < 100 < 10 < 10
Greece < 100 < 100 < 10 < 10
Spain < 100 < 100 < 10 < 10
Finland < 100 < 100 < 10 < 10
Croatia < 100 < 100 < 10 < 10
Ireland < 100 < 100 < 10 < 10
Lithuania < 100 < 100 < 10 < 10
Luxembourg < 100 < 100 < 10 < 10
Latvia < 100 < 100 < 10 < 10
Malta < 100 < 100 < 10 < 10
Portugal < 100 < 100 < 10 < 10
Sweden < 100 < 100 < 10 < 10
United Kingdom < 100 < 100 < 10 < 10
Total EU 28 12 200 8 600 1 390 950
Source: EurObserv’ER 2017
Employment and turnover
lion between 2015 and 2016. The
largest share of economic activity
and employment is based on the
operation and maintenance part
of the existing power plants and
heat generating facilities.
Italy, with an estimated deep
geothermal employment figure of
2 300 jobs is keeping the European
lead. The 767 MW of net capacity
operating in the country represent
over 90% of the EU total power
capacity. However, employment
is in decline compared to 2015
due to a reduction of the newly
installed geothermal capacity.
Turnover in 2016 is estimated at € 310 million, a decrease from € 450
million. Germany and Hungary,
each with an employment estimate
of 1 200 jobs for both countries
are following. In these Member
States, geothermal energy is, for a
large part, dedicated to heat pro-
duction and its economic activity
is on a positive trend, especially in
Germany with a growth from € 80
to 150 million in 2016.
In France the reduction in labour
was substantial (down to a mere 600 jobs in 2016 from 3 500 in
2015). The reason for this fall may
be found in the much lower newly
added capacity in 2016 compared
to the year 2015. Employment
for operation and maintenance
remained stable. Of all remaining
European Union Member States,
only Denmark and the Nether-lands showed an upward trend.
In the Netherlands, the job figure
increased roughly from 400 to 500 employees and turnover
from € 50 to 70 million in 2016.
In Denmark turnover rose from 10
to € 50 million and employment
reached 300 jobs.
Deep geothermal energy - next to
solid biomass - is well suited to
source heating networks in the
residential sector. This positive cha-
racteristic remains into force, and
the future eventually will point out
whether deep geothermal energy
has sufficient competitive advan-
tages to see a further growth and
reap part of its potential. n
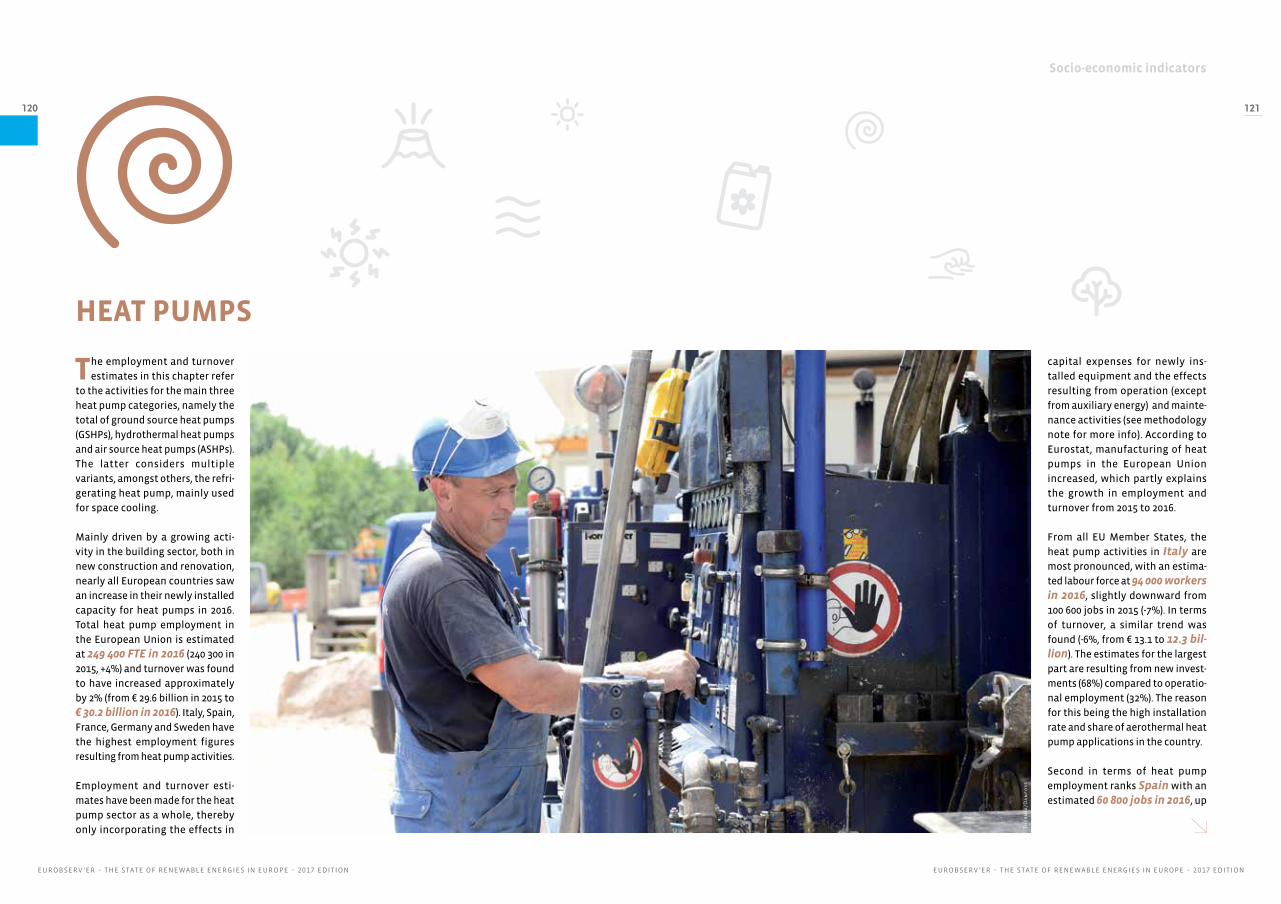
Socio-economic indicators
EUROBSERV ’ER – THE STATE OF RENEWABLE ENERGIES IN EUROPE – 2017 EDITIONEUROBSERV ’ER – THE STATE OF RENEWABLE ENERGIES IN EUROPE – 2017 EDITION
120 121
HEAT PUMPS
The employment and turnover
estimates in this chapter refer
to the activities for the main three
heat pump categories, namely the
total of ground source heat pumps
(GSHPs), hydrothermal heat pumps
and air source heat pumps (ASHPs).
The latter considers multiple
variants, amongst others, the refri-
gerating heat pump, mainly used
for space cooling.
Mainly driven by a growing acti-
vity in the building sector, both in
new construction and renovation,
nearly all European countries saw
an increase in their newly installed
capacity for heat pumps in 2016.
Total heat pump employment in
the European Union is estimated
at 249 400 FTE in 2016 (240 300 in
2015, +4%) and turnover was found
to have increased approximately
by 2% (from € 29.6 billion in 2015 to
€ 30.2 billion in 2016). Italy, Spain,
France, Germany and Sweden have
the highest employment figures
resulting from heat pump activities.
Employment and turnover esti-
mates have been made for the heat
pump sector as a whole, thereby
only incorporating the effects in
capital expenses for newly ins-
talled equipment and the effects
resulting from operation (except
from auxiliary energy) and mainte-
nance activities (see methodology
note for more info). According to
Eurostat, manufacturing of heat
pumps in the European Union
increased, which partly explains
the growth in employment and
turnover from 2015 to 2016.
From all EU Member States, the
heat pump activities in Italy are
most pronounced, with an estima-
ted labour force at 94 000 workers in 2016, slightly downward from
100 600 jobs in 2015 (-7%). In terms
of turnover, a similar trend was
found (-6%, from € 13.1 to 12.3 bil-lion). The estimates for the largest
part are resulting from new invest-
ments (68%) compared to operatio-
nal employment (32%). The reason
for this being the high installation
rate and share of aerothermal heat
pump applications in the country.
Second in terms of heat pump
employment ranks Spain with an
estimated 60 800 jobs in 2016, up
Th
erm
ia/D
an
foss
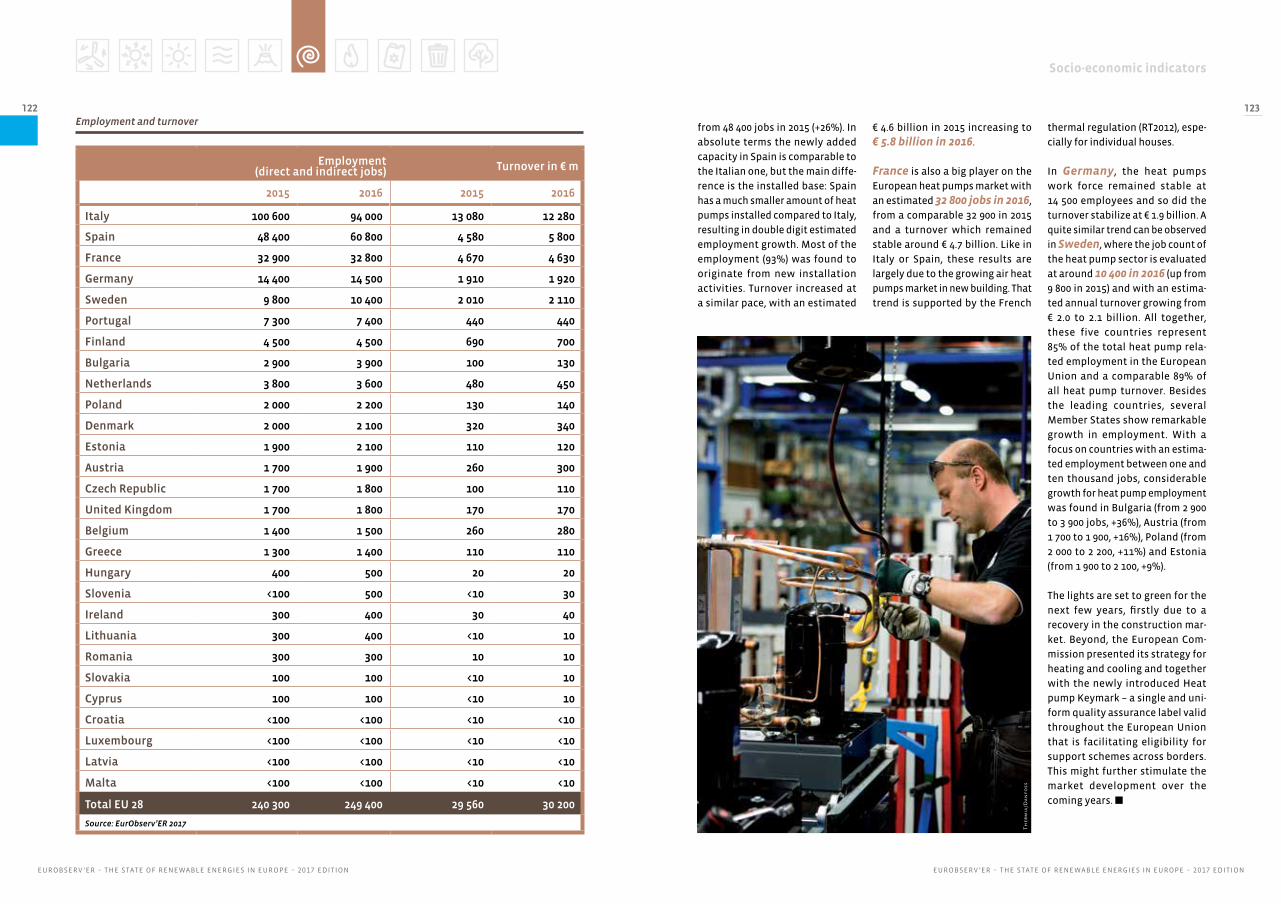
Socio-economic indicators
EUROBSERV ’ER – THE STATE OF RENEWABLE ENERGIES IN EUROPE – 2017 EDITIONEUROBSERV ’ER – THE STATE OF RENEWABLE ENERGIES IN EUROPE – 2017 EDITION
122 123
Employment(direct and indirect jobs) Turnover in € m
2015 2016 2015 2016
Italy 100 600 94 000 13 080 12 280
Spain 48 400 60 800 4 580 5 800
France 32 900 32 800 4 670 4 630
Germany 14 400 14 500 1 910 1 920
Sweden 9 800 10 400 2 010 2 110
Portugal 7 300 7 400 440 440
Finland 4 500 4 500 690 700
Bulgaria 2 900 3 900 100 130
Netherlands 3 800 3 600 480 450
Poland 2 000 2 200 130 140
Denmark 2 000 2 100 320 340
Estonia 1 900 2 100 110 120
Austria 1 700 1 900 260 300
Czech Republic 1 700 1 800 100 110
United Kingdom 1 700 1 800 170 170
Belgium 1 400 1 500 260 280
Greece 1 300 1 400 110 110
Hungary 400 500 20 20
Slovenia <100 500 <10 30
Ireland 300 400 30 40
Lithuania 300 400 <10 10
Romania 300 300 10 10
Slovakia 100 100 <10 10
Cyprus 100 100 <10 10
Croatia <100 <100 <10 <10
Luxembourg <100 <100 <10 <10
Latvia <100 <100 <10 <10
Malta <100 <100 <10 <10
Total EU 28 240 300 249 400 29 560 30 200
Source: EurObserv’ER 2017
Employment and turnoverfrom 48 400 jobs in 2015 (+26%). In
absolute terms the newly added
capacity in Spain is comparable to
the Italian one, but the main diffe-
rence is the installed base: Spain
has a much smaller amount of heat
pumps installed compared to Italy,
resulting in double digit estimated
employment growth. Most of the
employment (93%) was found to
originate from new installation
activities. Turnover increased at
a similar pace, with an estimated
€ 4.6 billion in 2015 increasing to
€ 5.8 billion in 2016.
France is also a big player on the
European heat pumps market with
an estimated 32 800 jobs in 2016,
from a comparable 32 900 in 2015
and a turnover which remained
stable around € 4.7 billion. Like in
Italy or Spain, these results are
largely due to the growing air heat
pumps market in new building. That
trend is supported by the French
thermal regulation (RT2012), espe-
cially for individual houses.
In Germany, the heat pumps
work force remained stable at
14 500 employees and so did the
turnover stabilize at € 1.9 billion. A
quite similar trend can be observed
in Sweden, where the job count of
the heat pump sector is evaluated
at around 10 400 in 2016 (up from
9 800 in 2015) and with an estima-
ted annual turnover growing from
€ 2.0 to 2.1 billion. All together,
these five countries represent
85% of the total heat pump rela-
ted employment in the European
Union and a comparable 89% of
all heat pump turnover. Besides
the leading countries, several
Member States show remarkable
growth in employment. With a
focus on countries with an estima-
ted employment between one and
ten thousand jobs, considerable
growth for heat pump employment
was found in Bulgaria (from 2 900
to 3 900 jobs, +36%), Austria (from
1 700 to 1 900, +16%), Poland (from
2 000 to 2 200, +11%) and Estonia
(from 1 900 to 2 100, +9%).
The lights are set to green for the
next few years, firstly due to a
recovery in the construction mar-
ket. Beyond, the European Com-
mission presented its strategy for
heating and cooling and together
with the newly introduced Heat
pump Keymark – a single and uni-
form quality assurance label valid
throughout the European Union
that is facilitating eligibility for
support schemes across borders.
This might further stimulate the
market development over the
coming years. n
Th
erm
ia/D
an
foss
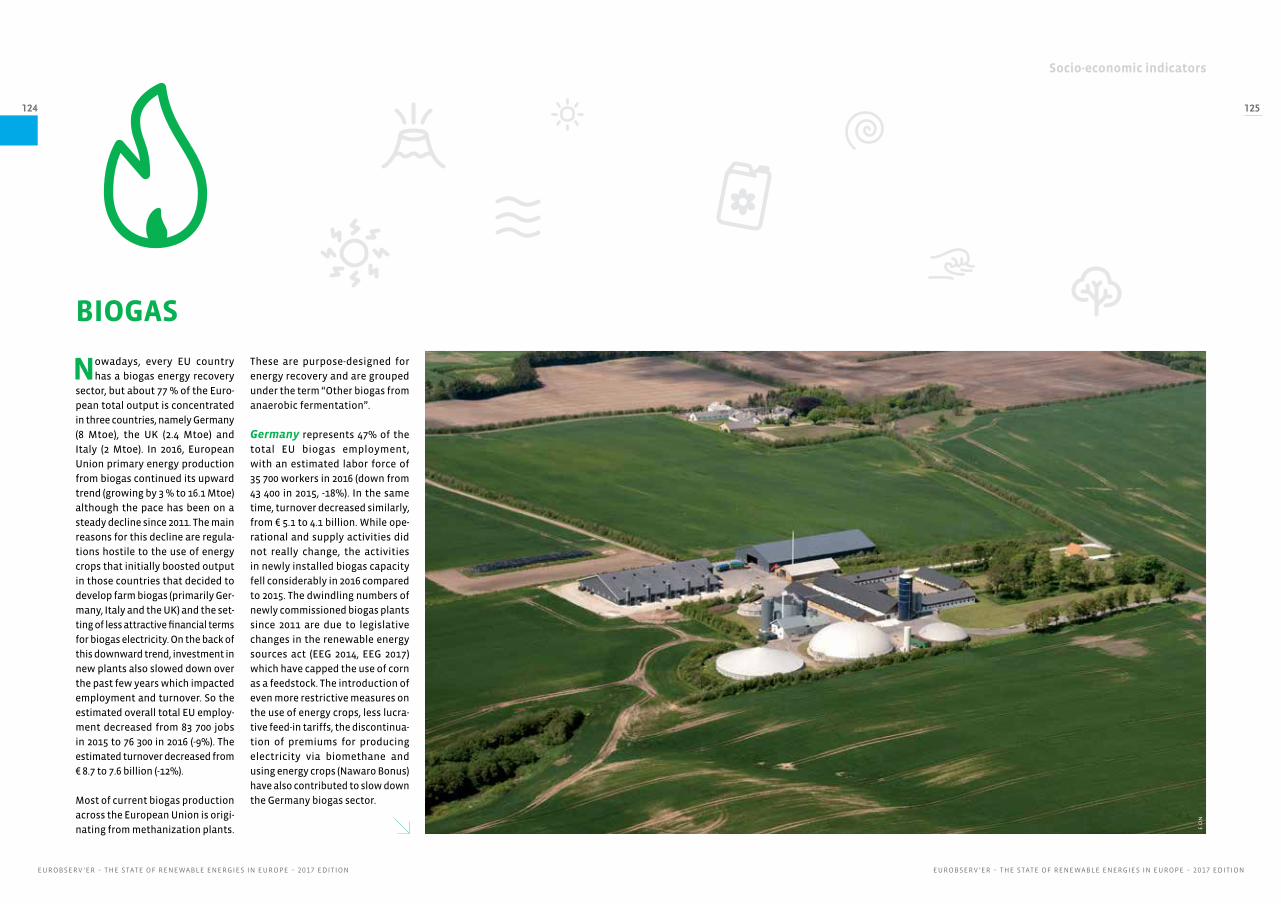
Socio-economic indicators
EUROBSERV ’ER – THE STATE OF RENEWABLE ENERGIES IN EUROPE – 2017 EDITIONEUROBSERV ’ER – THE STATE OF RENEWABLE ENERGIES IN EUROPE – 2017 EDITION
124 125
Nowadays, every EU country
has a biogas energy recovery
sector, but about 77 % of the Euro-
pean total output is concentrated
in three countries, namely Germany
(8 Mtoe), the UK (2.4 Mtoe) and
Italy (2 Mtoe). In 2016, European
Union primary energy production
from biogas continued its upward
trend (growing by 3 % to 16.1 Mtoe)
although the pace has been on a
steady decline since 2011. The main
reasons for this decline are regula-
tions hostile to the use of energy
crops that initially boosted output
in those countries that decided to
develop farm biogas (primarily Ger-
many, Italy and the UK) and the set-
ting of less attractive financial terms
for biogas electricity. On the back of
this downward trend, investment in
new plants also slowed down over
the past few years which impacted
employment and turnover. So the
estimated overall total EU employ-
ment decreased from 83 700 jobs
in 2015 to 76 300 in 2016 (-9%). The
estimated turnover decreased from
€ 8.7 to 7.6 billion (-12%).
Most of current biogas production
across the European Union is origi-
nating from methanization plants.
BIOGAS
These are purpose-designed for
energy recovery and are grouped
under the term “Other biogas from
anaerobic fermentation”.
Germany represents 47% of the
total EU biogas employment,
with an estimated labor force of
35 700 workers in 2016 (down from
43 400 in 2015, -18%). In the same
time, turnover decreased similarly,
from € 5.1 to 4.1 billion. While ope-
rational and supply activities did
not really change, the activities
in newly installed biogas capacity
fell considerably in 2016 compared
to 2015. The dwindling numbers of
newly commissioned biogas plants
since 2011 are due to legislative
changes in the renewable energy
sources act (EEG 2014, EEG 2017)
which have capped the use of corn
as a feedstock. The introduction of
even more restrictive measures on
the use of energy crops, less lucra-
tive feed-in tariffs, the discontinua-
tion of premiums for producing
electricity via biomethane and
using energy crops (Nawaro Bonus)
have also contributed to slow down
the Germany biogas sector.
E.O
N
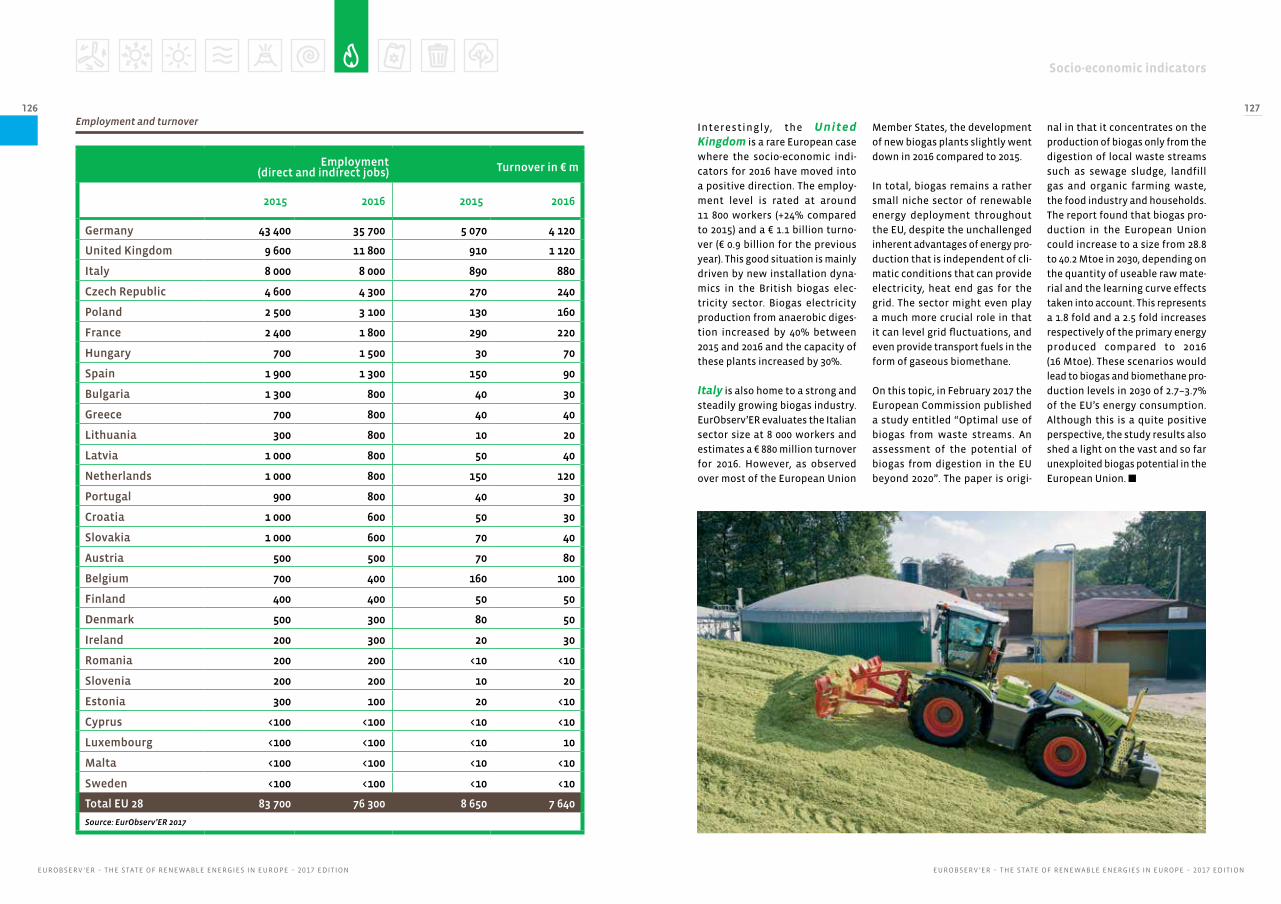
Socio-economic indicators
EUROBSERV ’ER – THE STATE OF RENEWABLE ENERGIES IN EUROPE – 2017 EDITIONEUROBSERV ’ER – THE STATE OF RENEWABLE ENERGIES IN EUROPE – 2017 EDITION
126 127
Employment(direct and indirect jobs) Turnover in € m
2015 2016 2015 2016
Germany 43 400 35 700 5 070 4 120
United Kingdom 9 600 11 800 910 1 120
Italy 8 000 8 000 890 880
Czech Republic 4 600 4 300 270 240
Poland 2 500 3 100 130 160
France 2 400 1 800 290 220
Hungary 700 1 500 30 70
Spain 1 900 1 300 150 90
Bulgaria 1 300 800 40 30
Greece 700 800 40 40
Lithuania 300 800 10 20
Latvia 1 000 800 50 40
Netherlands 1 000 800 150 120
Portugal 900 800 40 30
Croatia 1 000 600 50 30
Slovakia 1 000 600 70 40
Austria 500 500 70 80
Belgium 700 400 160 100
Finland 400 400 50 50
Denmark 500 300 80 50
Ireland 200 300 20 30
Romania 200 200 <10 <10
Slovenia 200 200 10 20
Estonia 300 100 20 <10
Cyprus <100 <100 <10 <10
Luxembourg <100 <100 <10 10
Malta <100 <100 <10 <10
Sweden <100 <100 <10 <10
Total EU 28 83 700 76 300 8 650 7 640
Source: EurObserv’ER 2017
Employment and turnoverInterestingly, the United Kingdom is a rare European case
where the socio-economic indi-
cators for 2016 have moved into
a positive direction. The employ-
ment level is rated at around
11 800 workers (+24% compared
to 2015) and a € 1.1 billion turno-
ver (€ 0.9 billion for the previous
year). This good situation is mainly
driven by new installation dyna-
mics in the British biogas elec-
tricity sector. Biogas electricity
production from anaerobic diges-
tion increased by 40% between
2015 and 2016 and the capacity of
these plants increased by 30%.
Italy is also home to a strong and
steadily growing biogas industry.
EurObserv’ER evaluates the Italian
sector size at 8 000 workers and
estimates a € 880 million turnover
for 2016. However, as observed
over most of the European Union
Member States, the development
of new biogas plants slightly went
down in 2016 compared to 2015.
In total, biogas remains a rather
small niche sector of renewable
energy deployment throughout
the EU, despite the unchallenged
inherent advantages of energy pro-
duction that is independent of cli-
matic conditions that can provide
electricity, heat end gas for the
grid. The sector might even play
a much more crucial role in that
it can level grid fluctuations, and
even provide transport fuels in the
form of gaseous biomethane.
On this topic, in February 2017 the
European Commission published
a study entitled “Optimal use of
biogas from waste streams. An
assessment of the potential of
biogas from digestion in the EU
beyond 2020”. The paper is origi-
nal in that it concentrates on the
production of biogas only from the
digestion of local waste streams
such as sewage sludge, landfill
gas and organic farming waste,
the food industry and households.
The report found that biogas pro-
duction in the European Union
could increase to a size from 28.8
to 40.2 Mtoe in 2030, depending on
the quantity of useable raw mate-
rial and the learning curve effects
taken into account. This represents
a 1.8 fold and a 2.5 fold increases
respectively of the primary energy
produced compared to 2016
(16 Mtoe). These scenarios would
lead to biogas and biomethane pro-
duction levels in 2030 of 2.7–3.7%
of the EU’s energy consumption.
Although this is a quite positive
perspective, the study results also
shed a light on the vast and so far
unexploited biogas potential in the
European Union. n
Bio
ga
z ©
Cla
as
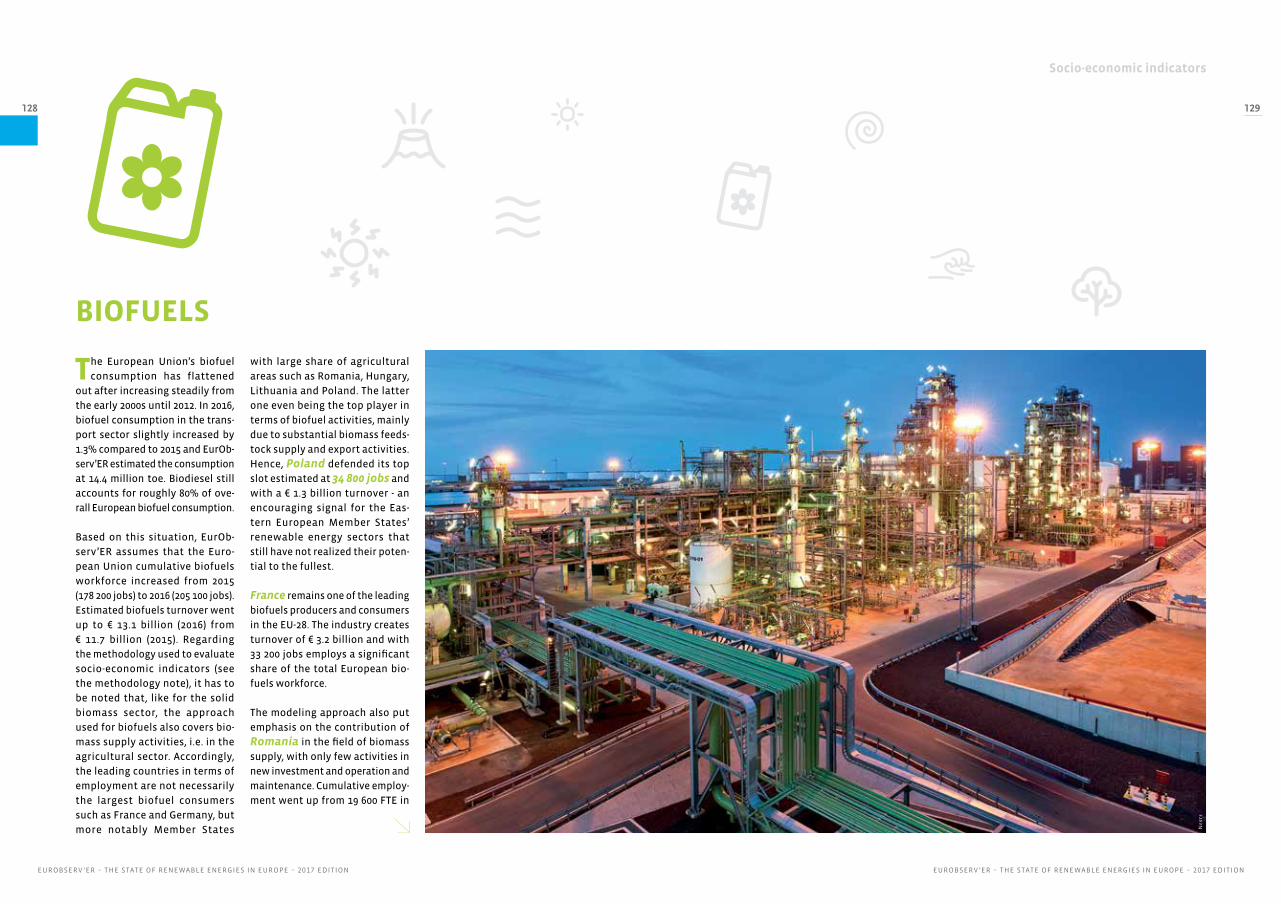
Socio-economic indicators
EUROBSERV ’ER – THE STATE OF RENEWABLE ENERGIES IN EUROPE – 2017 EDITIONEUROBSERV ’ER – THE STATE OF RENEWABLE ENERGIES IN EUROPE – 2017 EDITION
128 129
The European Union’s biofuel
consumption has flattened
out after increasing steadily from
the early 2000s until 2012. In 2016,
biofuel consumption in the trans-
port sector slightly increased by
1.3% compared to 2015 and EurOb-
serv’ER estimated the consumption
at 14.4 million toe. Biodiesel still
accounts for roughly 80% of ove-
rall European biofuel consumption.
Based on this situation, EurOb-
serv’ER assumes that the Euro-
pean Union cumulative biofuels
workforce increased from 2015
(178 200 jobs) to 2016 (205 100 jobs).
Estimated biofuels turnover went
up to € 13.1 billion (2016) from
€ 11.7 billion (2015). Regarding
the methodology used to evaluate
socio-economic indicators (see
the methodology note), it has to
be noted that, like for the solid
biomass sector, the approach
used for biofuels also covers bio-
mass supply activities, i.e. in the
agricultural sector. Accordingly,
the leading countries in terms of
employment are not necessarily
the largest biofuel consumers
such as France and Germany, but
more notably Member States
with large share of agricultural
areas such as Romania, Hungary,
Lithuania and Poland. The latter
one even being the top player in
terms of biofuel activities, mainly
due to substantial biomass feeds-
tock supply and export activities.
Hence, Poland defended its top
slot estimated at 34 800 jobs and
with a € 1.3 billion turnover - an
encouraging signal for the Eas-
tern European Member States’
renewable energy sectors that
still have not realized their poten-
tial to the fullest.
France remains one of the leading
biofuels producers and consumers
in the EU-28. The industry creates
turnover of € 3.2 billion and with
33 200 jobs employs a significant
share of the total European bio-
fuels workforce.
The modeling approach also put
emphasis on the contribution of
Romania in the field of biomass
supply, with only few activities in
new investment and operation and
maintenance. Cumulative employ-
ment went up from 19 600 FTE in
BIOFUELS
Nes
te
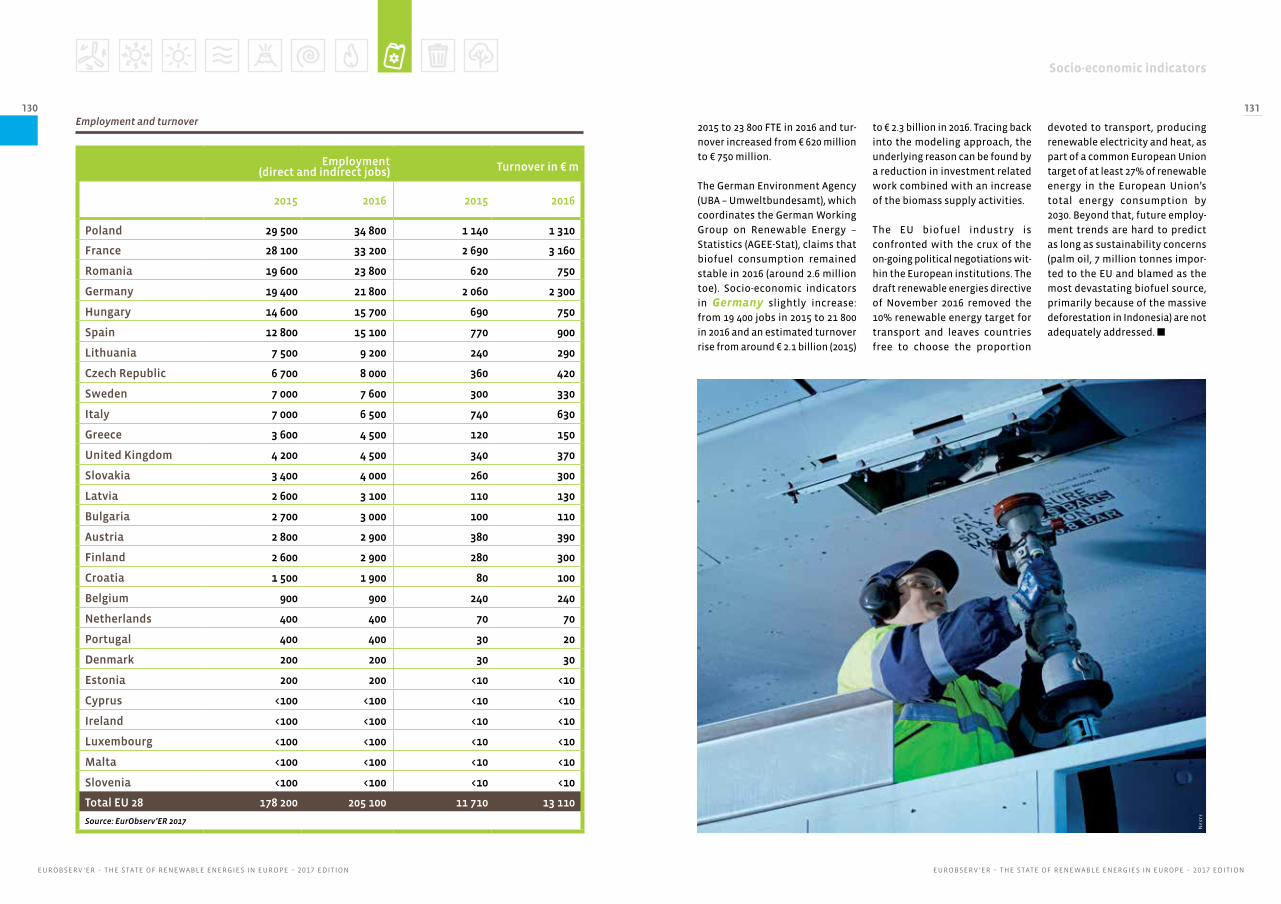
Socio-economic indicators
EUROBSERV ’ER – THE STATE OF RENEWABLE ENERGIES IN EUROPE – 2017 EDITIONEUROBSERV ’ER – THE STATE OF RENEWABLE ENERGIES IN EUROPE – 2017 EDITION
130 131
Employment(direct and indirect jobs) Turnover in € m
2015 2016 2015 2016
Poland 29 500 34 800 1 140 1 310
France 28 100 33 200 2 690 3 160
Romania 19 600 23 800 620 750
Germany 19 400 21 800 2 060 2 300
Hungary 14 600 15 700 690 750
Spain 12 800 15 100 770 900
Lithuania 7 500 9 200 240 290
Czech Republic 6 700 8 000 360 420
Sweden 7 000 7 600 300 330
Italy 7 000 6 500 740 630
Greece 3 600 4 500 120 150
United Kingdom 4 200 4 500 340 370
Slovakia 3 400 4 000 260 300
Latvia 2 600 3 100 110 130
Bulgaria 2 700 3 000 100 110
Austria 2 800 2 900 380 390
Finland 2 600 2 900 280 300
Croatia 1 500 1 900 80 100
Belgium 900 900 240 240
Netherlands 400 400 70 70
Portugal 400 400 30 20
Denmark 200 200 30 30
Estonia 200 200 <10 <10
Cyprus <100 <100 <10 <10
Ireland <100 <100 <10 <10
Luxembourg <100 <100 <10 <10
Malta <100 <100 <10 <10
Slovenia <100 <100 <10 <10
Total EU 28 178 200 205 100 11 710 13 110
Source: EurObserv’ER 2017
Employment and turnover
Nes
te
2015 to 23 800 FTE in 2016 and tur-
nover increased from € 620 million
to € 750 million.
The German Environment Agency
(UBA – Umweltbundesamt), which
coordinates the German Working
Group on Renewable Energy –
Statistics (AGEE-Stat), claims that
biofuel consumption remained
stable in 2016 (around 2.6 million
toe). Socio-economic indicators
in Germany slightly increase:
from 19 400 jobs in 2015 to 21 800
in 2016 and an estimated turnover
rise from around € 2.1 billion (2015)
to € 2.3 billion in 2016. Tracing back
into the modeling approach, the
underlying reason can be found by
a reduction in investment related
work combined with an increase
of the biomass supply activities.
The EU biofuel industry is
confronted with the crux of the
on-going political negotiations wit-
hin the European institutions. The
draft renewable energies directive
of November 2016 removed the
10% renewable energy target for
transport and leaves countries
free to choose the proportion
devoted to transport, producing
renewable electricity and heat, as
part of a common European Union
target of at least 27% of renewable
energy in the European Union’s
total energy consumption by
2030. Beyond that, future employ-
ment trends are hard to predict
as long as sustainability concerns
(palm oil, 7 million tonnes impor-
ted to the EU and blamed as the
most devastating biofuel source,
primarily because of the massive
deforestation in Indonesia) are not
adequately addressed. n
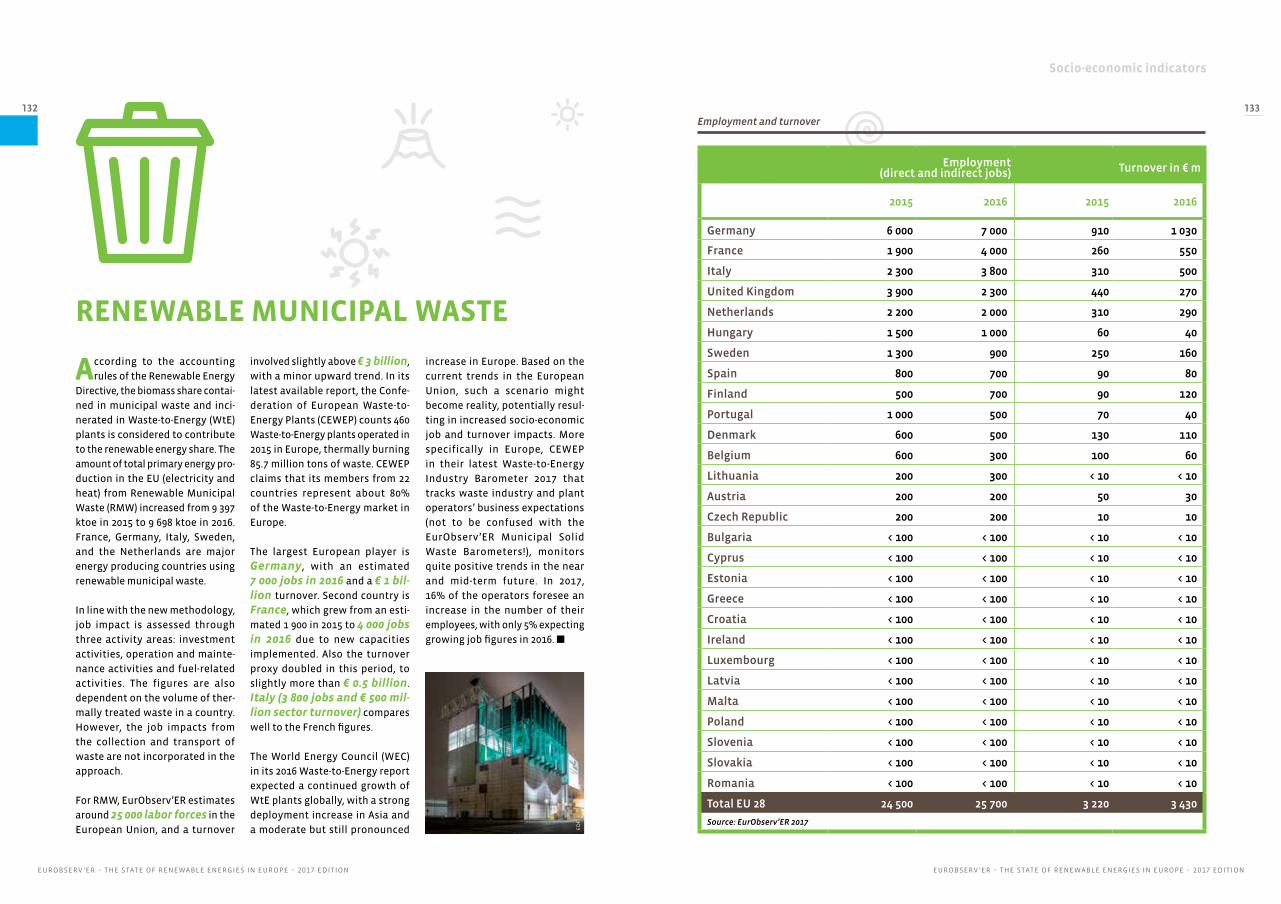
Socio-economic indicators
EUROBSERV ’ER – THE STATE OF RENEWABLE ENERGIES IN EUROPE – 2017 EDITIONEUROBSERV ’ER – THE STATE OF RENEWABLE ENERGIES IN EUROPE – 2017 EDITION
132 133
RENEWABLE MUNICIPAL WASTE
According to the accounting
rules of the Renewable Energy
Directive, the biomass share contai-
ned in municipal waste and inci-
nerated in Waste-to-Energy (WtE)
plants is considered to contribute
to the renewable energy share. The
amount of total primary energy pro-
duction in the EU (electricity and
heat) from Renewable Municipal
Waste (RMW) increased from 9 397
ktoe in 2015 to 9 698 ktoe in 2016.
France, Germany, Italy, Sweden,
and the Netherlands are major
energy producing countries using
renewable municipal waste.
In line with the new methodology,
job impact is assessed through
three activity areas: investment
activities, operation and mainte-
nance activities and fuel-related
activities. The figures are also
dependent on the volume of ther-
mally treated waste in a country.
However, the job impacts from
the collection and transport of
waste are not incorporated in the
approach.
For RMW, EurObserv’ER estimates
around 25 000 labor forces in the
European Union, and a turnover
involved slightly above € 3 billion,
with a minor upward trend. In its
latest available report, the Confe-
deration of European Waste-to-
Energy Plants (CEWEP) counts 460
Waste-to-Energy plants operated in
2015 in Europe, thermally burning
85.7 million tons of waste. CEWEP
claims that its members from 22
countries represent about 80%
of the Waste-to-Energy market in
Europe.
The largest European player is
Germany, with an estimated
7 000 jobs in 2016 and a € 1 bil-lion turnover. Second country is
France, which grew from an esti-
mated 1 900 in 2015 to 4 000 jobs in 2016 due to new capacities
implemented. Also the turnover
proxy doubled in this period, to
slightly more than € 0.5 billion.
Italy (3 800 jobs and € 500 mil-lion sector turnover) compares
well to the French figures.
The World Energy Council (WEC)
in its 2016 Waste-to-Energy report
expected a continued growth of
WtE plants globally, with a strong
deployment increase in Asia and
a moderate but still pronounced
increase in Europe. Based on the
current trends in the European
Union, such a scenario might
become reality, potentially resul-
ting in increased socio-economic
job and turnover impacts. More
specifically in Europe, CEWEP
in their latest Waste-to-Energy
Industry Barometer 2017 that
tracks waste industry and plant
operators’ business expectations
(not to be confused with the
EurObserv’ER Municipal Solid
Waste Barometers!), monitors
quite positive trends in the near
and mid-term future. In 2017,
16% of the operators foresee an
increase in the number of their
employees, with only 5% expecting
growing job figures in 2016. n
Employment(direct and indirect jobs) Turnover in € m
2015 2016 2015 2016
Germany 6 000 7 000 910 1 030
France 1 900 4 000 260 550
Italy 2 300 3 800 310 500
United Kingdom 3 900 2 300 440 270
Netherlands 2 200 2 000 310 290
Hungary 1 500 1 000 60 40
Sweden 1 300 900 250 160
Spain 800 700 90 80
Finland 500 700 90 120
Portugal 1 000 500 70 40
Denmark 600 500 130 110
Belgium 600 300 100 60
Lithuania 200 300 < 10 < 10
Austria 200 200 50 30
Czech Republic 200 200 10 10
Bulgaria < 100 < 100 < 10 < 10
Cyprus < 100 < 100 < 10 < 10
Estonia < 100 < 100 < 10 < 10
Greece < 100 < 100 < 10 < 10
Croatia < 100 < 100 < 10 < 10
Ireland < 100 < 100 < 10 < 10
Luxembourg < 100 < 100 < 10 < 10
Latvia < 100 < 100 < 10 < 10
Malta < 100 < 100 < 10 < 10
Poland < 100 < 100 < 10 < 10
Slovenia < 100 < 100 < 10 < 10
Slovakia < 100 < 100 < 10 < 10
Romania < 100 < 100 < 10 < 10
Total EU 28 24 500 25 700 3 220 3 430
Source: EurObserv’ER 2017
Employment and turnover
ED
F
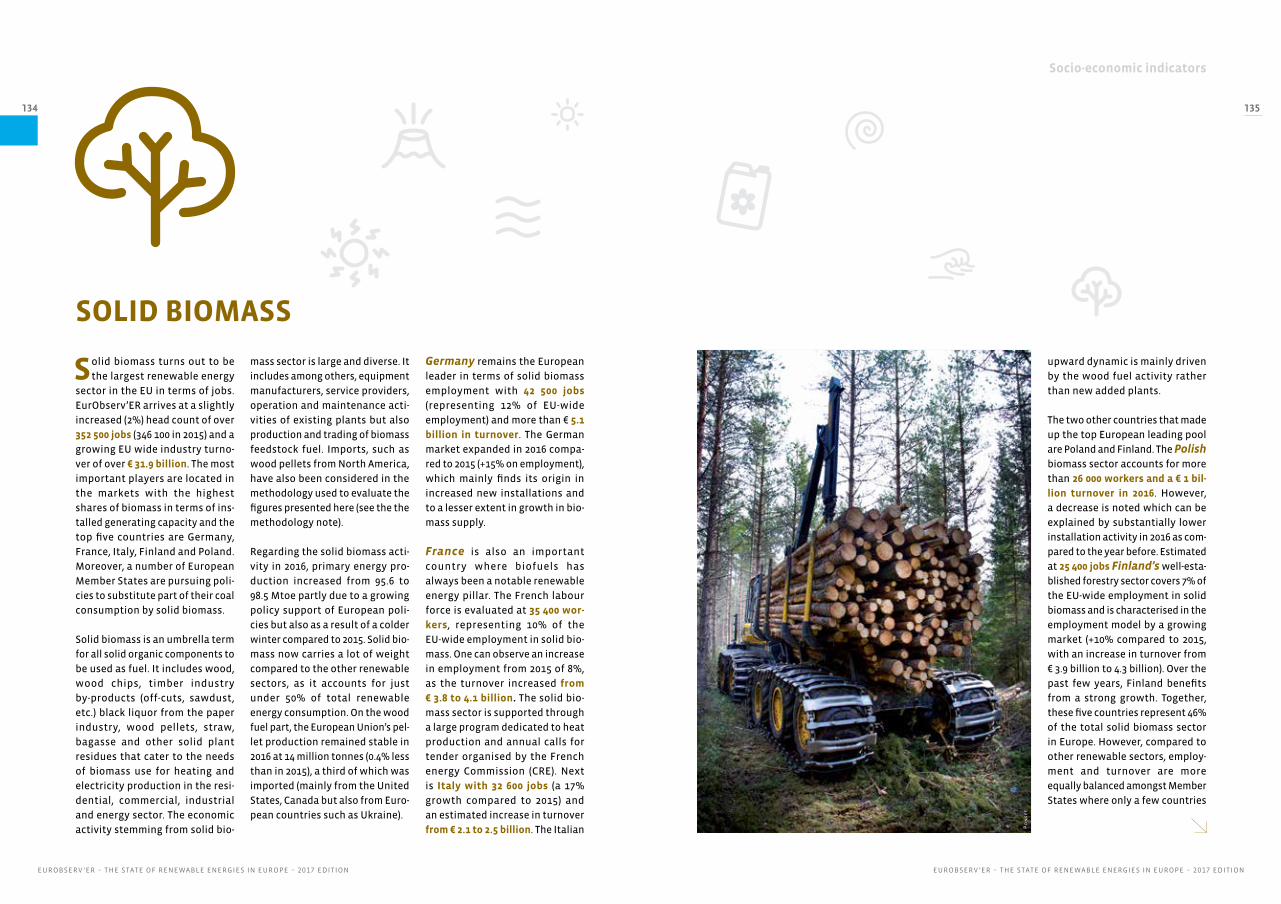
Socio-economic indicators
EUROBSERV ’ER – THE STATE OF RENEWABLE ENERGIES IN EUROPE – 2017 EDITIONEUROBSERV ’ER – THE STATE OF RENEWABLE ENERGIES IN EUROPE – 2017 EDITION
134 135
Solid biomass turns out to be
the largest renewable energy
sector in the EU in terms of jobs.
EurObserv’ER arrives at a slightly
increased (2%) head count of over
352 500 jobs (346 100 in 2015) and a
growing EU wide industry turno-
ver of over € 31.9 billion. The most
important players are located in
the markets with the highest
shares of biomass in terms of ins-
talled generating capacity and the
top five countries are Germany,
France, Italy, Finland and Poland.
Moreover, a number of European
Member States are pursuing poli-
cies to substitute part of their coal
consumption by solid biomass.
Solid biomass is an umbrella term
for all solid organic components to
be used as fuel. It includes wood,
wood chips, timber industry
by-products (off-cuts, sawdust,
etc.) black liquor from the paper
industry, wood pellets, straw,
bagasse and other solid plant
residues that cater to the needs
of biomass use for heating and
electricity production in the resi-
dential, commercial, industrial
and energy sector. The economic
activity stemming from solid bio-
SOLID BIOMASS
upward dynamic is mainly driven
by the wood fuel activity rather
than new added plants.
The two other countries that made
up the top European leading pool
are Poland and Finland. The Polish
biomass sector accounts for more
than 26 000 workers and a € 1 bil-
lion turnover in 2016. However,
a decrease is noted which can be
explained by substantially lower
installation activity in 2016 as com-
pared to the year before. Estimated
at 25 400 jobs Finland’s well-esta-
blished forestry sector covers 7% of
the EU-wide employment in solid
biomass and is characterised in the
employment model by a growing
market (+10% compared to 2015,
with an increase in turnover from
€ 3.9 billion to 4.3 billion). Over the
past few years, Finland benefits
from a strong growth. Together,
these five countries represent 46%
of the total solid biomass sector
in Europe. However, compared to
other renewable sectors, employ-
ment and turnover are more
equally balanced amongst Member
States where only a few countries
mass sector is large and diverse. It
includes among others, equipment
manufacturers, service providers,
operation and maintenance acti-
vities of existing plants but also
production and trading of biomass
feedstock fuel. Imports, such as
wood pellets from North America,
have also been considered in the
methodology used to evaluate the
figures presented here (see the the
methodology note).
Regarding the solid biomass acti-
vity in 2016, primary energy pro-
duction increased from 95.6 to
98.5 Mtoe partly due to a growing
policy support of European poli-
cies but also as a result of a colder
winter compared to 2015. Solid bio-
mass now carries a lot of weight
compared to the other renewable
sectors, as it accounts for just
under 50% of total renewable
energy consumption. On the wood
fuel part, the European Union’s pel-
let production remained stable in
2016 at 14 million tonnes (0.4% less
than in 2015), a third of which was
imported (mainly from the United
States, Canada but also from Euro-
pean countries such as Ukraine).
Germany remains the European
leader in terms of solid biomass
employment with 42 500 jobs
(representing 12% of EU-wide
employment) and more than € 5.1
billion in turnover. The German
market expanded in 2016 compa-
red to 2015 (+15% on employment),
which mainly finds its origin in
increased new installations and
to a lesser extent in growth in bio-
mass supply.
France is also an important
country where biofuels has
always been a notable renewable
energy pillar. The French labour
force is evaluated at 35 400 wor-
kers, representing 10% of the
EU-wide employment in solid bio-
mass. One can observe an increase
in employment from 2015 of 8%,
as the turnover increased from
€ 3.8 to 4.1 billion. The solid bio-
mass sector is supported through
a large program dedicated to heat
production and annual calls for
tender organised by the French
energy Commission (CRE). Next
is Italy with 32 600 jobs (a 17%
growth compared to 2015) and
an estimated increase in turnover
from € 2.1 to 2.5 billion. The Italian Po
nse
e

Socio-economic indicators
EUROBSERV ’ER – THE STATE OF RENEWABLE ENERGIES IN EUROPE – 2017 EDITIONEUROBSERV ’ER – THE STATE OF RENEWABLE ENERGIES IN EUROPE – 2017 EDITION
136 137
Employment(direct and indirect jobs) Turnover in € m
2015 2016 2015 2016
Germany 37 100 42 500 4 450 5 110
France 32 900 35 400 3 800 4 090
Italy 27 900 32 600 2 050 2 540
Poland 33 500 26 100 1 380 1 010
Finland 22 800 25 400 3 900 4 320
Latvia 18 800 21 800 620 720
Sweden 20 200 18 700 4 380 4 090
Spain 22 100 18 400 1 120 770
Croatia 14 400 15 000 330 380
United Kingdom 18 600 12 600 1 670 1 090
Hungary 10 800 12 000 300 350
Czech Republic 10 900 11 400 680 690
Romania 12 500 11 400 350 330
Estonia 8 200 10 000 460 560
Bulgaria 7 500 9 600 200 270
Slovakia 9 700 8 700 390 340
Austria 9 100 8 600 1 820 1 740
Denmark 5 900 8 500 1 020 1 450
Portugal 8 200 6 500 710 580
Lithuania 4 000 4 700 220 260
Netherlands 3 600 3 900 450 480
Greece 2 600 3 400 100 150
Slovenia 2 000 2 300 110 130
Ireland 900 1 700 110 200
Belgium 1 600 1 000 380 260
Cyprus <100 <100 <10 <10
Luxembourg <100 <100 <10 <10
Malta <100 <100 <10 <10
Total EU 28 346 100 352 500 31 030 31 940
Source: EurObserv’ER 2017
Employment and turnoverprovide the bulk of jobs and econo-
mic volume (i.e. wind or PV).
Some words can be said about
countries such as Latvia or Spain
where employment is quite high
compared to the turnover evalua-
tion. In these cases, jobs figures
stem mainly from the biomass fuel
production which is strongly dyna-
mic. As an example, Latvian labour
force is largely due to the national
vast pellet production base and
increasing export activities.
Since the NREAP plans were
published in 2010, many countries
have revised their estimates of bio-
mass heat consumption upwards.
The latest EurObserv’ER Solid Bio-
mass Barometer (December 2017)
observed a positive trend and
projected 94 Mtoe of solid bio-
mass energy production in the EU
Member States, against initial pro-
jections of 81 Mtoe. In this respect
the European biomass industry is
not only a major contributor to
reaching the 2020 and 2030 tar-
gets, but also well positioned in
the international competition.
Solid biomass provides and main-
tains numerous jobs in the forestry
sectors and plant installation and
O&M. Beyond that the expert
knowledge gained over the past
decades might translate in further
jobs based on stable export oppor-
tunities from the well-established
biomass technology value chain
for the decade to come. n
Dr
ax
Socio-economic indicators
EUROBSERV ’ER – THE STATE OF RENEWABLE ENERGIES IN EUROPE – 2017 EDITIONEUROBSERV ’ER – THE STATE OF RENEWABLE ENERGIES IN EUROPE – 2017 EDITION
138 139
CONCLUSIONS
For both employment and turnover estimates,
an important methodological change has been
implemented. The details have been reported in the
methodological note at the beginning of this chapter.
The new methodological approach is based on an eva-
luation of the economic activity of each renewable
sector covered, which is then expressed into full-time
equivalent (FTE) employment and turnover. It uses a
consistent and mathematical approach, allowing for
a comparison between the European Union Member
States. The 2015 employment and turnover figures,
published in the previous Edition of ‘The State of
Renewable Energy in Europe’, have been re-evalua-
ted for the present edition in order to have coherent
2015 and 2016 series for all RES sectors in the EU 28.
In effect, the job and turnover figures from last year
cannot directly be compared to the current ones.
Following the new approach, which consistently
assesses employment initiated from renewable
investments, operation and maintenance activities,
production and trading of equipment and biomass
feedstock, it is found that, with 1.4 million persons employed in 2016, employment was very similar to
the renewable jobs in 2015. All in all, a slight reduction
occurred, with an employment reduction of almost
1% (i.e. a reduction of 12 600 jobs in absolute terms).
Technologies for which the 2016 estimates are below
the 2015 jobs are the following: wind energy decreased
from 315 900 to 309 000 jobs (-2%), solar PV from 113 400
to 95 900 jobs (-15%), hydropower from 94 800 to
75 900 jobs (-20%), biogas from 83 700 to 76 300 jobs
(-9%), solar thermal from 30 900 to 29 000 jobs (-6%)
and finally geothermal from 12 200 to 8 600 jobs (-30%).
On the opposite, other technologies saw an increase:
solid biomass grew from 346 100 to 352 500 jobs (+2%),
heat pumps increased from 240 300 to 249 400 jobs
(+4%), biofuels from 178 200 to 205 100 jobs (+15%) and
finally renewable municipal solid waste from 24 500
to 25 700 jobs (+5%).
Looking at what happened in the EU Member States,
Germany, even at an estimated overall reduction
of 12% (38 700 fewer jobs in 2016 compared to 2015)
still has the highest employment of all countries:
283 100 jobs, for the largest part in wind power
(43%). Second is Italy, with 179 000 jobs in 2016,
more than half of them (53%) in the heat pump sector.
Like Germany, also Italy faced a reduction in jobs
of 10 000, representing a 5% decrease. Third comes
France, which unlike the former countries, increased
its estimated renewable energy induced employment
by 6% (+8 300 jobs), comparable to fourth country
Spain increasing in estimated employment by 4%
(+5 500 jobs). In France the main labour force is active
in solid biomass (25%), heat pumps and biofuels
(each 23%). In Spain, main labour can be found in
heat pumps (43%). Next largest player is the United Kingdom, with an estimated job reduction of 3,8%,
following from an estimated reduction of 4 300 jobs.
In the United Kingdom, most labour can be found
in the wind sector (40%) and in solar photovoltaics
(27%).
Despite the overall decrease in workforce, renewable
energy sectors has strengthened their position in the
European economy, which becomes visible from the
impact of manufacturing industry. For example, in the
wind enegy sector, early movers have today a signi-
ficant share of their labour forces involved in opera-
tion and maintenance of the running plants but they
also have competitive wind industry firms (turbines,
foundation, etc.) providing both european markets
and worldwide export.
Regarding the economic activity, combined turnover
of the ten renewable energy sectors covered in the 28
EU Member States reached 149 billion euros in 2016,
slightly down from 2015 (151 billion euros, -1%). Sorted
by technology, wind energy maintained its leading
role in generating turnover (39 billion euros, equiva-
lent to 26% of total EU RES sector turnover), followed
by solid biomass (32 billion euros, 21%), and the heat
pump sector (30 billion euros, 20%).
Looking at the turnover estimations by country, 20 out
of 28 EU Member states increased or maintained their
industrial turnover. However, this positive status is
slightly overbalanced by job decline in the 8 other
countries. The twenty Member States with zero or a
positive growth (France, Spain, Romania, Denmark,
Finland, Hungary, Czech Republic, Netherlands,
Latvia, Croatia, Bulgaria, Lithuania, Greece, Estonia,
Belgium, Ireland, Slovenia, Luxembourg and Malta)
grew on average at 11% (absolute growth: + 5 billion
euro). The countries going downward (Germany, Italy,
United Kingdom, Poland, Sweden, Portugal, Austria,
Slovakia and Cyprus) showed a 7 billion euros cumu-
latively decline. n

Socio-economic indicators
EUROBSERV ’ER – THE STATE OF RENEWABLE ENERGIES IN EUROPE – 2017 EDITIONEUROBSERV ’ER – THE STATE OF RENEWABLE ENERGIES IN EUROPE – 2017 EDITION
140 141
Country Total Biomass Wind Heat pumps Biofuels PV Hydro Biogas Solar thermal Waste Geothermal
Germany 321 800 37 100 155 200 14 400 19 400 32 200 6 300 43 400 7 200 6 000 600
Italy 189 000 27 900 9 400 100 600 7 000 10 000 19 100 8 000 1 400 2 300 3 300
Spain 135 500 22 100 22 000 48 400 12 800 3 000 16 000 1 900 8 400 800 <100
France 134 800 32 900 10 800 32 900 28 100 10 400 10 500 2 400 1 400 1 900 3 500
United Kingdom 111 700 18 600 34 100 1 700 4 200 36 800 2 500 9 600 200 3 900 <100
Poland 84 700 33 500 12 100 2 000 29 500 1 200 1 300 2 500 2 200 <100 300
Sweden 49 800 20 200 5 100 9 800 7 000 300 5 800 <100 <100 1 300 <100
Romania 42 400 12 500 2 500 300 19 600 1 800 5 100 200 100 <100 200
Denmark 41 700 5 900 29 100 2 000 200 1 900 <100 500 1 300 600 <100
Finland 35 200 22 800 2 500 4 500 2 600 500 1 200 400 <100 500 <100
Hungary 32 000 10 800 800 400 14 600 1 800 <100 700 200 1 500 1 100
Portugal 30 000 8 200 3 600 7 300 400 800 7 200 900 500 1 000 <100
Czech Republic 29 700 10 900 900 1 700 6 700 2 100 1 900 4 600 600 200 <100
Austria 26 900 9 100 3 000 1 700 2 800 1 500 5 200 500 2 600 200 300
Netherlands 26 100 3 600 10 300 3 800 400 4 200 <100 1 000 100 2 200 400
Latvia 24 000 18 800 <100 <100 2 600 <100 1 000 1 000 <100 <100 <100
Croatia 21 000 14 400 1 400 <100 1 500 400 1 800 1 000 200 <100 <100
Bulgaria 20 900 7 500 500 2 900 2 700 700 3 100 1 300 1 500 <100 600
Slovakia 16 100 9 700 <100 100 3 400 200 1 300 1 000 <100 <100 100
Lithuania 16 000 4 000 2 600 300 7 500 <100 800 300 <100 200 <100
Greece 15 400 2 600 2 200 1 300 3 600 1 200 1 900 700 1 700 <100 <100
Estonia 12 700 8 200 1 600 1 900 200 100 <100 300 <100 <100 <100
Belgium 9 400 1 600 2 300 1 400 900 1 300 400 700 100 600 <100
Ireland 5 600 900 3 200 300 <100 <100 400 200 200 <100 <100
Slovenia 4 000 2 000 <100 <100 <100 300 900 200 <100 <100 <100
Luxembourg 1 400 <100 <100 <100 <100 <100 500 <100 <100 <100 <100
Cyprus 1 100 <100 200 <100 <100 100 <100 <100 100 <100 <100
Malta 1 100 <100 <100 <100 <100 200 <100 <100 <100 <100 <100
Total EU 28 1 440 000 346 100 315 900 240 300 178 200 113 400 94 800 83 700 30 900 24 500 12 200
Source : EurObserv’ER 2017
2015 EMPLOYMENT DISTRIBUTION BY SECTOR
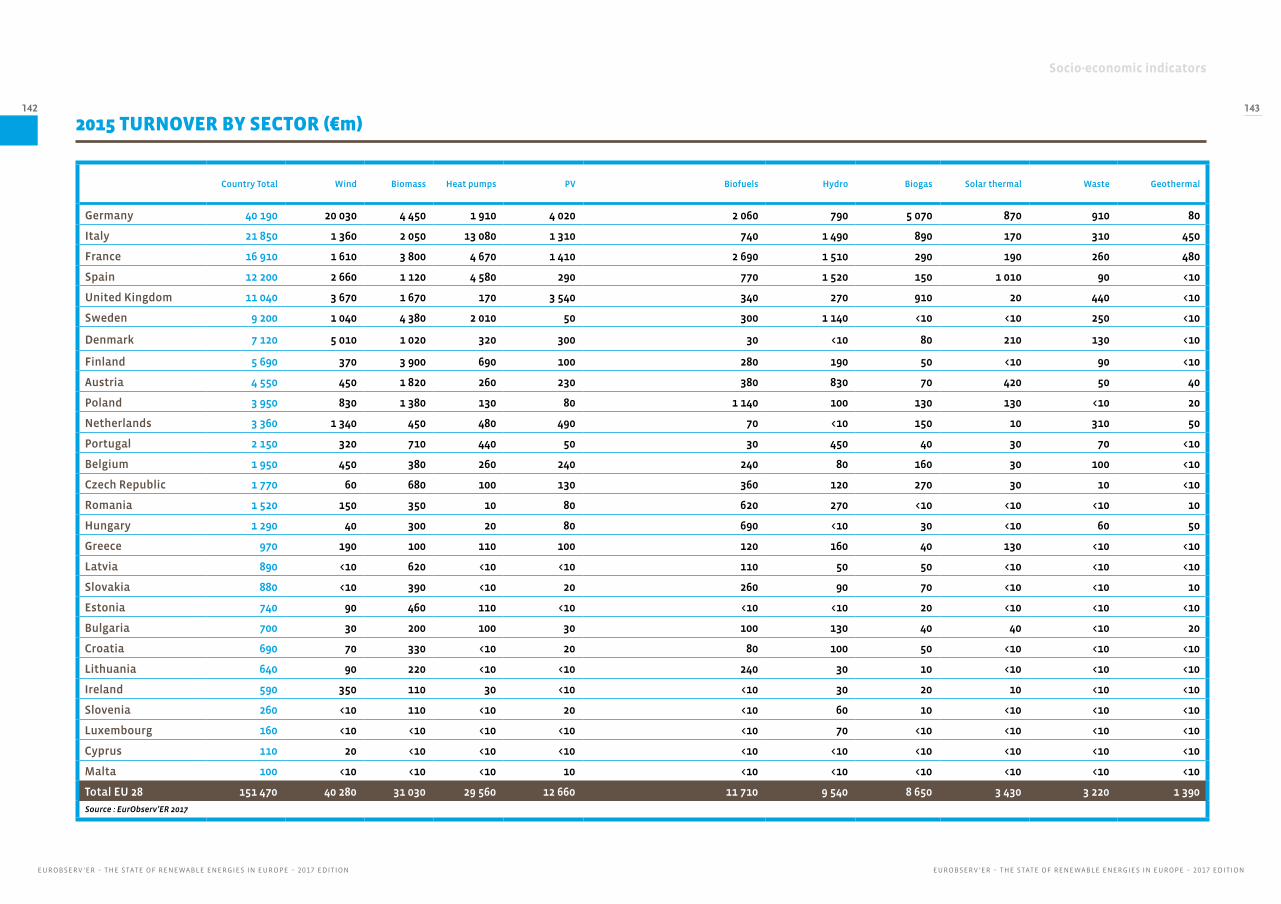
Socio-economic indicators
EUROBSERV ’ER – THE STATE OF RENEWABLE ENERGIES IN EUROPE – 2017 EDITIONEUROBSERV ’ER – THE STATE OF RENEWABLE ENERGIES IN EUROPE – 2017 EDITION
142 143
2015 TURNOVER BY SECTOR (€m)
Country Total Wind Biomass Heat pumps PV Biofuels Hydro Biogas Solar thermal Waste Geothermal
Germany 40 190 20 030 4 450 1 910 4 020 2 060 790 5 070 870 910 80
Italy 21 850 1 360 2 050 13 080 1 310 740 1 490 890 170 310 450
France 16 910 1 610 3 800 4 670 1 410 2 690 1 510 290 190 260 480
Spain 12 200 2 660 1 120 4 580 290 770 1 520 150 1 010 90 <10
United Kingdom 11 040 3 670 1 670 170 3 540 340 270 910 20 440 <10
Sweden 9 200 1 040 4 380 2 010 50 300 1 140 <10 <10 250 <10
Denmark 7 120 5 010 1 020 320 300 30 <10 80 210 130 <10
Finland 5 690 370 3 900 690 100 280 190 50 <10 90 <10
Austria 4 550 450 1 820 260 230 380 830 70 420 50 40
Poland 3 950 830 1 380 130 80 1 140 100 130 130 <10 20
Netherlands 3 360 1 340 450 480 490 70 <10 150 10 310 50
Portugal 2 150 320 710 440 50 30 450 40 30 70 <10
Belgium 1 950 450 380 260 240 240 80 160 30 100 <10
Czech Republic 1 770 60 680 100 130 360 120 270 30 10 <10
Romania 1 520 150 350 10 80 620 270 <10 <10 <10 10
Hungary 1 290 40 300 20 80 690 <10 30 <10 60 50
Greece 970 190 100 110 100 120 160 40 130 <10 <10
Latvia 890 <10 620 <10 <10 110 50 50 <10 <10 <10
Slovakia 880 <10 390 <10 20 260 90 70 <10 <10 10
Estonia 740 90 460 110 <10 <10 <10 20 <10 <10 <10
Bulgaria 700 30 200 100 30 100 130 40 40 <10 20
Croatia 690 70 330 <10 20 80 100 50 <10 <10 <10
Lithuania 640 90 220 <10 <10 240 30 10 <10 <10 <10
Ireland 590 350 110 30 <10 <10 30 20 10 <10 <10
Slovenia 260 <10 110 <10 20 <10 60 10 <10 <10 <10
Luxembourg 160 <10 <10 <10 <10 <10 70 <10 <10 <10 <10
Cyprus 110 20 <10 <10 <10 <10 <10 <10 <10 <10 <10
Malta 100 <10 <10 <10 10 <10 <10 <10 <10 <10 <10
Total EU 28 151 470 40 280 31 030 29 560 12 660 11 710 9 540 8 650 3 430 3 220 1 390
Source : EurObserv’ER 2017

Socio-economic indicators
EUROBSERV ’ER – THE STATE OF RENEWABLE ENERGIES IN EUROPE – 2017 EDITIONEUROBSERV ’ER – THE STATE OF RENEWABLE ENERGIES IN EUROPE – 2017 EDITION
144 145
Country Total Biomass Wind Heat pumps Biofuels PV Biogas Hydro Solar thermal Waste Geothermal
Germany 283 100 42 500 121 700 14 500 21 800 27 100 35 700 5 200 6 400 7 000 1 200
Italy 179 000 32 600 6 300 94 000 6 500 10 700 8 000 13 400 1 400 3 800 2 300
France 143 100 35 400 18 800 32 800 33 200 5 200 1 800 10 200 1 100 4 000 600
Spain 141 000 18 400 23 500 60 800 15 100 2 200 1 300 10 900 8 000 700 <100
United Kingdom 107 400 12 600 42 900 1 800 4 500 29 000 11 800 2 200 200 2 300 <100
Poland 81 800 26 100 11 400 2 200 34 800 1 500 3 100 1 300 1 100 <100 200
Sweden 47 900 18 700 4 900 10 400 7 600 300 <100 4 800 <100 900 <100
Romania 44 900 11 400 2 500 300 23 800 1 800 200 4 400 200 <100 200
Denmark 43 000 8 500 26 600 2 100 200 1 200 300 <100 3 200 500 300
Finland 39 200 25 400 3 500 4 500 2 900 400 400 1 200 <100 700 <100
Netherlands 37 600 3 900 21 500 3 600 400 4 700 800 <100 100 2 000 500
Hungary 35 200 12 000 800 500 15 700 2 000 1 500 <100 400 1 000 1 200
Czech Republic 30 500 11 400 900 1 800 8 000 1 700 4 300 1 700 400 200 <100
Latvia 27 400 21 800 <100 <100 3 100 <100 800 1 100 <100 <100 <100
Portugal 26 800 6 500 6 400 7 400 400 700 800 3 800 200 500 <100
Austria 24 000 8 600 1 700 1 900 2 900 1 300 500 4 800 2 000 200 <100
Bulgaria 23 200 9 600 600 3 900 3 000 800 800 2 900 1 300 <100 200
Croatia 20 500 15 000 900 <100 1 900 <100 600 1 600 100 <100 <100
Greece 18 300 3 400 3 700 1 400 4 500 1 100 800 1 700 1 500 <100 <100
Lithuania 18 300 4 700 1 600 400 9 200 300 800 800 <100 300 <100
Slovakia 15 500 8 700 <100 100 4 000 400 600 1 300 <100 <100 100
Estonia 14 600 10 000 1 600 2 100 200 200 <100 <100 <100 <100 <100
Belgium 9 500 1 000 2 300 1 500 900 2 400 400 400 200 300 <100
Ireland 7 300 1 700 4 200 400 <100 <100 300 200 100 <100 <100
Slovenia 4 800 2 300 <100 500 <100 300 200 900 200 <100 100
Luxembourg 1 500 <100 200 <100 <100 <100 <100 500 <100 <100 <100
Cyprus 1 000 <100 <100 <100 <100 <100 <100 <100 100 <100 <100
Malta 1 000 <100 <100 <100 <100 100 <100 <100 <100 <100 <100
Total EU 28 1 427 400 352 500 309 000 249 400 205 100 95 900 76 300 75 900 29 000 25 700 8 600
Source : EurObserv’ER 2017
2016 EMPLOYMENT DISTRIBUTION BY SECTOR

Socio-economic indicators
EUROBSERV ’ER – THE STATE OF RENEWABLE ENERGIES IN EUROPE – 2017 EDITIONEUROBSERV ’ER – THE STATE OF RENEWABLE ENERGIES IN EUROPE – 2017 EDITION
146 147
2016 TURNOVER BY SECTOR (€m)
Country Total Wind Biomass Heat pumps Biofuels PV Hydro Biogas Solar thermal Waste Geothermal
Germany 35 500 16 060 5 110 1 920 2 300 3 400 650 4 120 760 1 030 150
Italy 21 420 950 2 540 12 280 630 1 400 1 760 880 170 500 310
France 17 850 2 790 4 090 4 630 3 160 710 1 460 220 150 550 90
Spain 12 750 2 820 770 5 800 900 220 1 080 90 980 80 <10
United Kingdom 10 580 4 490 1 090 170 370 2 810 240 1 120 10 270 <10
Sweden 8 740 1 010 4 090 2 110 330 60 940 <10 20 160 <10
Denmark 7 370 4 600 1 450 340 30 200 <10 50 530 110 50
Finland 6 300 520 4 320 700 300 80 190 50 <10 120 <10
Netherlands 4 740 2 680 480 450 70 560 <10 120 10 290 70
Austria 4 120 280 1 740 300 390 190 770 80 330 30 10
Poland 3 690 790 1 010 140 1 310 90 100 160 70 <10 10
Portugal 1 930 500 580 440 20 40 260 30 10 40 <10
Belgium 1 950 450 260 280 240 440 80 100 30 60 <10
Czech Republic 1 780 60 690 110 420 110 110 240 20 10 <10
Greece 1 120 300 150 110 150 90 150 40 110 <10 <10
Romania 1 610 150 330 10 750 90 240 <10 <10 <10 10
Hungary 1 460 50 350 20 750 90 <10 70 20 40 60
Estonia 840 90 560 120 <10 10 <10 <10 <10 <10 <10
Latvia 1 000 <10 720 <10 130 <10 50 40 <10 <10 <10
Slovakia 840 <10 340 <w10 300 20 90 40 <10 <10 10
Ireland 780 440 200 40 <10 <10 20 30 10 <10 <10
Bulgaria 780 30 270 130 110 30 120 30 40 <10 <10
Croatia 700 50 380 <10 100 <10 90 30 <10 <10 <10
Lithuania 710 60 260 10 290 10 30 20 <10 <10 <10
Slovenia 310 <10 130 30 <10 20 60 20 <10 <10 <10
Luxembourg 180 30 <10 <10 <10 10 70 10 <10 <10 <10
Cyprus 100 <10 <10 <10 <10 <10 <10 <10 <10 <10 <10
Malta 100 <10 <10 <10 <10 <10 <10 <10 <10 <10 <10
Total EU 28 149 250 39 250 31 940 30 200 13 110 10 730 8 620 7 640 3 380 3 430 950
Source : EurObserv’ER 2017
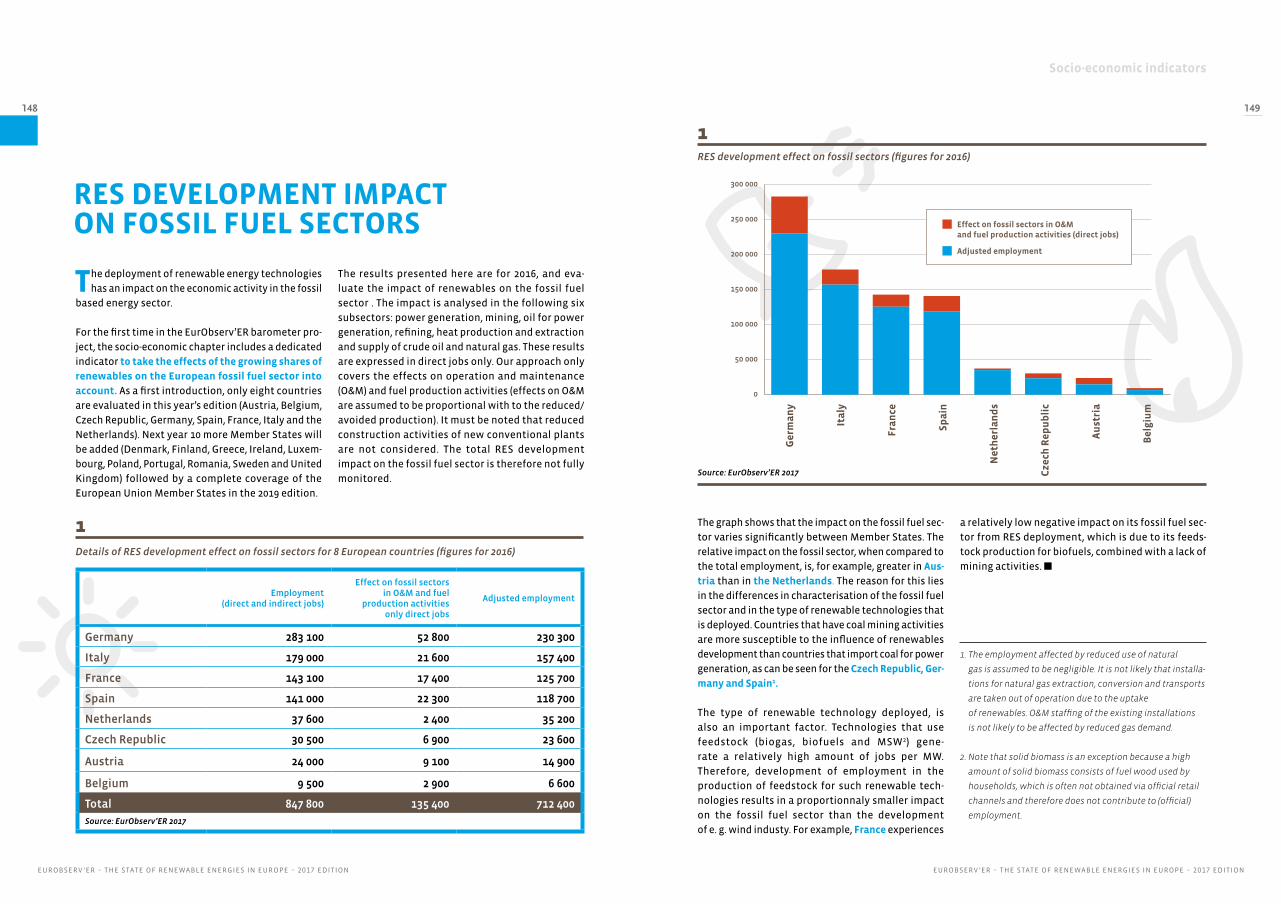
Socio-economic indicators
EUROBSERV ’ER – THE STATE OF RENEWABLE ENERGIES IN EUROPE – 2017 EDITIONEUROBSERV ’ER – THE STATE OF RENEWABLE ENERGIES IN EUROPE – 2017 EDITION
148 149
RES DEVELOPMENT IMPACT ON FOSSIL FUEL SECTORS
The deployment of renewable energy technologies
has an impact on the economic activity in the fossil
based energy sector.
For the first time in the EurObserv’ER barometer pro-
ject, the socio-economic chapter includes a dedicated
indicator to take the effects of the growing shares of
renewables on the European fossil fuel sector into
account. As a first introduction, only eight countries
are evaluated in this year’s edition (Austria, Belgium,
Czech Republic, Germany, Spain, France, Italy and the
Netherlands). Next year 10 more Member States will
be added (Denmark, Finland, Greece, Ireland, Luxem-
bourg, Poland, Portugal, Romania, Sweden and United
Kingdom) followed by a complete coverage of the
European Union Member States in the 2019 edition.
The results presented here are for 2016, and eva-
luate the impact of renewables on the fossil fuel
sector . The impact is analysed in the following six
subsectors: power generation, mining, oil for power
generation, refining, heat production and extraction
and supply of crude oil and natural gas. These results
are expressed in direct jobs only. Our approach only
covers the effects on operation and maintenance
(O&M) and fuel production activities (effects on O&M
are assumed to be proportional with to the reduced/
avoided production). It must be noted that reduced
construction activities of new conventional plants
are not considered. The total RES development
impact on the fossil fuel sector is therefore not fully
monitored.
The graph shows that the impact on the fossil fuel sec-
tor varies significantly between Member States. The
relative impact on the fossil sector, when compared to
the total employment, is, for example, greater in Aus-
tria than in the Netherlands. The reason for this lies
in the differences in characterisation of the fossil fuel
sector and in the type of renewable technologies that
is deployed. Countries that have coal mining activities
are more susceptible to the influence of renewables
development than countries that import coal for power
generation, as can be seen for the Czech Republic, Ger-
many and Spain1.
The type of renewable technology deployed, is
also an important factor. Technologies that use
feedstock (biogas, biofuels and MSW2) gene-
rate a relatively high amount of jobs per MW.
Therefore, development of employment in the
production of feedstock for such renewable tech-
nologies results in a proportionnaly smaller impact
on the fossil fuel sector than the development
of e. g. wind industy. For example, France experiences
1. The employment affected by reduced use of natural
gas is assumed to be negligible. It is not likely that installa-
tions for natural gas extraction, conversion and transports
are taken out of operation due to the uptake
of renewables. O&M staffing of the existing installations
is not likely to be affected by reduced gas demand.
2. Note that solid biomass is an exception because a high
amount of solid biomass consists of fuel wood used by
households, which is often not obtained via official retail
channels and therefore does not contribute to (official)
employment.
Employment(direct and indirect jobs)
Effect on fossil sectors in O&M and fuel
production activitiesonly direct jobs
Adjusted employment
Germany 283 100 52 800 230 300
Italy 179 000 21 600 157 400
France 143 100 17 400 125 700
Spain 141 000 22 300 118 700
Netherlands 37 600 2 400 35 200
Czech Republic 30 500 6 900 23 600
Austria 24 000 9 100 14 900
Belgium 9 500 2 900 6 600
Total 847 800 135 400 712 400
Source: EurObserv’ER 2017
1Details of RES development effect on fossil sectors for 8 European countries (figures for 2016)
1RES development effect on fossil sectors (figures for 2016)
0
50 000
100 000
150 000
200 000
250 000
300 000
Ge
rma
ny
Ita
ly
Fra
nce
Sp
ain
Ne
the
rla
nd
s
Cze
ch R
ep
ub
lic
Au
stri
a
Be
lgiu
m
Effect on fossil sectors in O&M and fuel production activities (direct jobs)
Adjusted employment
Source: EurObserv’ER 2017
a relatively low negative impact on its fossil fuel sec-
tor from RES deployment, which is due to its feeds-
tock production for biofuels, combined with a lack of
mining activities. n

Investment indicators
EUROBSERV ’ER – THE STATE OF RENEWABLE ENERGIES IN EUROPE – 2017 EDITIONEUROBSERV ’ER – THE STATE OF RENEWABLE ENERGIES IN EUROPE – 2017 EDITION
150 151
INVESTMENT INDICATORSIn this chapter, EurObserv’ER presents indi-cators that shed light on the financing side of RES. In order to show a comprehensive picture, the investment indicators cover two broader aspects: • The first group of indicators relates to invest-
ment in the application of RE technologies (e.g. building power plants).
• The second group of indicators shifts the focus towards the development and the production of the technologies themselves (e.g. producing solar modules).
First of all, investments in new built capacity for all RES sectors in all EU member states are covered under asset finance. Asset finance data is derived from the Bloomberg New Energy Finance (BNEF) data base as well as other data sources and covers utility-scale investments in renewable energy, i.e. invest-ment in power plants. Furthermore, average investment expenditures per MW of capacity are compared to main EU trading partners In order to capture the involvement of the public sector in RES financing, information on natio-nal and EU-wide financing programmes for RES will be presented.
It should be mentioned that the data on asset finance and VC/PE investment presented in
this edition cannot be compared to the data in the previous overview barometers. The rea-son is that the database evolves continuously. This means that, whenever information on investment deals in previous years is found, it is added to the database to make it as com-prehensive as possible. Hence, the investment figures for 2015 presented in last year’s edi-tion and this edition naturally differ.
The second part starts to analyse investment in RE technology by providing venture capital and private equity (VC/PE) investment data as derived from BNEF and other sources for all RES for the EU as a whole in order to capture the dynamics of the EU market for new tech-nology and project developing companies. Then, RES stock indices are constructed which cover the largest European firms for the major RES. This indicator captures the performance of RES technology companies, i.e. companies that develop / produce the RES components needed for RES plants to function. The data used for the construction of the indices is collected from the respective national stock exchanges as well as public databases. In addition, YieldCos, i.e. infrastructure assets, e.g. renewable energy plants, where the ownership is offered on public markets, will be included in this chapter.

Investment indicators
EUROBSERV ’ER – THE STATE OF RENEWABLE ENERGIES IN EUROPE – 2017 EDITIONEUROBSERV ’ER – THE STATE OF RENEWABLE ENERGIES IN EUROPE – 2017 EDITION
152 153
Asset finance covers all investment into utility-scale
renewable energy generation projects. It covers
wind, solar PV, CSP, solid biomass, biogas, and waste-
to-energy projects with a capacity of more than
1 MW and investments in biofuels with a capacity
of more the one million litres per year. Furthermore,
the underlying data is deal-based and for the invest-
ment indicators presented here, all completed deals
in 2015 and 2016 were covered. This means that for all
included projects the financial deal was agreed upon
and finalised, so the financing is secured. Note that
this does not give an indication when the capacity
will be added. In some cases the construction starts
immediately, while in several cases a financial deal
is signed for a project, where construction starts
several months (or sometimes years) later. Hence,
the data of the associated capacity added shows the
estimated capacity added by the asset finance deals
closed in the respective year. This capacity might be
added either already in the respective year or in the
following years. In addition to investments in RES
capacity in the Member States, an overview of invest-
ment expenditures per MW of RES capacity will be
calculated for the EU and main trading partners in
order to compare investment costs.
Asset finance is differentiated by three types:
balance-sheet finance, non-recourse project
finance, and bonds and other instruments. In the
first case, the respective power plant is financed
from the balance-sheet of typically a large energy
company or a utility. In this case the utility might
borrow money from a bank and is – as company
– responsible to pay back the loan. Non-recourse
project finance implies that someone provides
equity to a single purpose company (a dedicated
project company) and this project company asks
for additional bank loans. Here, only the project
company is responsible to pay back the loan and
the project is largely separated from the balance
sheet of the equity provider (sponsor). Finally,
the third type of asset finance, new / alternative
financing mechanisms are captured as bonds
(that are issued to finance a project), guarantees,
leasing, etc. These instruments play so far a very
minor role in the EU, particularly in comparison
to the US, where the market for bond finance for
RES projects is further developed. Nevertheless,
these instruments are captured to monitor their
role in the EU.
Methodological note
Investment in Renewable Energy CapacityIn this section, the EurObserv’ER investment indica-
tors focus on investment in RES capacity, i.e. invest-
ments in utility-size RES power plants (asset finance).
Hence, an overview of investments in capacity across
RES in the EU Member States is provided. Further-
more, average investments costs per MW of capacity
are calculated for the EU and compared with main
EU trading partners. Finally, information in public
financing programmes for RES is presented.

Investment indicators
EUROBSERV ’ER – THE STATE OF RENEWABLE ENERGIES IN EUROPE – 2017 EDITIONEUROBSERV ’ER – THE STATE OF RENEWABLE ENERGIES IN EUROPE – 2017 EDITION
154 155
1Overview of asset finance in the wind power sector (onshore + offshore) in the EU Member States in 2015 and 2016
2015 2016
Asset Finance -
New Built (in € m)
Number of Projects
Capacity (in MW)
Asset Finance -
New Built (in € m)
Number of Projects
Capacity (in MW)
United Kingdom 13 024.19 75 4 138.7 15 410.79 80 4 311.1
Germany 10 901.69 442 58 73.0 8 984.05 179 3 890.4
Belgium 880.50 28 339.4 2 509.30 18 835.6
France 1 283.68 54 988.0 1 604.21 63 1 106.2
Denmark 354.70 20 281.1 1 283.15 15 601.9
Sweden 525.68 23 416.6 1 078.55 21 806.1
Italy 491.59 17 374.3 804.33 14 532.4
Finland 777.81 19 578.9 703.81 20 446.2
Ireland 777.07 16 521.3 674.25 14 467.0
Austria 395.60 18 298.3 352.23 10 213.1
Spain 25.15 2 9.6 176.37 8 125.9
Estonia 0.00 0 0 166.65 1 102.0
Greece 300.01 5 215.9 153.08 3 107.7
Poland 1 011.28 46 798.2 93.39 3 61.4
Netherlands 250.07 23 196.5 89.03 5 63.6
Lithuania 1.89 1 1.5 10.51 1 7.5
Portugal 103.17 4 89.7 0.00 0 0
Luxembourg 26.50 1 21.0 0.00 0
Cyprus 12.62 1 10.0 0.00 0
Total EU 31 143.19 795 15 152.0 34 093.68 455 13 678.2
Source: EurObserv’ER 2017
2016 was another very posi-
tive year for invest-
ments in wind capacity. In 2015,
wind investments, including both
onshore and offshore wind, reached
an already impressive € 31 billion
and grew to € 34 billion in 2016,
which corresponds to an increase
by almost 10%. In contrast to total
investments, the number of wind
projects decreased notably from
795 in 2015 to 455 in 2016. In spite
of the increase in investments,
however, the capacity added asso-
ciated with asset finance went
down by 10% from 15.2 GW in 2015
to 13.7 GW in 2017. This obser-
vation indicates an increase of
investment expenditures per MW
of wind capacity. As will be shown
below, this increase in investment
expenditures is mainly driven by a
substantial increase in the share
of offshore wind, which is typically
more expensive.
The way wind power projects
were financed changed marginally
between both years. On-balance-
sheet financing is the dominant
source in both years and even
increased from 60% in 2015 to
68% in 2016. A reverse trend can
be observed for other financing
instruments, as e.g. bonds or gua-
rantees, which declined notably
between the two years from a
share of more than 10% in 2015
to only 1.3% in 2016. The share
of non-recourse project finance
remained relative stable around
30%. The shares of the number of
project financed investments in
both years indicate that the on
average larger investments are
projects financed while smaller
wind power plants are financed
through on-balance-sheet finance.
Although project finance is asso-
ciated with around 30% of finan-
cing volumes in both years, only
9.4% (2015) and 15.4% (2016) of all
projects are covered by project
financing.
OFFSHORE DRIVES WIND INVESTMENTS IN 2016Comparing onshore and offshore
wind investments shows that the
positive investment trend in the
sector is substantially driven by a
massive upsurge in offshore wind
investments. Overall, offshore
investments increased from an
already impressive € 13.9 billion
in 2015 to € 22.3 billion in 2016.
Hence, compared to previous
years, offshore was the main dri-
ver in wind investments. Its share
increased from 45% in 2015 to more
than 65% in 2016. The relatively low
numbers of offshore wind projects,
namely 11 in 2015 and 15 in 2016,
indicate the substantially larger
size of these investments compa-
red to the average onshore wind
WIND POWER
project. The average project size
of an offshore investment was
€ 1.26 billion in 2015 and € 1.49 bil-
lion in 2016. In contrast, onshore
investments totalled on average
€ 22 million in 2015 and € 26 million
in 2016. Compared to onshore, non-
recourse project finance is used
more frequently in the offshore
sector due to the high financing
volumes of these projects.
Capacity added associated with
offshore investments grew from
3.01 GW in 2015 to 5.49 GW in 2016.
Offshore capacity grew at a fas-
ter pace than investment expen-
ditures, which indicates that
expenditures per MW of offshore
Eu
ro
pea
n E
ner
gy
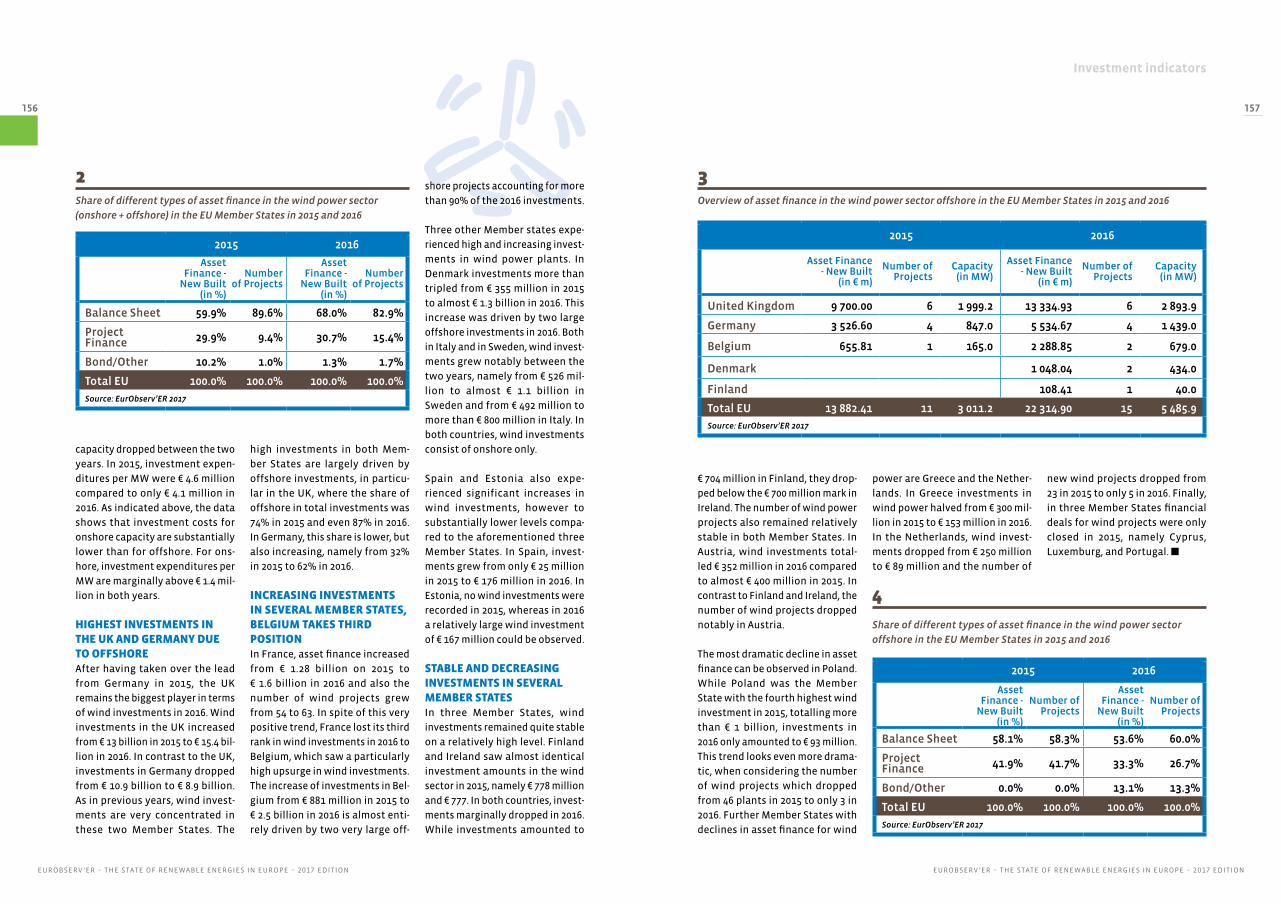
Investment indicators
EUROBSERV ’ER – THE STATE OF RENEWABLE ENERGIES IN EUROPE – 2017 EDITIONEUROBSERV ’ER – THE STATE OF RENEWABLE ENERGIES IN EUROPE – 2017 EDITION
156 157
2Share of different types of asset finance in the wind power sector
(onshore + offshore) in the EU Member States in 2015 and 2016
2015 2016
Asset Finance -
New Built (in %)
Number of Projects
Asset Finance -
New Built (in %)
Number of Projects
Balance Sheet 59.9% 89.6% 68.0% 82.9%
Project Finance 29.9% 9.4% 30.7% 15.4%
Bond/Other 10.2% 1.0% 1.3% 1.7%
Total EU 100.0% 100.0% 100.0% 100.0%
Source: EurObserv’ER 2017
capacity dropped between the two
years. In 2015, investment expen-
ditures per MW were € 4.6 million
compared to only € 4.1 million in
2016. As indicated above, the data
shows that investment costs for
onshore capacity are substantially
lower than for offshore. For ons-
hore, investment expenditures per
MW are marginally above € 1.4 mil-
lion in both years.
HIGHEST INVESTMENTS IN THE UK AND GERMANY DUE TO OFFSHOREAfter having taken over the lead
from Germany in 2015, the UK
remains the biggest player in terms
of wind investments in 2016. Wind
investments in the UK increased
from € 13 billion in 2015 to € 15.4 bil-
lion in 2016. In contrast to the UK,
investments in Germany dropped
from € 10.9 billion to € 8.9 billion.
As in previous years, wind invest-
ments are very concentrated in
these two Member States. The
high investments in both Mem-
ber States are largely driven by
offshore investments, in particu-
lar in the UK, where the share of
offshore in total investments was
74% in 2015 and even 87% in 2016.
In Germany, this share is lower, but
also increasing, namely from 32%
in 2015 to 62% in 2016.
INCREASING INVESTMENTS IN SEVERAL MEMBER STATES, BELGIUM TAKES THIRD POSITIONIn France, asset finance increased
from € 1.28 billion on 2015 to
€ 1.6 billion in 2016 and also the
number of wind projects grew
from 54 to 63. In spite of this very
positive trend, France lost its third
rank in wind investments in 2016 to
Belgium, which saw a particularly
high upsurge in wind investments.
The increase of investments in Bel-
gium from € 881 million in 2015 to
€ 2.5 billion in 2016 is almost enti-
rely driven by two very large off-
shore projects accounting for more
than 90% of the 2016 investments.
Three other Member states expe-
rienced high and increasing invest-
ments in wind power plants. In
Denmark investments more than
tripled from € 355 million in 2015
to almost € 1.3 billion in 2016. This
increase was driven by two large
offshore investments in 2016. Both
in Italy and in Sweden, wind invest-
ments grew notably between the
two years, namely from € 526 mil-
lion to almost € 1.1 billion in
Sweden and from € 492 million to
more than € 800 million in Italy. In
both countries, wind investments
consist of onshore only.
Spain and Estonia also expe-
rienced significant increases in
wind investments, however to
substantially lower levels compa-
red to the aforementioned three
Member States. In Spain, invest-
ments grew from only € 25 million
in 2015 to € 176 million in 2016. In
Estonia, no wind investments were
recorded in 2015, whereas in 2016
a relatively large wind investment
of € 167 million could be observed.
STABLE AND DECREASING INVESTMENTS IN SEVERAL MEMBER STATESIn three Member States, wind
investments remained quite stable
on a relatively high level. Finland
and Ireland saw almost identical
investment amounts in the wind
sector in 2015, namely € 778 million
and € 777. In both countries, invest-
ments marginally dropped in 2016.
While investments amounted to
€ 704 million in Finland, they drop-
ped below the € 700 million mark in
Ireland. The number of wind power
projects also remained relatively
stable in both Member States. In
Austria, wind investments total-
led € 352 million in 2016 compared
to almost € 400 million in 2015. In
contrast to Finland and Ireland, the
number of wind projects dropped
notably in Austria.
The most dramatic decline in asset
finance can be observed in Poland.
While Poland was the Member
State with the fourth highest wind
investment in 2015, totalling more
than € 1 billion, investments in
2016 only amounted to € 93 million.
This trend looks even more drama-
tic, when considering the number
of wind projects which dropped
from 46 plants in 2015 to only 3 in
2016. Further Member States with
declines in asset finance for wind
3Overview of asset finance in the wind power sector offshore in the EU Member States in 2015 and 2016
2015 2016
Asset Finance - New Built
(in € m)
Number of Projects
Capacity (in MW)
Asset Finance - New Built
(in € m)
Number of Projects
Capacity (in MW)
United Kingdom 9 700.00 6 1 999.2 13 334.93 6 2 893.9
Germany 3 526.60 4 847.0 5 534.67 4 1 439.0
Belgium 655.81 1 165.0 2 288.85 2 679.0
Denmark 1 048.04 2 434.0
Finland 108.41 1 40.0
Total EU 13 882.41 11 3 011.2 22 314.90 15 5 485.9
Source: EurObserv’ER 2017
4
Share of different types of asset finance in the wind power sector
offshore in the EU Member States in 2015 and 2016
2015 2016
Asset Finance -
New Built (in %)
Number of Projects
Asset Finance -
New Built (in %)
Number of Projects
Balance Sheet 58.1% 58.3% 53.6% 60.0%
Project Finance 41.9% 41.7% 33.3% 26.7%
Bond/Other 0.0% 0.0% 13.1% 13.3%
Total EU 100.0% 100.0% 100.0% 100.0%
Source: EurObserv’ER 2017
power are Greece and the Nether-
lands. In Greece investments in
wind power halved from € 300 mil-
lion in 2015 to € 153 million in 2016.
In the Netherlands, wind invest-
ments dropped from € 250 million
to € 89 million and the number of
new wind projects dropped from
23 in 2015 to only 5 in 2016. Finally,
in three Member States financial
deals for wind projects were only
closed in 2015, namely Cyprus,
Luxemburg, and Portugal. n
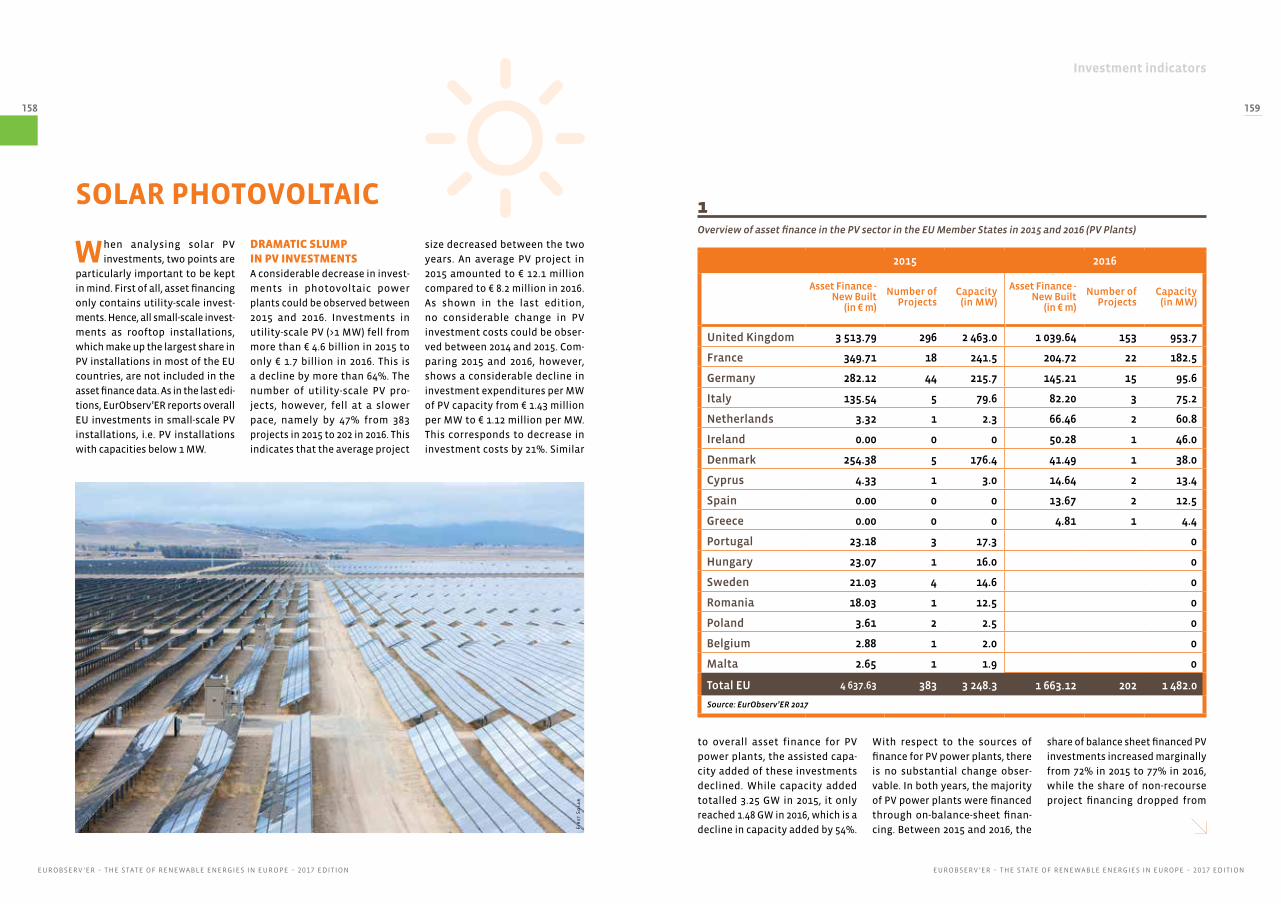
Investment indicators
EUROBSERV ’ER – THE STATE OF RENEWABLE ENERGIES IN EUROPE – 2017 EDITIONEUROBSERV ’ER – THE STATE OF RENEWABLE ENERGIES IN EUROPE – 2017 EDITION
158 159
size decreased between the two
years. An average PV project in
2015 amounted to € 12.1 million
compared to € 8.2 million in 2016.
As shown in the last edition,
no considerable change in PV
investment costs could be obser-
ved between 2014 and 2015. Com-
paring 2015 and 2016, however,
shows a considerable decline in
investment expenditures per MW
of PV capacity from € 1.43 million
per MW to € 1.12 million per MW.
This corresponds to decrease in
investment costs by 21%. Similar
When analysing solar PV
investments, two points are
particularly important to be kept
in mind. First of all, asset financing
only contains utility-scale invest-
ments. Hence, all small-scale invest-
ments as rooftop installations,
which make up the largest share in
PV installations in most of the EU
countries, are not included in the
asset finance data. As in the last edi-
tions, EurObserv’ER reports overall
EU investments in small-scale PV
installations, i.e. PV installations
with capacities below 1 MW.
DRAMATIC SLUMP IN PV INVESTMENTSA considerable decrease in invest-
ments in photovoltaic power
plants could be observed between
2015 and 2016. Investments in
utility-scale PV (>1 MW) fell from
more than € 4.6 billion in 2015 to
only € 1.7 billion in 2016. This is
a decline by more than 64%. The
number of utility-scale PV pro-
jects, however, fell at a slower
pace, namely by 47% from 383
projects in 2015 to 202 in 2016. This
indicates that the average project
SOLAR PHOTOVOLTAIC 1Overview of asset finance in the PV sector in the EU Member States in 2015 and 2016 (PV Plants)
2015 2016
Asset Finance - New Built
(in € m)
Number of Projects
Capacity (in MW)
Asset Finance - New Built
(in € m)
Number of Projects
Capacity (in MW)
United Kingdom 3 513.79 296 2 463.0 1 039.64 153 953.7
France 349.71 18 241.5 204.72 22 182.5
Germany 282.12 44 215.7 145.21 15 95.6
Italy 135.54 5 79.6 82.20 3 75.2
Netherlands 3.32 1 2.3 66.46 2 60.8
Ireland 0.00 0 0 50.28 1 46.0
Denmark 254.38 5 176.4 41.49 1 38.0
Cyprus 4.33 1 3.0 14.64 2 13.4
Spain 0.00 0 0 13.67 2 12.5
Greece 0.00 0 0 4.81 1 4.4
Portugal 23.18 3 17.3 0
Hungary 23.07 1 16.0 0
Sweden 21.03 4 14.6 0
Romania 18.03 1 12.5 0
Poland 3.61 2 2.5 0
Belgium 2.88 1 2.0 0
Malta 2.65 1 1.9 0
Total EU 4 637.63 383 3 248.3 1 663.12 202 1 482.0
Source: EurObserv’ER 2017
to overall asset finance for PV
power plants, the assisted capa-
city added of these investments
declined. While capacity added
totalled 3.25 GW in 2015, it only
reached 1.48 GW in 2016, which is a
decline in capacity added by 54%.
With respect to the sources of
finance for PV power plants, there
is no substantial change obser-
vable. In both years, the majority
of PV power plants were financed
through on-balance-sheet finan-
cing. Between 2015 and 2016, the
share of balance sheet financed PV
investments increased marginally
from 72% in 2015 to 77% in 2016,
while the share of non-recourse
project financing dropped from
Fir
st S
ola
r
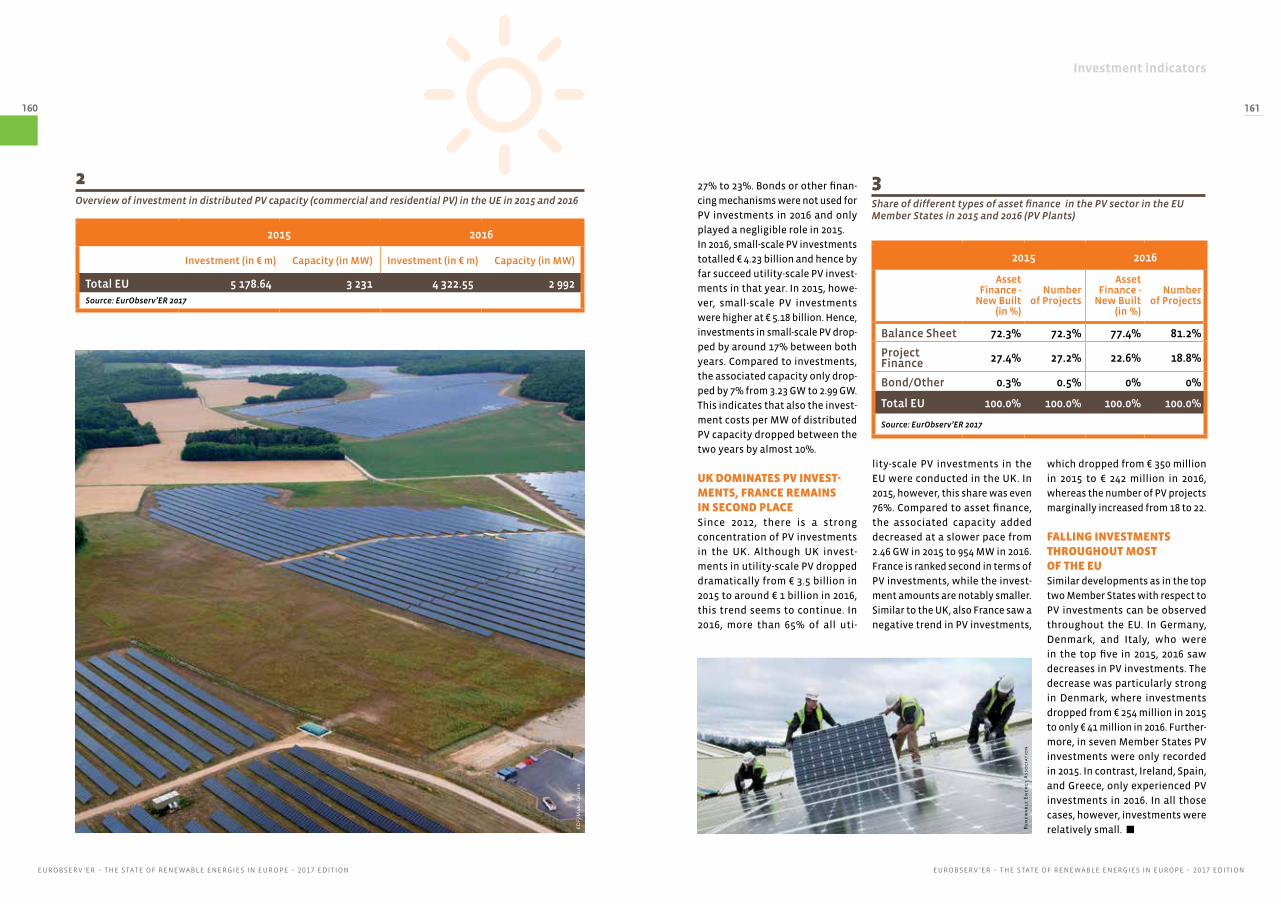
Investment indicators
EUROBSERV ’ER – THE STATE OF RENEWABLE ENERGIES IN EUROPE – 2017 EDITIONEUROBSERV ’ER – THE STATE OF RENEWABLE ENERGIES IN EUROPE – 2017 EDITION
160 161
2Overview of investment in distributed PV capacity (commercial and residential PV) in the UE in 2015 and 2016
2015 2016
Investment (in € m) Capacity (in MW) Investment (in € m) Capacity (in MW)
Total EU 5 178.64 3 231 4 322.55 2 992Source: EurObserv’ER 2017
3Share of different types of asset finance in the PV sector in the EU Member States in 2015 and 2016 (PV Plants)
2015 2016
Asset Finance -
New Built (in %)
Number of Projects
Asset Finance -
New Built (in %)
Number of Projects
Balance Sheet 72.3% 72.3% 77.4% 81.2%
Project Finance 27.4% 27.2% 22.6% 18.8%
Bond/Other 0.3% 0.5% 0% 0%
Total EU 100.0% 100.0% 100.0% 100.0%
Source: EurObserv’ER 2017
which dropped from € 350 million
in 2015 to € 242 million in 2016,
whereas the number of PV projects
marginally increased from 18 to 22.
FALLING INVESTMENTS THROUGHOUT MOST OF THE EUSimilar developments as in the top
two Member States with respect to
PV investments can be observed
throughout the EU. In Germany,
Denmark, and Italy, who were
in the top five in 2015, 2016 saw
decreases in PV investments. The
decrease was particularly strong
in Denmark, where investments
dropped from € 254 million in 2015
to only € 41 million in 2016. Further-
more, in seven Member States PV
investments were only recorded
in 2015. In contrast, Ireland, Spain,
and Greece, only experienced PV
investments in 2016. In all those
cases, however, investments were
relatively small. n
27% to 23%. Bonds or other finan-
cing mechanisms were not used for
PV investments in 2016 and only
played a negligible role in 2015.
In 2016, small-scale PV investments
totalled € 4.23 billion and hence by
far succeed utility-scale PV invest-
ments in that year. In 2015, howe-
ver, small-scale PV investments
were higher at € 5.18 billion. Hence,
investments in small-scale PV drop-
ped by around 17% between both
years. Compared to investments,
the associated capacity only drop-
ped by 7% from 3.23 GW to 2.99 GW.
This indicates that also the invest-
ment costs per MW of distributed
PV capacity dropped between the
two years by almost 10%.
UK DOMINATES PV INVEST-MENTS, FRANCE REMAINS IN SECOND PLACESince 2012, there is a strong
concentration of PV investments
in the UK. Although UK invest-
ments in utility-scale PV dropped
dramatically from € 3.5 billion in
2015 to around € 1 billion in 2016,
this trend seems to continue. In
2016, more than 65% of all uti-
lity-scale PV investments in the
EU were conducted in the UK. In
2015, however, this share was even
76%. Compared to asset finance,
the associated capacity added
decreased at a slower pace from
2.46 GW in 2015 to 954 MW in 2016.
France is ranked second in terms of
PV investments, while the invest-
ment amounts are notably smaller.
Similar to the UK, also France saw a
negative trend in PV investments,
ED
F/M
ar
c D
idie
r
Ren
ewa
ble
En
erg
y A
sso
cia
tio
n
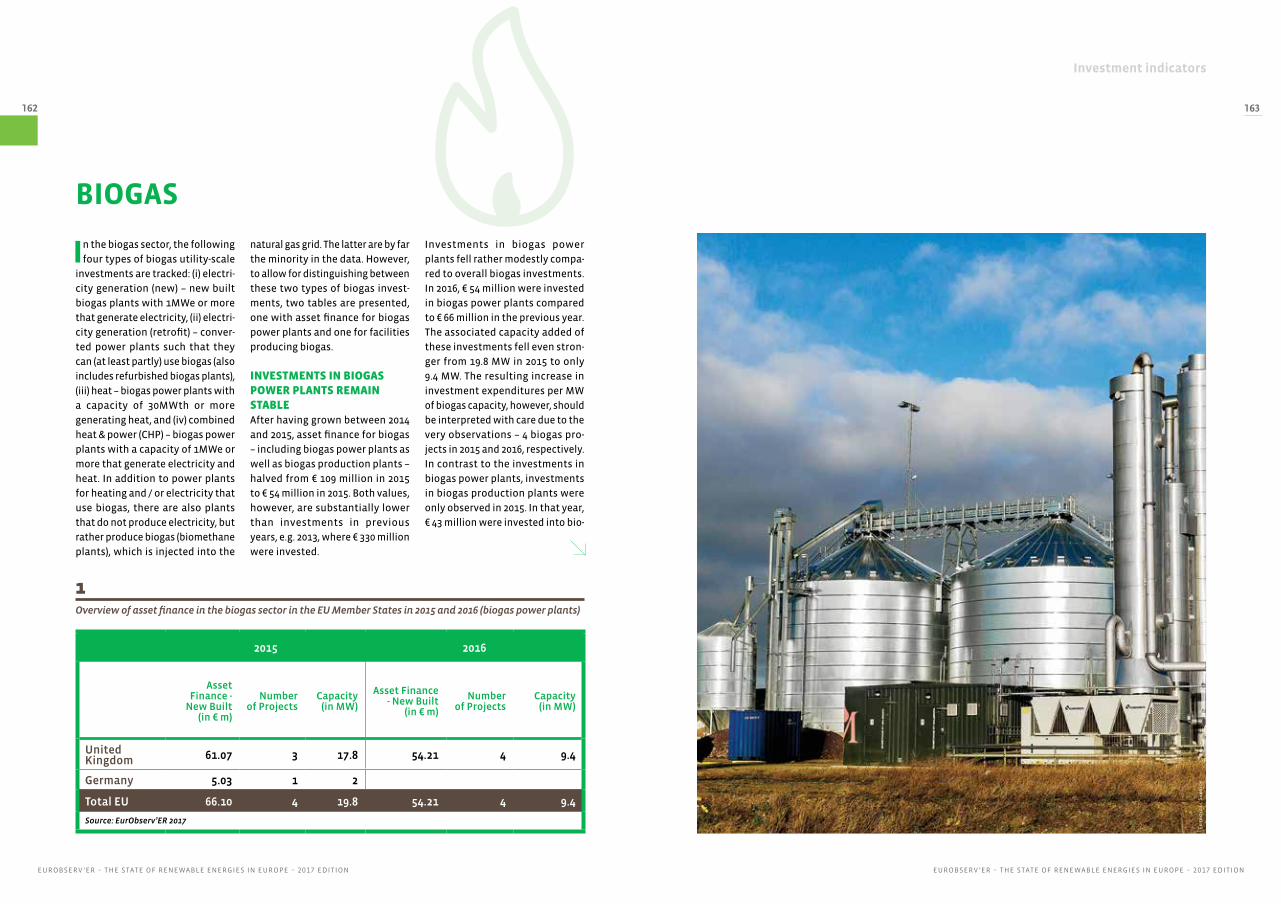
Investment indicators
EUROBSERV ’ER – THE STATE OF RENEWABLE ENERGIES IN EUROPE – 2017 EDITIONEUROBSERV ’ER – THE STATE OF RENEWABLE ENERGIES IN EUROPE – 2017 EDITION
162 163
1Overview of asset finance in the biogas sector in the EU Member States in 2015 and 2016 (biogas power plants)
2015 2016
Asset Finance -
New Built (in € m)
Number of Projects
Capacity (in MW)
Asset Finance - New Built
(in € m)
Number of Projects
Capacity (in MW)
United Kingdom 61.07 3 17.8 54.21 4 9.4
Germany 5.03 1 2
Total EU 66.10 4 19.8 54.21 4 9.4
Source: EurObserv’ER 2017
In the biogas sector, the following
four types of biogas utility-scale
investments are tracked: (i) electri-
city generation (new) – new built
biogas plants with 1MWe or more
that generate electricity, (ii) electri-
city generation (retrofit) – conver-
ted power plants such that they
can (at least partly) use biogas (also
includes refurbished biogas plants),
(iii) heat – biogas power plants with
a capacity of 30MWth or more
generating heat, and (iv) combined
heat & power (CHP) – biogas power
plants with a capacity of 1MWe or
more that generate electricity and
heat. In addition to power plants
for heating and / or electricity that
use biogas, there are also plants
that do not produce electricity, but
rather produce biogas (biomethane
plants), which is injected into the
BIOGAS
natural gas grid. The latter are by far
the minority in the data. However,
to allow for distinguishing between
these two types of biogas invest-
ments, two tables are presented,
one with asset finance for biogas
power plants and one for facilities
producing biogas.
INVESTMENTS IN BIOGAS POWER PLANTS REMAIN STABLEAfter having grown between 2014
and 2015, asset finance for biogas
– including biogas power plants as
well as biogas production plants –
halved from € 109 million in 2015
to € 54 million in 2015. Both values,
however, are substantially lower
than investments in previous
years, e.g. 2013, where € 330 million
were invested.
Investments in biogas power
plants fell rather modestly compa-
red to overall biogas investments.
In 2016, € 54 million were invested
in biogas power plants compared
to € 66 million in the previous year.
The associated capacity added of
these investments fell even stron-
ger from 19.8 MW in 2015 to only
9.4 MW. The resulting increase in
investment expenditures per MW
of biogas capacity, however, should
be interpreted with care due to the
very observations – 4 biogas pro-
jects in 2015 and 2016, respectively.
In contrast to the investments in
biogas power plants, investments
in biogas production plants were
only observed in 2015. In that year,
€ 43 million were invested into bio-
En
erg
iga
s S
ver
ige
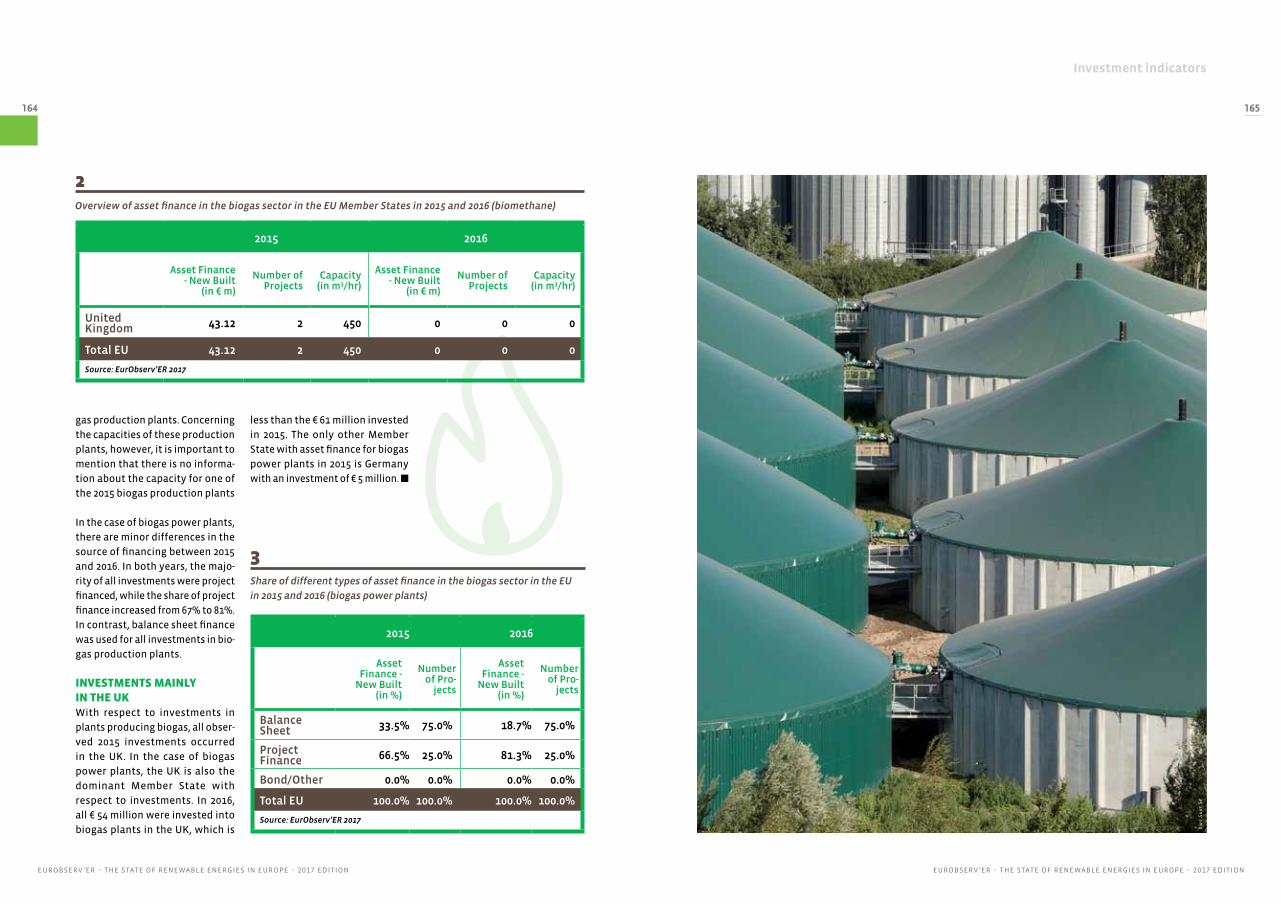
Investment indicators
EUROBSERV ’ER – THE STATE OF RENEWABLE ENERGIES IN EUROPE – 2017 EDITIONEUROBSERV ’ER – THE STATE OF RENEWABLE ENERGIES IN EUROPE – 2017 EDITION
164 165
2015 2016
Asset Finance -
New Built (in %)
Number of Pro-
jects
Asset Finance -
New Built (in %)
Number of Pro-
jects
Balance Sheet 33.5% 75.0% 18.7% 75.0%
Project Finance 66.5% 25.0% 81.3% 25.0%
Bond/Other 0.0% 0.0% 0.0% 0.0%
Total EU 100.0% 100.0% 100.0% 100.0%
Source: EurObserv’ER 2017
3Share of different types of asset finance in the biogas sector in the EU
in 2015 and 2016 (biogas power plants)
gas production plants. Concerning
the capacities of these production
plants, however, it is important to
mention that there is no informa-
tion about the capacity for one of
the 2015 biogas production plants
In the case of biogas power plants,
there are minor differences in the
source of financing between 2015
and 2016. In both years, the majo-
rity of all investments were project
financed, while the share of project
finance increased from 67% to 81%.
In contrast, balance sheet finance
was used for all investments in bio-
gas production plants.
INVESTMENTS MAINLY IN THE UKWith respect to investments in
plants producing biogas, all obser-
ved 2015 investments occurred
in the UK. In the case of biogas
power plants, the UK is also the
dominant Member State with
respect to investments. In 2016,
all € 54 million were invested into
biogas plants in the UK, which is Kw
s S
aat
Se
2015 2016
Asset Finance - New Built
(in € m)
Number of Projects
Capacity (in m3/hr)
Asset Finance - New Built
(in € m)
Number of Projects
Capacity (in m3/hr)
United Kingdom 43.12 2 450 0 0 0
Total EU 43.12 2 450 0 0 0
Source: EurObserv’ER 2017
2Overview of asset finance in the biogas sector in the EU Member States in 2015 and 2016 (biomethane)
less than the € 61 million invested
in 2015. The only other Member
State with asset finance for biogas
power plants in 2015 is Germany
with an investment of € 5 million. n
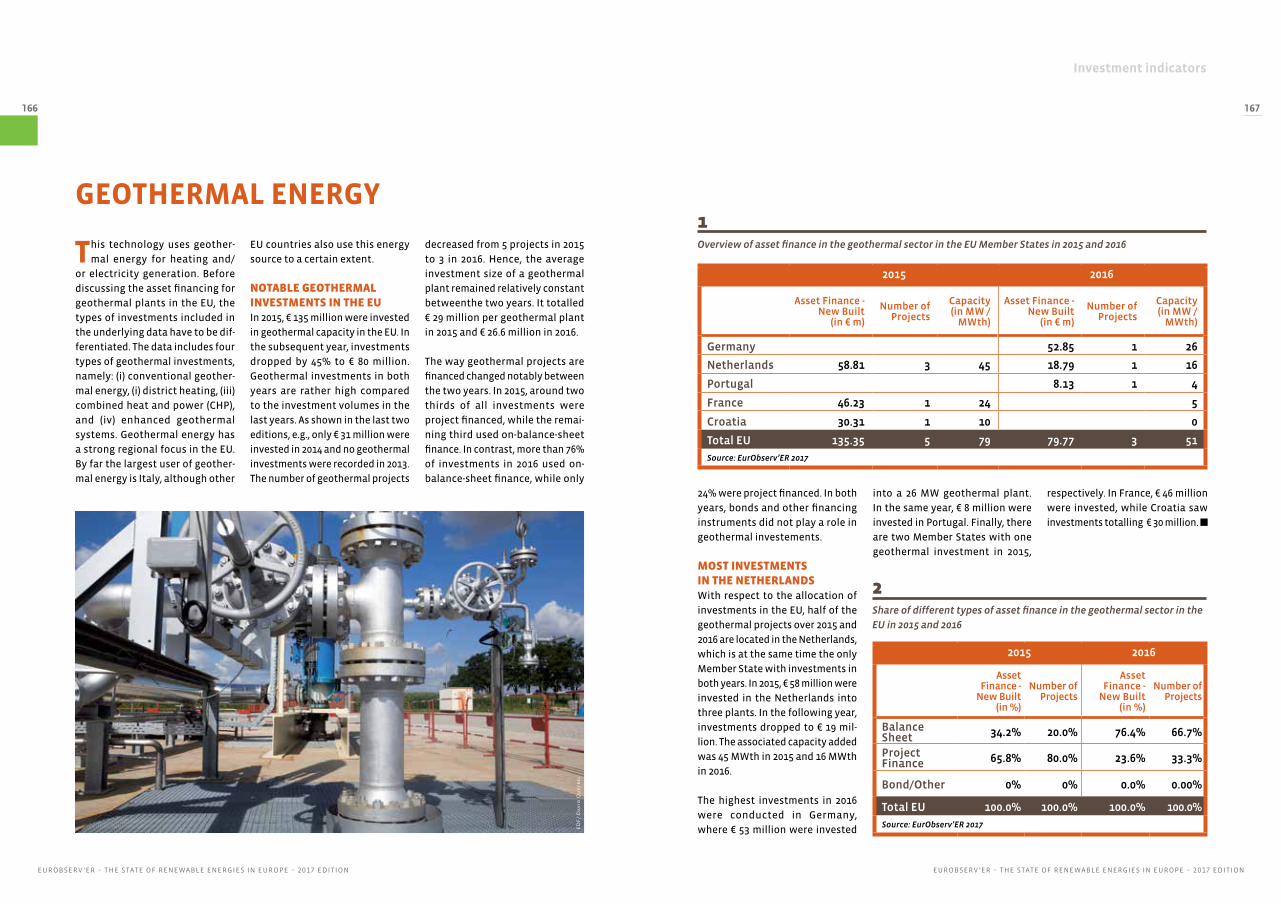
Investment indicators
EUROBSERV ’ER – THE STATE OF RENEWABLE ENERGIES IN EUROPE – 2017 EDITIONEUROBSERV ’ER – THE STATE OF RENEWABLE ENERGIES IN EUROPE – 2017 EDITION
166 167
1Overview of asset finance in the geothermal sector in the EU Member States in 2015 and 2016
2015 2016
Asset Finance - New Built
(in € m)
Number of Projects
Capacity (in MW /
MWth)
Asset Finance - New Built
(in € m)
Number of Projects
Capacity (in MW /
MWth)
Germany 52.85 1 26
Netherlands 58.81 3 45 18.79 1 16
Portugal 8.13 1 4
France 46.23 1 24 5
Croatia 30.31 1 10 0
Total EU 135.35 5 79 79.77 3 51
Source: EurObserv’ER 2017
This technology uses geother-
mal energy for heating and/
or electricity generation. Before
discussing the asset financing for
geothermal plants in the EU, the
types of investments included in
the underlying data have to be dif-
ferentiated. The data includes four
types of geothermal investments,
namely: (i) conventional geother-
mal energy, (i) district heating, (iii)
combined heat and power (CHP),
and (iv) enhanced geothermal
systems. Geothermal energy has
a strong regional focus in the EU.
By far the largest user of geother-
mal energy is Italy, although other
GEOTHERMAL ENERGY
EU countries also use this energy
source to a certain extent.
NOTABLE GEOTHERMAL INVESTMENTS IN THE EUIn 2015, € 135 million were invested
in geothermal capacity in the EU. In
the subsequent year, investments
dropped by 45% to € 80 million.
Geothermal investments in both
years are rather high compared
to the investment volumes in the
last years. As shown in the last two
editions, e.g., only € 31 million were
invested in 2014 and no geothermal
investments were recorded in 2013.
The number of geothermal projects
decreased from 5 projects in 2015
to 3 in 2016. Hence, the average
investment size of a geothermal
plant remained relatively constant
betweenthe two years. It totalled
€ 29 million per geothermal plant
in 2015 and € 26.6 million in 2016.
The way geothermal projects are
financed changed notably between
the two years. In 2015, around two
thirds of all investments were
project financed, while the remai-
ning third used on-balance-sheet
finance. In contrast, more than 76%
of investments in 2016 used on-
balance-sheet finance, while only
2Share of different types of asset finance in the geothermal sector in the
EU in 2015 and 2016
24% were project financed. In both
years, bonds and other financing
instruments did not play a role in
geothermal investements.
MOST INVESTMENTS IN THE NETHERLANDSWith respect to the allocation of
investments in the EU, half of the
geothermal projects over 2015 and
2016 are located in the Netherlands,
which is at the same time the only
Member State with investments in
both years. In 2015, € 58 million were
invested in the Netherlands into
three plants. In the following year,
investments dropped to € 19 mil-
lion. The associated capacity added
was 45 MWth in 2015 and 16 MWth
in 2016.
The highest investments in 2016
were conducted in Germany,
where € 53 million were invested
2015 2016
Asset Finance -
New Built (in %)
Number of Projects
Asset Finance -
New Built (in %)
Number of Projects
Balance Sheet 34.2% 20.0% 76.4% 66.7%
Project Finance 65.8% 80.0% 23.6% 33.3%
Bond/Other 0% 0% 0.0% 0.00%
Total EU 100.0% 100.0% 100.0% 100.0%
Source: EurObserv’ER 2017ED
F/
Dav
id Q
uey
rel
into a 26 MW geothermal plant.
In the same year, € 8 million were
invested in Portugal. Finally, there
are two Member States with one
geothermal investment in 2015,
respectively. In France, € 46 million
were invested, while Croatia saw
investments totalling € 30 million. n
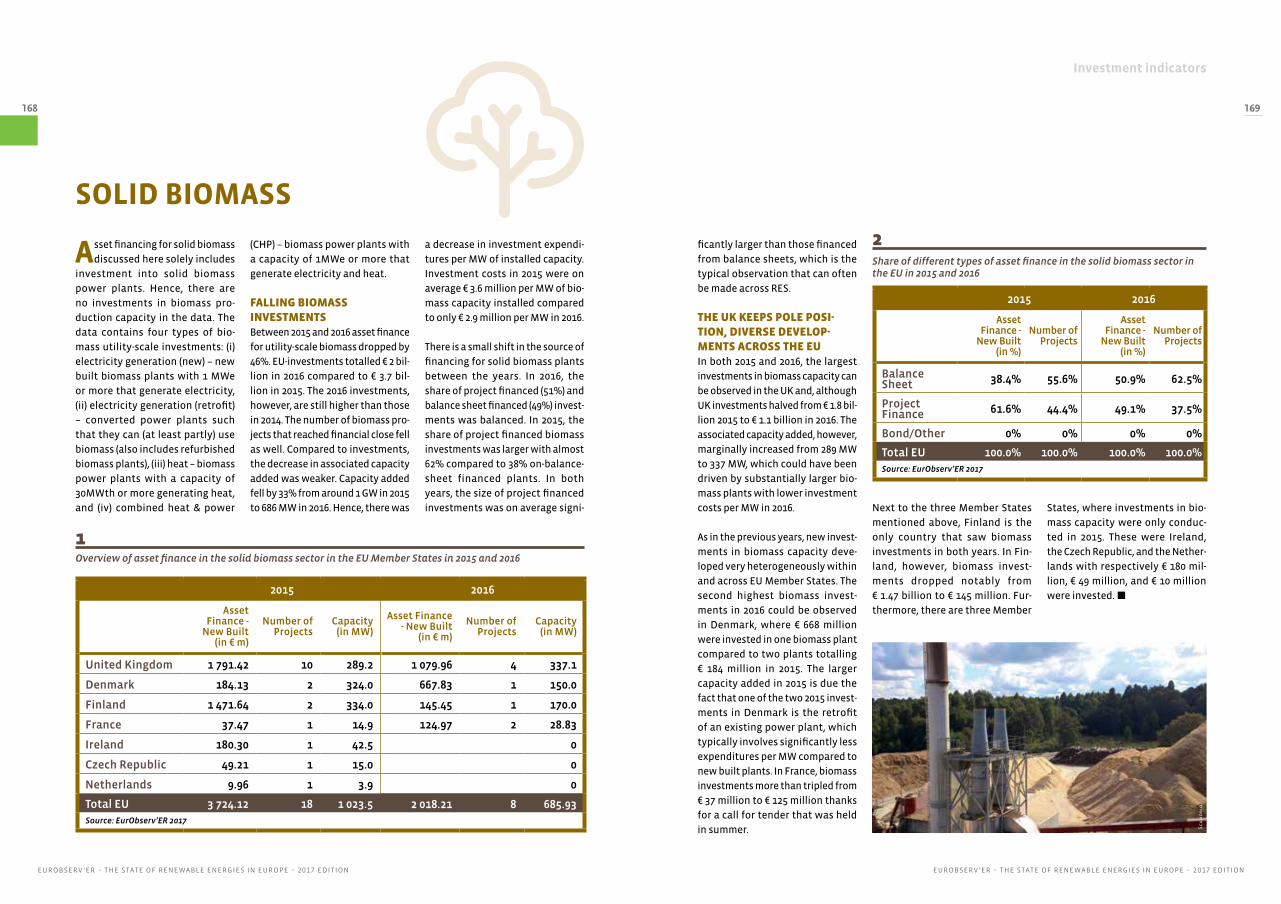
Investment indicators
EUROBSERV ’ER – THE STATE OF RENEWABLE ENERGIES IN EUROPE – 2017 EDITIONEUROBSERV ’ER – THE STATE OF RENEWABLE ENERGIES IN EUROPE – 2017 EDITION
168 169
(CHP) – biomass power plants with
a capacity of 1MWe or more that
generate electricity and heat.
FALLING BIOMASS INVESTMENTSBetween 2015 and 2016 asset finance
for utility-scale biomass dropped by
46%. EU-investments totalled € 2 bil-
lion in 2016 compared to € 3.7 bil-
lion in 2015. The 2016 investments,
however, are still higher than those
in 2014. The number of biomass pro-
jects that reached financial close fell
as well. Compared to investments,
the decrease in associated capacity
added was weaker. Capacity added
fell by 33% from around 1 GW in 2015
to 686 MW in 2016. Hence, there was
a decrease in investment expendi-
tures per MW of installed capacity.
Investment costs in 2015 were on
average € 3.6 million per MW of bio-
mass capacity installed compared
to only € 2.9 million per MW in 2016.
There is a small shift in the source of
financing for solid biomass plants
between the years. In 2016, the
share of project financed (51%) and
balance sheet financed (49%) invest-
ments was balanced. In 2015, the
share of project financed biomass
investments was larger with almost
62% compared to 38% on-balance-
sheet financed plants. In both
years, the size of project financed
investments was on average signi-
Asset financing for solid biomass
discussed here solely includes
investment into solid biomass
power plants. Hence, there are
no investments in biomass pro-
duction capacity in the data. The
data contains four types of bio-
mass utility-scale investments: (i)
electricity generation (new) – new
built biomass plants with 1 MWe
or more that generate electricity,
(ii) electricity generation (retrofit)
– converted power plants such
that they can (at least partly) use
biomass (also includes refurbished
biomass plants), (iii) heat – biomass
power plants with a capacity of
30MWth or more generating heat,
and (iv) combined heat & power
SOLID BIOMASS
2015 2016
Asset Finance -
New Built (in € m)
Number of Projects
Capacity (in MW)
Asset Finance - New Built
(in € m)
Number of Projects
Capacity (in MW)
United Kingdom 1 791.42 10 289.2 1 079.96 4 337.1
Denmark 184.13 2 324.0 667.83 1 150.0
Finland 1 471.64 2 334.0 145.45 1 170.0
France 37.47 1 14.9 124.97 2 28.83
Ireland 180.30 1 42.5 0
Czech Republic 49.21 1 15.0 0
Netherlands 9.96 1 3.9 0
Total EU 3 724.12 18 1 023.5 2 018.21 8 685.93Source: EurObserv’ER 2017
ficantly larger than those financed
from balance sheets, which is the
typical observation that can often
be made across RES.
THE UK KEEPS POLE POSI-TION, DIVERSE DEVELOP-MENTS ACROSS THE EUIn both 2015 and 2016, the largest
investments in biomass capacity can
be observed in the UK and, although
UK investments halved from € 1.8 bil-
lion 2015 to € 1.1 billion in 2016. The
associated capacity added, however,
marginally increased from 289 MW
to 337 MW, which could have been
driven by substantially larger bio-
mass plants with lower investment
costs per MW in 2016.
As in the previous years, new invest-
ments in biomass capacity deve-
loped very heterogeneously within
and across EU Member States. The
second highest biomass invest-
ments in 2016 could be observed
in Denmark, where € 668 million
were invested in one biomass plant
compared to two plants totalling
€ 184 million in 2015. The larger
capacity added in 2015 is due the
fact that one of the two 2015 invest-
ments in Denmark is the retrofit
of an existing power plant, which
typically involves significantly less
expenditures per MW compared to
new built plants. In France, biomass
investments more than tripled from
€ 37 million to € 125 million thanks
for a call for tender that was held
in summer.
Next to the three Member States
mentioned above, Finland is the
only country that saw biomass
investments in both years. In Fin-
land, however, biomass invest-
ments dropped notably from
€ 1.47 billion to € 145 million. Fur-
thermore, there are three Member
States, where investments in bio-
mass capacity were only conduc-
ted in 2015. These were Ireland,
the Czech Republic, and the Nether-
lands with respectively € 180 mil-
lion, € 49 million, and € 10 million
were invested. n
1Overview of asset finance in the solid biomass sector in the EU Member States in 2015 and 2016
2015 2016
Asset Finance -
New Built (in %)
Number of Projects
Asset Finance -
New Built (in %)
Number of Projects
Balance Sheet 38.4% 55.6% 50.9% 62.5%
Project Finance 61.6% 44.4% 49.1% 37.5%
Bond/Other 0% 0% 0% 0%
Total EU 100.0% 100.0% 100.0% 100.0%Source: EurObserv’ER 2017
2Share of different types of asset finance in the solid biomass sector in the EU in 2015 and 2016
Sc
an
dbi
o
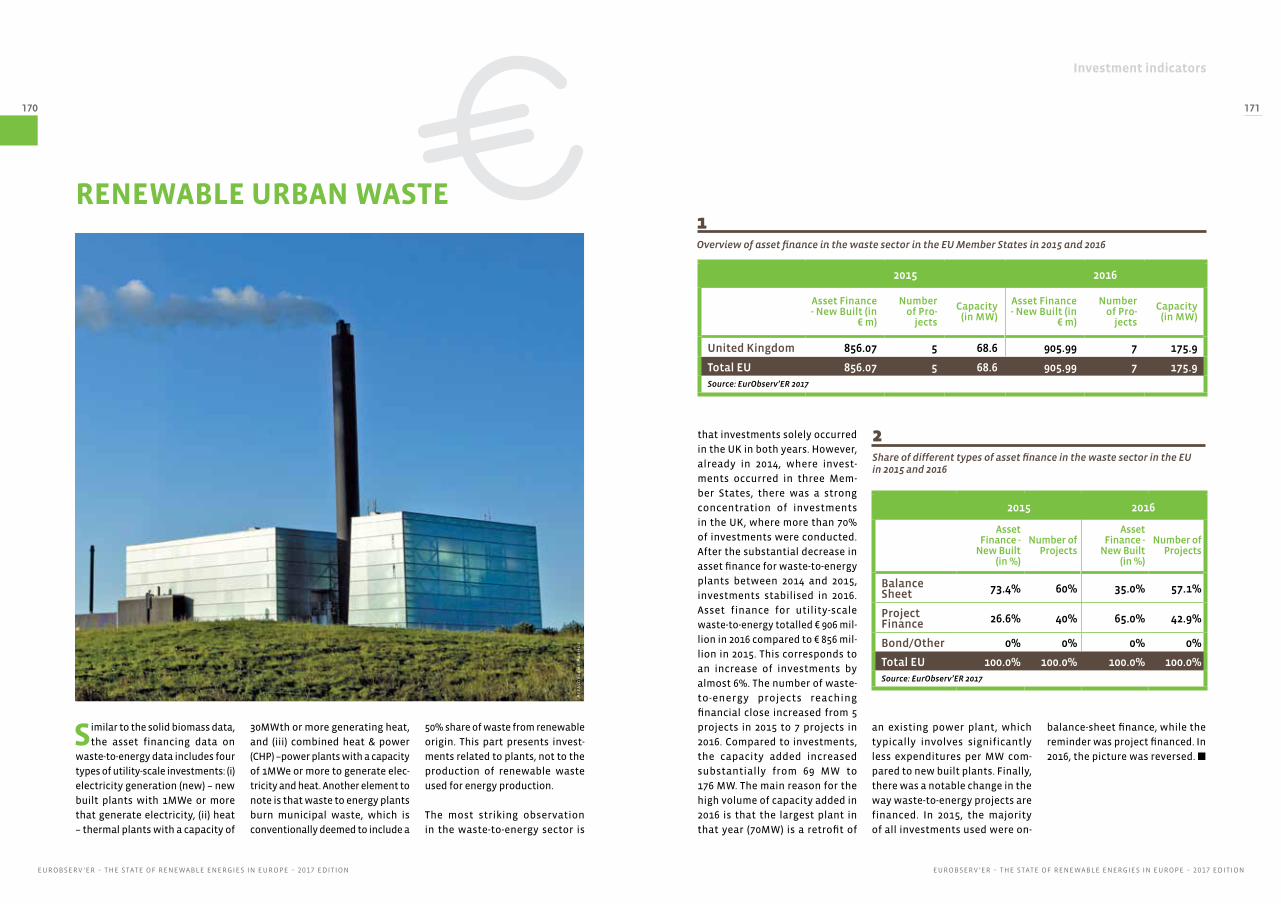
Investment indicators
EUROBSERV ’ER – THE STATE OF RENEWABLE ENERGIES IN EUROPE – 2017 EDITIONEUROBSERV ’ER – THE STATE OF RENEWABLE ENERGIES IN EUROPE – 2017 EDITION
170 171
Similar to the solid biomass data,
the asset financing data on
waste-to-energy data includes four
types of utility-scale investments: (i)
electricity generation (new) – new
built plants with 1MWe or more
that generate electricity, (ii) heat
– thermal plants with a capacity of
RENEWABLE URBAN WASTE
30MWth or more generating heat,
and (iii) combined heat & power
(CHP) –power plants with a capacity
of 1MWe or more to generate elec-
tricity and heat. Another element to
note is that waste to energy plants
burn municipal waste, which is
conventionally deemed to include a
that investments solely occurred
in the UK in both years. However,
already in 2014, where invest-
ments occurred in three Mem-
ber States, there was a strong
concentration of investments
in the UK, where more than 70%
of investments were conducted.
After the substantial decrease in
asset finance for waste-to-energy
plants between 2014 and 2015,
investments stabilised in 2016.
Asset finance for utility-scale
waste-to-energy totalled € 906 mil-
lion in 2016 compared to € 856 mil-
lion in 2015. This corresponds to
an increase of investments by
almost 6%. The number of waste-
to-energy projects reaching
financial close increased from 5
projects in 2015 to 7 projects in
2016. Compared to investments,
the capacity added increased
substantially from 69 MW to
176 MW. The main reason for the
high volume of capacity added in
2016 is that the largest plant in
that year (70MW) is a retrofit of
2015 2016
Asset Finance - New Built (in
€ m)
Number of Pro-
jects
Capacity (in MW)
Asset Finance - New Built (in
€ m)
Number of Pro-
jects
Capacity (in MW)
United Kingdom 856.07 5 68.6 905.99 7 175.9
Total EU 856.07 5 68.6 905.99 7 175.9Source: EurObserv’ER 2017
2015 2016
Asset Finance -
New Built (in %)
Number of Projects
Asset Finance -
New Built (in %)
Number of Projects
Balance Sheet 73.4% 60% 35.0% 57.1%
Project Finance 26.6% 40% 65.0% 42.9%
Bond/Other 0% 0% 0% 0%
Total EU 100.0% 100.0% 100.0% 100.0%Source: EurObserv’ER 2017
1Overview of asset finance in the waste sector in the EU Member States in 2015 and 2016
2Share of different types of asset finance in the waste sector in the EU in 2015 and 2016
an existing power plant, which
typically involves significantly
less expenditures per MW com-
pared to new built plants. Finally,
there was a notable change in the
way waste-to-energy projects are
financed. In 2015, the majority
of all investments used were on-
balance-sheet finance, while the
reminder was project financed. In
2016, the picture was reversed. n
50% share of waste from renewable
origin. This part presents invest-
ments related to plants, not to the
production of renewable waste
used for energy production.
The most striking observation
in the waste-to-energy sector is
Aff
ald
Va
rm
e A
ar
hu
s

Investment indicators
EUROBSERV ’ER – THE STATE OF RENEWABLE ENERGIES IN EUROPE – 2017 EDITIONEUROBSERV ’ER – THE STATE OF RENEWABLE ENERGIES IN EUROPE – 2017 EDITION
172 173
In this section, EurObserv’ER
presents RES investment costs
in the EU and major EU trading
partners. This comparison is
based on investments in utility-
size RES power plants. Investment
costs are defined as the average
investment expenditures per MW
of capacity in the respective RES
sector. These average investment
INTERNATIONAL COMPARISON OF EU INVESTMENT COSTS
expenditures per MW are cal-
culated for the EU as well as for
some major EU trading partners,
namely China, Canada, India,
Japan, Norway, Russian Federa-
tion, Turkey and the United States.
However, there are several cases,
where some of these countries
did not experience investments
in capacity in certain RES sectors.
Hence, the number of countries,
where investments costs can be
calculated and reported, differs
across RES technologies.
WIND ONSHORE AND OFFSHORE INVESTMENT EXPENDITURESInvestments expenditures per
MW of onshore wind capacity
almost remained constant in the
EU with € 1.42 million in 2015 and
€ 1.44 million in 2016. These invest-
ment costs are marginally higher
than the average non-EU invest-
ment costs. However, in most of
the analysed non-EU countries,
the investment expenditures per
MW increased stronger than in the
EU, e.g. in Canada and the United
States. Hence, the difference
between the EU and the non-EU
investment costs per MW onshore
declined, as the latter increased
from € 1.27 million to € 1.4 million.
In contrast to onshore, only
very few of the analysed non-EU
countries experienced offshore
wind investments, namely Japan
and the United States in 2015 only
as well as China in both years. Due
the very few underlying offshore
wind projects – e.g., Japan and
the United States saw one off-
shore wind investment, respec-
tively – it is difficult to compare
the investment costs. In both
countries, the 2015 investments
were demonstration / first of their
2015 2016
Canada 1.56 1.65
China 1.26 1.25
India 1.01 1.04
Japan 1.26 1.91
Norway 1.26 1.18
Russian Federation 1.26 1.40
Turkey 1.26 1.33
United States 1.32 1.45
Average EU 1.42 1.44
Source: EurObserv’ER 2017
2015 2016
China 2.89 2.43
Japan 5.19
United States 9.39
Average EU 4.61 4.07
Source: EurObserv’ER 2017
kind projects, which might explain
the very high costs per MW.
INVESTMENT EXPENDITURES FOR PV AND BIOMASSIn contrast to the wind sector,
investment expenditures per MW
for solar PV plants dropped notably
in the EU, namely from € 1.43 mil-
lion in 2015 to only € 1.12 million
in 2016. The same trend could be
observed in the analysed non-EU
countries. On average invest-
ment expenditures per MW of
PV dropped from € 1.67 million
to € 1.28 million. Hence, in both
years, investment costs for PV
are notably below the average of
1Wind Onshore Investment Expenditures (€ m per MW)
2Wind Offshore Investment Expenditures (€ m per MW)
Po
nse
e

Investment indicators
EUROBSERV ’ER – THE STATE OF RENEWABLE ENERGIES IN EUROPE – 2017 EDITIONEUROBSERV ’ER – THE STATE OF RENEWABLE ENERGIES IN EUROPE – 2017 EDITION
174 175
2015 2016
Canada 2.75 1.74
China 1.40 1.17
India 1.00 0.88
Japan 1.82 1.79
Russian Federation 1.70 1.09
Turkey 1.35 1.09
United States 1.69 1.20
Average EU 1.43 1.12Source: EurObserv’ER 2017
2015 2016
China 1.77 1.60
Japan 2.51 3.41
United States 3.61 2.52
Average EU 3.64 2.73Source: EurObserv’ER 2017
the analysed non-EU economies,
but the situation is contrasted
when considering the different
countries. India shows the lowest
rate with € 0,88 million per MW
while Japan and Canada are above
€1.70 million per MW.
In the biomass sector, the invest-
ment costs for one MW of capacity
in the EU was € 3.64 million per MW
in 2015 and € 2.73 million in 2016.
These expenditures were higher
than the average of the conside-
red non-EU countries, which were
€ 2.63 million per MW in 2015 and
€ 2.51 million in 2016. However,
the difference notably declined
between both years. Analogue in
the case of offshore wind, however,
these numbers have to be inter-
preted with care due to, in some
cases, very few observations. In
the United States, e.g., only one
biomass investment was recorded
per year.
Overall, the analysis shows a hete-
rogeneous picture across RES tech-
nologies. While investment costs
per MW of capacity seem to be
below the average of the consi-
dered non-EU countries for some
technologies, e.g. photovoltaic,
they seem to be higher for others,
e.g. onshore wind. Investment
costs seemed to have decreased
between 2015 and 2016 in most of
the analysed RES sectors in the EU
and among its competitors. n
3Solar PV Investment Expenditures (€ m per MW)
4Biomass Investment Expenditures (€ m per MW)
Sc
hö
nin
g F
oto
des
ign
Lag
erw
ey/J
or
rit
Lo
usb
erg
Investment indicators
EUROBSERV ’ER – THE STATE OF RENEWABLE ENERGIES IN EUROPE – 2017 EDITIONEUROBSERV ’ER – THE STATE OF RENEWABLE ENERGIES IN EUROPE – 2017 EDITION
176 177
To capture the involvement
of the public sector in RES
financing, EurObserv’ER gathered
information on national and EU-
wide financing or promotion pro-
grammes. In general, public finance
institutions can play an important
role in catalysing and mobilising
investment in renewable energy.
There are numerous instruments
which are used by these institu-
tions, which are typically either
state-owned or mandated by their
national government or the Euro-
pean Union. The instruments range
from providing subsidies/grants or
equity to classic concessional len-
ding (loans with favourable condi-
tions / soft loans) or guarantees.
The dominant instrument in terms
of financial volume is concessional
lending. The loans provided by
public finance institutions are typi-
cally aimed at projects that have
commercial prospects, but would
not have happened without the
public bank’s intervention.
In this section, an overview of
public finance programmes for
RES investments available in
2015 and/or 2016 is presented.
This overview only contains pro-
grammes, where financial instru-
ments, as debt / equity finance or
guarantees, are offered. Hence, it
is complementary to the country
profiles on RES policies and regu-
lations. As the overview concen-
trates on dedicated RES financing
programmes or funds focussing
on RES, it might omit public
finance institutions that provide
RES financing without having
explicitly set up a programme
or dedicated fund. An example
is the Nordic Investment Bank
(NIB) that also offers loans for
RES investments to its member
countries, namely Denmark, Fin-
land, Iceland, Norway, Sweden,
Estonia, Latvia, and Lithuania.
The overview comprises both
programmes and funds that only
provide finance for RES invest-
ments as well as those, with other
focus areas next to renewables, as
energy efficiency investments. An
example of the latter is the Slovak
Energy Efficiency and Renewable
Energy Finance Facility that, next
to RES investments, also targets
residential and industrial energy
efficiency.
OVERVIEW OF INSTITUTIONSThere are a number of public
finance institutions with dedicated
financing programmes for RES in
the EU. These include, but are not
limited to, the two European public
banks – the European Investment
Bank (EIB) and the European Bank
of Reconstruction and Develop-
ment (EBRD) – as well as numerous
regional and national public banks
such as the KfW (Kreditanstalt für
Wiederaufbau), Cassa Depositi e
PUBLIC FINANCE PROGRAMMES FOR RES INVESTMENTS
Prestiti, or the Croatian Bank for
Reconstruction and Development
(HBOR). Furthermore, there are
numerous funds, which provide
financing for RES investments.
These include EU-wide funds, as
the European Regional and Deve-
lopment Fund (ERDF) or the Cohe-
sion Fund of the EIB, as well as
national funds, as the Slovenian
Environmental Public Fund (Eco-
Fund) or the Lithuanian Environ-
mental Investment Fund (LEIF).
Finally, there are also dedicated
financing facilities that provide
lending for RES investments and
typically also offer technical assis-
tance to private banks. Examples
are the Polish Sustainable Energy
Financing Facility (PolSEFF²) or
the Slovak Energy Efficiency and
Renewable Energy Finance Facility
(SLOVSEFF III) of the EBRD.
FINANCING SCHEMES AND INSTRUMENTSThe presented public finance
programmes differ with respect
to financing instruments used,
financing amounts, and types of
final beneficiaries. Most of the pro-
grammes and funds offer conces-
sional financing. In some cases,
also loan guarantees are offered.
There are also substantial dif-
ferences in the way financing is
provided for RES investments of
the final beneficiaries. In many
cases, as the KfW Renewable
Energies Programme, direct len-
ding is available, i.e. the borrower
directly receives a loan from the
public finance institution. The
loans might also be tied to certain
conditions, e.g. that private banks
also provide financing for the res-
pective RES investment. In the KfW
Programme Offshore Wind Energy,
direct public loans are given in
the framework of bank consor-
tia, where private banks have to
provide at least the same amount
of debt financing. Alternatively,
there are cases, where financing
is provided indirectly, i.e. via a
private partner institution. Such
a structure is being used within
EBRD’s Polish Sustainable Energy
Finance Facility (PolSEFF) that
offers loans to SMEs for invest-
ments in sustainable energy tech-
nologies. PolSEFF, however, is not
lending directly to SMEs, but rather
provides credit lines to private par-
tner banks, which then on lend to
the final beneficiaries.
Finally, there are considerable dif-
ferences in the financing volumes
across programmes. The KfW
Funding Initiative Energy Transi-
tion, e.g., focuses on large-scale
RES investments with loans ran-
ging from € 25 to € 100 million. In
contrast, the Polish programme
PROSUMER focuses on micro-ins-
tallations, e.g. small RES electri-
city installations of up to 40kWe.
Overall, a wide variety of financing
schemes, used instruments, and
focused final borrowers can be
observed in the EU.
It is possible that public involve-
ment in financing RES projects in
the EU will slow down in the next
years, similar to other RES support
mechanisms. The need of public
finance might decline as different
RES technologies mature over the
years. However, RES investments
will remain highly dependent on
services provided by capital mar-
kets. As they are typically charac-
terised by high up-front and low
operation costs, the cost structure
of RES projects is dominated by
capital costs. n
Pix
ab
ay
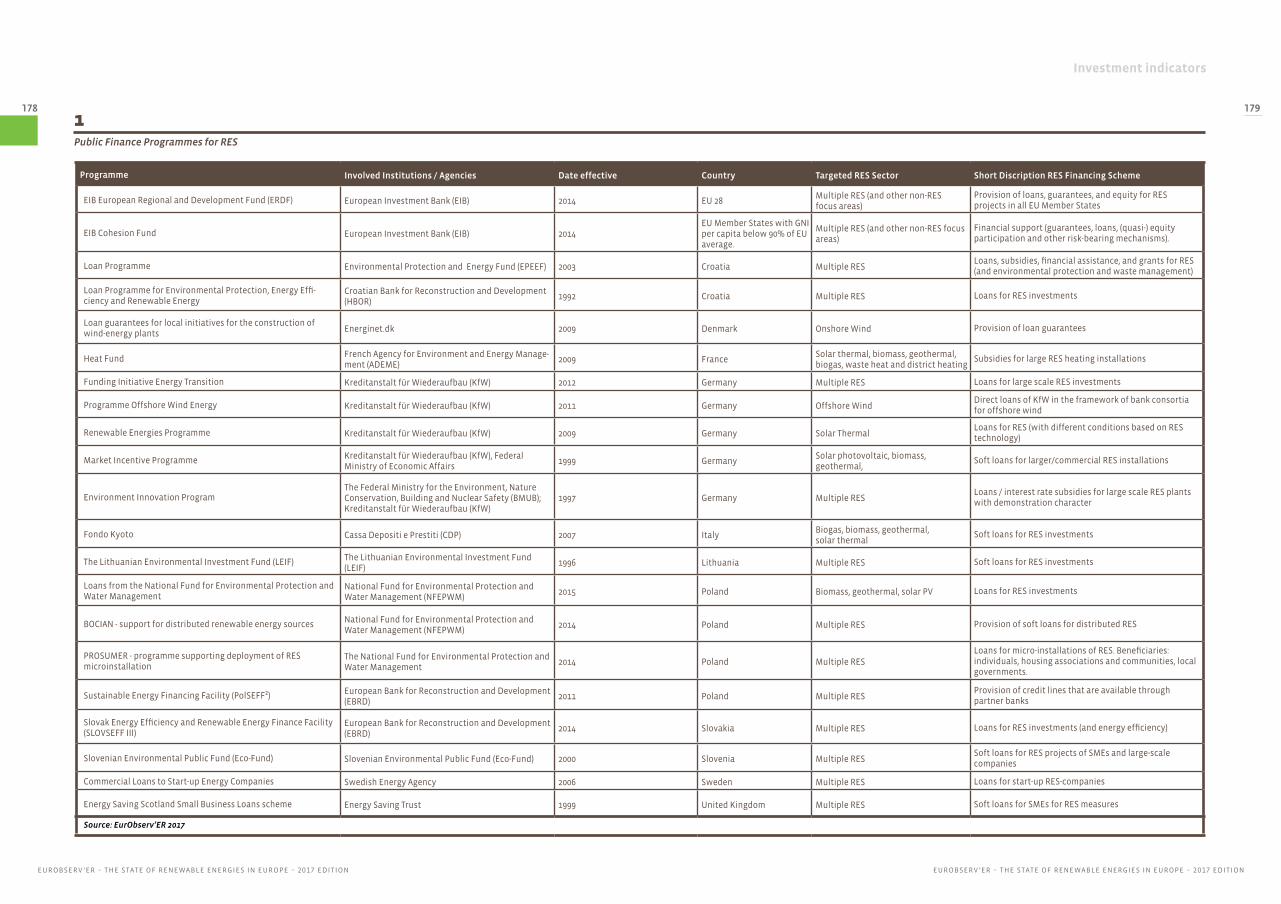
Investment indicators
EUROBSERV ’ER – THE STATE OF RENEWABLE ENERGIES IN EUROPE – 2017 EDITIONEUROBSERV ’ER – THE STATE OF RENEWABLE ENERGIES IN EUROPE – 2017 EDITION
178 179
Programme Involved Institutions / Agencies Date effective Country Targeted RES Sector Short Discription RES Financing Scheme
EIB European Regional and Development Fund (ERDF) European Investment Bank (EIB) 2014 EU 28Multiple RES (and other non-RES focus areas)
Provision of loans, guarantees, and equity for RES projects in all EU Member States
EIB Cohesion Fund European Investment Bank (EIB) 2014EU Member States with GNI per capita below 90% of EU average.
Multiple RES (and other non-RES focus areas)
Financial support (guarantees, loans, (quasi-) equity participation and other risk-bearing mechanisms).
Loan Programme Environmental Protection and Energy Fund (EPEEF) 2003 Croatia Multiple RESLoans, subsidies, financial assistance, and grants for RES (and environmental protection and waste management)
Loan Programme for Environmental Protection, Energy Effi-ciency and Renewable Energy
Croatian Bank for Reconstruction and Development (HBOR)
1992 Croatia Multiple RES Loans for RES investments
Loan guarantees for local initiatives for the construction of wind-energy plants Energinet.dk 2009 Denmark Onshore Wind Provision of loan guarantees
Heat Fund French Agency for Environment and Energy Manage-ment (ADEME)
2009 FranceSolar thermal, biomass, geothermal, biogas, waste heat and district heating
Subsidies for large RES heating installations
Funding Initiative Energy Transition Kreditanstalt für Wiederaufbau (KfW) 2012 Germany Multiple RES Loans for large scale RES investments
Programme Offshore Wind Energy Kreditanstalt für Wiederaufbau (KfW) 2011 Germany Offshore WindDirect loans of KfW in the framework of bank consortia for offshore wind
Renewable Energies Programme Kreditanstalt für Wiederaufbau (KfW) 2009 Germany Solar ThermalLoans for RES (with different conditions based on RES technology)
Market Incentive Programme Kreditanstalt für Wiederaufbau (KfW), Federal Ministry of Economic Affairs
1999 GermanySolar photovoltaic, biomass, geothermal,
Soft loans for larger/commercial RES installations
Environment Innovation ProgramThe Federal Ministry for the Environment, Nature Conservation, Building and Nuclear Safety (BMUB); Kreditanstalt für Wiederaufbau (KfW)
1997 Germany Multiple RESLoans / interest rate subsidies for large scale RES plants with demonstration character
Fondo Kyoto Cassa Depositi e Prestiti (CDP) 2007 ItalyBiogas, biomass, geothermal, solar thermal
Soft loans for RES investments
The Lithuanian Environmental Investment Fund (LEIF) The Lithuanian Environmental Investment Fund (LEIF)
1996 Lithuania Multiple RES Soft loans for RES investments
Loans from the National Fund for Environmental Protection and Water Management
National Fund for Environmental Protection and Water Management (NFEPWM)
2015 Poland Biomass, geothermal, solar PV Loans for RES investments
BOCIAN - support for distributed renewable energy sources National Fund for Environmental Protection and Water Management (NFEPWM)
2014 Poland Multiple RES Provision of soft loans for distributed RES
PROSUMER - programme supporting deployment of RES microinstallation
The National Fund for Environmental Protection and Water Management
2014 Poland Multiple RESLoans for micro-installations of RES. Beneficiaries: individuals, housing associations and communities, local governments.
Sustainable Energy Financing Facility (PolSEFF²) European Bank for Reconstruction and Development (EBRD)
2011 Poland Multiple RESProvision of credit lines that are available through partner banks
Slovak Energy Efficiency and Renewable Energy Finance Facility (SLOVSEFF III)
European Bank for Reconstruction and Development (EBRD)
2014 Slovakia Multiple RES Loans for RES investments (and energy efficiency)
Slovenian Environmental Public Fund (Eco-Fund) Slovenian Environmental Public Fund (Eco-Fund) 2000 Slovenia Multiple RESSoft loans for RES projects of SMEs and large-scale companies
Commercial Loans to Start-up Energy Companies Swedish Energy Agency 2006 Sweden Multiple RES Loans for start-up RES-companies
Energy Saving Scotland Small Business Loans scheme Energy Saving Trust 1999 United Kingdom Multiple RES Soft loans for SMEs for RES measures
Source: EurObserv’ER 2017
1Public Finance Programmes for RES

Investment indicators
EUROBSERV ’ER – THE STATE OF RENEWABLE ENERGIES IN EUROPE – 2017 EDITIONEUROBSERV ’ER – THE STATE OF RENEWABLE ENERGIES IN EUROPE – 2017 EDITION
180 181
Investment in Renewable Energy Technology
Methodological note
Performance of RES technology firms and assets on public markets
VENTURE CAPITAL & PRIVATE EQUITYEurObserv’ER collects data investments of venture
capital and private equity funds into renewable
energy technology developing firms. Venture capi-
tal (VC) focuses on very young start-up companies
typically with high risks and high potential returns.
Venture capital can be provided to back an idea of
an entrepreneur before the business has started.
It may be used to finalize technology development
or to develop initial business concepts before the
start-up phase. Venture capital can be also used
in the subsequent start-up phase to finance e.g.
product development and initial marketing or the
expansion of a business. Basically, venture capital
funds finance risky start-ups with the aim to sell the
shares with a profit. Private equity (PE) is a type of
equity that is not traded on stock markets. Gene-
rally, PE aims at more mature companies than VC
and can be divided into two types. PE expansion
capital is financing companies that plan to expand
or restructure their operations or enter new mar-
kets. While expansion capital is usually a minority
investment, PE buy-outs are investments to buy a
company. These investments are often accompa-
nied by large amounts of borrowed money due to
the usually high acquisition costs.
Summing up, venture capital investments target
renewable energy technology firms at the start-
up phase, while private equity aims at relatively
mature companies. While VC investments are typi-
cally small, private equity deals are usually larger
than VC deals. PE-buyouts are in general and by
far the largest deals since in such a deal a mature
company is acquired. All these investments toge-
ther shed a light on the activity of start-up and
young renewable energy technology firms, while
it is essential to distinguish between the typically
large PE buy-outs and the other investments when
analysing the VC/PE investments in the RES sec-
tors. Hence, a breakdown of VC/PE investments by
investment stage will be provided to show a more
comprehensive picture.
The EurObserv’ER investment indicators also focus
on investments related to the development and pro-
duction of RES technologies as well as the perfor-
mance of RES firms and assets. Hence, information
of venture capital and private equity investments
is presented. Additionally, RES indices based on EU
RES firms are constructed and the performance of
YieldCos is tracked. The RES indices are intended to capture the situa-
tion and dynamics on the EU market for equip-
ment manufacturers and project developers.
The methodological approach is to include EU
RES firms that are listed on stock markets and
where the firms’ revenues were (almost) enti-
rely generated by RES operations. Hence, there
might be important large firms that are not
included in the indices. The reason is that there
are numerous (partly very large) companies that
produce renewable energy technologies but are
also active in other sectors (e.g. manufacturers
producing wind turbines, but as well turbines
for conventional power plants). These are not
included since their stock prices might be largely
influenced by their operations in other areas than
RES. Furthermore, there is also a large group of
small firms that are not listed on stock markets
which hence are also not included here. For the
sectoral indices, RES firms are allocated if they
are only (or mainly) active in the respective sec-
tor. The final choice among the firms in each sec-
tor is done by the firm size measured in revenues.
Hence, the indices contain the ten largest quoted
RES firms in the EU in the respective sector.
The indices are constructed as Laspeyres-Indices.
The aim of a Laspeyres-Index is to show the
aggregated price changes, since the weighting
is used based on the base values. Hence, firms
are weighted by their revenues in the respective
previous period. In 2015, the firms are weighted
by their 2014 revenues whereas in 2016, the
2015 revenues are applied. So the weighting is
adjusted every year in order to keep the struc-
ture appropriate. The reason for this approach
– in contrast to weighting the firms according to
their market capitalisation – is that this approach
reflects less the short term stock market fluctua-
tions but rather focuses on long-term develop-
ments as it is in this analysis that concentrates on
the development of two years. The top ten firms
for the respective RES Technology Indices are
selected based on their 2015 revenues.
Furthermore, EurObserv’ER collects and ana-
lyses data on YieldCos. YieldCos are entities that
own cash-generating infrastructure assets, e.g.
renewable energy plants, where the ownership
is offered on public markets. Hence, YieldCos are
also listed on stock markets. As there are only
very few YieldCos currently operational in the EU,
the stock prices of these will be captured rather
than constructing an index as in the case of RES
firms.
Investment indicators
EUROBSERV ’ER – THE STATE OF RENEWABLE ENERGIES IN EUROPE – 2017 EDITIONEUROBSERV ’ER – THE STATE OF RENEWABLE ENERGIES IN EUROPE – 2017 EDITION
182 183
Total venture capital (VC) and
private equity (PE) investments
in renewable energy companies
remained stable between 2015
and 2016. VC/PE in the EU totalled
€ 2.04 billion in 2015 and € 2.02 bil-
lion in 2016. The VC/PE investment
amounts in both years are, howe-
ver, substantially below the very
high investments of € 3.67 billion
in 2014. This development in VC/
PE investments in the RES sectors
is overall in line with the observed
trends across all other sectors in
the EU. According to the data of
the European Private Equity and
Venture Capital Association (EVCA),
overall EU-wide VC/PE investments
(covering all sectors) showed a
decrease in investments by 1.2%
compared to a 0.8% decrease of
VC/PE investments in RES.
BREAKDOWN OF VC/PE INVESTMENT STAGESFor this analysis, the overall VC/PE
investments for all RES in the EU
are disaggregated into four invest-
ment stages: (i) VC Early Stage, (ii)
VC Late Stage, (iii) PE Expansion
Capital, and (iv) PE Buy-outs. Early-
stage venture capital is provided
to early-stage / emerging young
companies, e.g., for research and
development in order to develop
a product or business plan and
make it marketable. Late-stage VC
is typically used to finance initial
production capacities or marke-
ting activities. PE is typically used
in later stages of a firm’s life cycle.
PE Expansion Capital is typically
used by mature / established
companies to expand their activi-
ties by, e.g., scaling-up production
facilities. Finally, PE Buy-outs are
investments to buy (a majority of)
a RES company and often imply
high investments compared to the
other PE and particularly VC deals.
Between 2015 and 2016, PE invest-
ments fell by almost 9%. In particu-
lar PE Buy-outs decreased notably
from € 1.85 billion to € 1.67 billion.
As it could also be observed in the
last years, the share of PE Buy-outs
is relatively large in overall VC/PE
investments. Their share totalled
almost 91% in 2015 and decreased
to 83% in 2016. A similar pattern
can also be observed for overall VC/
PE investments as reported by the
EVCA, where the share of PE Buy-
outs is around 70% in both years.
PE Expansion Capital remained
relatively stable.
In contrast to PE, VC investments
tripled from € 78 million in 2015 to
€ 231 million in 2016. Early-stage VC
investments almost doubled from
€ 75.5 million in 2015 to € 129 million
in 2016. The increase in late-stage VC
investments was particularly large.
These investments increased from
only € 2 million in 2015 to more than
€ 102 million in 2016. This indicates
that the attractiveness of invest-
ments into young RES technology
for venture capital funds seems to
have increased between both years.
VENTURE CAPITAL – PRIVATE EQUITY
SOLAR PV OVERTAKES WIND VC/PE INVESTMENTSWhen taking a more detailed look
at the respective renewable energy
technologies, it should be poin-
ted out that biogas, biomass, and
waste-to-energy are not disaggre-
gated. The main reason is that the
data includes several companies
that are either project developer
active in at least two of these sec-
tors or equipment developers/pro-
ducers that provide technologies
for two or more sectors.
Overall, VC/PE investments were
conducted in more RES sectors in
2015 compared to 2016. The most
striking change in the sectoral dis-
tribution of VC/PE investments is
the significant increase in the
relative importance of the solar PV
sector. From 2015 to 2016, invest-
ments of VC/PE funds in solar firms
increased by almost € 1 billion from
€ 347 million to € 1.33 billion. The
dominance of the wind sector in
overall 2016 investments, however,
can be mainly explained by a very
large PE Buy-out deal of more than
€ 1 billion. Hence this increase in
solar PV investments should not be
over-interpreted.
In contrast to the solar PV sector,
VC/PE investments in the wind
sector dropped notably from
€ 1.5 billion in 2015 to € 663 mil-
lion. As with the increase in solar
PV investments, the decrease in
wind investments is mainly drivel
by PE Buy-outs. In 2015, there was
one large PE Buy-out deal in the
wind sector amounting to more
than € 1 billion. With respect to all
other types of VC/PE investments,
there was even a notable increase
in investments in the wind sector.
The only other sectors that
experienced VC/PE investments
in 2016 are biogas, biomass, and
waste. In 2016, VC/PE investment
in biogas, biomass, and waste
totalled € 32 million compared
to € 13 million in 2015. In the bio-
fuels, the geothermal, and the
small hydro sectors, VC/PE invest-
ments were only observed in
2015. For biofuels, these totalled
almost € 113 million which rende-
red this sector to be ranked third
in that year. In the geothermal
and the small hydro sectors VC/
PE investments in 2015 amounted
to € 58 million and € 18 million,
respectively. n
Pix
ab
ay
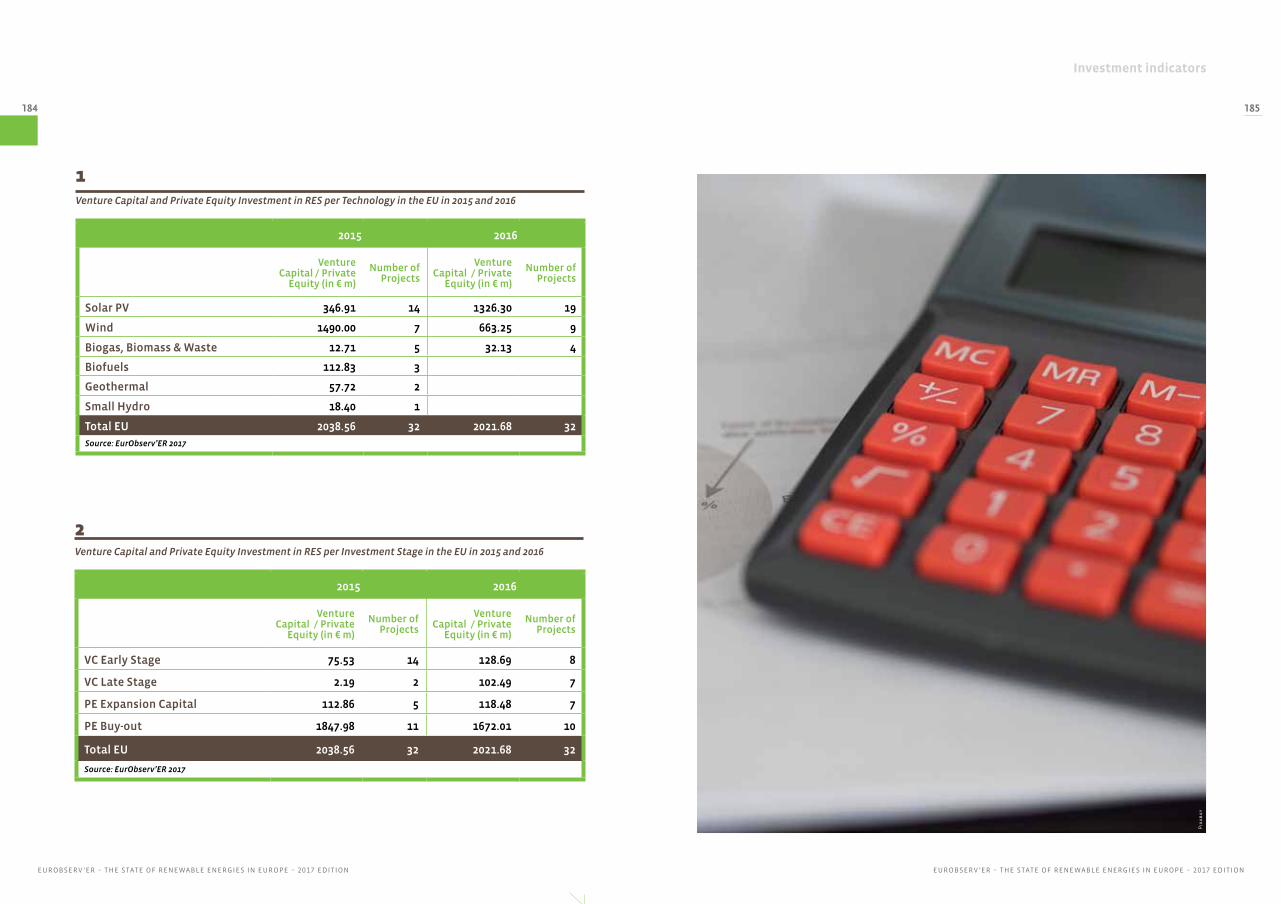
Investment indicators
EUROBSERV ’ER – THE STATE OF RENEWABLE ENERGIES IN EUROPE – 2017 EDITIONEUROBSERV ’ER – THE STATE OF RENEWABLE ENERGIES IN EUROPE – 2017 EDITION
184 185
2015 2016
Venture Capital / Private
Equity (in € m)
Number of Projects
Venture Capital / Private
Equity (in € m)
Number of Projects
Solar PV 346.91 14 1326.30 19
Wind 1490.00 7 663.25 9
Biogas, Biomass & Waste 12.71 5 32.13 4
Biofuels 112.83 3
Geothermal 57.72 2
Small Hydro 18.40 1
Total EU 2038.56 32 2021.68 32
Source: EurObserv’ER 2017
1Venture Capital and Private Equity Investment in RES per Technology in the EU in 2015 and 2016
2015 2016
Venture Capital / Private
Equity (in € m)
Number of Projects
Venture Capital / Private
Equity (in € m)
Number of Projects
VC Early Stage 75.53 14 128.69 8
VC Late Stage 2.19 2 102.49 7
PE Expansion Capital 112.86 5 118.48 7
PE Buy-out 1847.98 11 1672.01 10
Total EU 2038.56 32 2021.68 32
Source: EurObserv’ER 2017
2Venture Capital and Private Equity Investment in RES per Investment Stage in the EU in 2015 and 2016
Pix
ab
ay
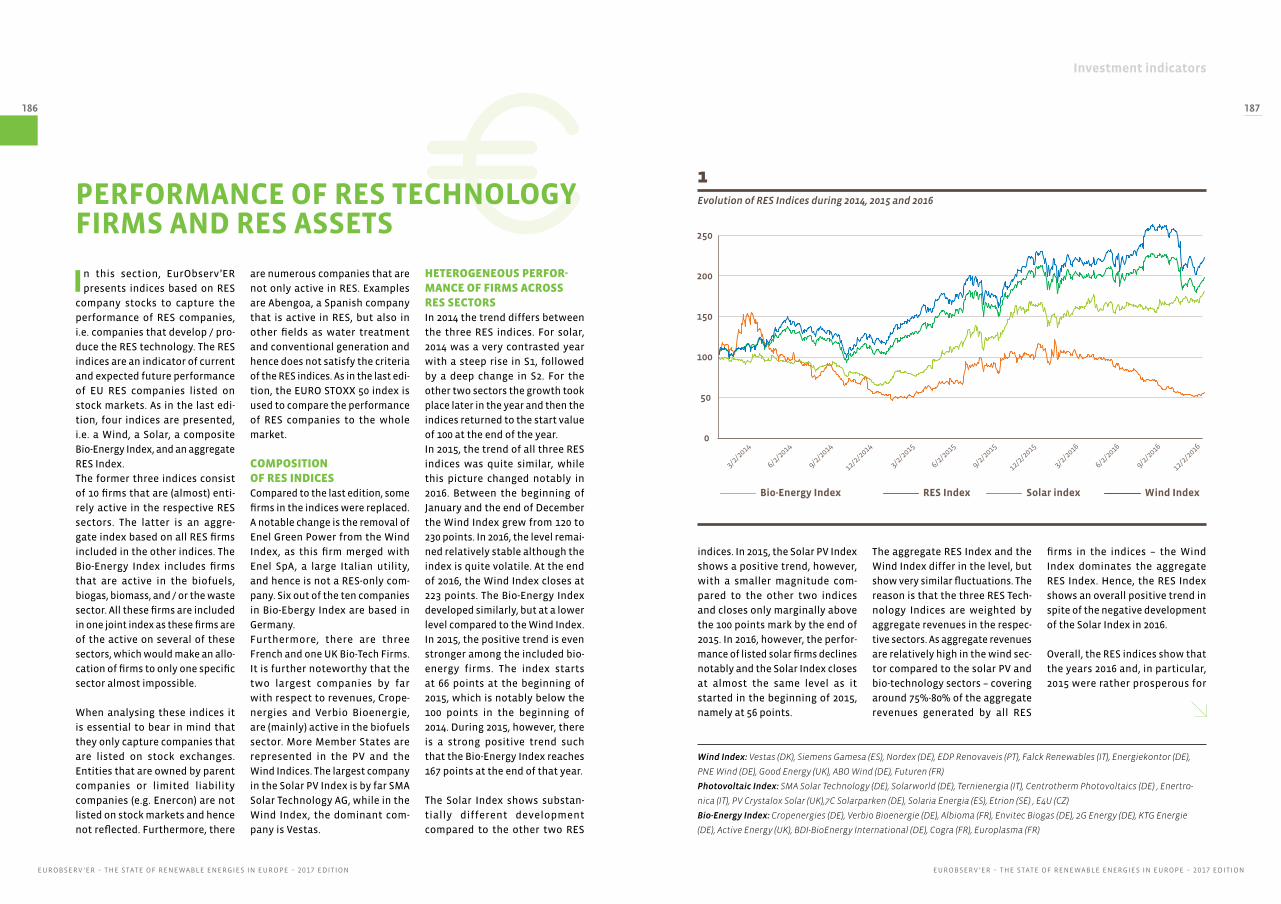
Investment indicators
EUROBSERV ’ER – THE STATE OF RENEWABLE ENERGIES IN EUROPE – 2017 EDITIONEUROBSERV ’ER – THE STATE OF RENEWABLE ENERGIES IN EUROPE – 2017 EDITION
186 187
PERFORMANCE OF RES TECHNOLOGY FIRMS AND RES ASSETS
In this section, EurObserv’ER
presents indices based on RES
company stocks to capture the
performance of RES companies,
i.e. companies that develop / pro-
duce the RES technology. The RES
indices are an indicator of current
and expected future performance
of EU RES companies listed on
stock markets. As in the last edi-
tion, four indices are presented,
i.e. a Wind, a Solar, a composite
Bio-Energy Index, and an aggregate
RES Index.
The former three indices consist
of 10 firms that are (almost) enti-
rely active in the respective RES
sectors. The latter is an aggre-
gate index based on all RES firms
included in the other indices. The
Bio-Energy Index includes firms
that are active in the biofuels,
biogas, biomass, and / or the waste
sector. All these firms are included
in one joint index as these firms are
of the active on several of these
sectors, which would make an allo-
cation of firms to only one specific
sector almost impossible.
When analysing these indices it
is essential to bear in mind that
they only capture companies that
are listed on stock exchanges.
Entities that are owned by parent
companies or limited liability
companies (e.g. Enercon) are not
listed on stock markets and hence
not reflected. Furthermore, there
are numerous companies that are
not only active in RES. Examples
are Abengoa, a Spanish company
that is active in RES, but also in
other fields as water treatment
and conventional generation and
hence does not satisfy the criteria
of the RES indices. As in the last edi-
tion, the EURO STOXX 50 index is
used to compare the performance
of RES companies to the whole
market.
COMPOSITION OF RES INDICESCompared to the last edition, some
firms in the indices were replaced.
A notable change is the removal of
Enel Green Power from the Wind
Index, as this firm merged with
Enel SpA, a large Italian utility,
and hence is not a RES-only com-
pany. Six out of the ten companies
in Bio-Ebergy Index are based in
Germany.
Furthermore, there are three
French and one UK Bio-Tech Firms.
It is further noteworthy that the
two largest companies by far
with respect to revenues, Crope-
nergies and Verbio Bioenergie,
are (mainly) active in the biofuels
sector. More Member States are
represented in the PV and the
Wind Indices. The largest company
in the Solar PV Index is by far SMA
Solar Technology AG, while in the
Wind Index, the dominant com-
pany is Vestas.
HETEROGENEOUS PERFOR-MANCE OF FIRMS ACROSS RES SECTORSIn 2014 the trend differs between
the three RES indices. For solar,
2014 was a very contrasted year
with a steep rise in S1, followed
by a deep change in S2. For the
other two sectors the growth took
place later in the year and then the
indices returned to the start value
of 100 at the end of the year.
In 2015, the trend of all three RES
indices was quite similar, while
this picture changed notably in
2016. Between the beginning of
January and the end of December
the Wind Index grew from 120 to
230 points. In 2016, the level remai-
ned relatively stable although the
index is quite volatile. At the end
of 2016, the Wind Index closes at
223 points. The Bio-Energy Index
developed similarly, but at a lower
level compared to the Wind Index.
In 2015, the positive trend is even
stronger among the included bio-
energy firms. The index starts
at 66 points at the beginning of
2015, which is notably below the
100 points in the beginning of
2014. During 2015, however, there
is a strong positive trend such
that the Bio-Energy Index reaches
167 points at the end of that year.
The Solar Index shows substan-
tially different development
compared to the other two RES
1Evolution of RES Indices during 2014, 2015 and 2016
Bio-Energy Index RES Index Solar index Wind Index
0
200
250
150
100
50
3/2/2
014
6/2/2
014
9/2/2
014
12/2/2
014
3/2/2
015
6/2/2
015
9/2/2
015
12/2/2
015
3/2/2
016
6/2/2
016
9/2/2
016
12/2/2
016
indices. In 2015, the Solar PV Index
shows a positive trend, however,
with a smaller magnitude com-
pared to the other two indices
and closes only marginally above
the 100 points mark by the end of
2015. In 2016, however, the perfor-
mance of listed solar firms declines
notably and the Solar Index closes
at almost the same level as it
started in the beginning of 2015,
namely at 56 points.
The aggregate RES Index and the
Wind Index differ in the level, but
show very similar fluctuations. The
reason is that the three RES Tech-
nology Indices are weighted by
aggregate revenues in the respec-
tive sectors. As aggregate revenues
are relatively high in the wind sec-
tor compared to the solar PV and
bio-technology sectors – covering
around 75%-80% of the aggregate
revenues generated by all RES
firms in the indices – the Wind
Index dominates the aggregate
RES Index. Hence, the RES Index
shows an overall positive trend in
spite of the negative development
of the Solar Index in 2016.
Overall, the RES indices show that
the years 2016 and, in particular,
2015 were rather prosperous for
Wind Index: Vestas (DK), Siemens Gamesa (ES), Nordex (DE), EDP Renovaveis (PT), Falck Renewables (IT), Energiekontor (DE),
PNE Wind (DE), Good Energy (UK), ABO Wind (DE), Futuren (FR)
Photovoltaic Index: SMA Solar Technology (DE), Solarworld (DE), Ternienergia (IT), Centrotherm Photovoltaics (DE) , Enertro-
nica (IT), PV Crystalox Solar (UK),7C Solarparken (DE), Solaria Energia (ES), Etrion (SE) , E4U (CZ)
Bio-Energy Index: Cropenergies (DE), Verbio Bioenergie (DE), Albioma (FR), Envitec Biogas (DE), 2G Energy (DE), KTG Energie
(DE), Active Energy (UK), BDI-BioEnergy International (DE), Cogra (FR), Europlasma (FR)
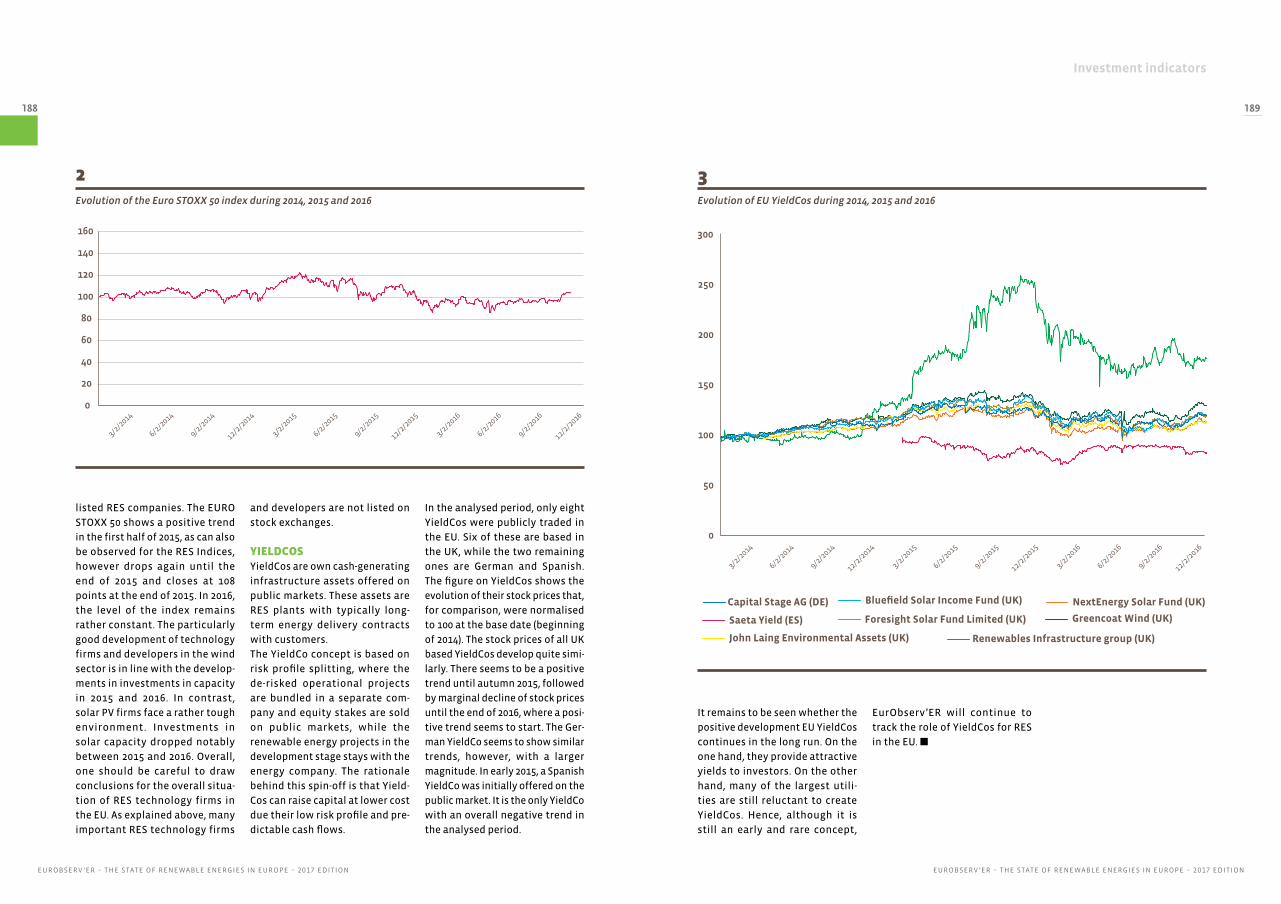
Investment indicators
EUROBSERV ’ER – THE STATE OF RENEWABLE ENERGIES IN EUROPE – 2017 EDITIONEUROBSERV ’ER – THE STATE OF RENEWABLE ENERGIES IN EUROPE – 2017 EDITION
188 189
0
160
140
120
100
80
60
40
20
3/2/2
014
6/2/2
014
9/2/2
014
12/2/2
014
3/2/2
015
6/2/2
015
9/2/2
015
12/2/2
015
3/2/2
016
6/2/2
016
9/2/2
016
12/2/2
016
and developers are not listed on
stock exchanges.
YIELDCOSYieldCos are own cash-generating
infrastructure assets offered on
public markets. These assets are
RES plants with typically long-
term energy delivery contracts
with customers.
The YieldCo concept is based on
risk profile splitting, where the
de-risked operational projects
are bundled in a separate com-
pany and equity stakes are sold
on public markets, while the
renewable energy projects in the
development stage stays with the
energy company. The rationale
behind this spin-off is that Yield-
Cos can raise capital at lower cost
due their low risk profile and pre-
dictable cash flows.
In the analysed period, only eight
YieldCos were publicly traded in
the EU. Six of these are based in
the UK, while the two remaining
ones are German and Spanish.
The figure on YieldCos shows the
evolution of their stock prices that,
for comparison, were normalised
to 100 at the base date (beginning
of 2014). The stock prices of all UK
based YieldCos develop quite simi-
larly. There seems to be a positive
trend until autumn 2015, followed
by marginal decline of stock prices
until the end of 2016, where a posi-
tive trend seems to start. The Ger-
man YieldCo seems to show similar
trends, however, with a larger
magnitude. In early 2015, a Spanish
YieldCo was initially offered on the
public market. It is the only YieldCo
with an overall negative trend in
the analysed period.
listed RES companies. The EURO
STOXX 50 shows a positive trend
in the first half of 2015, as can also
be observed for the RES Indices,
however drops again until the
end of 2015 and closes at 108
points at the end of 2015. In 2016,
the level of the index remains
rather constant. The particularly
good development of technology
firms and developers in the wind
sector is in line with the develop-
ments in investments in capacity
in 2015 and 2016. In contrast,
solar PV firms face a rather tough
environment. Investments in
solar capacity dropped notably
between 2015 and 2016. Overall,
one should be careful to draw
conclusions for the overall situa-
tion of RES technology firms in
the EU. As explained above, many
important RES technology firms
2Evolution of the Euro STOXX 50 index during 2014, 2015 and 2016
It remains to be seen whether the
positive development EU YieldCos
continues in the long run. On the
one hand, they provide attractive
yields to investors. On the other
hand, many of the largest utili-
ties are still reluctant to create
YieldCos. Hence, although it is
still an early and rare concept,
EurObserv’ER will continue to
track the role of YieldCos for RES
in the EU. n
Saeta Yield (ES) Foresight Solar Fund Limited (UK)
Bluefield Solar Income Fund (UK)Capital Stage AG (DE)
Renewables Infrastructure group (UK)
NextEnergy Solar Fund (UK)
Greencoat Wind (UK)
John Laing Environmental Assets (UK)
0
50
100
150
200
250
300
3/2/2
014
6/2/2
014
9/2/2
014
12/2/2
014
3/2/2
015
6/2/2
015
9/2/2
015
12/2/2
015
3/2/2
016
6/2/2
016
9/2/2
016
12/2/2
016
3Evolution of EU YieldCos during 2014, 2015 and 2016
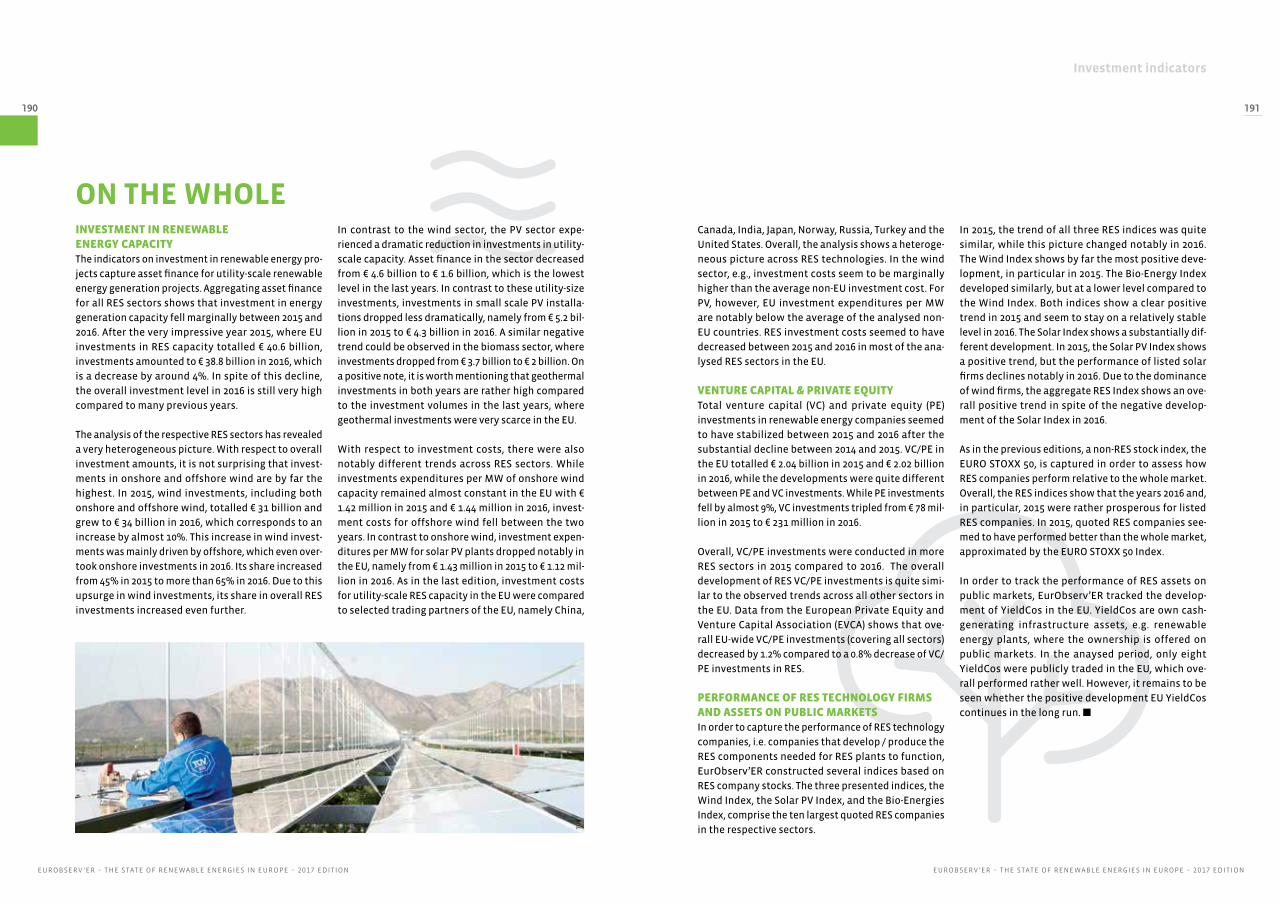
Investment indicators
EUROBSERV ’ER – THE STATE OF RENEWABLE ENERGIES IN EUROPE – 2017 EDITIONEUROBSERV ’ER – THE STATE OF RENEWABLE ENERGIES IN EUROPE – 2017 EDITION
190 191
INVESTMENT IN RENEWABLE ENERGY CAPACITYThe indicators on investment in renewable energy pro-
jects capture asset finance for utility-scale renewable
energy generation projects. Aggregating asset finance
for all RES sectors shows that investment in energy
generation capacity fell marginally between 2015 and
2016. After the very impressive year 2015, where EU
investments in RES capacity totalled € 40.6 billion,
investments amounted to € 38.8 billion in 2016, which
is a decrease by around 4%. In spite of this decline,
the overall investment level in 2016 is still very high
compared to many previous years.
The analysis of the respective RES sectors has revealed
a very heterogeneous picture. With respect to overall
investment amounts, it is not surprising that invest-
ments in onshore and offshore wind are by far the
highest. In 2015, wind investments, including both
onshore and offshore wind, totalled € 31 billion and
grew to € 34 billion in 2016, which corresponds to an
increase by almost 10%. This increase in wind invest-
ments was mainly driven by offshore, which even over-
took onshore investments in 2016. Its share increased
from 45% in 2015 to more than 65% in 2016. Due to this
upsurge in wind investments, its share in overall RES
investments increased even further.
In contrast to the wind sector, the PV sector expe-
rienced a dramatic reduction in investments in utility-
scale capacity. Asset finance in the sector decreased
from € 4.6 billion to € 1.6 billion, which is the lowest
level in the last years. In contrast to these utility-size
investments, investments in small scale PV installa-
tions dropped less dramatically, namely from € 5.2 bil-
lion in 2015 to € 4.3 billion in 2016. A similar negative
trend could be observed in the biomass sector, where
investments dropped from € 3.7 billion to € 2 billion. On
a positive note, it is worth mentioning that geothermal
investments in both years are rather high compared
to the investment volumes in the last years, where
geothermal investments were very scarce in the EU.
With respect to investment costs, there were also
notably different trends across RES sectors. While
investments expenditures per MW of onshore wind
capacity remained almost constant in the EU with €
1.42 million in 2015 and € 1.44 million in 2016, invest-
ment costs for offshore wind fell between the two
years. In contrast to onshore wind, investment expen-
ditures per MW for solar PV plants dropped notably in
the EU, namely from € 1.43 million in 2015 to € 1.12 mil-
lion in 2016. As in the last edition, investment costs
for utility-scale RES capacity in the EU were compared
to selected trading partners of the EU, namely China,
Canada, India, Japan, Norway, Russia, Turkey and the
United States. Overall, the analysis shows a heteroge-
neous picture across RES technologies. In the wind
sector, e.g., investment costs seem to be marginally
higher than the average non-EU investment cost. For
PV, however, EU investment expenditures per MW
are notably below the average of the analysed non-
EU countries. RES investment costs seemed to have
decreased between 2015 and 2016 in most of the ana-
lysed RES sectors in the EU.
VENTURE CAPITAL & PRIVATE EQUITYTotal venture capital (VC) and private equity (PE)
investments in renewable energy companies seemed
to have stabilized between 2015 and 2016 after the
substantial decline between 2014 and 2015. VC/PE in
the EU totalled € 2.04 billion in 2015 and € 2.02 billion
in 2016, while the developments were quite different
between PE and VC investments. While PE investments
fell by almost 9%, VC investments tripled from € 78 mil-
lion in 2015 to € 231 million in 2016.
Overall, VC/PE investments were conducted in more
RES sectors in 2015 compared to 2016. The overall
development of RES VC/PE investments is quite simi-
lar to the observed trends across all other sectors in
the EU. Data from the European Private Equity and
Venture Capital Association (EVCA) shows that ove-
rall EU-wide VC/PE investments (covering all sectors)
decreased by 1.2% compared to a 0.8% decrease of VC/
PE investments in RES.
PERFORMANCE OF RES TECHNOLOGY FIRMS AND ASSETS ON PUBLIC MARKETS In order to capture the performance of RES technology
companies, i.e. companies that develop / produce the
RES components needed for RES plants to function,
EurObserv’ER constructed several indices based on
RES company stocks. The three presented indices, the
Wind Index, the Solar PV Index, and the Bio-Energies
Index, comprise the ten largest quoted RES companies
in the respective sectors.
In 2015, the trend of all three RES indices was quite
similar, while this picture changed notably in 2016.
The Wind Index shows by far the most positive deve-
lopment, in particular in 2015. The Bio-Energy Index
developed similarly, but at a lower level compared to
the Wind Index. Both indices show a clear positive
trend in 2015 and seem to stay on a relatively stable
level in 2016. The Solar Index shows a substantially dif-
ferent development. In 2015, the Solar PV Index shows
a positive trend, but the performance of listed solar
firms declines notably in 2016. Due to the dominance
of wind firms, the aggregate RES Index shows an ove-
rall positive trend in spite of the negative develop-
ment of the Solar Index in 2016.
As in the previous editions, a non-RES stock index, the
EURO STOXX 50, is captured in order to assess how
RES companies perform relative to the whole market.
Overall, the RES indices show that the years 2016 and,
in particular, 2015 were rather prosperous for listed
RES companies. In 2015, quoted RES companies see-
med to have performed better than the whole market,
approximated by the EURO STOXX 50 Index.
In order to track the performance of RES assets on
public markets, EurObserv’ER tracked the develop-
ment of YieldCos in the EU. YieldCos are own cash-
generating infrastructure assets, e.g. renewable
energy plants, where the ownership is offered on
public markets. In the anaysed period, only eight
YieldCos were publicly traded in the EU, which ove-
rall performed rather well. However, it remains to be
seen whether the positive development EU YieldCos
continues in the long run. n
ON THE WHOLE
TU
V

EUROBSERV ’ER – THE STATE OF RENEWABLE ENERGIES IN EUROPE – 2017 EDITIONEUROBSERV ’ER – THE STATE OF RENEWABLE ENERGIES IN EUROPE – 2017 EDITION
192 193
Renewable energy costs, prices and cost competitiveness
In this section, levelised costs of energy (LCoE) are estimated for various renewable energy technologies and their cost competiti-veness is assessed by comparing the LCoE to reference prices. As one can expect though, this is not a black-and-white issue: firstly, there is not a ‘single technology cost’ (many factors determine the costs, notably locatio-nal and operational aspects, but also quality and financing characteristics); secondly the energy yield from various renewables differs widely across Europe; and finally, reference prices can vary significantly.
The past few years have proven that electri-city generation from offshore wind energy has rapidly come down in generating costs, leading to tender bids nearly without sub-sidy appeal in Germany and the Nether-lands. A trend that is similarly spectacular is the cost reduction observed in solar PV, which has been ongoing for decades already, and which has led to competiti-veness in various demand sectors. Next to an overview of current costs, approximate historic costs are estimated in this chapter for a number of technologies, based on a backward-looking approach.
The overarching question whether renewable technologies are competitive or not depends, among others, on the reference prices paid for energy. In some demand sectors in a number of EU Member States various renewables are already com-petitive, and in some not yet.
RENEWABLE ENERGY COSTS, REFERENCE PRICES AND COMPETITIVENESS
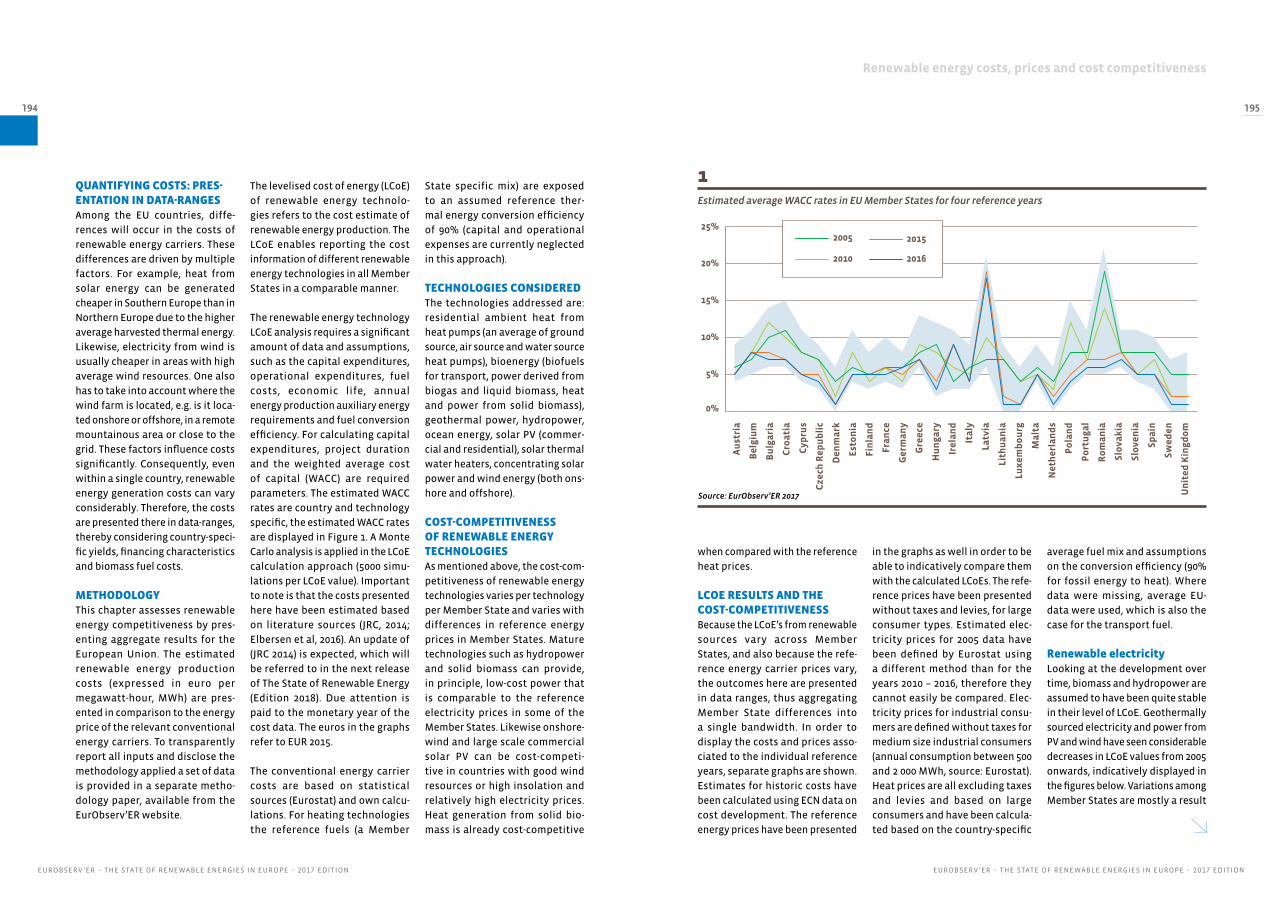
EUROBSERV ’ER – THE STATE OF RENEWABLE ENERGIES IN EUROPE – 2017 EDITIONEUROBSERV ’ER – THE STATE OF RENEWABLE ENERGIES IN EUROPE – 2017 EDITION
194 195
Renewable energy costs, prices and cost competitiveness
QUANTIFYING COSTS: PRES-ENTATION IN DATA-RANGESAmong the EU countries, diffe-
rences will occur in the costs of
renewable energy carriers. These
differences are driven by multiple
factors. For example, heat from
solar energy can be generated
cheaper in Southern Europe than in
Northern Europe due to the higher
average harvested thermal energy.
Likewise, electricity from wind is
usually cheaper in areas with high
average wind resources. One also
has to take into account where the
wind farm is located, e.g. is it loca-
ted onshore or offshore, in a remote
mountainous area or close to the
grid. These factors influence costs
significantly. Consequently, even
within a single country, renewable
energy generation costs can vary
considerably. Therefore, the costs
are presented there in data-ranges,
thereby considering country-speci-
fic yields, financing characteristics
and biomass fuel costs.
METHODOLOGYThis chapter assesses renewable
energy competitiveness by pres-
enting aggregate results for the
European Union. The estimated
renewable energy production
costs (expressed in euro per
megawatt-hour, MWh) are pres-
ented in comparison to the energy
price of the relevant conventional
energy carriers. To transparently
report all inputs and disclose the
methodology applied a set of data
is provided in a separate metho-
dology paper, available from the
EurObserv’ER website.
The levelised cost of energy (LCoE)
of renewable energy technolo-
gies refers to the cost estimate of
renewable energy production. The
LCoE enables reporting the cost
information of different renewable
energy technologies in all Member
States in a comparable manner.
The renewable energy technology
LCoE analysis requires a significant
amount of data and assumptions,
such as the capital expenditures,
operational expenditures, fuel
costs, economic life, annual
energy production auxiliary energy
requirements and fuel conversion
efficiency. For calculating capital
expenditures, project duration
and the weighted average cost
of capital (WACC) are required
parameters. The estimated WACC
rates are country and technology
specific, the estimated WACC rates
are displayed in Figure 1. A Monte
Carlo analysis is applied in the LCoE
calculation approach (5000 simu-
lations per LCoE value). Important
to note is that the costs presented
here have been estimated based
on literature sources (JRC, 2014;
Elbersen et al, 2016). An update of
(JRC 2014) is expected, which will
be referred to in the next release
of The State of Renewable Energy
(Edition 2018). Due attention is
paid to the monetary year of the
cost data. The euros in the graphs
refer to EUR 2015.
The conventional energy carrier
costs are based on statistical
sources (Eurostat) and own calcu-
lations. For heating technologies
the reference fuels (a Member
State specific mix) are exposed
to an assumed reference ther-
mal energy conversion efficiency
of 90% (capital and operational
expenses are currently neglected
in this approach).
TECHNOLOGIES CONSIDEREDThe technologies addressed are:
residential ambient heat from
heat pumps (an average of ground
source, air source and water source
heat pumps), bioenergy (biofuels
for transport, power derived from
biogas and liquid biomass, heat
and power from solid biomass),
geothermal power, hydropower,
ocean energy, solar PV (commer-
cial and residential), solar thermal
water heaters, concentrating solar
power and wind energy (both ons-
hore and offshore).
COST-COMPETITIVENESS OF RENEWABLE ENERGY TECHNOLOGIESAs mentioned above, the cost-com-
petitiveness of renewable energy
technologies varies per technology
per Member State and varies with
differences in reference energy
prices in Member States. Mature
technologies such as hydropower
and solid biomass can provide,
in principle, low-cost power that
is comparable to the reference
electricity prices in some of the
Member States. Likewise onshore-
wind and large scale commercial
solar PV can be cost-competi-
tive in countries with good wind
resources or high insolation and
relatively high electricity prices.
Heat generation from solid bio-
mass is already cost-competitive
when compared with the reference
heat prices.
LCOE RESULTS AND THE COST-COMPETITIVENESSBecause the LCoE’s from renewable
sources vary across Member
States, and also because the refe-
rence energy carrier prices vary,
the outcomes here are presented
in data ranges, thus aggregating
Member State differences into
a single bandwidth. In order to
display the costs and prices asso-
ciated to the individual reference
years, separate graphs are shown.
Estimates for historic costs have
been calculated using ECN data on
cost development. The reference
energy prices have been presented
in the graphs as well in order to be
able to indicatively compare them
with the calculated LCoEs. The refe-
rence prices have been presented
without taxes and levies, for large
consumer types. Estimated elec-
tricity prices for 2005 data have
been defined by Eurostat using
a different method than for the
years 2010 – 2016, therefore they
cannot easily be compared. Elec-
tricity prices for industrial consu-
mers are defined without taxes for
medium size industrial consumers
(annual consumption between 500
and 2 000 MWh, source: Eurostat).
Heat prices are all excluding taxes
and levies and based on large
consumers and have been calcula-
ted based on the country-specific
average fuel mix and assumptions
on the conversion efficiency (90%
for fossil energy to heat). Where
data were missing, average EU-
data were used, which is also the
case for the transport fuel.
Renewable electricityLooking at the development over
time, biomass and hydropower are
assumed to have been quite stable
in their level of LCoE. Geothermally
sourced electricity and power from
PV and wind have seen considerable
decreases in LCoE values from 2005
onwards, indicatively displayed in
the figures below. Variations among
Member States are mostly a result
1Estimated average WACC rates in EU Member States for four reference years
Au
stri
a
Be
lgiu
m
Bu
lga
ria
Cro
ati
a
Cyp
rus
Cze
ch R
ep
ub
lic
De
nm
ark
Est
on
ia
Fin
lan
d
Fra
nce
Ge
rma
ny
Gre
ece
Hu
ng
ary
Ire
lan
d
Ita
ly
Latv
ia
Lith
ua
nia
Lux
em
bo
urg
Ma
lta
Ne
the
rla
nd
s
Po
lan
d
Po
rtu
ga
l
Ro
ma
nia
Slo
vak
ia
Slo
ven
ia
Sp
ain
Sw
ed
en
Un
ite
d K
ing
do
m
5%
10%
15%
20%
25%2005 2015
2010 2016
0%
Source: EurObserv’ER 2017

EUROBSERV ’ER – THE STATE OF RENEWABLE ENERGIES IN EUROPE – 2017 EDITIONEUROBSERV ’ER – THE STATE OF RENEWABLE ENERGIES IN EUROPE – 2017 EDITION
196 197
Renewable energy costs, prices and cost competitiveness
2LCoE and reference energy carrier (€/MWh) EU ranges derived from Member State analysis for 2005
3LCoE and reference energy carrier (€/MWh) EU ranges derived from Member State analysis for 2010
0
100
200
300
400
500
600
700
800
Median LCOE
Average reference energy carrier price
LCOE
Reference energy carrier price
€/MWh
Bio
ener
gy: b
ioga
s (e
lect
rici
ty)
Bio
ener
gy: l
iqu
id b
iom
ass
(ele
ctri
city
)
Bio
ener
gy: s
oli
d b
iom
ass
(ele
ctri
city
)
Geo
ther
mal
(e
lect
rici
ty)
Hyd
rop
ow
er
(ele
ctri
city
)
Sola
r P
V -
Co
mm
erci
al
(ele
ctri
city
)
Sola
r th
erm
al p
ow
er
(ele
ctri
city
)
Win
d p
ow
er
(ele
ctri
city
)
Sola
r P
V -
Res
iden
tial
(e
lect
rici
ty)
Bio
ener
gy: s
oli
d b
iom
ass
(hea
t)
Sola
r w
ater
hea
ters
(h
eat)
Hea
t p
um
ps
resi
den
tial
(h
eat)
Bio
ener
gy: b
iofu
els
(tra
nsp
ort
fuel
)
Bio
ener
gy: b
ioga
s (e
lect
rici
ty)
Bio
ener
gy: l
iqu
id b
iom
ass
(ele
ctri
city
)
Bio
ener
gy: s
oli
d b
iom
ass
(ele
ctri
city
)
Geo
ther
mal
(e
lect
rici
ty)
Hyd
rop
ow
er
(ele
ctri
city
)
Sola
r P
V -
Co
mm
erci
al
(ele
ctri
city
)
Sola
r th
erm
al p
ow
er
(ele
ctri
city
)
Win
d p
ow
er
(ele
ctri
city
)
Sola
r P
V -
Res
iden
tial
(e
lect
rici
ty)
Bio
ener
gy: s
oli
d b
iom
ass
(hea
t)
Sola
r w
ater
hea
ters
(h
eat)
Hea
t p
um
ps
resi
den
tial
(h
eat)
Bio
ener
gy: b
iofu
els
(tra
nsp
ort
fuel
)
0
100
200
300
400
500
600
700
800
€/MWh
Median LCOE
Average reference energy carrier price
LCOE
Reference energy carrier price
of differences in assumed yield and
financing conditions. The graphs
depicted here only show aggre-
gates, but a separate paper, avai-
lable on the EurObserv’ER website,
allows to see the country-specific
costs and prices.
Among the technologies producing
electricity from bioenergy (via bio-
gas, liquid and solid biomass), the
LCoE for technologies based on
solid biomass are found to be the
least expensive, and in the same
range as the reference electricity
price. For electricity from deep
geothermal energy all countries
have estimated LCoE values
displayed, although no realisa-
tions might have occurred in the
period under consideration, and
potential might be non-existent.
Both PV variants are assumed
to have realised important cost
reductions, making this techno-
logy more and more competitive.
In the residential sector, PV is in
multiple countries competitive
compared to residential electricity
prices. Wind energy LCoE levels are
assumed to have decreased rapidly
since 2005, both for onshore and
offshore. For offshore wind, the
most recent cost developments
have not yet been considered yet
in the graph; in a few countries
offshore wind bid prices in recent
tenders demonstrate that perhaps
offshore wind LCoE is undercutting
onshore wind LCoE levels.
Renewable heatFor the technologies producing
heat, the LCoE for solid biomass
is overlapping the reference heat
range, indicating it is competitive
in many countries. The LCoE range
for solar water heaters and heat
captured from ambient heat via
heat pumps shows, according to the
analysis, relatively high LCoE levels.
Renewable transportLCoEs for biofuels for transport
show quite a narrow range, above
the reference transport fuel price
levels.
Source: EurObserv’ER 2017 Source: EurObserv’ER 2017
Note: Overview of the LCoE assessment on a European Union level; ranges derive from the Member State differentiation. The graph also presents, based on large consumer tariffs, the ranges of reference electricity, reference heat and reference transport fuel prices, all excluding taxes and levies. The LCoE ranges represent median values, the ranges were defined based on the interval between 25% and 75% of all values resulting from the Monte Carlo analysis. Data refer to the years 2005, 2010 and 2016 (monetary
values are defined in EUR2015).
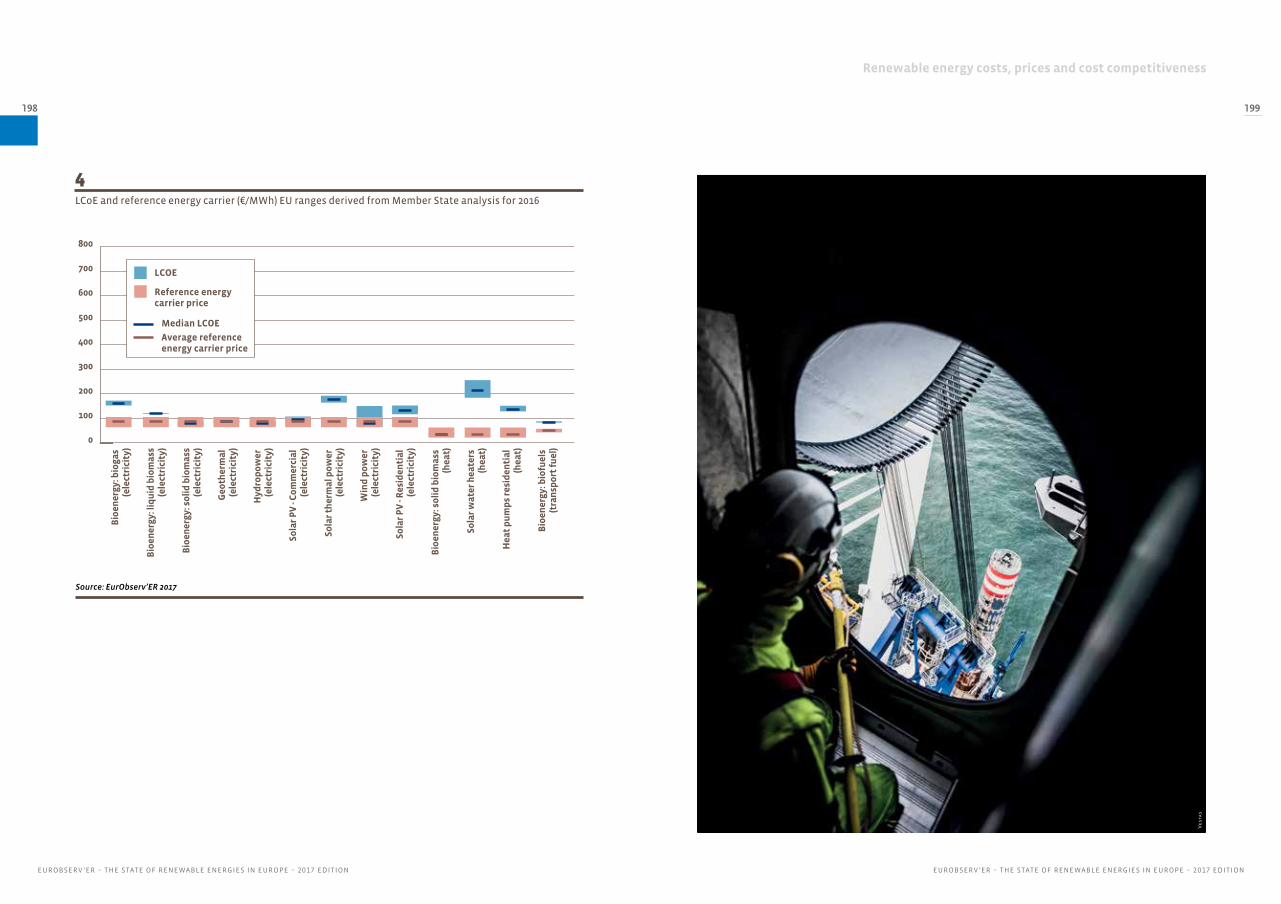
EUROBSERV ’ER – THE STATE OF RENEWABLE ENERGIES IN EUROPE – 2017 EDITIONEUROBSERV ’ER – THE STATE OF RENEWABLE ENERGIES IN EUROPE – 2017 EDITION
198 199
Renewable energy costs, prices and cost competitiveness
4LCoE and reference energy carrier (€/MWh) EU ranges derived from Member State analysis for 2016
0
100
200
300
400
500
600
700
800
Median LCOE
Average reference energy carrier price
LCOE
Reference energy carrier price
Bio
ener
gy: b
ioga
s (e
lect
rici
ty)
Bio
ener
gy: l
iqu
id b
iom
ass
(ele
ctri
city
)
Bio
ener
gy: s
oli
d b
iom
ass
(ele
ctri
city
)
Geo
ther
mal
(e
lect
rici
ty)
Hyd
rop
ow
er
(ele
ctri
city
)
Sola
r P
V -
Co
mm
erci
al
(ele
ctri
city
)
Sola
r th
erm
al p
ow
er
(ele
ctri
city
)
Win
d p
ow
er
(ele
ctri
city
)
Sola
r P
V -
Res
iden
tial
(e
lect
rici
ty)
Bio
ener
gy: s
oli
d b
iom
ass
(hea
t)
Sola
r w
ater
hea
ters
(h
eat)
Hea
t p
um
ps
resi
den
tial
(h
eat)
Bio
ener
gy: b
iofu
els
(tra
nsp
ort
fuel
)
Ves
tas
Source: EurObserv’ER 2017

EUROBSERV ’ER – THE STATE OF RENEWABLE ENERGIES IN EUROPE – 2017 EDITIONEUROBSERV ’ER – THE STATE OF RENEWABLE ENERGIES IN EUROPE – 2017 EDITION
200 201
Avoided fossil fuel use and resulting avoided costs
• The focus of the analysis is on the national level,
quantifying the avoided costs in the case where
all fossil energy carriers are being purchased
abroad. As a consequence, all fuel prices conside-
red exclude taxes and levies.
• For countries producing their own fossil fuels the
analysis is similar and no correction is made for
the indigenous resources.
• The avoided costs through the substitution of
natural gas by synthetic natural gas (SNG) is not
quantified explicitly.
• Only the impact on fossil fuel displacement is
being addressed: in the electricity mix nuclear
energy is not considered.
• Pricing non-renewable waste is not straight-
forward; therefore this impact is not quantified
in monetary terms.
• For liquid biofuels only the biofuels compliant
with the Directive 28/EC/2009 are included.
• Data refer to values not normalised for hydro-
power and wind power.
• Energy data [Mtoe] may vary from totals mentio-
ned elsewhere in this EurObserv’ER Barometer
because a different base data set was used. The
2016 estimates are proxies.
Methodological notes
LESS CONVENTIONAL ENERGY CARRIERS, AVOIDED BY RENEWABLE ENERGY
AVOIDED FOSSIL FUEL USE AND RESULTING AVOIDED COSTS
Avoided fossil fuels represent conventional non-renewable energy carriers (hereafter fossil fuels and non-renewable waste are col-lectively named as fossil fuels) not consumed – both domestic and imported fuels – due to development and use of renewable energy.
Avoided costs refer to the expenses that do not occur as a result of avoided fossil fuels. Thus, cumulative amounts of avoided fossil fuels multiplied by the corresponding fuel price levels observed in the various countries represent the avoided costs.

EUROBSERV ’ER – THE STATE OF RENEWABLE ENERGIES IN EUROPE – 2017 EDITIONEUROBSERV ’ER – THE STATE OF RENEWABLE ENERGIES IN EUROPE – 2017 EDITION
202 203
Avoided fossil fuel use and resulting avoided costs
2Avoided fossil fuels per sector (ktoe)
1Fossil fuel price ranges in the European Union (excluding taxes and levies)The amount of avoided fossil
fuels has been analysed by the
European Environment Agency and
presented in the report “Renewable
energy in Europe 2018 - Recent
growth and knock-on effects”,
(EEA 2018, (still to be published
at the time of drafting this text).
The fossil fuel types assumed to
be substituted are transport fuels
(diesel and gasoline), fuels used for
heating (gaseous fuels, petroleum
products and non-renewable waste)
and fuels used for the production
of electricity (a mix of gaseous,
solid and oil products). This section
makes use of the EEA data.
The avoided fossil fuel costs are
based on the country specific
fuel prices derived from multiple
sources (Eurostat, European Com-
mission, BP). Figure 1 highlights
the fuel price ranges observed in
the 28 EU Member States for 2015
and 2016 for five energy carriers:
coal, diesel, gasoline, natural gas
and oil. These five fuels are assu-
med to reasonably cover the fuels
reported in (EEA, 2017). Note that
non-renewable waste has not
been priced here (usually the
tariff setting of waste is a local
issue and not so much driven by
a global market).
0
200
400
600
800
1 000
0
M€/Mtoe
2015 2016
Coal Diesel Gasoline Natural Gas Oil
0
50 000
100 000
150 000
200 000
250 000
300 000
350 000
2015 2016
Electricity Heating & Cooling Transport
Looking at the individual energy
carriers and their ratios, it
becomes clear that the downward
trend, which was also observed
from 2014 to 2015, is continuing
during 2016. Fossil fuel prices in
2016 are generally lower than the
prices in 2015.
The ranking remains unchanged
with coal being the least expen-
sive fuel, next natural gas, fol-
lowed by (heating) oil. Diesel and
gasoline are the most expensive
fuels. Compared to 2015, prices in
2016 were not only lower but also
the observed data spread for most
fuels is smaller.
Source: Eurostat, European Commission, BP (2017)
Source: EurObserv’ER 2017 based on EEA data
Pix
ab
ay

EUROBSERV ’ER – THE STATE OF RENEWABLE ENERGIES IN EUROPE – 2017 EDITIONEUROBSERV ’ER – THE STATE OF RENEWABLE ENERGIES IN EUROPE – 2017 EDITION
204 205
Avoided fossil fuel use and resulting avoided costs
AVOIDED FOSSIL FUEL USE & AVOIDED COSTS PER TECHNOLOGYIn 2015 and 2016 renewable energy
substituted around 314 Mtoe and
322 Mtoe of fossil fuels respecti-
vely. These figures correspond to an
avoided annual cost of EUR 97 billion
for EU28 collectively in 2015, decrea-
sing to € 83 billion in 2016. This
decrease is due to lower fossil fuel
prices in 2016 compared to 2015. The
largest contributions derive from
renewable electricity and renewable
heat (at approximately equal contri-
butions together representing
about 90% of the avoided expenses).
The use of renewable electricity
contributed to 64% of the total
avoided fossil fuels (the share is
equal for 2015 and 2016). This is
followed by renewables in the
heating and cooling sector contri-
buting to approximately 32% (2015)
and 31% (2016) of the total avoided
fossil fuels and the remaining 4%
(similar share for both years) was
substituted through renewable
transport fuels (only fuels com-
pliant with Directive 2009/28/EC
are included). In monetary terms,
the avoided costs were € 49.7 bil-
lion in 2015 and € 42.4 billion in
2016 in the electricity sector.
Second, renewable heat contribu-
ted to avoided costs reaching to
€ 39.2 billion in 2015. In 2016 this fell
to € 33.4 billion. Third is renewable
transport fuels which contributed
to avoided costs of € 8.3 billion in
2015 and € 7.1 billion in 2016. For
correctly interpreting these results
it is important to take note of a
number of methodological issues,
Biodiesels (compliant)
Hydropower excl. pumping (not normalised)
Solid biomass (E)
Solid biomass (H)
Onshore wind (not normalised)
Renewable energy from heat pumps
35%
21%
8%
3%4%
3%
6%
7%
13%
2015 (total € 97 billion)
Solar photovoltaic
Offshore wind (not normalised)
Other
Biodiesels (compliant)
Hydropower excl. pumping (not normalised)
Solid biomass (E)
Solid biomass (H)
Onshore wind (not normalised)
Renewable energy from heat pumps
36%
20%
8%
3%4%
3%
6%
8%
12%
2016 (total € 83 billion)
Solar photovoltaic
Offshore wind (not normalised)
Other
2016 (total 322 Mtoe)
Coal
Diesel
Natural Gas
Gasoline
Oil
Non-RE waste
32%
1%
2%22%
3%
40%
Coal
Diesel
Natural Gas
Gasoline
Oil
Non-RE waste
31%
1%
2%
23%
3%
39%
2015 (total 314 Mtoe)
Source: EurObserv’ER 2017 based on EEA data
Source: EurObserv’ER 2017 based on EEA data
referred to in the methodological
note (see page 201).
Although the penetration of
renewable energy (expressed in
avoided fossil fuels) expanded by
approximately 2.5% in 2016, the
cumulative effect of the avoided
fossil fuel costs is lower than in
2015. Underlying reason can be
found in the decreasing fossil fuel
prices in 2016 compared to 2015.
Among the RES technologies, solid
biomass for heating purposes
avoided the purchase of fossil
fuels at an amount of € 37.7 billion
in 2016 € 33.7 billion in 2015). Next,
hydropower has been responsible
for € 20.4 billion in 2016 (€ 20.8 bil-
lion in 2015). Onshore wind is third
in the row with € 12.6 billion in 2016
(€ 13.0 billion in 2015).
In a graphical manner, the
graph and the pie charts of the
figure 3 show how each technology
contributes to the total avoided
costs.
The largest share of avoided fos-
sil fuels comes from solid fuels
(mainly coal, 39% for 2015 and 40%
for 2016), followed by natural gas
(31% and 32% for 2015 and 2016).
Next are oil products, with a contri-
bution of 23% in 2015 and 22% in
2016. The remaining fuels (trans-
port fuels and non-renewable
waste) cover the remaining share
(figure 4).
3Avoided expenses in EU-28 through renewables
4EU substituted fossil fuels during 2015 and 2016

EUROBSERV ’ER – THE STATE OF RENEWABLE ENERGIES IN EUROPE – 2017 EDITIONEUROBSERV ’ER – THE STATE OF RENEWABLE ENERGIES IN EUROPE – 2017 EDITION
206 207
Avoided fossil fuel use and resulting avoided costs
1.9
2.1
1.2
1.23.
1
3.3
0.2
0.2
2.1
2.4
0.0
0.0
4.3
4.4
3.3
3.4
1.6
1.83.
6
3.2
2.1
2.34.2
4.6
1.9
1.8
0.2
0.2
314.
4
322.
2
20152016
DE
FR SE IT ES
UK AT FI PL
RO
DK PT
CZ
GR BE
NL
HU
HR
BG SI
SK LV IE LT EE
LU CY
MT
EU
-28
14.0
15.1
7.3 8.9
10.1
10.1
57.0
57.6
33.1
34.8 37
.2
34.0
33.1
33.1
25.7 28
.2
20.5
21.2
14.7
15.0
5.7
5.811
.1
11.5
4.7
4.810
.2
11.2
DE
FR SE IT ES
UK AT FI PL
RO
DK PT
CZ
GR BE
NL
HU
HR
BG SI
SK LV IE LT EE
LU CY
MT
EU
-28
20152016
97.1
83.0
0.0
0.0
0.1
0.1
6.9
17.0
12.9
10.2
8.711
.3
10.412
.3
10.6
6.2 6.4
5.4
2.9
2.4
1.3
1.3
4.8
4.15.
6
4.5
1.2
1.02.
0
1.83.
8
3.6
1.3
1.22.
2
2.0
1.1
0.9
0.9
0.8
0.4
0.3
0.7
0.6
0.8
0.8
0.4
0.4
0.1
0.1
0.9
0.7
0.8
0.6
1.1
0.9
0.6
0.5
5Avoided fossil fuels per country [Mtoe]
6Avoided expenses per country [billion euro]
Source: EurObserv’ER 2017 based on EEA data
Source: EurObserv’ER 2017 based on EEA data

EUROBSERV ’ER – THE STATE OF RENEWABLE ENERGIES IN EUROPE – 2017 EDITIONEUROBSERV ’ER – THE STATE OF RENEWABLE ENERGIES IN EUROPE – 2017 EDITION
208 209
Avoided fossil fuel use and resulting avoided costs
AVOIDED FOSSIL FUELS & EXPENSES PER MEMBER STATEAt Member State level, the avoided
costs have been estimated as dis-
played in graph 6. Note that there
is a strong correlation between
the avoided amount and the size
of a country. As can be expected,
the avoided cost follow the fuel
price development: with fossil
fuel prices lower in 2016 compa-
red to 2015, almost all counties
show a similar pattern. Four
Member States show a decreasing
trend in avoided fossil fuels due
to decreased renewable energy
deployment in 2016 compared to
2015. These countries are Bulgaria,
Estonia, Ireland and Sweden. See
also the methodological notes.
The data have been displayed gra-
phically in the figures above.
Next, the visuals below indicate
how the amounts of estimated
avoided fuel relate to the total
fuel EU use. The relevant para-
meter for comparing the avoided
fuel use with is the primary energy
consumption, which indicates the
gross inland consumption exclu-
ding all non-energy use of energy
carriers (e.g. natural gas used not
for combustion but for producing
chemicals). For the transport fuels
the comparison is not possible
because these are not primary
fuels (but instead secondary fuels).
Reference year depicted 2015,
because it regards final data. n
Avoided (Mtoe)
Actual (Mtoe)
263
123
Gross inland coal consumption in 2015
Avoided (Mtoe)
Actual (Mtoe)
358
99
Gross inland gas consumption in 2015
Source: EurObserv’ER 2017 based on EEA data
7Contributions per fuel 2015 compared to total
Pix
ab
ay
Indicators on innovation and competitiveness
EUROBSERV ’ER – THE STATE OF RENEWABLE ENERGIES IN EUROPE – 2017 EDITIONEUROBSERV ’ER – THE STATE OF RENEWABLE ENERGIES IN EUROPE – 2017 EDITION
210 211
Regarding RET, R&D investments spur inno-vations in RET, which are often measured by the number or share of patent applications in the respective technology field. How well the R&D output translates into a strong mar-ket position, i.e. competitiveness in RET, is measured for example by the trade share in RET products. These three indicators are depicted in the following chapters: R&D expenditures (public & private) showing the efforts or investments of countries w.r.t. RET, patent applications reflecting the out-put of R&D efforts and finally trade shares in RET displaying how competitive a country is in RET products.
The Energy Union strives to provide a secure, sustainable, affordable energy supply by increasing renewable energy uses, energy efficiency, internal energy market integration and competitiveness. Wiser energy use, the European Commis-sion states, is both a spur for new jobs and growth, and an investment in the future of Europe. Economic theory underpins this understanding. Expenditures for research and development are seen as investments into new or better processes, products or services that might create new markets or increase market shares and strengthen com-petitiveness of firms, sectors and nations.
INDICATORS ON INNOVATION AND COMPETITIVENESS
Indicators on innovation and competitiveness
EUROBSERV ’ER – THE STATE OF RENEWABLE ENERGIES IN EUROPE – 2017 EDITIONEUROBSERV ’ER – THE STATE OF RENEWABLE ENERGIES IN EUROPE – 2017 EDITION
212 213
Overall, R&D expenditures are financed by private
and public resources, while R&D is performed by
both, business (private), government and higher
education sector (public). This differentiation into
financing and performing is depicted in Figure 1.
In this section, we will analyze public and private
R&D expenditures of a selected set of countries
with regard to renewable energy technologies, i.e.
research investments originating from the public
sector (see dark grey area in Figure 1) as well as
from the business sector are taken into account
(see light grey area in Figure 1).
R&D investments from the public sector are sup-
posed to spur innovation in the private sector.
Although the specific returns to public-sector R&D
investments are largely unknown, the basic idea is
to create follow-up investments from the private
sector and generate spill-over effects.
For this report, the data on public and private R&D
Methodological approach
R&D InvestmentsIn general, investments into R&D and innovation
are commonly seen as the basis for technological
changes and hence competitiveness. Therefore, they
are an important factor for or driver of economic
growth. From a macro-economic perspective, R&D
investments can be viewed as a major indicator to
measure innovative performance of economies or
innovation systems. The indicator is able to display
the position of a country in international competition
with regard to innovation.
Sectors by financing and performing of R&D
1
Total R&D spending
Financing sectors Business Government
Performing sectors Business Government Higher education
investment were provided by JRC SETIS. Its R&D data
relies on IEA statistics , which collects and depicts
national R&D investments. They address 20 of the
EU Member States with varying regularity and gra-
nularity of technology detail. However, there is a
2 year time delay in reporting for most Member
States, thus data is available for 2015, while only
a few are available in 2016. For the data on private
R&D, the time delay is even longer (2012 and 2013)
as JRC’s assessment is based on patent data. The
methodology is described in more detail in the JRC
Science for Policy Report “Monitoring R&D in Low
Carbon Energy Technologies: Methodology for the
R&D indicators in the State of the Energy Union
Report, - 2016 Edition”. Data gaps are supplemented
by the Member States through the SET Plan Steering
Group or through targeted data mining.
1. IEA. International Energy Agency RD&D Online Data
Service. Available from: http://www.iea.org/statistics/
RDDonlinedataservice/
2. A. Fiorini, A. Georgakaki, F. Pasimeni, E. Tzimas, “Monito-
ring R&D in Low-Carbon Energy Technologies”, EUR 28446
EN (2017). Available from: https://setis.ec.europa.eu/
related-jrc-activities/jrc-setis-reports/monitoring-ri-low-
carbon-energy-technologies
Besides providing absolute figures for R&D expen-
ditures (Euro) of the given countries, the share of
R&D expenditures on GDP (%) is calculated to get an
impression of the relative size of a country’s invest-
ments in RET technologies. Blanks in the table mean
that no data was available.
PUBLIC R&D INVESTMENTS Public R&D investments are depicted by RE technologies.
PRIVATE R&D INVESTMENTS Private R&D investments are depicted by RE technologies. Data are only available for the countries of the
EU-28 in 2012 and 2013.

Indicators on innovation and competitiveness
EUROBSERV ’ER – THE STATE OF RENEWABLE ENERGIES IN EUROPE – 2017 EDITIONEUROBSERV ’ER – THE STATE OF RENEWABLE ENERGIES IN EUROPE – 2017 EDITION
214 215
Public R&D Exp. (in € m)
Share of Public R&D Exp. by GDP
2015 2016 2015 2016
EU 28
Germany 53.0 49.7 0.0017% 0.0017%
Denmark 26.1 22.7 0.0096% 0.0087%
Spain 22.6 0.0021%
Netherlands 16.1 0.0024%
United Kingdom 10.0 9.9 0.0004% 0.0005%
France 9.6 0.0004%
Belgium 4.3 0.0011%
Sweden 3.7 2.3 0.0008% 0.0005%
Finland 2.6 0.0012%
Poland 0.8 0.2 0.0002% 0.0000%
Austria 0.5 0.0002%
Portugal 0.3 0.0002%
Ireland 0.2 0.0001%
Czech Republic 0.1 0.1 0.0001% 0.0001%
Slovakia 0.0 0.0 0.0000% 0.0000%
Hungary 0.0 0.0 0.0000% 0.0000%
Italy 0.0 0.0000%
Total EU 150.0 84.9 0.0010% 0.0006%
Other Countries
Japan 215.7 199.8 0.0055% 0.0045%
Korea 31.5 0.0025% 0.0000%
United States 77.4 67.7 0.0005% 0.0004%
Australia 0.3 0.1
Canada 4.5 7.0 0.0008% 0.0005%
New Zealand 0.0 0.0
Norway 18.0 17.0 0.0052% 0.0048%
Switzerland 1.8 1.8 0.0003% 0.0004%
Turkey 0.7 1.3 0.0001% 0.0002%
Source : JRC SETIS, Eurostat, WDI Database
Public R&D Exp. (in € m)
Share of Public R&D Exp. by GDP
2015 2016 2015 2016
EU 28
Germany 82.0 78.6 0.0027% 0.0028%
France 71.1 0.0033%
Netherlands 51.7 0.0076%
Spain 15.2 0.0014%
United Kingdom 14.3 15.5 0.0006% 0.0007%
Denmark 11.5 8.5 0.0042% 0.0033%
Austria 9.1 0.0027%
Finland 6.8 0.0032%
Belgium 6.6 0.0016%
Sweden 6.5 6.2 0.0015% 0.0015%
Poland 4.7 0.6 0.0011% 0.0001%
Portugal 1.9 0.0011%
Ireland 0.7 0.0003%
Czech Republic 0.7 0.4 0.0004% 0.0002%
Slovakia 0.1 1.2 0.0001% 0.0016%
Hungary 0.0 0.0 0.0000% 0.0000%
Italy 0.0 0.0000%
Total EU 282.8 110.9 0.0019% 0.0008%
Other Countries
Australia 83.7 52.7
United States 82.6 100.1 0.0005% 0.0006%
Japan 59.2 57.4 0.0015% 0.0013%
Korea 43.6 0.0035% 0.0000%
Switzerland 42.1 42.1 0.0070% 0.0087%
Norway 13.4 14.8 0.0038% 0.0042%
Canada 10.4 15.2 0.0007% 0.0011%
Turkey 4.7 6.8 0.0006% 0.0008%
Source : JRC SETIS, Eurostat, WDI Database
In wind energy, Japan scores
first with regard to public R&D
spending, followed by the EU 28
(although data for many countries
is not available in 2016). The U.S.
ranks third, however, with less
than half of the budget of Japan.
Within the EU 28, it is Germany,
Denmark as well as Spain (2015)
and the Netherlands with the
largest public R&D budget (2015).
This can be explained by the fact
that main players among the wind
power manufacturers are located
in these EU countries. In terms of
GDP shares, the values are by far
largest for Denmark, followed by
Japan, Korea (2015) and Germany. n
In the field of solar energy, the
EU 28 is the largest player in
terms of national R&D investment,
although the data are not com-
plete for 2016. The U.S, Japan and
Korea follow the EU 28. The table 2
displays a growth in national R&D
investments in the US, while the
figures slightly decrease for Japan.
Figures for China as well as some
other countries are not available.
Within the EU 28, there are three
countries with significant public
R&D investments, namely Ger-
many, France and the Netherlands.
In 2015, Germany, the Netherlands
and France are responsible for 72%
of the R&D investments of the
EU 28 (2015). In Germany, public
R&D expenditures are rather
constant between 2015 and 2016,
with only slight decreases visible.
For France and the Netherlands,
data for 2016 is not yet available.
When looking at the normaliza-
tion of the R&D figures by GDP, the
share of the EU 28 is low, especially
compared to Korea (in 2015). Howe-
ver, as data are still incomplete in
2016 a general trend cannot be
seen. In 2015, EU 28 reveals still
higher figures than the U.S. and
Japan. Within the EU, the Nether-
lands have the largest budget
share for solar energy, followed
by Denmark, France and Finland. n
PUBLIC R&D INVESTMENTS
WIND ENERGYPUBLIC R&D INVESTMENTS
SOLAR ENERGY
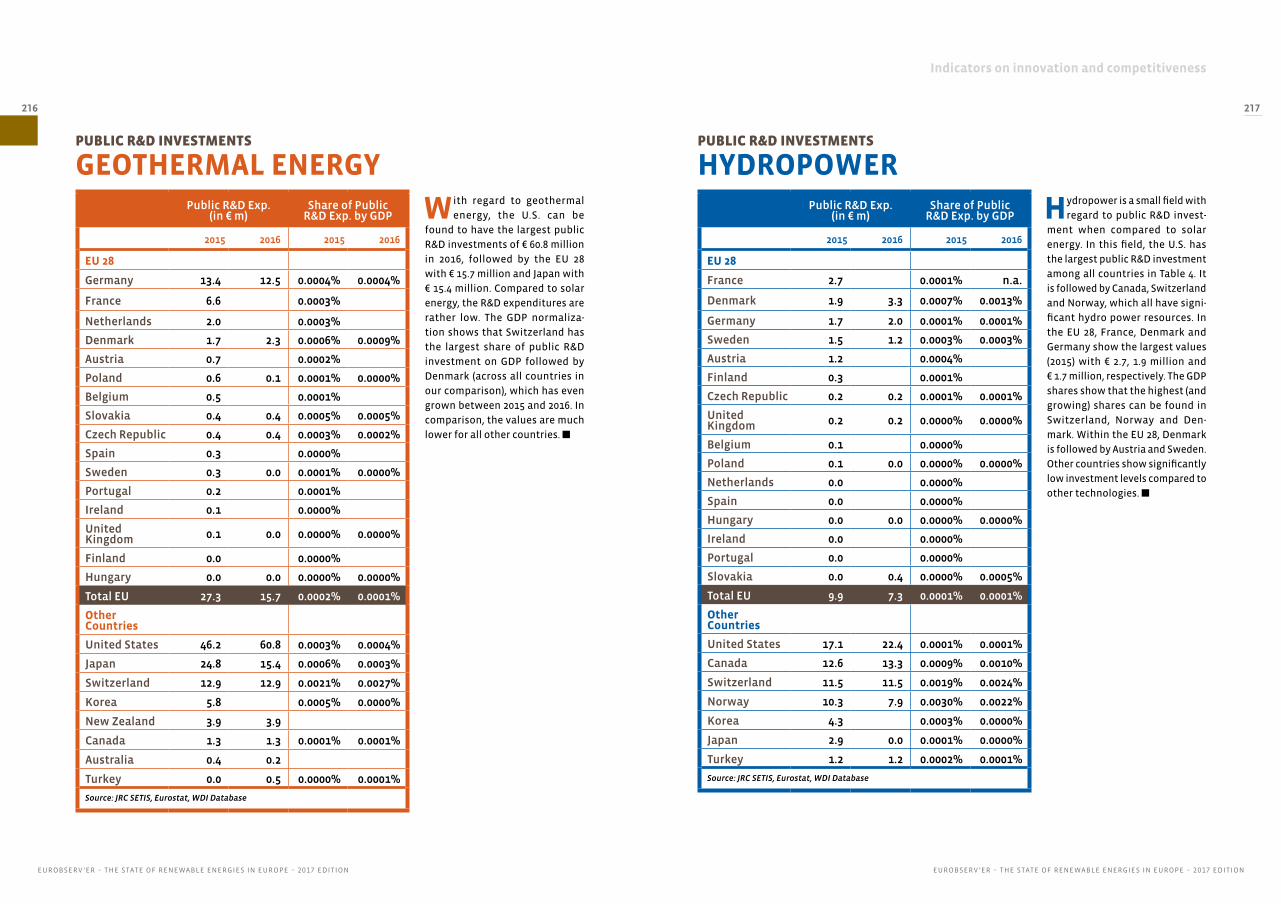
Indicators on innovation and competitiveness
EUROBSERV ’ER – THE STATE OF RENEWABLE ENERGIES IN EUROPE – 2017 EDITIONEUROBSERV ’ER – THE STATE OF RENEWABLE ENERGIES IN EUROPE – 2017 EDITION
216 217
Public R&D Exp. (in € m)
Share of Public R&D Exp. by GDP
2015 2016 2015 2016
EU 28
France 2.7 0.0001% n.a.
Denmark 1.9 3.3 0.0007% 0.0013%
Germany 1.7 2.0 0.0001% 0.0001%
Sweden 1.5 1.2 0.0003% 0.0003%
Austria 1.2 0.0004%
Finland 0.3 0.0001%
Czech Republic 0.2 0.2 0.0001% 0.0001%
United Kingdom 0.2 0.2 0.0000% 0.0000%
Belgium 0.1 0.0000%
Poland 0.1 0.0 0.0000% 0.0000%
Netherlands 0.0 0.0000%
Spain 0.0 0.0000%
Hungary 0.0 0.0 0.0000% 0.0000%
Ireland 0.0 0.0000%
Portugal 0.0 0.0000%
Slovakia 0.0 0.4 0.0000% 0.0005%
Total EU 9.9 7.3 0.0001% 0.0001%
Other Countries
United States 17.1 22.4 0.0001% 0.0001%
Canada 12.6 13.3 0.0009% 0.0010%
Switzerland 11.5 11.5 0.0019% 0.0024%
Norway 10.3 7.9 0.0030% 0.0022%
Korea 4.3 0.0003% 0.0000%
Japan 2.9 0.0 0.0001% 0.0000%
Turkey 1.2 1.2 0.0002% 0.0001%
Source: JRC SETIS, Eurostat, WDI Database
Public R&D Exp. (in € m)
Share of Public R&D Exp. by GDP
2015 2016 2015 2016
EU 28
Germany 13.4 12.5 0.0004% 0.0004%
France 6.6 0.0003%
Netherlands 2.0 0.0003%
Denmark 1.7 2.3 0.0006% 0.0009%
Austria 0.7 0.0002%
Poland 0.6 0.1 0.0001% 0.0000%
Belgium 0.5 0.0001%
Slovakia 0.4 0.4 0.0005% 0.0005%
Czech Republic 0.4 0.4 0.0003% 0.0002%
Spain 0.3 0.0000%
Sweden 0.3 0.0 0.0001% 0.0000%
Portugal 0.2 0.0001%
Ireland 0.1 0.0000%
United Kingdom 0.1 0.0 0.0000% 0.0000%
Finland 0.0 0.0000%
Hungary 0.0 0.0 0.0000% 0.0000%
Total EU 27.3 15.7 0.0002% 0.0001%
Other Countries
United States 46.2 60.8 0.0003% 0.0004%
Japan 24.8 15.4 0.0006% 0.0003%
Switzerland 12.9 12.9 0.0021% 0.0027%
Korea 5.8 0.0005% 0.0000%
New Zealand 3.9 3.9
Canada 1.3 1.3 0.0001% 0.0001%
Australia 0.4 0.2
Turkey 0.0 0.5 0.0000% 0.0001%
Source: JRC SETIS, Eurostat, WDI Database
Hydropower is a small field with
regard to public R&D invest-
ment when compared to solar
energy. In this field, the U.S. has
the largest public R&D investment
among all countries in Table 4. It
is followed by Canada, Switzerland
and Norway, which all have signi-
ficant hydro power resources. In
the EU 28, France, Denmark and
Germany show the largest values
(2015) with € 2.7, 1.9 million and
€ 1.7 million, respectively. The GDP
shares show that the highest (and
growing) shares can be found in
Switzerland, Norway and Den-
mark. Within the EU 28, Denmark
is followed by Austria and Sweden.
Other countries show significantly
low investment levels compared to
other technologies. n
With regard to geothermal
energy, the U.S. can be
found to have the largest public
R&D investments of € 60.8 million
in 2016, followed by the EU 28
with € 15.7 million and Japan with
€ 15.4 million. Compared to solar
energy, the R&D expenditures are
rather low. The GDP normaliza-
tion shows that Switzerland has
the largest share of public R&D
investment on GDP followed by
Denmark (across all countries in
our comparison), which has even
grown between 2015 and 2016. In
comparison, the values are much
lower for all other countries. n
PUBLIC R&D INVESTMENTS
HYDROPOWERPUBLIC R&D INVESTMENTS
GEOTHERMAL ENERGY
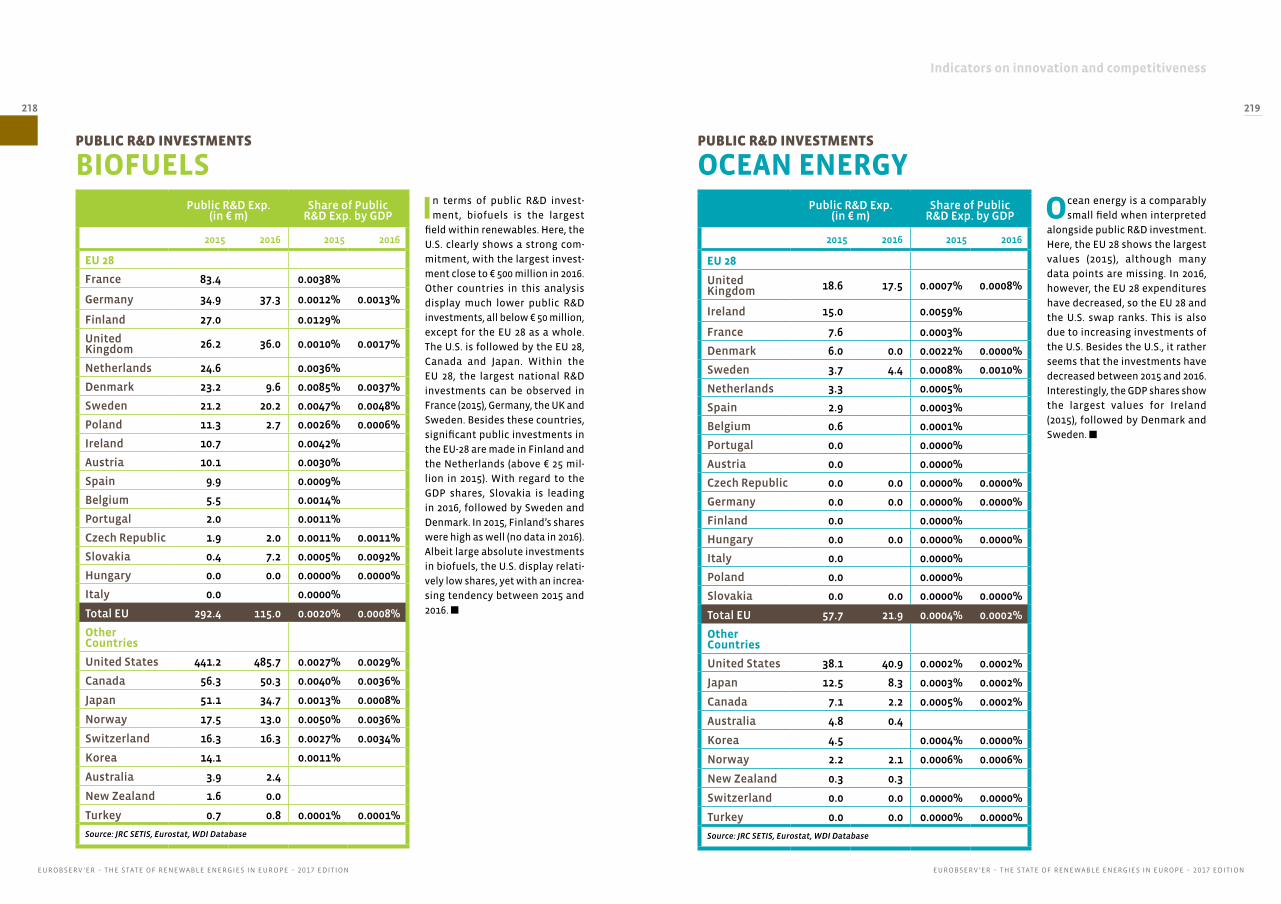
Indicators on innovation and competitiveness
EUROBSERV ’ER – THE STATE OF RENEWABLE ENERGIES IN EUROPE – 2017 EDITIONEUROBSERV ’ER – THE STATE OF RENEWABLE ENERGIES IN EUROPE – 2017 EDITION
218 219
Public R&D Exp. (in € m)
Share of Public R&D Exp. by GDP
2015 2016 2015 2016
EU 28
France 83.4 0.0038%
Germany 34.9 37.3 0.0012% 0.0013%
Finland 27.0 0.0129%
United Kingdom 26.2 36.0 0.0010% 0.0017%
Netherlands 24.6 0.0036%
Denmark 23.2 9.6 0.0085% 0.0037%
Sweden 21.2 20.2 0.0047% 0.0048%
Poland 11.3 2.7 0.0026% 0.0006%
Ireland 10.7 0.0042%
Austria 10.1 0.0030%
Spain 9.9 0.0009%
Belgium 5.5 0.0014%
Portugal 2.0 0.0011%
Czech Republic 1.9 2.0 0.0011% 0.0011%
Slovakia 0.4 7.2 0.0005% 0.0092%
Hungary 0.0 0.0 0.0000% 0.0000%
Italy 0.0 0.0000%
Total EU 292.4 115.0 0.0020% 0.0008%
Other Countries
United States 441.2 485.7 0.0027% 0.0029%
Canada 56.3 50.3 0.0040% 0.0036%
Japan 51.1 34.7 0.0013% 0.0008%
Norway 17.5 13.0 0.0050% 0.0036%
Switzerland 16.3 16.3 0.0027% 0.0034%
Korea 14.1 0.0011%
Australia 3.9 2.4
New Zealand 1.6 0.0
Turkey 0.7 0.8 0.0001% 0.0001%
Source: JRC SETIS, Eurostat, WDI Database
Public R&D Exp. (in € m)
Share of Public R&D Exp. by GDP
2015 2016 2015 2016
EU 28
United Kingdom 18.6 17.5 0.0007% 0.0008%
Ireland 15.0 0.0059%
France 7.6 0.0003%
Denmark 6.0 0.0 0.0022% 0.0000%
Sweden 3.7 4.4 0.0008% 0.0010%
Netherlands 3.3 0.0005%
Spain 2.9 0.0003%
Belgium 0.6 0.0001%
Portugal 0.0 0.0000%
Austria 0.0 0.0000%
Czech Republic 0.0 0.0 0.0000% 0.0000%
Germany 0.0 0.0 0.0000% 0.0000%
Finland 0.0 0.0000%
Hungary 0.0 0.0 0.0000% 0.0000%
Italy 0.0 0.0000%
Poland 0.0 0.0000%
Slovakia 0.0 0.0 0.0000% 0.0000%
Total EU 57.7 21.9 0.0004% 0.0002%
Other Countries
United States 38.1 40.9 0.0002% 0.0002%
Japan 12.5 8.3 0.0003% 0.0002%
Canada 7.1 2.2 0.0005% 0.0002%
Australia 4.8 0.4
Korea 4.5 0.0004% 0.0000%
Norway 2.2 2.1 0.0006% 0.0006%
New Zealand 0.3 0.3
Switzerland 0.0 0.0 0.0000% 0.0000%
Turkey 0.0 0.0 0.0000% 0.0000%
Source: JRC SETIS, Eurostat, WDI Database
In terms of public R&D invest-
ment, biofuels is the largest
field within renewables. Here, the
U.S. clearly shows a strong com-
mitment, with the largest invest-
ment close to € 500 million in 2016.
Other countries in this analysis
display much lower public R&D
investments, all below € 50 million,
except for the EU 28 as a whole.
The U.S. is followed by the EU 28,
Canada and Japan. Within the
EU 28, the largest national R&D
investments can be observed in
France (2015), Germany, the UK and
Sweden. Besides these countries,
significant public investments in
the EU-28 are made in Finland and
the Netherlands (above € 25 mil-
lion in 2015). With regard to the
GDP shares, Slovakia is leading
in 2016, followed by Sweden and
Denmark. In 2015, Finland’s shares
were high as well (no data in 2016).
Albeit large absolute investments
in biofuels, the U.S. display relati-
vely low shares, yet with an increa-
sing tendency between 2015 and
2016. n
Ocean energy is a comparably
small field when interpreted
alongside public R&D investment.
Here, the EU 28 shows the largest
values (2015), although many
data points are missing. In 2016,
however, the EU 28 expenditures
have decreased, so the EU 28 and
the U.S. swap ranks. This is also
due to increasing investments of
the U.S. Besides the U.S., it rather
seems that the investments have
decreased between 2015 and 2016.
Interestingly, the GDP shares show
the largest values for Ireland
(2015), followed by Denmark and
Sweden. n
PUBLIC R&D INVESTMENTS
BIOFUELSPUBLIC R&D INVESTMENTS
OCEAN ENERGY
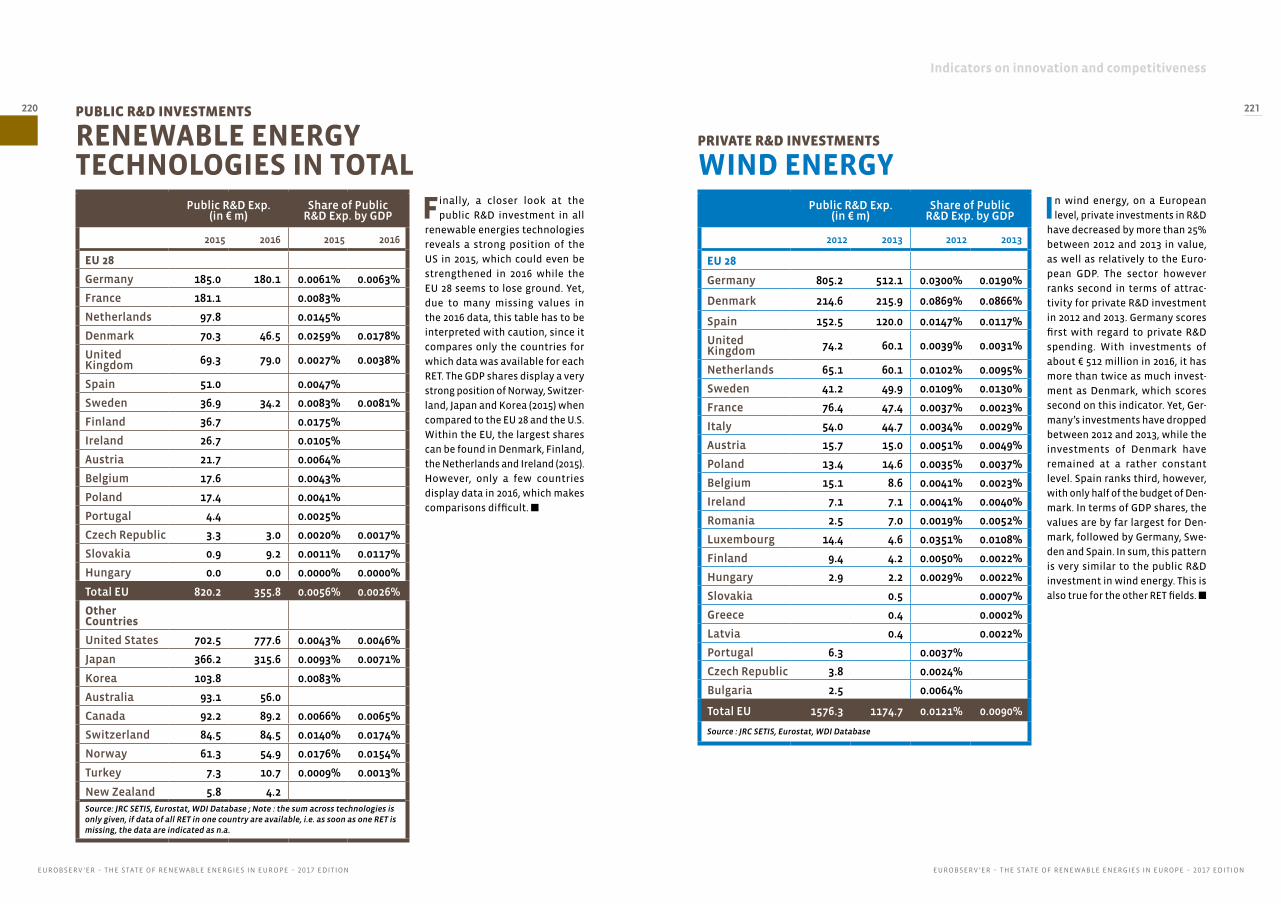
Indicators on innovation and competitiveness
EUROBSERV ’ER – THE STATE OF RENEWABLE ENERGIES IN EUROPE – 2017 EDITIONEUROBSERV ’ER – THE STATE OF RENEWABLE ENERGIES IN EUROPE – 2017 EDITION
220 221
Public R&D Exp. (in € m)
Share of Public R&D Exp. by GDP
2015 2016 2015 2016
EU 28
Germany 185.0 180.1 0.0061% 0.0063%
France 181.1 0.0083%
Netherlands 97.8 0.0145%
Denmark 70.3 46.5 0.0259% 0.0178%
United Kingdom 69.3 79.0 0.0027% 0.0038%
Spain 51.0 0.0047%
Sweden 36.9 34.2 0.0083% 0.0081%
Finland 36.7 0.0175%
Ireland 26.7 0.0105%
Austria 21.7 0.0064%
Belgium 17.6 0.0043%
Poland 17.4 0.0041%
Portugal 4.4 0.0025%
Czech Republic 3.3 3.0 0.0020% 0.0017%
Slovakia 0.9 9.2 0.0011% 0.0117%
Hungary 0.0 0.0 0.0000% 0.0000%
Total EU 820.2 355.8 0.0056% 0.0026%
Other Countries
United States 702.5 777.6 0.0043% 0.0046%
Japan 366.2 315.6 0.0093% 0.0071%
Korea 103.8 0.0083%
Australia 93.1 56.0
Canada 92.2 89.2 0.0066% 0.0065%
Switzerland 84.5 84.5 0.0140% 0.0174%
Norway 61.3 54.9 0.0176% 0.0154%
Turkey 7.3 10.7 0.0009% 0.0013%
New Zealand 5.8 4.2 Source: JRC SETIS, Eurostat, WDI Database ; Note : the sum across technologies is only given, if data of all RET in one country are available, i.e. as soon as one RET is missing, the data are indicated as n.a.
Finally, a closer look at the
public R&D investment in all
renewable energies technologies
reveals a strong position of the
US in 2015, which could even be
strengthened in 2016 while the
EU 28 seems to lose ground. Yet,
due to many missing values in
the 2016 data, this table has to be
interpreted with caution, since it
compares only the countries for
which data was available for each
RET. The GDP shares display a very
strong position of Norway, Switzer-
land, Japan and Korea (2015) when
compared to the EU 28 and the U.S.
Within the EU, the largest shares
can be found in Denmark, Finland,
the Netherlands and Ireland (2015).
However, only a few countries
display data in 2016, which makes
comparisons difficult. n
PUBLIC R&D INVESTMENTS
RENEWABLE ENERGY TECHNOLOGIES IN TOTAL
Public R&D Exp. (in € m)
Share of Public R&D Exp. by GDP
2012 2013 2012 2013
EU 28
Germany 805.2 512.1 0.0300% 0.0190%
Denmark 214.6 215.9 0.0869% 0.0866%
Spain 152.5 120.0 0.0147% 0.0117%
United Kingdom 74.2 60.1 0.0039% 0.0031%
Netherlands 65.1 60.1 0.0102% 0.0095%
Sweden 41.2 49.9 0.0109% 0.0130%
France 76.4 47.4 0.0037% 0.0023%
Italy 54.0 44.7 0.0034% 0.0029%
Austria 15.7 15.0 0.0051% 0.0049%
Poland 13.4 14.6 0.0035% 0.0037%
Belgium 15.1 8.6 0.0041% 0.0023%
Ireland 7.1 7.1 0.0041% 0.0040%
Romania 2.5 7.0 0.0019% 0.0052%
Luxembourg 14.4 4.6 0.0351% 0.0108%
Finland 9.4 4.2 0.0050% 0.0022%
Hungary 2.9 2.2 0.0029% 0.0022%
Slovakia 0.5 0.0007%
Greece 0.4 0.0002%
Latvia 0.4 0.0022%
Portugal 6.3 0.0037%
Czech Republic 3.8 0.0024%
Bulgaria 2.5 0.0064%
Total EU 1576.3 1174.7 0.0121% 0.0090%
Source : JRC SETIS, Eurostat, WDI Database
In wind energy, on a European
level, private investments in R&D
have decreased by more than 25%
between 2012 and 2013 in value,
as well as relatively to the Euro-
pean GDP. The sector however
ranks second in terms of attrac-
tivity for private R&D investment
in 2012 and 2013. Germany scores
first with regard to private R&D
spending. With investments of
about € 512 million in 2016, it has
more than twice as much invest-
ment as Denmark, which scores
second on this indicator. Yet, Ger-
many’s investments have dropped
between 2012 and 2013, while the
investments of Denmark have
remained at a rather constant
level. Spain ranks third, however,
with only half of the budget of Den-
mark. In terms of GDP shares, the
values are by far largest for Den-
mark, followed by Germany, Swe-
den and Spain. In sum, this pattern
is very similar to the public R&D
investment in wind energy. This is
also true for the other RET fields. n
PRIVATE R&D INVESTMENTS
WIND ENERGY
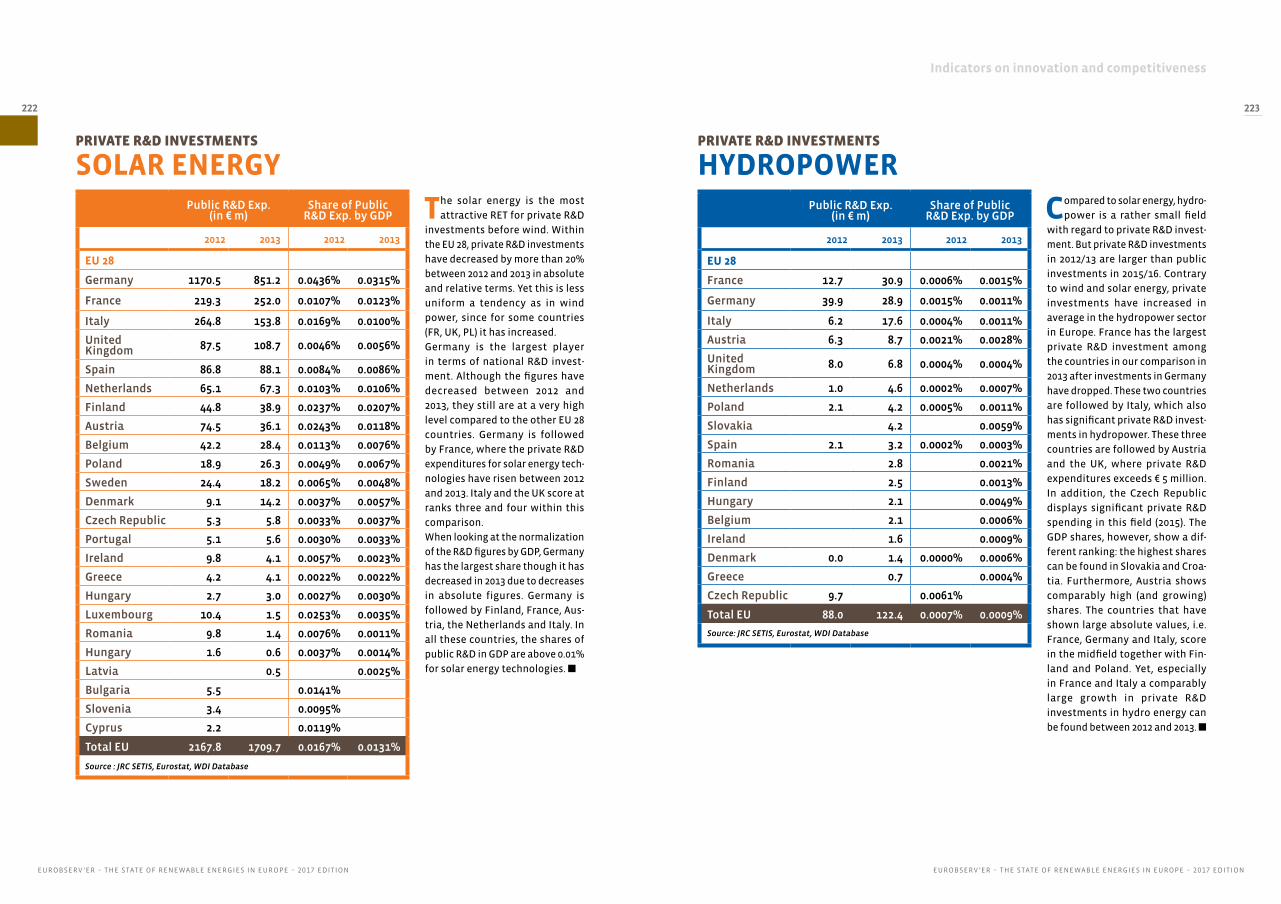
Indicators on innovation and competitiveness
EUROBSERV ’ER – THE STATE OF RENEWABLE ENERGIES IN EUROPE – 2017 EDITIONEUROBSERV ’ER – THE STATE OF RENEWABLE ENERGIES IN EUROPE – 2017 EDITION
222 223
Public R&D Exp. (in € m)
Share of Public R&D Exp. by GDP
2012 2013 2012 2013
EU 28
Germany 1170.5 851.2 0.0436% 0.0315%
France 219.3 252.0 0.0107% 0.0123%
Italy 264.8 153.8 0.0169% 0.0100%
United Kingdom 87.5 108.7 0.0046% 0.0056%
Spain 86.8 88.1 0.0084% 0.0086%
Netherlands 65.1 67.3 0.0103% 0.0106%
Finland 44.8 38.9 0.0237% 0.0207%
Austria 74.5 36.1 0.0243% 0.0118%
Belgium 42.2 28.4 0.0113% 0.0076%
Poland 18.9 26.3 0.0049% 0.0067%
Sweden 24.4 18.2 0.0065% 0.0048%
Denmark 9.1 14.2 0.0037% 0.0057%
Czech Republic 5.3 5.8 0.0033% 0.0037%
Portugal 5.1 5.6 0.0030% 0.0033%
Ireland 9.8 4.1 0.0057% 0.0023%
Greece 4.2 4.1 0.0022% 0.0022%
Hungary 2.7 3.0 0.0027% 0.0030%
Luxembourg 10.4 1.5 0.0253% 0.0035%
Romania 9.8 1.4 0.0076% 0.0011%
Hungary 1.6 0.6 0.0037% 0.0014%
Latvia 0.5 0.0025%
Bulgaria 5.5 0.0141%
Slovenia 3.4 0.0095%
Cyprus 2.2 0.0119%
Total EU 2167.8 1709.7 0.0167% 0.0131%
Source : JRC SETIS, Eurostat, WDI Database
The solar energy is the most
attractive RET for private R&D
investments before wind. Within
the EU 28, private R&D investments
have decreased by more than 20%
between 2012 and 2013 in absolute
and relative terms. Yet this is less
uniform a tendency as in wind
power, since for some countries
(FR, UK, PL) it has increased.
Germany is the largest player
in terms of national R&D invest-
ment. Although the figures have
decreased between 2012 and
2013, they still are at a very high
level compared to the other EU 28
countries. Germany is followed
by France, where the private R&D
expenditures for solar energy tech-
nologies have risen between 2012
and 2013. Italy and the UK score at
ranks three and four within this
comparison.
When looking at the normalization
of the R&D figures by GDP, Germany
has the largest share though it has
decreased in 2013 due to decreases
in absolute figures. Germany is
followed by Finland, France, Aus-
tria, the Netherlands and Italy. In
all these countries, the shares of
public R&D in GDP are above 0.01%
for solar energy technologies. n
PRIVATE R&D INVESTMENTS
SOLAR ENERGYPublic R&D Exp.
(in € m)Share of Public
R&D Exp. by GDP
2012 2013 2012 2013
EU 28
France 12.7 30.9 0.0006% 0.0015%
Germany 39.9 28.9 0.0015% 0.0011%
Italy 6.2 17.6 0.0004% 0.0011%
Austria 6.3 8.7 0.0021% 0.0028%
United Kingdom 8.0 6.8 0.0004% 0.0004%
Netherlands 1.0 4.6 0.0002% 0.0007%
Poland 2.1 4.2 0.0005% 0.0011%
Slovakia 4.2 0.0059%
Spain 2.1 3.2 0.0002% 0.0003%
Romania 2.8 0.0021%
Finland 2.5 0.0013%
Hungary 2.1 0.0049%
Belgium 2.1 0.0006%
Ireland 1.6 0.0009%
Denmark 0.0 1.4 0.0000% 0.0006%
Greece 0.7 0.0004%
Czech Republic 9.7 0.0061%
Total EU 88.0 122.4 0.0007% 0.0009%
Source: JRC SETIS, Eurostat, WDI Database
Compared to solar energy, hydro-
power is a rather small field
with regard to private R&D invest-
ment. But private R&D investments
in 2012/13 are larger than public
investments in 2015/16. Contrary
to wind and solar energy, private
investments have increased in
average in the hydropower sector
in Europe. France has the largest
private R&D investment among
the countries in our comparison in
2013 after investments in Germany
have dropped. These two countries
are followed by Italy, which also
has significant private R&D invest-
ments in hydropower. These three
countries are followed by Austria
and the UK, where private R&D
expenditures exceeds € 5 million.
In addition, the Czech Republic
displays significant private R&D
spending in this field (2015). The
GDP shares, however, show a dif-
ferent ranking: the highest shares
can be found in Slovakia and Croa-
tia. Furthermore, Austria shows
comparably high (and growing)
shares. The countries that have
shown large absolute values, i.e.
France, Germany and Italy, score
in the midfield together with Fin-
land and Poland. Yet, especially
in France and Italy a comparably
large growth in private R&D
investments in hydro energy can
be found between 2012 and 2013. n
PRIVATE R&D INVESTMENTS
HYDROPOWER
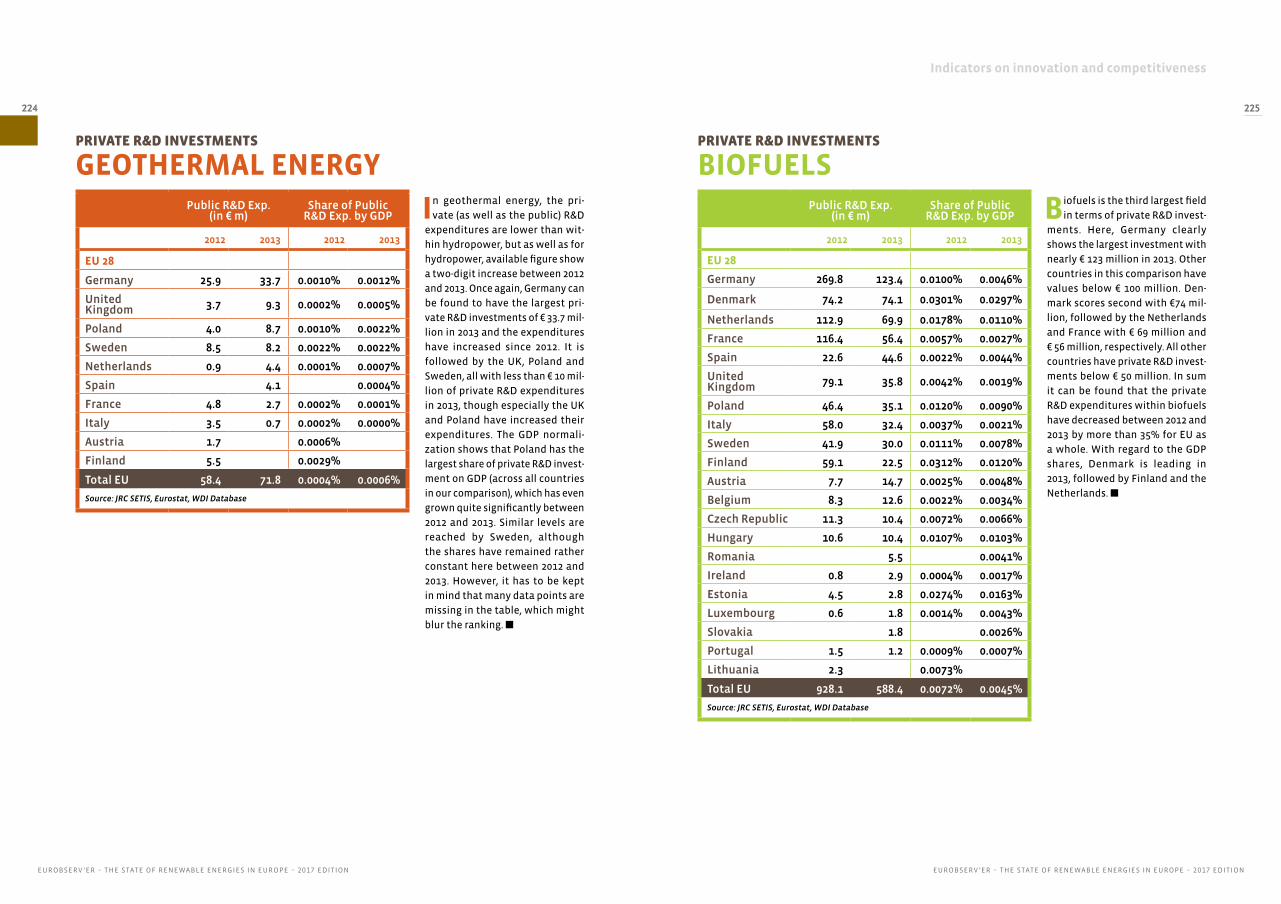
Indicators on innovation and competitiveness
EUROBSERV ’ER – THE STATE OF RENEWABLE ENERGIES IN EUROPE – 2017 EDITIONEUROBSERV ’ER – THE STATE OF RENEWABLE ENERGIES IN EUROPE – 2017 EDITION
224 225
Public R&D Exp. (in € m)
Share of Public R&D Exp. by GDP
2012 2013 2012 2013
EU 28
Germany 25.9 33.7 0.0010% 0.0012%
United Kingdom 3.7 9.3 0.0002% 0.0005%
Poland 4.0 8.7 0.0010% 0.0022%
Sweden 8.5 8.2 0.0022% 0.0022%
Netherlands 0.9 4.4 0.0001% 0.0007%
Spain 4.1 0.0004%
France 4.8 2.7 0.0002% 0.0001%
Italy 3.5 0.7 0.0002% 0.0000%
Austria 1.7 0.0006%
Finland 5.5 0.0029%
Total EU 58.4 71.8 0.0004% 0.0006%
Source: JRC SETIS, Eurostat, WDI Database
In geothermal energy, the pri-
vate (as well as the public) R&D
expenditures are lower than wit-
hin hydropower, but as well as for
hydropower, available figure show
a two-digit increase between 2012
and 2013. Once again, Germany can
be found to have the largest pri-
vate R&D investments of € 33.7 mil-
lion in 2013 and the expenditures
have increased since 2012. It is
followed by the UK, Poland and
Sweden, all with less than € 10 mil-
lion of private R&D expenditures
in 2013, though especially the UK
and Poland have increased their
expenditures. The GDP normali-
zation shows that Poland has the
largest share of private R&D invest-
ment on GDP (across all countries
in our comparison), which has even
grown quite significantly between
2012 and 2013. Similar levels are
reached by Sweden, although
the shares have remained rather
constant here between 2012 and
2013. However, it has to be kept
in mind that many data points are
missing in the table, which might
blur the ranking. n
PRIVATE R&D INVESTMENTS
GEOTHERMAL ENERGYPublic R&D Exp.
(in € m)Share of Public
R&D Exp. by GDP
2012 2013 2012 2013
EU 28
Germany 269.8 123.4 0.0100% 0.0046%
Denmark 74.2 74.1 0.0301% 0.0297%
Netherlands 112.9 69.9 0.0178% 0.0110%
France 116.4 56.4 0.0057% 0.0027%
Spain 22.6 44.6 0.0022% 0.0044%
United Kingdom 79.1 35.8 0.0042% 0.0019%
Poland 46.4 35.1 0.0120% 0.0090%
Italy 58.0 32.4 0.0037% 0.0021%
Sweden 41.9 30.0 0.0111% 0.0078%
Finland 59.1 22.5 0.0312% 0.0120%
Austria 7.7 14.7 0.0025% 0.0048%
Belgium 8.3 12.6 0.0022% 0.0034%
Czech Republic 11.3 10.4 0.0072% 0.0066%
Hungary 10.6 10.4 0.0107% 0.0103%
Romania 5.5 0.0041%
Ireland 0.8 2.9 0.0004% 0.0017%
Estonia 4.5 2.8 0.0274% 0.0163%
Luxembourg 0.6 1.8 0.0014% 0.0043%
Slovakia 1.8 0.0026%
Portugal 1.5 1.2 0.0009% 0.0007%
Lithuania 2.3 0.0073%
Total EU 928.1 588.4 0.0072% 0.0045%
Source: JRC SETIS, Eurostat, WDI Database
Biofuels is the third largest field
in terms of private R&D invest-
ments. Here, Germany clearly
shows the largest investment with
nearly € 123 million in 2013. Other
countries in this comparison have
values below € 100 million. Den-
mark scores second with €74 mil-
lion, followed by the Netherlands
and France with € 69 million and
€ 56 million, respectively. All other
countries have private R&D invest-
ments below € 50 million. In sum
it can be found that the private
R&D expenditures within biofuels
have decreased between 2012 and
2013 by more than 35% for EU as
a whole. With regard to the GDP
shares, Denmark is leading in
2013, followed by Finland and the
Netherlands. n
PRIVATE R&D INVESTMENTS
BIOFUELS
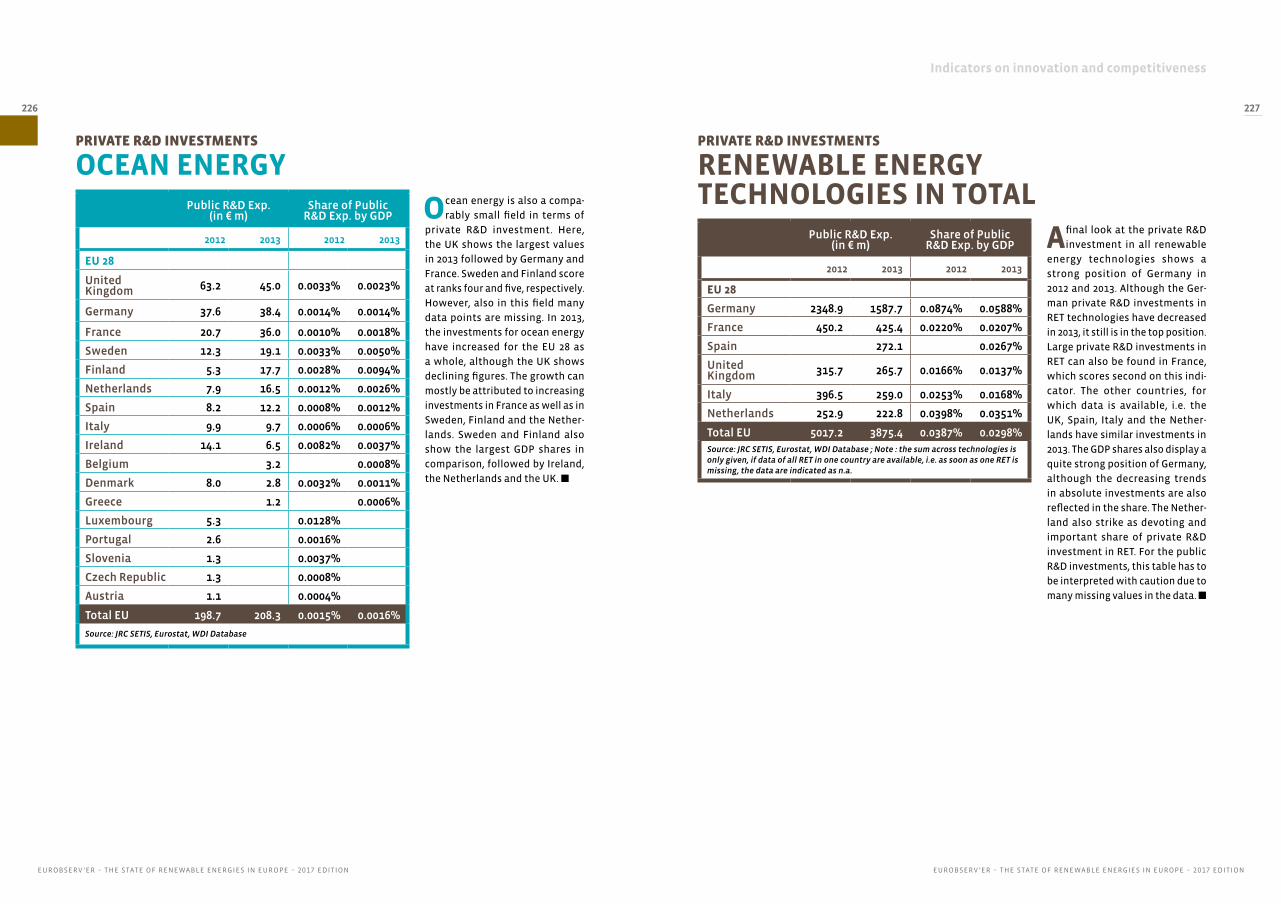
Indicators on innovation and competitiveness
EUROBSERV ’ER – THE STATE OF RENEWABLE ENERGIES IN EUROPE – 2017 EDITIONEUROBSERV ’ER – THE STATE OF RENEWABLE ENERGIES IN EUROPE – 2017 EDITION
226 227
Public R&D Exp. (in € m)
Share of Public R&D Exp. by GDP
2012 2013 2012 2013
EU 28
United Kingdom 63.2 45.0 0.0033% 0.0023%
Germany 37.6 38.4 0.0014% 0.0014%
France 20.7 36.0 0.0010% 0.0018%
Sweden 12.3 19.1 0.0033% 0.0050%
Finland 5.3 17.7 0.0028% 0.0094%
Netherlands 7.9 16.5 0.0012% 0.0026%
Spain 8.2 12.2 0.0008% 0.0012%
Italy 9.9 9.7 0.0006% 0.0006%
Ireland 14.1 6.5 0.0082% 0.0037%
Belgium 3.2 0.0008%
Denmark 8.0 2.8 0.0032% 0.0011%
Greece 1.2 0.0006%
Luxembourg 5.3 0.0128%
Portugal 2.6 0.0016%
Slovenia 1.3 0.0037%
Czech Republic 1.3 0.0008%
Austria 1.1 0.0004%
Total EU 198.7 208.3 0.0015% 0.0016%
Source: JRC SETIS, Eurostat, WDI Database
Ocean energy is also a compa-
rably small field in terms of
private R&D investment. Here,
the UK shows the largest values
in 2013 followed by Germany and
France. Sweden and Finland score
at ranks four and five, respectively.
However, also in this field many
data points are missing. In 2013,
the investments for ocean energy
have increased for the EU 28 as
a whole, although the UK shows
declining figures. The growth can
mostly be attributed to increasing
investments in France as well as in
Sweden, Finland and the Nether-
lands. Sweden and Finland also
show the largest GDP shares in
comparison, followed by Ireland,
the Netherlands and the UK. n
PRIVATE R&D INVESTMENTS
OCEAN ENERGY
Public R&D Exp. (in € m)
Share of Public R&D Exp. by GDP
2012 2013 2012 2013
EU 28
Germany 2348.9 1587.7 0.0874% 0.0588%
France 450.2 425.4 0.0220% 0.0207%
Spain 272.1 0.0267%
United Kingdom 315.7 265.7 0.0166% 0.0137%
Italy 396.5 259.0 0.0253% 0.0168%
Netherlands 252.9 222.8 0.0398% 0.0351%
Total EU 5017.2 3875.4 0.0387% 0.0298%Source: JRC SETIS, Eurostat, WDI Database ; Note : the sum across technologies is only given, if data of all RET in one country are available, i.e. as soon as one RET is missing, the data are indicated as n.a.
A final look at the private R&D
investment in all renewable
energy technologies shows a
strong position of Germany in
2012 and 2013. Although the Ger-
man private R&D investments in
RET technologies have decreased
in 2013, it still is in the top position.
Large private R&D investments in
RET can also be found in France,
which scores second on this indi-
cator. The other countries, for
which data is available, i.e. the
UK, Spain, Italy and the Nether-
lands have similar investments in
2013. The GDP shares also display a
quite strong position of Germany,
although the decreasing trends
in absolute investments are also
reflected in the share. The Nether-
land also strike as devoting and
important share of private R&D
investment in RET. For the public
R&D investments, this table has to
be interpreted with caution due to
many missing values in the data. n
PRIVATE R&D INVESTMENTS
RENEWABLE ENERGY TECHNOLOGIES IN TOTAL

Indicators on innovation and competitiveness
EUROBSERV ’ER – THE STATE OF RENEWABLE ENERGIES IN EUROPE – 2017 EDITIONEUROBSERV ’ER – THE STATE OF RENEWABLE ENERGIES IN EUROPE – 2017 EDITION
228 229
Due to missing data, espe-
cially for China, it is difficult
to draw conclusions. China is
currently the largest investor in
RET installations (wind and solar
power), followed by the US. Thus,
it is expected to show also signifi-
cant financial allocations for R&D.
Furthermore, China is the main
exporter in PV as well as in hydro-
power. Based on the assumption
of strengthening competitiveness
through innovation, China is sup-
posed to allocate significant finan-
cial resources for R&D to these
technologies as well.
Nevertheless, it can be stated
that many countries have specia-
lized in certain technology fields
within RET technologies. This can
be found for public as well as for
private R&D investments:
• So far, the EU-28 (2015/16) scores
first in public solar energy R&D
spending, above the U.S., Japan
and Korea, while data for China
is not available. Within Europe,
especially Germany, France
and the Netherlands have the
largest public R&D investments.
For private R&D investments,
only data for the EU-28 countries
are available (2012/2013). The
solar sector is by far the one
which attracts the more private
investments in R&D. Here, it can
be shown that Germany scores
first in terms of national R&D
investment, followed by France,
Italy and the UK.
• In wind energy, Japan scores
first with regard to public R&D
spending, followed by the
EU-28 (although data for many
countries is not available here in
2016). With regard to private R&D
spending in the EU, wind power
is the second largest sector after
solar in 2013. Germany scores
first followed by Denmark, which
scores second on this indicator.
• In hydro energy, which is a com-
parably small field with regard to
public R&D investment, the U.S.
ranks first, which can be explai-
ned by its geographical position,
i.e. large hydropower resources.
It is followed by Canada, Swit-
zerland and Norway. Within
the EU-28, France, Denmark
and Germany show the largest
public investments. As for the
private R&D investments, France
shows the largest values among
the countries in our comparison
(EU-28 only). It is followed by Ger-
many and Italy, which both have
significant private R&D invest-
ments in hydropower.
PUBLIC AND PRIVATE R&D CONCLUSIONS
• With regard to geothermal
energy, the U.S. ranks first,
although many countries have
been found to be active here.
When looking at the share of
public R&D investments on GDP,
especially Switzerland and Den-
mark stick out. The figures for
private R&D expenditures show
that Germany seems to have the
largest private R&D investments
of € 33.7 million in 2013 and the
expenditures have increased
since 2012. It is followed by the
UK, Poland and Sweden.
• Within biofuels, the U.S. clearly
shows the largest investment
with nearly € 500 million in 2016.
The other countries in our com-
parison have much lower public
R&D investments. As for the pri-
vate investment, Germany scores
first with nearly € 123 million in
2016. All other (EU 28) countries
in our comparison have values
below € 100 million. However,
biofuel is the largest field in
renewables in terms of public
R&D spending and the third in
terms of private investments in
2013.
• In ocean energy – also a rather
small field in terms of public
R&D – the EU 28 sticks out. In
2016, however, the EU 28 expen-
ditures have decreased (based on
the available data), so the EU 28
and the U.S. swap ranks. This is
also due to increasing public R&D
investments of the U.S. Concer-
ning private R&D investments,
the UK shows the largest values
in 2013 followed by Germany,
France, Sweden and Finland.
• Regarding all renewables,
Germany, France, the UK and
especially the Netherlands and
Denmark should be mentioned.
These are countries that have
significant public R&D investment
in nearly all RET fields, as is shown
by a share of GDP that surpasses
between two or three times that
of the first two countries.
• Overall, this analysis shows that
private R&D financing by far
exceeds public R&D financing,
in the monitored years. n
Ves
tas

Indicators on innovation and competitiveness
EUROBSERV ’ER – THE STATE OF RENEWABLE ENERGIES IN EUROPE – 2017 EDITIONEUROBSERV ’ER – THE STATE OF RENEWABLE ENERGIES IN EUROPE – 2017 EDITION
230 231
Patent Filings
Methodological approach For the analyses of patents in different renewable
energy technologies, not only the number of
filings but also a specialization indicator is pro-
vided. For this purpose, the Revealed Patent
Advantage (RPA) is estimated, which builds on
the works by Balassa (Balassa 1965), who has
created this indicator to analyse international
trade. Here the RPA indicates in which RET fields
a country is strongly or weakly represented com-
pared to the total patent applications in the field
of energy technologies. Thus, the RPA for country
i in field RET measures the share of RET patents
of country i in all energy technologies compared
to the RET world share of patents in all energy
technologies. If a country i’s share is larger than
the world share, country i is said to be specialised
in renewable energies within its energy field. The
data were transformed, so values between 0 and
1 imply a below average interest or focus on this
renewable technology, while values above 1 indi-
cate a positive specialization, i.e. a strong focus
on this RET compared to all energy technologies.
It should be noted that the specialization indica-
tor refers to energy technologies, and not to all
technologies. This makes the indicator more sen-
sitive to small changes in RET patent filings, i.e. it
displays more ups and downs, and depicts small
numbers in renewable patents as large speciali-
sation effects if the patent portfolio in energy
technologies is small, i.e. the country is small.
To account for this size effect of the country or
economy and to make patent data more compa-
rable between countries, patent filings per GDP
(in trillion €) are depicted as well4.
Figures in 2012 differ from the previous version
due to an update of the patent database.
The patent data for this report were provided by
JRC SETIS. The data originate from the EPO World-
wide Patent Statistical Database (PATSTAT)1. A
full dataset for a given year is completed with a
3.5 year delay. Thus, data used for the assessment
of indicators have a 4 year delay. Estimates with a
2 year lag are provided at EU level only. The data
specifically address advances in the area of low
carbon energy and climate mitigation technologies
(Y-code of the Cooperative Patent Classification
(CPC)2). Datasets are processed by JRC SETIS to eli-
minate errors and inconsistencies. Patent statis-
tics are based on the priority date, simple patent
families3 and fractional counts of submissions
made both to national and international autho-
rities to avoid multiple counting of patents. Wit-
hin the count of patent families, filings at single
offices, also known as “singletons” are included.
This implies that the results regarding the global
technological competitiveness could be biased
towards countries with large domestic markets
The technological performance of countries or inno-
vation systems in general is commonly measured by
patent filings as well as patent grants, which can be
viewed as the major output indicators for R&D pro-
cesses. Countries with a high output of patents are
assumed to have a strong technological competiti-
veness, which might be translated into an overall
macroeconomic competitiveness. Patents can be
analyzed from different angles and with different
aims, and the methods and definitions applied for
these analyses do differ. Here, we focus on a domestic,
macro-economic perspective by providing informa-
tion on the technological capabilities of economies
within renewable energies technologies. The number
of patent applications - domestic or international -,
the patent specialization as well as patent per GDP
are depicted by RE technologies for 2012 and 2013.
1. EPO. Worldwide Patent Statistical Database (PATSTAT),
European Patent Office. Available from: https://www.
epo.org/searching-for-patents/business/patstat.
html#tab1
2. EPO and USPTO. Cooperative Patent Classification (CPC),
European Patent Office & United States Trademark and
Patent Office. Available from http://www.cooperativepa-
tentclassification.org/index.html
3. Patents allow companies to protect their research and
innovations efforts. Patents covering the domestic
market only (single patent families), provide only a
protection at the domestic level, while patents filed
at the WIPO or the EPO provide a protection outside
the domestic market (i.e. they are forwarded to other
national offices), and hence signal an international com-
petitiveness of the company.
4. The methodology is described in more detail in the
JRC Science for Policy Report “Monitoring R&D in Low
Carbon Energy Technologies: Methodology for the R&D
indicators in the State of the Energy Union Report,
- 2016 Edition” A. Fiorini, A. Georgakaki, F. Pasimeni,
E. Tzimas, “Monitoring R&D in Low-Carbon Energy
Technologies”, EUR 28446 EN (2017). Available from:
https://setis.ec.europa.eu/related-jrc-activities/jrc-setis-
reports/monitoring-ri-low-carbon-energy-technologies
and specialties in their patent systems, e.g. Japan
and Korea. Thus, these results might wrongly signal
a strong international competitiveness.
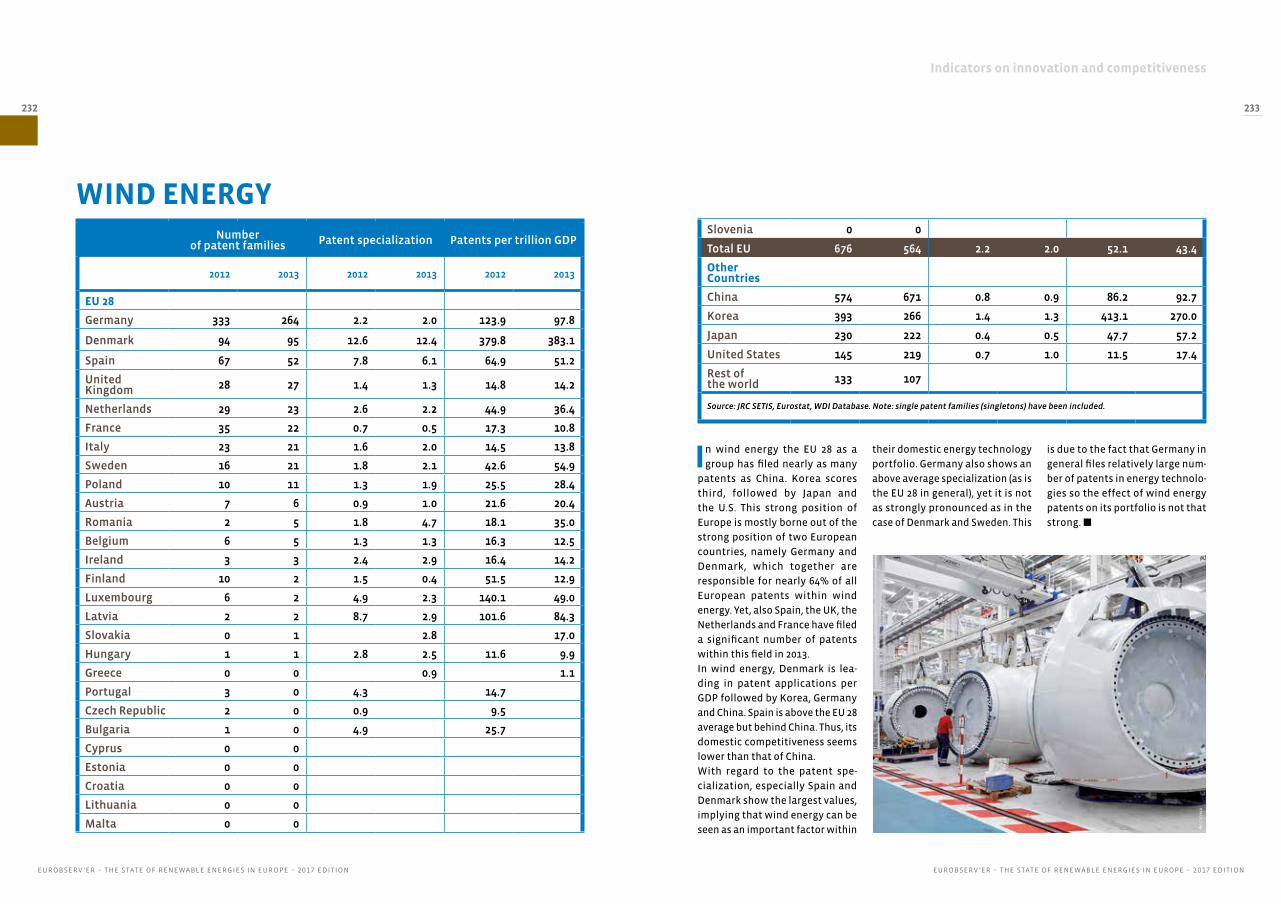
Indicators on innovation and competitiveness
EUROBSERV ’ER – THE STATE OF RENEWABLE ENERGIES IN EUROPE – 2017 EDITIONEUROBSERV ’ER – THE STATE OF RENEWABLE ENERGIES IN EUROPE – 2017 EDITION
232 233
In wind energy the EU 28 as a
group has filed nearly as many
patents as China. Korea scores
third, followed by Japan and
the U.S. This strong position of
Europe is mostly borne out of the
strong position of two European
countries, namely Germany and
Denmark, which together are
responsible for nearly 64% of all
European patents within wind
energy. Yet, also Spain, the UK, the
Netherlands and France have filed
a significant number of patents
within this field in 2013.
In wind energy, Denmark is lea-
ding in patent applications per
GDP followed by Korea, Germany
and China. Spain is above the EU 28
average but behind China. Thus, its
domestic competitiveness seems
lower than that of China.
With regard to the patent spe-
cialization, especially Spain and
Denmark show the largest values,
implying that wind energy can be
seen as an important factor within
their domestic energy technology
portfolio. Germany also shows an
above average specialization (as is
the EU 28 in general), yet it is not
as strongly pronounced as in the
case of Denmark and Sweden. This
WIND ENERGY
is due to the fact that Germany in
general files relatively large num-
ber of patents in energy technolo-
gies so the effect of wind energy
patents on its portfolio is not that
strong. n
Number of patent families Patent specialization Patents per trillion GDP
2012 2013 2012 2013 2012 2013
EU 28
Germany 333 264 2.2 2.0 123.9 97.8
Denmark 94 95 12.6 12.4 379.8 383.1
Spain 67 52 7.8 6.1 64.9 51.2
United Kingdom 28 27 1.4 1.3 14.8 14.2
Netherlands 29 23 2.6 2.2 44.9 36.4
France 35 22 0.7 0.5 17.3 10.8
Italy 23 21 1.6 2.0 14.5 13.8
Sweden 16 21 1.8 2.1 42.6 54.9
Poland 10 11 1.3 1.9 25.5 28.4
Austria 7 6 0.9 1.0 21.6 20.4
Romania 2 5 1.8 4.7 18.1 35.0
Belgium 6 5 1.3 1.3 16.3 12.5
Ireland 3 3 2.4 2.9 16.4 14.2
Finland 10 2 1.5 0.4 51.5 12.9
Luxembourg 6 2 4.9 2.3 140.1 49.0
Latvia 2 2 8.7 2.9 101.6 84.3
Slovakia 0 1 2.8 17.0
Hungary 1 1 2.8 2.5 11.6 9.9
Greece 0 0 0.9 1.1
Portugal 3 0 4.3 14.7
Czech Republic 2 0 0.9 9.5
Bulgaria 1 0 4.9 25.7
Cyprus 0 0
Estonia 0 0
Croatia 0 0
Lithuania 0 0
Malta 0 0
Slovenia 0 0
Total EU 676 564 2.2 2.0 52.1 43.4
Other Countries
China 574 671 0.8 0.9 86.2 92.7
Korea 393 266 1.4 1.3 413.1 270.0
Japan 230 222 0.4 0.5 47.7 57.2
United States 145 219 0.7 1.0 11.5 17.4
Rest of the world 133 107
Source: JRC SETIS, Eurostat, WDI Database. Note: single patent families (singletons) have been included.
Ac
cio
na
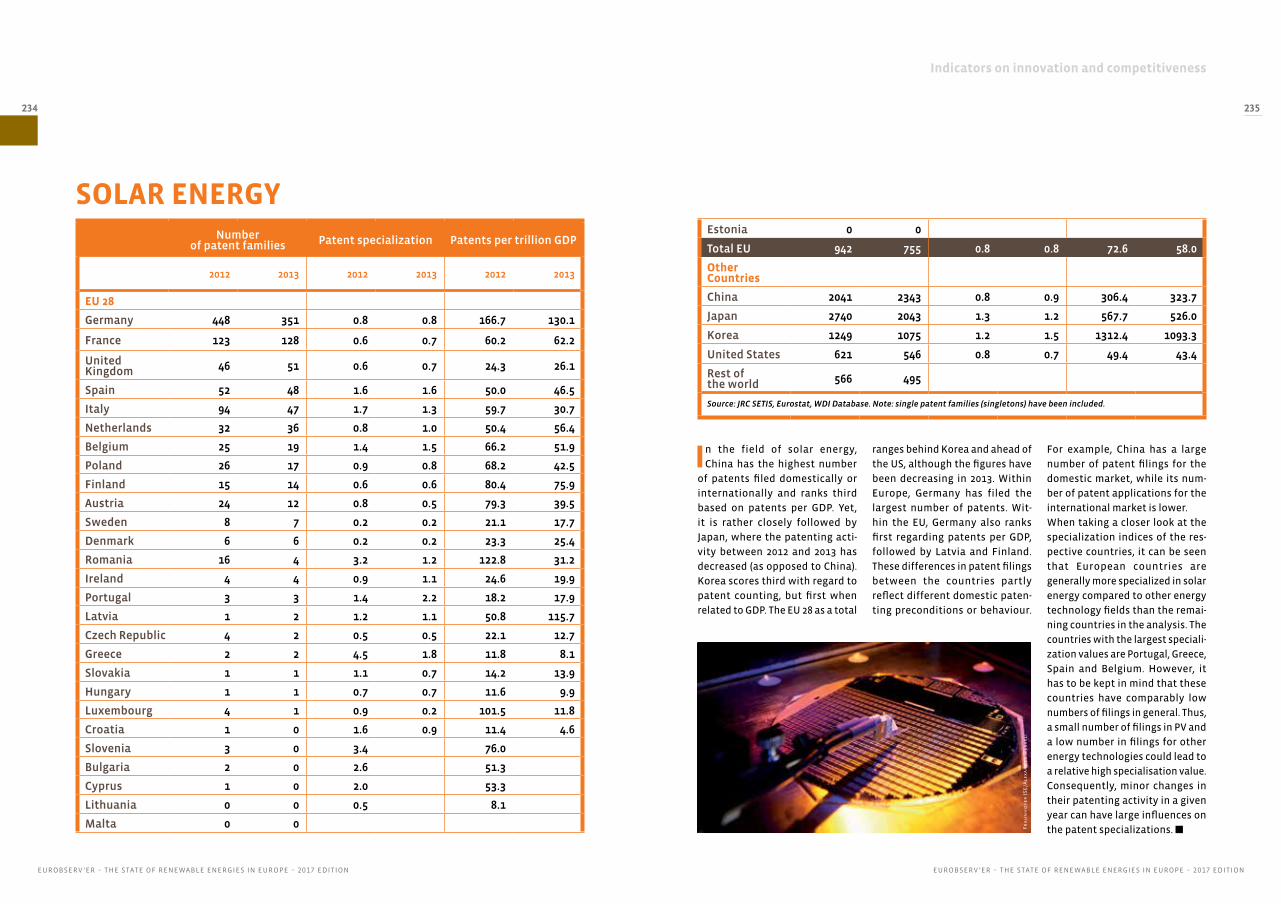
Indicators on innovation and competitiveness
EUROBSERV ’ER – THE STATE OF RENEWABLE ENERGIES IN EUROPE – 2017 EDITIONEUROBSERV ’ER – THE STATE OF RENEWABLE ENERGIES IN EUROPE – 2017 EDITION
234 235
In the field of solar energy,
China has the highest number
of patents filed domestically or
internationally and ranks third
based on patents per GDP. Yet,
it is rather closely followed by
Japan, where the patenting acti-
vity between 2012 and 2013 has
decreased (as opposed to China).
Korea scores third with regard to
patent counting, but first when
related to GDP. The EU 28 as a total
ranges behind Korea and ahead of
the US, although the figures have
been decreasing in 2013. Within
Europe, Germany has filed the
largest number of patents. Wit-
hin the EU, Germany also ranks
first regarding patents per GDP,
followed by Latvia and Finland.
These differences in patent filings
between the countries partly
reflect different domestic paten-
ting preconditions or behaviour.
SOLAR ENERGY
For example, China has a large
number of patent filings for the
domestic market, while its num-
ber of patent applications for the
international market is lower.
When taking a closer look at the
specialization indices of the res-
pective countries, it can be seen
that European countries are
generally more specialized in solar
energy compared to other energy
technology fields than the remai-
ning countries in the analysis. The
countries with the largest speciali-
zation values are Portugal, Greece,
Spain and Belgium. However, it
has to be kept in mind that these
countries have comparably low
numbers of filings in general. Thus,
a small number of filings in PV and
a low number in filings for other
energy technologies could lead to
a relative high specialisation value.
Consequently, minor changes in
their patenting activity in a given
year can have large influences on
the patent specializations. n
Number of patent families Patent specialization Patents per trillion GDP
2012 2013 2012 2013 2012 2013
EU 28
Germany 448 351 0.8 0.8 166.7 130.1
France 123 128 0.6 0.7 60.2 62.2
United Kingdom 46 51 0.6 0.7 24.3 26.1
Spain 52 48 1.6 1.6 50.0 46.5
Italy 94 47 1.7 1.3 59.7 30.7
Netherlands 32 36 0.8 1.0 50.4 56.4
Belgium 25 19 1.4 1.5 66.2 51.9
Poland 26 17 0.9 0.8 68.2 42.5
Finland 15 14 0.6 0.6 80.4 75.9
Austria 24 12 0.8 0.5 79.3 39.5
Sweden 8 7 0.2 0.2 21.1 17.7
Denmark 6 6 0.2 0.2 23.3 25.4
Romania 16 4 3.2 1.2 122.8 31.2
Ireland 4 4 0.9 1.1 24.6 19.9
Portugal 3 3 1.4 2.2 18.2 17.9
Latvia 1 2 1.2 1.1 50.8 115.7
Czech Republic 4 2 0.5 0.5 22.1 12.7
Greece 2 2 4.5 1.8 11.8 8.1
Slovakia 1 1 1.1 0.7 14.2 13.9
Hungary 1 1 0.7 0.7 11.6 9.9
Luxembourg 4 1 0.9 0.2 101.5 11.8
Croatia 1 0 1.6 0.9 11.4 4.6
Slovenia 3 0 3.4 76.0
Bulgaria 2 0 2.6 51.3
Cyprus 1 0 2.0 53.3
Lithuania 0 0 0.5 8.1
Malta 0 0
Estonia 0 0
Total EU 942 755 0.8 0.8 72.6 58.0
Other Countries
China 2041 2343 0.8 0.9 306.4 323.7
Japan 2740 2043 1.3 1.2 567.7 526.0
Korea 1249 1075 1.2 1.5 1312.4 1093.3
United States 621 546 0.8 0.7 49.4 43.4
Rest of the world 566 495
Source: JRC SETIS, Eurostat, WDI Database. Note: single patent families (singletons) have been included.
Fra
un
ho
fer
IS
E/A
lexa
nd
er W
ekk
eli
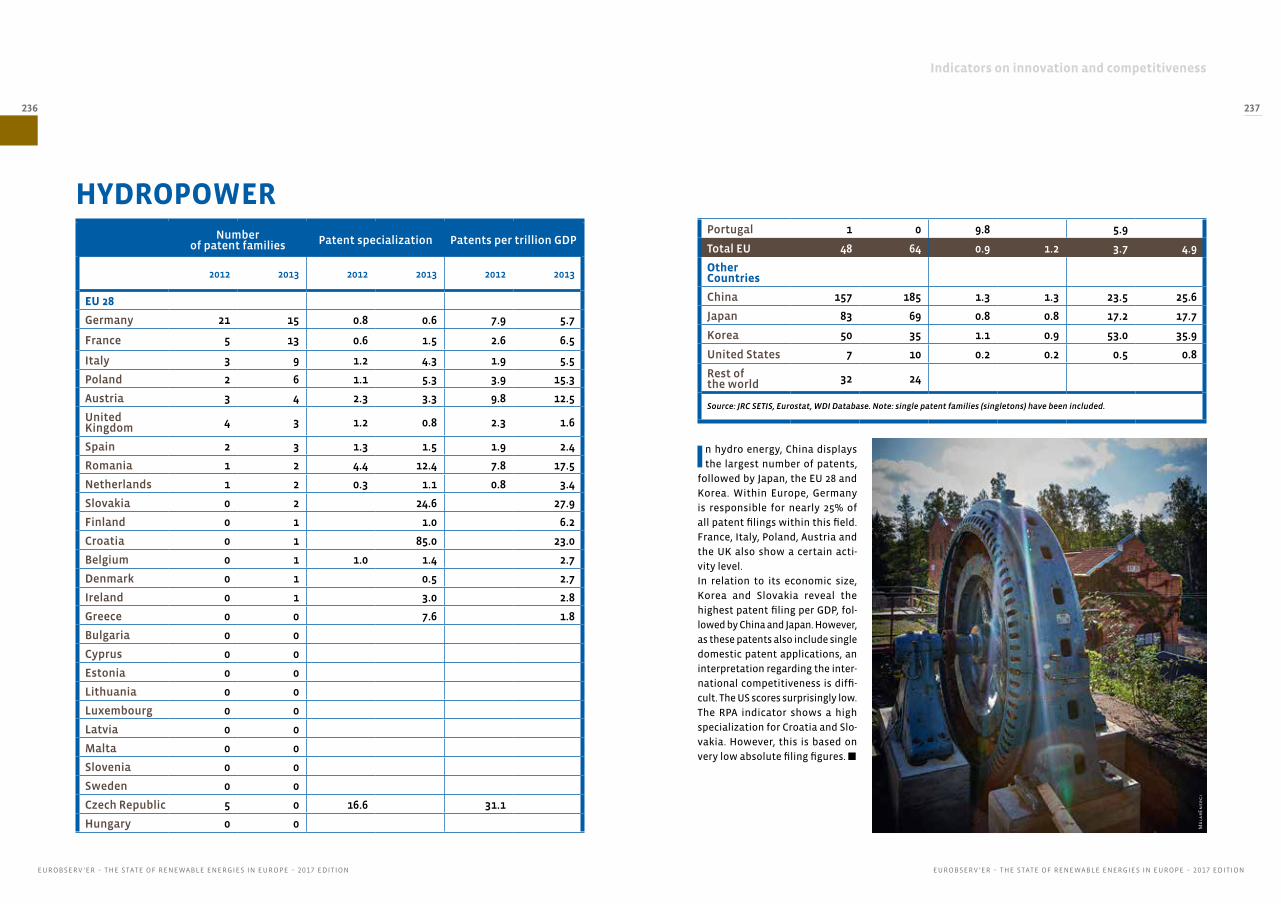
Indicators on innovation and competitiveness
EUROBSERV ’ER – THE STATE OF RENEWABLE ENERGIES IN EUROPE – 2017 EDITIONEUROBSERV ’ER – THE STATE OF RENEWABLE ENERGIES IN EUROPE – 2017 EDITION
236 237
In hydro energy, China displays
the largest number of patents,
followed by Japan, the EU 28 and
Korea. Within Europe, Germany
is responsible for nearly 25% of
all patent filings within this field.
France, Italy, Poland, Austria and
the UK also show a certain acti-
vity level.
In relation to its economic size,
Korea and Slovakia reveal the
highest patent filing per GDP, fol-
lowed by China and Japan. However,
as these patents also include single
domestic patent applications, an
interpretation regarding the inter-
national competitiveness is diffi-
cult. The US scores surprisingly low.
The RPA indicator shows a high
specialization for Croatia and Slo-
vakia. However, this is based on
very low absolute filing figures. n
HYDROPOWERNumber
of patent families Patent specialization Patents per trillion GDP
2012 2013 2012 2013 2012 2013
EU 28
Germany 21 15 0.8 0.6 7.9 5.7
France 5 13 0.6 1.5 2.6 6.5
Italy 3 9 1.2 4.3 1.9 5.5
Poland 2 6 1.1 5.3 3.9 15.3
Austria 3 4 2.3 3.3 9.8 12.5
United Kingdom 4 3 1.2 0.8 2.3 1.6
Spain 2 3 1.3 1.5 1.9 2.4
Romania 1 2 4.4 12.4 7.8 17.5
Netherlands 1 2 0.3 1.1 0.8 3.4
Slovakia 0 2 24.6 27.9
Finland 0 1 1.0 6.2
Croatia 0 1 85.0 23.0
Belgium 0 1 1.0 1.4 2.7
Denmark 0 1 0.5 2.7
Ireland 0 1 3.0 2.8
Greece 0 0 7.6 1.8
Bulgaria 0 0
Cyprus 0 0
Estonia 0 0
Lithuania 0 0
Luxembourg 0 0
Latvia 0 0
Malta 0 0
Slovenia 0 0
Sweden 0 0
Czech Republic 5 0 16.6 31.1
Hungary 0 0
Portugal 1 0 9.8 5.9
Total EU 48 64 0.9 1.2 3.7 4.9
Other Countries
China 157 185 1.3 1.3 23.5 25.6
Japan 83 69 0.8 0.8 17.2 17.7
Korea 50 35 1.1 0.9 53.0 35.9
United States 7 10 0.2 0.2 0.5 0.8
Rest of the world 32 24
Source: JRC SETIS, Eurostat, WDI Database. Note: single patent families (singletons) have been included.
Mä
lar
En
erg
i

Indicators on innovation and competitiveness
EUROBSERV ’ER – THE STATE OF RENEWABLE ENERGIES IN EUROPE – 2017 EDITIONEUROBSERV ’ER – THE STATE OF RENEWABLE ENERGIES IN EUROPE – 2017 EDITION
238 239
In geothermal energy, the paten-
ting figures are slightly lower
than in hydropower. In terms of
patent filings, geothermal energy
is less significant a field than solar
energy. The filing figures are below
100 for each of the countries in our
comparison. The EU 28 countries in
total filed 20 patents in geothermal
energy in 2013, with 9 patents ori-
ginating from Germany. The other
European countries that have
actively patented inventions in
geothermal energy are Poland, the
UK and Sweden. The largest paten-
ting country in geothermal energy
worldwide is Japan with 57 patents
in 2013, followed by China, Korea
and the EU 28. The U.S. has only
filed 12 patents within this field in
2013. With respect to patents per
GDP, Korea and Japan are leading,
i.e. they show the highest level of
patent filings. In the EU 28, Poland,
Sweden and Germany rank top at a
low level in 2013.
As mentioned before, there is a size
problem with the specialisation
indicator if countries are small. For
example, in Poland or Sweden the
indicator is high, but it is based on
only minor changes in the paten-
ting of renewables. This is because
the countries’ energy techno-
logy portfolio is small, and small
GEOTHERMAL ENERGY
changes in renewables patent
become a large weight. Overall,
Japan and Korea show a relatively
high specialization of their domes-
tic markets with a large number of
patents, while some EU countries
reveal a much stronger specialisa-
tion, which is, however, based on a
lower number of patents. n
Number of patent families Patent specialization Patents per trillion GDP
2012 2013 2012 2013 2012 2013
EU 28
Germany 11 9 0.8 0.9 4.0 3.4
Poland 2 4 2.4 9.1 3.9 10.5
United Kingdom 1 2 0.8 1.5 0.7 1.2
Sweden 3 2 4.0 2.6 7.9 5.2
Netherlands 0 1 0.4 1.3 0.5 1.7
Spain 0 1 0.0 1.5 0.0 1.0
France 2 1 0.4 0.2 0.8 0.3
Italy 2 0 2.0 0.2 1.5 0.1
Finland 2 0 3.7 10.6
Austria 1 0 1.6 3.3
Czech Republic 1 0 7.2 6.3
Cyprus 0 0
Estonia 0 0
Greece 0 0
Croatia 0 0
Lithuania 0 0
Luxembourg 0 0
Latvia 0 0
Malta 0 0
Romania 0 0
Slovenia 0 0
Denmark 0 0
Belgium 0 0
Slovakia 0 0
Portugal 0 0
Ireland 0 0
Bulgaria 0 0
Hungary 0 0
Total EU 25 20 1.0 1.0 1.9 1.6
Other Countries
Japan 71 57 1.5 1.6 14.8 14.6
China 22 28 0.4 0.5 3.3 3.8
Korea 31 27 1.4 1.7 32.9 27.6
United States 16 12 0.9 0.7 1.2 0.9
Rest of the world 11 11
Source: JRC SETIS, Eurostat, WDI Database. Note: single patent families (singletons) have been included.
Da
nsk
Fje
rn
var
me
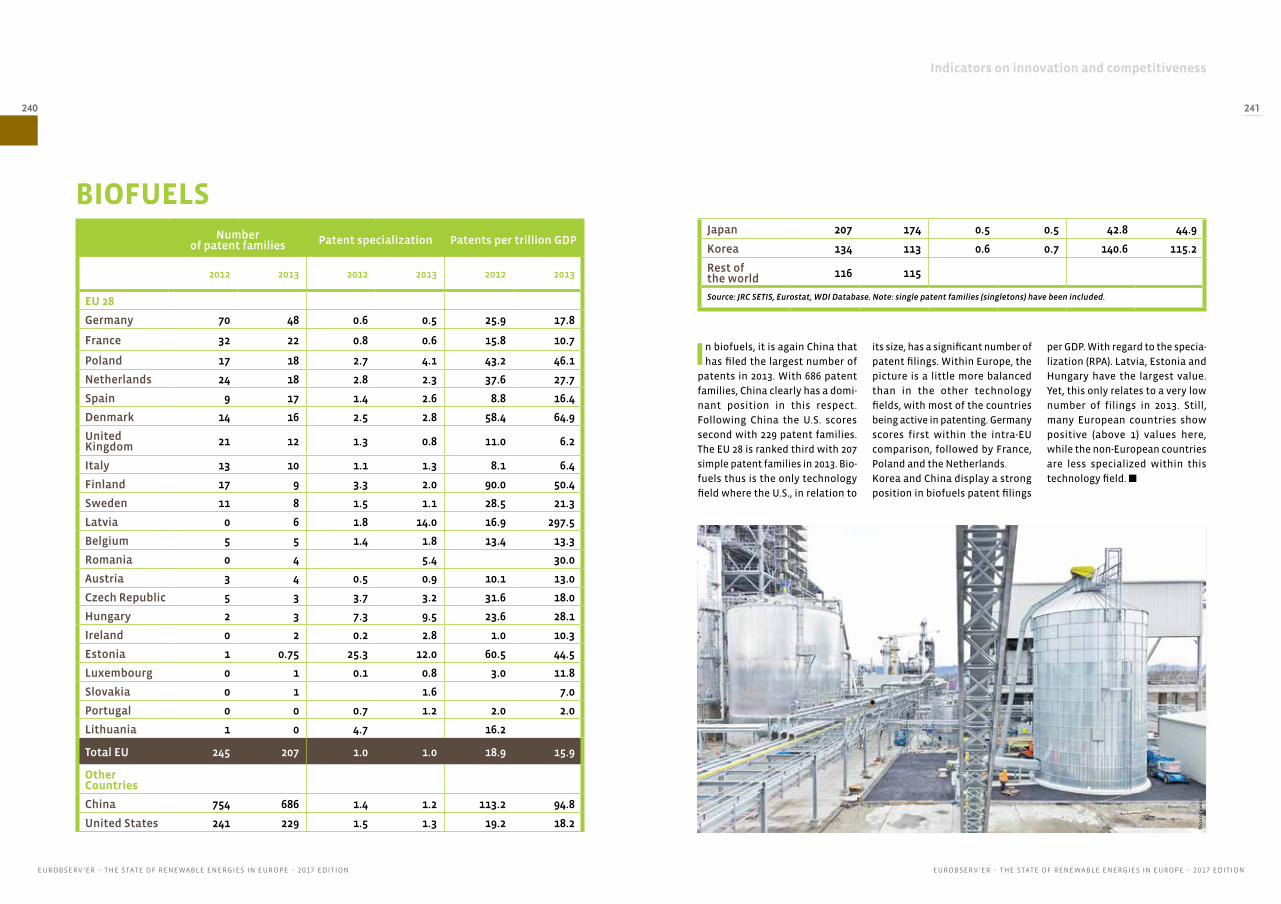
Indicators on innovation and competitiveness
EUROBSERV ’ER – THE STATE OF RENEWABLE ENERGIES IN EUROPE – 2017 EDITIONEUROBSERV ’ER – THE STATE OF RENEWABLE ENERGIES IN EUROPE – 2017 EDITION
240 241
In biofuels, it is again China that
has filed the largest number of
patents in 2013. With 686 patent
families, China clearly has a domi-
nant position in this respect.
Following China the U.S. scores
second with 229 patent families.
The EU 28 is ranked third with 207
simple patent families in 2013. Bio-
fuels thus is the only technology
field where the U.S., in relation to
BIOFUELSNumber
of patent families Patent specialization Patents per trillion GDP
2012 2013 2012 2013 2012 2013
EU 28
Germany 70 48 0.6 0.5 25.9 17.8
France 32 22 0.8 0.6 15.8 10.7
Poland 17 18 2.7 4.1 43.2 46.1
Netherlands 24 18 2.8 2.3 37.6 27.7
Spain 9 17 1.4 2.6 8.8 16.4
Denmark 14 16 2.5 2.8 58.4 64.9
United Kingdom 21 12 1.3 0.8 11.0 6.2
Italy 13 10 1.1 1.3 8.1 6.4
Finland 17 9 3.3 2.0 90.0 50.4
Sweden 11 8 1.5 1.1 28.5 21.3
Latvia 0 6 1.8 14.0 16.9 297.5
Belgium 5 5 1.4 1.8 13.4 13.3
Romania 0 4 5.4 30.0
Austria 3 4 0.5 0.9 10.1 13.0
Czech Republic 5 3 3.7 3.2 31.6 18.0
Hungary 2 3 7.3 9.5 23.6 28.1
Ireland 0 2 0.2 2.8 1.0 10.3
Estonia 1 0.75 25.3 12.0 60.5 44.5
Luxembourg 0 1 0.1 0.8 3.0 11.8
Slovakia 0 1 1.6 7.0
Portugal 0 0 0.7 1.2 2.0 2.0
Lithuania 1 0 4.7 16.2
Total EU 245 207 1.0 1.0 18.9 15.9
Other Countries
China 754 686 1.4 1.2 113.2 94.8
United States 241 229 1.5 1.3 19.2 18.2
Japan 207 174 0.5 0.5 42.8 44.9
Korea 134 113 0.6 0.7 140.6 115.2
Rest of the world 116 115
Source: JRC SETIS, Eurostat, WDI Database. Note: single patent families (singletons) have been included.
its size, has a significant number of
patent filings. Within Europe, the
picture is a little more balanced
than in the other technology
fields, with most of the countries
being active in patenting. Germany
scores first within the intra-EU
comparison, followed by France,
Poland and the Netherlands.
Korea and China display a strong
position in biofuels patent filings
per GDP. With regard to the specia-
lization (RPA). Latvia, Estonia and
Hungary have the largest value.
Yet, this only relates to a very low
number of filings in 2013. Still,
many European countries show
positive (above 1) values here,
while the non-European countries
are less specialized within this
technology field. n
No
voz
ymes
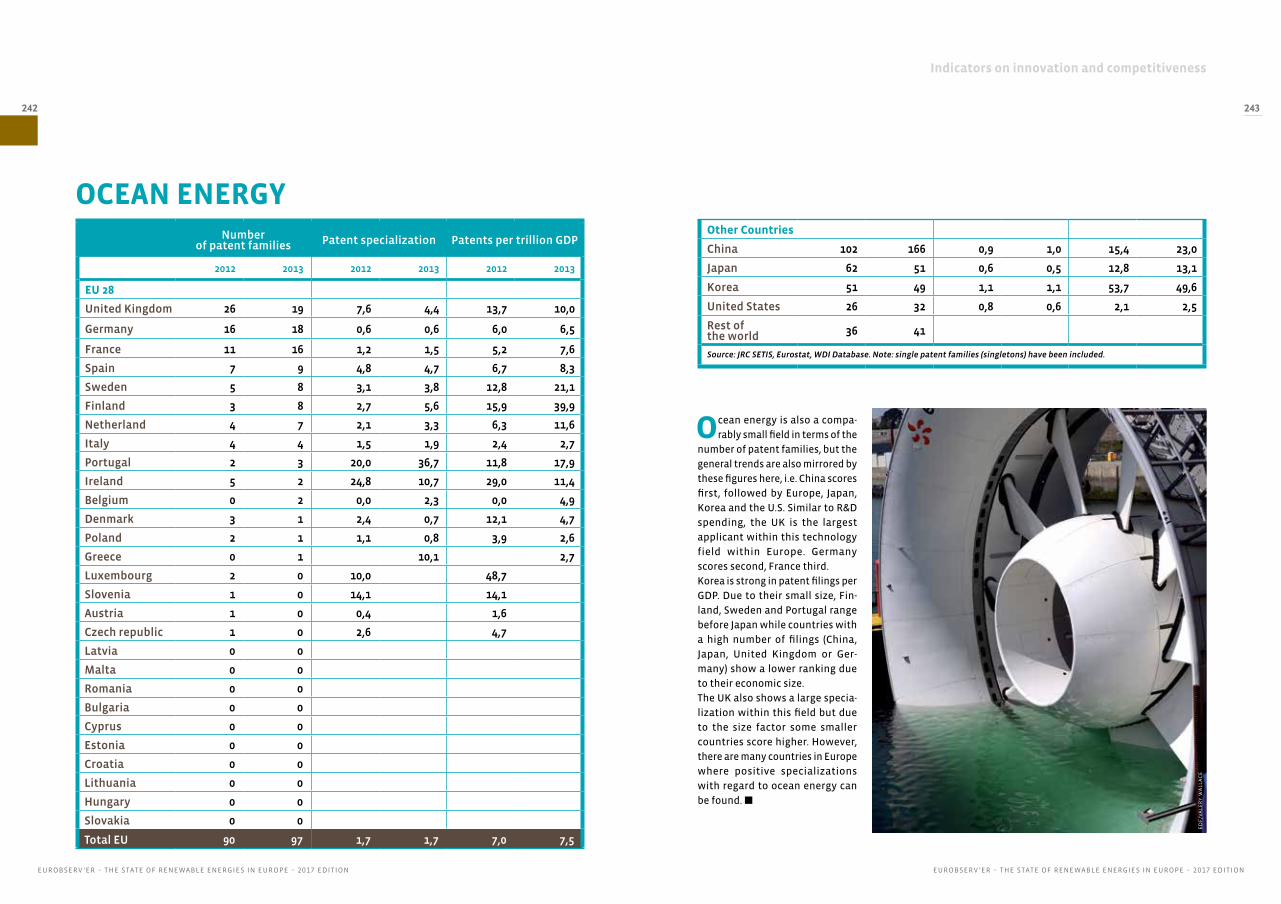
Indicators on innovation and competitiveness
EUROBSERV ’ER – THE STATE OF RENEWABLE ENERGIES IN EUROPE – 2017 EDITIONEUROBSERV ’ER – THE STATE OF RENEWABLE ENERGIES IN EUROPE – 2017 EDITION
242 243
Ocean energy is also a compa-
rably small field in terms of the
number of patent families, but the
general trends are also mirrored by
these figures here, i.e. China scores
first, followed by Europe, Japan,
Korea and the U.S. Similar to R&D
spending, the UK is the largest
applicant within this technology
field within Europe. Germany
scores second, France third.
Korea is strong in patent filings per
GDP. Due to their small size, Fin-
land, Sweden and Portugal range
before Japan while countries with
a high number of filings (China,
Japan, United Kingdom or Ger-
many) show a lower ranking due
to their economic size.
The UK also shows a large specia-
lization within this field but due
to the size factor some smaller
countries score higher. However,
there are many countries in Europe
where positive specializations
with regard to ocean energy can
be found. n
OCEAN ENERGYNumber
of patent families Patent specialization Patents per trillion GDP
2012 2013 2012 2013 2012 2013
EU 28
United Kingdom 26 19 7,6 4,4 13,7 10,0
Germany 16 18 0,6 0,6 6,0 6,5
France 11 16 1,2 1,5 5,2 7,6
Spain 7 9 4,8 4,7 6,7 8,3
Sweden 5 8 3,1 3,8 12,8 21,1
Finland 3 8 2,7 5,6 15,9 39,9
Netherland 4 7 2,1 3,3 6,3 11,6
Italy 4 4 1,5 1,9 2,4 2,7
Portugal 2 3 20,0 36,7 11,8 17,9
Ireland 5 2 24,8 10,7 29,0 11,4
Belgium 0 2 0,0 2,3 0,0 4,9
Denmark 3 1 2,4 0,7 12,1 4,7
Poland 2 1 1,1 0,8 3,9 2,6
Greece 0 1 10,1 2,7
Luxembourg 2 0 10,0 48,7
Slovenia 1 0 14,1 14,1
Austria 1 0 0,4 1,6
Czech republic 1 0 2,6 4,7
Latvia 0 0
Malta 0 0
Romania 0 0
Bulgaria 0 0
Cyprus 0 0
Estonia 0 0
Croatia 0 0
Lithuania 0 0
Hungary 0 0
Slovakia 0 0
Total EU 90 97 1,7 1,7 7,0 7,5
Other Countries
China 102 166 0,9 1,0 15,4 23,0
Japan 62 51 0,6 0,5 12,8 13,1
Korea 51 49 1,1 1,1 53,7 49,6
United States 26 32 0,8 0,6 2,1 2,5
Rest of the world 36 41
Source: JRC SETIS, Eurostat, WDI Database. Note: single patent families (singletons) have been included.
ED
F/V
ALE
RY
WA
LLA
CE
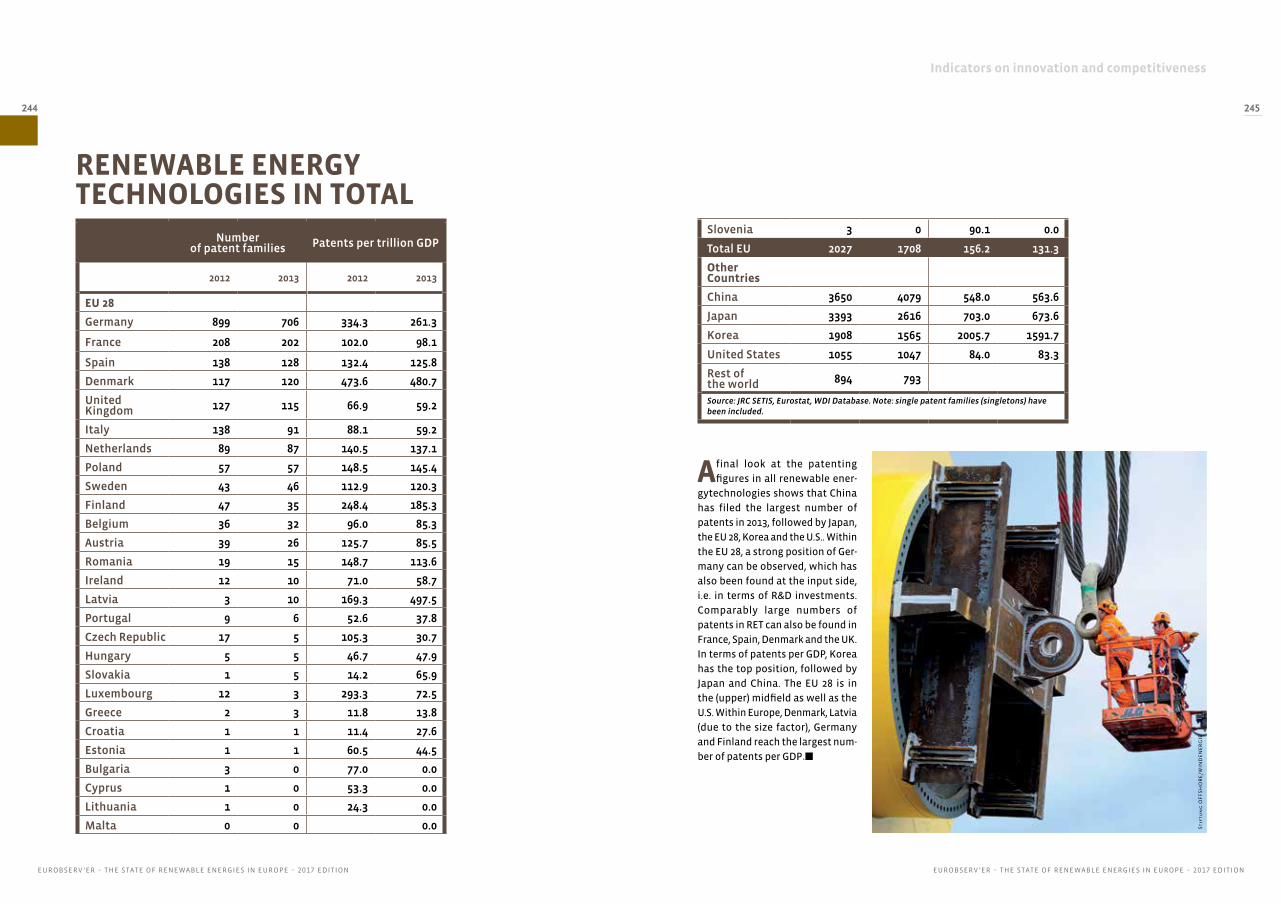
Indicators on innovation and competitiveness
EUROBSERV ’ER – THE STATE OF RENEWABLE ENERGIES IN EUROPE – 2017 EDITIONEUROBSERV ’ER – THE STATE OF RENEWABLE ENERGIES IN EUROPE – 2017 EDITION
244 245
A final look at the patenting
figures in all renewable ener-
gytechnologies shows that China
has filed the largest number of
patents in 2013, followed by Japan,
the EU 28, Korea and the U.S.. Within
the EU 28, a strong position of Ger-
many can be observed, which has
also been found at the input side,
i.e. in terms of R&D investments.
Comparably large numbers of
patents in RET can also be found in
France, Spain, Denmark and the UK.
In terms of patents per GDP, Korea
has the top position, followed by
Japan and China. The EU 28 is in
the (upper) midfield as well as the
U.S. Within Europe, Denmark, Latvia
(due to the size factor), Germany
and Finland reach the largest num-
ber of patents per GDP.n
RENEWABLE ENERGY TECHNOLOGIES IN TOTAL
Number of patent families Patents per trillion GDP
2012 2013 2012 2013
EU 28
Germany 899 706 334.3 261.3
France 208 202 102.0 98.1
Spain 138 128 132.4 125.8
Denmark 117 120 473.6 480.7
United Kingdom 127 115 66.9 59.2
Italy 138 91 88.1 59.2
Netherlands 89 87 140.5 137.1
Poland 57 57 148.5 145.4
Sweden 43 46 112.9 120.3
Finland 47 35 248.4 185.3
Belgium 36 32 96.0 85.3
Austria 39 26 125.7 85.5
Romania 19 15 148.7 113.6
Ireland 12 10 71.0 58.7
Latvia 3 10 169.3 497.5
Portugal 9 6 52.6 37.8
Czech Republic 17 5 105.3 30.7
Hungary 5 5 46.7 47.9
Slovakia 1 5 14.2 65.9
Luxembourg 12 3 293.3 72.5
Greece 2 3 11.8 13.8
Croatia 1 1 11.4 27.6
Estonia 1 1 60.5 44.5
Bulgaria 3 0 77.0 0.0
Cyprus 1 0 53.3 0.0
Lithuania 1 0 24.3 0.0
Malta 0 0 0.0
Slovenia 3 0 90.1 0.0
Total EU 2027 1708 156.2 131.3
Other Countries
China 3650 4079 548.0 563.6
Japan 3393 2616 703.0 673.6
Korea 1908 1565 2005.7 1591.7
United States 1055 1047 84.0 83.3
Rest of the world 894 793
Source: JRC SETIS, Eurostat, WDI Database. Note: single patent families (singletons) have been included.
Sti
ftu
ng
OF
FS
HO
RE
/WIN
DE
NE
RG
IE

Indicators on innovation and competitiveness
EUROBSERV ’ER – THE STATE OF RENEWABLE ENERGIES IN EUROPE – 2017 EDITIONEUROBSERV ’ER – THE STATE OF RENEWABLE ENERGIES IN EUROPE – 2017 EDITION
246 247
Across nearly all fields in
renewable energies technolo-
gies, the Asian countries display
the highest patenting activities
in absolute and relative (GDP)
numbers when including patent
filings that refer only to the
domestic market (singletons). It
is mostly China who scores first
in the number of patent fami-
lies within the sample. Europe
takes a middle position between
the Asian countries and the U.S.
Besides the technology field bio-
fuels, the U.S. is not very active in
patenting RET technologies rela-
tive to other countries. It is the
only field where the U.S. can score
a rank among the top 3 in terms of
patent counts. Within the EU 28, it
is mostly Germany that files the
largest number of patents. But
this is due to its size - in terms of
patenting Germany ranks first in
Europe.
Germany is also one of the few
countries that show a certain
activity level across all renewable
energy technology fields, while
most other countries are specia-
lized in only one or two RET tech-
nologies. Denmark and Spain, for
example, show remarkable filing
figures in wind energy, while the
UK is most patent active in ocean
energy.
Regarding RE technologies, solar
energy has the largest number of
patent filings in the EU and world-
wide, followed by wind energy. In
contrast to the large R&D invest-
ments into biofuels, the patent
statistics show relatively modest
results for biofuels. Regarding
ocean energy, in terms of patents
and R&D spending it is less signi-
ficant, despite its resource and
technological development poten-
tials. n
CONCLUSIONS
So
lar
str
om
for
sch
un
g
Indicators on innovation and competitiveness
EUROBSERV ’ER – THE STATE OF RENEWABLE ENERGIES IN EUROPE – 2017 EDITIONEUROBSERV ’ER – THE STATE OF RENEWABLE ENERGIES IN EUROPE – 2017 EDITION
248 249
International Trade
Methodological approach
To depict trade, not only the absolute (export)
advantage in terms of global export shares is
analysed but also net exports, i.e. exports minus
imports of a given country. It reveals whether
there is a surplus generated by exporting goods
and services. Moreover, a closer look is taken at
the comparative advantage, which refers to the
relative costs of one product in terms of a country
vis-à-vis another country. While early economists
believed that absolute advantage in a certain pro-
duct category would be a necessary condition
for trade, it has been shown that international
trade is mutually beneficial under the weaker
condition of comparative advantage (meaning
that productivity of one good relative to ano-
ther differs between countries). The analysis of
trade-flows has thus become an important topic
in trade economics where the most widely used
indicator was the Revealed Comparative Advan-
tage (RCA) developed by (Balassa 1965) because
an increase in trade benefits all trading partners
under very general conditions. Thus, the RCA is a
The analysis of trade and trade-flows has become
an important topic in trade economics because it is
understood that an increase in trade generally benefits
all trading partners. According to the mainstream in
international trade theories, the international trade of
goods occurs because of comparative advantages. The
different advantages in manufacturing goods between
two countries lead to trade. However, empirical data
revealed that not only factor endowment but also the
technological capabilities of a country affect its export
performance. Consequently, firms that develop new
products or integrate superior technology, will domi-
nate the export markets of these products. In sum, it
can be stated that innovation is positively correlated
with export performance. This is why a closer look is
taken at the export performance. It is considered as an
important output indicator of innovative performance
within renewable energies technologies.
very valuable indicator to analyse and describe
specialisation in certain products or sectors.
The share of a country i’s RET exports is compa-
red to the world’s (sum of all other countries)
RET export share. The RET shares itself show RET
exports in relation to all exports. Therefore, the
RCA for country i measures the share of e.g. wind
power technology exports of country i compared
to the world’s share of wind power technology
exports. If a country i’s share is larger than the
world share, country i is said to be specialised in
this field. Further, the RCA refers to all product
groups traded, while the RPA indicator refers to
energy technologies.
The analysis looks at renewable energy exports as
a whole, but also at the disaggregated RET fields.
These fields comprise photovoltaics (PV), wind
energy and hydroelectricity and biofuels for the
reporting year 2017. The export data were extrac-
ted from the UN Comtrade database. The fields
were identified based on a selection of Harmo-
nized System Codes (HS 2017).
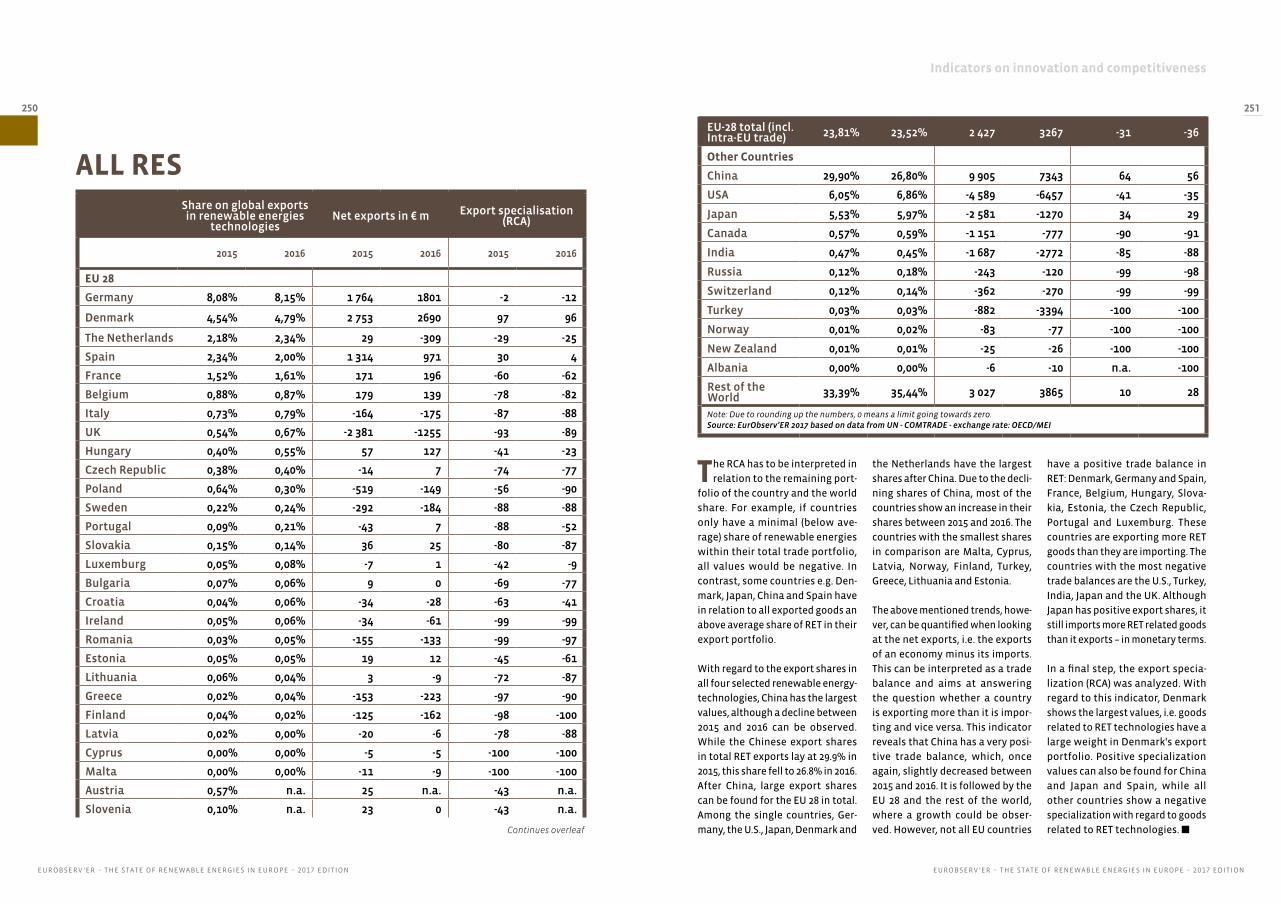
Indicators on innovation and competitiveness
EUROBSERV ’ER – THE STATE OF RENEWABLE ENERGIES IN EUROPE – 2017 EDITIONEUROBSERV ’ER – THE STATE OF RENEWABLE ENERGIES IN EUROPE – 2017 EDITION
250 251
The RCA has to be interpreted in
relation to the remaining port-
folio of the country and the world
share. For example, if countries
only have a minimal (below ave-
rage) share of renewable energies
within their total trade portfolio,
all values would be negative. In
contrast, some countries e.g. Den-
mark, Japan, China and Spain have
in relation to all exported goods an
above average share of RET in their
export portfolio.
With regard to the export shares in
all four selected renewable energy-
technologies, China has the largest
values, although a decline between
2015 and 2016 can be observed.
While the Chinese export shares
in total RET exports lay at 29.9% in
2015, this share fell to 26.8% in 2016.
After China, large export shares
can be found for the EU 28 in total.
Among the single countries, Ger-
many, the U.S., Japan, Denmark and
the Netherlands have the largest
shares after China. Due to the decli-
ning shares of China, most of the
countries show an increase in their
shares between 2015 and 2016. The
countries with the smallest shares
in comparison are Malta, Cyprus,
Latvia, Norway, Finland, Turkey,
Greece, Lithuania and Estonia.
The above mentioned trends, howe-
ver, can be quantified when looking
at the net exports, i.e. the exports
of an economy minus its imports.
This can be interpreted as a trade
balance and aims at answering
the question whether a country
is exporting more than it is impor-
ting and vice versa. This indicator
reveals that China has a very posi-
tive trade balance, which, once
again, slightly decreased between
2015 and 2016. It is followed by the
EU 28 and the rest of the world,
where a growth could be obser-
ved. However, not all EU countries
ALL RES
have a positive trade balance in
RET: Denmark, Germany and Spain,
France, Belgium, Hungary, Slova-
kia, Estonia, the Czech Republic,
Portugal and Luxemburg. These
countries are exporting more RET
goods than they are importing. The
countries with the most negative
trade balances are the U.S., Turkey,
India, Japan and the UK. Although
Japan has positive export shares, it
still imports more RET related goods
than it exports – in monetary terms.
In a final step, the export specia-
lization (RCA) was analyzed. With
regard to this indicator, Denmark
shows the largest values, i.e. goods
related to RET technologies have a
large weight in Denmark's export
portfolio. Positive specialization
values can also be found for China
and Japan and Spain, while all
other countries show a negative
specialization with regard to goods
related to RET technologies. n
Share on global exports in renewable energies
technologiesNet exports in € m Export specialisation
(RCA)
2015 2016 2015 2016 2015 2016
EU 28
Germany 8,08% 8,15% 1 764 1801 -2 -12
Denmark 4,54% 4,79% 2 753 2690 97 96
The Netherlands 2,18% 2,34% 29 -309 -29 -25
Spain 2,34% 2,00% 1 314 971 30 4
France 1,52% 1,61% 171 196 -60 -62
Belgium 0,88% 0,87% 179 139 -78 -82
Italy 0,73% 0,79% -164 -175 -87 -88
UK 0,54% 0,67% -2 381 -1255 -93 -89
Hungary 0,40% 0,55% 57 127 -41 -23
Czech Republic 0,38% 0,40% -14 7 -74 -77
Poland 0,64% 0,30% -519 -149 -56 -90
Sweden 0,22% 0,24% -292 -184 -88 -88
Portugal 0,09% 0,21% -43 7 -88 -52
Slovakia 0,15% 0,14% 36 25 -80 -87
Luxemburg 0,05% 0,08% -7 1 -42 -9
Bulgaria 0,07% 0,06% 9 0 -69 -77
Croatia 0,04% 0,06% -34 -28 -63 -41
Ireland 0,05% 0,06% -34 -61 -99 -99
Romania 0,03% 0,05% -155 -133 -99 -97
Estonia 0,05% 0,05% 19 12 -45 -61
Lithuania 0,06% 0,04% 3 -9 -72 -87
Greece 0,02% 0,04% -153 -223 -97 -90
Finland 0,04% 0,02% -125 -162 -98 -100
Latvia 0,02% 0,00% -20 -6 -78 -88
Cyprus 0,00% 0,00% -5 -5 -100 -100
Malta 0,00% 0,00% -11 -9 -100 -100
Austria 0,57% n.a. 25 n.a. -43 n.a.
Slovenia 0,10% n.a. 23 0 -43 n.a.
EU-28 total (incl. Intra-EU trade) 23,81% 23,52% 2 427 3267 -31 -36
Other Countries
China 29,90% 26,80% 9 905 7343 64 56
USA 6,05% 6,86% -4 589 -6457 -41 -35
Japan 5,53% 5,97% -2 581 -1270 34 29
Canada 0,57% 0,59% -1 151 -777 -90 -91
India 0,47% 0,45% -1 687 -2772 -85 -88
Russia 0,12% 0,18% -243 -120 -99 -98
Switzerland 0,12% 0,14% -362 -270 -99 -99
Turkey 0,03% 0,03% -882 -3394 -100 -100
Norway 0,01% 0,02% -83 -77 -100 -100
New Zealand 0,01% 0,01% -25 -26 -100 -100
Albania 0,00% 0,00% -6 -10 n.a. -100
Rest of the World 33,39% 35,44% 3 027 3865 10 28
Note: Due to rounding up the numbers, 0 means a limit going towards zero.Source: EurObserv’ER 2017 based on data from UN - COMTRADE - exchange rate: OECD/MEI
Continues overleaf
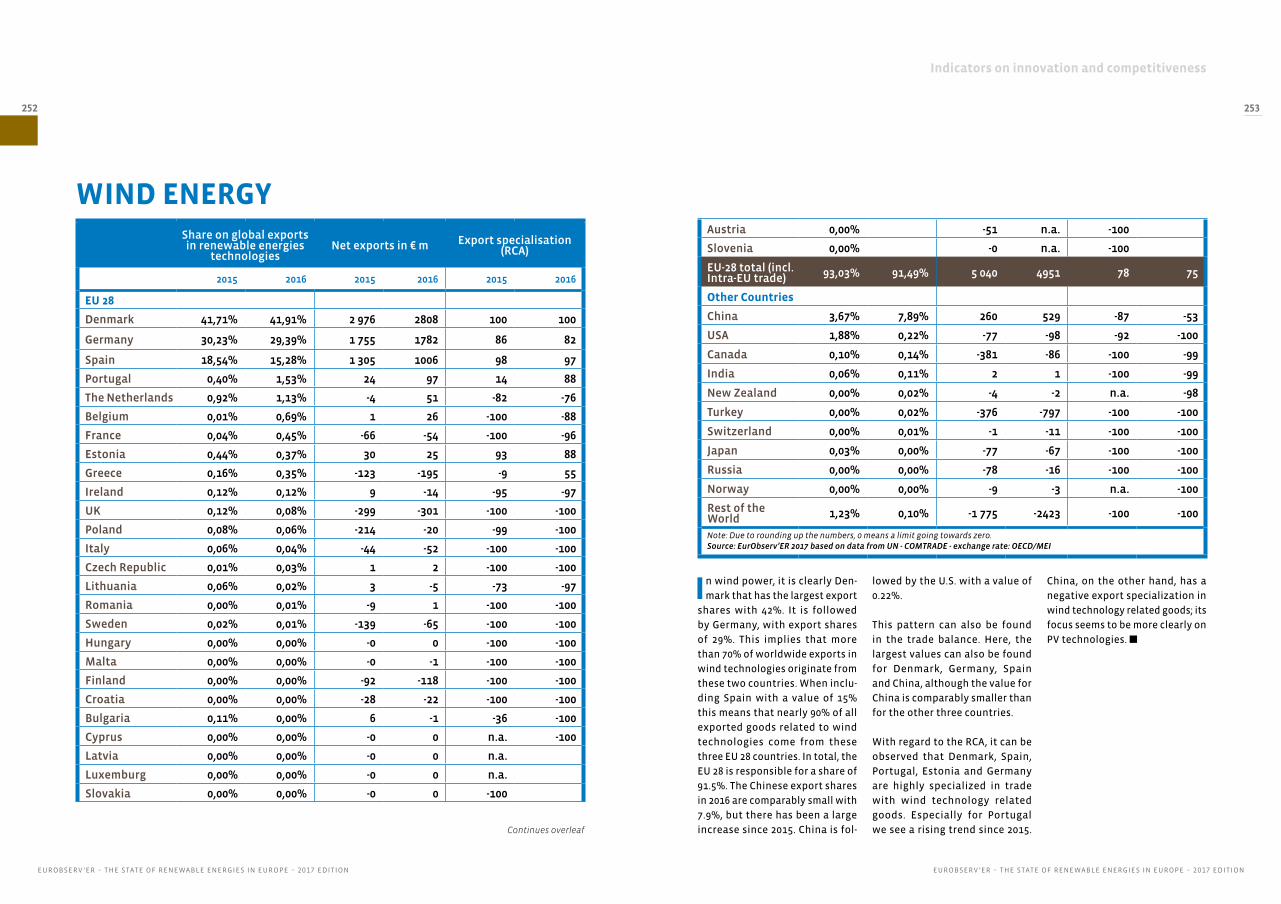
Indicators on innovation and competitiveness
EUROBSERV ’ER – THE STATE OF RENEWABLE ENERGIES IN EUROPE – 2017 EDITIONEUROBSERV ’ER – THE STATE OF RENEWABLE ENERGIES IN EUROPE – 2017 EDITION
252 253
In wind power, it is clearly Den-
mark that has the largest export
shares with 42%. It is followed
by Germany, with export shares
of 29%. This implies that more
than 70% of worldwide exports in
wind technologies originate from
these two countries. When inclu-
ding Spain with a value of 15%
this means that nearly 90% of all
exported goods related to wind
technologies come from these
three EU 28 countries. In total, the
EU 28 is responsible for a share of
91.5%. The Chinese export shares
in 2016 are comparably small with
7.9%, but there has been a large
increase since 2015. China is fol-
lowed by the U.S. with a value of
0.22%.
This pattern can also be found
in the trade balance. Here, the
largest values can also be found
for Denmark, Germany, Spain
and China, although the value for
China is comparably smaller than
for the other three countries.
With regard to the RCA, it can be
observed that Denmark, Spain,
Portugal, Estonia and Germany
are highly specialized in trade
with wind technology related
goods. Especially for Portugal
we see a rising trend since 2015.
WIND ENERGY
China, on the other hand, has a
negative export specialization in
wind technology related goods; its
focus seems to be more clearly on
PV technologies. n
Share on global exports in renewable energies
technologiesNet exports in € m Export specialisation
(RCA)
2015 2016 2015 2016 2015 2016
EU 28
Denmark 41,71% 41,91% 2 976 2808 100 100
Germany 30,23% 29,39% 1 755 1782 86 82
Spain 18,54% 15,28% 1 305 1006 98 97
Portugal 0,40% 1,53% 24 97 14 88
The Netherlands 0,92% 1,13% -4 51 -82 -76
Belgium 0,01% 0,69% 1 26 -100 -88
France 0,04% 0,45% -66 -54 -100 -96
Estonia 0,44% 0,37% 30 25 93 88
Greece 0,16% 0,35% -123 -195 -9 55
Ireland 0,12% 0,12% 9 -14 -95 -97
UK 0,12% 0,08% -299 -301 -100 -100
Poland 0,08% 0,06% -214 -20 -99 -100
Italy 0,06% 0,04% -44 -52 -100 -100
Czech Republic 0,01% 0,03% 1 2 -100 -100
Lithuania 0,06% 0,02% 3 -5 -73 -97
Romania 0,00% 0,01% -9 1 -100 -100
Sweden 0,02% 0,01% -139 -65 -100 -100
Hungary 0,00% 0,00% -0 0 -100 -100
Malta 0,00% 0,00% -0 -1 -100 -100
Finland 0,00% 0,00% -92 -118 -100 -100
Croatia 0,00% 0,00% -28 -22 -100 -100
Bulgaria 0,11% 0,00% 6 -1 -36 -100
Cyprus 0,00% 0,00% -0 0 n.a. -100
Latvia 0,00% 0,00% -0 0 n.a.
Luxemburg 0,00% 0,00% -0 0 n.a.
Slovakia 0,00% 0,00% -0 0 -100
Austria 0,00% -51 n.a. -100
Slovenia 0,00% -0 n.a. -100
EU-28 total (incl. Intra-EU trade) 93,03% 91,49% 5 040 4951 78 75
Other Countries
China 3,67% 7,89% 260 529 -87 -53
USA 1,88% 0,22% -77 -98 -92 -100
Canada 0,10% 0,14% -381 -86 -100 -99
India 0,06% 0,11% 2 1 -100 -99
New Zealand 0,00% 0,02% -4 -2 n.a. -98
Turkey 0,00% 0,02% -376 -797 -100 -100
Switzerland 0,00% 0,01% -1 -11 -100 -100
Japan 0,03% 0,00% -77 -67 -100 -100
Russia 0,00% 0,00% -78 -16 -100 -100
Norway 0,00% 0,00% -9 -3 n.a. -100
Rest of the World 1,23% 0,10% -1 775 -2423 -100 -100
Note: Due to rounding up the numbers, 0 means a limit going towards zero.Source: EurObserv’ER 2017 based on data from UN - COMTRADE - exchange rate: OECD/MEI
Continues overleaf
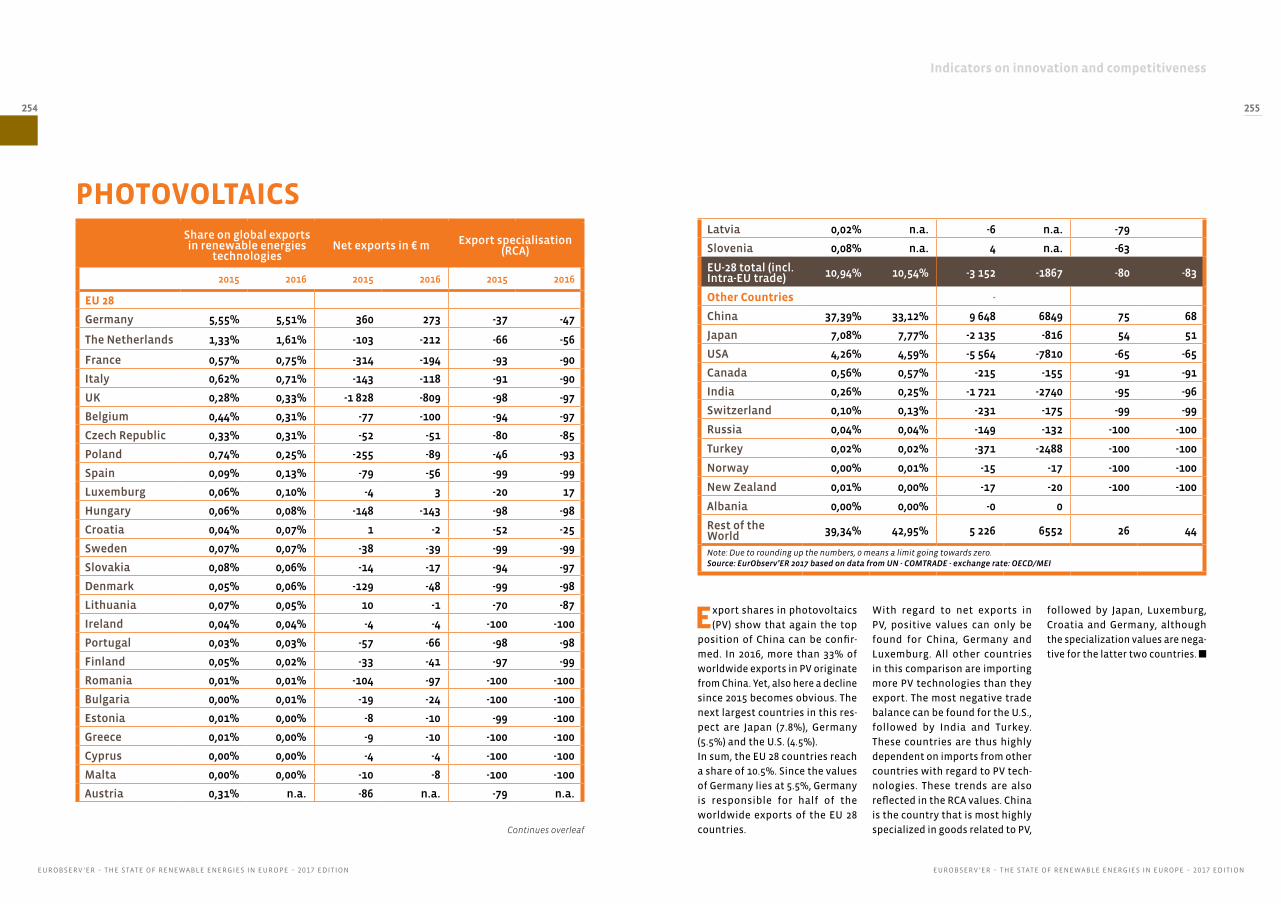
Indicators on innovation and competitiveness
EUROBSERV ’ER – THE STATE OF RENEWABLE ENERGIES IN EUROPE – 2017 EDITIONEUROBSERV ’ER – THE STATE OF RENEWABLE ENERGIES IN EUROPE – 2017 EDITION
254 255
Export shares in photovoltaics
(PV) show that again the top
position of China can be confir-
med. In 2016, more than 33% of
worldwide exports in PV originate
from China. Yet, also here a decline
since 2015 becomes obvious. The
next largest countries in this res-
pect are Japan (7.8%), Germany
(5.5%) and the U.S. (4.5%).
In sum, the EU 28 countries reach
a share of 10.5%. Since the values
of Germany lies at 5.5%, Germany
is responsible for half of the
worldwide exports of the EU 28
countries.
With regard to net exports in
PV, positive values can only be
found for China, Germany and
Luxemburg. All other countries
in this comparison are importing
more PV technologies than they
export. The most negative trade
balance can be found for the U.S.,
followed by India and Turkey.
These countries are thus highly
dependent on imports from other
countries with regard to PV tech-
nologies. These trends are also
reflected in the RCA values. China
is the country that is most highly
specialized in goods related to PV,
PHOTOVOLTAICS
followed by Japan, Luxemburg,
Croatia and Germany, although
the specialization values are nega-
tive for the latter two countries. n
Share on global exports in renewable energies
technologiesNet exports in € m Export specialisation
(RCA)
2015 2016 2015 2016 2015 2016
EU 28
Germany 5,55% 5,51% 360 273 -37 -47
The Netherlands 1,33% 1,61% -103 -212 -66 -56
France 0,57% 0,75% -314 -194 -93 -90
Italy 0,62% 0,71% -143 -118 -91 -90
UK 0,28% 0,33% -1 828 -809 -98 -97
Belgium 0,44% 0,31% -77 -100 -94 -97
Czech Republic 0,33% 0,31% -52 -51 -80 -85
Poland 0,74% 0,25% -255 -89 -46 -93
Spain 0,09% 0,13% -79 -56 -99 -99
Luxemburg 0,06% 0,10% -4 3 -20 17
Hungary 0,06% 0,08% -148 -143 -98 -98
Croatia 0,04% 0,07% 1 -2 -52 -25
Sweden 0,07% 0,07% -38 -39 -99 -99
Slovakia 0,08% 0,06% -14 -17 -94 -97
Denmark 0,05% 0,06% -129 -48 -99 -98
Lithuania 0,07% 0,05% 10 -1 -70 -87
Ireland 0,04% 0,04% -4 -4 -100 -100
Portugal 0,03% 0,03% -57 -66 -98 -98
Finland 0,05% 0,02% -33 -41 -97 -99
Romania 0,01% 0,01% -104 -97 -100 -100
Bulgaria 0,00% 0,01% -19 -24 -100 -100
Estonia 0,01% 0,00% -8 -10 -99 -100
Greece 0,01% 0,00% -9 -10 -100 -100
Cyprus 0,00% 0,00% -4 -4 -100 -100
Malta 0,00% 0,00% -10 -8 -100 -100
Austria 0,31% n.a. -86 n.a. -79 n.a.
Latvia 0,02% n.a. -6 n.a. -79
Slovenia 0,08% n.a. 4 n.a. -63
EU-28 total (incl. Intra-EU trade) 10,94% 10,54% -3 152 -1867 -80 -83
Other Countries -
China 37,39% 33,12% 9 648 6849 75 68
Japan 7,08% 7,77% -2 135 -816 54 51
USA 4,26% 4,59% -5 564 -7810 -65 -65
Canada 0,56% 0,57% -215 -155 -91 -91
India 0,26% 0,25% -1 721 -2740 -95 -96
Switzerland 0,10% 0,13% -231 -175 -99 -99
Russia 0,04% 0,04% -149 -132 -100 -100
Turkey 0,02% 0,02% -371 -2488 -100 -100
Norway 0,00% 0,01% -15 -17 -100 -100
New Zealand 0,01% 0,00% -17 -20 -100 -100
Albania 0,00% 0,00% -0 0
Rest of the World 39,34% 42,95% 5 226 6552 26 44
Note: Due to rounding up the numbers, 0 means a limit going towards zero.Source: EurObserv’ER 2017 based on data from UN - COMTRADE - exchange rate: OECD/MEI
Continues overleaf
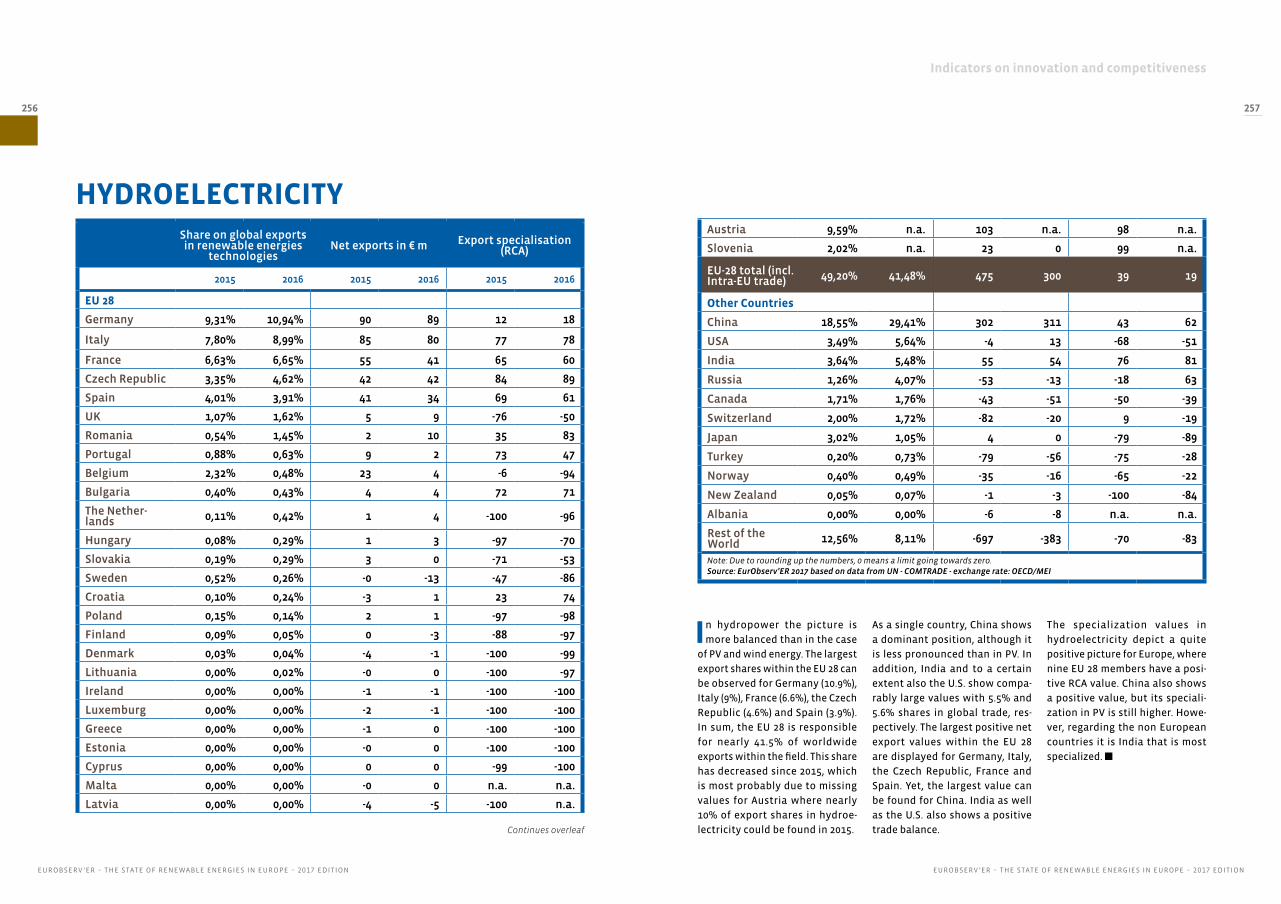
Indicators on innovation and competitiveness
EUROBSERV ’ER – THE STATE OF RENEWABLE ENERGIES IN EUROPE – 2017 EDITIONEUROBSERV ’ER – THE STATE OF RENEWABLE ENERGIES IN EUROPE – 2017 EDITION
256 257
In hydropower the picture is
more balanced than in the case
of PV and wind energy. The largest
export shares within the EU 28 can
be observed for Germany (10.9%),
Italy (9%), France (6.6%), the Czech
Republic (4.6%) and Spain (3.9%).
In sum, the EU 28 is responsible
for nearly 41.5% of worldwide
exports within the field. This share
has decreased since 2015, which
is most probably due to missing
values for Austria where nearly
10% of export shares in hydroe-
lectricity could be found in 2015.
As a single country, China shows
a dominant position, although it
is less pronounced than in PV. In
addition, India and to a certain
extent also the U.S. show compa-
rably large values with 5.5% and
5.6% shares in global trade, res-
pectively. The largest positive net
export values within the EU 28
are displayed for Germany, Italy,
the Czech Republic, France and
Spain. Yet, the largest value can
be found for China. India as well
as the U.S. also shows a positive
trade balance.
HYDROELECTRICITY
The specialization values in
hydroelectricity depict a quite
positive picture for Europe, where
nine EU 28 members have a posi-
tive RCA value. China also shows
a positive value, but its speciali-
zation in PV is still higher. Howe-
ver, regarding the non European
countries it is India that is most
specialized. n
Share on global exports in renewable energies
technologiesNet exports in € m Export specialisation
(RCA)
2015 2016 2015 2016 2015 2016
EU 28
Germany 9,31% 10,94% 90 89 12 18
Italy 7,80% 8,99% 85 80 77 78
France 6,63% 6,65% 55 41 65 60
Czech Republic 3,35% 4,62% 42 42 84 89
Spain 4,01% 3,91% 41 34 69 61
UK 1,07% 1,62% 5 9 -76 -50
Romania 0,54% 1,45% 2 10 35 83
Portugal 0,88% 0,63% 9 2 73 47
Belgium 2,32% 0,48% 23 4 -6 -94
Bulgaria 0,40% 0,43% 4 4 72 71
The Nether-lands 0,11% 0,42% 1 4 -100 -96
Hungary 0,08% 0,29% 1 3 -97 -70
Slovakia 0,19% 0,29% 3 0 -71 -53
Sweden 0,52% 0,26% -0 -13 -47 -86
Croatia 0,10% 0,24% -3 1 23 74
Poland 0,15% 0,14% 2 1 -97 -98
Finland 0,09% 0,05% 0 -3 -88 -97
Denmark 0,03% 0,04% -4 -1 -100 -99
Lithuania 0,00% 0,02% -0 0 -100 -97
Ireland 0,00% 0,00% -1 -1 -100 -100
Luxemburg 0,00% 0,00% -2 -1 -100 -100
Greece 0,00% 0,00% -1 0 -100 -100
Estonia 0,00% 0,00% -0 0 -100 -100
Cyprus 0,00% 0,00% 0 0 -99 -100
Malta 0,00% 0,00% -0 0 n.a. n.a.
Latvia 0,00% 0,00% -4 -5 -100 n.a.
Austria 9,59% n.a. 103 n.a. 98 n.a.
Slovenia 2,02% n.a. 23 0 99 n.a.
EU-28 total (incl. Intra-EU trade) 49,20% 41,48% 475 300 39 19
Other Countries
China 18,55% 29,41% 302 311 43 62
USA 3,49% 5,64% -4 13 -68 -51
India 3,64% 5,48% 55 54 76 81
Russia 1,26% 4,07% -53 -13 -18 63
Canada 1,71% 1,76% -43 -51 -50 -39
Switzerland 2,00% 1,72% -82 -20 9 -19
Japan 3,02% 1,05% 4 0 -79 -89
Turkey 0,20% 0,73% -79 -56 -75 -28
Norway 0,40% 0,49% -35 -16 -65 -22
New Zealand 0,05% 0,07% -1 -3 -100 -84
Albania 0,00% 0,00% -6 -8 n.a. n.a.
Rest of the World 12,56% 8,11% -697 -383 -70 -83
Note: Due to rounding up the numbers, 0 means a limit going towards zero.Source: EurObserv’ER 2017 based on data from UN - COMTRADE - exchange rate: OECD/MEI
Continues overleaf
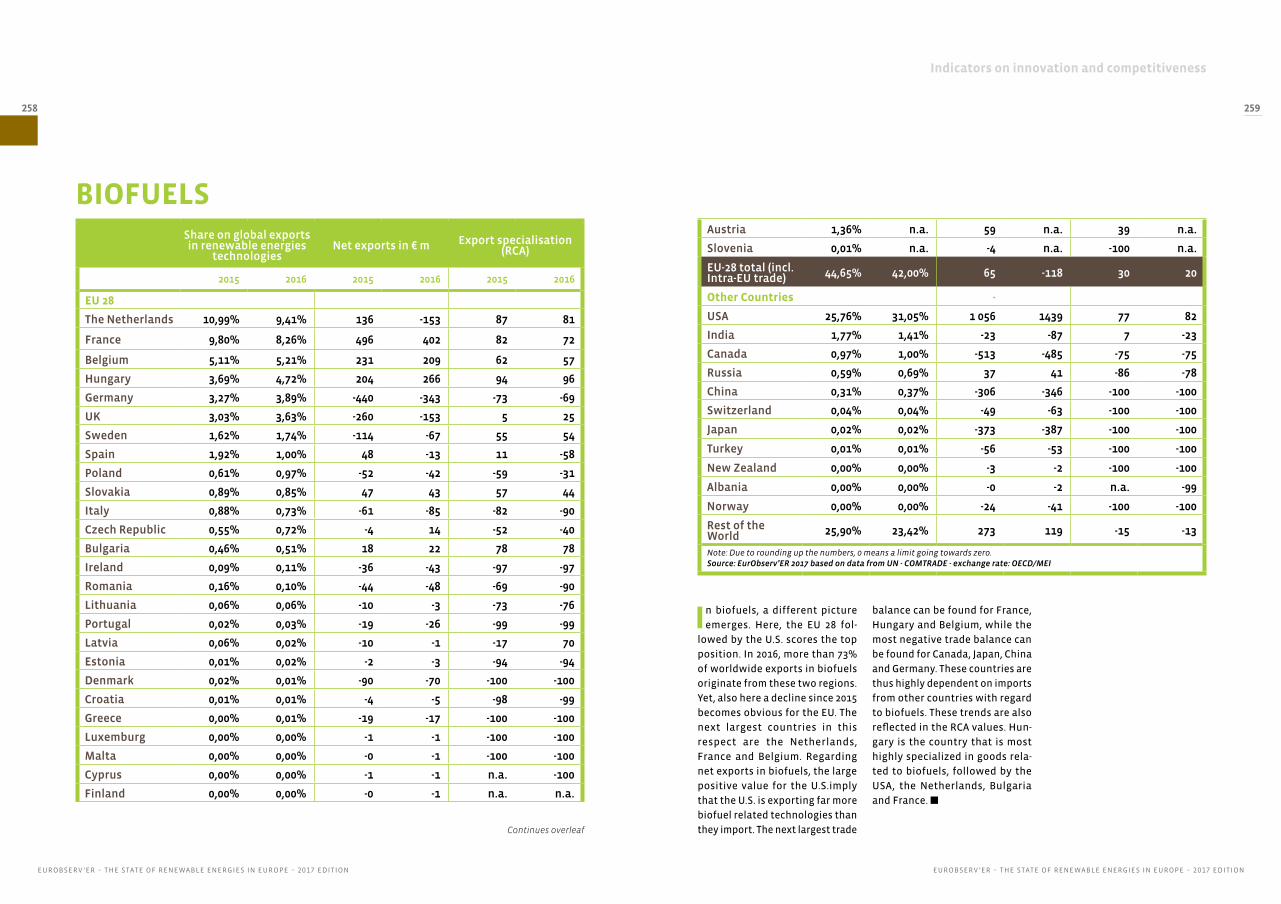
Indicators on innovation and competitiveness
EUROBSERV ’ER – THE STATE OF RENEWABLE ENERGIES IN EUROPE – 2017 EDITIONEUROBSERV ’ER – THE STATE OF RENEWABLE ENERGIES IN EUROPE – 2017 EDITION
258 259
In biofuels, a different picture
emerges. Here, the EU 28 fol-
lowed by the U.S. scores the top
position. In 2016, more than 73%
of worldwide exports in biofuels
originate from these two regions.
Yet, also here a decline since 2015
becomes obvious for the EU. The
next largest countries in this
respect are the Netherlands,
France and Belgium. Regarding
net exports in biofuels, the large
positive value for the U.S.imply
that the U.S. is exporting far more
biofuel related technologies than
they import. The next largest trade
balance can be found for France,
Hungary and Belgium, while the
most negative trade balance can
be found for Canada, Japan, China
and Germany. These countries are
thus highly dependent on imports
from other countries with regard
to biofuels. These trends are also
reflected in the RCA values. Hun-
gary is the country that is most
highly specialized in goods rela-
ted to biofuels, followed by the
USA, the Netherlands, Bulgaria
and France. n
BIOFUELSShare on global exports in renewable energies
technologiesNet exports in € m Export specialisation
(RCA)
2015 2016 2015 2016 2015 2016
EU 28
The Netherlands 10,99% 9,41% 136 -153 87 81
France 9,80% 8,26% 496 402 82 72
Belgium 5,11% 5,21% 231 209 62 57
Hungary 3,69% 4,72% 204 266 94 96
Germany 3,27% 3,89% -440 -343 -73 -69
UK 3,03% 3,63% -260 -153 5 25
Sweden 1,62% 1,74% -114 -67 55 54
Spain 1,92% 1,00% 48 -13 11 -58
Poland 0,61% 0,97% -52 -42 -59 -31
Slovakia 0,89% 0,85% 47 43 57 44
Italy 0,88% 0,73% -61 -85 -82 -90
Czech Republic 0,55% 0,72% -4 14 -52 -40
Bulgaria 0,46% 0,51% 18 22 78 78
Ireland 0,09% 0,11% -36 -43 -97 -97
Romania 0,16% 0,10% -44 -48 -69 -90
Lithuania 0,06% 0,06% -10 -3 -73 -76
Portugal 0,02% 0,03% -19 -26 -99 -99
Latvia 0,06% 0,02% -10 -1 -17 70
Estonia 0,01% 0,02% -2 -3 -94 -94
Denmark 0,02% 0,01% -90 -70 -100 -100
Croatia 0,01% 0,01% -4 -5 -98 -99
Greece 0,00% 0,01% -19 -17 -100 -100
Luxemburg 0,00% 0,00% -1 -1 -100 -100
Malta 0,00% 0,00% -0 -1 -100 -100
Cyprus 0,00% 0,00% -1 -1 n.a. -100
Finland 0,00% 0,00% -0 -1 n.a. n.a.
Austria 1,36% n.a. 59 n.a. 39 n.a.
Slovenia 0,01% n.a. -4 n.a. -100 n.a.
EU-28 total (incl. Intra-EU trade) 44,65% 42,00% 65 -118 30 20
Other Countries -
USA 25,76% 31,05% 1 056 1439 77 82
India 1,77% 1,41% -23 -87 7 -23
Canada 0,97% 1,00% -513 -485 -75 -75
Russia 0,59% 0,69% 37 41 -86 -78
China 0,31% 0,37% -306 -346 -100 -100
Switzerland 0,04% 0,04% -49 -63 -100 -100
Japan 0,02% 0,02% -373 -387 -100 -100
Turkey 0,01% 0,01% -56 -53 -100 -100
New Zealand 0,00% 0,00% -3 -2 -100 -100
Albania 0,00% 0,00% -0 -2 n.a. -99
Norway 0,00% 0,00% -24 -41 -100 -100
Rest of the World 25,90% 23,42% 273 119 -15 -13
Note: Due to rounding up the numbers, 0 means a limit going towards zero.Source: EurObserv’ER 2017 based on data from UN - COMTRADE - exchange rate: OECD/MEI
Continues overleaf
Indicators on innovation and competitiveness
EUROBSERV ’ER – THE STATE OF RENEWABLE ENERGIES IN EUROPE – 2017 EDITIONEUROBSERV ’ER – THE STATE OF RENEWABLE ENERGIES IN EUROPE – 2017 EDITION
260 261
The analyses of export data in
RET technologies have shown
that China indeed has achieved
quite strong a position in the
last years and is continuing with
its growth. The Chinese strength
in RET exports mostly originates
from a strong position in photo-
voltaics, although the shares in
this field have slightly decreased
between 2015 and 2016. As the
PV technology is rather easy to
assemble (compared to wind tur-
bines) China has started building
up PV cell and module manufactu-
ring from scratch and employed
most up-to-date automatization
technologies making Chinas pro-
duction very competitive. This is
different for wind technologies.
Nevertheless, the Chinese shares
in wind and hydro power have
slightly increased. Only in biofuels,
China’s trade position is far behind
the EU.
This picture changes when looking
at the other RET subfields, i.e. wind
energy and hydroelectricity. In
wind energy, especially Denmark,
Germany and Spain can be seen
as strong competitive countries,
dominating the worldwide export
markets. These three countries in
sum generate a worldwide export
share of nearly 90%, while China
only plays a minor role. However,
not only with respect to patenting
activities but also with respect to
trade shares China is catching up,
while the EU as a whole is slightly
loosing shares in wind power in
2016 compared to 2015.
In hydroelectricity, the picture
is very balanced. Here, several
European countries are active on
worldwide export markets, while
also China is responsible for com-
parably large shares. At a low level
and pace, China is catching up in
patent applications – at least in
the domestic market – as well as in
exports and might become a more
competitive player in the future.
In contrast, the EU is slightly loo-
sing shares.
Overall, the EU displays a strong
competitiveness in all RET fields,
but is loosing trade shares and
competitiveness in all RET fields,
while China is gaining. The US
is only strong in biofuels, and is
enforcing its position there, while
in other RET its contribution is far
below that of the EU. n
CONCLUSIONS
Ha
pag
-Llo
yd
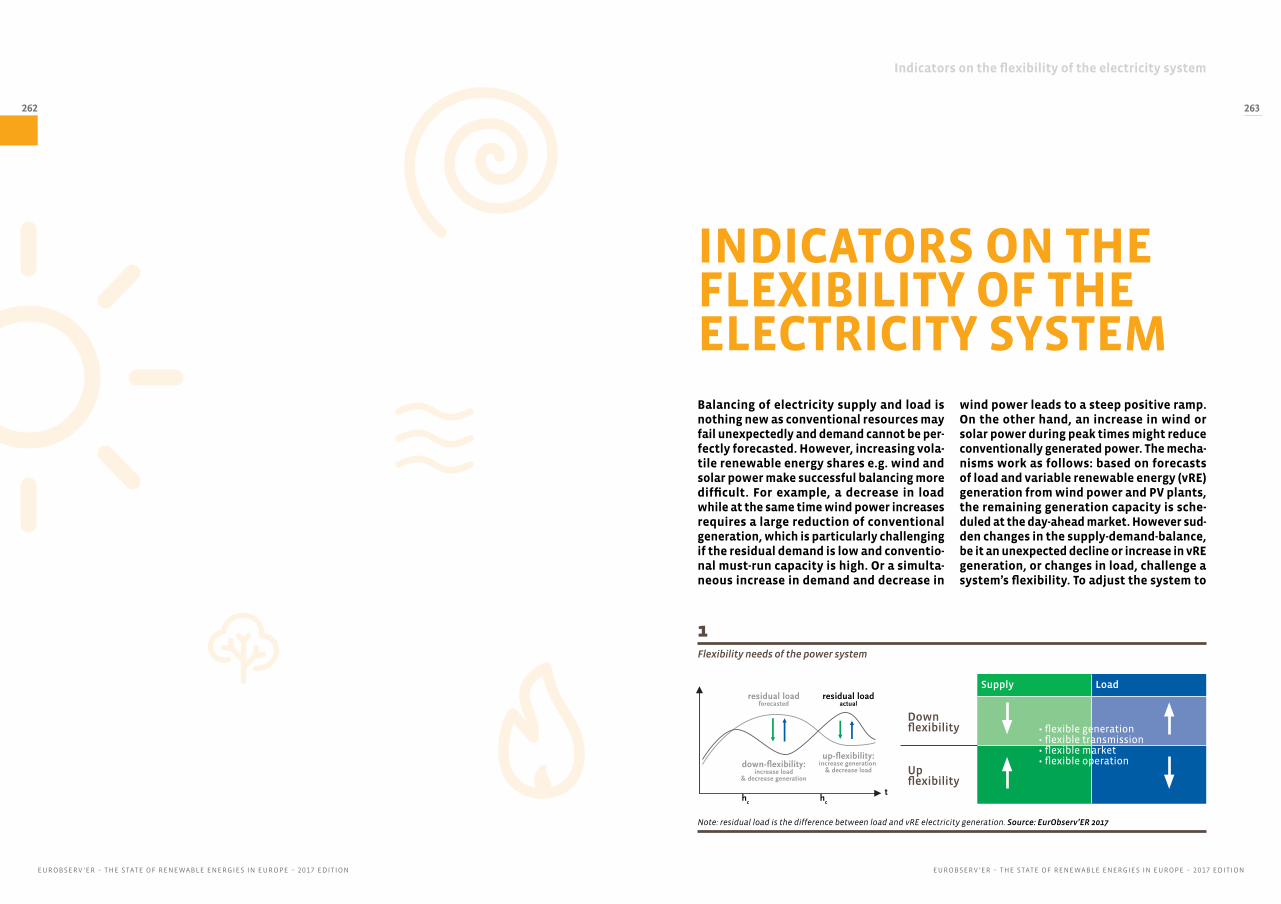
EUROBSERV ’ER – THE STATE OF RENEWABLE ENERGIES IN EUROPE – 2017 EDITIONEUROBSERV ’ER – THE STATE OF RENEWABLE ENERGIES IN EUROPE – 2017 EDITION
262 263
Indicators on the flexibility of the electricity system
wind power leads to a steep positive ramp. On the other hand, an increase in wind or solar power during peak times might reduce conventionally generated power. The mecha-nisms work as follows: based on forecasts of load and variable renewable energy (vRE) generation from wind power and PV plants, the remaining generation capacity is sche-duled at the day-ahead market. However sud-den changes in the supply-demand-balance, be it an unexpected decline or increase in vRE generation, or changes in load, challenge a system’s flexibility. To adjust the system to
Balancing of electricity supply and load is nothing new as conventional resources may fail unexpectedly and demand cannot be per-fectly forecasted. However, increasing vola-tile renewable energy shares e.g. wind and solar power make successful balancing more difficult. For example, a decrease in load while at the same time wind power increases requires a large reduction of conventional generation, which is particularly challenging if the residual demand is low and conventio-nal must-run capacity is high. Or a simulta-neous increase in demand and decrease in
INDICATORS ON THE FLEXIBILITY OF THE ELECTRICITY SYSTEM
th
ch
c
residual loadforecasted
residual loadactual
up-flexibility:increase generation
& decrease loaddown-flexibility:
increase load& decrease generation
MW
Note: residual load is the difference between load and vRE electricity generation. Source: EurObserv’ER 2017
Supply Load
Down flexibility
Up flexibility
1Flexibility needs of the power system
• flexible generation• flexible transmission• flexible market• flexible operation

EUROBSERV ’ER – THE STATE OF RENEWABLE ENERGIES IN EUROPE – 2017 EDITION
265
Indicators on the flexibility of the electricity system
EUROBSERV ’ER – THE STATE OF RENEWABLE ENERGIES IN EUROPE – 2017 EDITION
264
In a first step, situations are identified in which high
flexibility in the system is required. These situations
are called critical hours (hc) and are defined as hours
in which the difference between forecasted and
actual load and vRE generation is the largest. Thus,
critical hours are those hours in which either fore-
casted vRE generation is larger and forecasted load
is smaller than actual, or forecasted vRE generation
is smaller and forecasted load is larger than actual.
In the first case (up-flexibility), additional power is
needed either through ramping-up, transmission,
intraday market adjustments or reserves, or a reduc-
tion of load. The second case, called down-flexibility,
entails curtailing especially of renewable power. The
latter might reduce sustainability and cost efficiency
of generation, but it is feasible in most of the situa-
tions. In contrast, ramping up within a short time is
more critical due to technical requirements. Thus, up-
flexibility is of particular interest. In the following,
the up-flexibility in the power system is analysed
based on generation, transmission and balancing.
To depict the flexibility of a system in critical hours
four indicators are employed that cover generation,
transmission, market and operation of a system. A
detailed description of the methodological approach
can be found under: www.eurobserv-er.org
• Generation flexibility: actual used generation in the
critical hours is compared to the available flexible
capacity of the respective countries. The available
flexible capacity is defined as availability of capa-
cities within 15 min, i.e. all capacities that could be
made available for generation adjustments within
15 min are included (up-flexibility). Thus, it depicts
the technically available flexibility of the system to
adjust to a situation where generation and demand
are in imbalance.
• Transmission flexibility: actual exports or imports
in the critical hours are compared to the available
transmission capacity. Ideally, available transmis-
sion capacity is a benchmarked transfer capacity
at the borders. But due to data restrictions, the
available transmission capacity is defined as the
maximum import capacity of a country in the res-
pective year.
• Market flexibility: actual intraday trade volumes
in the critical hours are compared to the available
maximum traded volume in the respective year. The
indicator shows how far or close the intraday mar-
ket in a critical situation is to the maximum traded
volume, thus it shows how severe the situation is.
• Operational flexibility: actual used secondary and
tertiary reserve volumes in the critical hours are
compared to the maximum reserve in the respec-
tive year. It is employed as a proxy for the available/
contracted reserve volume.
Methodological note
RESULTS AND INTERPRETATIONchanges in vRE supply and demand, different mechanisms are applicable. A mismatch could indeed be adjusted by increasing demand or decreasing generation (down-flexibility), or vice versa, by decreasing demand and increasing generation (up-flexi-bility). Also, unexpected changes within one country could be compensated by cross-bor-der transfers, short-term market or demand side adjustments. Thus, not only the supply side but also the demand side, the transmis-
sion infrastructure between countries and the markets provide flexibility in the power system. All these options become increasin-gly important for successfully integrating RE in the power system. To depict how flexible a system is, a set of indicators is applied: the capacity and transmission flexibility, the operational and market flexibility (see Figure 1). Based on these mechanisms, flexi-bility indicators are derived and explained in the following.
In the following, the results
depicted in this overview illus-
trate those situations in which
up-flexibility is needed, because
it is more constraining. Informa-
tion and results on down-flexibi-
lity mechanisms are depicted in
the methodological paper (www.
eurobserv-er.org)1.
GENERATION FLEXIBILITYTo measure up-flexibility, we calcu-
late the share of the used genera-
tion in critical hours to technical
available flexible generation. Thus,
for every EU member, conventional
energy generation technologies
are taken into account and the
up-flexibility based on the ramp-
up time is assessed and compared
1. Due to restriction in data availability, no critical hours are defined for Malta,
Cyprus and Luxemburg, while for the Czech Republic, Italy and Croatia, critical
hours are defined on the basis of incomplete data sets and deviations in load. In
addition, data on actual generation, transmission, intraday and reserve market
are limited from case to case for several EU countries. These limitations are
indicated at the respective chapter or figure.
2Generation flexibility in critical hours 2015 and 2016
0%
50%
100%
AT
BE
BG CZ
DK
DE
EE
IE*
GR ES
FR IT CY LV LT HU NL
PL
PT
RO SI
SK FI SE
GB
2016
0%
50%
100%
AT
BE
BG CZ
DK
DE
EE
IE*
GR ES
FR LV LT HU NL
PL
PT
RO SI
SK FI SE
GB
2015
Note: no data for HR,CY, LU, MT. Source: own assessment based on ENTSO-E data downloaded 9/2017.
to the actual running capacities in
the critical hours. The results are
depicted in Figure 2. The blue bars
show the relation of running capa-
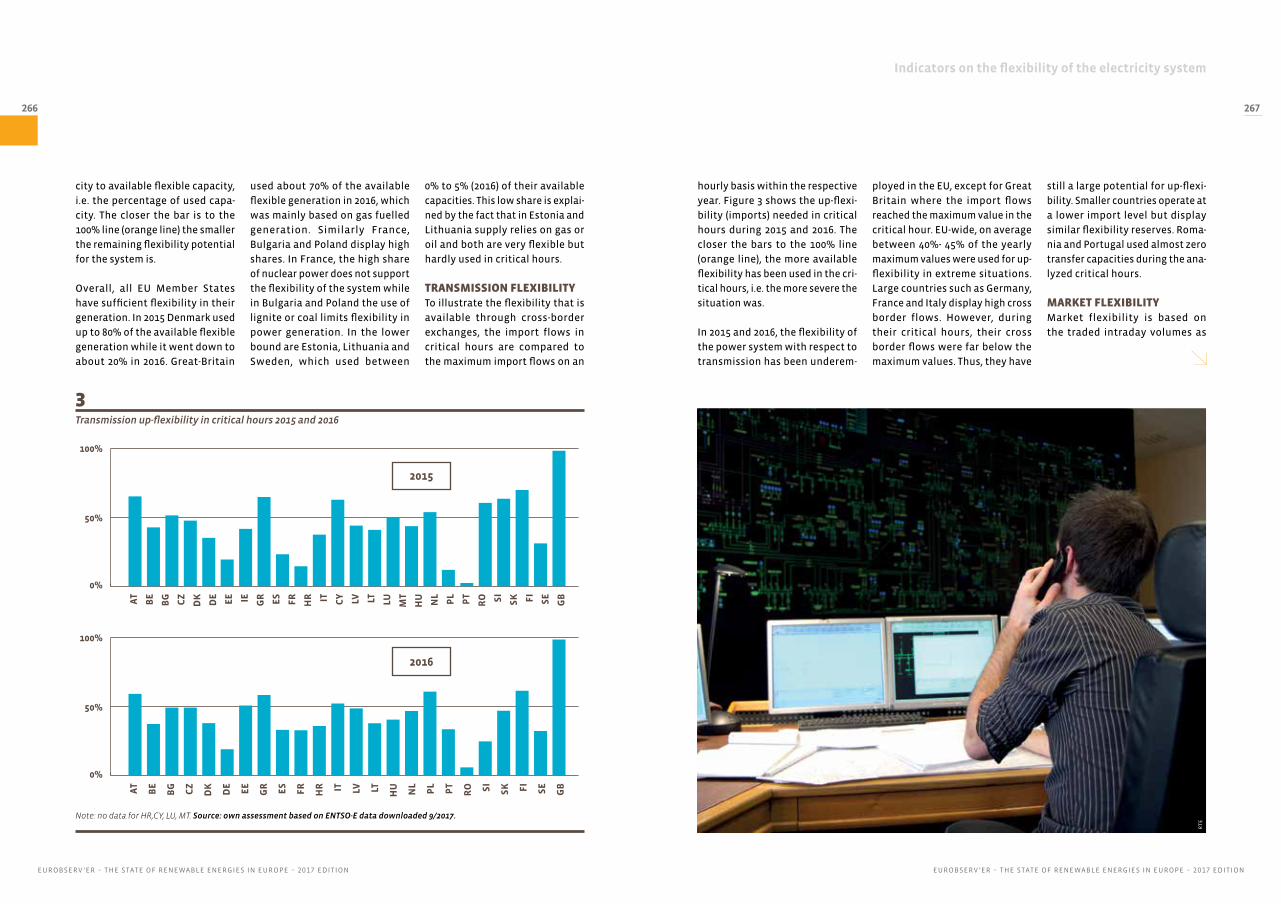
EUROBSERV ’ER – THE STATE OF RENEWABLE ENERGIES IN EUROPE – 2017 EDITIONEUROBSERV ’ER – THE STATE OF RENEWABLE ENERGIES IN EUROPE – 2017 EDITION
266 267
Indicators on the flexibility of the electricity system
city to available flexible capacity,
i.e. the percentage of used capa-
city. The closer the bar is to the
100% line (orange line) the smaller
the remaining flexibility potential
for the system is.
Overall, all EU Member States
have sufficient flexibility in their
generation. In 2015 Denmark used
up to 80% of the available flexible
generation while it went down to
about 20% in 2016. Great-Britain
used about 70% of the available
flexible generation in 2016, which
was mainly based on gas fuelled
generation. Similarly France,
Bulgaria and Poland display high
shares. In France, the high share
of nuclear power does not support
the flexibility of the system while
in Bulgaria and Poland the use of
lignite or coal limits flexibility in
power generation. In the lower
bound are Estonia, Lithuania and
Sweden, which used between
0% to 5% (2016) of their available
capacities. This low share is explai-
ned by the fact that in Estonia and
Lithuania supply relies on gas or
oil and both are very flexible but
hardly used in critical hours.
TRANSMISSION FLEXIBILITYTo illustrate the flexibility that is
available through cross-border
exchanges, the import flows in
critical hours are compared to
the maximum import flows on an
3Transmission up-flexibility in critical hours 2015 and 2016
0%
50%
100%
AT
BE
BG CZ
DK
DE
EE IE GR ES
FR HR IT CY LV LT LU MT
HU NL
PL
PT
RO SI
SK FI SE
GB
2015
0%
50%
100%
AT
BE
BG CZ
DK
DE
EE
GR ES
FR HR IT LV LT HU NL
PL
PT
RO SI
SK FI SE
GB
2016
Note: no data for HR,CY, LU, MT. Source: own assessment based on ENTSO-E data downloaded 9/2017.
hourly basis within the respective
year. Figure 3 shows the up-flexi-
bility (imports) needed in critical
hours during 2015 and 2016. The
closer the bars to the 100% line
(orange line), the more available
flexibility has been used in the cri-
tical hours, i.e. the more severe the
situation was.
In 2015 and 2016, the flexibility of
the power system with respect to
transmission has been underem-
ployed in the EU, except for Great
Britain where the import flows
reached the maximum value in the
critical hour. EU-wide, on average
between 40%- 45% of the yearly
maximum values were used for up-
flexibility in extreme situations.
Large countries such as Germany,
France and Italy display high cross
border flows. However, during
their critical hours, their cross
border flows were far below the
maximum values. Thus, they have
still a large potential for up-flexi-
bility. Smaller countries operate at
a lower import level but display
similar flexibility reserves. Roma-
nia and Portugal used almost zero
transfer capacities during the ana-
lyzed critical hours.
MARKET FLEXIBILITYMarket flexibility is based on
the traded intraday volumes as
RT
E

EUROBSERV ’ER – THE STATE OF RENEWABLE ENERGIES IN EUROPE – 2017 EDITIONEUROBSERV ’ER – THE STATE OF RENEWABLE ENERGIES IN EUROPE – 2017 EDITION
268 269
Indicators on the flexibility of the electricity system
depicted in Figure 4. The bars
show the traded intraday volume
in the critical hours compared to
the maximum of hourly traded
volumes within a year. The closer
the blue bar to the orange line
(100% line) the more the intraday
market served as a mechanism for
adjustments. Data is not available
for all EU Member states. But for
those countries, of which data is
available, it becomes clear that in
some countries the intraday mar-
ket seems to play a significant
role. For example, in Germany
and Spain, the traded volume in
critical hours was close to the
maximum values (2016) while in
other countries such as Latvia,
Lithuania, or Poland the intraday
market seems to be less needed to
compensate unexpected changes
in load or generation.
OPERATIONAL FLEXIBILITYOperational flexibility is repre-
sented by the reserve market.
Here the activated reserves of
power are compared to the yearly
maximum in the critical hours per
4Market flexibility in critical hours in 2015 and 2016
5Operational flexibility in critical hours 2015 and 2016
0%
50%
100%
AT
BE
CZ
DK
DE
EE
ES
FR LV LT NL
PL
PT FI SE
Intraday volume traded in critical hours compared to maximum volume/a in 2015 [%]
0%
50%
100%
AT
BE
CZ
DK
DE
EE
ES
FR IT LV LT HU NL
PL
PT
RO SI
SK SE
GB
Reserves used in critical hours compared to maximum reserves/a for up-flexibility in 2015 [%]
0%
50%
100%
AT
CZ
DK
DE
EE
ES
FR LV LT NL
PL
PT FI SE
Intraday volume traded in critical hours compared to maximum volume/a in 2016 [%]
0%
50%
100%
AT
BE
CZ
DK
DE
EE
ES
FR LV LT LU NL
PL
PT
RO SI
SK FI SE
GB
Reserves used in critical hours compared to maximum reserves/a for up-flexibility in 2016 [%]
Note: no data for IE, MT, LU, CY, BG, GR, HR, IT, HU, RO, SI, SK, GB; AT and DE have a common market, but different critical hours. In ES and PT maximum values are based on the analysed critical hours. Source: own assessment based on data of power exchanges down-loaded 11/2017.
Note: no data for BG, GR, IE, HR, MT and CY, no data for IT in 2016. Luxembourg is included in Germany reserves. Source: own assessment based on ENTSO-E data downloaded 10/2017
country, which is considered as a
proxy for the available volume.
The bars in Figure 5 depict the
share of actual activated reserves
in the critical hours to the avai-
lable volume. The closer the bars
to the orange line (100% line) the
more the system relies on the
operational flexibility potential
in critical situations.
In general, the reserve market
provides only a small share of the
generation capacity as reserves,
because the costs of holding
reserve power are mostly higher
than the average spot market
electricity prices. Thus, there is a
strong incentive to keep the use of
reserves at minimum.
For 2015, on average almost 30%
of the maximum possible reserve
power was used during critical
hours, but it varies strongly among
countries. For example, Germany
relied on about 5% (2015) of the
operational reserves in the critical
hour. But it cannot be concluded

EUROBSERV ’ER – THE STATE OF RENEWABLE ENERGIES IN EUROPE – 2017 EDITIONEUROBSERV ’ER – THE STATE OF RENEWABLE ENERGIES IN EUROPE – 2017 EDITION
270 271
Indicators on the flexibility of the electricity system
that the contracted reserve volume
could be cut down, because unex-
pected outages of conventional
generation capacities or network
problems (in addition to critical
hours defined by this report) are
still potential challenges to the
power system.
Spain, Sweden and the UK have the
highest reserve volumes but at the
same time, these countries do not
activate even half of their potential
in the analyzed critical hour. Italy is
close to its maximum annual capa-
city in its critical hour. Romania is
displaying a contrary picture, as
the actual used reserve capacity is
negative while still having positive
potential. One explanation would
be that with traded volumes at a
kind of intraday market Romania
overbalanced the forecast error
and therefore has to rebalance
with the reserve power.
In 2016, Portugal, Sweden, Spain
and Lithuania display high shares.
In contrast, Latvia, Estonia and the
Netherlands reveal a very low use
of their reserve potentials ranging
between 0% and 10%. For Romania,
the same situation applies as the
year before. Even with a demand
for up regulation, the actual used
reserve power is negative. This
analysis is limited to 20 EU Mem-
ber States due to missing data. n
CONCLUSIONSFollowing the starting point
of this chapter, stating that
increasing vRE shares of wind
and solar power make successful
balancing of power supply and
load more difficult, countries with
a high share of vRE might face
higher challenges integrating vRE.
Subsequently, the power system
of those countries, in which the
share of installed vRE capacities
to total generation capacities is
the highest, are of special interest
of this analysis. Germany, Den-
mark, Great Britain, Portugal dis-
play high vRE shares in decreasing
order (see Figure 6). In contrast,
countries with a low share of vRE
such as Latvia and Hungary are
6Share of volatile renewable energies (installed capacities) in 2016
0%
50%
100%
AT
BE
BG CY
CZ
DE
DK EE
ES FI FR GB
GR
*
HR
HU IE IT LT LU LV NL
PL
PT
RO SE SI
SK
Installed vRE capacities to net generating capacities [%] in 2016
* data from 2015. Source: own assessment based on ENTSO-E data (download 1/2018)
supposed to display a small use
of flexibility mechanisms.
Regarding the flexibility mecha-
nisms of countries with high vRE
shares, Germany but also Spain
strongly rely on the intraday
market while Great Britain mainly
uses transmission and flexible
generation capacities in various
markets to compensate unexpec-
ted changes. Denmark displays a
balanced mix of all mechanisms.
Countries with lower shares of
vRE such as Latvia, Finland or Hun-
gary neither display a homoge-
nous picture: the intraday market
represents an important flexibility
mechanism for the Czech Repu-
blic and Estonia, while Finland
relies on transmission; Latvia as
well as the Czech Republic use
flexible generation capacities for
adjustments to changing supply
and load.
Overall, in critical hours all
countries dispose of sufficient
flexibility in the system. Countries
with low or high vRE shares do not
display a pattern regarding the use
of flexibility mechanism, rather
the use of mechanisms depends
on a combination of various
country specific characteristics.
For example, France has only
Pix
ab
ay

EUROBSERV ’ER – THE STATE OF RENEWABLE ENERGIES IN EUROPE – 2017 EDITIONEUROBSERV ’ER – THE STATE OF RENEWABLE ENERGIES IN EUROPE – 2017 EDITION
272 273
Indicators on the flexibility of the electricity system
15% of renewable energies but
over 60% of nuclear power; Swe-
den dispose of a high amount of
water reservoirs and therefore of
a good source to balance forecast
differences; albeit its high share
of flexible generation capacities,
UK uses mainly the transmission
mechanism as prices in France or
the Netherlands are lower. n
7Pattern of flexibility in critical situations per country
DK DE
TransmissionOperation
Generation
Market
GB*
1
0,8
0,6
0,4
0,2
0
Flexibility mechanism used in countries with low shares of vRE capacities in 2016
EECZ LV
TransmissionOperation
Generation
Market
FI
Flexibility mechanism used in countries with high shares of vRE capacities in 2016
1
0,8
0,6
0,4
0,2
0
Note: for UK no market data. Source: own assessment based on ENTSO-E and power stock exchange data (download 2017).
RT
E
Sources
274 275
EUROBSERV ’ER – THE STATE OF RENEWABLE ENERGIES IN EUROPE – 2017 EDITIONEUROBSERV ’ER – THE STATE OF RENEWABLE ENERGIES IN EUROPE – 2017 EDITION
• Dachverband Energie-Klima – Umbrella
Organization Energy-Climate Protection
(www.energieklima.at)
• E-Control – Energie Control (www.econtrol.at)
• EEG (Energy Economics Group)/Vienna University
of Technology (www.eeg.tuwien.ac.at)
• IG Windkraft – Austrian Wind Energy Association
(www.igwindkraft.at)
• Kleinwasserkraft Österreich – Small Hydro
Association Austria (www.kleinwasserkraft.at)
• Lebensministerium – Federal Ministry of
Agriculture, Forestry, Environment and Water
Management (www.lebensministerium.at)
• Nachhaltig Wirtschaften
(www.nachhaltigwirtschaften.at)
• Österreichischer Biomasse-Verband – Austrian
Biomass Association (www.biomasseverband.at)
• OeMAG – Energy Market Services
(www.oekb.at/en/energy-market/oemag/)
• ProPellets Austria – Pellets Association Austria
(www.propellets.at)
• PV Austria – Photovoltaic Austria Federal
Association (www.pvaustria.at)
• Statistik Austria – Bundesanstalt Statistik
Österreich (www.statistik.at)
• Umweltbundesamt – Environment Agency Austria
(www.umweltbundesamt.at)
• Vienna University of Technology
(www.tuwien.ac.at)
BELGIUM• ATTB – Belgium Thermal Technics Association
(www.attb.be/index-fr.asp)
• APERe – Renewable Energies Association
(www.apere.org)
• Belsolar (www.belsolar.be)
• BioWanze – CropEnergies (www.biowanze.be)
• Cluster TWEED – Technologie Wallonne
ÉnergieEnvironnement et Développement durable
(www.clusters.wallonie.be/tweed)
• CWaPE – Walloon Energy Commission
(www.cwape.be)
• EDORA – Renewable and alternative
energyfederation (www.edora.be)
• ICEDD – Institute for Consultancy and Studies
in Sustainable Development (www.icedd.be)
• National Renewable Energy Action Plans (NREAPs)
Transparency Platform on Renewable Energy
(www.ec.europa.eu/energy/en/topics/renewable-
energy)
• NIB – Nordic Investment Bank (www.nib.int)
• OEC – Ocean Energy Council
(www.oceanenergycouncil.com)
• OEC – OOECD/IEA Statistics Manual (2005)
• Photon International – Solar Power Magazine
(www.photon.info)
• PV Employment (www.pvemployment.org)
• PVPS – IEA Photovoltaic Power Systems
Programme (www.iea-pvps.org)
• REN 21 – Renewable Energy Policy Network
for the 21st Century (www.ren21.net)
• Renewable Energy Magazine
(www.renewableenergymagazine.com)
• Renewables International
(www.renewablesinternational.net)
• RES Legal (www.res-legal.eu)
• Solarthermal World (www.solarthermalworld.org)
• Sun & Wind Energy (www.sunwindenergy.com)
• WWEA – World Wind Energy Association
(www.wwindea.org)
• WWF – World Wild Life Fund (www.wwf.org)
AUSTRIA• AEE Intec – Institute for Sustainable Technologies
(www.aee-intec.at)
• Austria Solar – Austrian Solar Thermal Industry
Association (www.solarwaerme.at)
• ARGE Biokraft – Arbeitsgemeinschaft Flüssige
Biokraftstoffe (www.biokraft-austria.at)
• Kompost & Biogas Verband – Austrian Biogas
Association (www.kompost-biogas.info)
• BIOENERGY 2020+ (www.bioenergy2020.eu)
• Bundesverband Wärmepumpe Austria – National
Heat-Pump Association Austria (www.bwp.at)
• BMLFUW - Bundesministerium für Land- und
Forstwirtschaft, Umwelt und Wasserwirtschaft
/ Federal Ministry of Agriculture, Forestry,
Environment and Water Management
(www.bmlfuw.gv.at)
• BMVIT – Federal Ministry for Transport, Innovation
and Technology (www.bmvit.gv.at)
EUROPEAN AND INTERNATIONAL ORGANISATIONS, PRESS• AEBIOM – European Biomass Association
(www.aebiom.org)
• Becquerel Institute (becquerelinstitute.org)
• Biofuel Digest (www.biofuelsdigest.com)
• Bloomberg
(www.bloomberg.com)
• BNEF – Bloomberg New Energy Finance
(www.bnef.com)
• BP/Quandl (www.quandl.com/data/BP/coal_prices)
• EAFO _ European Alternative Fuels Observatory
(www.eafo.eu)
• CEWEP – Confederation of European Waste-to-
Energy Plants (www.cewep.eu)
• EBA – European Biogas Association
(www.european-biogas.eu)
• EBB – European Biodiesel Board
(www.ebb-eu.org)
• European Biofuels Technology Platform
(www.biofuelstp.eu)
• EC – European Commission (www.ec.europa.eu)
• ECN – Energy research Centre of the Netherlands,
NREAP summary report (www.ecn.nl/nreap)
• EC – European Commission Directorate General for
Energy and Transport
(https://ec.europa.eu/info/energy-climate-change-
environment_en)
• EGEC – European Geothermal Energy Council
(www.egec.org)
• EGC 2016- European Geothermal Congress
(europeangeothermalcongress.eu)
• EHPA – European Heat Pump Association
(www.ehpa.org)
• EIB – European Investment Bank
(www.eib.org)
• SPE - Solar Power Europe (www.solarpowereurope
SPE – Solar.org/home/) formerly EPIA
• ePURE – European Renewable Ethanol
(www.epure.org)
• ESTELA – European Solar Thermal Electricity
Association (www.estelasolar.eu)
• ESTIF – European Solar Thermal Industry
Federation (www.estif.org)
• Electricity Map (EU)
(https://www.electricitymap.org/)
• EU-OEA – European Ocean Energy Association
(www.eu-oea.com)
• European Energy Innovation
(www.europeanenergyinnovation.e)
• European Commission, Weekly Oil Bulletin
(www.ec.europa.eu/energy/en/data-analysis/
weekly-oil-bulletin)
• Eurostat – Statistique européenne/European
Statistics (www.ec.europa.eu/Eurostat).
Accessed Mid February 2018
• Eurostat SHARES 2016 (Short Assesment of
Renewable Energy Sources) (ec.europa.eu/
eurostat/fr/web/energy/data/shares).
• European Union (www.ec.europa.eu/energy/)
• EVCA – European Private Equity and Venture
Capital Association (www.evca.eu)
• Know-RES (www.knowres-jobs.eu/en)
• RGI - Renewables Grid Initiative
renewables-grid.eu/
• fi compass (www.fi-compass.eu)
• WindEurope (https://windeurope.org)
formerly EWEA
• GEA – Geothermal Energy Association
(www.geo-energy.org)
• GeoTrainNet (www.geotrainet.eu/moodle)
• GWEC – Global Wind Energy Council
(www.gwec.net)
• IEA – International Energy Agency (www.iea.org)
• IEA – RETD: Renewable Energy Technology
Deployment (www.iea-retd.org)
• IEPD – Industrial Efficiency Policy Database
(www. iepd.iipnetwork.org)
• Horizon 2020
(https://ec.europa.eu/programmes/horizon2020/)
• IGA – International Geothermal Association
(www.geothermal-energy.org)
• ISF/UTS Institute for Sustainable Futures/
University of Technology Sydney
(www.isf.uts.edu.au)
• JRC – Joint Research Centre, Renewable Energy
Unit (www.ec.europa.eu/dgs/jrc/index.cfm)
• IRENA – International Renewable Energy Agency
(www.irena.org)
• IWR – Institute of the Renewable Energy Industry
(www.iwr.de)
SOURCES & REFERENCES

Sources
276 277
EUROBSERV ’ER – THE STATE OF RENEWABLE ENERGIES IN EUROPE – 2017 EDITIONEUROBSERV ’ER – THE STATE OF RENEWABLE ENERGIES IN EUROPE – 2017 EDITION
• SULPU – Finnish Heat Pump Association
(www.sulpu.fi)
• Suomen tuulivoimayhdistys – Finnish Wind Power
Association (www.tuulivoimayhdistys.fi)
• TEKES – Finnish Funding Agency for Technology
and Innovation (www.tekes.fi/en)
• Teknologiateollisuus – Federation of Finnish
Technology Industries
(www.teknologiateollisuus.fi)
• University of Eastern Finland (www.uef.fi)
• VTT – Technical Research Centre of Finland
(www.vtt.fi)
FRANCE• ADEME – Environment and Energy Efficiency
Agency (www.ademe.fr)
• AFPAC – French Heat Pump Association
(www.afpac.org)
• AFPG – Geothermal French Association
(www.afpg.asso.fr)
• CDC – Caisse des Dépôts (www.caissedesdepots.fr)
• Club Biogaz ATEE – French Biogas Association
(www.biogaz.atee.fr)
• DGEC – Energy and Climat Department
(www.industrie.gouv.fr/energie)
• Enerplan – Solar Energy organisation
(www.enerplan.asso.fr)
• FEE – French Wind Energy Association
(www.fee.asso.fr)
• France Énergies Marines
(www.france-energies-marines.org)
• In Numeri – Consultancy in Economics and
Statistics (www.in-numeri.fr)
• Observ’ER – French Renewable Energy
Observatory (www.energies-renouvelables.org)
• OFATE - Office franco-allemand pour la transition
énergétiqie (enr-ee.com/fr/qui-sommes-nous.html)
• SVDU – National Union of Treatment and Recovery
of Urban and Assimilated Waste
(www.incineration.org)
• SER – French Renewable Energy Organisation
(www.enr.fr)
• SDES– Observation and Statistics Office – Ministry
of Ecology (www.statistiques.developpement-
durable.gouv.fr)
• UNICLIMA Syndicat des Industries Thermiques,
Aérauliques et Frigorifiques (www.uniclima.fr/)
GERMANY• AA - Federal Foreign Office
(energiewende.diplo.de/home/)
• AEE – Agentur für Erneuerbare Energien -
Renewable Energy Agency
(www.unendlich-viel-energie.de)
• AGEB – Arbeitsgemeinschaft Energiebilanzen
(www.ag-energiebilanzen.de)
• AGEE-Stat – Working Group on Renewable Energy-
Statistics (www.erneuerbare-energien.de)
• AGORA Energiewende - Energy Transition Think
Tank (www.agora-energiewende.de)
• BAFA – Federal Office of Economics and Export
Control (www.bafa.de)
• BBE – Bundesverband Bioenergie
(www.bioenergie.de)
• BBK – German Biogenous and Regenerative Fuels
Association (www.biokraftstoffe.org)
• B.KWK German Combined Heat and Power
Association (www.bkwk.de)
• BEE – Bundesverband Erneuerbare Energie -
German Renewable Energy Association
(www.bee-ev.de)
• BDEW - Bundesverband der Energie - und
Wasserwirtschaft e.V (www.bdew.de)
• BDW - Federation of German Hydroelectric Power
Plants (www.wasserkraft-deutschland.de)
• BMUB – Federal Ministry for the Environment,
Nature Conservation and Nuclear Safety
(www.bmub.bund.de/en/)
• BMWi – Federal Ministry for Economics Affairs
and Energy
(www.bmwi.de/Navigation/EN/Home/home.html)
• BWE – Bundesverband Windenergie -
German Wind Energy Association
(www.wind-energie.de)
• BSW-Solar – Bundesverband Solarwirtschaft - PV
and Solarthermal Industry Association (www.
solarwirtschaft.de)
• BWP – Bundesverband Wärmepumpe - German
Heat Pump Association (www.waermepumpe.de)
• Bundesnetzagentur – Federal Network Agency
(www.bundesnetzagentur.de)
• Bundesverband Wasserkraft – German Small
Hydro Federation
(www.wasserkraft-deutschland.de)
• BVES - German Energy Storage Association
(www.bves.de)
• SPF Economy – Energy Department – Energy
Observatory (economie.fgov.be/fr/spf/structure/
Observatoires/Observatoire_Energie)
• ODE – Sustainable Energie Organisation
Vlaanderen (www.ode.be)
• Valbiom – Biomass Valuation asbl (www.valbiom.be)
• VEA – Flemish Energy Agency
(www.energiesparen.be)
• VWEA – Flemish Wind Energy Association
(www.vwea.be)
• Walloon Energie Portal (www.energie.wallonie.be)
BULGARIA• ABEA – Association of Bulgarian Energy Agencies
(www.abea-bg.org)
• APEE Association of Producers of Ecological
Energy (www.apee.bg/en)
• BGA – Bulgarian Geothermal Association
(www.geothermalbg.org)
• Bulgarian Wind Energy Association (bgwea.org.
server14.host.bg/English/Home_EN.html)
• CL SENES BAS – Central Laboratory of Solar Energy
and New Energy Sources (www.senes.bas.bg)
• EBRD – Renewable Development Initiative
(www.ebrdrenewables.com)
• Invest Bulgaria Agency
(www.investbg.government.bg)
• NSI National Statistical Institute (www.nsi.bg)
• SEC – Sofia Energy Centre (www.sec.bg)
• SEDA - Sustainable Energy Development Agency
(www.seea.government.bg)
CYPRUS• Cyprus Institute of Energy (www.cie.org.cy)
• MCIT – Ministry of Commerce, Industry and
Tourism (www.mcit.gov.cy)
• CERA Cyprus Energy Regulatory Authority
(www.cera.org.cy)
CROATIA• Croatian Bureau of Statistics
(www.dzs.hr/default_e.htm)
• University of Zagreb (www.fer.unizg.hr/en)
• HEP-Distribution System Operator (www.hep.hr)
• CROATIAN ENERGY MARKET OPERATOR - HROTE
(www.hrote.hr)
• Croatian Ministry of Economy (www.mingo.hr/en)
CZECH REPUBLIC• MPO – Ministry of Industry and Trade – RES
Statistics (www.mpo.cz)
• Czech RE Agency – Czech Renewable Energy
Agency (www.czrea.org)
• ERU – Energy Regulatory Office (www.eru.cz)
• CzBA – Czech Biogas Association (www.czba.cz)
• CZ Biom – Czech Biomass Association
(www.biom.cz)
• Czech Wind Energy Association (www.csve.cz/en)
DENMARK• DANBIO – Danish Biomass Association
(www.biogasbranchen.dk)
• Dansk Solvarme Forening - Danish Solar
Association (www. dansksolvarmeforening.dk)
• Danish Wind Industry Association
(www.windpower.org/en)
• Energinet.dk – TSO (www.energinet.dk)
• ENS – Danish Energy Agency (www.ens.dk)
• PlanEnergi (www.planenergi.dk)
• SolEnergi Centret – Solar Energy Centre Denmark
(www.solenergi.dk)
ESTONIA• EBU – Estonian Biomass Association (www.eby.ee)
• Espel (Estonia)– MTÜ Eesti Soojuspumba Liit
(www.soojuspumbaliit.ee)
• EWPA – Estonian Wind Power Association
(www.tuuleenergia.ee/en)
• Ministry of Finance (www.fin.ee)
• Ministry of Economics (www.mkm.ee/eng/)
• MTÜ – Estonian Biogas Association
• STAT EE – Statistics Estonia (www.stat.ee)
• TTU – Tallinn University of Technology
(www.ttu.ee)
FINLAND• Finbio – Bio-Energy Association of Finland
(www.finbio.org)
• Finnish Board of Customs (www.tulli.fi/en)
• Finnish biogas association
(biokaasuyhdistys.net)
• Finnish Energy - Energiateollisuus (energia.fi/)
• Metla – Finnish Forest Research Institute
(www.metla.fi)
• Pienvesivoimayhdistys ry – Small Hydro
Association (www.pienvesivoimayhdistys.fi)
• Statistics Finland (www.stat.fi)

Sources
278 279
EUROBSERV ’ER – THE STATE OF RENEWABLE ENERGIES IN EUROPE – 2017 EDITIONEUROBSERV ’ER – THE STATE OF RENEWABLE ENERGIES IN EUROPE – 2017 EDITION
IRELAND• Action Renewables (www.actionrenewables.org)
• EIRGRID (www.eirgridgroup.com/)
• IRBEA – Irish Bioenergy Association (www.irbea.org)
• Irish Hydro Power Association (www.irishhydro.com)
• ITI – InterTradeIreland (www.intertradeireland.com)
• IWEA – Irish Wind Energy Association
(www.iwea.com)
• REIO – Renewable Energy Information Office
(www.seai.ie/Renewables/REIO)
• SEAI – Sustainable Energy Authority of Ireland
(www.seai.ie)
ITALY• AIEL – Associazione Italiana Energie Agroforestali
(www.aiel.cia.it)
• ANEV – Associazione Nazionale Energia del Vento
(www.anev.org)
• APER – Associazione Produttori Energia da Fonti
Rinnovabili (www.aper.it)
• Assocostieri – Unione Produttorri Biocarburanti
(www.assocostieribiodiesel.com)
• Assosolare – Associazione Nazionale dell’Industria
Solar Fotovoltaica (www.assosolare.org)
• Assotermica (www.anima.it/ass/assotermica)
• CDP – Cassa Depositi e Prestiti (www.cassaddpp.it)
• COAER ANIMA Associazione Costruttori di
Apparecchiature ed Impianti Aeraulici
(www.coaer.it)
• Consorzio Italiano Biogas – Italian Biogas
Association (www.consorziobiogas.it)
• Energy & Strategy Group – Dipartimento
diIngegneria Gestionale, Politecnico di Milano
(www.energystrategy.it)
• ENEA – Italian National Agency for New
Technologies (www.enea.it)
• Fiper – Italian Producer of Renewable Energy
Federation (www.fiper.it)
• GIFI – Gruppo Imprese Fotovoltaiche Italiane
(www.gifi-fv.it/cms)
• GSE – Gestore Servizi Energetici (www.gse.it)
• ISSI – Instituto Sviluppo Sostenible Italia
• ITABIA – Italian Biomass Association
(www.itabia.it)
• MSE – Ministry of Economic Development
(www.sviluppoeconomico.gov.it)
• Ricerca sul Sistema Energetico (www.rse-web.it)
• Terna – Electricity Transmission Grid Operator
(www.terna.it)
• UGI Unione Geotermica Italiana
(www.unionegeotermica.it)
LATVIA• CSB –Central Statistical Bureau of Latvia
(www.csb.gov.lv)
• IPE – Institute of Physical Energetics
(www.innovation.lv/fei)
• LATbioNRG – Latvian Biomass Association
(www.latbionrg.lv)
• LBA – Latvijas Biogazes Asociacija
(www.latvijasbiogaze.lv)
• LIIA – Investment and Development Agency
of Latvia (www.liaa.gov.lv)
• Ministry of Economics (www.em.gov.lv)
LITHUANIA• EA – State Enterprise Energy Agency (www.ena.lt/en)
• LAIEA – Lithuanian Renewable Resources Energy
Association (www.laiea.lt)
• LBDA – Lietuvos Bioduju Asociacija
(www.lbda.lt/lt/titulinis)
• LEEA – Lithuanian Electricity Association
(www.leea.lt)
• LEI – Lithuanian Energy Institute (www.lei.lt)
• LHA – Lithuanian Hydropower Association
(www.hidro.lt)
• Lietssa (www.lietssa.lt)
• LITBIOMA – Lithuanian Biomass Energy
Association (www.biokuras.lt)
• LIGRID AB, Lithuanian electricity transmission
system operator (www.litgrid.eu)
• LS – Statistics Lithuania (www.stat.gov.lt)
• LWEA – Lithuanian Wind Energy Association
(www.lwea.lt/portal)
LUXEMBOURG• Biogasvereenegung – Luxembourg Biogas
Association (www.biogasvereenegung.lu)
• Enovos (www.enovos.eu)
• NSI Luxembourg – Service Central de la Statistique
et des Études Économiques
• Solarinfo (www.solarinfo.lu)
• STATEC – Institut National de la Statistique et des
Études Économiques (www.statec.public.lu)
MALTA• WSC - The Energy and Water Agency
(https://energywateragency.gov.mt)
• CLEW -Clean Energy Wire
(www.cleanenergywire.org)
• Dena – German Energy Agency (www.dena.de)
• DGS – EnergyMap Deutsche Gesellschaft für
Solarenergie (www.energymap.info)
• DBFZ – German Biomass Research Centre
(www.dbfz.de)
• Deutsche WindGuard GmbH (www.windguard.de)
• DEWI – Deutsches Windenergie Institut
(www.dewi.de)
• EEG Aktuell (www.eeg-aktuell.de)
• EEX – European Energy Exchange (www.eex.com)
• Erneuerbare Energien
(www.erneuerbare-energien.de)
• Fachverband Biogas - German Biogas Association
(www.biogas.org)
• Fraunhofer-ISE - Institut for Solar Energy System
(www.ise.fraunhofer.de/)
• Fraunhofer-IWES - Institute for Wind Energy and
Energy System Technology
(www.iwes.fraunhofer.de/en.html)
• FNR – Fachagentur Nachwachsende Rohstoffe -
Agency for Sustainable Resources
(international.fnr.de/)
• FVEE – Forschungsverbund Erneuerbare
Energien – Renewable Energy Research
Association (www.fvee.de)
• GTAI – Germany Trade and Invest (www.gtai.de)
• GtV – Bundesverband Geothermie
(www.geothermie.de)
• GWS – Gesellschaft für Wirtschaftliche
Strukturforschung (www.gws-os.com/de)
• KfW – Kreditanstalt für Wiederaufbau
(www.kfw.de)
• RENAC - Renewables Academy AG (www.renac.de)
• UBA - Federal Environmental Agency
(Umweltbundesamt) (www.umweltbundesamt.de)
• UFOP – Union for the Promotion of Oil and Protein
plants e.V (www.ufop.de)
• VDB – German Biofuel Association
(www.biokraftstoffverband.de)
• VDMA – German Engineering Federation
(www.vdma.org)
• WI – Wuppertal Institute for Climate, Environment
and Energy (www.wupperinst.org)
• ZSW – Centre for Solar Energy and Hydrogen
Research Baden-Württemberg (www.zsw-bw.de)
GREECE• CRES – Center for Renewable Energy Sources and
saving (www.cres.gr)
• DEDDIE Hellenic Electricity Distribution Network
Operator S.A.(www.deddie.gr)
• EBHE – Greek Solar Industry Association
(www.ebhe.gr)
• HELAPCO – Hellenic Association of Photovoltaic
Companies (www.helapco.gr)
• HELLABIOM – Greek Biomass Association c/o CRES
(www.cres.gr)
• HWEA – Hellenic Wind Energy Association
(www.eletaen.gr)
• MINISTRY OF ENVIRONMENT, ENERGY
AND CLIMATE CHANGE (www.ypeka.gr)
• Small Hydropower Association Greece
(www.microhydropower.gr)
• Lagie - operator of electricity market S.A. (www.
lagie.info)
HUNGARY• Energiaklub – Climate Policy Institute
(www.energiaklub.hu/en)
• Energy Centre – Energy Efficiency, Environment
and Energy Information Agency
(www.energycentre.hu)
• Ministry of National Development
(www.kormany.hu/en/ministry-of-national-
development)
• Hungarian Wind Energy Association
(www.mszet.hu)
• Hungarian Heat Pump Association
(www.hoszisz.hu)
• Magyar Pellet Egyesület – Hungarian Pellets
Association (www.mapellet.hu)
• MBE – Hungarian Biogas Association
(www.biogas.hu)
• MGTE – Hungarian Geothermal Association
(www.mgte.hu/egyesulet)
• Miskolci Egyetem – University of Miskolc Hungary
(www.uni-miskolc.hu)
• MMESZ – Hungarian Association of Renewable
Energy Sources (www.mmesz.hu)
• MSZET – Hungarian Wind Energy Association
(www.mszet.hu)
• Naplopó Kft. (www.naplopo.hu)
• SolarT System (www.solart-system.hu)
Sources
280 281
EUROBSERV ’ER – THE STATE OF RENEWABLE ENERGIES IN EUROPE – 2017 EDITIONEUROBSERV ’ER – THE STATE OF RENEWABLE ENERGIES IN EUROPE – 2017 EDITION
SPAIN• AEE – Spanish Wind Energy Association
(www.aeeolica.es)
• ADABE – Asociación para la Difusión
delAprovechamiento de la Biomasa en España
(www.adabe.net)
• AEBIG – Asociación Española de Biogás
(www.aebig.org)
• AIGUASOL – Energy consultant
(www.aiguasol.coop)
• APPA – Asociación de Productores de Energías
Renovables (www.appa.es)
• ASIF – Asociación de la Industria Fotovoltaica
(www.asif.org)
• ASIT – Asociación Solar de la Industria Térmica
(www.asit-solar.com)
• ANPIER – Asociación Nacional de Productores-
Inversores de Energías Renovables
(www.anpier.org)
• AVEBIOM – Asociación Española de Valorización
Energética de la Biomasa (www.avebiom.org/es/)
• CNMC – Comissiòn Nacional de los Mercados y la
Competencia (www.cnmc.es)
• FB – Fundación Biodiversidad
(www.fundacion-biodiversidad.es)
• ICO – Instituto de Crédito Oficial (www.ico.es)
• IDAE – Institute for Diversification and Saving
of Energy (www.idae.es)
• INE – Instituto Nacional de Estadística
(www.ine.es)
• MITYC – Ministry of Industry, Tourism and Trade
(www.mityc.es)
• OSE – Observatorio de la Sostenibilidad en España
(www.forumambiental.org)
• Protermosolar – Asociación Española de la
Industria Solar Termoeléctrica
(www.protermosolar.com)
• Red Eléctrica de Espana (www.ree.es)
UNITED KINGDOM• ADBA – Anaerobic Digestion and Biogas
Association – Biogas Group (UK)
(www.adbiogas.co.uk)
• BHA – British Hydropower Association
(www.british-hydro.org)
• BSRIA – The Building Services Research and
Information Association (www.bsria.co.uk/)
• BEIS - Department for Business, Energy &
Industrial Strategy (https://www.gov.uk/
government/statistics/energy-trends-section-6-
renewables)
• DUKES – Digest of United Kingdom Energy
Statistics (www.gov.uk/government)
• GSHPA – UK Ground Source Heat Pump Association
(www.gshp.org.uk)
• HM Revenue & Customs (www.hmrc.gov.uk)
• National Non-Food Crops Centre
(www.nnfcc.co.uk)
• MCS - Microgeneration Certification Scheme
(www.microgenerationcertification.org)
• Renewable UK – Wind and Marine Energy
Association (www.renewableuk.com)
• Renewable Energy Centre
(www.TheRenewableEnergyCentre.co.uk)
• REA – Renewable Energy Association (www.r-e-a.net)
• RFA – Renewable Fuels Agency (www.data.gov.uk/
publisher/renewable-fuels-agency)
• Ricardo AEA (www.ricardo-aea.com)
• Solar Trade Association (www.solar-trade.org.uk)
• UKERC – UK Energy Research Centre
(www.ukerc.ac.uk)
SLOVAKIA• ECB – Energy Centre Bratislava Slovakia
(www.ecb2.sk)
• Ministry of Economy of the Slovak Republic
(www.economy.gov.sk)
• SAPI – Slovakian PV Association (www.sapi.sk)
• Slovak Association for Cooling and Air
Conditioning Technology (www.szchkt.org)
• SK-BIOM – Slovak Biomass Association
(www.4biomass.eu/en/partners/sk-biom)
• SKREA – Slovak Renewable Energy Agency, n.o.
(www.skrea.sk)
• SIEA – Slovak Energy and Innovation Agency
(www.siea.sk)
• Statistical Office of the Slovak Republic
(portal.statistics.sk)
• The State Material Reserves of Slovak Republic
(www.reserves.gov.sk/en)
• Thermosolar Ziar ltd (www.thermosolar.sk)
• URSO Regulatory Office for Network Industries
(www.urso.gov.sk)
• MEEREA – Malta Energy Efficiency & Renewable
Energies Association (www.meerea.org)
• MIEMA – Malta Intelligent Energy Management
Agency (www.miema.org )
• Ministry for Energy and Health (energy.gov.mt)
• MRA – Malta Resources Authority
(www.mra.org.mt)
• NSO – National Statistics Office (www.nso.gov.mt)
• University of Malta – Institute for Sustainable
Energy (www.um.edu.mt/iet)
NETHERLANDS• Netherlands Enterprise Agency (RVO) (www.rvo.nl)
• CBS – Statistics Netherlands (www.cbs.nl)
• CertiQ – Certification of Electricity (www.certiq.nl)
• ECN – Energy research Centre of the Netherlands
(www.ecn.nl)
• Holland Solar – Solar Energy Association
(www.hollandsolar.nl)
• NWEA – Nederlandse Wind Energie Associatie
(www.nwea.nl)
• Platform Bio-Energie – Stichting Platform
Bio-Energie (www.platformbioenergie.nl)
• Stichting Duurzame Energie Koepel
(www.dekoepel.org)
• Vereniging Afvalbedrijven – Dutch Waste
Management Association
(www.verenigingafvalbedrijven.nl)
• Bosch & Van Rijn (www.windstats.nl)
• Stichting Monitoring Zonnestroom
(www.zonnestroomnl.nl)
POLAND• CPV – Centre for Photovoltaicsat Warsaw
University of Technology (www.pv.pl)
• Energy Regulatory Office (www.ure.gov.pl)
• Federation of employers renewable energy forum
(www.zpfeo.org.pl)
• GUS – Central Statistical Office (www.stat.gov.pl)
• IEO EC BREC – Institute for Renewable Energy
(www.ieo.pl)
• National Fund for Environmental Protection and
Water Management (www.nfosigw.gov.pl)
• SPIUG Polish heating organisation (www.spiug.pl/)
• PBA – Polish Biogas Association (www.pba.org.pl)
• PGA – Polish Geothermal Association
(www.pga.org.pl)
• PIGEO – Polish Economic Chamber of Renewable
Energy (www.pigeo.org.pl)
• POLBIOM – Polish Biomass Association
(www.polbiom.pl)
• Polska Organizacja Rozwoju Technologii Pomp
Ciepła PORT PC (www.portpc.pl)
• POPiHN - Polish Oil Industry and Trade
Organisation – (www.popihn.pl/)
• PSG – Polish Geothermal Society
(www.energia-geotermalna.org.pl)
• PSEW – Polish Wind Energy Association
(www.psew.pl)
• TRMEW – Society for the Development of Small
Hydropower (www.trmew.pl)
• THE - Polish Hydropower Association (PHA)
(www.tew.pl)
PORTUGAL• ADENE – Agência para a Energia (www.adene.pt)
• APESF – Associação Portuguesa de Empresas de
Solar Fotovoltaico (www.apesf.pt)
• Apisolar – Associação Portuguesa da Indústria
Solar (www.apisolar.pt)
• Apren – Associação de energies renováveis
(www.apren.pt)
• CEBio – Association for the Promotion of
Bioenergy (www.cebio.net)
• DGEG – Direcção Geral de Energia e Geologia
(www.dgeg.pt)
• EDP – Microprodução (www.edp.pt)
• SPES – Sociedade Portuguesa de Energia Solar
(www.spes.pt)
ROMANIA• Association Biofuels Romania
(www.asociatia-biocombustibili.ro)
• CNR-CME – World Energy Council Romanian
National Committee (www.cnr-cme.ro)
• ECONET Romania (www.econet-romania.com/)
• ENERO – Centre for Promotion of Clean and
Efficient Energy (www.enero.ro)
• ICEMENERG – Energy Research and Modernising
Institute (www.icemenerg.ro)
• ICPE – Research Institute for Electrical Engineering
(www.icpe.ro)
• INS – National Institute of Statistics (www.insse.ro)
• Romanian Wind Energy Association (www.rwea.ro)
• RPIA -Romanian Photovoltaic Industry Association
(rpia.ro)
• University of Oradea (www.uoradea.ro)
• Transelectrica (www.transelectrica.ro)
Sources
282 283
EUROBSERV ’ER – THE STATE OF RENEWABLE ENERGIES IN EUROPE – 2017 EDITIONEUROBSERV ’ER – THE STATE OF RENEWABLE ENERGIES IN EUROPE – 2017 EDITION
SLOVENIA• SURS – Statistical Office of the Republic of
Slovenia (www.stat.si)
• Eko sklad – Eco-Fund-Slovenian Environmental
Public Fund (www.ekosklad.si)
• ARSO - Slovenian Environment Agency
(www.arso.gov.si/en/)
• JSI/EEC - The Jozef Stefan Institute – Energy
Efficiency Centre (www.ijs.si/ijsw)
• Tehnološka platforma za fotovoltaiko –
Photovoltaic Technology Platform
(www.pv-platforma.si)
• ZDMHE – Slovenian Small Hydropower Association
(www.zdmhe.si)
SWEDEN• Avfall Sverige – Swedish Waste Management
(www.avfallsverige.se)
• ÅSC – Angstrom Solar Center
(www.asc.angstrom.uu.se)
• Energimyndigheten – Swedish Energy Agency
(www.energimyndigheten.se)
• SCB – Statistics Sweden (www.scb.se)
• SERO – Sveriges Energiföreningars Riks
Organisation (www.sero.se)
• SPIA – Scandinavian Photovoltaic Industry
Association (www.solcell.nu)
• Energigas Sverige – (www.energigas.se)
• Uppsala University (www.uu.se/en/)
• Svensk Solenergi – Swedish Solar Energy Industry
Association (www.svensksolenergi.se)
• Svensk Vattenkraft – Swedish Hydropower
Association – (www.svenskvattenkraft.se)
• Svensk Vindenergi – Swedish Wind Energy
(www.svenskvindenergi.org)
• Swentec – Sveriges Miljöteknikråd
(www.swentec.se)
• SVEBIO – Svenska Bioenergiföreningen/Swedish
Bioenergy Association (www.svebio.se)
• SKVP - Svenska Kyl & Värmepumpföreningen
(skvp.se/) (formely SVEP)
• Aghion, P./Howitt, P. (1993): A model of growth
through creative destruction. In: Foray, D./
Freeman, C. (eds.): Technology and the wealth of
Nations. London: Pinter Publisher, 145-172.
• Balassa, B. (1965): Trade Liberalisation and Revealed
Comparative Advantage, The Manchester School of
Economics and Social Sciences, 33, 99-123.
• Dosi, G./Soete, L. (1983): Technology Gaps and
Cost-Based Adjustment: Some Explorations on the
Determinants of International Competitiveness,
Metroeconomica, 35, 197-222.
• Dosi, G./Soete, L. (1991): Technical Change and
International Trade. In: Dosi, G./Freeman, C./
Nelson, R./Silverberg, G./Soete, L. (eds.): Technical
Change and Economic Theory. London: Pinter
Publishers, 401-431.
• Freeman, C. (1982): The Economics of Industrial
Innovation. London: Pinter Publishers.
• Grupp, H. (1998): Foundations of the Economics of
Innovation - Theory, Measurement and Practice.
Cheltenham: Edward Elgar.
• Krugman, P. (1979): A Model of Innovation,
Technology Transfer, and the World Distribution of
Income, Journal of Political Economy, 87, 253-266.
• Leamer, E.E. (1980): The Leontief Paradox,
Reconsidered, Journal of Political Economy, 88,
495-503.
• Leontief, W. (1953): Domestic Production and
Foreign Trade; The American Capital Position
Re-Examined, Proceedings of the American
Philosophical Society, 97, 332-349.
• Martinez, C. (2011): Patent families: When
do different definitions really matter?,
Scientometrics, 86, 39-63.
• Moed, H.F./Glänzel, W./Schmoch, U. (eds.) (2004):
Handbook of Quantitative Science and Technology
Research. The Use of Publications and Patent
Statistics in Studies of S&T Systems. Dordrecht:
Kluwer Academic Publisher.
• Nelson, R.R./Romer, P.M. (1996): Science, Economic
Growth, and Public Policy. In: Smith, B.L.R./
Barfield, C.E. (eds.): Technology, R&D, and the
Economy. Washington D.C.: The Brookings
Institution.
• Posner, M.V. (1961): International Trade and
Technical Change, Oxford Economic Papers, 13,
323-341.
• Romer, P.M. (1990): Endogenous Technological
Change, Journal of Political Economy, 98, S71-S102.
• Vernon, R. (1966): International Investment and
International Trade in the Product Cycle, Quarterly
Journal of Economics, 80, 190-207.
• Vernon, R. (1979): The Product Cycle Hypothesis in
a New International Environment, Oxford Bulletin
of Economics & Statistics, 41, 255-267.
REFERENCES FOR THE INDICATORS ON INNOVATION AND COMPETITIVENESS
REFERENCES FOR RENEWABLE ENERGY COSTS, REFERENCE PRICES AND COMPETITIVENESS
• Elbersen, B., Staritsky, I., Hengeveld,G., Jeurissen, L., Lesschen, J.P.
• Panoutsou C. (2016): Outlook of spatial biomass value chains in EU28.
• Deliverable 2.3 of the Biomass Policies project.
• JRC, 2014: Energy Technology Reference Indicator projections for 2010-2050.
• Luxemburg: Publications Office of the European Union.
• Eurostat, ec.europa.eu/eurostat (2017).
• EEA 2018: Renewable energy in Europe 2018 - Recent growth and knock-on effects’, EEA, (to be published),
eea.europa.eu .
284 285
EUROBSERV ’ER – THE STATE OF RENEWABLE ENERGIES IN EUROPE – 2017 EDITIONEUROBSERV ’ER – THE STATE OF RENEWABLE ENERGIES IN EUROPE – 2017 EDITION
EUROBSERV’ER BAROMETERS ONLINE
All EurObserv’ER barometers can be downloaded in PDF format at the following address:
www.eurobserv-er.org

Editorial director: Vincent Jacques le SeigneurDeputy editor-in-chief: Timothée BongrainEditorial coordination: Romain DavidEditors: Observ’ER (FR), ECN (NL), RENAC (DE), Frankfurt School of Finance and Management (DE), Fraunhofer ISI (DE) and Statistics Netherlands (NL)Translation: Odile Bruder, Shula TennenhausGraphic design: Lucie Baratte/kaleidoscopeye.comProduction: Marie Agnès Guichard, Alice GuillierPictograms: bigre! et Lucie Baratte/kaleidoscopeye.comCover photo credit: InvenergyPrinted by Imprimerie Graphius, March 2018ISSN 2555-0195
For more extensive information pertaining to the EurObserv’ER barometers, please contact:
Diane Lescot, Frédéric TuilléObserv’ER 146, rue de l’UniversitéF – 75007 ParisTél.: + 33 (0)1 44 18 73 53Fax: + 33 (0)1 44 18 00 36E-mail: [email protected]: www.energies-renouvelables.org
Schedule for the 2018 EurObserv’ER barometers
Wind power >> February 2018
Photovoltaic >> April 2018
Solar thermal >> June 2018
Biofuels >> July 2018
Heat Pumps >> November 2018
Solid biomass >> December 2018
INFORMATION

Observ’ER146, rue de l’Université
F–75007 ParisTél. : +33 (0)1 44 18 00 80
www.energies-renouvelables.org