the structure of long-term ad memories - ameritest
TRANSCRIPT


© 2017 Ameritest/CY Research, 4841 Tramway Ridge Drive NE, Albuquerque, NM 87111, www.ameritest.com
2
The Structure of Long-Term Ad Memories
by Charles Young
“The only sustainable competitive advantage is the ability to learn faster than your competitors.”
-Former Head of Planning, Royal Dutch Shell
Here’s a simple thought experiment: imagine that you are holding two magical cups in your hand. The first cup contains the universe of all the memories that you have of all the things you have ever experienced. The second cup contains the universe of all the things that you can imagine. “Which is the larger cup?” My viewpoint is that they are the same cup. An act of imagination is a remix of remembered life experiences, put together in original ways. Indeed, it is an axiom of Claud Shannon’s foundational work, The Mathematical Theory of Communication, that a message that is completely made up of original content and lacking in familiar content would be “unintelligible” to the receiver. To the extent that our thoughts are messages to ourselves, the same logic applies. The neuroscientist David Eagleman reports that if you place a respondent in an fMRI machine and measure the brain activity as someone is watching visual stimulus, six times more information is being re-activated in different parts of the brain where it is stored as memory as is coming in through the optic nerve to create vision. In other words, what we see is more a function of what we remember than is what is coming through our eyes. Memory is much more dynamic than we think, and it is always ON. The eye is just the on-ramp to the more complicated memory traffic system we have in our brains. Memory and imagination are core to the business we call advertising. And yet, they are concepts surprisingly under-represented in professional discussions of how advertising works. These days the hot topic is “emotion” and “System 1 processing.” A decade ago, when we were still in the Age of Television, the hot topic would’ve been “attention” and “persuasion.” The Nobel Prize-winning economist Daniel Kahneman, who coined the term “System 1” to describe the unconscious decision-making processes of the Experiencer Self in his book Thinking Fast and Slow, makes a central point that “It Is the Remembered Self that keeps score and makes all economic decisions.” Simply said, the function of memory is to enable the brain to make predictions about the possible consequences of future behaviors. The myth of memory is that it’s about the past. From an evolutionary survival-of-the fittest standpoint, memory is really about the future. The reason for Advertisers’ loss of focus on memory is historical. The original and widely-accepted measure of advertising quality, dating back to the Mad Men days of the Fifties, was a day-after-recall score. But after dominating the industry for a generation, recall scores fell out of favor because many major advertisers, like P&G, could not find a correlation between recall scores and sales. There were three reasons that an earlier generation of ad researchers could not connect ad memories to sales. First, a recall score is a verbal or word-based metric. Most of the ad memories we care to access are non-verbal, difficult, if not impossible, to put into words. Second, asking a respondent to actively recall an ad does not dig as deeply into their memory as asking them if they recognize a picture from an ad they saw some time ago. Third, it is well-established science that there are three major memory systems in the brain not just one. However, the memory system tapped into by recall testing, semantic memory, is the least important of the three from the standpoint of understanding how advertising motivates behavior. In other words, the earlier generation of ad researchers got the strategy right. Memory is the main game for measuring and understanding how advertising builds brands. However, they only got the execution one-third right.

© 2017 Ameritest/CY Research, 4841 Tramway Ridge Drive NE, Albuquerque, NM 87111, www.ameritest.com
3
To get back to basics, Ameritest and our partners, Research Now and Sand’s Neuroscience Research, operating under the aegis of the Advertising Research Foundation, has recently conducted a study of long-term advertising memories in the Quick Service Restaurant category. As far as we know, this is the largest study of its kind, involving over 4000 consumer interviews conducted on 268 TV commercials and 4000 individual still images taken from those ads. The study is an “edge case” for marketers, since 9 years elapsed between the time those fast food ads were aired and tested in 2009 and now-- when we measured advertising memories one picture at a time. Obviously, such a long time frame is irrelevant to most marketers, but by showing how much memory can be recovered even after so many years of forgetting time, it should be clear in the discussion that follows how this approach might be useful if done once or twice a year in any well-defined advertising category.
Headline Findings 1. This research proves that the assumption that most Marketing Mix Models make that advertising memories decay very quickly is false. This large-scale study found the average image, from the 268 fast food TV commercials that were tested, is still remembered by 12.5% of the target population in 2017. As a corollary, this finding implies that modelers may be seriously undervaluing the contribution made by the long-term component of advertising ROI. 2. Not only are long-term ad memories plentiful, they are predictable. A simple Moment-by-moment measure of short-term memory, collected 10 minutes after first exposure to an ad with a Picture Sort in a pre-test, is highly correlated with memories 9 years later. 3. Long term ad memories are driven by ad quality. As an example, ads that performed in the top quartile of motivation (using a standard 5-point purchase intent) generated twice as many long-term memories as ads performing in the bottom quartile. Thus, it is reasonable to assume that ads that generate higher ROI in the short term, should create longer lasting memories which also generate above average returns over the long term. 4. One of the most important variables driving long-term ad memory formation is emotion. Images that scored in the top quartile of self-reported emotional response after 10 minutes generated more than twice as many long-term memories than images scoring in the bottom quartile. 5. There are winners and losers in the fight for share of consumer memory space in each category. The reason for this is the existence of “free range” imagery from poorly branded ads in the category. These images may be misattributed to competing brands in consumer memory and not the brand that paid to air the images. This study provides case histories to illustrate. 6. By comparing the memories retrieved with storyboards with memories activated by individual images, this study provides new insights into the structure of ad memories and how they are built up over time. By exploring the optimal balance between “familiar” and “original” content within individual executions, the image level approach may be useful for measuring the memory strength of advertising elements we call “ad equities.” Ad equities are important because of their application across multiple advertising formats as building blocks for an integrated campaign. This could be used to build an Advertising Playbook for optimizing your brand’s memories. 7. The image-level approach can be used to measure the strength of different memories and identify specific visual ad imagery that may be concentrated in different target audiences. This is information which can be used in developing creative briefs that target new messages based on a given segment’s known prior knowledge of the brand. 8. This data can be used to investigate the role in brand-building of each of the three major memory systems in the brain: semantic, episodic and procedural/implicit memory (what we call “Head Heart Hand”). Based on this data, it appears that the three types of memories decay at different rates, and perform different functions in driving motivation.
© 2017 Ameritest/CY Research, 4841 Tramway Ridge Drive NE, Albuquerque, NM 87111, www.ameritest.com
4
9. This study demonstrates a new way to integrate new neuroscience techniques with survey ad research methods. A combination of survey (Picture Sorts) and brain-wave measurement(EEG) seems to be most predictive of long term memory, based on a small subsample of the larger study. 10. This study demonstrates that it’s now practical to track not only ad awareness but image-level memories at the category level. This can be used to measure and track Share-of-Memory by brand, an analog to Share-of-Voice and Share-of-Market, as an overall report card measure of total in-market advertising effectiveness.
Theoretical Framework The co-father of AI, Herbert Simon, stressed the importance of dealing at the right level of abstraction in building AI models. This idea was amplified by the resident futurist at Google, Ray Kurzweil, in his book Creating Mind. Kurzweil writes eloquently about the hierarchical nature of memory and pattern recognition which operates in the Neocortex, the locus of all higher-level thought. He describes the Neocortex as only 6 layers deep, with predictions from memory from higher levels of abstraction moving down to finer and finer grained levels of pattern detectors linked to our senses. The senses send their readings back up to the top to validate or course-correct the brain’s predictions in a continuous stream of information flowing up and down the six layers. If we were to look at the advertising world from a similar viewpoint, we might deconstruct the 6 layers of abstraction as follows: Levels of Abstraction in the Economic World: 1. Marketplaces/categories 2. Products/Brands 3. Ad Campaigns/PR 4. Ads/other executional vehicles 5. Images/Memories 6. Sub-image level pattern recognition (i.e. edges, shapes, colors) When you try to give an answer to any “Reason Why" question for advertisers with research, you always must drop one or two levels below the level of the problem you're trying to solve. That’s why we diagnose ad performance with the Picture Sorts, we drop down from level 4 to level 5 to explain what’s going on.
Research Design Conceptually, the design of this research is like a 2-cycle rotary engine: With the first cycle, in 2009, we swept the fast food category for all new advertising, testing each ad as soon as it arrives on the national stage, making predictions about how each ad will sell and stick with consumers. Clients used that information to optimize their media buy and adapt their messaging strategy to changing conditions in the marketplace. A by-product of the diagnostic testing we do is that we automatically converted hundreds of ads into thousands of images for use in our analysis. The second cycle, in 2017, was to use the image from the first cycle to track which memories are still there after all that time as proof that the advertising did its job, and may even today be contributing to sales because it’s still there in the consumer’s head.
2009: QSR Category Ad Sweeps In 2009, Ameritest was operating a syndicated ad testing service in the Quick Service Restaurant (“fast food”) category. That year we tested all of the 30-second TV commercials that aired nationally in the category. There were 268 adult targeted ads for 17 national brands, like McDonald’s, Burger King, Pizza Hut, etc. The timing was serendipitous because this study represents close to the high-water mark for the Age of Television, since this was just after the birth of Social Media.
© 2017 Ameritest/CY Research, 4841 Tramway Ridge Drive NE, Albuquerque, NM 87111, www.ameritest.com
5
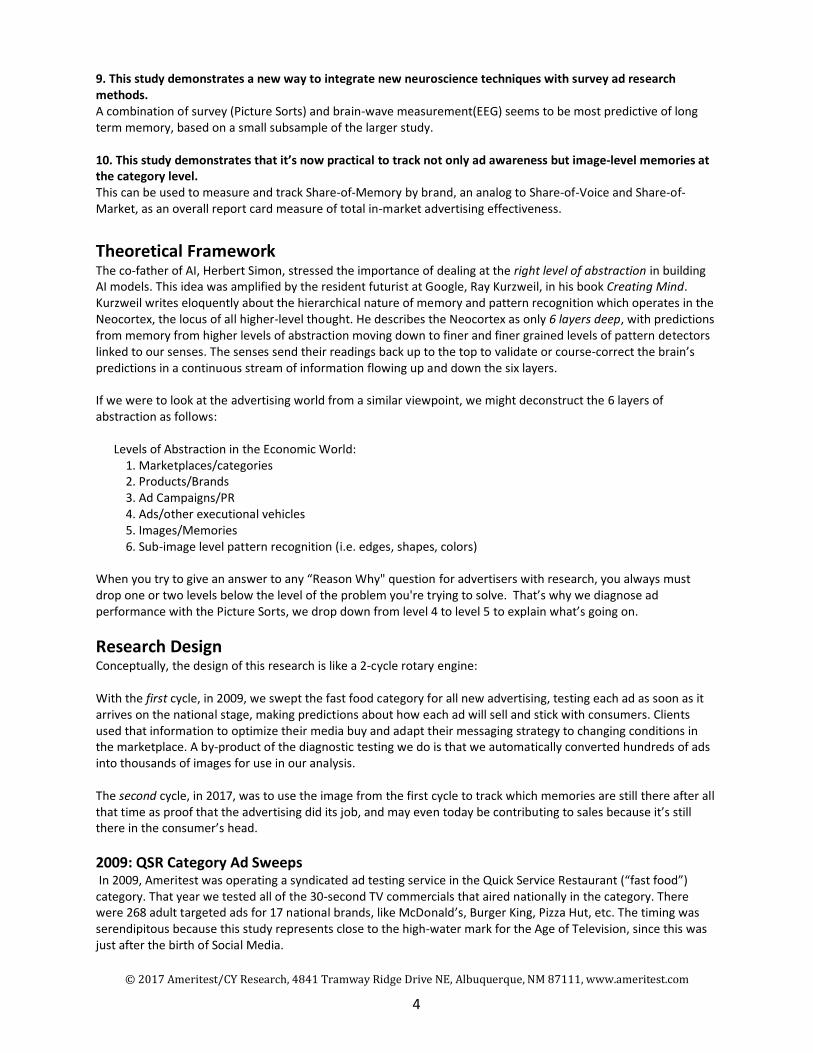
Using the Ameritest custom pre-test as a design model, our syndicated testing-product was built on a platform that allowed us to “batch process” large numbers of commercials at a time. The 15-minute automated interview was conducted on each commercial within 48 hours of its national debut. This was done among 100 past month fast food consumers and the sample was balanced to census. Thus the baseline sample for the study was 26,000 consumer interviews. The interview for each commercial was completely standardized, but in-depth. It included measures of attention-getting power, brand linkage, motivation, diagnostic ratings for the execution, brand ratings, three picture sorts, and two copy sorts. The data set for that year was well-behaved. The distribution for advertising performance followed a bell-curve and there was a great deal of variability in ad quality across the seventeen brands.
In addition, we could validate the predictiveness of these creative metrics to sales, using 77 months of change-in-same-store sales growth figures that McDonald’s reported publicly to Wall Street. This validation model used just four creative variables to explain 45% of McDonald’s monthly sales growth over that period, without knowing media weight. The model was written up in the Journal of Advertising Research. (Young, C. and Page, A., A model
for predicting advertising quality as a key to driving sales growth: How television advertising quality affected McDonald's sales growth over six year. JAR December 2014) With these three picture sorts, we deconstructed the commercials frame-by-frame, into over 5000 still images. These pictures were used to measure memory of the commercial roughly 10-minutes after exposure, self-reported emotion on a 5-point scale and consumer-reported meanings for each picture from a standard list of ten fast food dimensions of brand positioning. Normally, we base our predictions about long term brand memories by looking at the three picture sorts together. We would use the data from having respondents sort pictures on their screen based on attention and short-term memory, reported positive or negative emotion, and the strategic meaning triggered by each image. However, for this study we will be looking at the linkage to long term memory one variable at time.

© 2017 Ameritest/CY Research, 4841 Tramway Ridge Drive NE, Albuquerque, NM 87111, www.ameritest.com
6
Flow of Attention Example:
Flow of Emotion Example:
So, at the end of the year we had two levels of information in our database from the data. One, a complete, in-depth set of test data on ads representing one-year’s investment in advertising in creative content for what was, at the time , the second-most heavily advertised TV category in the U.S. Two, a “sub-space” of over 5000 images from those ads which is virtually all the national “paid for” images from that category. Each image was a potential seed that could grow the brand in consumer memory. Like a fine wine, that data aged in our computers until nine years later someone had a bright idea! The question was simple, “What images would we still find if we probed consumer memories so long after the advertising ran?”

© 2017 Ameritest/CY Research, 4841 Tramway Ridge Drive NE, Albuquerque, NM 87111, www.ameritest.com
7
2017: Image Level Memory Tracking In May of 2017 we conducted a follow-up study among 5500 respondents, matched the sample demographically to the previous study and used the same panel supplier, Research Now. The stimuli used in this new research were the same 4,050 (unbranded) still images originally pulled from all 268 ads. In addition, we also tested 30 complete ads in storyboard form, using the 8 best remembered images from each ad to construct the storyboard. Half the storyboards were from high performing ads in the Ameritest system and half were from low performing ads. For the Memory Test each respondent was interviewed for fifteen minutes and saw a random sample of 20 pictures drawn from the category set and asked if they recognized seeing it before in any fast food advertising, and if so, which brand they associated it with.
Findings 1. This research proves that the assumption that most Marketing Mix Models make that advertising memories decay very quickly is false. According to Bill Harvey, a well-respected innovator in media research, “All the MMM modelers I ever worked with on ROI all use a curve based on Ebbinghaus forgetting of nonsense syllables (1885) which removes most of the ad memory after 48 hours. This is what drives most of the Jones/Ephron work on recency theory. I once asked if we could establish the actual curve for a given ad empirically and although the answer was yes I never got the money to do the work.” Knowing the rate at which memories of an ad decay is important because it guides the modeler’s assumptions about how to solve the equation: Short Term Sales + Long Term Sales Contribution = Total Ad ROI. Ads that decay more slowly can be reasonably hypothesized to make a greater contribution to sales over a longer period of time. Which in turn results in a greater return in the advertising investment. The data from this study confirms that the memory effects of advertising can be quite long lasting. It is true that advertising memories do begin to fade quickly after exposure, though this is a combination of selective attention as well as forgetting. However, nine years after exposure, the consumers average recognition level is still 12.5% and only 31% of images getting zero remembering.
This finding is particularly relevant for marketers today who worry that advertising on the internet has become too short term in its focus on a transactional relationship with the consumer that may come at the expense of long-term brand building. Advertising appears to have a long tail of brand-linked memories rewarding the initial marketing investment.

© 2017 Ameritest/CY Research, 4841 Tramway Ridge Drive NE, Albuquerque, NM 87111, www.ameritest.com
8
2.Not only are long-term ad memories plentiful, they are predictable. It’s well-established science that memory is hierarchical. We can intuitively see this if you think about the experience of walking out of a theater with some scenes from the movie you just saw re-playing vividly in memory, while other scenes are quickly fading. The reason for this is that our Experiencer Self, to use Kahneman’s term, weighs one moment of experience equally with the next. However, our Remembered Self sorts that experience into peak memories and endings, which is the basis of storytelling. The Flow of Attention graph, shown above, captures the hierarchical nature of memory in a time series graph. A peak memory is formed from advertising film roughly every 5-7 seconds. This has proven to be a powerful diagnostic for predicting attention-getting power and brand-linkage. It also turns out to be key to predicting long-term brand memory formation. The hierarchy of memories that we can identify ten minutes after showing respondents an ad is surprisingly well-preserved even after nine years of forgetting time. The images that stood out were also most likely to be the strongest memories in the long-term memory test.
Other variables affect long-term memorability. This includes the other performance characteristics of an ad (e.g. message and emotion), media spend and what competitors are doing. Nevertheless, the relevant news for marketers is that it’s easy to predict what specific images are most likely to last long in consumer memory from a simple memory test that can be performed a few minutes after watching an ad. 3. Long term ad memories are driven by ad quality. One of the most widely-used measures of ad quality is a five-point purchase intent scale. For this set of fast food ads, two versions of this scale were used. The first measured intent to visit the restaurant based on the advertising and the second was intent to buy the specific product featured in the advertising. For both measures of motivation, there is a strong correlation between motivation and long term memory.
Data for intent-to-visit:

© 2017 Ameritest/CY Research, 4841 Tramway Ridge Drive NE, Albuquerque, NM 87111, www.ameritest.com
9
Data for purchase intent:
Purchase Intent has been validated as a simple predictor of short-term sales across a wide variety of categories. This finding indicates that it is also a useful predictor of the kind of advertising that will build long-term brand value. 4. One of the most important variables driving long-term ad memory formation is emotion. Generating a spike in emotional response at key moments in an ad video is one way to create a peak brand memory. In creating the hierarchy of memories that guide our decision-making, the level of emotion associated with a particular moment is a marker of memory strength. This is such a strong effect that special equipment is not needed to see it. Self-reported audience emotions are, by themselves, quite predictive of memorability.
It remains to be seen from some of the newer methods from science (i.e. facial response, skin conductance, response time measurement) how much we can improve on this predictability. But, as we will see below in our work with EEG, combining these simple picture sorting methods with more advanced scientific technique can be productive. 5.There are winners and losers in the fight for share of consumer memory space in each category. For each image they remembered in the 2017 test, respondents were asked which fast food brand they associated with that image. While the majority of images were associated with the correct brand, many images from that year were associated with the wrong brand due to poorly branded ads.

© 2017 Ameritest/CY Research, 4841 Tramway Ridge Drive NE, Albuquerque, NM 87111, www.ameritest.com
10
Of course, misattribution works in both ways. A given brand receives credit for some images they did not run, while other images that actually were in their ads were incorrectly linked to a competitor. By adding and subtracting, we can calculate the share-of-memory for each brand in the QSR category for 2009 as follows:
By comparing share-of-memory to share-of-voice (here we are using share-of-ads run as a surrogate for share-of-media spending since we did not have access to that data) we have a simple way of calculating the net efficiency of each brand’s TV campaign for the year.
The big winner for the battle for consumer memory that year was Sonic. McDonald’s was a net loser that year because their share-of-memory was less than their share-of-voice. 6. By comparing the memories retrieved with storyboards with memories activated by individual images, this study provides new insights into the structure of ad memories and how they are built up over time. Ordinarily, advertising tracking studies use either a storyboard or an edited video clip as a stimulus to measure the awareness of specific TV advertising. But with ads being recut and repurposed for use on social media and other

© 2017 Ameritest/CY Research, 4841 Tramway Ridge Drive NE, Albuquerque, NM 87111, www.ameritest.com
11
platforms, knowing which particular execution a respondent saw is increasing difficult. Was that the :15 second or :30 second version of the ad they remembered? Moreover, the accuracy of tracking with storyboards/video clips depends on the researcher’s judgement as to which images to leave in to cue the memory of the ad and which images to leave out. The research problem can be seen by comparing consumer memory when it is cued by a storyboard with the memorability of the images that go into that storyboard. It’s a bit like looking at the protons, electrons and neutrons inside the structure of an atom.
The best predictor of the long-term memorability of the storyboard was the average of the eight frames selected to be in the storyboard. However, that explained only 31% of the variation in memory. Hence the accuracy of a

© 2017 Ameritest/CY Research, 4841 Tramway Ridge Drive NE, Albuquerque, NM 87111, www.ameritest.com
12
tracking study’s measured ad awareness appears to be strongly influenced by the choice of which images to include. What are we to make of the fact that some images are much better recalled when seen as an individual image than when embedded in the structure of a storyboard? The most likely explanation is that some of the images, or very similar ones, also appeared in other ad executions, which in turn increases that particular image’s chances of being seen and remembered by consumers. This provides insight into how new advertising memories may be added to existing brand memories and to the formation of “advertising equities” that propagate as memes through successful ad campaigns. Examples of equities from these three ads:
These images were the most memorable elements of the storyboard. This is most likely because they were already familiar to the consumer from other advertising. As a hypothesis, these are the “sticky” parts of the ad to which new information and original content can be most easily linked to existing consumer memories. By looking at ad memories at both levels, the storyboard level of the advertising vehicle and the more granular level of the memory-image, it should be possible in future research to explore the interaction and the optimal balance between familiar brand equities and the new and original elements of effective advertising executions. 7. The image-level approach can be used to measure the strength of different memories and identify specific
visual ad imagery that may be concentrated in different target audiences. With information obtained from image-level data, it's possible to "see" what's already in the heads of consumers in different audience segments. This is the "backstory" of where the consumer is "coming from" as they react to any new advertising developed for the brand. To illustrate, let's look at fast food memories from 2009 that are more likely to be found in the memories of men versus women. Men are more likely to remember fully loaded burgers from Burger King (the press reported that young men were BK's specific target audience that year).

© 2017 Ameritest/CY Research, 4841 Tramway Ridge Drive NE, Albuquerque, NM 87111, www.ameritest.com
13
While women were more likely to remember images of health sandwiches from Subway.
From this kind of visual memory-audit, it’s not difficult to infer which type of memories are more motivating for these two audiences.
8. This data can be used to investigate the role in brand-building of each of the three major memory systems in the brain: semantic, episodic and procedural/implicit memory (at Ameritest we call “Head Heart Hand”). One of the reasons recall testing fell into disfavor was its limitations in terms of dealing with the true complexity of memory. With a word based approach, recall is primarily a measure of semantic memory. This is what we might think of as school book learning. There are three main memory systems in the brain, identified by Endel Tulving a generation ago. For academics, the three types are semantic, episodic and procedural/implicit memory. For advertisers, Ameritest calls them “Head”, “Heart”, and “Hand.” In this research, we coded different visuals based on the dominant type of memory we thought each particular image was likely to create. This research is part of our process of validating that classification system.
Classification System
Head-targeted (i.e., semantic) memories pertain to the World of Ideas. This includes mostly text-based content (i.e. headlines and supers, descriptions of features and benefits, value offers, etc. ) It’s the job of the advertising Strategist to figure out how to get into the consumer’s Head. Examples of what we coded as Head-target visuals:
Heart-targeted (i.e., episodic) memories pertain to the World of Society. This is the realm of storytelling and character. These kinds of memories are autobiographical, tied to one’s unique point-of-view, and help define our sense of Self. (These are the kinds of memories lost to Alzheimer’s disease.) It’s the job of the advertising Writer to get into the Heart of the consumer.

© 2017 Ameritest/CY Research, 4841 Tramway Ridge Drive NE, Albuquerque, NM 87111, www.ameritest.com
14
Examples of what we coded as Heart-target visuals:
Hand-targeted (i.e., procedural/implicit) memories pertain to the World of Physical Senses. This is the realm of sensation and action, music and art and product-in-use demonstrations. These are the memories that “touch” us. It is the job of the Artist to create the sensory touchpoints that enable the ad to shake Hands with the consumer. Examples of what we coded as Hand-target visuals:
When we first tested the QSR ads in 2009 we coded only the peak memories into the three memory types. What we found that year was that the most motivating strategy for brands was to target the Hand with product appeals to the physical senses. The most common, but least motivating strategy, was to target the Head with price offers and deals, etc.

© 2017 Ameritest/CY Research, 4841 Tramway Ridge Drive NE, Albuquerque, NM 87111, www.ameritest.com
15
When we tested all the ads in the fast food category the preceding year, 2008, the winning strategy had been more storytelling-type ads, targeted to the Heart. The losing strategy was, again, targeting the Head. So it appears the advertising marketplace adapts to what the winners are doing. For this long-term memory validation project, we coded all of the frames for the same subset of 30 ads we tested in 2017 with storyboard cues. These 30 were selected so that half of the ads were very strong, scoring above average on our key report card metrics of Attention/Branding/Motivation. The other half the ads were very weak, scoring below average on our key metrics. Our objective was to understand how these three different memory types decay over time and how that is related to advertising performance.
If we look at the HHH distribution of images across these ads, we can see that the total image content (i.e. all the pictures in the ad, not just the peaks) is heavily skewed toward the Heart type image:
At the end of nine years, the distribution of memories shifted somewhat to a more balanced distribution.
As an explanation, we hypothesize that Heart-targeted memories decay more quickly because they are generated by storytelling-type ads which follow a rhythmic peaks and valleys narrative structure. Memory is hierarchical, so peak memories in the short term tend to last into the long term. However, the “connecting tissue” of other scenes are quickly forgotten. This would explain the higher rate of memory decay or forgetting in Heart-directed imagery. (To reinforce such memories may be the reason we like to tell the same stories over and over again.) How does this relate to advertising performance and long-term memory? If we look at ads split by performance on our standard report card measures, we see a little more nuance. For both high performers and low performers in this subset of thirty ads, content skews towards the Heart. However, the best performers take it further and spend less time on Head-targeted information.
© 2017 Ameritest/CY Research, 4841 Tramway Ridge Drive NE, Albuquerque, NM 87111, www.ameritest.com
16
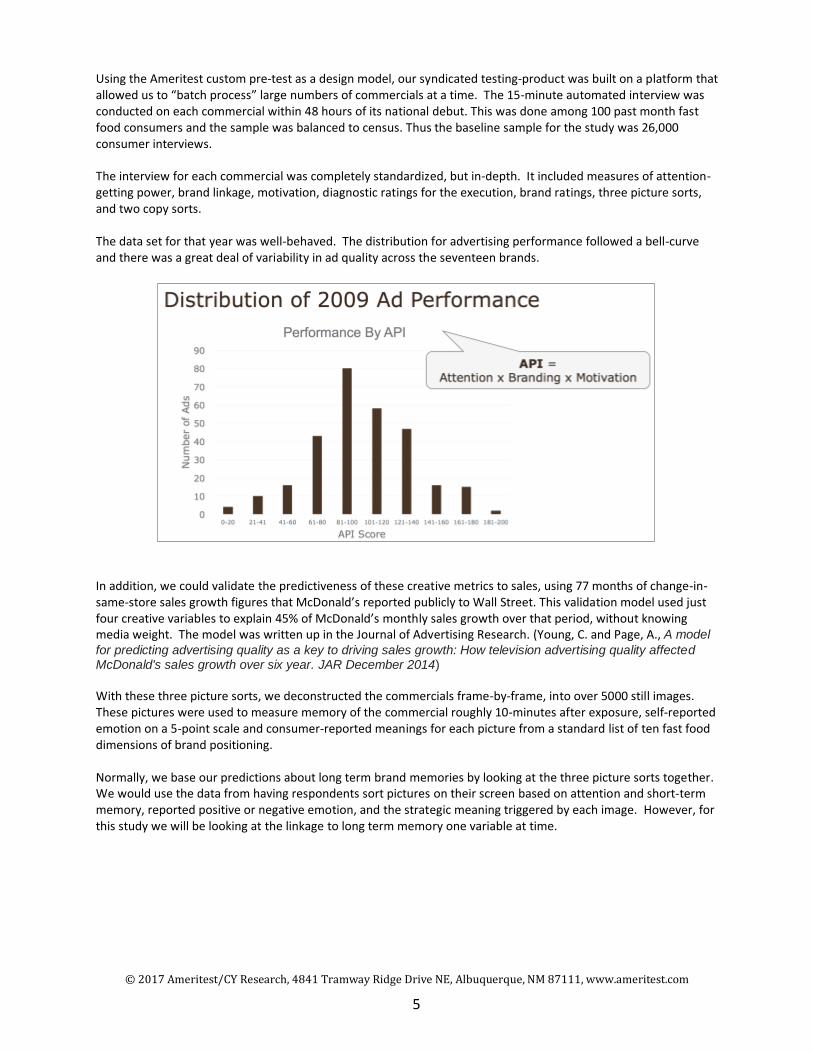
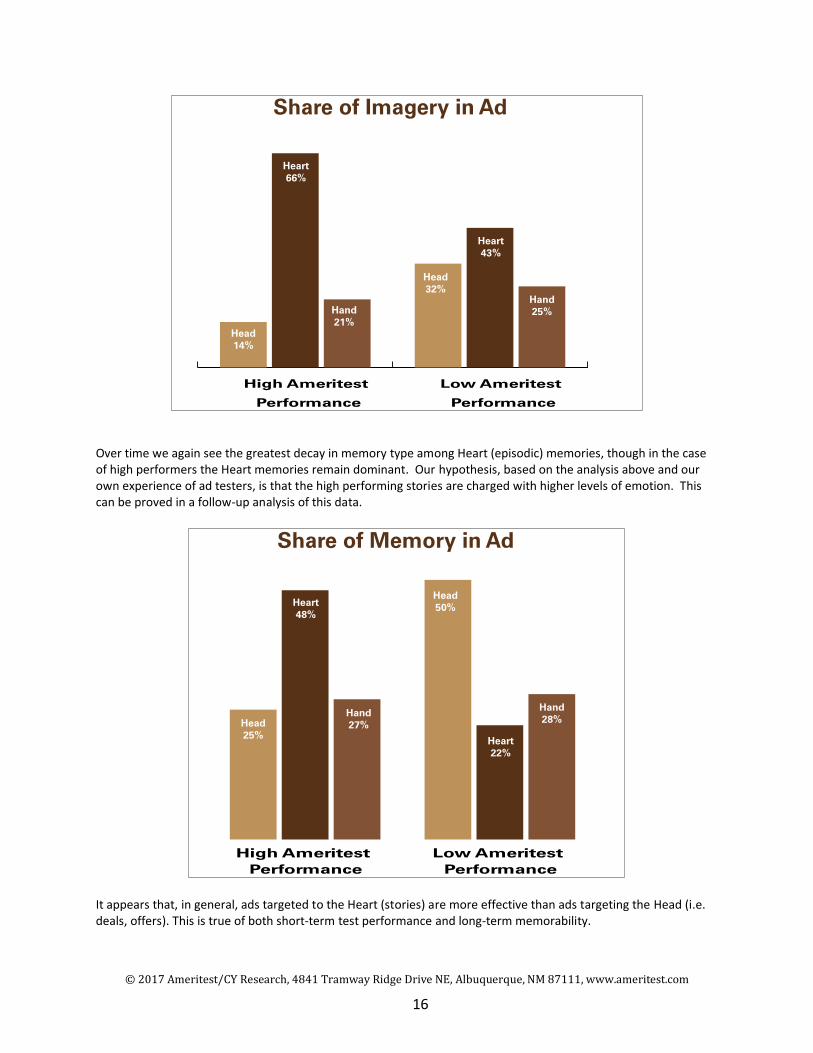
Over time we again see the greatest decay in memory type among Heart (episodic) memories, though in the case of high performers the Heart memories remain dominant. Our hypothesis, based on the analysis above and our own experience of ad testers, is that the high performing stories are charged with higher levels of emotion. This can be proved in a follow-up analysis of this data.
It appears that, in general, ads targeted to the Heart (stories) are more effective than ads targeting the Head (i.e. deals, offers). This is true of both short-term test performance and long-term memorability.

© 2017 Ameritest/CY Research, 4841 Tramway Ridge Drive NE, Albuquerque, NM 87111, www.ameritest.com
17
9. This study also demonstrates a way to integrate new neuroscience techniques with survey ad research methods. As a step towards combining picture sort, self-report data with machine-based measurements of consumer response, Ameritest collaborated with Sand’s Research, a leading supplier of EEG measurement to advertisers. Together we studied nineteen of these commercials with a sample of 24 test subjects using 325 unbranded images to cue memory. What we found was that combining the two techniques improved our ability to predict long-term memories.
The next step in this part of the project (to be reported in a follow-up paper) is to compare moment-by-moment brain wave activity when a respondent is first watching an ad, to brain activity at the point of memory retrieval, when respondents is retrieving memories of specific images from the ad with a picture sort task ten minutes later. 10. This study demonstrates that it’s now practical to track not only ad awareness but image-level memories at the category level. A few years ago, before all the tools were developed for managing pictures and videos on the internet were developed, this kind of research project would’ve been difficult. Frame-grabbing thousands of still images from hundreds of videos and serving them up randomized in a statistical block design in short interviews on a mobile device would’ve been considered quite unwieldy. Now this is just another tool in the researcher’s toolkit. While

© 2017 Ameritest/CY Research, 4841 Tramway Ridge Drive NE, Albuquerque, NM 87111, www.ameritest.com
18
collecting the data is straightforward these days, making sense of all that picture data requires researchers to use a number of standard statistical analytic methods for digging deeper. For our next steps in analyzing this dataset, we plan to use hierarchical clustering programs on the image data to further explore the hierarchical nature of memory. We also plan to use multi-discriminate analysis to identify the best key visuals from memory that separate one target audience from another (i.e. customers from non-customers). We want to better understand the advertising backstory of the brand so that creatives can work with developing new ads tailored to that specific audience.
Conclusion and Invitation Memory is a complex subject. Of course, that’s an understatement. Master marketers aren’t just good at engaging the attention of their audience, they are also good at creating memories that last. The real point of this study is to remind us how much there is still to be learned about how the brain converts engagement with advertising in the Experiencer Self into branded memories that live in the Remembered Self. This close is a conclusion with an invitation: we invite the professional reader to play with this memory data yourself. We ask you to replicate our analysis, or more usefully, to do your own analysis and draw your own conclusions. At the end of this year we will be making available to the advertising research community at large the full Ameritest dataset described here. This will be done using the Advertising Research Foundation as a collaboration platform. To find out how to access this database, please contact Chris Bacon at the ARF: [email protected].
References & Readings ARF Conference Presentation: “The Long Tail of Advertising” (June,2017) Beilock, Sandra, How the Body Knows Its Mind Civaschi, M. and Milesi, Gianmarco, Film in 5 Seconds Du Plessis, Eric, The Branded Mind Eagleman, David, The Brain: The Story of You Hofstadter, Douglas, Surfaces and Essences Kahneman, Daniel, Thinking Fast and Slow Kurzweil, Ray, How to Create a Mind Linden, David, Touch: The Science of Hand, Heart and Mind Minsky, M., Society of Mind Shannon, Claude, The Mathematical Theory of Communication Sharpe, Byron, How Brands Grow (vol 1 &2) Shaw, Julia, The Memory Illusion Simon, Herbert, The Sciences of the Artifical Tulving, Endel, Elements of Episodic Memory (Oxford Psychology Series) Tulving, Endel, Oxford Handbook of Memory Young, Charles, Handbook of Advertising Research Young, Charles, Branded Memory Young, Charles, How to Analyze an Ad Young, C. and Page, Adam., A model for predicting advertising quality as a key to driving sales growth: How
television advertising quality affected McDonald's sales growth over six years