the swing voter’s curse in social networks
TRANSCRIPT

The Swing Voter’s Curse in Social Networks∗
Berno Buechel† & Lydia Mechtenberg‡
August 19, 2019
Abstract
We study private communication in social networks prior to a majority vote on two
alternative policies. Some agents receive a private imperfect signal about which policy is
correct. They can, but need not, recommend a policy to their neighbors in the social net-
work prior to the vote. We show theoretically and empirically that communication can
undermine efficiency of the vote and hence reduce welfare in a common-interest setting.
Both efficiency and existence of fully informative equilibria in which vote recommen-
dations are truthfully given and followed hinge on the structure of the communication
network. If some voters have distinctly larger audiences than others, their neighbors
should not follow their vote recommendation; however, they may do so in equilibrium.
We test the model in a laboratory experiment and find rather inefficient equilibrium
selection. Based on this result, there is support for the comparative statics of our model
and, more generally, for the importance of the network structure for voting behavior.
JEL-Code: D72, D83, D85, C91.
Keywords: Strategic Voting, Social Networks, Swing Voter’s Curse, Information Aggrega-
tion
∗We thank Marina Agranov, Francis Bloch, Jordi Brandts, Yann Bramoulle, Dirk Engelmann, ManuelFoerster, Matt Jackson, Dominik Karos, Shuo Liu, Friederike Mengel, and Jean-Robert Tyran for helpfulcomments. Moreover, we thank the participants of the conference on “Information Transmission in Networks”at Harvard University, the participants of the public economic theory (PET15) conference in Luxembourg,the Lisbon Meeting in Game Theory and Applications 2015, the SSES Annual Congress 2016 in Lugano, theCoalition Theory Network (CTN) workshop 2016 in Moskau, the SAET conference 2017 in Faro, and theWarwick/Princeton/Utah Political Economy Conference 2019 at Warwick in Venice, as well as the seminarparticipants at Caltech, in Cologne, Hamburg, Konstanz, Marseilles, Regensburg, Stanford and Zurich. Wethank Willi Flemming for excellent research assistance. Berno Buechel gratefully acknowledges the hospitalityof the Economics Department of Stanford University and the financial support by the Fritz Thyssen Foun-dation. Lydia Mechtenberg gratefully acknowledges the hospitality of the Institute for Economic Analysis(IAE) in Barcelona and the hospitality of Caltech in Pasadena.†University of Fribourg, Department of Economics, bd. de Perolles 90, CH-1700 Fribourg, Switzerland;
Email: [email protected]. Web: www.berno.info. Declarations of interest: none.‡Corresponding author. University of Hamburg, Department of Economics, von-Melle-Park 5, D-20146
Hamburg, Germany. Phone: +49 40 42838 9484. Email: [email protected]. Decla-rations of interest: none.
1

1 Introduction
Motivation. Majority voting is a major form of collective decision making. As such, it
is intensely studied in political economy. However, traditionally the literature has ignored
pre-vote communication, although in reality, people often receive advice before they vote.
For instance, family members, neighbors or Facebook friends who are more deeply inter-
ested in politics or better informed might try to convince others to vote like them. Vote
recommendations seem to be frequent: Approximately 30% of the U.S. population report
that they give vote recommendations to their peers often or sometimes (see Carpini et al.,
2004, p. 323). Hence, the question arises whether pre-vote communication is harmless or
even desirable, or whether such communication can be harmful. In the past two decades,
there have been several theoretical and experimental contributions to this issue, ranging from
studying straw polls (Coughlan, 2000; Guarnaschelli et al., 2000) to studying all cheap-talk
extensions of voting games (Gerardi and Yariv, 2007; Goeree and Yariv, 2011; Iaryczower
et al., 2018). A central insight is that public communication among voters with sufficiently
aligned preferences leads to efficient information aggregation due to deliberation of private
signals (Coughlan, 2000, Austen-Smith and Feddersen, 2006, Gerardi and Yariv, 2007, and
Goeree and Yariv, 2011). However, pre-vote communication need not be public, but can also
be – at least partly – private, as illustrated by the examples above.1
We focus our analysis on vote recommendations that are provided in one round of (partly)
private communication. We show that this form of pre-vote communication can impede
efficient information aggregation even if voters are sophisticated and interests are perfectly
aligned. We restrict our analysis to a common-interest setting to take the assumption to the
extreme that voters’ preferences are sufficiently aligned to allow for truthful communication.
Thus, we demonstrate a negative effect of communication that is, other than in the cheap-talk
literature, not due to limited degrees of truthfulness or to conflicting interests, but rather to
the exogenous structure of the communication network. Hence, our setting predominantly
applies to large elections, involving a high degree of uncertainty, and concerning a “common
good” like national security or growth or, in the case of shareholder votes, the future of the
company in question.2
A negative effect of private pre-vote communication on efficiency can occur if the social
network connecting voters who are imperfect experts on the issue at stake with other voters
is not sufficiently balanced. In insufficiently balanced networks, some voters have a somehow
larger audience than other voters without having much better information. In some such
networks it is an equilibrium strategy to follow the vote recommendations one receives.
Hence, wrongly informed voters may get too much weight in the vote. Then, the voting
1Iaryczower et al. (2018) study all communication equilibria of a jury-voting game when jury members’utility functions have both common-interest and private-interest components. They find positive and negativeeffects of deliberative communication. In a setting of naıve learning among non-strategic voters, Golub andJackson (2012) show that private communication in homophilous networks can undermine efficient informationaggregation in the intermediate term. Outside the literature on information aggregation, Agranov et al. (2017)and Palfrey and Pogorelskiy (2017) study public and private pre-vote communication. In their settings,communication reveals information on preferences or intentions to turnout, which affects actual turnout.
2In an extension, we show that our results are robust to the introduction of propaganda by voters withextreme biases (“partisans” or “trolls”).
2

outcome is less efficient than it would have been in the absence of pre-vote communication.
We show that this result is robust: It even holds true if the number of informed voters goes
to infinity.
Since our theoretical analysis is restricted to two focal types of equilibria (one with giving
and following vote recommendations and one with voting according to one’s signal when in-
formed and abstaining otherwise), we conducted a laboratory experiment to test our focality
assumption and to investigate equilibrium selection in different networks. The second pur-
pose of the experiment is to investigate how subjects account for the inefficiency mentioned
above, in particular, whether uninformed voters follow vote recommendations of informed
voters less often if the latter have an oversized audience. The laboratory data validate our
focality assumption, with more coordination on giving and following vote recommendations
than on voting according to one’s signal when informed and abstaining otherwise. We find
that individual behavior is largely in line with the comparative statics of our theory: Giving
and following vote recommendations becomes less frequent when the network is unbalanced.
On the collective level, there are more differences between our comparative statics and empir-
ical group behavior, but our data reveal that in the laboratory, too, truthful communication
sometimes impedes efficient information aggregation.3
To better understand when and why vote recommendations can be harmful and when
they are harmless, consider communication networks in which imperfectly informed voters
give vote recommendations to their neighbors. Such a communication stage is introduced
into a standard common-interest voting game. Nature draws the binary state of the world
and the signals that voters receive on the true state. Both states of the world are equally
likely. Each informed voter receives only one signal, and signals are independent across
voters. Some voters have audiences of one or more other voters and can send one out of
two possible messages, which can be interpreted as vote recommendations, to their audience
or keep silent.4 Then, a vote takes place to decide which of two possible policies shall be
implemented. Only the policy matching the true state of the world generates a strictly
positive payoff for all individuals (the other policy generates a zero payoff for everyone).
Voters individually and simultaneously decide between voting for one or the other policy
and abstaining. Voting is costless.5 The policy that gets a simple majority of votes is
implemented. In case the voting outcome is a tie, the policy to be implemented is randomly
drawn, where both policies have equal probability. Voters are strategic; i.e., they condition
their behavior on pivotality.
A focal strategy in this setting is to recommend the policy indicated by one’s own sig-
nal and to vote according to one’s updated belief about the “correct” policy. We call this
strategy sincere behavior and investigate when it is an equilibrium and when efficient. Con-
3We also conducted a second laboratory experiment testing the same model, extended by partisans (ortroll senders), with different social networks. Our findings from the second experiment, which we refer to asStudy II, corroborate the picture painted from the main experiment. For further detail, see section C.3 inthe supplementary online material (SOM).
4In our set-up, the chosen message space is rich enough to convey all information.5With costs of voting, the pivot probability which might change across equilibria in different networks
would affect the willingness to abstain. Since we want to isolate the effects of communication on votingbehavior, we abstract from voting costs. In the laboratory, costless voting makes the “willingness to delegateto the expert” harder to find and hence more surprising.
3

sider an informed voter whose audience – consisting of her neighbors in the network – is a
substantial part of the voting population, i.e., she is a well-connected sender. In a model of
naıve social learning, her audience would simply follow this sender’s vote recommendation,
rendering her an opinion leader whose influence undermines efficient learning (e.g. DeMarzo
et al., 2003; Golub and Jackson, 2010). In contrast, we consider behavior of Bayesian up-
daters who are strategic agents: Being pivotal with a vote that follows the well-connected
sender’s recommendation implies that many voters from the rest of the population voted for
the opposite, which implies, in turn, that they had information contradicting the sender’s
recommendation. Hence, conditioning on pivotality, it is more likely that the vote recom-
mendation of the sender is based on wrong rather than correct information. More generally,
in unbalanced networks in which the power to influence opinions is insufficiently justified by
the expertise of the sender, sincere behavior is neither informationally efficient nor equilib-
rium behavior. However, we state as a main result that there are communication networks
(denoted as weakly balanced, but not strongly balanced) such that sincere behavior is both
an equilibrium and informationally inefficient. In Appendix A.2, where we generalize our
model to arbitrary networks, we prove that our results are robust and neither existence nor
inefficiency vanish in the limit (when the network of voters grows ad indefinitum with the
structure preserved).
An important feature of our model is that the exogenously given network structure only
determines the system of communication channels that can potentially be used, while there is
always an equilibrium without communication. Indeed, there is an alternative focal strategy:
Voters who are better informed than others vote for the policy indicated by their signal
and the others abstain. In line with the literature, we call this strategy “let the experts
decide” (henceforth: LTED).6 Importantly, we show that LTED is efficient, independent
of the network structure. Hence, in a class of weakly but not strongly balanced networks
the problem of efficiency becomes one of equilibrium selection between sincere behavior and
LTED, which is essentially an empirical question.
Testing our theoretical predictions in the laboratory experiment, we find that (i) collec-
tively, groups switch more often from sincere to LTED if the network becomes unbalanced,
but that (ii) sincere behavior still occurs frequently even in unbalanced networks, causing
a (weak) loss in efficiency, compared to balanced networks. (iii) Individually, uninformed
voters are indeed more inclined to abstain when they are in an unbalanced network (and
hence listen to a powerful sender) and (iv) informed voters tend to pass on their signals to
their audience but become more reluctant to do so when they are, in an unbalanced network,
a sender with an oversized audience. In the experiment, there is loss in informational effi-
ciency when the communication network becomes unbalanced. Intuitively, the less balanced
the network structure, the less balanced is the power to influence opinions such that the
final outcome is determined by the messages of a few agents, in contrast to the Marquis
de Condorcet’s original idea of aggregating information in the entire collective (De Caritat,
1785).
6See, e.g. Morton and Tyran (2011).
4

Related literature. Condorcet’s argument that majority voting among independently in-
formed voters efficiently aggregates private signals, i.e., his “Jury Theorem,” is a cornerstone
of the justification of the majority rule, and, even more generally, of making collective de-
cisions by voting. His argument has been seriously challenged by Austen-Smith and Banks
(1996) and Feddersen and Pesendorfer (1996, 1997, 1998) who study voters as strategic ac-
tors. As they show, to vote in line with one’s private information, i.e., to “sincerely” cast the
vote for the alternative that maximizes unconditional expected utility, is not automatically
an optimal action. When restricting attention to the cases in which one’s own vote is deci-
sive, the resulting conditional expected utility may be different. Hence, we assume strategic
voting when solving our model, but also address the question when sincere and strategic
voting lead to the same behavior.
In the absence of communication, Feddersen and Pesendorfer (1996) find that it is opti-
mal for rational voters with common interests to abstain if they are uninformed and to vote
in line with their independent private signal if they are informed.7,8 This LTED behavior not
only forms an equilibrium, but also exhibits informational efficiency. In their experimental
study of the model of Feddersen and Pesendorfer (1996), Battaglini et al. (2010) find that
this equilibrium provides a good prediction of real behavior. Morton and Tyran (2011) have
extended the model of Feddersen and Pesendorfer (1996) to include heterogeneity in infor-
mation quality among the informed voters and find that less well-informed voters generally
tend to abstain and delegate the collective decision to the better informed voters. Hence,
the tendency to “delegate to the expert” seems quite strong in the laboratory. This sug-
gests that the LTED equilibrium might be a good prediction even in more general models of
information aggregation by majority votes. Accordingly, we consider it to be a benchmark
equilibrium in our model, too.
However, efficiency of information aggregation hinges on the assumption that all partici-
pating voters enter the majority vote with independent private pieces of information – which
is fulfilled in the standard model of common-interest voting.9 But the picture becomes
more complicated when a mechanism is introduced that leads to correlated information
among voters, despite their private independent signals. Pre-vote communication is clearly
one important source of correlation.10 Coughlan (2000) and Austen-Smith and Feddersen
7Since Feddersen’s and Pesendorfer’s ingenious contribution, the finding that uninformed voters in acommon-interest setting are better off abstaining from the vote has been dubbed the swing voter’s curse.More generally, a voter is “cursed” if his optimal strategy conditional on his pivotality differs from what hewould deem optimal if he did not condition his strategy on being pivotal, i.e., what he would choose as adictator. We adopt this way of speaking.
8If one deviates from the assumption of common interests by introducing a number of “partisans” whoalways vote into a pre-specified direction, then abstention does no longer need to be the optimal strategy ofthe uninformed voters.
9Levy and Razin (2015) provide a model on informed voting which includes heterogeneous preferencesamong voters, different sources of information for each voter and voters who neglect the correlation betweentheir information sources. They show that correlation neglect may improve the informational efficiency of thevote since it makes voters put more weight on information than on the conflict of interest.
10In a recent theory paper, Battaglini (2017) allows for communication between citizens in separate au-diences so that information becomes correlated among the citizens in one audience. However, in his model,citizens cannot vote on policies directly but coordinate on public protest instead, potentially signing a petitionagainst the policy maker’s default policy. Battaglini shows that communication in social media can improveinformation aggregation and transmission via public protests.
5

(2006) find that deliberation under the majority rule fosters efficiency when preferences are
sufficiently aligned. Guarnaschelli et al. (2000) validate this insight experimentally taking
Coughlan (2000)’s straw poll to the laboratory. Much more generally, Gerardi and Yariv
(2007) study sequential equilibria that are implementable by a centralized mediator, which
is outcome equivalent to studying all cheap-talk extensions of the voting game and hence
covers arbitrary communication protocols. In an application, they show that one round of
public messages prior to the vote admits the same set of (sequential) equilibria for a whole
set of voting rules. Intuitively, the information aggregation that the vote has to achieve in
the standard model is shifted up the game tree and is now obtained in the communication
stage already. This effect finds strong empirical support in a set of experiments reported in
Goeree and Yariv (2011).11
By contrast, introducing a public signal on the state of the world prior to the vote changes
the picture dramatically. Kawamura and Vlaseros (2017), Liu (2019) and Jeong (2019) find
that the presence of a public signal generates a new class of equilibria in which voters
discard their private information in favor of the public signal and information aggregation is
inefficient, even if voters condition their strategy on pivotality.12
We consider a third way of correlating voters’ information in the standard model of
common-interest voting: private communication between voters in the form of vote recom-
mendations. To our knowledge, private communication before voting in a common-interest
setting has so far been modeled either implicitly by studying (with a mediator) all cheap-talk
extensions of the voting game (Gerardi and Yariv, 2007; Iaryczower et al., 2018) or as re-
peated exchange among naıve voters who do not condition on pivotality (Golub and Jackson,
2012).13 We show that the way in which private communication affects information aggrega-
tion is different from the effects of public communication: Although efficient equilibria always
exist (in particular, the LTED equilibrium), there are also equilibria (in particular, the sin-
cere equilibrium) in which information is inefficiently aggregated, given that the network is
not strongly balanced. The latter equilibria and their corresponding “sincere” strategies are
more frequently played in the laboratory than the former. Hence, private communication
indeed undermines informational efficiency if some voters are too powerful communicators.
After generalizing the model to admit all possible network structures, our model incorporates
11By implementing free text communication in the laboratory, Goeree and Yariv (2011) can study whichkind of communication emerges. They find that participants choose public communication, first to revealtheir private information (deliberation), then to prepare decision making. This fosters efficiency, as predictedby the theory on deliberation with public communication above. Hence, the study of private informationapplies to settings where there are exogenous restrictions on the communication channels (such as in largeelections).
12Somewhat relatedly, the literature on hidden profiles reports that in group discussions prior to groupdecisions, information shared with other group members gets too much weight compared to unique privateinformation. See, e.g., the meta-study by Lu et al. (2012).
13When admitting arbitrary communication protocols, Iaryczower et al. (2018) demonstrate positive andnegative effects of pre-vote communication on information aggregation in a jury. For a society of naıve learners,it is known that information aggregation is inefficient in the long term when some agents are overly powerful(Golub and Jackson, 2010). In their application of the homophily theory to voting, Golub and Jackson(2012) assume that every voter has the same expected number of links and is hence equally influential. Theninformation aggregation is efficient in the limit, but not necessarily in the intermediate term: They show thatinefficiency can arise, when there are multiple groups with more links within group than across groups (i.e.,homophily) and when the signals are not distributed equally across groups.
6

vote recommendations that are both private and public, and hence builds a bridge between
private communication and public communication in the form of vote recommendations.14
Organization of the paper. In the next section, we introduce a simple model of vote
recommendations, restricting our analysis to a specific subset of communication networks
and to homogeneous signal qualities. We characterize conditions on the network structure
under which the two focal strategy profiles, i.e., sincere behavior and LTED, are equilibria.
In section 3, we present the design of the laboratory experiment and in section 4, we report
the experimental results. In section 5, we conclude. In Appendix A.2, we analyze the general
model with arbitrary networks and heterogeneous signal precisions and prove our theoretical
results. In the supplementary online material (henceforth: SOM), we provide supplementary
mathematical results (in SOM B) and supplementary experimental material including the
instructions (in SOM C).
2 A Simple Model of Vote Recommendations
2.1 Set-Up
Nature draws one state of the world, ω, which has two possible realizations, A and B, that
occur with equal probability and are not directly observable. There is a finite set of agents
partitioned into a group of experts M and a group of non-experts N . Respective group
sizes are m = |M | and n = |N |. Experts j ∈ M receive a private independent signal
sj ∈ {A∗, B∗} about the true state of the world. The signal is imperfectly informative
with quality pj = Pr {sj = A∗ | ω = A} = Pr {sj = B∗ | ω = B} ∈(12 , 1). We preliminarily
assume that pj = p ∀j ∈ M and that non-experts i ∈ N do not receive a signal, but can
potentially receive a message from an expert. A graph g represents the communication
structure between non-experts and experts. We preliminarily assume that g is bipartite,
consisting of links (i, j) ⊆ N ×M only.15 Degree di is the number of links of agent i. An
expert j with dj ≥ 1 is called sender and all non-experts linked to j are called the “audience
of j.” Our final preliminary assumption is that different audiences do not overlap, i.e., the
degree of each non-expert is at most one, such that no agent can access more than one piece
of information.16 We will drop our preliminary assumptions in section 2.4 and Appendix A.2.
After receiving the signal, each sender may send message “A” or message “B” or an empty
message ∅ to her audience. Then, all agents participate in a majority vote the outcome of
which determines which of two alternative policies, PA or PB, shall be implemented. Voters
simultaneously vote for one of the two policies or abstain. If one policy obtains a simple
majority, i.e., a plurality, of votes, it is implemented; otherwise, the policy to be chosen is
randomly drawn with equal probability from the two alternatives.
14There are other forms of communication that we do not address in this paper. They include multi-roundcommunication, discussions about signal quality or reasoning, discussions about decision making, differenti-ated messages for different recipients, etc.
15The network is undirected since it represents the communication channels that can be potentially used.16This assumption assures that information aggregation can only take place in the voting stage but not in
the communication stage and hence is the natural counterpart to public communication and deliberation.
7
All experts and non-experts are assumed to be unbiased in the sense that they want
the policy to match the state of the world. More precisely, their utility is represented by
u(PA|A) = u(PB|B) = 1 and u(PB|A) = u(PA|B) = 0.17,18
The sequence of actions is as follows. First, nature draws the state of the world and the
signals of the experts. Second, each sender decides which message to communicate to her
audience, if any. Third, all agents vote or abstain and the outcome is determined by the
simple majority rule. The full description of the game including the network structure is
common knowledge.19
Strategies are defined as follows: A communication and voting strategy σj of a sender
j ∈M defines which message to send and whether and how to vote for each signal received,
i.e., σj : {A∗, B∗} → {A,B, ∅} × {A,B, ∅} if dj ≥ 1 and σj : {A∗, B∗} → {A,B, ∅} if dj = 0.
We can abstract from the timing of these two actions (communication and voting) here. A
voting strategy of a non-expert i ∈ N with a link is a mapping from the set of messages
into the voting action σi : {A,B, ∅} → {A,B, ∅}, and a voting strategy of an agent i ∈ Nwithout a link is simply a voting action σi ∈ {A,B, ∅}. A strategy profile σ consists of all
experts’ and all non-experts’ strategies.
We analyze this model using the concept of perfect Bayesian equilibrium, i.e., agents
use sequentially rational strategies, given their beliefs, and beliefs are updated according
to Bayes’ rule whenever possible. We focus on two strategy profiles, one with information
transmission (“sincere”) and one without information transmission (“let the experts decide”,
in short: LTED). These are the two strategy profiles predominantly discussed in the literature
on voting. Still, communication generally gives rise to a multiplicity of equilibria, and focality
of strategies is ultimately an empirical question. We address this question in our laboratory
experiments. It turns out that exactly the two strategy profiles that we focus on are the
relevant ones in the laboratory.
Note that if all non-experts in a given audience choose not to condition their voting
action on the message received, then the outcome of the game is as if communication was
not possible at all (“babbling equilibrium”). Similarly, if all non-experts in a given audience
vote B if the message is A and vote A if the message is B, then the outcome of the game
is as if their sender had chosen another communication strategy, where messages A and B
are permuted (“mirror equilibria”). We will not differentiate between mirror equilibria, i.e.,
differentiate equilibria on the basis of the syntax of information transmission. Instead, we
will identify equilibria via the semantics of information transmission, i.e., on the basis of the
meanings that messages acquire in equilibrium.20
A desirable property of an equilibrium is informational efficiency which is defined as
follows.
Definition 2.1. A strategy profile σ is efficient if it maximizes the ex ante probability of
17Here, we follow the convention to define cardinal utility levels, although this assumption is not necessary.18An extended model with heterogeneous preferences, in particular with biased agents who always favor
one of the two alternatives, is studied in SOM C.3.19Knowing the network structure prevents potential inefficiencies due to imperfect information about the
network structure.20This is standard in the cheap-talk literature starting with Crawford and Sobel (1982).
8

the implemented policy matching the true state of the world.
Observe that an efficient strategy profile σ maximizes the sum of ex ante expected utilities
of all experts and non-experts since they are unbiased. Given efficient strategy profiles, the
probability of matching the true state is maximized but not equal to one because it might
always happen by chance that many experts receive the wrong signal. Letting the number of
experts grow, this probability approaches one as in Condorcet’s Jury Theorem. Observe also
that in this simple setting an efficient strategy profile is characterized by always implementing
the policy indicated by the signal that has been received by most experts, which we call the
majority signal. For convenience, we let the number of experts m be odd such that there is
always a unique majority signal indicating the policy that should be implemented.21
While the definition of informational efficiency above is binary, strategy profiles can also
be ranked according to their informational efficiency by comparing their corresponding ex
ante probabilities of matching the true state.
Hereafter, we will slightly misuse notation by using “A” and “B” to denote the corre-
sponding state of the world, message content, and policy, whenever the context prevents
confusion.
2.2 “Let the Experts Decide”
One important feature of this simple model is that informational efficiency can always be
obtained in equilibrium, regardless of the network structure. Consider for instance the
strategy profile σ∗ in which all experts vote in line with their signal and all non-experts
abstain. Under the simple majority rule this LTED strategy profile σ∗ is efficient since for
any draw of nature the signal received by a majority of experts is implemented. Moreover,
because preferences are homogeneous, efficient strategy profiles do not only maximize the sum
of utilities, but also each individual agent’s utility. Thus, there is no room for improvement
(as already argued in McLennan, 1998).
Proposition 2.1. There exist efficient equilibria for any network structure. For instance,
the LTED strategy profile σ∗ is efficient and an equilibrium for any network structure.
Importantly, while every efficient strategy profile constitutes an equilibrium, the reverse
does not hold true. On the contrary, there are (trivial and non-trivial) inefficient equilibria
of the game. One non-trivial inefficient equilibrium will be discussed as Example 3 below.
Among the efficient equilibria, we consider the LTED equilibrium σ∗ focal for two reasons.
First, it is simple: All experts use the same type of strategy and all non-experts use the same
type of strategy. Second, it is intuitive to abstain as a non-expert and to vote in line with
one’s signal as an expert, as already argued by, e.g., Feddersen and Pesendorfer (1996) and
experimentally shown by Morton and Tyran (2011). However, since it is also intuitive for
experts to send informative messages and for receivers to vote according to their messages, it
may nonetheless be difficult to coordinate on σ∗. In particular, consider the strategy profile
21Admitting an even number of experts would not change the results qualitatively, but it would make theanalysis cumbersome because more cases would have to be distinguished.
9

σ in which experts communicate and vote for the policy indicated by their signal and non-
experts vote in line with their message and abstain if they did not receive any information.
This strategy profile σ is sincere in the sense that each agent communicates and votes for
the alternative that she considers as most likely given her private information.22 We now
proceed by investigating the sincere strategy profile.
2.3 Sincere Voting
Balanced networks. To characterize under which conditions on the network structure the
sincere strategy profile σ is an equilibrium, we define two intimately related balancedness
requirements. Both the content and the purpose of the following definition will be explained
with the help of simple examples below.
Definition 2.2 (Balancedness). We define strong and weak balancedness.
(a) Let M ′ ⊂ M denote the set of the m′ = m+12 experts with the lowest degree.23 A
network is called “strongly balanced” if this set is involved in at least half of all links,
i.e.∑
j∈M ′ dj ≥∑
k∈M\M ′ dk.
(b) For an expert j ∈M , letMj be the set of expert sets M ′′ ⊆M that contain expert j and
form a slight majority when adding their audiences of non-experts, i.e.∑
k∈M ′′(dk +
1)−∑
l∈M\M ′′(dl + 1) ∈ {0, 1, 2}. A network is called “ weakly balanced ” if for every
expert j ∈M , non-emptiness of this set, i.e. Mj 6= ∅, implies that there is at least one
element consisting of a weak majority of experts, i.e. ∃M ′′ ∈Mj such that m′′ ≥ m+12 .
To illustrate strong and weak balancedness, we use the following two examples.
Example 1. Let n = 4, m = 5, and the degree distribution of experts (d1, d2, d3, d4, d5) =
(1, 1, 1, 1, 0) as illustrated in the left panel of Figure 1. This network is strongly balanced
since d3 + d4 + d5 ≥ d1 + d2; and it is weakly balanced since every slight majority of voters
in which a given expert j ∈ {j1, j2, j3, j4, j5} partakes comprises a weak majority of experts,
too.
Example 2. Let n = 4, m = 5, and the degree distribution of experts (d1, d2, d3, d4, d5) =
(4, 0, 0, 0, 0) as illustrated in the right panel of Figure 1. This network violates weak bal-
ancedness. Indeed, M1 = {{j1}} such that there is no M ′′ ∈ M1 with m′′ ≥ m+12 = 3. Put
differently, expert 1 can partake in a slight majority of voters that contains only a minority
of experts (himself).
In general, strong balancedness requires that even the majority of experts with the small-
est degrees, which is called M ′ in the definition, is involved in at least half of all links. This
22The LTED strategy profile σ∗, in contrast, is not “fully sincere” for the following reason. The aspect thatinformation is not transmitted either means that senders do not communicate their signal or that receiversdo not follow their message.
23If there are several of these sets, we can choose any one. If m was even, we would require m′ = m+22
inthis definition.
10

simply means that every majority of experts is involved in at least half of all links, which re-
quires a rather even degree distribution.24 Weak balancedness restricts a related requirement
to certain sets of experts Mj . Indeed, strong balancedness always implies weak balanced-
ness (since it implies for all j and all M ′′ ∈ Mj that m′′ ≥ m+12 ). Networks violating weak
balancedness also violate strong balancedness and will be called unbalanced hereafter.
The two properties capture some kind of balance between a group’s expertise (which
depends on the number of signals) and its power (which depends on the size of the audiences).
For instance, in Example 1, experts are equally powerful, whereas in Example 2, expert 1 is
overly powerful, compared to the other experts.25
Proposition 2.2. The sincere strategy profile σ is efficient if and only if the network is
strongly balanced. The sincere strategy profile σ is an equilibrium if (a) the network is
strongly balanced, and only if (b) the network is weakly balanced.
Applied to our two examples, Proposition 2.2 implies that the sincere strategy profile
σ is efficient and an equilibrium in Example 1 but neither efficient nor an equilibrium in
Example 2. The intuition of Proposition 2.2 can be illustrated with these two examples.26
Consider first strong balancedness in Example 1. Observe that under the sincere strategy
profile σ any three experts who vote and communicate the same alternative determine the
final outcome. Thus, for any draw of nature the policy indicated by the majority signal is
implemented, which means that information is aggregated efficiently and hence σ is an equi-
librium. Likewise, in any strongly balanced network the majority signal receives a majority
of votes. The reason is that the set of experts who have received this signal has a majority
of votes when considering their own votes and the votes of their audiences.
Consider now weak balancedness, which is violated in Example 2. To see why σ is
inefficient in Example 2, consider a draw of nature by which the most powerful expert, i.e.,
the expert j1 with the highest degree, receives the minority signal. Assume now, for the
sake of argument, that the sincere strategy profile σ is played. In this case the minority
signal determines which policy is implemented; information is hence aggregated inefficiently.
To see why σ is not an equilibrium, consider the following two deviation incentives. First,
the most powerful expert would want to deviate to not communicating, but still voting for,
the policy indicated by her signal. This would lead to an efficient strategy profile that is
outcome-equivalent to LTED since the non-experts then abstain. Second, the non-experts,
too, can improve by deviating. In particular, consider a non-expert receiving message A.
His posterior belief that A is true is pi(A|A) = p > 12 . However, his posterior belief that A is
true, given that he is pivotal, is pi(A|A, piv) < 12 because in this simple example pivotality
24This requirement follows from the assumption in the simple model that the signal quality of the expertsis homogeneous. In the general model with heterogeneous signal quality, networks with unequal degreedistributions can also be strongly balanced as it will become clear in Appendix A.2.
25A formal definition of power is given in SOM B.4. It relies on the cooperative framework of simple games,in which individual power is measured by the Shapley-Shubik index or the Banzhaf index, which both countthe number of “swings” a voter has (cf., e.g., Roth, 1988).
26Note that Proposition 2.2 provides one sufficient and one necessary condition for the sincere strategyprofile σ to be an equilibrium, but no condition that is both sufficient and necessary. For such a conditionsee Proposition B.1 in SOM B.1.
11

Figure 1: Left: Example 1, which is a network satisfying strong balancedness. Right: Example 2, the starnetwork, which is an unbalanced network.
only occurs when all other experts have received signal B∗. Thus, abstention or voting the
opposite of the message is a strict improvement for any non-expert.
Example 2 provides a simple illustration of the swing voter’s curse. The argument,
however, is much more general. Assume that all agents play according to the sincere strategy
profile σ and consider the receivers who belong to a large audience. These receivers know
that their sender is very powerful. Hence, if they are pivotal in the vote, this implies that
a considerable number among the other experts must have got a signal that contradicts the
message they received. Thus, if following the message has any effect on the outcome, it has
most likely a detrimental effect. If a receiver realizes that he is “cursed” in this sense, he
wants to deviate from the sincere strategy and prefers to abstain or to vote the opposite.
Inefficient equilibria. For networks that satisfy the necessary condition (weak balanced-
ness), but violate the sufficient condition (strong balancedness) the sincere strategy profile σ
is inefficient but potentially still an equilibrium. More generally, the question arises whether
there are equilibria with information transmission prior to the vote that are inefficient.
Proposition 2.3. There are networks in which the sincere strategy profile σ is both an
equilibrium and exhibits informational inefficiency. This inefficiency does not necessarily
vanish when the number of experts and the number of non-experts grow large.
One example demonstrating the above proposition is given below.
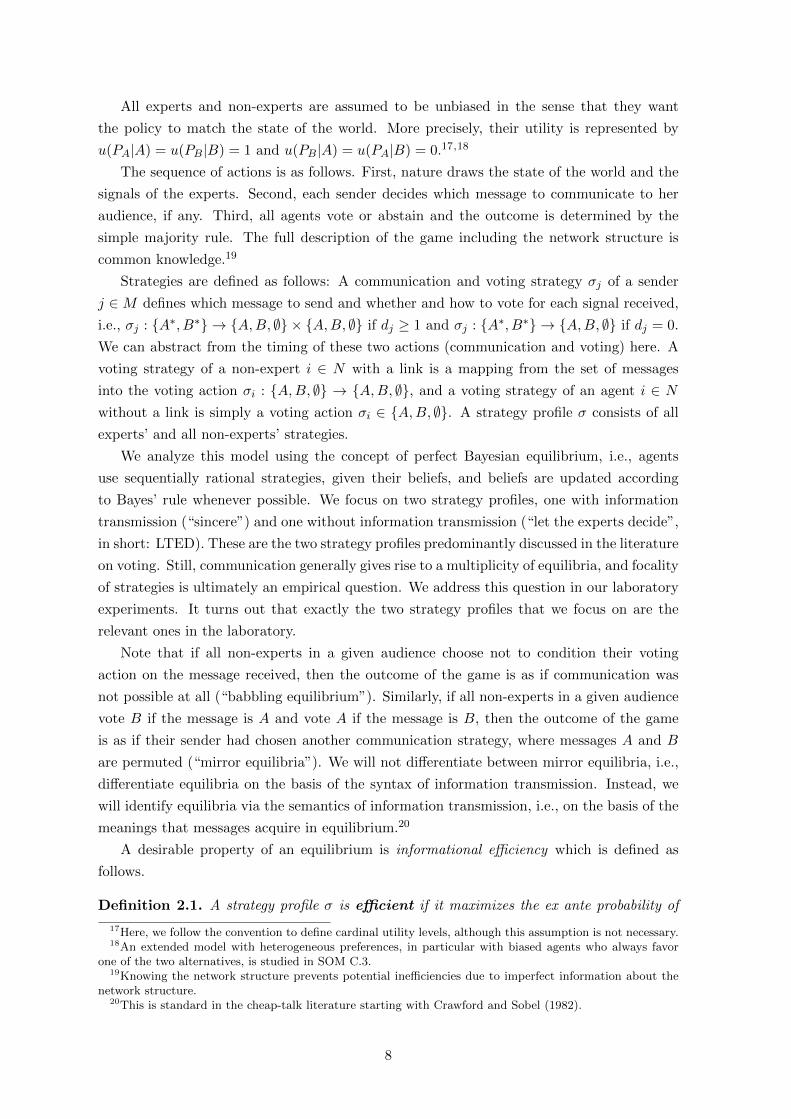
Example 3 (weakly balanced). Let n = 4, m = 5, and the degree distribution of experts
(d1, ..., d5) = (2, 2, 0, 0, 0) as illustrated in Figure 2. In this network the sincere strategy
profile σ is inefficient because the network violates strong balancedness. However, we can
show that the sincere strategy profile σ is an equilibrium in this network. Moreover, this
inefficiency need not vanish for large numbers of experts and non-experts. Let the network
grow infinitely in discrete steps t = 1, 2, 3, ... by adding two non-experts to each audience and
two experts without an audience in each step.27 For any t ≥ 1 the sincere strategy profile σ
27The t-th network then has two experts of degree 2t and 2t+ 1 experts of degree zero.
12
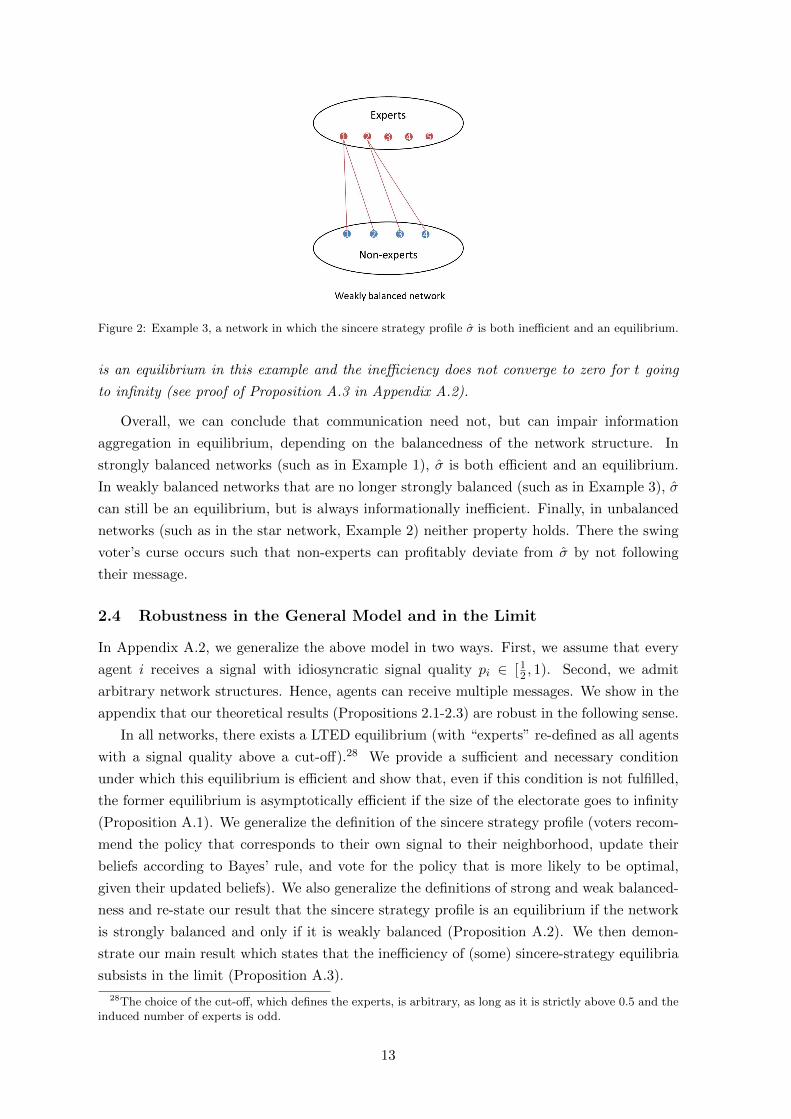
Figure 2: Example 3, a network in which the sincere strategy profile σ is both inefficient and an equilibrium.
is an equilibrium in this example and the inefficiency does not converge to zero for t going
to infinity (see proof of Proposition A.3 in Appendix A.2).
Overall, we can conclude that communication need not, but can impair information
aggregation in equilibrium, depending on the balancedness of the network structure. In
strongly balanced networks (such as in Example 1), σ is both efficient and an equilibrium.
In weakly balanced networks that are no longer strongly balanced (such as in Example 3), σ
can still be an equilibrium, but is always informationally inefficient. Finally, in unbalanced
networks (such as in the star network, Example 2) neither property holds. There the swing
voter’s curse occurs such that non-experts can profitably deviate from σ by not following
their message.
2.4 Robustness in the General Model and in the Limit
In Appendix A.2, we generalize the above model in two ways. First, we assume that every
agent i receives a signal with idiosyncratic signal quality pi ∈ [12 , 1). Second, we admit
arbitrary network structures. Hence, agents can receive multiple messages. We show in the
appendix that our theoretical results (Propositions 2.1-2.3) are robust in the following sense.
In all networks, there exists a LTED equilibrium (with “experts” re-defined as all agents
with a signal quality above a cut-off).28 We provide a sufficient and necessary condition
under which this equilibrium is efficient and show that, even if this condition is not fulfilled,
the former equilibrium is asymptotically efficient if the size of the electorate goes to infinity
(Proposition A.1). We generalize the definition of the sincere strategy profile (voters recom-
mend the policy that corresponds to their own signal to their neighborhood, update their
beliefs according to Bayes’ rule, and vote for the policy that is more likely to be optimal,
given their updated beliefs). We also generalize the definitions of strong and weak balanced-
ness and re-state our result that the sincere strategy profile is an equilibrium if the network
is strongly balanced and only if it is weakly balanced (Proposition A.2). We then demon-
strate our main result which states that the inefficiency of (some) sincere-strategy equilibria
subsists in the limit (Proposition A.3).
28The choice of the cut-off, which defines the experts, is arbitrary, as long as it is strictly above 0.5 and theinduced number of experts is odd.
13

3 Experimental Design
Motivation of the experiment. Whether real people, both individually and collectively,
account for the swing voter’s curse in unbalanced networks is an empirical question. There-
fore, we bring the theory to the laboratory and find out how experimental subjects play the
game in various networks that differ in their balancedness. The other, equally important,
purpose of the laboratory experiment is to test our focality assumption and to empirically
study (network-dependent) equilibrium selection. In particular, in the case of weakly bal-
anced networks that are not strongly balanced the quality of information aggregation depends
on whether the agents manage to coordinate on the efficient LTED equilibrium or whether
they coordinate on the inefficient sincere equilibrium, or on other potential equilibria.
To theoretically prepare experimental equilibrium selection, we address the question of
additional, non-focal equilibria. We extend the equilibrium analysis of our Examples 1, 2,
and 3, which is particularly useful since these examples are also implemented in our ex-
periment. In SOM B.2, we give a full characterization of all equilibria conforming to four
selection criteria (Purity, Symmetry, Monotonicity, and Neutrality). It shows that one more
strategy than considered so far contributes to equilibrium formation, namely a delegation
strategy according to which experts with an audience delegate their vote to their audience
by revealing their signal and abstaining themselves. Moreover, there are equilibria in which
experts who are never pivotal abstain from voting without delegating their vote. However,
there are no additional strategies that arise as composites of equilibria in these examples. All
equilibria conforming to our selection criteria are composites of the LTED strategy profile,
the sincere voting profile, and the delegation or abstention strategies of experts.
Experimental implementation. We conducted two experiments. In the main text, we
report the results of the one that directly tests the model above.29 Our experimental design
implements the empty network, in which communication is precluded, and the three examples
– Example 1, 2, and 3 – analyzed above. These four different communication networks are
depicted in Figure 3. The empty network serves as a benchmark, since the sincere strategy
profile σ is impossible to play when there are no communication channels. Hence, the LTED
equilibrium is the only focal equilibrium in the empty network. The other three networks
differ in the way described in section 2.3. In particular, the sincere strategy profile is an
efficient equilibrium in the strongly balanced network; it is an inefficient equilibrium in the
weakly balanced network; and it is neither an equilibrium nor efficient in the star network.
Each of these networks corresponds to one experimental treatment; and treatments are
varied within subjects (i.e., all participants in a given session play the communication and
voting game in all four networks) in random order. Voter groups – i.e., subject groups
interacting in one network – consist of five experts and four non-experts. Apart from the
29The second experiment, Study II, tests an extended model with fully analogous propositions. It showsthat our findings, as reported below, are fully robust. Each result – with one notable exception – is matchedby a corresponding result in Study II. If anything effects are even stronger and significant on a higher levelin Study II. The exception concerns the communication behavior of the sender in the star network, which inStudy II is truthful independent of the treatment. Study II can be found in SOM C.3 referring to an earlierworking paper version that is permanently available online (Buechel and Mechtenberg, 2017).
14

baseline treatment, the empty network, the density of the networks is held constant while
the equality of the degree distribution is decreasing.
Figure 3: The four treatments. The empty network is the baseline treatment. The strongly balanced networkis Example 1. The weakly balanced network is Example 3. The star network is Example 2. The sincerestrategy profile σ is an equilibrium in the strongly and the weakly balanced network; it is efficient in thestrongly balanced network. LTED σ∗ is an efficient equilibrium in any network.
The experiment was conducted in the WISO-lab of the University of Hamburg, using
the software z-Tree. We ran seven sessions with 3 ∗ 9 = 27 participants in each session. All
subjects in a session played the game described above in all four networks over 40 rounds
in total. Each of the four treatments occurred in two blocks of five subsequent rounds.
Blocks were ordered randomly. For the recruitment of a total of 189 subjects, we used the
software tool hroot (Bock et al., 2014). Virtually all subjects were undergraduate or master
students at the University of Hamburg from a variety of fields. None of them had previously
participated in a related experiment. At the beginning of each session, subjects randomly
received the role of an expert or the role of a non-expert. These roles were fixed throughout
the experiment.30 In each round, subjects were randomly matched into groups of nine (five
experts and four non-experts). At the end of each round, the participants learned the chosen
policy, the true state, and the voter turnout in their group. They did not learn individual
votes, vote shares per role, or any behavior from other groups. Groups were newly formed
each round by random re-matching. Instructions that described the experimental session in
detail were handed out at the beginning of each session and were followed by a short quiz
that tested the subjects’ understanding of the game.31 Moreover, there were four practicing
rounds, one for each treatment, that were not payout-relevant. During the entire session,
each subject always knew his own network position and the structure of the network. The
quality of the signal that the experts received was p = 0.6. At the end of each session, three
rounds were randomly drawn and payed out in cash and in private. Subjects earned 5 Euros
for a correct group choice and 0 Euros for an incorrect group choice. Hence, a given subject
could earn either 0, or 5, or 10, or 15 Euros from group play, depending on how many of the
three randomly drawn payoff-relevant rounds were associated with a correct group choice
for this particular subject. In addition, each subject received a show-up fee of 5 Euros. On
30The network position varied within roles; e.g., the expert at the center of the star network was randomlydrawn from among all experts in the group at the beginning of each round in which the star was played.
31The instructions and the quiz can be found in SOM C.2.
15
average, sessions lasted for 1.5 hours and subjects earned EUR 14.3.32
4 Experimental Results
Table 2 in Appendix A.1 gives a summary of the number of observations. On the group
level we have 840 observations. On the individual level we have 7,560 observations with 40
decisions per subject. In total, 189 subjects participated in the experiment.
After analyzing equilibrium selection in section 4.1, we will turn to individual behavior
in section 4.2. We address efficiency in section 4.3. The experimental results are illustrated
in the main text by figures. Most tables are relegated to Appendix A.1.
4.1 Equilibrium Selection
Focality. Since our setting gives rise to a multiplicity of equilibria, the first question is
which equilibria are played. We check how frequently actual behavior in a group is consis-
tent with one of the existing equilibrium strategy profiles (Table 1). It turns out that the
empirical frequency of most equilibria is 0.0%: Out of the 840 observations on the group
level, respectively out of the 210 group observations per treatment, they are not even played
once. There are two equilibria which are frequently played, however: the sincere σ and
the LTED σ∗.33 Besides these two focal equilibria there is only one more equilibrium that
is actually ever played. This is an equilibrium in the strongly balanced network, which is
highly similar to sincere behavior, but with the difference that one of the four non-experts
abstains.34 Hence, by focusing on the sincere strategy profile and the LTED strategy profile,
we do not miss other relevant equilibria.
Moreover, we counted to which extent the two focal strategy profiles can predict the
actual group decision given the actual distribution of signals. In every treatment more than
80% of the actual outcomes are predicted by at least one of the two focal strategy profiles
(Table 3, last column). This is another indication that the focus on the two focal equilibria
is well justified by the data.35
Treatment effects on equilibrium selection. The second question is how the network
structure affects which strategy profile is selected. Figure 4 (and Tables 1 and 3) show the
results. Since many groups’ strategy profiles are not consistent with any equilibrium, we
additionally consider playing almost a strategy profile, when at most one of the nine subjects
in a group has chosen a different strategy.36 This gives a more exhaustive view on group
behavior.
32The norm in the WISO-lab at the University of Hamburg is EUR 10 per hour.33Sometimes there is more than one equilibrium strategy profile that induces LTED.34In SOM B.2 this equilibrium is denoted by v1, r = 3 and illustrated in Figure B.1, Panel (a).35Finally, there could be additional equilibria involving mixed strategies. In our analysis of the experimental
data we have not found any indication for the relevance of mixed strategies. When investigating individualbehavior of the same subjects in different instances (such as in Figure 7 below), it turns out that many agentsconsistently choose the same action when they are in the same treatment.
36Our within-subjects design with stranger matching makes it very demanding for subjects to coordinate.
16

Table 1. Equilibrium Selection
Equilibria Equ. Play sincere σ LTED σ∗ all others
empty σ∗ 23 - 23 0(N=210)
strongly balanced σ∗, σ, and 17 others 44 21 0 23a
(N=210)
weakly balanced σ∗, σ, and 7 others 18 16 2 0(N=210)
star σ∗, and 5 others 5 (5)b 5 0(N=210)
Total 90 37 (42) 30 23(N=840)
Table 1: Frequency of equilibria. The column ‘Equilibria’ lists the strategy profiles that comprise an equi-librium and that satisfy our equilibrium selection criteria (Purity, Symmetry, Monotonicity, and Neutrality).The other columns report the empirical frequency of certain equilibria, i.e., how often all actions in a groupare consistent with an equilibrium strategy profile.Note a: The 23 times that other equilibria than LTED σ∗ and sincere σ were played, it was each time the sameequilibrium. Its strategy profile differs from the sincere strategy profile in that one of the four non-expertsabstains. In SOM B.2 this equilibrium is denoted by v1, r = 3 and illustrated in Figure B.1, Panel (a).Note b: In the star network, the strategy profile sincere σ is not an equilibrium, but played 5 times.
In the empty network, in which σ cannot be played, we find the highest level of coordina-
tion on σ∗. In the strongly balanced network there are 19 different equilibria, including the
two focal ones, which are both efficient in this network. Behavior is consistent with only two
equilibria: the sincere σ and the other equilibrium that is highly similar to sincere. Hence,
the (almost) sincere strategy profile σ is predominant, while LTED σ∗ is rarely ever played.
In the weakly balanced network, there are 9 different equilibria, including the two focal ones.
LTED σ∗, which is efficient, is rarely played. The sincere equilibrium σ, which is inefficient,
is more frequently selected. Hence, in both balanced networks equilibrium selection is in
favor of the sincere strategy profile. In the star network, LTED σ∗ is the only equilibrium
that is ever played. However, we note that the sincere strategy profile σ, which is not an
equilibrium and inefficient in this network, is still played as frequently as LTED.
Comparing across treatments, network balancedness leads to a higher frequency with
which groups coordinate (almost) on the sincere strategy profile σ and to a lower frequency
with which groups coordinate (almost) on the LTED strategy profile σ∗. Fisher exact tests
reveal that these differences are significant on the p < 0.05 level when taking the “almost”
definition of the strategy profiles and most of them are also significant when taking the strict
definition (Tables 4 and 5). The following result summarizes the findings.
Result 1. In the (strongly and weakly) balanced networks, groups coordinate more often
on the sincere strategy profile σ than on LTED equilibrium σ∗. In the star network groups
coordinate less often on σ and more often on σ∗ than in the balanced networks. Coordination
on σ∗ is highest in the empty network.
The selection of the sincere strategy profile in the weakly balanced network means that
the inefficient equilibrium is selected. The comparison between the balanced networks and
the star network is in line with the theoretical prediction (since σ is not an equilibrium in
17

41%
2%6%
12%
35%
28%
14%
0%
5%
10%
15%
20%
25%
30%
35%
40%
45%
empty stronglybalanced
weaklybalanced
star
almost LTED
almost sincere
Figure 4: Frequency of behavior consistent with strategy profiles σ∗ and σ by treatment. A strategy profileis “almost” played if at most one agent has chosen a different strategy. All differences – apart from thecomparison between the strongly and weakly balanced networks – are significant on the p < 0.05 level(Tables 4 and 5).
the unbalanced star network).37
In sum, we find that our focality assumption on equilibrium selection is well supported
by our experimental findings. Moreover, we find that equlibrium selection is more in favor of
the sincere strategy profile. Given this finding, the resulting comparative-static predictions
of the theory are supported as well.38
4.2 Individual Behavior Across Networks
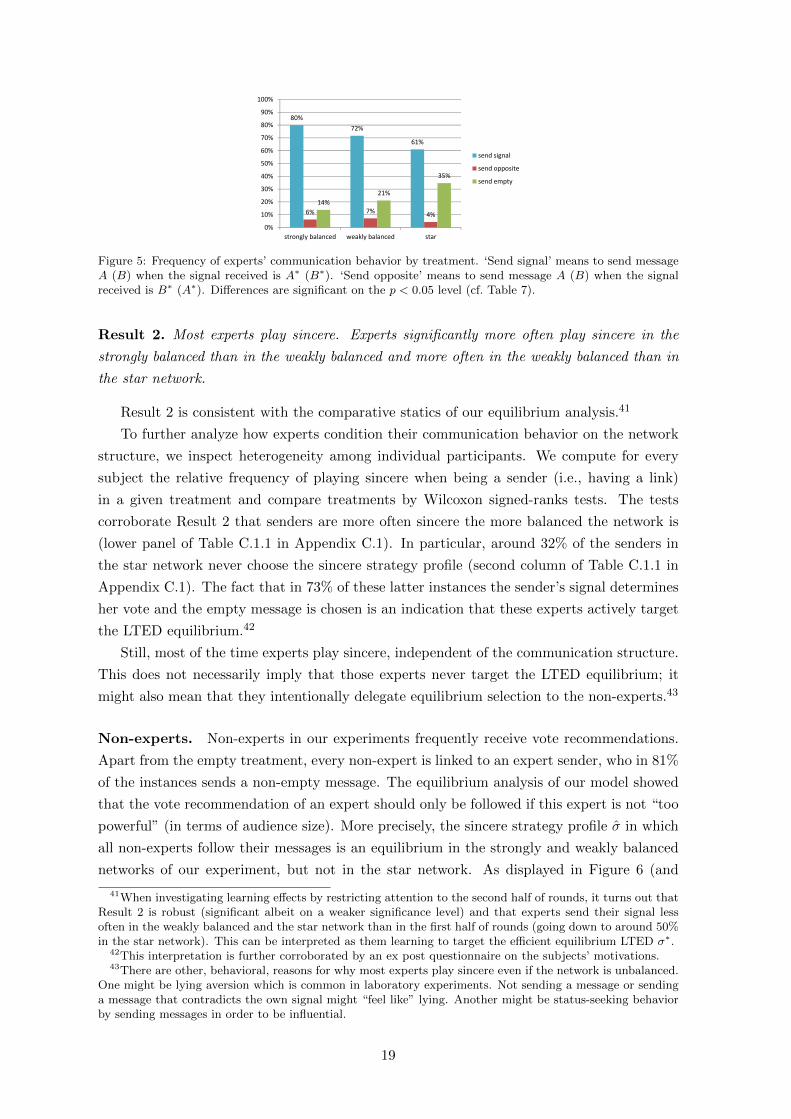
Experts. Around 80% of the time experts vote and communicate in accordance with their
signal, i.e., they play the sincere strategy σj (Table 6). While experts vote in line with their
signal in a large majority of instances, there are some deviations from the sincere strategy
profile on the communication stage, as can be seen from Figure 5.39 Recall that there
is an incentive to deviate in the star network since it is unbalanced. Indeed, information
transmission is lowest in the star network, where only 61% of the senders communicate
their signal, whereas 35% choose the empty message. This is a significant difference in
communication behavior on the p < 0.05 level, as can be seen from the logistic regressions
in Table 7, which take the weakly balanced network as the baseline category.40 Moreover,
experts send a truthful message more frequently in the strongly balanced network, where
sincere behavior is an efficient equibrium, than in the weakly balanced network (p < 0.01),
where it is an inefficient equilibrium.
37When exploring learning effects by restricting attention to the second half of rounds, i.e., round 21 to 40,Result 1 still holds. Moreover, in comparison with the first half of rounds, i.e., round 1 to 20, there is highercoordination on σ∗ in the star network and lower coordination on σ in the balanced networks in the secondhalf. Both changes could be interpreted as learning effects since agents play more frequently the efficientequilibrium and less frequently the strategy profile that is inefficient the weakly balanced network.
38These findings are particularly strong since our experimental design is (intentionally) biased against them:the within-subjects design with stranger matching makes it difficult for subjects to coordinate at all, let aloneconditional on treatment, and still we find significant treatment-conditional equilibrium selection.
39There are also some deviations in the voting behavior as it can be seen from Table 6. For instance, 5.9%of experts vote against their signal in the empty network, which is a relatively high error rate when comparedto the study of Morton and Tyran (2011). However, we note important differences between these two studiesincluding that the experts in our experiment have a lower signal quality than the non-experts (!) in theirtreatments and that the groups in our study are three times larger.
40We use robust standard errors clustered by sessions in every regression. All results would also hold whenclustering standard errors by subject (as reported in an earlier working paper version).
18
80%72%
61%
6% 7% 4%
14%21%
35%
0%
10%
20%
30%
40%
50%
60%
70%
80%
90%
100%
strongly balanced weakly balanced star
send signal
send opposite
send empty
Figure 5: Frequency of experts’ communication behavior by treatment. ‘Send signal’ means to send messageA (B) when the signal received is A∗ (B∗). ‘Send opposite’ means to send message A (B) when the signalreceived is B∗ (A∗). Differences are significant on the p < 0.05 level (cf. Table 7).
Result 2. Most experts play sincere. Experts significantly more often play sincere in the
strongly balanced than in the weakly balanced and more often in the weakly balanced than in
the star network.
Result 2 is consistent with the comparative statics of our equilibrium analysis.41
To further analyze how experts condition their communication behavior on the network
structure, we inspect heterogeneity among individual participants. We compute for every
subject the relative frequency of playing sincere when being a sender (i.e., having a link)
in a given treatment and compare treatments by Wilcoxon signed-ranks tests. The tests
corroborate Result 2 that senders are more often sincere the more balanced the network is
(lower panel of Table C.1.1 in Appendix C.1). In particular, around 32% of the senders in
the star network never choose the sincere strategy profile (second column of Table C.1.1 in
Appendix C.1). The fact that in 73% of these latter instances the sender’s signal determines
her vote and the empty message is chosen is an indication that these experts actively target
the LTED equilibrium.42
Still, most of the time experts play sincere, independent of the communication structure.
This does not necessarily imply that those experts never target the LTED equilibrium; it
might also mean that they intentionally delegate equilibrium selection to the non-experts.43
Non-experts. Non-experts in our experiments frequently receive vote recommendations.
Apart from the empty treatment, every non-expert is linked to an expert sender, who in 81%
of the instances sends a non-empty message. The equilibrium analysis of our model showed
that the vote recommendation of an expert should only be followed if this expert is not “too
powerful” (in terms of audience size). More precisely, the sincere strategy profile σ in which
all non-experts follow their messages is an equilibrium in the strongly and weakly balanced
networks of our experiment, but not in the star network. As displayed in Figure 6 (and
41When investigating learning effects by restricting attention to the second half of rounds, it turns out thatResult 2 is robust (significant albeit on a weaker significance level) and that experts send their signal lessoften in the weakly balanced and the star network than in the first half of rounds (going down to around 50%in the star network). This can be interpreted as them learning to target the efficient equilibrium LTED σ∗.
42This interpretation is further corroborated by an ex post questionnaire on the subjects’ motivations.43There are other, behavioral, reasons for why most experts play sincere even if the network is unbalanced.
One might be lying aversion which is common in laboratory experiments. Not sending a message or sendinga message that contradicts the own signal might “feel like” lying. Another might be status-seeking behaviorby sending messages in order to be influential.
19

80%73%
52%
7% 6%12%13%
22%
36%
0%
10%
20%
30%
40%
50%
60%
70%
80%
strongly balanced weakly balanced star
vote message
vote opposite
abstain
Figure 6: Frequency of non-experts’ following behavior by treatment. ‘Vote message’ means to vote A (B)when the message received is A (B). ‘Vote opposite’ means to vote A (B) when the message received is B(A). Only responses to non-empty messages are displayed. Differences between the (strongly and weakly)balanced networks and the star network are significant on the p < 0.01 level (cf. Table 9).
5%8%
24%
57%
46%
30%
0%
10%
20%
30%
40%
50%
60%
70%
strongly balanced weakly balanced star
never
always
Figure 7: Frequency of individual following behavior by treatment. The variable ‘never’, respectively ‘always,’reports the fraction of individual participants who never respectively always followed the non-empty voterecommendation they received for each network position. Differences between the (strongly and weakly)balanced networks and the star network are significant on the p < 0.01 level (cf. Table 10).
in Table 8 in column ‘vote message’), in around 70% to 80% of the instances non-experts
vote according to their received message in the balanced networks where the sincere strategy
profile is an equilibrium, but they do so only in around 50% of the instances in the star
network. These differences are significant on the p < 0.01 level as can be seen from the
logistic regressions in Table 9.
Result 3. Non-experts follow their vote recommendation significantly more often in the
(strongly and weakly) balanced networks than in the star network.
In general, non-experts who do not follow a message mostly abstain, as can be seen in
Figure 6. Thus, the flipside of a significant decrease in followers is a significant increase in
abstentions for the unbalanced networks.44
To get more detailed evidence on when non-experts follow their vote recommendations,
we move on to idiosyncratic heterogeneity between participants. Figure 7 shows how many
of the non-experts never and how many always follow their message in a given position. As
many as 57% of the non-experts always follow their message when they are in the strongly
44When exploring learning effects by focusing on the second half of rounds, we first of all find that Result 3is robust. Moreover, we find that following message A or B is less frequent in the second half of rounds than inthe first half. In the star network, abstention of non-experts increases (from 37% to 56%), while uninformedvoting decreases (from 49% to 26%). This change of behavior is consistent with individual improvements intaking the swing voter’s curse into account in the second half.
20

balanced network, respectively the weakly balanced network. For the star network this
number reduces to 30%. This observation strongly suggests that a considerable share of non-
experts react to the balancedness of the network, as predicted by our theory.45 Differences in
individual behavior of non-experts across networks are tested using Wilcoxon signed-ranks
tests, which are reported in Table 10. In the star network the non-experts’ following behavior
is different from their behavior in all other networks (p < 0.01, upper block of Table 10).
Hence, the network structure has a strong influence on following: a substantial fraction of
individuals only follows the vote recommendation of senders that are not too influential.46
Besides, there is also a minority of subjects who follow any sender.47 In sum, non-experts’
behavior is largely in line with the predictions of our model.
4.3 Efficiency
Since uninformed voting is highly detrimental to efficiency in common-interest voting (see,
e.g., Elbittar et al., 2016), a few remarks on uninformed voting are in order before we proceed
to our efficiency results.
Uninformed voting. Non-experts who receive no message, either because they are in the
empty network or because their sender chose the empty message, are uninformed. In most of
these instances the uninformed non-experts abstain, but in a substantial fraction of around
30% of instances there is a vote by the uninformed non-expert, as can be seen from Table 8.48
This observation is in line with the literature, since positive rates of uninformed voting are
45In fact, the ex post questionnaire, with which we asked the subjects about their motives for their decisionscorroborates the view that many subjects understood the swing voter’s curse in some form. For instance,there was substantial agreement (80% agree, 7% agree partially, 13% disagree) with the following (sound)statement about pivotality reasoning: “With my vote, I have tried to make a good choice for the case thatmy vote is decisive.” There was substantial disagreement (26% agree, 14% agree partially, 59% disagree) withthe following unsound statement: “The more receivers a certain sender has, the more her message shouldbe followed.” Moreover, agreement to the statements is associated with corresponding actual behavior,e.g. agreement to the latter statement is highly correlated with following vote recommendations in the starnetwork; agreement to the former statement is correlated with higher expected payoffs.
46As an anonymous referee has pointed out, our finding that non-experts target the sincere equilibriummore often than the LTED equilibrium in the weakly and strongly balanced networks, compared to the star,might also be due to homogeneous signal qualities among experts. If experts were of different quality as inour general model, voters might refrain from following the recommendation of low-quality experts to delegatethe decision to the high-quality experts.
47There are at least three possible explanations of their behavior. One is extreme correlation neglect(see, e.g., Enke and Zimmermann, 2017, and Levy and Razin, 2015): These non-experts might ignore theperfect correlation of a message received by several members of an expert’s audience, instead treating it as anindependent signal. The second possible explanation is overconfidence in the truth of the signal of one’s ownsender (see, e.g., Ortoleva and Snowberg, 2015). The third is what one might call “pivotality neglect”, i.e.,the inability to condition on hypothetical events such as pivotality (see Esponda and Vespa, 2014). Obviously,also a combination of biases might explain the amount of naıve following. For instance, if a non-expert linkedto the center of the star in Study I believes that all other voters randomize and that he himself is likely to bepivotal, his optimal response is indeed to vote along with the message he received (see Dittmann et al., 2014for a combination of illusion of control, overconfidence, and overestimation of others’ errors explaining excessturnout). Since our focus in this paper is not on disentangling biases that lead to irrational voting, we leavea more precise explanation of this minority behavior to further research.
48Exploring individual heterogeneity in uninformed voting reveals that around 50% of the participants nevervote when uninformed, while there are almost 20% of the participants who always vote when uninformed.
21

found in all experiments on common-interest voting.49 Since uninformed votes are no better
than coin flips, they have detrimental effects on informational efficiency. However, if we
compute the hypothetical group decisions without uninformed voting (as if all uninformed
voters abstained), then only 14 out of 840 decisions, i.e., less than 2%, change: In 8 instances
a majority for A or B changes into a tie; and in 6 instances a tie changes into a majority for
A or B. Hence, the impact of uninformed voting on efficiency in our study is limited.
Informational efficiency. Per definitionem, informational efficiency is the higher the
more often the signal received by the majority of experts determines the voting outcome.
Given the results on individual behavior and equilibrium selection above, we have two op-
posite forces. Some subjects play the sincere strategy profile σ independent of the network
structure, which is the more inefficient, the less balanced the network. Others mitigate the
inefficiency of the unbalanced networks, but not necessarily of the weakly balanced network,
by playing a strategy that targets the LTED equilibrium σ∗. The net effect of the two forces
is a priori unclear.
Figure 8 displays the degree of informational efficiency of voting outcomes across net-
works. To test whether differences in informational efficiency across networks are significant,
we create the variable efficiency that takes the value −1 if the voting outcome matches the
minority signal, the value 0 if a tie occurs, and the value 1 if the voting outcome matches
the majority signal. When Fisher exact tests directly compare efficiency of the different
treatments, the null hypothesis cannot be rejected (Table 11). This indicates that there are
no strong differences in efficiency between the treatments.
Note, however, that efficiency is also heavily affected by signal distributions.50 By con-
trolling for them, we can reduce the noise in the analysis of efficiency. Using ordered logit
models, we regress efficiency on the network type, controlling for the signal distribution.
Results are displayed in Table 12. We now find weak evidence that informational efficiency
is lower in the star network than in the empty network (p < 0.1).
Result 4. Informational efficiency is lower in the star network, than in the empty network
(weak evidence).
The superiority of the empty network compared to the star network is so notable be-
cause any strategy profile that can be played in the empty network is also feasible in this
unbalanced network. Providing participants with the possibility to communicate can hence
have a detrimental effect on their voting outcome.51
49Grosser and Seebauer (2016) find a 30% rate of uninformed voting. Elbittar et al. (2016) even find that60% of the uninformed vote.
50To see this, let the five experts happen to receive the same signal, say A∗. They will find it is easier toimplement the majority signal A∗ than if there would be signals for both A and B, where voting errors wouldbe more likely to impair informational efficiency. We call a signal distribution of the form “5:0” uniform, asignal distribution of the form “4:1 ” almost uniform, and a signal distribution of the form “3:2” non-uniform.
51When exploring learning effects by focusing on the second half of rounds, we first of all find that Result 4is robust. Moreover, it yields in addition weak evidence (p < 0.1) that the star is less efficient than the weaklybalanced network. Hence, informational inefficiency does not vanish when agents have time to learn.
22

74.3% 77.6% 74.3%68.6%
13.8% 9.1%11.0%
12.9%
50%
55%
60%
65%
70%
75%
80%
85%
90%
95%
100%
empty strongly balanced weakly balanced star
tie
win
Figure 8: Frequency of informationally efficient group decisions by treatment. ‘Win’ means that the outcomeof voting is the majority signal. ‘Tie’ means that there were as many votes for A as for B such that theoutcome is correct with probability one half. Differences between the empty network and the star networkare significant on the p < 0.1 level when controlling for the distribution of signals (Table 12).
Economic efficiency. To test whether the low informational efficiency in the star network,
and probably also in the unbalanced network, affects subjects in an economically meaningful
way, we compute the expected payoff EP for each group in each round. If the group decision
matches the true state, each member of the group earns 100 points. Hence, the variable EP
coincides with the likelihood (in percentage points) of a correct collective decision, given all
signals in the group. For instance, if four experts have received signal A∗ and one expert
B∗ and the outcome of the majority vote is A, then EP = p4(1−p)p4(1−p)+(1−p)4p ∗ 100 which is
approximately 77.14 for p = 0.6.52 Computing EP by network type yields on average 61
points in the star network and on average 64 points in the other networks (as displayed in
Table C.1.2 in Appendix C.1).53
Recall that when not controlling for the distribution of signals, there is additional noise
because some treatments might happen to exhibit uniform signals and hence higher expected
payoffs more often than others. We test for significant differences using OLS regressions and
control for uniformity of signals (Table C.1.3). The findings are similar to those of Result 4:
The inefficiency of the star network compared to the empty network is confirmed (p < 0.1).
In addition, there is now weak evidence that the star network exhibits lower efficiency than
the weakly balanced network (p < 0.1).
Result 5. Expected payoffs are lower in the star network than in the empty network and the
weakly balanced network (weak evidence).
Result 5 consists of two separate findings. The comparison among the networks in which
communication is possible shows that an unbalanced communication structure can be detri-
mental to efficiency. The comparison of the star network with the empty network, where
communication is precluded, shows that communication itself can be detrimental to effi-
52If we consider reasonable values of EP to lie between the EP of a dictator who is randomly chosen fromthe experts and the EP of an efficient strategy profile, then the range is [60, 68.3].
53Table C.1.2 additionally displays the actual number of correct group decisions (‘success’), which is a lessreliable measure of economic efficiency than EP due to the noise induced by imperfect signals. As confirmedby t-tests (not in the appendix) the empirical values of EP are significantly below the EP of an efficientstrategy profile, except for the case of a uniform signal, i.e., a signal distribution of the form “5:0,” whichvirtually always leads to the efficient majority decision.
23

ciency, confirming Result 4 above.54,55
To summarize, although we find evidence in favor of the comparative statics of our
theory and a substantial share of our subjects does switch from sincere voting to the LTED
equilibrium if network balancedness decreases, this switching behavior is not pronounced
enough to fully prevent detrimental effects of unbalanced communication on informational
efficiency. If instead, preplay communication is prohibited altogether, voters can indeed
be better off. Despite these deviations, our experimental results confirm that our simple
model already captures an important aspect of pre-vote communication in social networks:
Balancedness of the network structure affects both the choice between sincere behavior and
LTED, and efficiency.
5 Conclusion and Discussion
Basic model. We have analyzed communication in the form of vote recommendations in
social networks and have shown that it can lower efficiency of the voting outcome even in a
common-interest setting. In the basic model communication is fully private: The network
is bipartite and the non-experts have at most degree one. After communication, each voter
holds no more than one piece of information. Hence, any information aggregation can only
occur in the voting stage, not through communication.
If such a social network is not strongly balanced, i.e., if it gives too much weight to
voters with too little expertise, and if, at the same time, the network is not unbalanced
either, then it can be an equilibrium to give and follow vote recommendations. However, the
outcome of the resulting election is less likely to be optimal than under no communication.
We have compared two focal strategy profiles – one without and one with private vote
recommendations. In the first, efficient strategy profile, the informed vote in line with their
own information and the others abstain (“let the experts decide”). In the second strategy
profile, voters report their information to their neighbors in the network and everyone votes
according to his or her updated belief (sincere behavior). Theoretically, we have found that
sincere behavior, i.e., giving and following vote recommendations, constitutes an equilibrium
in many weakly balanced networks but is inefficient in all that are not strongly balanced. We
have shown empirically that the two focal strategy profiles are indeed the only relevant ones,
that the inefficient one is frequently chosen over the efficient one, and that communication
indeed has some detrimental effects on efficiency if the network is unbalanced.
General model. In Appendix A.2, we generalize our model to include vote recommen-
dations between arbitrary voters with varying levels of expertise and in arbitrary network
structures, but still in a common-interest setting. The general model includes both extremes
of the private-public communication spectrum as special cases. Fully public communication
54When exploring learning effects by focusing on the second half of rounds, we cannot reject the nullhypothesis that expected payoffs in the different treatments are the same. However, for the empty network,there is weak evidence that in the second half of rounds expected payoffs are larger than in the first half(p < 0.1). There are no similar learning effects in the other treatments.
55Further empirical results show that most inefficient outcomes could have been avoided by some non-expertvoters abstaining (see Table C.1.4 in SOM C.1).
24

occurs if the network is complete, i.e., every voter is linked to every other voter. In this
case, passing on one’s signal and voting according to one’s posterior belief (sincere behavior)
is efficient and an equilibrium that captures ideal deliberation: The optimal alternative can
be deduced by every voter; and other voting rules than the majority rule would also admit
an equally efficient outcome (cf. Coughlan, 2000, Austen-Smith and Feddersen, 2006, and
Gerardi and Yariv, 2007).
Arguably, in large elections communication is neither fully public nor fully private. Re-
ceiving multiple messages and an own signal leads to some information aggregation already
in the communication stage. Participation in a majority election further aggregates infor-
mation in the voting stage. Our general model accounts for this reality with respect to vote
recommendations. Balancedness is crucial here, too: With the exception of efficiency of
LTED in finite networks, the findings from our basic model remain robust. Moreover, all
findings from the basic model also hold in the limit when the population size converges to
infinity.
To be clear, also the general version of our model addresses only one form of pre-vote
communication: vote recommendations. This is captured by our set-up and the particular
communication protocol, in which there is one round of sending messages to all network
neighbors.
Misinformation. Our setting lends itself to be extended to study the effects of misinfor-
mation on voting behavior and informational efficiency. We did one step into this direction
which is reported in SOM C.3 and in an earlier working paper version that is permanently
available online (Buechel and Mechtenberg, 2017). In Buechel and Mechtenberg (2017), we
extend the simple model from section 2 of this paper to include “partisans” (Feddersen and
Pesendorfer, 1996), i.e., troll senders that either always send the message A or always send
the message B. We assume an equal number of troll senders for both messages. Our equilib-
rium analysis reveals that the presence of these troll senders does not change our theoretical
results: Troll senders reduce the expected quality (i.e., truth probability) of a message, but
since our results hold for any expected message quality above 0.5, this does not add any
new insight. Empirically, however, the presence of troll senders creates a new behavioral
effect: When we test the extended simple model in the laboratory (Study II, summarized in
SOM C.3), we find suggestive evidence that (1) the presence of troll senders makes human
senders prone to pass on their signal to their audience regardless of the network structure,
and that (2) the star network becomes even less efficient, compared to balanced networks,
mostly due to followers of a troll sender in the center of the star. While this is obviously
not a comprehensive analysis of misinformation, it still provides an important insight: Mis-
information might enlarge an already existing problem of vote recommendations in social
networks, namely the too-high weight that voters with large audiences get in the course of
communication via social media.56
We conclude that the structure of social networks and the balance – or the lack thereof
– between voters’ expertise and the size of their audience in the communication network are
56For a recent experimental study on misinformation, see Pogorelskiy and Shum (2019).
25
important for efficient majority votes.
References
Agranov, M., J. K. Goeree, J. Romero, and L. Yariv (2017): “What makes voters
turn out: The effects of polls and beliefs,” Journal of the European Economic Association,
16, 825–856.
Austen-Smith, D. and J. S. Banks (1996): “Information aggregation, rationality, and
the Condorcet jury theorem,” American Political Science Review, 90, 34–45.
Austen-Smith, D. and T. J. Feddersen (2006): “Deliberation, preference uncertainty,
and voting rules,” American Political Science Review, 100, 209–217.
Battaglini, M. (2017): “Public protests and policy making,” The Quarterly Journal of
Economics, 132, 485–549.
Battaglini, M., R. B. Morton, and T. R. Palfrey (2010): “The swing voter’s curse
in the laboratory,” The Review of Economic Studies, 77, 61–89.
Bock, O., I. Baetge, and A. Nicklisch (2014): “hroot: Hamburg registration and
organization online tool,” European Economic Review, 71, 117–120.
Buechel, B. and L. Mechtenberg (2017): “The swing voter’s curse in social networks,”
Working Paper, http://doc.rero.ch/record/305039.
Carpini, M. X. D., F. L. Cook, and L. R. Jacobs (2004): “Public deliberation, discur-
sive participation, and citizen engagement: A review of the empirical literature,” Annual
Review of Political Science, 7, 315–344.
Coughlan, P. J. (2000): “In defense of unanimous jury verdicts: Mistrials, communication,
and strategic voting,” American Political Science Review, 94, 375–393.
Crawford, V. P. and J. Sobel (1982): “Strategic information transmission,” Economet-
rica: Journal of the Econometric Society, 1431–1451.
De Caritat, Marie Jean Antoine Nicolas, M. d. C. (1785): Essai sur l’application de
l’analyse a la probabilite des decisions rendues a la pluralite des voix, L’imprimerie royale.
DeMarzo, P. M., D. Vayanos, and J. Zwiebel (2003): “Persuasion bias, social influ-
ence, and unidimensional opinions,” The Quarterly Journal of Economics, 118, 909–968.
Dittmann, I., D. Kubler, E. Maug, and L. Mechtenberg (2014): “Why votes have
value: Instrumental voting with overconfidence and overestimation of others’ errors,”
Games and Economic Behavior, 84, 17–38.
Elbittar, A., A. Gomberg, C. Martinelli, and T. R. Palfrey (2016): “Ignorance
and bias in collective decisions,” Journal of Economic Behavior & Organization.
26

Enke, B. and F. Zimmermann (2017): “Correlation neglect in belief formation,” Review
of Economic Studies, 86, 313–332.
Esponda, I. and E. Vespa (2014): “Hypothetical thinking and information extraction in
the laboratory,” American Economic Journal: Microeconomics, 6, 180–202.
Feddersen, T. and W. Pesendorfer (1996): “The swing voter’s curse,” American Eco-
nomic Review, 408–424.
——— (1997): “Voting behavior and information aggregation in elections with private in-
formation,” Econometrica, 1029–1058.
——— (1998): “Convicting the innocent: The inferiority of unanimous jury verdicts under
strategic voting,” American Political Science Review, 23–35.
Gerardi, D. and L. Yariv (2007): “Deliberative voting,” Journal of Economic Theory,
134, 317–338.
Goeree, J. K. and L. Yariv (2011): “An experimental study of collective deliberation,”
Econometrica, 79, 893–921.
Golub, B. and M. O. Jackson (2010): “Naıve learning in social networks and the wisdom
of crowds,” American Economic Journal: Microeconomics, 2, 112–49.
——— (2012): “How homophily affects the speed of learning and best-response dynamics,”
The Quarterly Journal of Economics, 127, 1287–1338.
Grosser, J. and M. Seebauer (2016): “The curse of uninformed voting: An experimental
study,” Games and Economic Behavior, 97, 205–226.
Guarnaschelli, S., R. D. McKelvey, and T. R. Palfrey (2000): “An experimental
study of jury decision rules,” American Political Science Review, 94, 407–423.
Iaryczower, M., X. Shi, and M. Shum (2018): “Can words get in the way? The effect
of deliberation in collective decision making,” Journal of Political Economy, 126, 688–734.
Jeong, D. (2019): “Using cheap talk to polarize or unify a group of decision makers,”
Journal of Economic Theory, 180, 50 – 80.
Kawamura, K. and V. Vlaseros (2017): “Expert information and majority decisions,”
Journal of Public Economics, 147, 77–88.
Levy, G. and R. Razin (2015): “Correlation neglect, voting behavior, and information
aggregation,” American Economic Review, 105, 1634–45.
Liu, S. (2019): “Voting with public information,” Games and Economic Behavior, 113, 694
– 719.
Lu, L., Y. C. Yuan, and P. L. McLeod (2012): “Twenty-five years of hidden profiles
in group decision making a meta-analysis,” Personality and Social Psychology Review, 16,
54–75.
27

McLennan, A. (1998): “Consequences of the Condorcet jury theorem for beneficial infor-
mation aggregation by rational agents,” American Political Science Review, 92, 413–418.
Morton, R. B. and J.-R. Tyran (2011): “Let the experts decide? Asymmetric in-
formation, abstention, and coordination in standing committees,” Games and Economic
Behavior, 72, 485–509.
Nitzan, S. and J. Paroush (1982): “Optimal decision rules in uncertain dichotomous
choice situations,” International Economic Review, 289–297.
Ortoleva, P. and E. Snowberg (2015): “Overconfidence in political behavior,” American
Economic Review, 105, 504–35.
Palfrey, T. R. and K. Pogorelskiy (2017): “Communication among voters benefits
the majority party,” The Economic Journal, 129, 961–990.
Pogorelskiy, K. and M. Shum (2019): “News we like to share: How news sharing on
social networks influences voting outcomes,” CAGE Online Working Paper Series.
Roth, A. E. (1988): The Shapley value: essays in honor of Lloyd S. Shapley, Cambridge
University Press.
Shapley, L. and B. Grofman (1984): “Optimizing group judgmental accuracy in the
presence of interdependencies,” Public Choice, 43, 329–343.
28

A Appendix
A.1 Tables 2 - 12
Table 2. Observations
treatment groups experts non-experts senders receivers
empty 210 1,050 840 0 0strongly balanced 210 1,050 840 840 840weakly balanced 210 1,050 840 420 840star 210 1,050 840 210 840
Total 840 4,200 3,360 1,470 2,520
Table 2: Number of observations. Senders are experts who are in a network position with an audience.Non-experts are receivers if they are linked to a sender.
Table 3. Strategy profiles
LTED σ∗ almost LTED sincere σ almost sincere explained
empty 11.0% 41.4% 81.9%(N=210)
strongly balanced 0.0% 2.4% 10.0% 35.2% 81.0%(N=210)
weakly balanced 1.0% 5.7% 7.6% 27.6% 82.9%(N=210)
star 2.4% 12.4% 2.4% 13.8% 90.5%(N=210)
Total 3.6% 15.5% 6.7% 25.6% 84.0%(N=840)
Table 3: Frequency of strategy profiles. A group plays “almost” a strategy profile if there is at most oneplayer whose strategy differs from the profile. An outcome is explained if the actual outcome in a group (i.e.,majority decision A or B) is predicted by at least one of the two strategy profiles, given the distribution ofsignals.
Table 4. Fisher exact tests on (almost) σ∗
strongly balanced weakly balanced star
empty 0.000 (0.000) 0.000 (0.000) 0.001 (0.000)strongly balanced 0.499 (0.135) 0.061 (0.000)weakly balanced 0.449 (0.026)
Table 4: p-values of Fisher exact tests comparing the frequency of the “LTED” strategy profile σ∗ betweentwo treatments. In brackets are the corresponding p-values for almost LTED σ∗. A group plays “almost” σ∗
if there is at most one player whose strategy differs from the profile.
1

2
Table 5. Fisher exact tests on (almost) σ
weakly balanced star
strongly balanced 0.492 (0.115) 0.002 (0.000)weakly balanced 0.023 (0.001)
Table 5: p-values of Fisher exact tests comparing the frequency of the sincere strategy profile σ between twotreatments (in the empty network σ cannot be played). In brackets are the corresponding p-values for almostsincere. A group plays “almost” σ if there is at most one player whose strategy differs from the profile.
Table 6. Behavior of experts
vote signal vote opposite send signal send opposite sincere
empty 919 62 - - 919(N = 1, 050) 87.5% 5.9 % - - 87.5%
strongly balanced 884 75 671 53 798(N = 1, 050) 84.2% 7.1% 79.9% 6.3% 76.0%
weakly balanced 878 74 301 30 803(N = 1, 050) 83.6% 7.1% 71.7% 7.1% 76.5%
star 854 84 128 9 794(N = 1, 050) 81.3% 8.0% 61.0% 4.3% 75.6%
Total 3,535 295 1,100 92 3,314(N = 4, 200) 84.2% 7.0% 74.8% 6.3 % 78.9%
Table 6: Behavior of experts by treatment. The action ‘vote (send) opposite’ means vote (send message) Awhen signal is B∗ and vice versa. In addition to the displayed categories ‘vote signal’ and ‘vote opposite’experts could abstain. In addition to the displayed categories ‘send signal’ and ‘send opposite’ experts couldsend an empty message. Experts without an audience are sincere if they vote their signal. Experts with anaudience are sincere if they vote their signal and also send it.
Table 7. Sincere senders
Logit 1: Send Signal Logit 2: SincereVariable Coefficient (Std. Err.) Coefficient (Std. Err.)
strongly balanced 0.451∗∗∗ (0.175) 0.505∗∗∗ (0.115)star -0.483∗∗ (0.191) -0.486∗∗∗ (0.159)Intercept 0.928∗∗∗ (0.189) 0.619∗∗∗ (0.122)
N 1,470 1,470Log-likelihood -812.55 -884.94Wald χ2
(2) 9.33 19.24
p-value Wald test 0.009 0.000∗p < 0.10,∗∗ p < 0.05,∗∗∗ p < 0.01
Table 7: Estimation results: Logistic regression sincere senders by treatment. Senders are experts with atleast one link. Dependent variable in Model 1 is ‘send signal,’ which is 1 if the expert’s message equals hersignal (and zero otherwise). Dependent variable in Model 2 is sincere behavior, which equals 1 if sender bothsends and votes her signal. Robust standard errors in parentheses adjusted for sessions. Baseline category isthe weakly balanced network.

3
Table 8. Behavior of non-experts
vote message vote opposite vote uninformed sincere
empty - - 265 575(N = 840) - - 31.6% 68.5%
strongly balanced 577 52 29 664(N = 840) 79.7% 7.2% 25.0% 79.1%
weakly balanced 480 37 49 609(N = 840) 72.5% 5.6% 27.5% 72.5%
star 286 66 108 470(N = 840) 52.2% 12.0% 37.0% 56.0%
Total 1,343 155 451 2,318(N = 3, 360) 69.4% 8.0% 31.6% 69.0%
Table 8: Behavior of non-experts by treatment. In the empty network all non-experts are uninformed. In theother networks this happens only if an expert sender chose the empty message. The action ‘vote message’means that A (B) is voted after message A (B) has been received. In addition to the displayed categories‘vote message’ and ‘vote opposite’ non-experts who received message A or B could abstain. In addition to thedisplayed category ‘vote uninformed’ non-experts who received an empty message could abstain. Non-expertswith no message or an empty message are sincere if they abstain. Non-experts with message A (B) are sincereif they vote A (B).
Table 9. Dependent variable: Following of non-experts
Logit 1 Logit 2Variable Coefficient (Std. Err.) Coefficient (Std. Err.)
strongly balanced 0.398 (0.266)weakly balanced -0.398 (0.266)star -0.882∗∗∗ (0.160) -1.280∗∗∗ (0.195)Intercept 0.970∗∗∗ (0.249) 1.367∗∗∗ (0.272)
N 1,934 1,934Log-likelihood -1133.96 -1133.96Wald χ2
(2) 83.96 83.96
p-value Wald test 0.000 0.000∗p < 0.10,∗∗ p < 0.05,∗∗∗ p < 0.01
Table 9: Estimation results: Logistic regression with decision to follow a (non-empty) message as dependentvariable. Robust standard errors in parentheses adjusted for sessions. Baseline category is the weakly balancednetwork in Model 1 and the strongly balanced network in Model 2. Following coincides with sincere behaviorof non-experts who have received message A or B.
Table 10. Individual sincere behavior of non-experts
never always strongly balanced weakly balanced star
strongly balanced 4.8% 57.1% 0.127 0.000weakly balanced 8.33% 46.43% 0.000star 23.8% 29.8%
empty 19.1% 54.8% 0.033 0.545 0.032strongly balanced 1.2% 51.2% 0.008 0.000weakly balanced 0.0% 31.0% 0.000star 1.2% 16.7%
Table 10: Individual behavior of non-experts: for each individual there is a variable capturing the frequency ofsincere actions. The first block restricts attention to instances in which a non-empty message is received andthus reports on following of non-empty vote recommendations. The second block considers all ten decisionsof each individual in each network. In the empty network a non-expert never receives a message. Column 2and 3 report the fraction of participants who never respectively always chose the sincere strategy in the givennetwork. Columns 4-6 of the table show the p-values of Wilcoxon matched-pairs signed-ranks test.

4
Table 11. Fisher exact tests on efficiency
strongly balanced weakly balanced star
empty 0.299 0.543 0.170strongly balanced 0.705 0.117weakly balanced 0.429
Table 11: p-values of Fisher exact tests comparing efficiency between two treatments. Efficiency is 1 ifmajority signal wins, 0 in case of a tie, and −1 if majority signal loses.
Table 12. Dependent variable: Efficiency
ologit 1 ologit 2Variable Coeff. (Std. Err.) Coeff. (Std. Err.)
empty -0.016 (0.185)strongly balanced 0.110 (0.265) 0.095 (0.238)weakly balanced 0.016 (0.185)star -0.236∗ (0.141) -0.252 (0.174)uniform signal 3.173∗∗∗ (0.593) 3.173∗∗∗ (0.593)almost uniform signal 1.579∗∗∗ (0.367) 1.579∗∗∗ (0.367)Intercept cut 1 -1.296 (0.110) -1.311 (0.152)Intercept cut 2 -0.492 (0.121) -0.508 (0.126)
N 840 840Log-likelihood -580.612 -580.612∗p < 0.10,∗∗ p < 0.05,∗∗∗ p < 0.01
Table 12: Estimation results: Ordered logit. Efficiency is 1 if majority signal wins, 0 in case of a tie, and−1 if majority signal loses. Robust standard errors in parentheses adjusted for sessions. Less clusters thanparameters simply mean that joint significance (Wald test) cannot be tested. The first model uses the emptynetwork as baseline category. The second model uses the weakly balanced network as baseline category.

A.2 General Model and Proofs
We now take the model as it is defined in section 2 and integrate the following two exten-
sions. First, we relax the assumptions that only experts receive signals and that all experts’
signals are of equal quality p. Instead we assume that every agent i receives a signal with
idiosyncratic signal quality pi ∈[12 , 1). Second, we relax the assumptions on the network
structure. We now admit arbitrary network structures in which agents can receive multiple
messages and be informed by nature in addition.
A.2.1 Set-Up
As before, nature draws one state of the world ω ∈ {A,B} with uniform probability.
There is a finite set of voters V . All agents i ∈ V receive a private independent signal
si ∈ {A∗, B∗} about the true state of the world with quality pi = Pr {si = A∗ | ω = A} =
Pr {si = B∗ | ω = B} ∈[12 , 1). Let gV be the set of all subsets of V of size two. A network
g ⊆ gV represents the communication structure between the agents. A voter of degree di ≥ 1
is called sender and all voters linked to her are called her neighbors, who are denoted by
Vi := {j ∈ V | ij ∈ g}.The voting stage and the preferences are as defined in section 2. In particular, after
receiving the signal, each agent may send message “A” or message “B” or an empty message
∅ to her neighbors. Then, all agents simultaneously participate in the majority vote. Note
that senders may be neighbors of other senders now. Strategies can now be defined as follows:
A communication strategy mi of a voter i ∈ V with di ≥ 1 defines which message to send for
each signal received, i.e. mi : {A∗, B∗} → {A,B, ∅}. A voting strategy vi of a voter i ∈ Vdefines whether and how to vote for each signal received and for each profile of messages
received, i.e. vi : {A∗, B∗} × {A,B, ∅}di → {A,B, ∅} if di ≥ 1 and σj : {A∗, B∗} → {A,B, ∅}if dj = 0. Again, we denote by σi = (mi, vi) a communication and voting strategy of a voter
and by σ = (σi)i∈V a strategy profile.57
In the general model the definition of experts and non-experts has to be reconsidered.
Order the voters by their signal quality in decreasing order such that p1 ≥ p2 ≥ ... ≥ p|V | (in
case of equalities fix any such order) and consider the m best informed voters as the experts,
i.e., set M := {j1, j2, ..., jm} ⊆ V with pm > 12 . Consistently, the LTED strategy profile σ∗,m
will be parametrized by the number of experts m, which we require to be odd.58
In the simple model with homogeneous signal precision, the “expertise” of a set of voters
could be assessed simply by the number of signals they have received, which is the number
of experts in the set. For idiosyncratic signal precision, each signal must be considered with
its quality pi. The optimal aggregation rule weights each signal with its “log-odds” weight
log( pi1−pi ) (Nitzan and Paroush, 1982; Shapley and Grofman, 1984). Hence, a set of voters
S is better informed than another set S′ if and only if∑
i∈S log( pi1−pi ) >
∑j∈S′ log(
pj1−pj ),
which simplifies to∏
i∈Spi
1−pi >∏
j∈S′pj
1−pj .
57This model nests our model of section 2 as follows. Let experts M ⊆ V be a subset of voters whoreceive an informative signal of quality pj = p > 1
2and let N = V \M be the non-experts, whose signal is
uninformative, i.e. pi = 12. Moreover, we assumed that g is bipartite such that all links involve exactly one
expert and one non-expert and that non-experts have at most one link.58The profile σ∗,m could also be called “let some(!) experts decide.”
5

In this more general set-up the definition of the sincere strategy profile σ has to be
extended since voters may receive multiple messages, while still all voters with an informative
signal communicate their signal. Consistent with the tag “sincere” we assume that agents
vote for the message that has the higher posterior probability to coincide with the true state,
given their private information, i.e., a voter i who has received signal A∗ from nature and
message A by the subset S of her neighbors Vi votes for A if and only if∑
j∈S∪{i} log(pj
1−pj ) >∑k∈Vi\(S∪{i}) log( pk
1−pk ) and abstains if indifferent; and vice versa for a voter who has received
signal B∗. For a voter j who talks to agents with a sufficiently low signal quality (i.e.
log(pj
1−pj ) >∑
k∈Vilog( pk
1−pk )) this simply means to vote in line with her signal. For a voter
without an informative signal who listens to some equally well-informed experts, σ means to
vote in line with the message A or B that he has received more often; if both messages have
been received equally frequently or if there is no message at all, he abstains. We can now
reconsider our three theoretical results, Propositions 2.1 - 2.3, in the more general set-up.
A.2.2 “Let the experts decide” Revisited
Propositions 2.1 shows for the particular model that the LTED strategy profile σ∗ is efficient
and an equilibrium. In the general model, every odd number m = 1, 3, 5, ... that is not
larger than the number of informed agents defines a LTED strategy profile σ∗,m, in which
all members of M vote their signal and all voters outside of M abstain. We find that each
of these strategy profiles is an equilibrium and that efficiency holds at least asymptotically.
Proposition A.1 (LTED, general). There exist equilibria for any network structure. For
instance, for any odd number m of experts (i.e., m voters with signal precision strictly
above 12 and weakly above all other voters’), the LTED strategy profile σ∗,m is an equilibrium
for any network structure. This strategy profile is efficient if and only if∏
j∈M ′pj
1−pj ≥∏k∈V \M ′
pk1−pk , where M ′ := {jm+1
2, jm+3
2, ..., jm} ⊆ M is the set of the m+1
2 experts with
the lowest signal precision. Moreover, letting the number of experts m grow in this strategy
profile σ∗,m, the probability of a correct decision approaches one.
Proof. We address equilibrium, efficiency, and the limit case in turn.
Equilibrium. We first show that σ∗,m is an equilibrium for any odd m. We start with showing
that the experts j ∈M indeed prefer to vote their signal, then we turn to showing that the
non-experts indeed prefer to abstain.
W.l.o.g. consider an expert j who has received signal A∗. He is pivotal if and only if A
wins by one vote (m is odd). This happens if and only if there is a set of experts S of sizem−12 who have received signal A∗ as well, while the m−1
2 remaining experts M \ (S ∪ j) have
received the signal B∗. Given that we are in this case (j has received signal A∗, all agents
in S have received signal A∗, and all agents in M \ (S ∪ j) have received signal B∗), A is
weakly more likely to be true than B if and only if
pj ·∑
S⊂M\j:|S|=m−12
∏i∈S
pi ·∏
k∈M\(S∪j)
(1−pk) ≥ (1−pj) ·∑
Q⊂M\j:|Q|=m−12
∏i∈Q
(1−pi) ·∏
k∈M\(Q∪j)
pk.
(A.1)
6

We observe that for every set “S” in the summation on the LHS of (A.1), there is a comple-
mentary set “Q” in the summation on the RHS: Q = (M \ j) \S. Each pair of “S” and com-
plementary “Q” cancel each other out when computing the products∏
i∈S pi ·∏
k∈M\(S∪j)(1−pk) =
∏k∈M\(Q∪j) pk ·
∏i∈Q(1− pi). Therefore, we get
∑S⊂M\j:|S|=m−1
2
∏i∈S
pi ·∏
k∈M\(S∪j)
(1− pk) =∑
Q⊂M\j:|Q|=m−12
∏k∈M\(Q∪j)
pk ·∏i∈Q
(1− pi),
which yields that (A.1) holds if and only if pj ≥ 1−pj , which holds by assumption. Thus,
j ∈M does not deviate from voting the received signal.
Now, we turn to a non-expert i ∈ V \M . Suppose w.l.o.g. that he has received signal
A∗. Then he is pivotal if and only if B wins by one vote under σ∗,m. This happens if and
only if there is a set of experts S ⊂M of size m−12 who has received signal A∗ and the m+1
2
remaining experts M \ S have received signal B∗. Given that we are in this case (i and all
experts in S have received signal A∗ and all experts in M \ S have received signal B∗), A is
weakly less likely to be true than B if and only if
pi ·∑
S⊂M :|S|=m−12
∏j∈S
pj ·∏
k∈M\S
(1− pk) ≤ (1− pi) ·∑
Q⊂M :|Q|=m−12
∏j∈Q
(1− pj) ·∏
k∈M\Q
pk. (A.2)
For every summand S on the LHS there is a summand Q on the RHS which almost
coincides but differs in two factors, e.g.
S : p1p2...pm−12· (1− pm+1
2)(1− pm+3
2)...(1− pm) · pi
Q : (1− pm)(1− pm−1)...(1− pm+32
) · pm+12pm−1
2...p1 · (1− pi)
differ in the factors pi and (1 − pi) and the factors pm+12
and (1 − pm+12
). For a pair S,Q
that differs in the factor pk and (1 − pk), besides pi and (1 − pi), let k(S) := k and let
α(S) > 0 be the common part of S and Q. Then we can reorganize (A.2) by subtracting the
right-hand side (RHS) on both sides and expressing the common and different part of each
pair as follows: ∑S⊂M :|S|=m−1
2
α(S) · [(1− pk(S)) · pi − pk(S) · (1− pi)] ≤ 0. (A.3)
We observe that (1 − pk(S)) · pi ≤ pk(S) · (1 − pi) for pi ≤ pk(S), which holds by assumption
because signal precision of non-expert i is by definition smaller than of any expert k(S).
Thus, A.3 holds. Hence, for a non-expert i pivotality implies that the outcome of the vote
is more likely to be correct than what he can induce with a deviation.
Efficiency. We now show that σ∗,m is efficient if and only if the following condition holds:
(*)∏
j∈M ′pj
1−pj ≥∏
k∈V \M ′pk
1−pk , where M ′ := {jm+12, jm+3
2, ..., jm} ⊆ M is the set of the
m+12 experts with the lowest signal precision.
For a given draw of nature denote by S the set of agents who have received signal A∗.
7

Generally, a strategy profile is efficient if and only if the outcome is A whenever A is more
likely to be the true state than B, i.e., whenever∑j∈S
log(pj
1− pj) >
∑k∈V \S
log(pk
1− pk) (A.4)
and the outcome is B whenever inequality A.4 is reversed (e.g., Shapley and Grofman, 1984,
Theorem II).
Suppose, σ∗,m is efficient. Consider the draw of nature S = M ′, i.e., in which all members
of M ′ have received signal A∗, while all others have received signal B∗. Since m′ > m2 , A
wins under σ∗,m. By efficiency it must hold that∑
j∈S log(pj
1−pj ) ≥∑
k∈V \S log( pk1−pk ), which
is equivalent to∏
j∈M ′pj
1−pj ≥∏
k∈V \M ′pk
1−pk , i.e., condition (*) is satisfied.
Now suppose condition (*) is satisfied. Since M ′ is the smallest majority of experts with
the least expertise, any set S ⊇ M ′ holds more expertise than M ′ such that condition (*)
is equivalent to∑
j∈S log(pj
1−pj ) ≥∑
k∈V \S log( pk1−pk ) if and only if |M ∩ S| > m
2 . Take any
draw of nature and denote by S the set of agents who have received signal A∗. Suppose first
that inequality A.4 holds. Then by (*), |M ∩ S| > m2 holds. Under σ∗,m the outcome is A.
Suppose the reverse of inequality A.4 holds. Then by (*), |M ∩ S| < m2 holds and B wins.
Hence, σ∗,m is efficient.
Limit. Finally, we show that letting the number of experts m grow in this strategy profile
σ∗,m, the probability of an efficient outcome approaches one.
For every m, the probability of an efficient outcome under σ∗,m is larger than in the
hypothetical case that every expert in M has signal precision pm > 0.5 (which is the lowest
among the experts) and also votes her signal. For the hypothetical case, the Condorcet
Jury theorem applies, showing that the probability of a correct decision approaches one as
m→∞. Hence, this is also true for σ∗,m.
This result shows robustness of the LTED equilibrium to the two extensions. First,
trivially, more general network structures cannot affect an equilibrium which does not involve
information transmission. Second, the LTED equilibrium extends to heterogeneous signal
precisions. Efficiency of LTED, however, only holds in finite populations if even the weakest
majority of experts (M ′) holds more expertise than the strongest minority of experts together
with all non-experts. This means that efficiency in finite populations requires that the
experts’ signal quality is not too heterogeneous and that the non-experts’ signal quality is
sufficiently low, compared to the experts’.
However, we show in the proof of Proposition A.1 (in Appendix A.2) that the potential
inefficiency of LTED vanishes when the absolute number of experts m grows large. In that
sense not only existence, but also efficiency of LTED extends to the general model.
A.2.3 Sincere Voting Revisited
We now turn to the extension of Propositions 2.2 and hence to the sincere equilibrium σ.
The intuition that the sincere equilibrium σ requires a network structure that balances a
8

group of experts’ “expertise” with their “power” fully carries over. We only have to extend
the notion of balancedness, which requires some additional notation.59
For a fixed set of agents S ⊆ V , partition the voters V into believers V +(S), non-
believers V −(S), and neutrals V 0(S) as follows: i is called a believer of the set S, i.e.
i ∈ V +(S), if, from what i can observe in his neighborhood (Vi ∪ i), S is better informed
than the complementary set, i.e.∑
j∈(Vi∪i)∩S log(pj
1−pj ) >∑
k∈(Vi∪i)\S log( pk1−pk ). Analo-
gously, i is called a non-believer of the set S, i.e. i ∈ V −(S), if, from what i can ob-
serve in his neighborhood (Vi ∪ i), S is less well-informed than the complementary set, i.e.∑j∈(Vi∪i)∩S log(
pj1−pj ) <
∑k∈(Vi∪i)\S log( pk
1−pk ). Finally, i is called a neutral with respect
to the set S, i.e. i ∈ V 0(S), if he is neither a believer nor a non-believer, which happens
when the above condition holds with equality. In the special case of homogenous signal
precision, the number of links into a given set S determines whether an agent is a believer,
a non-believer, or a neutral.
Definition A.1 (Balancedness, general). (a) Given a profile of signal precisions pj, a net-
work is called “strongly balanced” if every set of voters which is better informed than
the complementary set has more believers than non-believers, i.e. ∀S ⊆ V ,∏
j∈Spj
1−pj >∏k∈V \S
pk1−pk implies |V +(S)| > |V −(S)|.
(b) For a voter i ∈ V , let Si collect all sets of voters S, of which i is a believer, i.e.
i ∈ V +(S), and which have slightly more believers than non-believers, i.e. |V +(S)| −|V −(S)| ∈ {0, 1, 2}. Let Qi collect all subsets of these sets that belong to i’s neigh-
borhood, i.e. Qi := {Q ⊆ V |Q = (Vi ∪ i) ∩ S for some S ∈ Si}. A network is called
“ weakly balanced” if for every voter i ∈ V and for every Q ∈ Qi, there is a corre-
sponding set of agents S with Q ⊆ S ∈ Si, which is weakly better informed than the
complementary set, i.e.∏
j∈Spj
1−pj ≥∏
k∈V \Spk
1−pk .
Strong balancedness requires that any group of voters S which is better informed than
the complementary set is also considered as better informed by a majority of voters. Weak
balancedness addresses groups of voters Q within a given voter’s neighborhood, which to-
gether with some voters outside of the neighborhood would have slightly more believers than
non-believers. When the agent is a believer of such a group Q, there must be one corre-
sponding group of voters outside the agent’s neighborhood such that both groups together
are weakly better informed than the complementary set.
Proposition A.2. The sincere strategy profile σ is efficient if and only if the network is
strongly balanced. The sincere strategy profile σ is an equilibrium if (a) the network is strongly
balanced and only if (b) the network is weakly balanced.
Proof. We begin with strong balancedness and then turn to weak balancedness. Strong
balancedness. We first show equivalence between strong balancedness and efficiency of σ.
For a given draw of nature denote by S the set of experts who have received signal A∗.
Generally, a strategy profile is efficient if and only if the outcome is A whenever A is more
59Applying the corresponding upcoming Definition A.1 to the specific set-up of section 2 leads to a notionof balancedness that is equivalent to Definition 2.2. This is shown in SOM B.3.
9

likely to be the true state than B, i.e., whenever∑j∈S
log(pj
1− pj) >
∑k∈V \S
log(pk
1− pk) (A.5)
and the outcome is B whenever inequality A.5 is reversed (e.g., Shapley and Grofman, 1984,
Theorem II). Now, consider that under σ an agent i votes A if and only if he is a believer
of the group S who have received signal A∗, i.e. i ∈ V +(S). Indeed, a voter i ∈ V votes A if
and only if A has the higher posterior probability to be the true state of the world given i′s
information, which is∑
j∈(Vi∪i)∩S log(pj
1−pj ) >∑
k∈(Vi∪i)\S log( pk1−pk ), which is the definition
of i ∈ V +(S). Hence, the number of A votes is |V +(S)|, while the number of B votes is
|V −(S)| (again, for the draw of nature that gives signal A∗ to S and signal B∗ to V \ S).
If inequality A.5 holds, then strong balancedness implies |V +(S)| > |V −(S)| such that
A receives a majority of votes. If inequality A.4 is reversed, then by strong balancedness
B receives a majority of votes. If the RHS and LHS of inequality A.5 are equal, then both
states of the world are equally likely and any outcome is consistent with efficiency. Hence,
strong balancedness implies efficiency of σ.
Now, suppose that g is not strongly balanced. Then there is a set S ⊆ V with∑
i∈S log( pi1−pi ) >∑
j∈V \S log(pj
1−pj ), but |V +(S)| ≤ |V −(S)|. Suppose all i ∈ S receive signal A∗ and all
j ∈ V \ S receive signal B∗. Then σ leads to outcome B or to a tie, while A is more likely
to be true. Hence, efficiency of σ requires strong balancedness. (We have established that σ
is efficient if and only if the network is strongly balanced.)
Efficiency of a strategy profile implies that it is an equilibrium, since every player’s ex-
pected utility is maximal.
Weak balancedness. Suppose weak balancedness is violated, i.e., there is a voter i ∈ V and
a set Q ∈ Qi, such that there is no corresponding set of agents S with Q ⊆ S ∈ Si and∏j∈S
pj1−pj ≥
∏k∈V \S
pk1−pk , i.e., which is weakly better informed than the complementary
set. Then ∀S ∈ Si, we have∑
j∈S log(pj
1−pj ) <∑
k∈V \S log( pk1−pk ) and Si 6= ∅ because Qi 6= ∅
by assumption.
Consider a draw of nature such that within i’s neighborhood all voters in Q have received
signal A∗ and all others (Vi∪ i)\Q have received signal B∗. Since i ∈ V +(S) for Q ⊆ S ∈ Si,it also holds that i ∈ V +(Q), and i will vote for A under σ.
Consider the deviation of i to vote B in this case (i.e., when from his own signal and the
messages of Vi, i infers that within (Vi ∪ i) exactly subset Q has received signal A∗). Let X
denote the set of other agents j ∈ V \ (Vi ∪ i) who have received signal A∗. If (Q ∪X) /∈ Si,then the deviation has not affected the outcome since it is not the case that there is a slight
majority for alternative A under σ. If (Q ∪ X) ∈ Si, then the deviation has turned the
outcome from A to B, or from A to a tie, or from a tie to B. This improves expected utility
if the probability that B is the true state is larger than that A is true. By the property that
∀S ∈ Si, we have∑
j∈S log(pj
1−pj ) <∑
k∈V \S log( pk1−pk ), B is indeed more likely to be true
than A. Hence, when weak balancedness is violated there is a beneficial deviation from σ.
10

To interpret Proposition A.2 part (a), consider first the special case of homogenous
signal precision pi = p for all voters i. Strong balancedness then means that every voter i
is equally powerful.60 Turning to heterogeneous signal precision, strong balancedness means
that heterogeneity in expertise is matched by the heterogeneity in power. For instance, as
we have discussed, in Example 2, the star network, as well as in Example 3, sincere voting
is not efficient for homogeneous signal precision. However, in Example 2 sincere behavior
σ would be efficient if signal precisions were, e.g., (p1, ..., p9) = (.9, .6, .6, .6, .6, .5, .5, .5, .5).
Similarly, in Example 3, sincere behavior would be efficient if, e.g., signal precisions were
(p1, ..., p9) = (.9, .9, .6, .6., .6, .5, .5, .5, .5). Hence strong balancedness does not generally refer
to an equality of power, but rather to a balance of power with expertise.61
To interpret Proposition A.2 part (b), consider an agent i who observes message A from
all agents in a set Q, of which i is a believer. Sincere behavior is to follow this message.
Deviations from sincere behavior only affect the outcome when the number of A votes under
σ is slightly larger than the number of B votes. Suppose that in any of those cases A is
less likely to be true than B. Then i can beneficially deviate from σ by voting B. We have
constructed a violation of weak balancedness and argued that then σ is not an equilibrium.
In fact, the agent i in the example is “cursed” in the sense that when he follows the vote
recommendations of the set Q whenever his vote has an effect, it has the undesirable effect
of switching the outcome to the less likely state.
This is illustrated by the following example.
Example 4 (not weakly balanced). Let V = {i1, i2, ..., i9}, the network g as illustrated in
Figure A.1, and let the signal precision of all agents i be equal pi = p > 12 . This network
violates weak balancedness: Consider agent i1 and set Q = {i2, i3}. Agent i1 is a believer
of set Q since he assigns more expertise to this set ((V1 ∪ i) ∩ Q = {i2, i3}) than to the
complementary set, of which he can only observe himself ((V1 ∪ i) \ Q = {i1}). There
are many elements in S1. For instance, Q together with X = {i8, i9} forms a set S =
{i2, i3, i8, i9} ∈ S1, which indeed has slightly more believers than non-believers since there are
five believers ({i1, i2, i3, i8, i9}) and four non-believers ({i4, i5, i6, i7}). Other examples that
contain set Q are S′ = {i2, i3, i8, i4} ∈ S1, or S′′ = {i2, i3, i4, i5} ∈ S1. Indeed, each of these
sets has slightly more believers than non-believers. However, there is no extension of Q in
S1, which contains more than four players. Weak balancedness would require that at least
one S with Q ⊆ S ∈ S1 is better informed than the complementary set, but this is not true
when only a minority of informed agents are in S. Thus, by Proposition A.2 part (b), the
sincere strategy profile σ is not an equilibrium.
In the example, agent i1 has an incentive to deviate from the sincere strategy profile
when he infers from their messages that the agents Q = {i2, i3} have received, e.g., signal
A∗, while he has received signal B∗. Given this private information, A is clearly more likely to
60This result is shown as Proposition B.6 in SOM B.4. Power is defined as the Shapley-Shubik index orthe Banzhaf index in a cooperative voting game that incorporates how many believers each coalition has.SOM B.4 introduces this framework, provides the result, and also gives some intuition for how individualpower is determined by the network structure.
61With our experimental design we purposefully keep expertise constant among experts to observe unbal-anced power directly in the network structure.
11

Neighborhood
5 6
1
3 4
9
2 7 8
1
2 4 5 6 7
Neighbor‐hood
8
9
3
Figure A.1: Example 4, a network in which weak balancedness is violated. Voter i1 is “cursed” if his signaldiffers from the signals of voters i2 and i3.
be true than B since two out of three “observable” voters have received signal A∗. However,
conditioning on pivotality implies that at least five voters (e.g. {i1, i4, i5, i6, i7}) must have
received signal B∗. Thus, in this situation the unconditional posterior of voter i1 differs
crucially from the posterior conditional on pivotality, which is the reason for the “swing
voter’s curse.” The source of this curse is the power of agents i2 and i3 regarding the votes
of agents i1, i8, and i9.
More generally, suppose there is an agent who observes a set of agents Q sending the
same message, say A. If for any additional set of agents whose votes for A would render i
pivotal (call this set X), it holds that these two sets together are less well-informed than the
complementary set V \ (Q ∪X), then voting for A is not a best response.
Inefficient equilibria revisited. Turning to Proposition 2.3, the existence of inefficient
equilibria with information transmission trivially extends to the more general framework.
Thus, there are network structures and distributions of expertise that lead to inefficient
equilibria.
Proposition A.3. There are networks in which the sincere strategy profile σ is both an
equilibrium and exhibits informational inefficiency. This inefficiency does not necessarily
vanish when the number of experts grows large.
Proof. We show existence of inefficient strategy profiles with the network introduced in
Example 3. For any t = 1, 2, ... we consider a network with two experts of degree 2t, 1 + 2t
experts of degree zero and 4t non-experts of degree one. For t = 1 this is exactly the network
depicted in Figure 2. All experts have signal quality pj = p > 0.5, all non-experts signal
quality pi = 0.5. For any t = 1, 2, ..., denote the corresponding game by Γt and the sincere
strategy profile in that game by σt.
Under σt, 3+6t agents participate in the vote. If the two senders receive the same signal,
say A∗, then A is the outcome since the two senders induce 2 ∗ (1 + 2t) ≥ 2 + 3t A-votes.
If both senders receive different signals, A∗ and B∗, then A wins if and only if A receives
k ≥ 1 + t votes of the 1 + 2t experts with degree zero. Supposing that A is the true state,
the probability that the outcome is A provides the general probability that the outcome
12

coincides with the true state since σt treats A and B interchangeably. Thus, under σt the
probability that the outcome coincides with the true state is
EU(σt) = p2 ∗ 1 + 2p(1− p)2t+1∑k=t+1
(2t+ 1
k
)pk(1− p)2t+1−k + (1− p)2 ∗ 0. (A.6)
Inefficiency. We establish inefficiency of σt for any t and also in the limit. (Recall that a
strategy profile is efficient if and only if for any draw of nature it selects the outcome that
maximizes the probability to match the true state.) Consider the draw of nature in which
both senders receive signal A∗ and all other experts receive signal B∗. An efficient strategy
profile would implement (the majority signal) B∗, but σt leads to A.
For an efficient strategy profile σt the probability that the outcome coincides with the
true state is below one for finite t, but converges to one for growing t, i.e. limt→∞EU(σt) = 1
when σt efficient. Under σt, when both senders happen to receive the incorrect signal, then
the outcome does not coincide with the true state. Thus, the probability of implement-
ing the incorrect outcome under σt is at least (1 − p)2, which is independent of t. Hence,
limt→∞EU(σt) ≤ 1− (1− p)2 < 1, i.e., inefficiency does not vanish for growing t.
Now, we establish that σt is an equilibrium for any t. We show first that there is no
profitable deviation that occurs on the voting stage only. Then we show that there is no
profitable deviation that affects both stages voting and communication.
Deviations on the voting stage only. Consider a voter i ∈ V who considers to deviate from
σt by changing his voting strategy vi. This can be a non-expert who does not follow the
received message or an expert who does not vote the received signal, but chooses some
different strategy instead.
Suppose one sender (i.e., a voter with pj = p > 0.5 and dj = 2t) receives signal A∗ and
the other sender receives signal B∗. Then A receives more votes than B under σt if and only
if more experts with degree zero (i.e., voters with pj = p > 0.5 and dj = 0) have received
signal A∗. Hence, when the two senders have not received the same signal, then σt always
implements the majority signal and thus induces the outcome that is more likely to be true.
Hence, if there is a beneficial deviation, then it must also change outcomes in which both
senders have received the same signal.
Suppose that both senders have received the same signal, say A∗. Then the number of
A-votes under σt is at least 2 + 4t (since two senders, and 2 ∗ 2t non-experts vote for A) and
the number of B-votes is hence at most 3 + 6t − (2 + 4t) = 1 + 2t. The number of A-votes
thus exceeds the number of B-votes by at least 2 + 4t− (1 + 2t) = 1 + 2t ≥ 3 votes. Hence, a
single agent who changes her vote cannot affect the outcome if the two senders have received
the same signal.
Taken together a deviation that only changes one vote is neither beneficial if both senders
have received the same signal nor if they have received different signals. This precludes devi-
ation incentives of non-experts, of experts with degree zero, as well as of senders who consider
to deviate in their voting behavior only, i.e., all deviations that happen on the voting stage
13

only. We now turn to deviations that also affect the communication stage, i.e., which involve
a sender who does not truthfully transmit her signal, and show that any of those is neither
beneficial.62
Deviations on both stages. Consider a sender j ∈ V with dj > 0. This expert has (3×3)2 = 81
strategies because she chooses one of three messages and one of three voting actions after
receiving one of two signals.63 To evaluate different strategies we can assume w.l.o.g. that the
expert has received signal A∗ because neither the utility function nor the strategy profile de-
pends on the label of the alternatives. This reduces the number of strategies to the following
nine: (mj(A∗), vj(A
∗)) ∈ {(A,A), (A,B), (A, ∅), (B,A), (B,B), (B, ∅), (∅, A), (∅, B), (∅, ∅)}.The first strategy (A,A) is sincere and hence not a deviation. The strategies (A,B) and
(A, ∅) only involve deviations on the voting stage and are hence not beneficial by the para-
graph above. This leads to the following six remaining deviations σ and their corresponding
expected utilities EU(σt):64
1. Sender j sends the opposite message and votes the signal.
EU(σt) = p22t+1∑k=t
(2t+ 1
k
)pk(1− p)2t+1−k + p(1− p) + (1− p)2
2t+1∑k=t+2
(2t+ 1
k
)pk(1− p) (A.7)
2. Sender j sends the opposite message and votes the opposite.
EU(σt) = [p2 + (1− p)2]2t+1∑k=t+1
(2t+ 1
k
)pk(1− p)2t+1−k + p(1− p) (A.8)
3. Sender j sends the opposite message and abstains.
EU(σt) = p2[
1
2
(2t+ 1
t
)pt(1− p)t+1 +
2t+1∑k=t+1
(2t+ 1
k
)pk(1− p)2t+1−k
]
+ p(1− p) + (1− p)2[
1
2
(2t+ 1
t+ 1
)pt+1(1− p)t +
2t+1∑k=t+2
(2t+ 1
k
)pk(1− p)2t+1−k
] (A.9)
62For large t this is simple to show. In the case in which the deviating agent receives the correct signal, sayA∗, and the other sender receives the incorrect signal, the probability that the outcome is A approaches zerofor growing t. Hence, the expected utility of any such deviation is bounded from above by limt→∞EU(σt) ≤1− p(1− p) < 1− (1− p)2 = limt→∞EU(σt).
63In general, voters with positive degree di > 0 have more pure strategies. In this example, the sendersare linked to non-experts (i.e voters i with pi = 0.5) who are assumed by convention not to send a messageunder σt. Since a message of an uninformed voter is meaningless, a change of convention would not affectthe result.
64Deviations that involve to vote and/or communicate an alternative unconditionally, i.e., independent ofthe signal, need not be considered here because of the symmetry between the alternatives. Indeed, if it isbeneficial to vote B after receiving A∗, then it is also beneficial to vote A after receiving B∗, which is to votethe opposite of the signal. Similarly, there is no need to consider strategies that involve the empty messageand/or to abstain only after one of the two signals. Indeed, if it is beneficial e.g. to abstain after havingreceived signal A∗, then it is also beneficial to abstain after having received signal B∗, which is to abstainunconditionally. Hence, if none of the six symmetric deviations is an improvement over σt, then neither is adeviation that treats the alternatives A and B asymmetrically.
14

4. Sender j sends the empty message and votes the signal.
EU(σt) = p2 + p(1− p)p2t+1 + p(1− p)2t+1∑k=1
(2t+ 1
k
)pk(1− p)2t+1−k (A.10)
5. Sender j sends the empty message and votes the opposite.
EU(σt) = p22t+1∑k=1
(2t+ 1
k
)pk(1− p)2t+1−k + p(1− p) + (1− p)2p2t+1 (A.11)
6. Sender j sends the empty message and abstains.
EU(σt) = p2[1− 1
2(1− p)2t+1] + p(1− p)1
2p2t+1 + p(1− p)[1− 1
2(1− p)2t+1] + (1− p)2 1
2p2t+1 (A.12)
The derivation of the expressions (A.7)-(A.12) is shown in SOM B.5. We can now compare
the expected utility EU(σt) of each deviation, which is given by (A.7)-(A.12), with the ex-
pected utility of the sincere strategy profile EU(σt), which is given by (A.6).
Consider, for instance, the fifth deviation: Sender j sends the empty message and votes
the opposite of the signal. There are 3 + 4t votes and 2 + 2t is a majority. Denote by (sj , sk)
the signals of the two senders. There are four possibilities.
• (A∗, A∗): A wins if there are at least 2+2t− (1+2t) = 1 A∗-signals among the experts
of degree zero.
• (A∗, B∗): A never wins since B receives at least 2 + 2t votes.
• (B∗, A∗): A wins since it receives at least 2 + 2t votes.
• (B∗, B∗): A wins if there are at least 2 + 2t− 1 = 2t+ 1 A∗-signals among the experts
of degree zero, i.e., all of them have signal A∗.
We now show that this deviation is not beneficial by considering the change in expert j’s
expected utility (which is the expected utility of every agent). Supposing that the true state
is A, the expected utility is the likelihood that A is indeed implemented. Hence,
EU(σt) = p22t+1∑k=1
(2t+ 1
k
)pk(1− p)2t+1−k + p(1− p) ∗ 0 + p(1− p) ∗ 1 + (1− p)2p2t+1,
which directly simplifies to (A.11).
For the upcoming simplifications we use the following two properties:
1.∑2t+1
k=0
(2t+1k
)pk(1− p)2t+1−k = 1 and
2.(2t+1k
)=(
2t+12t+1−k
)for any k = 0, ..., 2t+ 1.
Let ∆ := EU(σt)− EU(σt). Then
∆ = p2
[1−
2t+1∑k=1
(...)
]+ p(1− p)
[2
2t+1∑k=t+1
(2t+ 1
k
)pk(1− p)2t+1−k − 1
]− (1− p)2p2t+1
15

∆ = p2
[2t+1∑k=0
(...)−2t+1∑k=1
(...)
]+ p(1− p)
[2
2t+1∑k=t+1
(2t+ 1
k
)pk(1− p)2t+1−k − 1
]−(1− p)2p2t+1
∆ = p2(1− p)2t+1 + p(1− p)
[2t+1∑k=t+1
(...)−2t+1∑k=0
(...)
]︸ ︷︷ ︸
=−∑t
k=0(...)
+ p(1− p)2t+1∑k=t+1
(...)− (1− p)2p2t+1
︸ ︷︷ ︸≥p(1−p)
∑2tk=t+1(...)
To simplify the last part of the equation notice the following:
• First,∑2t+1
k=t+1(pk(1− p)2t+1−k =
∑2tk=t(p
k(1− p)2t+1−k +(2t+12t+1
)p2t+1(1− p)0.
• Second,(2t+12t+1
)p2t+1(1− p)0 = p2t+1.
• Third, p(1− p)p2t+1 − (1− p)2p2t+1 = [p(1− p)− (1− p2)]p2t+1 ≥ 0.
Thus,
∆ ≥ p2(1− p)2t+1 − p(1− p)t∑
k=0
(2t+ 1
k
)pk(1− p)2t+1−k + p(1− p)
2t∑k=t+1
(...)
∆ ≥ p2(1− p)2t+1 − p(1− p)(
2t+ 1
0
)p0(1− p)2t+1︸ ︷︷ ︸
≥0
−p(1− p)t∑
k=1
(...) + p(1− p)2t∑
k=t+1
(...)
∆ ≥ p(1− p)︸ ︷︷ ︸≥0
[2t∑
k=t+1
(2t+ 1
k
)pk(1− p)2t+1−k −
t∑k=1
(2t+ 1
k
)pk(1− p)2t+1−k
]
Hence, ∆ ≥ 0 if
2t∑k=t+1
(2t+ 1
k
)pk(1− p)2t+1−k ≥
t∑k=1
(2t+ 1
k
)pk(1− p)2t+1−k. (A.13)
To show that inequality A.13 holds, we substitute k in the first sum by l ≡ 2t + 1 − k
and consistently sum over l = 1, ..., t (instead over k = t + 1, ..., 2t). Moreover, we use(2t+1k
)=(
2t+12t+1−k
).
t∑l=1
(2t+ 1
l
)p2t+1−l(1− p)l −
t∑k=1
(2t+ 1
k
)pk(1− p)2t+1−k ≥ 0
t∑l=1
(2t+ 1
l
)(p2t+1−l(1− p)l − pl(1− p)2t+1−l
)≥ 0.
For every l = 1, ..., t, we have 2t + 1 − l > l. This implies for the expression in brackets
that the first product (p2t+1−l(1 − p)l) is larger than the second product (pl(1 − p)2t+1−l).
Hence, the inequality above holds, which implies inequality A.13. Thus, EU(σt) ≥ EU(σt)
and hence this deviation σt is not beneficial.
16

Using the same techniques as for this deviation, we can show for all six deviations σt
that EU(σt) ≤ EU(σt).65 Hence, no deviation that involves both stages communication and
voting is profitable either.
A.2.4 Multiplicity
In the sincere strategy profile σ, all communication channels, i.e., links in g, are used.
Generally, the information transmission network g∗ under some strategy profile σ need not
coincide with the exogenous network g, but can be any subnetwork (g∗ ⊆ g) of it, which
uses some but not necessarily all of the given communication channels (cf. SOM B.2). For
instance, any network g that contains a subnetwork g′ ⊆ g which satisfies strong balancedness
admits an efficient equilibrium by using the subnetwork as communication network, i.e.,
g∗ = g′. Our model extension admits denser networks g and hence gives rise to many
more information transmission networks g∗ ⊆ g than our baseline model. As a consequence,
coordination on an efficient equilibrium might become even harder than in the baseline
model.
Private versus public communication. With overlapping audiences, we can not only
model private communication but also public communication. Communication is fully public
if the network g is complete (g = gV ), i.e., every voter is linked to every other voter. In
that case, the sincere strategy profile σ is efficient and an equilibrium. In this deliberation
equilibrium the optimal alternative can be deduced by every voter such that this information
aggregation within each individual determines votes unanimously (and other voting rules
than the majority rule would also admit a similar equilibrium, cf. Gerardi and Yariv, 2007).
More generally, in every network g, in which a non-empty subset S of voters is linked to all
informed voters, there are efficient equilibria in which the members of S vote for the more
likely alternative. This is how public communication admits efficient information aggregation
in the communication stage.
At the other extreme of the spectrum, communication can be fully private as in the
model studied in section 2, i.e., when the network g is bipartite and voters in one group
(the non-experts) have at most degree one. There each voter holds at most one piece of
information after communication such that information aggregation can only occur in the
voting stage. Arguably, in reality communication is neither fully public nor fully private.
Receiving multiple messages and an own signal leads to information aggregation already in
the communication stage. Participation in a majority election further aggregates information
in the voting stage. Whether such institutions are efficient depends on the balancedness of
the social network.
65These derivations can be found in SOM B.5.
17