the travelers companies, inc. financial supplement - first
TRANSCRIPT
Page NumberConsolidated Results
Financial Highlights............................................................................................................................................................................................................................................................................................................................ 1
Reconciliation to Net Income (Loss) and Earnings Per Share............................................................................................................................................................................................................................................................ 2
Statement of Income (Loss)................................................................................................................................................................................................................................................................................................................. 3
Net Income (Loss) by Major Component and Combined Ratio.......................................................................................................................................................................................................................................................... 4
Core Income (Loss)............................................................................................................................................................................................................................................................................................................................. 5
Selected Statistics - Property and Casualty Operations....................................................................................................................................................................................................................................................................... 6
Written and Earned Premiums - Property and Casualty Operations................................................................................................................................................................................................................................................... 7
Business Insurance
Segment Income (Loss)....................................................................................................................................................................................................................................................................................................................... 8
Segment Income (Loss) by Major Component and Combined Ratio.................................................................................................................................................................................................................................................. 9
Selected Statistics................................................................................................................................................................................................................................................................................................................................ 10
Net Written Premiums......................................................................................................................................................................................................................................................................................................................... 11
Bond & Specialty Insurance
Segment Income.................................................................................................................................................................................................................................................................................................................................. 12
Segment Income by Major Component and Combined Ratio............................................................................................................................................................................................................................................................. 13
Selected Statistics................................................................................................................................................................................................................................................................................................................................ 14
Net Written Premiums......................................................................................................................................................................................................................................................................................................................... 15
Personal Insurance
Segment Income ................................................................................................................................................................................................................................................................................................................................. 16
Segment Income by Major Component and Combined Ratio............................................................................................................................................................................................................................................................. 17
Selected Statistics................................................................................................................................................................................................................................................................................................................................ 18
Net Written Premiums......................................................................................................................................................................................................................................................................................................................... 19
Selected Statistics - Automobile.......................................................................................................................................................................................................................................................................................................... 20
Selected Statistics - Homeowners and Other....................................................................................................................................................................................................................................................................................... 21
Supplemental Detail
Interest Expense and Other.................................................................................................................................................................................................................................................................................................................. 22
Consolidated Balance Sheet................................................................................................................................................................................................................................................................................................................ 23
Investment Portfolio............................................................................................................................................................................................................................................................................................................................ 24
Investment Portfolio - Fixed Maturities Data...................................................................................................................................................................................................................................................................................... 25
Investment Income.............................................................................................................................................................................................................................................................................................................................. 26
Net Realized and Unrealized Investment Gains (Losses) included in Shareholders’ Equity.............................................................................................................................................................................................................. 27
Reinsurance Recoverables................................................................................................................................................................................................................................................................................................................... 28
Net Reserves for Losses and Loss Adjustment Expense..................................................................................................................................................................................................................................................................... 29
Asbestos Reserves............................................................................................................................................................................................................................................................................................................................... 30
Capitalization....................................................................................................................................................................................................................................................................................................................................... 31
Statutory Capital and Surplus to GAAP Shareholders’ Equity Reconciliation................................................................................................................................................................................................................................... 32
Statement of Cash Flows..................................................................................................................................................................................................................................................................................................................... 33
Statement of Cash Flows (continued).................................................................................................................................................................................................................................................................................................. 34
Glossary of Financial Measures and Description of Reportable Business Segments...................................................................................................................................................................................................................... 35-36
The information included in the Financial Supplement is unaudited. This document should be read in conjunction with the Company’s Form 10-Q which will be filed with the Securities and Exchange Commission.
The Travelers Companies, Inc. Financial Supplement - First Quarter 2021
Index
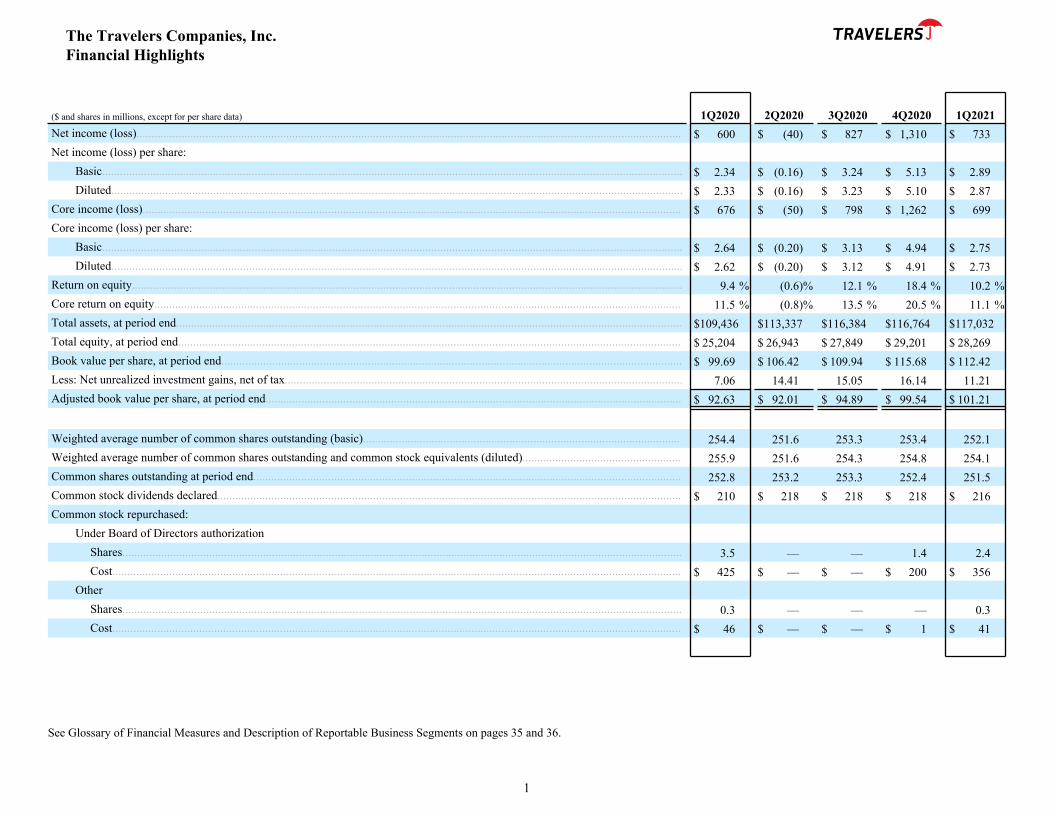
($ and shares in millions, except for per share data) 1Q2020 2Q2020 3Q2020 4Q2020 1Q2021Net income (loss)...................................................................................................................................................................................... $ 600 $ (40) $ 827 $ 1,310 $ 733 Net income (loss) per share:
Basic.................................................................................................................................................................................................. $ 2.34 $ (0.16) $ 3.24 $ 5.13 $ 2.89 Diluted............................................................................................................................................................................................... $ 2.33 $ (0.16) $ 3.23 $ 5.10 $ 2.87
Core income (loss).................................................................................................................................................................................... $ 676 $ (50) $ 798 $ 1,262 $ 699 Core income (loss) per share:
Basic.................................................................................................................................................................................................. $ 2.64 $ (0.20) $ 3.13 $ 4.94 $ 2.75 Diluted............................................................................................................................................................................................... $ 2.62 $ (0.20) $ 3.12 $ 4.91 $ 2.73
Return on equity........................................................................................................................................................................................ 9.4 % (0.6) % 12.1 % 18.4 % 10.2 %Core return on equity................................................................................................................................................................................ 11.5 % (0.8) % 13.5 % 20.5 % 11.1 %Total assets, at period end......................................................................................................................................................................... $ 109,436 $ 113,337 $ 116,384 $ 116,764 $ 117,032 Total equity, at period end........................................................................................................................................................................ $ 25,204 $ 26,943 $ 27,849 $ 29,201 $ 28,269 Book value per share, at period end.......................................................................................................................................................... $ 99.69 $ 106.42 $ 109.94 $ 115.68 $ 112.42 Less: Net unrealized investment gains, net of tax..................................................................................................................................... 7.06 14.41 15.05 16.14 11.21 Adjusted book value per share, at period end........................................................................................................................................... $ 92.63 $ 92.01 $ 94.89 $ 99.54 $ 101.21
Weighted average number of common shares outstanding (basic).......................................................................................................... 254.4 251.6 253.3 253.4 252.1 Weighted average number of common shares outstanding and common stock equivalents (diluted)..................................................... 255.9 251.6 254.3 254.8 254.1 Common shares outstanding at period end............................................................................................................................................... 252.8 253.2 253.3 252.4 251.5 Common stock dividends declared........................................................................................................................................................... $ 210 $ 218 $ 218 $ 218 $ 216 Common stock repurchased:
Under Board of Directors authorizationShares........................................................................................................................................................................................... 3.5 — — 1.4 2.4 Cost.............................................................................................................................................................................................. $ 425 $ — $ — $ 200 $ 356
OtherShares........................................................................................................................................................................................... 0.3 — — — 0.3 Cost.............................................................................................................................................................................................. $ 46 $ — $ — $ 1 $ 41
See Glossary of Financial Measures and Description of Reportable Business Segments on pages 35 and 36.
The Travelers Companies, Inc. Financial Highlights
1

($ and shares in millions, except earnings per share) 1Q2020 2Q2020 3Q2020 4Q2020 1Q2021Net income (loss)
Net income (loss)............................................................................................................................................................................................. $ 600 $ (40) $ 827 $ 1,310 $ 733 Adjustments:
Net realized investment (gains) losses, after-tax........................................................................................................................................ 76 (10) (29) (48) (34) Core income (loss)................................................................................................................................................................................. $ 676 $ (50) $ 798 $ 1,262 $ 699
Basic earnings per shareNet income (loss)............................................................................................................................................................................................. $ 2.34 $ (0.16) $ 3.24 $ 5.13 $ 2.89 Adjustments:
Net realized investment (gains) losses, after-tax........................................................................................................................................ 0.30 (0.04) (0.11) (0.19) (0.14) Core income (loss)................................................................................................................................................................................. $ 2.64 $ (0.20) $ 3.13 $ 4.94 $ 2.75
Diluted earnings per shareNet income (loss)............................................................................................................................................................................................. $ 2.33 $ (0.16) $ 3.23 $ 5.10 $ 2.87 Adjustments:
Net realized investment (gains) losses, after-tax........................................................................................................................................ 0.29 (0.04) (0.11) (0.19) (0.14) Core income (loss)................................................................................................................................................................................. $ 2.62 $ (0.20) $ 3.12 $ 4.91 $ 2.73
Adjustments to net income (loss) and weighted average shares for net income (loss) EPS calculations: (1)
Basic and Diluted 1Q2020 2Q2020 3Q2020 4Q2020 1Q2021Net income (loss), as reported......................................................................................................................................................................... $ 600 $ (40) $ 827 $ 1,310 $ 733 Participating share-based awards - allocated income...................................................................................................................................... (5) (1) (6) (10) (5) Net income (loss) available to common shareholders - basic and diluted....................................................................................................... $ 595 $ (41) $ 821 $ 1,300 $ 728
Common SharesBasic
Weighted average shares outstanding.............................................................................................................................................................. 254.4 251.6 253.3 253.4 252.1 Diluted
Weighted average shares outstanding.............................................................................................................................................................. 254.4 251.6 253.3 253.4 252.1 Weighted average effects of dilutive securities - stock options and performance shares................................................................................ 1.5 — 1.0 1.4 2.0 Diluted weighted average shares outstanding.................................................................................................................................................. 255.9 251.6 254.3 254.8 254.1
(1) Adjustments to net income and weighted average shares for net income EPS calculations can generally be used for the core income EPS calculations.
See Glossary of Financial Measures and Description of Reportable Business Segments on pages 35 and 36.
The Travelers Companies, Inc. Reconciliation to Net Income (Loss) and Earnings per Share
2

($ in millions) 1Q2020 2Q2020 3Q2020 4Q2020 1Q2021RevenuesPremiums............................................................................................................................................................................................................ $ 7,229 $ 6,955 $ 7,380 $ 7,480 $ 7,386 Net investment income....................................................................................................................................................................................... 611 268 671 677 701 Fee income.......................................................................................................................................................................................................... 108 114 101 106 101 Net realized investment gains (losses)................................................................................................................................................................ (98) 13 37 50 44 Other revenues.................................................................................................................................................................................................... 58 51 86 84 81
Total revenues............................................................................................................................................................................................. 7,908 7,401 8,275 8,397 8,313 Claims and expensesClaims and claim adjustment expenses............................................................................................................................................................... 4,789 5,107 4,886 4,341 4,970 Amortization of deferred acquisition costs......................................................................................................................................................... 1,178 1,173 1,207 1,215 1,207 General and administrative expenses.................................................................................................................................................................. 1,137 1,121 1,109 1,142 1,163 Interest expense................................................................................................................................................................................................... 84 85 87 83 82
Total claims and expenses.......................................................................................................................................................................... 7,188 7,486 7,289 6,781 7,422 Income (loss) before income taxes..................................................................................................................................................................... 720 (85) 986 1,616 891 Income tax expense (benefit).............................................................................................................................................................................. 120 (45) 159 306 158 Net income (loss)................................................................................................................................................................................................ $ 600 $ (40) $ 827 $ 1,310 $ 733
Other statisticsEffective tax rate on net investment income....................................................................................................................................................... 15.1 % 6.2 % 15.6 % 15.4 % 15.9 %Net investment income (after-tax)...................................................................................................................................................................... $ 519 $ 251 $ 566 $ 572 $ 590
Catastrophes, net of reinsurance:Pre-tax.............................................................................................................................................................................................................. $ 333 $ 854 $ 397 $ 29 $ 835 After-tax........................................................................................................................................................................................................... $ 263 $ 673 $ 314 $ 24 $ 659
Prior year reserve development - favorable:Pre-tax.............................................................................................................................................................................................................. $ 27 $ 2 $ 142 $ 180 $ 317 After-tax........................................................................................................................................................................................................... $ 21 $ 1 $ 113 $ 141 $ 249
See Glossary of Financial Measures and Description of Reportable Business Segments on pages 35 and 36.
The Travelers Companies, Inc. Statement of Income (Loss) - Consolidated
3
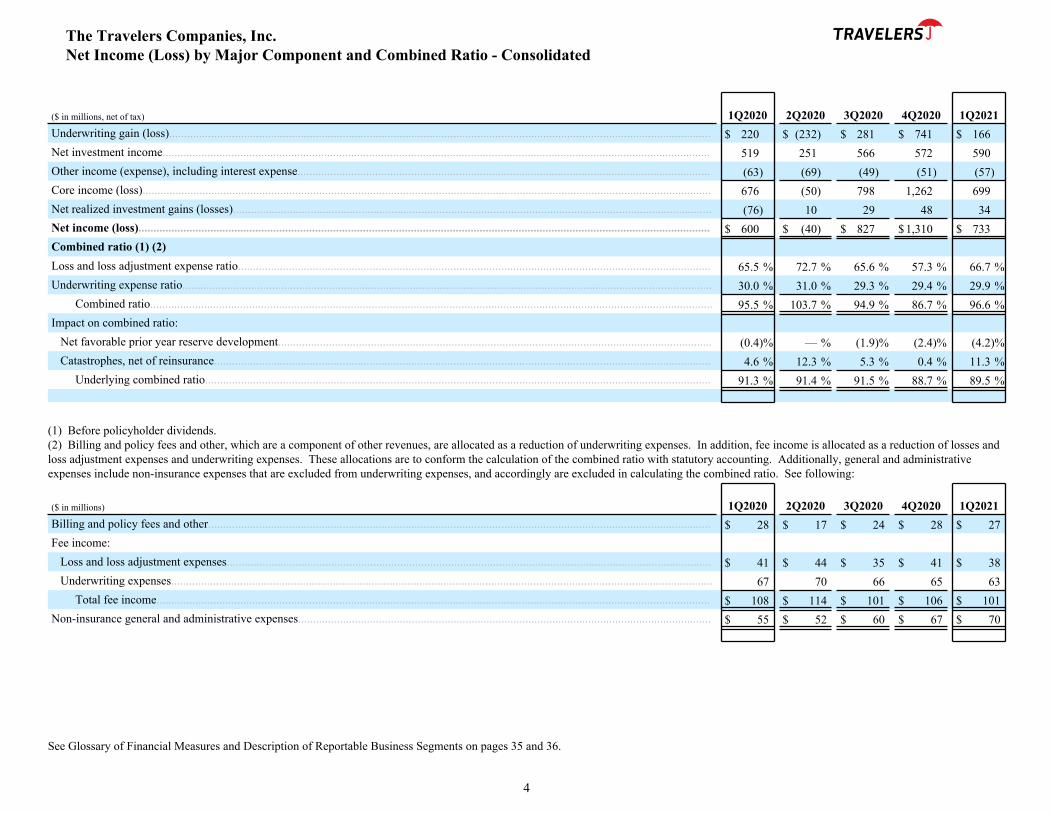
($ in millions, net of tax) 1Q2020 2Q2020 3Q2020 4Q2020 1Q2021Underwriting gain (loss)..................................................................................................................................................................................... $ 220 $ (232) $ 281 $ 741 $ 166 Net investment income....................................................................................................................................................................................... 519 251 566 572 590 Other income (expense), including interest expense.......................................................................................................................................... (63) (69) (49) (51) (57) Core income (loss).............................................................................................................................................................................................. 676 (50) 798 1,262 699 Net realized investment gains (losses)................................................................................................................................................................ (76) 10 29 48 34 Net income (loss)............................................................................................................................................................................................... $ 600 $ (40) $ 827 $ 1,310 $ 733 Combined ratio (1) (2)Loss and loss adjustment expense ratio.............................................................................................................................................................. 65.5 % 72.7 % 65.6 % 57.3 % 66.7 %Underwriting expense ratio................................................................................................................................................................................. 30.0 % 31.0 % 29.3 % 29.4 % 29.9 %
Combined ratio............................................................................................................................................................................................ 95.5 % 103.7 % 94.9 % 86.7 % 96.6 %Impact on combined ratio:
Net favorable prior year reserve development................................................................................................................................................. (0.4) % — % (1.9) % (2.4) % (4.2) %Catastrophes, net of reinsurance...................................................................................................................................................................... 4.6 % 12.3 % 5.3 % 0.4 % 11.3 %
Underlying combined ratio......................................................................................................................................................................... 91.3 % 91.4 % 91.5 % 88.7 % 89.5 %
(1) Before policyholder dividends.(2) Billing and policy fees and other, which are a component of other revenues, are allocated as a reduction of underwriting expenses. In addition, fee income is allocated as a reduction of losses and loss adjustment expenses and underwriting expenses. These allocations are to conform the calculation of the combined ratio with statutory accounting. Additionally, general and administrative expenses include non-insurance expenses that are excluded from underwriting expenses, and accordingly are excluded in calculating the combined ratio. See following:
($ in millions) 1Q2020 2Q2020 3Q2020 4Q2020 1Q2021Billing and policy fees and other........................................................................................................................................................................ $ 28 $ 17 $ 24 $ 28 $ 27 Fee income:
Loss and loss adjustment expenses.................................................................................................................................................................. $ 41 $ 44 $ 35 $ 41 $ 38 Underwriting expenses..................................................................................................................................................................................... 67 70 66 65 63
Total fee income......................................................................................................................................................................................... $ 108 $ 114 $ 101 $ 106 $ 101 Non-insurance general and administrative expenses.......................................................................................................................................... $ 55 $ 52 $ 60 $ 67 $ 70
See Glossary of Financial Measures and Description of Reportable Business Segments on pages 35 and 36.
The Travelers Companies, Inc. Net Income (Loss) by Major Component and Combined Ratio - Consolidated
4
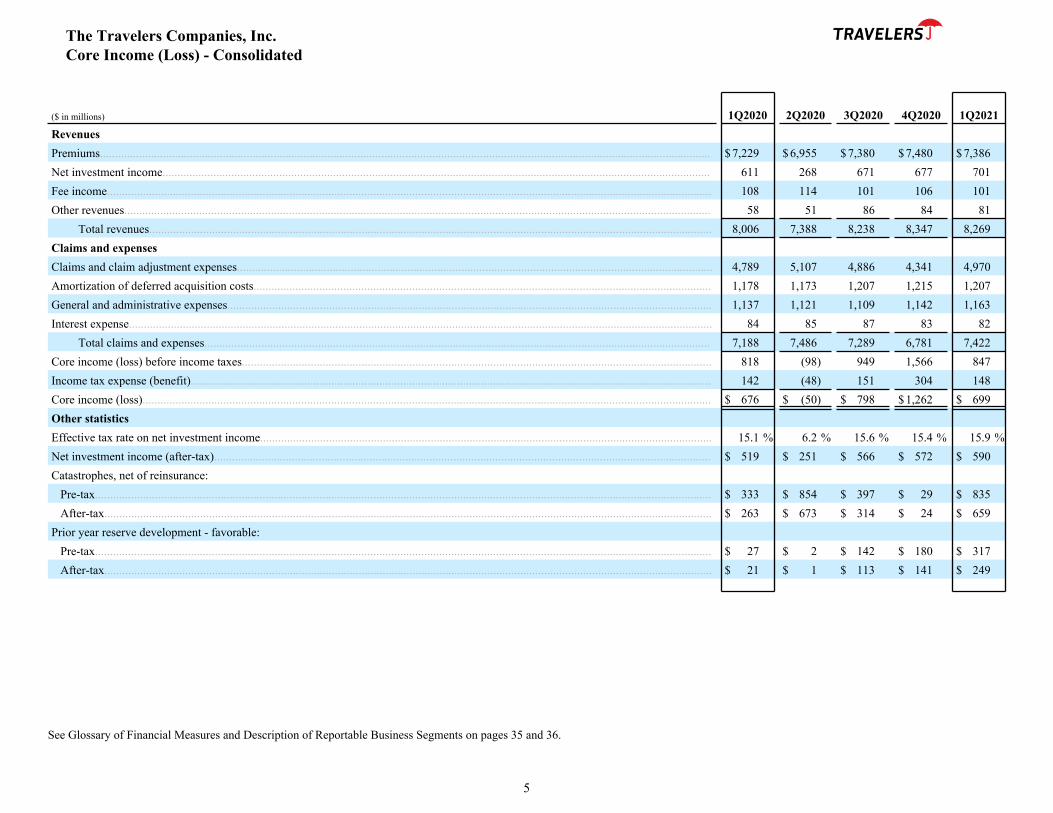
($ in millions) 1Q2020 2Q2020 3Q2020 4Q2020 1Q2021RevenuesPremiums............................................................................................................................................................................................................ $ 7,229 $ 6,955 $ 7,380 $ 7,480 $ 7,386 Net investment income....................................................................................................................................................................................... 611 268 671 677 701 Fee income.......................................................................................................................................................................................................... 108 114 101 106 101 Other revenues.................................................................................................................................................................................................... 58 51 86 84 81
Total revenues............................................................................................................................................................................................ 8,006 7,388 8,238 8,347 8,269 Claims and expensesClaims and claim adjustment expenses............................................................................................................................................................... 4,789 5,107 4,886 4,341 4,970 Amortization of deferred acquisition costs......................................................................................................................................................... 1,178 1,173 1,207 1,215 1,207 General and administrative expenses.................................................................................................................................................................. 1,137 1,121 1,109 1,142 1,163 Interest expense................................................................................................................................................................................................... 84 85 87 83 82
Total claims and expenses......................................................................................................................................................................... 7,188 7,486 7,289 6,781 7,422 Core income (loss) before income taxes............................................................................................................................................................. 818 (98) 949 1,566 847 Income tax expense (benefit).............................................................................................................................................................................. 142 (48) 151 304 148 Core income (loss).............................................................................................................................................................................................. $ 676 $ (50) $ 798 $ 1,262 $ 699 Other statisticsEffective tax rate on net investment income....................................................................................................................................................... 15.1 % 6.2 % 15.6 % 15.4 % 15.9 %Net investment income (after-tax)...................................................................................................................................................................... $ 519 $ 251 $ 566 $ 572 $ 590 Catastrophes, net of reinsurance:
Pre-tax.............................................................................................................................................................................................................. $ 333 $ 854 $ 397 $ 29 $ 835 After-tax........................................................................................................................................................................................................... $ 263 $ 673 $ 314 $ 24 $ 659
Prior year reserve development - favorable:Pre-tax.............................................................................................................................................................................................................. $ 27 $ 2 $ 142 $ 180 $ 317 After-tax........................................................................................................................................................................................................... $ 21 $ 1 $ 113 $ 141 $ 249
See Glossary of Financial Measures and Description of Reportable Business Segments on pages 35 and 36.
The Travelers Companies, Inc. Core Income (Loss) - Consolidated
5

($ in millions) 1Q2020 2Q2020 3Q2020 4Q2020 1Q2021Statutory underwritingGross written premiums...................................................................................................................................................................................... $ 8,152 $ 7,751 $ 8,243 $ 7,617 $ 8,407 Net written premiums......................................................................................................................................................................................... $ 7,346 $ 7,346 $ 7,771 $ 7,269 $ 7,505 Net earned premiums.......................................................................................................................................................................................... $ 7,229 $ 6,955 $ 7,380 $ 7,480 $ 7,386 Losses and loss adjustment expenses.................................................................................................................................................................. 4,733 5,053 4,830 4,291 4,920 Underwriting expenses........................................................................................................................................................................................ 2,193 2,212 2,214 2,153 2,276 Statutory underwriting gain (loss)...................................................................................................................................................................... 303 (310) 336 1,036 190 Policyholder dividends........................................................................................................................................................................................ 12 8 11 10 11 Statutory underwriting gain (loss) after policyholder dividends........................................................................................................................ $ 291 $ (318) $ 325 $ 1,026 $ 179 Other statutory statisticsReserves for losses and loss adjustment expenses.............................................................................................................................................. $ 43,913 $ 45,112 $ 46,181 $ 46,247 $ 47,153 Increase in reserves............................................................................................................................................................................................. $ 170 $ 1,199 $ 1,069 $ 66 $ 906 Statutory capital and surplus............................................................................................................................................................................... $ 20,808 $ 20,607 $ 21,230 $ 22,180 $ 22,403 Net written premiums/surplus (1)....................................................................................................................................................................... 1.41:1 1.42:1 1.39:1 1.34:1 1.33:1
(1) Based on 12 months of rolling net written premiums.
See Glossary of Financial Measures and Description of Reportable Business Segments on pages 35 and 36.
The Travelers Companies, Inc. Selected Statistics - Property and Casualty Operations
6
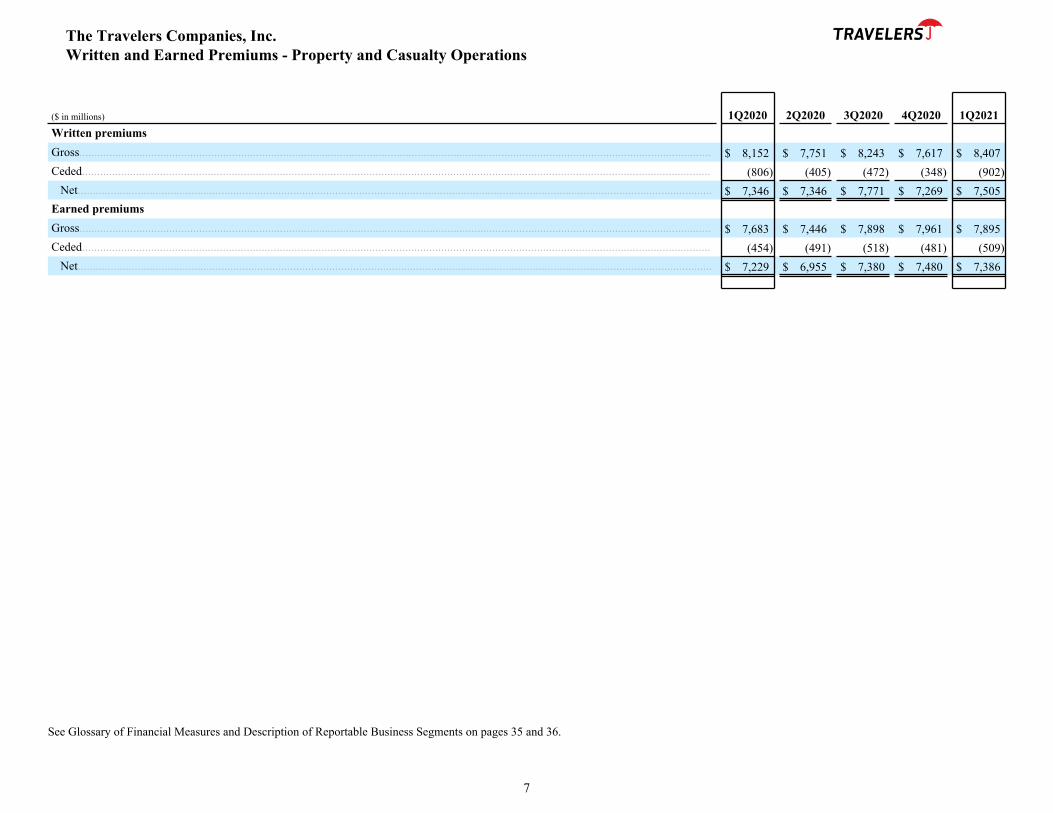
($ in millions) 1Q2020 2Q2020 3Q2020 4Q2020 1Q2021Written premiumsGross................................................................................................................................................................................................................... $ 8,152 $ 7,751 $ 8,243 $ 7,617 $ 8,407 Ceded.................................................................................................................................................................................................................. (806) (405) (472) (348) (902)
Net.................................................................................................................................................................................................................... $ 7,346 $ 7,346 $ 7,771 $ 7,269 $ 7,505 Earned premiumsGross................................................................................................................................................................................................................... $ 7,683 $ 7,446 $ 7,898 $ 7,961 $ 7,895 Ceded.................................................................................................................................................................................................................. (454) (491) (518) (481) (509)
Net.................................................................................................................................................................................................................... $ 7,229 $ 6,955 $ 7,380 $ 7,480 $ 7,386
See Glossary of Financial Measures and Description of Reportable Business Segments on pages 35 and 36.
The Travelers Companies, Inc. Written and Earned Premiums - Property and Casualty Operations
7

($ in millions) 1Q2020 2Q2020 3Q2020 4Q2020 1Q2021RevenuesPremiums............................................................................................................................................................................................................ $ 3,864 $ 3,735 $ 3,841 $ 3,854 $ 3,799 Net investment income....................................................................................................................................................................................... 453 180 498 502 523 Fee income.......................................................................................................................................................................................................... 102 108 95 100 95 Other revenues.................................................................................................................................................................................................... 31 36 58 51 53
Total revenues............................................................................................................................................................................................ 4,450 4,059 4,492 4,507 4,470 Claims and expensesClaims and claim adjustment expenses............................................................................................................................................................... 2,791 2,880 2,804 2,329 2,788 Amortization of deferred acquisition costs......................................................................................................................................................... 636 622 633 627 627 General and administrative expenses.................................................................................................................................................................. 685 656 651 672 683
Total claims and expenses......................................................................................................................................................................... 4,112 4,158 4,088 3,628 4,098 Segment income (loss) before income taxes....................................................................................................................................................... 338 (99) 404 879 372 Income tax expense (benefit).............................................................................................................................................................................. 49 (41) 39 166 55 Segment income (loss)........................................................................................................................................................................................ $ 289 $ (58) $ 365 $ 713 $ 317 Other statisticsEffective tax rate on net investment income....................................................................................................................................................... 15.0 % 6.3 % 15.6 % 15.4 % 15.8 %Net investment income (after-tax)...................................................................................................................................................................... $ 385 $ 169 $ 421 $ 423 $ 441 Catastrophes, net of reinsurance:
Pre-tax.............................................................................................................................................................................................................. $ 195 $ 377 $ 97 $ (24) $ 506 After-tax........................................................................................................................................................................................................... $ 154 $ 298 $ 76 $ (19) $ 399
Prior year reserve development - favorable (unfavorable):Pre-tax.............................................................................................................................................................................................................. $ 5 $ — $ (220) $ 124 $ 134 After-tax........................................................................................................................................................................................................... $ 3 $ — $ (173) $ 97 $ 105
See Glossary of Financial Measures and Description of Reportable Business Segments on pages 35 and 36.
The Travelers Companies, Inc. Segment Income (Loss) - Business Insurance
8

($ in millions, net of tax) 1Q2020 2Q2020 3Q2020 4Q2020 1Q2021Underwriting gain (loss)..................................................................................................................................................................................... $ (84) $ (221) $ (59) $ 292 $ (116) Net investment income....................................................................................................................................................................................... 385 169 421 423 441 Other income (expense)...................................................................................................................................................................................... (12) (6) 3 (2) (8) Segment income (loss)....................................................................................................................................................................................... $ 289 $ (58) $ 365 $ 713 $ 317 Combined ratio (1) (2)Loss and loss adjustment expense ratio.............................................................................................................................................................. 70.9 % 75.8 % 71.8 % 59.2 % 72.2 %Underwriting expense ratio................................................................................................................................................................................. 31.3 % 31.3 % 30.5 % 30.6 % 31.3 %
Combined ratio............................................................................................................................................................................................ 102.2 % 107.1 % 102.3 % 89.8 % 103.5 %Impact on combined ratio:
Net (favorable) unfavorable prior year reserve development.......................................................................................................................... (0.1) % — % 5.8 % (3.2) % (3.5) %Catastrophes, net of reinsurance...................................................................................................................................................................... 5.0 % 10.1 % 2.5 % (0.6) % 13.3 %
Underlying combined ratio......................................................................................................................................................................... 97.3 % 97.0 % 94.0 % 93.6 % 93.7 %
(1) Before policyholder dividends.(2) Billing and policy fees and other, which are a component of other revenues, are allocated as a reduction of underwriting expenses. In addition, fee income is allocated as a reduction of losses and loss adjustment expenses and underwriting expenses. These allocations are to conform the calculation of the combined ratio with statutory accounting. Additionally, general and administrative expenses include non-insurance expenses that are excluded from underwriting expenses, and accordingly are excluded in calculating the combined ratio. See following:
($ in millions) 1Q2020 2Q2020 3Q2020 4Q2020 1Q2021Billing and policy fees and other................................................................................................................................................................ $ 4 $ 3 $ 4 $ 5 $ 4 Fee income:
Loss and loss adjustment expenses........................................................................................................................................................ $ 41 $ 44 $ 35 $ 41 $ 38 Underwriting expenses........................................................................................................................................................................... 61 64 60 59 57
Total fee income................................................................................................................................................................................. $ 102 $ 108 $ 95 $ 100 $ 95 Non-insurance general and administrative expenses.................................................................................................................................. $ 47 $ 42 $ 52 $ 56 $ 60
See Glossary of Financial Measures and Description of Reportable Business Segments on pages 35 and 36.
The Travelers Companies, Inc. Segment Income (Loss) by Major Component and Combined Ratio - Business Insurance
9

($ in millions) 1Q2020 2Q2020 3Q2020 4Q2020 1Q2021Statutory underwritingGross written premiums...................................................................................................................................................................................... $ 4,794 $ 4,127 $ 4,230 $ 3,909 $ 4,776 Net written premiums......................................................................................................................................................................................... $ 4,190 $ 3,777 $ 3,833 $ 3,631 $ 4,125 Net earned premiums.......................................................................................................................................................................................... $ 3,864 $ 3,735 $ 3,841 $ 3,854 $ 3,799 Losses and loss adjustment expenses.................................................................................................................................................................. 2,737 2,828 2,750 2,282 2,741 Underwriting expenses........................................................................................................................................................................................ 1,247 1,167 1,145 1,132 1,251 Statutory underwriting gain (loss)...................................................................................................................................................................... (120) (260) (54) 440 (193) Policyholder dividends........................................................................................................................................................................................ 10 6 9 7 8 Statutory underwriting gain (loss) after policyholder dividends........................................................................................................................ $ (130) $ (266) $ (63) $ 433 $ (201)
See Glossary of Financial Measures and Description of Reportable Business Segments on pages 35 and 36.
The Travelers Companies, Inc. Selected Statistics - Business Insurance
10

($ in millions) 1Q2020 2Q2020 3Q2020 4Q2020 1Q2021Net written premiums by market Domestic
Select Accounts................................................................................................................................................................................................ $ 799 $ 734 $ 658 $ 630 $ 729 Middle Market................................................................................................................................................................................................. 2,408 1,960 2,131 2,012 2,384 National Accounts............................................................................................................................................................................................ 301 215 239 241 290 National Property and Other............................................................................................................................................................................ 428 585 602 471 445
Total Domestic............................................................................................................................................................................................ 3,936 3,494 3,630 3,354 3,848 International........................................................................................................................................................................................................ 254 283 203 277 277
Total....................................................................................................................................................................................................... $ 4,190 $ 3,777 $ 3,833 $ 3,631 $ 4,125 Net written premiums by product line Domestic
Workers’ compensation................................................................................................................................................................................... $ 1,096 $ 780 $ 774 $ 699 $ 948 Commercial automobile................................................................................................................................................................................... 755 667 689 679 762 Commercial property....................................................................................................................................................................................... 433 620 603 507 466 General liability............................................................................................................................................................................................... 683 531 630 603 714 Commercial multi-peril.................................................................................................................................................................................... 956 892 899 861 940 Other................................................................................................................................................................................................................ 13 4 35 5 18
Total Domestic............................................................................................................................................................................................ 3,936 3,494 3,630 3,354 3,848 International........................................................................................................................................................................................................ 254 283 203 277 277
Total....................................................................................................................................................................................................... $ 4,190 $ 3,777 $ 3,833 $ 3,631 $ 4,125
See Glossary of Financial Measures and Description of Reportable Business Segments on pages 35 and 36.
The Travelers Companies, Inc. Net Written Premiums - Business Insurance
11

($ in millions) 1Q2020 2Q2020 3Q2020 4Q2020 1Q2021RevenuesPremiums............................................................................................................................................................................................................ $ 667 $ 693 $ 723 $ 740 $ 743 Net investment income....................................................................................................................................................................................... 55 42 58 58 59 Other revenues.................................................................................................................................................................................................... 5 5 7 10 5
Total revenues............................................................................................................................................................................................. 727 740 788 808 807 Claims and expensesClaims and claim adjustment expenses............................................................................................................................................................... 327 403 392 342 374 Amortization of deferred acquisition costs......................................................................................................................................................... 124 128 133 134 134 General and administrative expenses.................................................................................................................................................................. 125 123 124 128 130
Total claims and expenses.......................................................................................................................................................................... 576 654 649 604 638 Segment income before income taxes................................................................................................................................................................. 151 86 139 204 169 Income tax expense............................................................................................................................................................................................. 29 14 24 40 32 Segment income.................................................................................................................................................................................................. $ 122 $ 72 $ 115 $ 164 $ 137 Other statisticsEffective tax rate on net investment income....................................................................................................................................................... 14.7 % 3.0 % 14.8 % 14.4 % 15.0 %Net investment income (after-tax)...................................................................................................................................................................... $ 47 $ 41 $ 49 $ 50 $ 50 Catastrophes, net of reinsurance:
Pre-tax.............................................................................................................................................................................................................. $ 1 $ 7 $ 2 $ 1 $ 24 After-tax........................................................................................................................................................................................................... $ 1 $ 5 $ 2 $ 1 $ 19
Prior year reserve development - favorable (unfavorable):Pre-tax.............................................................................................................................................................................................................. $ — $ (33) $ — $ 32 $ 15 After-tax........................................................................................................................................................................................................... $ — $ (26) $ — $ 25 $ 12
See Glossary of Financial Measures and Description of Reportable Business Segments on pages 35 and 36.
The Travelers Companies, Inc. Segment Income - Bond & Specialty Insurance
12
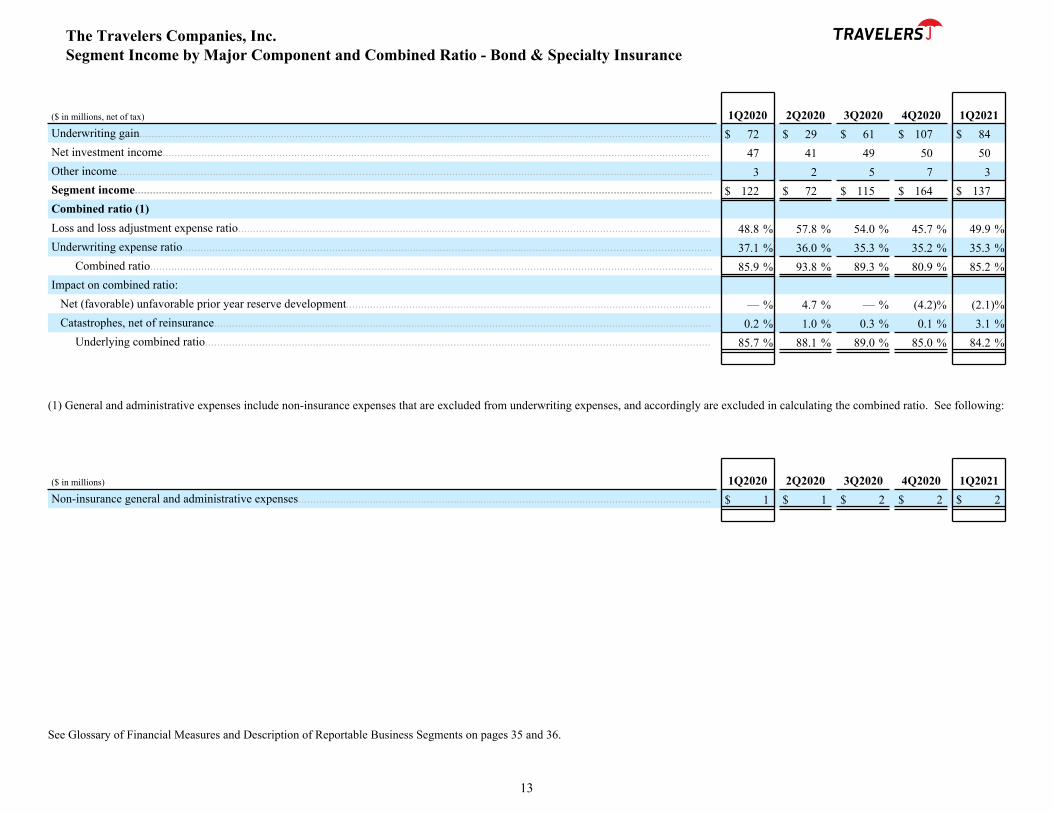
($ in millions, net of tax) 1Q2020 2Q2020 3Q2020 4Q2020 1Q2021Underwriting gain............................................................................................................................................................................................... $ 72 $ 29 $ 61 $ 107 $ 84 Net investment income....................................................................................................................................................................................... 47 41 49 50 50 Other income....................................................................................................................................................................................................... 3 2 5 7 3 Segment income................................................................................................................................................................................................. $ 122 $ 72 $ 115 $ 164 $ 137 Combined ratio (1)Loss and loss adjustment expense ratio.............................................................................................................................................................. 48.8 % 57.8 % 54.0 % 45.7 % 49.9 %Underwriting expense ratio................................................................................................................................................................................. 37.1 % 36.0 % 35.3 % 35.2 % 35.3 %
Combined ratio............................................................................................................................................................................................ 85.9 % 93.8 % 89.3 % 80.9 % 85.2 %Impact on combined ratio:
Net (favorable) unfavorable prior year reserve development.......................................................................................................................... — % 4.7 % — % (4.2) % (2.1) %Catastrophes, net of reinsurance...................................................................................................................................................................... 0.2 % 1.0 % 0.3 % 0.1 % 3.1 %
Underlying combined ratio......................................................................................................................................................................... 85.7 % 88.1 % 89.0 % 85.0 % 84.2 %
(1) General and administrative expenses include non-insurance expenses that are excluded from underwriting expenses, and accordingly are excluded in calculating the combined ratio. See following:
($ in millions) 1Q2020 2Q2020 3Q2020 4Q2020 1Q2021Non-insurance general and administrative expenses.......................................................................................................................................... $ 1 $ 1 $ 2 $ 2 $ 2
See Glossary of Financial Measures and Description of Reportable Business Segments on pages 35 and 36.
The Travelers Companies, Inc. Segment Income by Major Component and Combined Ratio - Bond & Specialty Insurance
13
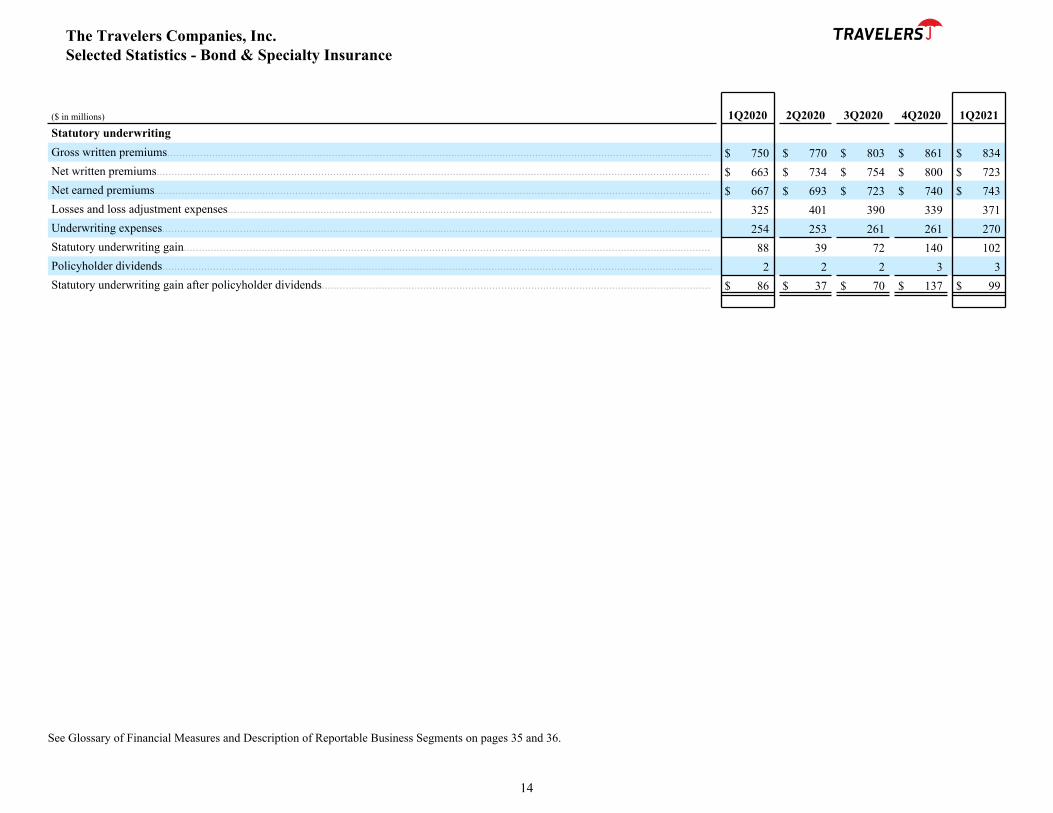
($ in millions) 1Q2020 2Q2020 3Q2020 4Q2020 1Q2021Statutory underwriting Gross written premiums...................................................................................................................................................................................... $ 750 $ 770 $ 803 $ 861 $ 834 Net written premiums......................................................................................................................................................................................... $ 663 $ 734 $ 754 $ 800 $ 723 Net earned premiums.......................................................................................................................................................................................... $ 667 $ 693 $ 723 $ 740 $ 743 Losses and loss adjustment expenses.................................................................................................................................................................. 325 401 390 339 371 Underwriting expenses........................................................................................................................................................................................ 254 253 261 261 270 Statutory underwriting gain................................................................................................................................................................................ 88 39 72 140 102 Policyholder dividends........................................................................................................................................................................................ 2 2 2 3 3 Statutory underwriting gain after policyholder dividends.................................................................................................................................. $ 86 $ 37 $ 70 $ 137 $ 99
See Glossary of Financial Measures and Description of Reportable Business Segments on pages 35 and 36.
The Travelers Companies, Inc. Selected Statistics - Bond & Specialty Insurance
14
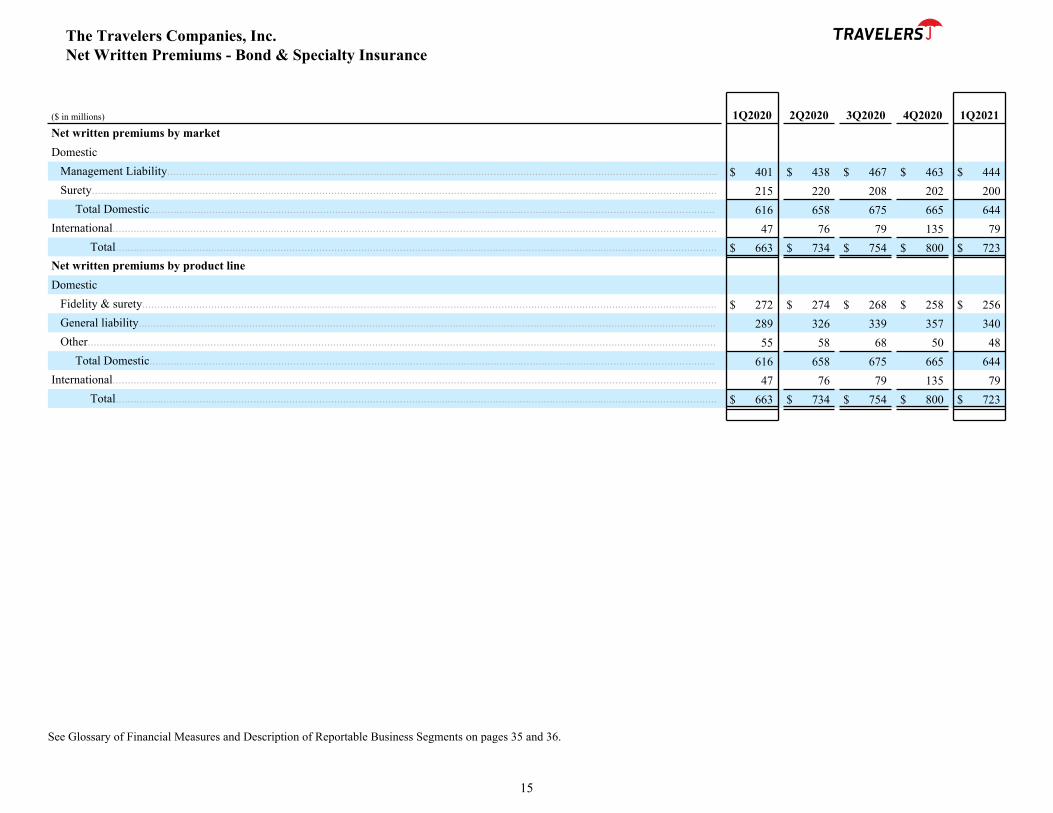
($ in millions) 1Q2020 2Q2020 3Q2020 4Q2020 1Q2021Net written premiums by marketDomestic
Management Liability........................................................................................................................................................................................ $ 401 $ 438 $ 467 $ 463 $ 444 Surety................................................................................................................................................................................................................. 215 220 208 202 200
Total Domestic............................................................................................................................................................................................. 616 658 675 665 644 International.......................................................................................................................................................................................................... 47 76 79 135 79
Total......................................................................................................................................................................................................... $ 663 $ 734 $ 754 $ 800 $ 723 Net written premiums by product lineDomestic
Fidelity & surety................................................................................................................................................................................................ $ 272 $ 274 $ 268 $ 258 $ 256 General liability................................................................................................................................................................................................. 289 326 339 357 340 Other.................................................................................................................................................................................................................. 55 58 68 50 48
Total Domestic............................................................................................................................................................................................. 616 658 675 665 644 International.......................................................................................................................................................................................................... 47 76 79 135 79
Total......................................................................................................................................................................................................... $ 663 $ 734 $ 754 $ 800 $ 723
See Glossary of Financial Measures and Description of Reportable Business Segments on pages 35 and 36.
The Travelers Companies, Inc. Net Written Premiums - Bond & Specialty Insurance
15
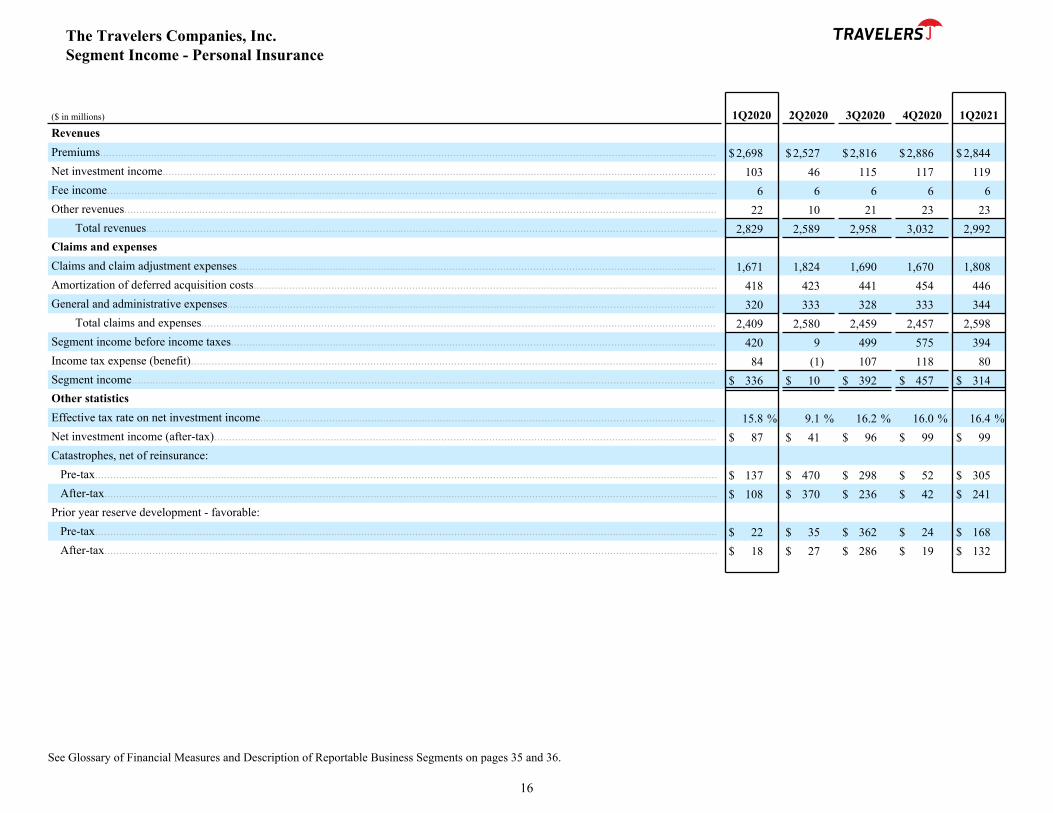
($ in millions) 1Q2020 2Q2020 3Q2020 4Q2020 1Q2021RevenuesPremiums.............................................................................................................................................................................................................. $ 2,698 $ 2,527 $ 2,816 $ 2,886 $ 2,844 Net investment income......................................................................................................................................................................................... 103 46 115 117 119 Fee income............................................................................................................................................................................................................ 6 6 6 6 6 Other revenues...................................................................................................................................................................................................... 22 10 21 23 23
Total revenues............................................................................................................................................................................................... 2,829 2,589 2,958 3,032 2,992 Claims and expensesClaims and claim adjustment expenses................................................................................................................................................................ 1,671 1,824 1,690 1,670 1,808 Amortization of deferred acquisition costs........................................................................................................................................................... 418 423 441 454 446 General and administrative expenses................................................................................................................................................................... 320 333 328 333 344
Total claims and expenses............................................................................................................................................................................ 2,409 2,580 2,459 2,457 2,598 Segment income before income taxes.................................................................................................................................................................. 420 9 499 575 394 Income tax expense (benefit)................................................................................................................................................................................ 84 (1) 107 118 80 Segment income................................................................................................................................................................................................... $ 336 $ 10 $ 392 $ 457 $ 314 Other statisticsEffective tax rate on net investment income........................................................................................................................................................ 15.8 % 9.1 % 16.2 % 16.0 % 16.4 %Net investment income (after-tax)........................................................................................................................................................................ $ 87 $ 41 $ 96 $ 99 $ 99 Catastrophes, net of reinsurance:
Pre-tax................................................................................................................................................................................................................ $ 137 $ 470 $ 298 $ 52 $ 305 After-tax............................................................................................................................................................................................................. $ 108 $ 370 $ 236 $ 42 $ 241
Prior year reserve development - favorable:Pre-tax................................................................................................................................................................................................................ $ 22 $ 35 $ 362 $ 24 $ 168 After-tax............................................................................................................................................................................................................. $ 18 $ 27 $ 286 $ 19 $ 132
See Glossary of Financial Measures and Description of Reportable Business Segments on pages 35 and 36.
The Travelers Companies, Inc. Segment Income - Personal Insurance
16

($ in millions, net of tax) 1Q2020 2Q2020 3Q2020 4Q2020 1Q2021Underwriting gain (loss)....................................................................................................................................................................................... $ 232 $ (40) $ 279 $ 342 $ 198 Net investment income......................................................................................................................................................................................... 87 41 96 99 99 Other income........................................................................................................................................................................................................ 17 9 17 16 17 Segment income.................................................................................................................................................................................................. $ 336 $ 10 $ 392 $ 457 $ 314 Combined ratio (1)Loss and loss adjustment expense ratio................................................................................................................................................................ 61.9 % 72.2 % 60.0 % 57.9 % 63.6 %Underwriting expense ratio.................................................................................................................................................................................. 26.3 % 29.1 % 26.4 % 26.2 % 26.7 %
Combined ratio............................................................................................................................................................................................. 88.2 % 101.3 % 86.4 % 84.1 % 90.3 %Impact on combined ratio:
Net favorable prior year reserve development............................................................................................................................................. (0.8) % (1.3) % (12.8) % (0.8) % (5.9) %Catastrophes, net of reinsurance................................................................................................................................................................... 5.0 % 18.6 % 10.5 % 1.8 % 10.8 %
Underlying combined ratio...................................................................................................................................................................... 84.0 % 84.0 % 88.7 % 83.1 % 85.4 %
(1) Billing and policy fees and other, which are a component of other revenues, and fee income are allocated as a reduction of underwriting expenses to conform the calculation of the combined ratio with statutory accounting. Additionally, general and administrative expenses include non-insurance expenses that are excluded from underwriting expenses, and accordingly are excluded in calculating the combined ratio. See following:
($ in millions) 1Q2020 2Q2020 3Q2020 4Q2020 1Q2021Billing and policy fees and other.......................................................................................................................................................................... $ 24 $ 14 $ 20 $ 23 $ 23 Fee income............................................................................................................................................................................................................ $ 6 $ 6 $ 6 $ 6 $ 6 Non-insurance general and administrative expenses............................................................................................................................................ $ — $ — $ — $ — $ 2
See Glossary of Financial Measures and Description of Reportable Business Segments on pages 35 and 36.
The Travelers Companies, Inc. Segment Income by Major Component and Combined Ratio - Personal Insurance
17
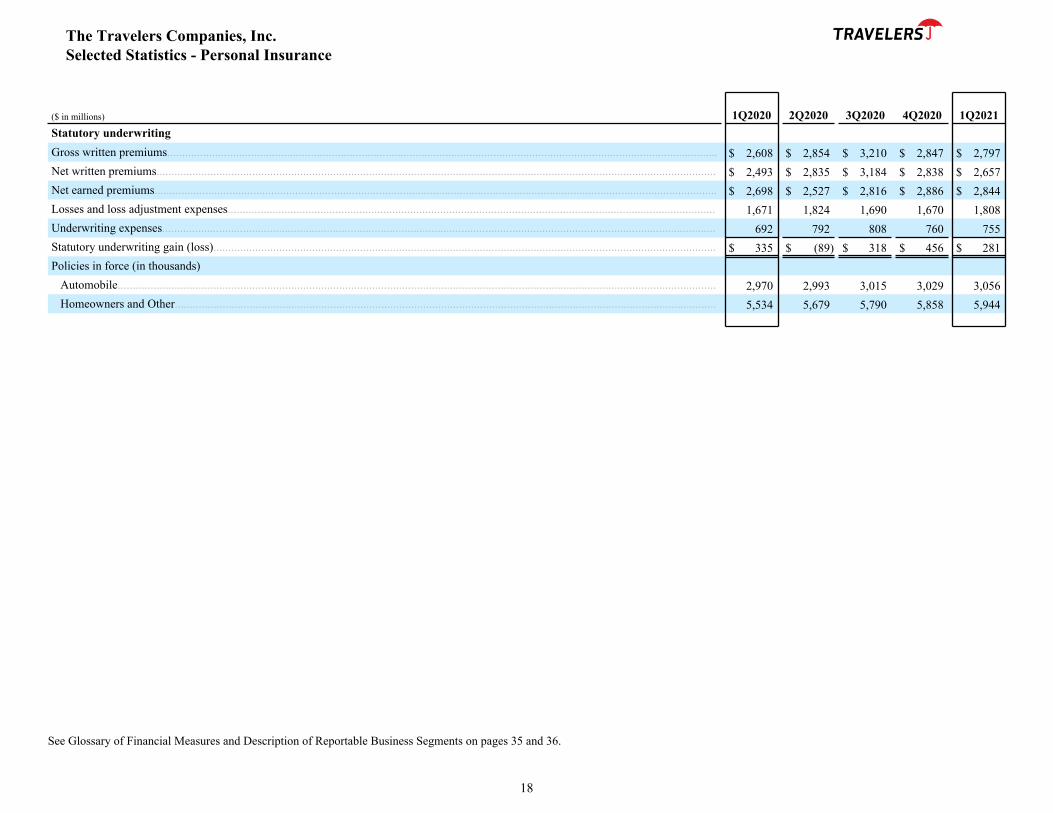
($ in millions) 1Q2020 2Q2020 3Q2020 4Q2020 1Q2021Statutory underwritingGross written premiums........................................................................................................................................................................................ $ 2,608 $ 2,854 $ 3,210 $ 2,847 $ 2,797 Net written premiums........................................................................................................................................................................................... $ 2,493 $ 2,835 $ 3,184 $ 2,838 $ 2,657 Net earned premiums............................................................................................................................................................................................ $ 2,698 $ 2,527 $ 2,816 $ 2,886 $ 2,844 Losses and loss adjustment expenses................................................................................................................................................................... 1,671 1,824 1,690 1,670 1,808 Underwriting expenses......................................................................................................................................................................................... 692 792 808 760 755 Statutory underwriting gain (loss)........................................................................................................................................................................ $ 335 $ (89) $ 318 $ 456 $ 281 Policies in force (in thousands)
Automobile........................................................................................................................................................................................................ 2,970 2,993 3,015 3,029 3,056 Homeowners and Other..................................................................................................................................................................................... 5,534 5,679 5,790 5,858 5,944
See Glossary of Financial Measures and Description of Reportable Business Segments on pages 35 and 36.
The Travelers Companies, Inc. Selected Statistics - Personal Insurance
18

($ in millions) 1Q2020 2Q2020 3Q2020 4Q2020 1Q2021Net written premiums by product lineDomestic (1)
Automobile................................................................................................................................................................................................... $ 1,333 $ 1,204 $ 1,484 $ 1,348 $ 1,375 Homeowners and Other................................................................................................................................................................................ 1,017 1,458 1,524 1,330 1,144
Total Domestic..................................................................................................................................................................................... 2,350 2,662 3,008 2,678 2,519 International.......................................................................................................................................................................................................... 143 173 176 160 138
Total................................................................................................................................................................................................. $ 2,493 $ 2,835 $ 3,184 $ 2,838 $ 2,657
(1) Effective January 1, 2021, Domestic net written premium for Automobile and Homeowners and Other now includes Direct-to-Consumer business. Previously, Direct-to-Consumer net written premiums were presented separately from Domestic Agency net written premiums. All prior periods presented have been reclassified to conform to the current presentation.
See Glossary of Financial Measures and Description of Reportable Business Segments on pages 35 and 36.
The Travelers Companies, Inc. Net Written Premiums - Personal Insurance
19

($ in millions) 1Q2020 2Q2020 3Q2020 4Q2020 1Q2021Statutory underwritingGross written premiums........................................................................................................................................................................................ $ 1,447 $ 1,322 $ 1,609 $ 1,460 $ 1,481 Net written premiums........................................................................................................................................................................................... $ 1,433 $ 1,316 $ 1,602 $ 1,453 $ 1,466 Net earned premiums............................................................................................................................................................................................ $ 1,467 $ 1,254 $ 1,499 $ 1,500 $ 1,478 Losses and loss adjustment expenses................................................................................................................................................................... 982 738 841 923 845 Underwriting expenses......................................................................................................................................................................................... 354 374 381 369 370 Statutory underwriting gain.................................................................................................................................................................................. $ 131 $ 142 $ 277 $ 208 $ 263 Other statisticsCombined ratio (2):Loss and loss adjustment expense ratio................................................................................................................................................................ 66.9 % 58.9 % 56.0 % 61.5 % 57.2 %Underwriting expense ratio.................................................................................................................................................................................. 24.3 % 28.9 % 24.3 % 24.5 % 24.6 %
Combined ratio............................................................................................................................................................................................. 91.2 % 87.8 % 80.3 % 86.0 % 81.8 %Impact on combined ratio:
Net favorable prior year reserve development............................................................................................................................................. (0.2) % (1.2) % (1.4) % (1.4) % (5.2) %Catastrophes, net of reinsurance................................................................................................................................................................... 0.5 % 2.9 % 0.2 % — % 0.4 %
Underlying combined ratio...................................................................................................................................................................... 90.9 % 86.1 % 81.5 % 87.4 % 86.6 %Catastrophe losses, net of reinsurance:
Pre-tax................................................................................................................................................................................................................ $ 8 $ 35 $ 3 $ — $ 6 After-tax............................................................................................................................................................................................................. $ 6 $ 27 $ 3 $ — $ 5
Prior year reserve development - favorable:Pre-tax................................................................................................................................................................................................................ $ 3 $ 15 $ 21 $ 20 $ 78 After-tax............................................................................................................................................................................................................. $ 2 $ 12 $ 17 $ 16 $ 61
Policies in force (in thousands)............................................................................................................................................................................ 2,970 2,993 3,015 3,029 3,056 Change from prior year quarter............................................................................................................................................................................ (0.4) % 0.4 % 1.2 % 1.9 % 2.9 %Change from prior quarter.................................................................................................................................................................................... (0.1) % 0.8 % 0.7 % 0.5 % 0.9 %
(1) Effective January 1, 2021, Domestic Agency, Direct-to-Consumer and International business activity are presented as Automobile. Previously, only the Domestic Agency business was presented. All prior periods presented have been reclassified to conform to the current presentation. (2) Billing and policy fees and other, which are a component of other revenues, and fee income are allocated as a reduction of underwriting expenses.
($ in millions) 1Q2020 2Q2020 3Q2020 4Q2020 1Q2021Billing and policy fees and other.......................................................................................................................................................................... $ 15 $ 9 $ 12 $ 13 $ 14 Fee income............................................................................................................................................................................................................ $ 3 $ 4 $ 4 $ 3 $ 3
See Glossary of Financial Measures and Description of Reportable Business Segments on pages 35 and 36.
The Travelers Companies, Inc. Selected Statistics - Personal Insurance - Automobile (1)
20

($ in millions) 1Q2020 2Q2020 3Q2020 4Q2020 1Q2021Statutory underwritingGross written premiums........................................................................................................................................................................................ $ 1,161 $ 1,532 $ 1,601 $ 1,387 $ 1,316 Net written premiums........................................................................................................................................................................................... $ 1,060 $ 1,519 $ 1,582 $ 1,385 $ 1,191 Net earned premiums............................................................................................................................................................................................ $ 1,231 $ 1,273 $ 1,317 $ 1,386 $ 1,366 Losses and loss adjustment expenses................................................................................................................................................................... 689 1,086 849 747 963 Underwriting expenses......................................................................................................................................................................................... 338 418 427 391 385 Statutory underwriting gain (loss)........................................................................................................................................................................ $ 204 $ (231) $ 41 $ 248 $ 18 Other statisticsCombined ratio (2):Loss and loss adjustment expense ratio................................................................................................................................................................ 56.0 % 85.3 % 64.5 % 53.9 % 70.5 %Underwriting expense ratio.................................................................................................................................................................................. 28.6 % 29.3 % 28.7 % 28.1 % 28.9 %
Combined ratio............................................................................................................................................................................................. 84.6 % 114.6 % 93.2 % 82.0 % 99.4 %Impact on combined ratio:
Net favorable prior year reserve development............................................................................................................................................. (1.6) % (1.5) % (25.9) % (0.3) % (6.6) %Catastrophes, net of reinsurance................................................................................................................................................................... 10.5 % 34.1 % 22.3 % 3.8 % 21.9 %
Underlying combined ratio...................................................................................................................................................................... 75.7 % 82.0 % 96.8 % 78.5 % 84.1 %Catastrophe losses, net of reinsurance:
Pre-tax................................................................................................................................................................................................................ $ 129 $ 435 $ 295 $ 52 $ 299 After-tax............................................................................................................................................................................................................. $ 102 $ 343 $ 233 $ 42 $ 236
Prior year reserve development - favorable:Pre-tax................................................................................................................................................................................................................ $ 19 $ 20 $ 341 $ 4 $ 90 After-tax............................................................................................................................................................................................................. $ 16 $ 15 $ 269 $ 3 $ 71
Policies in force (in thousands)............................................................................................................................................................................ 5,534 5,679 5,790 5,858 5,944 Change from prior year quarter............................................................................................................................................................................ 7.2 % 7.9 % 8.0 % 7.6 % 7.4 %Change from prior quarter.................................................................................................................................................................................... 1.7 % 2.6 % 2.0 % 1.2 % 1.5 %
(1) Effective January 1, 2021, Domestic Agency, Direct-to-Consumer and International business activity are presented as Homeowners and Other. Previously, only the Domestic Agency business was presented. All prior periods presented have been reclassified to conform to the current presentation.(2) Billing and policy fees and other, which are a component of other revenues, and fee income are allocated as a reduction of underwriting expenses.
($ in millions) 1Q2020 2Q2020 3Q2020 4Q2020 1Q2021Billing and policy fees and other.......................................................................................................................................................................... $ 9 $ 5 $ 8 $ 10 $ 9 Fee income............................................................................................................................................................................................................ $ 3 $ 2 $ 2 $ 3 $ 3
See Glossary of Financial Measures and Description of Reportable Business Segments on pages 35 and 36.
The Travelers Companies, Inc. Selected Statistics - Personal Insurance - Homeowners and Other (1)
21

($ in millions) 1Q2020 2Q2020 3Q2020 4Q2020 1Q2021RevenuesOther revenues...................................................................................................................................................................................................... $ — $ — $ — $ — $ —
Claims and expensesInterest expense.................................................................................................................................................................................................... 84 85 87 83 82 General and administrative expenses................................................................................................................................................................... 7 9 6 9 6
Total claims and expenses................................................................................................................................................................................. 91 94 93 92 88
Loss before income tax benefit............................................................................................................................................................................. (91) (94) (93) (92) (88) Income tax benefit................................................................................................................................................................................................ (20) (20) (19) (20) (19) Loss....................................................................................................................................................................................................................... $ (71) $ (74) $ (74) $ (72) $ (69)
See Glossary of Financial Measures and Description of Reportable Business Segments on pages 35 and 36.
The Travelers Companies, Inc. Interest Expense and Other
22

($ in millions)March 31,
2021December 31,
2020AssetsFixed maturities, available for sale, at fair value (amortized cost $70,286 and $68,830; allowance for expected credit losses of $2 and $2)..................................... $ 73,861 $ 74,003 Equity securities, at fair value (cost $387 and $387)............................................................................................................................................................................. 477 453 Real estate investments.......................................................................................................................................................................................................................... 1,018 1,026 Short-term securities.............................................................................................................................................................................................................................. 4,987 5,511 Other investments................................................................................................................................................................................................................................... 3,544 3,430
Total investments................................................................................................................................................................................................................................ 83,887 84,423 Cash........................................................................................................................................................................................................................................................ 663 721 Investment income accrued.................................................................................................................................................................................................................... 569 603 Premiums receivable (net of allowance for expected credit losses of $110 and $105).......................................................................................................................... 8,167 7,829 Reinsurance recoverables (net of allowance for estimated uncollectible reinsurance of $142 and $146)............................................................................................. 8,345 8,350 Ceded unearned premiums..................................................................................................................................................................................................................... 1,165 772 Deferred acquisition costs...................................................................................................................................................................................................................... 2,411 2,358 Contractholder receivables (net of allowance for expected credit losses of $19 and $19).................................................................................................................... 4,271 4,242 Goodwill................................................................................................................................................................................................................................................. 4,017 3,976 Other intangible assets........................................................................................................................................................................................................................... 318 317 Other assets............................................................................................................................................................................................................................................ 3,219 3,173
Total assets......................................................................................................................................................................................................................................... $ 117,032 $ 116,764
LiabilitiesClaims and claim adjustment expense reserves..................................................................................................................................................................................... $ 55,340 $ 54,521 Unearned premium reserves................................................................................................................................................................................................................... 15,742 15,222 Contractholder payables......................................................................................................................................................................................................................... 4,290 4,261 Payables for reinsurance premiums........................................................................................................................................................................................................ 702 356 Deferred taxes........................................................................................................................................................................................................................................ 293 558 Debt........................................................................................................................................................................................................................................................ 6,550 6,550 Other liabilities....................................................................................................................................................................................................................................... 5,846 6,095
Total liabilities................................................................................................................................................................................................................................... 88,763 87,563 Shareholders’ equityCommon stock (1,750.0 shares authorized; 251.5 and 252.4 shares issued and outstanding)............................................................................................................... 23,905 23,743 Retained earnings................................................................................................................................................................................................................................... 39,285 38,771 Accumulated other comprehensive income........................................................................................................................................................................................... 1,291 2,502 Treasury stock, at cost (530.0 and 527.3 shares)................................................................................................................................................................................... (36,212) (35,815)
Total shareholders’ equity................................................................................................................................................................................................................ 28,269 29,201 Total liabilities and shareholders’ equity........................................................................................................................................................................................ $ 117,032 $ 116,764
The Travelers Companies, Inc. Consolidated Balance Sheet
23
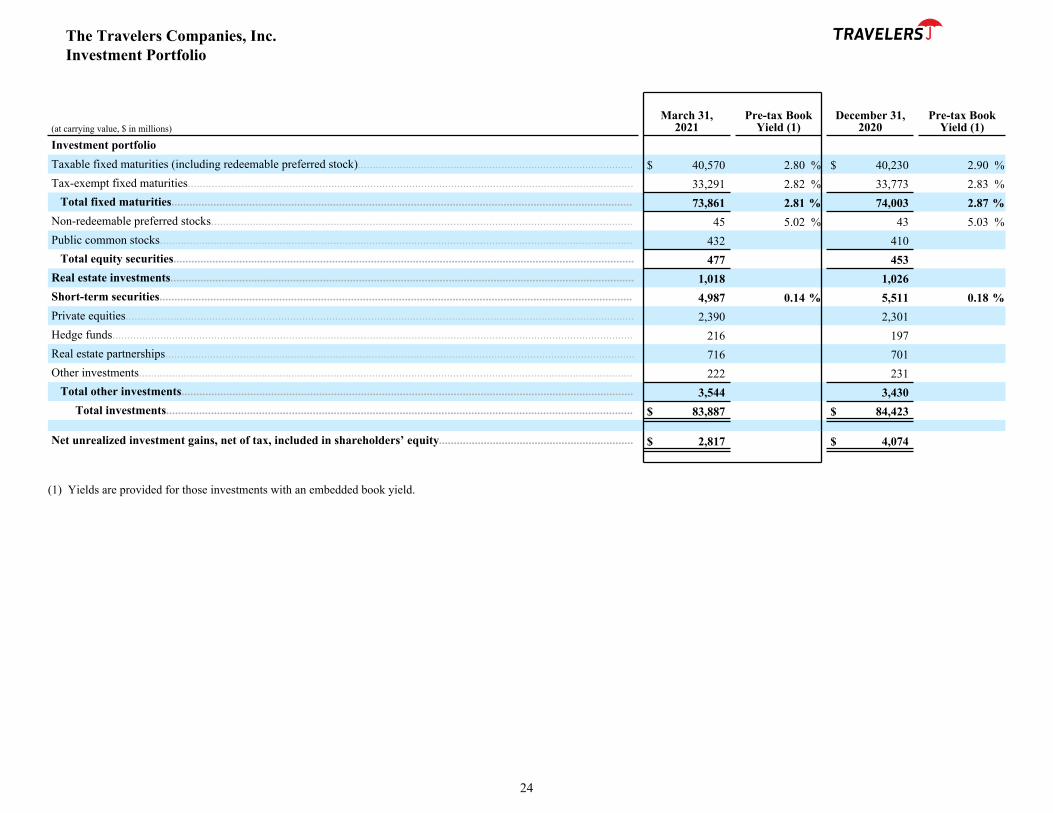
(at carrying value, $ in millions)March 31,
2021Pre-tax Book
Yield (1)December 31,
2020Pre-tax Book
Yield (1)Investment portfolioTaxable fixed maturities (including redeemable preferred stock)............................................................................................ $ 40,570 2.80 % $ 40,230 2.90 %Tax-exempt fixed maturities..................................................................................................................................................... 33,291 2.82 % 33,773 2.83 %
Total fixed maturities.......................................................................................................................................................... 73,861 2.81 % 74,003 2.87 %Non-redeemable preferred stocks............................................................................................................................................. 45 5.02 % 43 5.03 %Public common stocks.............................................................................................................................................................. 432 410
Total equity securities.......................................................................................................................................................... 477 453 Real estate investments........................................................................................................................................................... 1,018 1,026 Short-term securities.............................................................................................................................................................. 4,987 0.14 % 5,511 0.18 %Private equities.......................................................................................................................................................................... 2,390 2,301 Hedge funds.............................................................................................................................................................................. 216 197 Real estate partnerships............................................................................................................................................................. 716 701 Other investments..................................................................................................................................................................... 222 231
Total other investments....................................................................................................................................................... 3,544 3,430 Total investments............................................................................................................................................................ $ 83,887 $ 84,423
Net unrealized investment gains, net of tax, included in shareholders’ equity................................................................. $ 2,817 $ 4,074
(1) Yields are provided for those investments with an embedded book yield.
The Travelers Companies, Inc. Investment Portfolio
24

(at carrying value, $ in millions)March 31,
2021December 31,
2020Fixed maturitiesU.S. Treasury securities and obligations of U.S. Government corporations and agencies....................................................... $ 2,544 $ 2,149 Obligations of states and political subdivisions:
Pre-refunded........................................................................................................................................................................... 3,569 3,544 All other................................................................................................................................................................................. 32,531 32,816
Total.................................................................................................................................................................................. 36,100 36,360 Debt securities issued by foreign governments........................................................................................................................ 976 1,054 Mortgage-backed securities - principally obligations of U.S. Government agencies............................................................... 2,045 2,361 Corporates (including redeemable preferreds).......................................................................................................................... 32,196 32,079
Total fixed maturities............................................................................................................................................................. $ 73,861 $ 74,003
Fixed MaturitiesQuality Characteristics (1) March 31, 2021 December 31, 2020 Amount % of Total Amount % of TotalQuality RatingsAaa............................................................................................................................................................................................ $ 31,253 42.3 % $ 31,653 42.8 %Aa.............................................................................................................................................................................................. 18,466 25.0 18,327 24.8 A................................................................................................................................................................................................ 12,867 17.4 12,944 17.5 Baa............................................................................................................................................................................................ 9,960 13.5 9,738 13.1
Total investment grade........................................................................................................................................................... 72,546 98.2 72,662 98.2 Ba.............................................................................................................................................................................................. 859 1.2 870 1.2 B................................................................................................................................................................................................ 362 0.5 366 0.5 Caa and lower........................................................................................................................................................................... 94 0.1 105 0.1
Total below investment grade................................................................................................................................................ 1,315 1.8 1,341 1.8 Total fixed maturities................................................................................................................................................................ $ 73,861 100.0 % $ 74,003 100.0 %Average weighted quality......................................................................................................................................................... Aa2, AA Aa2, AAWeighted average duration of fixed maturities and short-term securities, net of securities lending activities and net receivables and payables on investment sales and purchases................................................................................................... 4.1 3.8
(1) Rated using external rating agencies or by Travelers when a public rating does not exist. Below investment grade assets refer to securities rated “Ba” or below.
The Travelers Companies, Inc. Investment Portfolio - Fixed Maturities Data
25
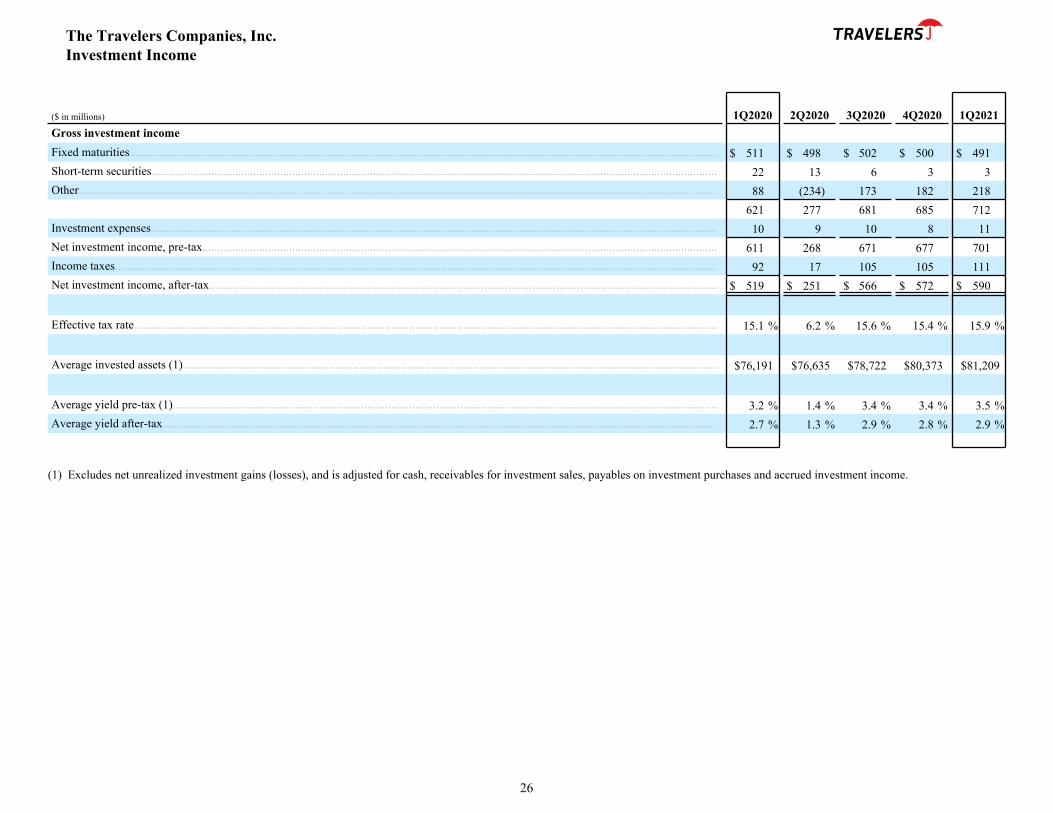
($ in millions) 1Q2020 2Q2020 3Q2020 4Q2020 1Q2021Gross investment incomeFixed maturities.................................................................................................................................................................................................... $ 511 $ 498 $ 502 $ 500 $ 491 Short-term securities............................................................................................................................................................................................. 22 13 6 3 3 Other..................................................................................................................................................................................................................... 88 (234) 173 182 218
621 277 681 685 712 Investment expenses............................................................................................................................................................................................. 10 9 10 8 11 Net investment income, pre-tax............................................................................................................................................................................ 611 268 671 677 701 Income taxes......................................................................................................................................................................................................... 92 17 105 105 111 Net investment income, after-tax.......................................................................................................................................................................... $ 519 $ 251 $ 566 $ 572 $ 590
Effective tax rate................................................................................................................................................................................................... 15.1 % 6.2 % 15.6 % 15.4 % 15.9 %
Average invested assets (1)................................................................................................................................................................................... $76,191 $76,635 $78,722 $80,373 $81,209
Average yield pre-tax (1)...................................................................................................................................................................................... 3.2 % 1.4 % 3.4 % 3.4 % 3.5 %Average yield after-tax......................................................................................................................................................................................... 2.7 % 1.3 % 2.9 % 2.8 % 2.9 %
(1) Excludes net unrealized investment gains (losses), and is adjusted for cash, receivables for investment sales, payables on investment purchases and accrued investment income.
The Travelers Companies, Inc. Investment Income
26

($ in millions) 1Q2020 2Q2020 3Q2020 4Q2020 1Q2021Net realized investment gains (losses)Fixed maturities........................................................................................................................................................................... $ (2) $ 10 $ 23 $ 21 $ 14 Equity securities .......................................................................................................................................................................... (88) 43 16 37 26 Other (1)....................................................................................................................................................................................... (8) (40) (2) (8) 4 Realized investment gains (losses) before tax............................................................................................................................. (98) 13 37 50 44 Related taxes................................................................................................................................................................................ (22) 3 8 2 10 Net realized investment gains (losses)......................................................................................................................................... $ (76) $ 10 $ 29 $ 48 $ 34
Gross investment gains (1)........................................................................................................................................................... $ 31 $ 69 $ 41 $ 64 $ 50 Gross investment losses before impairments (1)......................................................................................................................... (113) (10) (8) (17) (6) Net investment gains (losses) before impairments...................................................................................................................... (82) 59 33 47 44 Net credit impairment (charges) recoveries................................................................................................................................. (16) (46) 4 3 — Net realized investment gains (losses) before tax........................................................................................................................ (98) 13 37 50 44 Related taxes................................................................................................................................................................................ (22) 3 8 2 10 Net realized investment gains (losses)......................................................................................................................................... $ (76) $ 10 $ 29 $ 48 $ 34
($ in millions)March 31,
2020June 30,
2020September 30,
2020December 31,
2020March 31,
2021
Net unrealized investment gains, net of tax, included in shareholders’ equity, by asset type
Fixed maturities........................................................................................................................................................................... $ 2,271 $ 4,632 $ 4,842 $ 5,175 $ 3,577 Equity securities & other............................................................................................................................................................. 2 2 2 — 2 Unrealized investment gains before tax....................................................................................................................................... 2,273 4,634 4,844 5,175 3,579 Related taxes ............................................................................................................................................................................... 488 988 1,032 1,101 762 Balance, end of period................................................................................................................................................................. $ 1,785 $ 3,646 $ 3,812 $ 4,074 $ 2,817
(1) Includes the following gross investment gains and gross investment losses related to U.S. Treasury futures, which are settled daily:
Gross investment Treasury future gains $ 5 $ — $ — $ — $ — Gross investment Treasury future losses $ 12 $ — $ — $ — $ —
The Company entered into these arrangements as part of its strategy to manage the duration of its fixed maturity portfolio. In a changing interest rate environment, the change in the value of the futures contracts can be expected to partially offset changes in the value of the fixed maturity portfolio.
The Travelers Companies, Inc. Net Realized and Unrealized Investment Gains (Losses) included in Shareholders' Equity
27

($ in millions) March 31, 2021 December 31, 2020
Gross reinsurance recoverables on paid and unpaid claims and claim adjustment expenses (1).......................................................................................................................................................................... $ 3,750 $ 3,731
Gross structured settlements (2)............................................................................................................................................................................................................................................................................ 2,920 2,964
Mandatory pools and associations (3) .................................................................................................................................................................................................................................................................. 1,817 1,801
Gross reinsurance recoverables (4)................................................................................................................................................................................................................................................................. 8,487 8,496
Allowance for estimated uncollectible reinsurance (5) (142) (146)
Net reinsurance recoverables.................................................................................................................................................................................................................................................................. $ 8,345 $ 8,350
(1) The Company’s top five reinsurer groups, including retroactive reinsurance, included in gross reinsurance recoverables is as follows:
Reinsurer A.M. Best Rating of Group's Predominant Reinsurer March 31, 2021
Swiss Re Group.............................................................................................................................................................. A+ second highest of 16 ratings $ 587
Berkshire Hathaway....................................................................................................................................................... A++ highest of 16 ratings 309
Munich Re Group........................................................................................................................................................... A+ second highest of 16 ratings 290
Alleghany Group............................................................................................................................................................ A+ second highest of 16 ratings 195
Axa Group...................................................................................................................................................................... A+ second highest of 16 ratings 186
The gross reinsurance recoverables on paid and unpaid claims and claim adjustment expenses represent the current and estimated future amounts due from reinsurers on known and incurred but not reported claims. The ceded reserves are estimated in a manner consistent with the underlying direct and assumed reserves. Although this total comprises recoverables due from nearly one thousand different reinsurance entities, about half is attributable to 10 reinsurer groups.
(2) Included in reinsurance recoverables are certain amounts related to structured settlements, which comprise annuities purchased from various life insurance companies to settle certain personal physical injury claims, of which workers’ compensation claims comprise a significant portion. In cases where the Company did not receive a release from the claimant, the amounts due from the life insurance company related to the structured settlement are included in both the claims and claim adjustment expense reserves and reinsurance recoverables in the Company’s consolidated balance sheet, as the Company retains the liability to pay the claimant in the event that the life insurance company fails to make the required annuity payments. The Company would be required to make such payments, to the extent the purchased annuities are not covered by state guaranty associations.
The Company’s top five groups included in gross structured settlements is as follows:
Group A.M. Best Rating of Group's Predominant Insurer March 31, 2021
Fidelity & Guaranty Life Group .................................................................................................................................... A- fourth highest of 16 ratings $ 745
Genworth Financial Group (a)....................................................................................................................................... B seventh highest of 16 ratings 315
John Hancock Group...................................................................................................................................................... A+ second highest of 16 ratings 271
Brighthouse Financial, Inc............................................................................................................................................. A third highest of 16 ratings 230
Symetra Financial Corporation...................................................................................................................................... A third highest of 16 ratings 227
(a) On October 23, 2016, Genworth Financial (Genworth) announced that they had entered into a definitive agreement under which China Oceanwide Holdings Group Co., Ltd. agreed to acquire all of the outstanding shares of Genworth. On April 6, 2021, Genworth announced that it had exercised its right to terminate the merger agreement.
(3) The mandatory pools and associations represent various involuntary assigned risk pools that the Company is required to participate in. These pools principally involve workers’ compensation and automobile insurance, which provide various insurance coverages to insureds that otherwise are unable to purchase coverage in the open market. The costs of these mandatory pools in most states are usually charged back to the participating members in proportion to voluntary writings of related business in that state. In the event that a member of the pool becomes insolvent, the remaining members assume an additional pro rata share of the pool’s liabilities.
(4) Of the total reinsurance recoverables at March 31, 2021, after deducting mandatory pools and associations and before allowances for estimated uncollectible reinsurance, $5.83 billion, or 87%, were rated by A.M. Best Company. The Company utilizes updated A.M. Best credit ratings on a quarterly basis when determining the allowance. Of the total rated by A.M. Best Company, 94% were rated A- or better. The remaining 13% of reinsurance recoverables were comprised of the following: 6% related to captive insurance companies, 1% related to the Company’s participation in voluntary pools and 6% were balances from other companies not rated by A.M. Best Company. Certain of the Company's reinsurance recoverables are collateralized by letters of credit, funds held or trust agreements.
(5) The Company reports its reinsurance recoverables net of an allowance for estimated uncollectible reinsurance. The allowance is based upon the Company’s ongoing review of amounts outstanding, length of collection periods, changes in reinsurer credit standing, disputes, applicable coverage defenses and other relevant factors. For structured settlements, the allowance is also based upon the Company’s ongoing review of life insurers’ creditworthiness and estimated amounts of coverage that would be available from state guaranty funds if a life insurer defaults. A probability-of-default methodology which reflects current and forecasted economic conditions is used to estimate the amount of uncollectible reinsurance due to credit-related factors and the estimate is reported in an allowance for estimated uncollectible reinsurance. The allowance also includes estimated uncollectible amounts related to dispute risk with reinsurers. The Company adopted updated guidance for the accounting for credit losses for financial instruments for the quarter ending March 31, 2020 which resulted in the recognition of an allowance for expected credit losses on structured settlements of $53 million, pre-tax, with an offsetting after-tax cumulative effect adjustment to retained earnings as of January 1, 2020.
The Travelers Companies, Inc. Reinsurance Recoverables
28
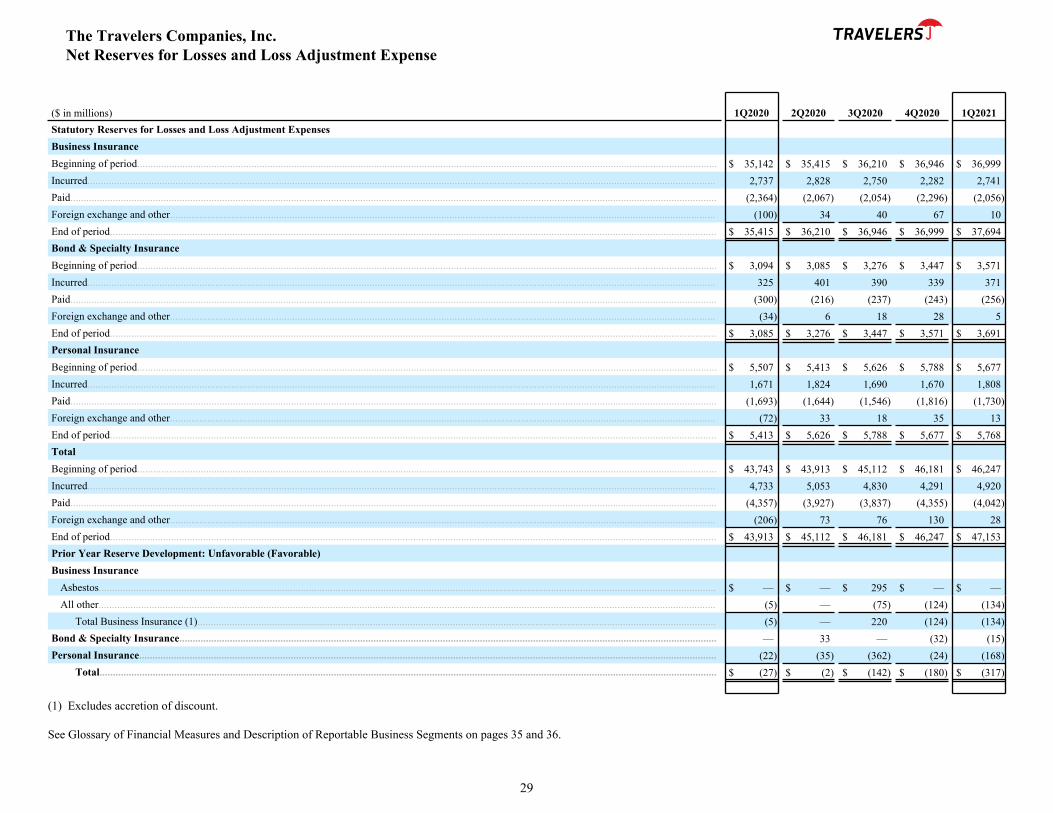
($ in millions) 1Q2020 2Q2020 3Q2020 4Q2020 1Q2021Statutory Reserves for Losses and Loss Adjustment ExpensesBusiness InsuranceBeginning of period.......................................................................................................................................................................................................................... $ 35,142 $ 35,415 $ 36,210 $ 36,946 $ 36,999 Incurred............................................................................................................................................................................................................................................ 2,737 2,828 2,750 2,282 2,741 Paid................................................................................................................................................................................................................................................... (2,364) (2,067) (2,054) (2,296) (2,056) Foreign exchange and other............................................................................................................................................................................................................. (100) 34 40 67 10 End of period.................................................................................................................................................................................................................................... $ 35,415 $ 36,210 $ 36,946 $ 36,999 $ 37,694 Bond & Specialty InsuranceBeginning of period.......................................................................................................................................................................................................................... $ 3,094 $ 3,085 $ 3,276 $ 3,447 $ 3,571 Incurred............................................................................................................................................................................................................................................ 325 401 390 339 371 Paid................................................................................................................................................................................................................................................... (300) (216) (237) (243) (256) Foreign exchange and other............................................................................................................................................................................................................. (34) 6 18 28 5 End of period.................................................................................................................................................................................................................................... $ 3,085 $ 3,276 $ 3,447 $ 3,571 $ 3,691 Personal InsuranceBeginning of period.......................................................................................................................................................................................................................... $ 5,507 $ 5,413 $ 5,626 $ 5,788 $ 5,677 Incurred............................................................................................................................................................................................................................................ 1,671 1,824 1,690 1,670 1,808 Paid................................................................................................................................................................................................................................................... (1,693) (1,644) (1,546) (1,816) (1,730) Foreign exchange and other............................................................................................................................................................................................................. (72) 33 18 35 13 End of period.................................................................................................................................................................................................................................... $ 5,413 $ 5,626 $ 5,788 $ 5,677 $ 5,768 TotalBeginning of period.......................................................................................................................................................................................................................... $ 43,743 $ 43,913 $ 45,112 $ 46,181 $ 46,247 Incurred............................................................................................................................................................................................................................................ 4,733 5,053 4,830 4,291 4,920 Paid................................................................................................................................................................................................................................................... (4,357) (3,927) (3,837) (4,355) (4,042) Foreign exchange and other............................................................................................................................................................................................................. (206) 73 76 130 28 End of period.................................................................................................................................................................................................................................... $ 43,913 $ 45,112 $ 46,181 $ 46,247 $ 47,153 Prior Year Reserve Development: Unfavorable (Favorable)Business Insurance
Asbestos........................................................................................................................................................................................................................................ $ — $ — $ 295 $ — $ — All other........................................................................................................................................................................................................................................ (5) — (75) (124) (134)
Total Business Insurance (1)................................................................................................................................................................................................... (5) — 220 (124) (134) Bond & Specialty Insurance.......................................................................................................................................................................................................... — 33 — (32) (15) Personal Insurance......................................................................................................................................................................................................................... (22) (35) (362) (24) (168)
Total........................................................................................................................................................................................................................................ $ (27) $ (2) $ (142) $ (180) $ (317)
(1) Excludes accretion of discount.
See Glossary of Financial Measures and Description of Reportable Business Segments on pages 35 and 36.
The Travelers Companies, Inc. Net Reserves for Losses and Loss Adjustment Expense
29

($ in millions) 1Q2020 2Q2020 3Q2020 4Q2020 1Q2021Asbestos reservesBeginning reserves:
Gross............................................................................................................................................................................................................................................. $ 1,601 $ 1,530 $ 1,470 $ 1,772 $ 1,668 Ceded............................................................................................................................................................................................................................................ (322) (316) (301) (365) (330) Net................................................................................................................................................................................................................................................. 1,279 1,214 1,169 1,407 1,338
Incurred losses and loss expenses:Gross............................................................................................................................................................................................................................................. — — 362 — — Ceded............................................................................................................................................................................................................................................ — — (67) — —
Paid loss and loss expenses:Gross............................................................................................................................................................................................................................................. 69 60 61 105 52 Ceded............................................................................................................................................................................................................................................ (6) (15) (2) (35) (3)
Foreign exchange and other:Gross............................................................................................................................................................................................................................................. (2) — 1 1 — Ceded............................................................................................................................................................................................................................................ — — 1 — —
Ending reserves:Gross............................................................................................................................................................................................................................................. 1,530 1,470 1,772 1,668 1,616 Ceded............................................................................................................................................................................................................................................ (316) (301) (365) (330) (327) Net................................................................................................................................................................................................................................................. $ 1,214 $ 1,169 $ 1,407 $ 1,338 $ 1,289
See Glossary of Financial Measures and Description of Reportable Business Segments on pages 35 and 36.
The Travelers Companies, Inc. Asbestos Reserves
30

($ in millions)March 31,
2021December 31,
2020Debt
Short-term debtCommercial paper............................................................................................................................................................................................................................... $ 100 $ 100
Total short-term debt...................................................................................................................................................................................................................... 100 100 Long-term debt7.75% Senior notes due April 15, 2026.............................................................................................................................................................................................. 200 200 7.625% Junior subordinated debentures due December 15, 2027...................................................................................................................................................... 125 125 6.375% Senior notes due March 15, 2033 (1)..................................................................................................................................................................................... 500 500 6.75% Senior notes due June 20, 2036 (1).......................................................................................................................................................................................... 400 400 6.25% Senior notes due June 15, 2037 (1).......................................................................................................................................................................................... 800 800 5.35% Senior notes due November 1, 2040 (1).................................................................................................................................................................................. 750 750 4.60% Senior notes due August 1, 2043 (1)........................................................................................................................................................................................ 500 500 4.30% Senior notes due August 25, 2045 (1)...................................................................................................................................................................................... 400 400 8.50% Junior subordinated debentures due December 15, 2045........................................................................................................................................................ 56 56 3.75% Senior notes due May 15, 2046 (1).......................................................................................................................................................................................... 500 500 8.312% Junior subordinated debentures due July 1, 2046.................................................................................................................................................................. 73 73 4.00% Senior notes due May 30, 2047 (1).......................................................................................................................................................................................... 700 700 4.05% Senior notes due March 7, 2048 (1)......................................................................................................................................................................................... 500 500 4.10% Senior notes due March 4, 2049 (1)......................................................................................................................................................................................... 500 500 2.55% Senior notes due April 27, 2050 (1)......................................................................................................................................................................................... 500 500
Total long-term debt....................................................................................................................................................................................................................... 6,504 6,504 Unamortized fair value adjustment..................................................................................................................................................................................................... 41 41 Unamortized debt issuance costs......................................................................................................................................................................................................... (95) (95)
6,450 6,450 Total debt...................................................................................................................................................................................................................................... 6,550 6,550
Common equity (excluding net unrealized investment gains, net of tax, included in shareholders’ equity)............................................................................... 25,452 25,127 Total capital (excluding net unrealized investment gains, net of tax, included in shareholders’ equity).................................................................................... $ 32,002 $ 31,677 Total debt to capital (excluding net unrealized investment gains, net of tax, included in shareholders’ equity)....................................................................... 20.5 % 20.7 %
(1) Redeemable anytime with “make-whole” premium.
See Glossary of Financial Measures and Description of Reportable Business Segments on pages 35 and 36.
The Travelers Companies, Inc. Capitalization
31
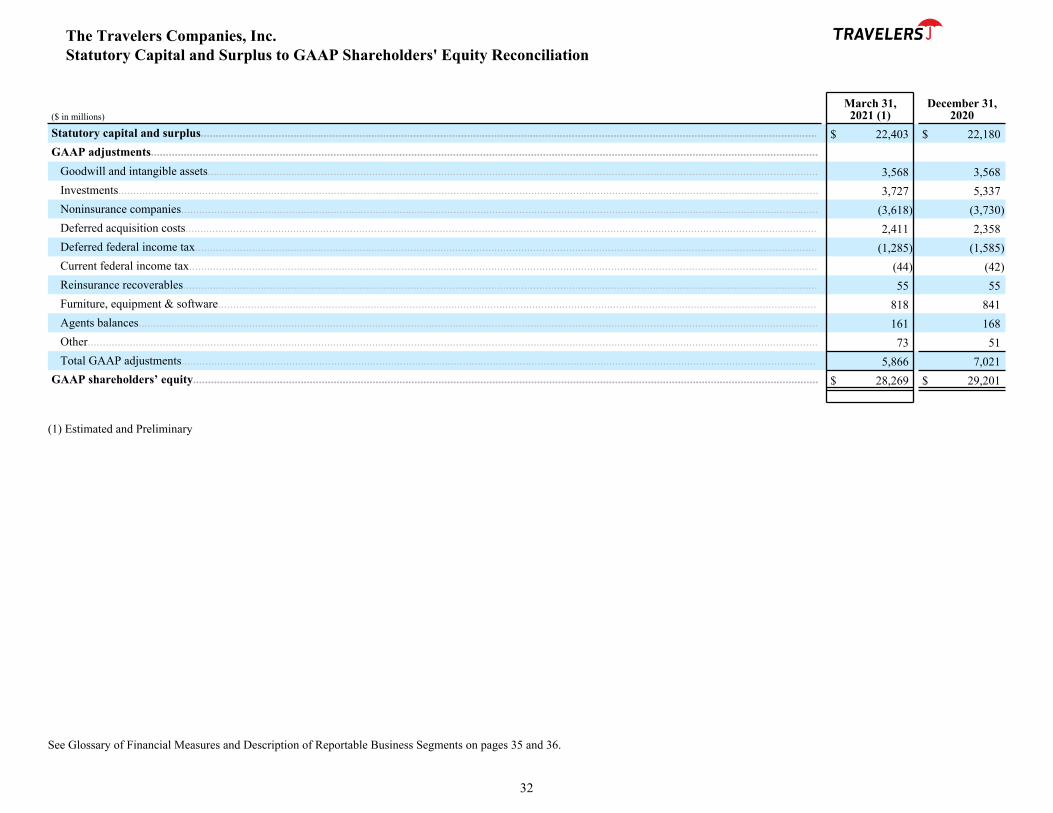
($ in millions)March 31,2021 (1)
December 31,2020
Statutory capital and surplus.............................................................................................................................................................................................................. $ 22,403 $ 22,180 GAAP adjustments...............................................................................................................................................................................................................................
Goodwill and intangible assets............................................................................................................................................................................................................ 3,568 3,568 Investments.......................................................................................................................................................................................................................................... 3,727 5,337 Noninsurance companies..................................................................................................................................................................................................................... (3,618) (3,730) Deferred acquisition costs................................................................................................................................................................................................................... 2,411 2,358 Deferred federal income tax................................................................................................................................................................................................................ (1,285) (1,585) Current federal income tax.................................................................................................................................................................................................................. (44) (42) Reinsurance recoverables.................................................................................................................................................................................................................... 55 55 Furniture, equipment & software........................................................................................................................................................................................................ 818 841 Agents balances................................................................................................................................................................................................................................... 161 168 Other.................................................................................................................................................................................................................................................... 73 51 Total GAAP adjustments.................................................................................................................................................................................................................... 5,866 7,021
GAAP shareholders’ equity................................................................................................................................................................................................................. $ 28,269 $ 29,201
(1) Estimated and Preliminary
See Glossary of Financial Measures and Description of Reportable Business Segments on pages 35 and 36.
The Travelers Companies, Inc. Statutory Capital and Surplus to GAAP Shareholders' Equity Reconciliation
32

($ in millions) 1Q2020 2Q2020 3Q2020 4Q2020 1Q2021Cash flows from operating activitiesNet income (loss).................................................................................................................................................................................................. $ 600 $ (40) $ 827 $ 1,310 $ 733 Adjustments to reconcile net income (loss) to net cash provided by operating activities:
Net realized investment (gains) losses............................................................................................................................................................... 98 (13) (37) (50) (44) Depreciation and amortization........................................................................................................................................................................... 203 188 186 212 235 Deferred federal income tax expense (benefit).................................................................................................................................................. 6 (77) 4 38 56 Amortization of deferred acquisition costs........................................................................................................................................................ 1,178 1,173 1,207 1,215 1,207 Equity in (income) loss from other investments................................................................................................................................................ (67) 253 (154) (162) (200) Premiums receivable.......................................................................................................................................................................................... (326) (245) 247 418 (333) Reinsurance recoverables.................................................................................................................................................................................. (15) 75 (210) (12) 12 Deferred acquisition costs................................................................................................................................................................................. (1,215) (1,238) (1,241) (1,160) (1,258) Claims and claim adjustment expense reserves................................................................................................................................................. 388 1,067 1,218 (51) 777 Unearned premium reserves.............................................................................................................................................................................. 414 229 317 (368) 509 Other.................................................................................................................................................................................................................. (636) 292 (38) 511 (504)
Net cash provided by operating activities................................................................................................................................................. 628 1,664 2,326 1,901 1,190 Cash flows from investing activitiesProceeds from maturities of fixed maturities....................................................................................................................................................... 1,461 1,610 2,170 2,146 2,064 Proceeds from sales of investments:
Fixed maturities................................................................................................................................................................................................. 388 832 774 1,063 1,238 Equity securities................................................................................................................................................................................................ 33 21 22 35 25 Other investments.............................................................................................................................................................................................. 64 75 45 97 79
Purchases of investments:Fixed maturities................................................................................................................................................................................................. (2,630) (2,160) (5,161) (4,122) (4,754) Equity securities................................................................................................................................................................................................ (35) (24) (21) (32) (19) Real estate investments...................................................................................................................................................................................... (16) (8) (9) (80) (5) Other investments.............................................................................................................................................................................................. (103) (125) (93) (166) (97)
Net sales (purchases) of short-term securities...................................................................................................................................................... 906 (2,053) (240) 821 524 Securities transactions in course of settlement..................................................................................................................................................... 85 9 428 (569) 269 Acquisition, net of cash acquired......................................................................................................................................................................... — — — — (38) Other..................................................................................................................................................................................................................... (69) (75) (78) (108) (60)
Net cash provided by (used in) investing activities.................................................................................................................................. 84 (1,898) (2,163) (915) (774)
The Travelers Companies, Inc. Statement of Cash Flows
33

($ in millions) 1Q2020 2Q2020 3Q2020 4Q2020 1Q2021Cash flows from financing activitiesTreasury stock acquired - share repurchase authorization...................................................................................................................................... (425) — — (200) (356) Treasury stock acquired - net employee share-based compensation...................................................................................................................... (46) — — (1) (41) Dividends paid to shareholders............................................................................................................................................................................... (210) (216) (217) (218) (214) Payment of debt...................................................................................................................................................................................................... — — — (500) — Issuance of debt....................................................................................................................................................................................................... — 490 — — — Issuance of common stock - employee share options............................................................................................................................................. 31 34 7 55 134
Net cash provided by (used in) financing activities......................................................................................................................................... (650) 308 (210) (864) (477) Effect of exchange rate changes on cash................................................................................................................................................................ (12) 5 7 16 3 Net increase (decrease) in cash............................................................................................................................................................................... 50 79 (40) 138 (58) Cash at beginning of period.................................................................................................................................................................................... 494 544 623 583 721 Cash at end of period.............................................................................................................................................................................................. $ 544 $ 623 $ 583 $ 721 $ 663 Income taxes paid................................................................................................................................................................................................... $ 15 $ 2 $ 396 $ 165 $ 58 Interest paid............................................................................................................................................................................................................. $ 60 $ 106 $ 60 $ 113 $ 59
The Travelers Companies, Inc. Statement of Cash Flows (Continued)
34

The following measures are used by the Company’s management to evaluate financial performance against historical results, to establish performance targets on a consolidated basis, and for other reasons as discussed below. In some cases, these measures are considered non-GAAP financial measures under applicable SEC rules because they are not displayed as separate line items in the consolidated financial statements or are not required to be disclosed in the notes to financial statements or, in some cases, include or exclude certain items not ordinarily included or excluded in the most comparable GAAP financial measure. In the opinion of the Company’s management, a discussion of these measures provides investors, financial analysts, rating agencies and other financial statement users with a better understanding of the significant factors that comprise the Company’s periodic results of operations and how management evaluates the Company’s financial performance. Some of these measures exclude net realized investment gains (losses), net of tax, and/or net unrealized investment gains (losses), net of tax, included in shareholders’ equity, which can be significantly impacted by both discretionary and other economic factors and are not necessarily indicative of operating trends. Other companies may calculate these measures differently, and, therefore, their measures may not be comparable to those used by the Company’s management. Core income (loss) is consolidated net income (loss) excluding the after-tax impact of net realized investment gains (losses), discontinued operations, the effect of a change in tax laws and tax rates at enactment, and cumulative effect of changes in accounting principles when applicable. Segment income (loss) is determined in the same manner as core income (loss) on a segment basis. Management uses segment income (loss) to analyze each segment’s performance and as a tool in making business decisions. Financial statement users also consider core income (loss) when analyzing the results and trends of insurance companies. Core income (loss) per share is core income (loss) on a per common share basis. Average shareholders’ equity is (a) the sum of total shareholders’ equity at the beginning and end of each of the quarters for the period presented divided by (b) the number of quarters in the period presented times two. Adjusted shareholders’ equity is shareholders’ equity excluding net realized investment gains (losses), net of tax, net unrealized investment gains (losses), net of tax, included in shareholders’ equity for the periods presented and the effect of a change in tax laws and tax rates at enactment (excluding the portion related to net unrealized investment gains (losses)). Adjusted average shareholders’ equity is (a) the sum of total adjusted shareholders’ equity at the beginning and end of each of the quarters for the period presented divided by (b) the number of quarters in the period presented times two.
Reconciliation of Shareholders’ Equity to Adjusted Shareholders’ Equity
As of
($ in millions) March 31, 2020 June 30, 2020 September 30, 2020 December 31, 2020 March 31, 2021
Shareholders’ equity....................................................................................................................................................................................................................... $ 25,204 $ 26,943 $ 27,849 $ 29,201 $ 28,269
Adjustments:
Net unrealized investment gains, net of tax, included in shareholders’ equity.............................................................................................................................. (1,785) (3,646) (3,812) (4,074) (2,817)
Net realized investment (gains) losses, net of tax........................................................................................................................................................................ 76 66 37 (11) (34)
Adjusted shareholders’ equity....................................................................................................................................................................................................... $ 23,495 $ 23,363 $ 24,074 $ 25,116 $ 25,418
Return on equity is the ratio of annualized net income (loss) to average shareholders’ equity for the periods presented. Core return on equity is the ratio of annualized core income (loss) to adjusted average shareholders’ equity for the periods presented. In the opinion of the Company’s management, these are important indicators of how well management creates value for its shareholders through its operating activities and its capital management.
Underwriting gain (loss) is net earned premiums and fee income less claims and claim adjustment expenses and insurance-related expenses. In the opinion of the Company’s management, it is important to measure the profitability of each segment excluding the results of investing activities, which are managed separately from the insurance business. This measure is used to assess each segment’s business performance and as a tool in making business decisions. A catastrophe is a severe loss designated a catastrophe by internationally recognized organizations that track and report on insured losses resulting from catastrophic events, such as Property Claim Services (PCS) for events in the United States and Canada. Catastrophes can be caused by various natural events, including, among others, hurricanes, tornadoes and other windstorms, earthquakes, hail, wildfires, severe winter weather, floods, tsunamis, volcanic eruptions and other naturally-occurring events, such as solar flares. Catastrophes can also be man-made, such as terrorist attacks and other intentionally destructive acts including those involving nuclear, biological, chemical and radiological events, cyber events, explosions and destruction of infrastructure. Each catastrophe has unique characteristics and catastrophes are not predictable as to timing or amount. Their effects are included in net and core income and claims and claim adjustment expense reserves upon occurrence. A catastrophe may result in the payment of reinsurance reinstatement premiums and assessments from various pools. The Company’s threshold for disclosing catastrophes is primarily determined at the reportable segment level. If a threshold for one segment or a combination thereof is exceeded and the other segments have losses from the same event, losses from the event are identified as catastrophe losses in the segment results and for the consolidated results of the Company. Additionally, an aggregate threshold is applied for international business across all reportable segments. The threshold for 2021 ranges from $20 million to $30 million of losses before reinsurance and taxes. Net favorable (unfavorable) prior year loss reserve development is the increase or decrease in incurred claims and claim adjustment expenses as a result of the re-estimation of claims and claim adjustment expense reserves at successive valuation dates for a given group of claims, which may be related to one or more prior years. In the opinion of the Company’s management, a discussion of loss reserve development is meaningful to users of the financial statements as it allows them to assess the impact between prior and current year development on incurred claims and claim adjustment expenses, net and core income (loss), and changes in claims and claim adjustment expense reserve levels from period to period.
The Travelers Companies, Inc. Glossary of Financial Measures and Description of Reportable Business Segments
35

Combined ratio For Statutory Accounting Practices (SAP), the combined ratio is the sum of the SAP loss and LAE ratio and the SAP underwriting expense ratio as defined in the statutory financial statements required by insurance regulators. The combined ratio, as used in this financial supplement, is the equivalent of, and is calculated in the same manner as, the SAP combined ratio except that the SAP underwriting expense ratio is based on net written premiums and the underwriting expense ratio as used in this financial supplement is based on net earned premiums. For SAP, the loss and LAE ratio is the ratio of incurred losses and loss adjustment expenses less certain administrative services fee income to net earned premiums as defined in the statutory financial statements required by insurance regulators. The loss and LAE ratio as used in this financial supplement is calculated in the same manner as the SAP ratio. For SAP, the underwriting expense ratio is the ratio of underwriting expenses incurred (including commissions paid), less certain administrative services fee income and billing and policy fees and other, to net written premiums as defined in the statutory financial statements required by insurance regulators. The underwriting expense ratio as used in this financial supplement, is the ratio of underwriting expenses (including the amortization of deferred acquisition costs), less certain administrative services fee income and billing and policy fees, to net earned premiums. Underlying combined ratio is the combined ratio adjusted to exclude the impact of prior year reserve development and catastrophes, net of reinsurance. The combined ratio, loss and LAE ratio, and underwriting expense ratio are used as indicators of the Company’s underwriting discipline, efficiency in acquiring and servicing its business and overall underwriting profitability. A combined ratio under 100% generally indicates an underwriting profit. A combined ratio over 100% generally indicates an underwriting loss. Other companies’ method of computing similarly titled measures may not be comparable to the Company’s method of computing these ratios. Gross written premiums reflect the direct and assumed contractually determined amounts charged to policyholders for the effective period of the contract based on the terms and conditions of the insurance contract. Net written premiums reflect gross written premiums less premiums ceded to reinsurers. Book value per share is total common shareholders’ equity divided by the number of common shares outstanding. Adjusted book value per share is total common shareholders’ equity excluding net unrealized investment gains and losses, net of tax, included in shareholders’ equity, divided by the number of common shares outstanding. In the opinion of the Company’s management, adjusted book value per share is useful in an analysis of a property casualty company’s book value per share as it removes the effect of changing prices on invested assets, (i.e., net unrealized investment gains (losses), net of tax) which do not have an equivalent impact on unpaid claims and claim adjustment expense reserves. Total capital is the sum of total shareholders’ equity and debt. Debt-to-capital ratio excluding net unrealized gain (loss) on investments, net of tax, included in shareholders’ equity is the ratio of debt to total capital excluding net unrealized investment gains and losses, net of tax, included in shareholders’ equity. In the opinion of the Company’s management, the debt to capital ratio is useful in an analysis of the Company’s financial leverage. Statutory capital and surplus represents the excess of an insurance company’s admitted assets over its liabilities, including loss reserves, as determined in accordance with statutory accounting practices. Travelers has organized its businesses into the following reportable business segments: Business Insurance - Business Insurance offers a broad array of property and casualty insurance and insurance-related services to its customers, primarily in the United States, as well as in Canada, the United Kingdom, the Republic of Ireland and throughout other parts of the world as a corporate member of Lloyd’s. Business Insurance is organized as follows: Select Accounts; Middle Market including Commercial Accounts, Construction, Technology, Public Sector Services, Oil & Gas, Excess Casualty, Inland Marine, Ocean Marine, and Boiler & Machinery; National Accounts; National Property and Other including National Property, Northland Transportation, Northfield, National Programs, and Agribusiness; and International including Global Services. Business Insurance also includes Simply Business, a leading provider of small business insurance policies primarily in the United Kingdom that was acquired in August 2017, as well as Business Insurance Other, which primarily comprises the Company’s asbestos and environmental liabilities, and the assumed reinsurance and certain other runoff operations. Bond & Specialty Insurance - Bond & Specialty Insurance provides surety, fidelity, management liability, professional liability, and other property and casualty coverages and related risk management services to its customers in the United States and certain specialty insurance products in Canada, the United Kingdom, the Republic of Ireland and Brazil (through a joint venture as described below), utilizing various degrees of financially-based underwriting approaches. The range of coverages includes performance, payment and commercial surety and fidelity bonds for construction and general commercial enterprises; management liability coverages including directors’ and officers’ liability, employee dishonesty, employment practices liability, fiduciary liability and cyber risk for public corporations, private companies, not-for-profit organizations and financial institutions; professional liability coverage for a variety of professionals including, among others, lawyers and design professionals; and in the United States only, property, workers’ compensation, auto and general liability for financial institutions. Bond & Specialty Insurance surety business in Brazil and Colombia is conducted through Junto Holding Brasil S.A. (Junto) and Junto Holding Latam S.A. in Brazil. The Company owns 49.5% of both Junto, a market leader in surety coverages in Brazil, and Junto Holding Latam S.A., a Colombian start-up surety provider. These joint venture investments are accounted for using the equity method and are included in “other investments” on the consolidated balance sheet. Personal Insurance - Personal Insurance writes a broad range of property and casualty insurance covering individuals’ personal risks, primarily in the United States, as well as in Canada. The primary products of automobile and homeowners insurance are complemented by a broad suite of related coverages.
The Travelers Companies, Inc. Glossary of Financial Measures and Description of Reportable Business Segments
36