the ultimate checklist for serverless monitoring
TRANSCRIPT

The Ultimate Checklist for Serverless Monitoringepsagon.com

2
OverviewThe Ultimate Checklist for Serverless Monitoring 1 Introduction 2
What You Need to Monitor 3
Key Challenges and How to Overcome Them 4 Lambda Cold Starts 5 Lambda Timeouts 6 Interservice Interaction and Dependencies 6 Alerts Without Context 6 Correlated Logs 6
Best Practices and Tips 7 Trace Every API call, Adding as Many Tags as Possible 5 Understand Your Serverless Functions with Contextual Service Maps 7 Leverage Authomation and Use Light Agents 7
Epsagon’s Approach 10
3epsagon.com
Introduction In November 2014, AWS Lambda was launched, extending the cloud’s as-a-service model
to code functions. Functions-as-a-service (FaaS) allows developers to write a function’s
runtime code and pre-define its usage requirements, leaving infrastructure and other
underlying software issues to the service provider. It was not long before all of the
major public cloud providers introduced their own FaaS offerings, which also came to be
known as “serverless” since DevOps teams were now freed from compute (and storage)
resource issues such as provisioning, scaling, and balancing. And here’s the icing on the
cake: You only pay for the time your code is running!
Serverless is one of the cornerstones and drivers of the microservice architecture that
underlies today’s modern distributed applications. The serverless universe now extends
far beyond FaaS to include:
• Cloud-native queuing and messaging services, as well as API gateways
• Services such as Step Functions that overcome the inherent statelessness of functions-as-a-service
• Fully managed databases that are optimized for distributed applications, such as DynamoDB
• Serverless data ETL and analytics tools such as Athena
Along with all of the advantages, however, serverless applications create a whole new
set of monitoring and observability challenges. Traditional monitoring paradigms break
down in the face of highly distributed, modular, event-driven applications that are
running on fully managed cloud infrastructures and platforms.
This ebook aggregates material that we have written over the last few years to create
the ultimate checklist for effectively monitoring the performance and health of serverless
applications. Although the insights and guidelines are applicable to all serverless
platforms, our frame of reference is AWS Lambda and related services since AWS
continues to dominate the serverless market.

4
What You Need to MonitorIn order to understand which AWS Lambda metrics are important to monitor, let’s
just quickly remind ourselves of how they work in the runtime environment. An event
trigger—which can be anything from an image uploaded to S3 or an HTTP request to
an SQS queue—invokes the Lambda function. The function first tells AWS Lambda to
create a function instance, which is basically a container, but AWS has its own proprietary
containerization software to manage AWS Lambda function instances.
Once the instance spins up, the code is deployed into the container. This is when the code
runs, executes, and returns a value. During this period, the function is considered alive
and running, and the idle period is when it has finished executing the code.
AWS Lambda monitors functions and sends the metrics to Amazon CloudWatch, where
you can build graphs, dashboards, and alerts. The key AWS Lambda metrics to track are:
Invocations: The number of times a function code is executed, whether
successfully or resulting in a function error. (Invocations are not recorded if
a request delivers an invocation error.) Anomalous upticks and downticks in
invocations can be indicators of faulty function code or problems with how the
function interfaces with the event source.
Errors: The number of invocations resulting in a function error, such as exceptions
thrown by the code (API timeout, bad type-casting, dividing by zero, etc.) or
by the Lambda runtime. The error rate is calculated as the division of Errors by
Invocations. A high error rate can be an important indicator of poor application
performance and user experience.
Timeouts: CloudWatch does not report this metric, but you can set up an alert
manually based on a hardcoded timeout. This effort is worthwhile since timeouts
can be very detrimental to application performance. If the function duration hits
the pre-configured timeout, the invocation will terminate mid execution.

5epsagon.com
Out of Memory: Rightsizing function memory is important. If you have not
allocated enough memory, execution will be slower. Even worse, if the function
exceeds the memory limits, AWS Lambda will stop the execution and throw an
exception. On the other hand, over-allocation of memory unnecessarily bumps up
costs. You can use the Max Memory Used metric (per function execution) to
fine-tune memory allocations and achieve the right balance between
performance and cost.
Average Duration: CloudWatch tracks the run duration of each Lambda function.
This metric has an impact on a number of key issues including billing, application
performance, and preventing premature function termination due to timeout
limits. Note: CloudWatch does not record the metric when a function times out.
Estimated Monthly Cost: CloudWatch can alert you when your bill is likely to
exceed the targeted monthly budget. You should never run any workload on AWS
without this alarm.
6
Lambda Cold Starts AWS Lambda implements a hot-cold architecture, whereby the frequency of function
invocation impacts its availability. Frequently called functions are “hot,” i.e., the associated
AWS resources required to invoke the function are continuously available. If a function is
idle, however, AWS Lambda may reclaim those resources, which will then have to be spun
up again the next time the function is called. This is what’s called a “cold start.”
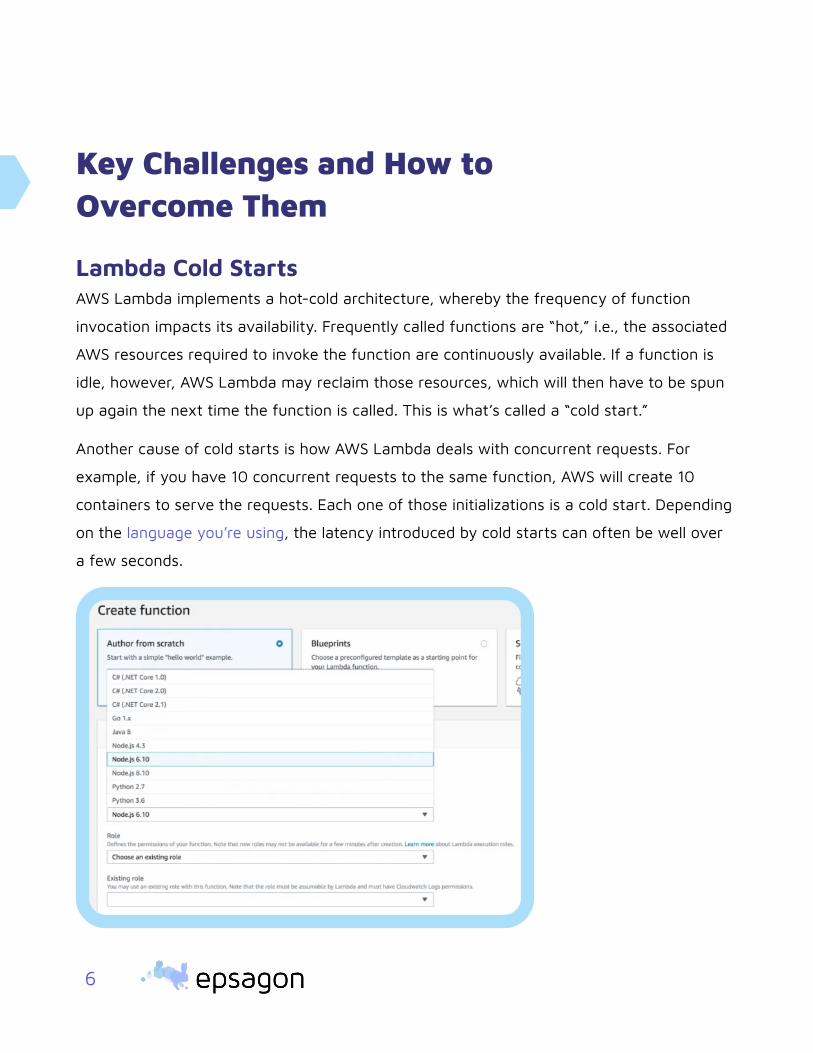
Another cause of cold starts is how AWS Lambda deals with concurrent requests. For
example, if you have 10 concurrent requests to the same function, AWS will create 10
containers to serve the requests. Each one of those initializations is a cold start. Depending
on the language you’re using, the latency introduced by cold starts can often be well over
a few seconds.
Key Challenges and How to Overcome Them

7epsagon.com
There are two main tactics you can use when battling cold starts: minimizing the duration
of the cold start (meaning cutting down the latency of the cold start itself) or minimizing
the number of times cold starts occur. The former is done by using interpreted languages
(Node.js, Python, Go, for example) or by choosing higher memory settings for your
functions. Memory size has a big impact on cold start time—the more CPU resources the
function has, the faster it is able to initialize the language runtime.
Minimizing the number of times cold starts is achieved with a technique called function
warming, i.e., sending ping events to keep the functions alive and at-the-ready to serve
requests. To correctly warm your functions, you should follow a few simple steps:
• Don’t invoke the function more often than once every five minutes.
• Invoke the function directly with Amazon CloudWatch Events.
• Pass in a test payload when running the warming.
• Create a handler logic that doesn’t run all function logic when it is running the warming.

8
A Lambda function can run for 15 minutes (900 seconds) at most. If what you’re doing
cannot be comfortably completed within 15 minutes, you should consider moving that
workload elsewhere. AWS Fargate became generally available in 2018 and is a good
solution for this type of long-running task that doesn’t quite fit with Lambda’s execution
limit, which affects the Lambda timeout.
Lambda Timeouts One of the most important configurations for an AWS Lambda function is the timeout
value. The AWS Lambda timeout dictates how long a function invocation can last before
it’s forcibly terminated by the Lambda service.

9epsagon.com
There are also other limits to consider. For example, Amazon API Gateway has a hard limit
of 30 seconds before an integration timeout. This means that even if your function can
complete execution within the 15-minute limit, API Gateway would have timed out after
30 seconds and returned a 500 Error to the caller.
The rule of thumb in microservices is to use short timeouts on API endpoints, and the
same wisdom applies when building APIs with API Gateway and Lambda. You could wait
for API Gateway to timeout the request after 30 seconds. But a better practice is to
proactively timeout the function after a few seconds in order to not reach the limit.
Note that the timeout value for your functions can also have a subtle impact on how
frequently you experience cold starts (see above). When API Gateway receives an HTTP
request, it will first see if it can reuse an existing container. If all existing containers are
executing already, then a new container would be spawned to handle the request. This
invocation would, therefore, be a cold start and would take longer to complete.

10
Interservice Interaction and Dependencies Sometimes, a function is unable to respond in a timely manner because it is dependent
on a downstream system that has reached its saturation point or is otherwise struggling.
Just as a short Lambda timeout is a good practice, you should use short timeouts on your
integrationpoints as well. Since you have to give up at some point, it is better to fail fast.
Otherwise, your own function might be timed out by AWS Lambda.
We can go a step further and set the timeout for these API calls based on how much time
is left in the invocation. This approach strikes a good balance between giving the requests
the best chance to succeed versus protecting yourselves against slow downstream
responses.
A circuit breaker is a resilience pattern that
is often used in a microservice architecture
to prevent cascade failures. When requests
to a downstream system consistently time
out, it trips the circuit. The application stops
forwarding requests to the downstream
system and gives it time to recover from
its current demise. Note, however, that to
avoid the anti-pattern of sharing the state
of the circuit across multiple callers, do
not share the state of the circuit across
concurrent executions of functions.
Last but not least, a partial or even wrong answer from a downstream system that is
tripping the circuit may be better than no answer at all. This is a UX consideration that you
can incorporate into the application code.

11epsagon.com
Alerts Without Context Alert fatigue is a common problem in the world of application performance monitoring.
It occurs when the teams responsible for keeping applications up and running become
overloaded with more metrics-based alerts than can be handled. If they do not have the
tools or processes in place to differentiate between low-risk and high-risk situations, there
is a danger that alerts will be routinely ignored and real issues overlooked. The bottom
line is that if the team is not responding appropriately to alerts, you might as well not be
monitoring at all.
Alert fatigue when monitoring serverless applications can be mitigated if the alerts include
contextual trace information such as payload and other related data. It is also important
that alerts be as granular as possible, with the ability to define thresholds for any trace,
function, or payload metric. Contextual, granular alerts make it easier for teams to
prioritize alerts and focus their attention on situations that pose a real risk to application
and service performance and health.

12
Correlated Logs The cloud vendor’s console is the first and most direct approach to attempting to solve
issues in your serverless system. Anyone using AWS Lambda is well familiar with the
CloudWatch console. There, you can find log groups for each of your functions, and each
group contains all the logs of the function. The logs refresh asynchronously, and it can
take anywhere from seconds to minutes for the logs to update.
However, when things become a bit more complicated, i.e., in a distributed system with
multiple functions, queues, triggers, and more, it can be quite challenging to understand
the whole picture and connect all the different log items. Imagine a chain of five Lambda
functions withtriggers in between—not to mention, it’s unlikely you’ll remember to log
everything. As the number of functions grows, teams quickly discover challenges in using
the default console to understand their systems—some even refer to it as “log hell.”
AWS X-Ray is a distributed tracing service to help debug and troubleshoot serverless
applications. One drawback of X-Ray is that it requires the developer to insert traces
manually. More significant, however, is that AWS X-Ray does not correlate metrics, logs,
and traces, which can complicate root cause analyses and lengthen MTTR. In addition,
AWS X-Ray only supports AWS services, which is a serious drawback in the multicloud and
third-party, API-heavy environments favored by organizations these days. For these and
other reasons, it can be quite challenging to troubleshoot complex issues with X-Ray.

13epsagon.com
Log aggregation is another possible approach to the challenge of gaining meaningful
insights from diverse logs. Log aggregation is performed by a number of existing open-
source and third-party tools and services, many of which are based on the Elasticsearch,
Logstash, and Kibana (ELK) Stack. These tools provide powerful query and search
mechanisms that enable you to match patterns in the recorded data. However, you still
have to log everything manually, and you still can’t get to the bottom of the asynchronous
nature of the system. It only captures data for individual services, meaning the logged
data lacks the relevant contextual data to show the wider impact of the problem. Where
are all the triggers and events? How are they connected? Also, these log aggregation tools
do not come cheap.
Another disadvantage of the log aggregation approach is that, due to storage
restrictions, the text files themselves may not be preserved for the time prescribed by an
organization’s policies. This means that the logging data required to spot long-term trends
will not be available. Many cloud-based services offer unlimited log storage, enabling you
to catch such long-term trends, but using a cloud-based solution can be expensive over
the long term.
At the end of the day, the only way to effectively and proactively monitor and observe
serverless architectures—which are inherently dynamic, always evolving, and a complex
mesh of external third-party services—is to leverage advanced AI-based data analytics.

14
Best Practices and Tips In this section, we focus on selected best practes and tips
that can boost your serverless monitoring.
Trace Every API call, Adding as Many Tags as Possible Distributed tracing follows the progress of a single request from its origin to its
destination, across multiple systems/domains, and takes into account all participants and
processes. In a serverless environment, such as AWS Lambda, distributed tracing can be
used to capture and forward correlation IDs through different event sources, making it
easier to locate serverless application failures and improve their performance.Because
modern microservice applications are abstracted from the infrastructure, developers
cannot deploy heavy agents that rely on bytecode instrumentation for application
monitoring in general or distributed tracing in particular. Thus, the way to achieve visibility
through distributed tracing is to deploy light agents, relying on protocols such as SNMP,
WMI, or SSH to relay infrastructure data to the central monitoring system.

15epsagon.com
You should automatically monitor the asynchronous communications typical of
microservices and automatically map and trace these distributed requests in real time.
Unfortunately, it’s hard to anticipate the exact timing and sequencing of these requests
as they go across the many components in a transaction. Latency or availability issues
anywhere along the request route can significantly impact application performance and
the end-user experience. Connecting and automatically correlating metrics, alerts, logs,
traces, and payloads in a highly visual architecture view or service map facilitates rapid
issue identification and MTTR.
Dead serverless functions are a real issue—but can be handled rather easily. Best
practices such as giving your functions meaningful names are relevant in serverless as
well. Tools like list-lambdas and others can help keep your architecture clean and steady,
which ultimately leads to better software.
Understand Your Serverless Functions with Contextual Service Maps
Function Name|_?

16
Leverage Automation and Use Light Agents New monitoring and observability solutions must keep pace with the need for very
rapid, iterative, and automated development, testing, staging, and deployment cycles.
They must support real-time decision-making despite having to handle growing volumes
of diverse data. In the modern application, incoming log data from many distributed
components can grow exponentially in volume and complexity and overwhelm developers
with tedious, manual tasks.
In order to deliver operational and business insights, serverless observability solutions
must be able to scale to hundreds of trace views and provide payload visibility, using
developer-oriented, best-practice-based metrics. This requires very high levels of
monitoring and troubleshooting automation, including the ability to auto-discover the
many components that make up the application architecture and the dependencies
between them, as well as auto-instrumenting and auto-deploying, using no-code/low-
code agents that don’t consume a lot of CPU/memory.

17epsagon.com
Epsagon’s ApproachModern applications built with microservices like AWS Lambda and cloud-managed
services require cloud-native monitoring and troubleshooting that is highly automated
and provides a holistic, intuitive view of all the “moving parts” as well as the real-time
interactions among them. This way, developers can see and quickly drill down to the root
cause of an issue and fix it in seconds or minutes—not days or weeks.
Epsagon is the only fully managed provider that integrates and correlates metrics, logs,
traces, and alerts in the same solution. Epsagon is built around monitoring transactions,
where a transaction is literally a list of traces that are connected together. Transaction
IDs give you a complete overview of your function architecture and let you actually see
what’s going on!
One of Epsagon’s most powerful features is the Issues Manager, a visual tool that shows
you a list of all errors, warnings, timeouts, and anything else that could be a risk to the
health of your system. This means you can take a quick glance at all the errors without
having to sift through tons of logs.
Epsagon alerts are easy to define across four main alert types: Lambda Events,
LambdaMetrics, Kubernetes, and Trace. Epsagon supports serverless alerting best
practices such as monitoring aggregated metrics across a group of Lambda functions;
reducing alert fatigue by, for example, taking into account the number of times an error
must occur before an alert is triggered; and highly customizable and granular alert
settings across multiple dimensions such as environment, resource, or customer.
The onboarding for Epsagon is quick and painless. You can even choose auto-
instrumentation to deploy a CloudFormation stack to your AWS account, which will ship
all of your logs to your new Epsagon dashboard. Or you can manually instrument your
functions with agents.

18
Epsagon is an AWS Advanced Technology Partner with DevOps, Data and Analytics, and
Retail competencies and is sold directly in the AWS Marketplace as a subscription-based
SaaSservice. Epsagon is also an AWS Lambda Layers Launch and Public Sector Partner. It
enhances product integration with a multitude of AWS services (Lambda, ECS and Fargate,
DynamoDB, API Gateway, ElastiCache, EKS, RDS, and more), along with other management
services, programming languages, and API-level integrations. Epsagon is the first provider
of automated tracing for AWS AppSync, with no code changes required. The solution also
automatically connects AWS CloudWatch metrics and AWS metadata with other sources.
In short, as a cloud-native platform based on a lightweight agent SDK, Epsagon provides
automated instrumentation and tracing without any gaps in coverage, giving you full
visibility for containers, VMs, serverless, and more—with no training, manual coding,
tagging, or maintenance required. Epsagon enables DevOps teams to easily monitor
modern applications, troubleshoot less, and fix issues faster. Using Epsagon, customers
have reported a 95% reduction in troubleshooting time and a 75% reduction in errors—
accelerating their time to business value.
Start your Epsagon free trial and get valuable insights immediately.

About Epsagon:
Epsagon simplifies modern cloud application development as the pioneering
microservices observability platform, used by Engineering leaders and
Architects to promote team knowledge of architecture, and confidently
scale and iterate services faster.
Our platform offers an intuitive view of container and serverless
environments, from the overall architecture to individual transactions, that
enables teams to rapidly develop, troubleshoot, and monitor microservices
applications.
As a new layer of the Observability tech stack where teams can see the
behavior of their features, identify and communicate dependencies more
effectively, and build intuition around the most cutting edge services
launching today, Epsagon is how teams build faster in the cloud.
epsagon.com [email protected]
® 2021 Epsagon