the u.s.-republic of korea free trade agreement and its ......subsequently balassa distinguishes...
TRANSCRIPT

The U.S.-Republic of Korea Free Trade Agreement
and its Impact on Latin America
Diploma Thesis
Anja Breuer
International Degree Course in Economics University of Applied Sciences Bremen
1. Examiner: Prof. Dr. Hans H. Bass, University of Applied Sciences Bremen
2. Examiner: Raquel Artecona, UN Economic Commission for Latin America and the Caribbean
August 2008

iii
Contents
List of Figures and Tables..............................................................................iv
List of Abbreviations and Acronyms.............................................................vi
1 Preferential Trade Arrangements: Forms, Development and Implications ......................................................................................................1
1.1 Forms of Preferential Trade Arrangements .............................................................2
1.2 The Recent Proliferation of Preferential Trade Arrangements................................5
1.3 The Economic Impact of Free Trade Agreements in Theory..................................8
2 The KorUS FTA and its Impact on Latin American Exports to the U.S. and Korea........................................................................................................17
2.1 History and Basic Facts of the KorUS FTA..........................................................18
2.2 The Impact of the KorUS FTA on the Member Countries....................................20
2.2.1 Current U.S.-Korea Trade and Its Development .............................................21
2.2.2 Estimated Effects on Trade and Welfare for the U.S. and Korea....................25
2.3 The Impact of the KorUS FTA on Latin American Exports .................................31
2.3.1 A Short Literature Review on Trade and Welfare Effects ..............................33
2.3.2 Current Latin American Trade with Korea and the U.S. and its Dynamics ....35
2.3.3 Composition of Latin American Exports.........................................................42
2.3.4 Comparison of Export Structures ....................................................................49
2.3.5 Competitiveness of Latin American Exports...................................................60
2.3.6 Conclusions .....................................................................................................66
3 The Nature of International Trade Relations Under Construction ........71
3.1 Is There a Superior Construction Plan?.................................................................72
3.2 PTAs: Building Blocks or Stumbling Blocks?......................................................78
3.3 Changing the Design? An Assessment of Policy Options.....................................83
References......................................................................................................87

iv
List of Figures and Tables
Figure 1: Main forms of economic integration.................................................................4
Figure 2: Preferential Trade Arrangements Notified to the WTO....................................6
Figure 3: Static Partial Equilibrium Analysis of a Free Trade Area ..............................10
Figure 4: U.S. Commodity Trade with South Korea......................................................21
Figure 5: Shares of Total U.S. Commodity Trade..........................................................22
Figure 6: Shares of Total Korean Commodity Trade.....................................................22
Figure 7: Development of Exports to the Republic of Korea.........................................38
Figure 8: Development of Exports to the United States.................................................41
Figure 9: ESI and WESI Values for the Korean Market................................................51
Figure 10: ESI and WESI Values for the U.S. Market...................................................55
Figure 11: Static Impact and Dynamic Time-Paths of Regionalism..............................79
Table 1: Summary of Modeled Sectoral Output Effects of the KorUS FTA .................28
Table 2: Summary of Modeled Welfare Effects of the KorUS FTA..............................30
Table 3: Basic Information on Selected Latin American Countries...............................33
Table 4: Welfare Effects of the KorUS FTA on Latin America ....................................34
Table 5: Changes in Latin American Exports due to the KorUS FTA...........................34

v
Table 6: Trade with the Republic of Korea in 2006.......................................................36
Table 7: Trade with the United States in 2006 ...............................................................40
Table 8: Import Shares in the Korean Market in 2006...................................................43
Table 9: Import Shares in the U.S. Market in 2006........................................................44
Table 10: Product Penetration in the Korean Market in 2006........................................45
Table 11: Product Penetration in the U.S. Market in 2006.............................................46
Table 12: Top 5 Exports to the Korean Market in 2006.................................................47
Table 13: Top 5 Exports to the U.S. Market in 2006 .....................................................48
Table 14: Decomposition of ESI Values for the Korean Market ...................................52
Table 15: Decomposition of WESI Values for the Korean Market ...............................53
Table 16: Decomposition of ESI Values for the U.S. Market........................................56
Table 17: Decomposition of WESI Values for the U.S. Market ....................................57
Table 18: Highest Latin American RCAs in the Korean Market ...................................62
Table 19: RCAs Shared by the U.S. and Latin American Countries in the Korean Market.............................................................................................................................63
Table 20: Highest Latin American RCAs in the U.S. Market........................................64
Table 21: RCAs Shared by Korea and Latin American Countries in the U.S. Market ..65

vi
List of Abbreviations and Acronyms
APEC Asia-Pacific Economic Cooperation
CGE computable general equilibrium
CU customs union
ESI export similarity index
FDI foreign direct investment
FTA free trade agreement
GATS General Agreement on Trade in Services
GATT General Agreement on Tariffs and Trade
GDP gross domestic product
GTAP Global Trade Analysis Project
KorUS FTA United States - Republic of Korea free trade agreement
LA Latin America
MFN most-favored-nation
NAFTA North American Free Trade Agreement
n.e.s. not elsewhere specified
PTA preferential trade arrangement
RCA revealed comparative advantage
SITC Rev.3 Standard International Trade Classification, Revision 3

vii
UN Comtrade United Nations Commodity Trade Statistics Database
USITC United States International Trade Commission
WESI weighted export similarity index
WTO World Trade Organization


1 Preferential Trade Arrangements: Forms, Development and Implications
The world economy has changed considerably over the last few decades. The world
grew together in many ways experiencing an improvement of transportation networks,
an expansion of information and communication networks, the liberalization of
financial markets and an increase in world trade. The last decade, however, is
particularly marked by a new development:
“The growth of regional trade blocs has been one of the major developments in international relations in recent years. Virtually all countries are members of a bloc, and many belong to more than one. Over a third of world trade takes place within such agreements.” (Schiff and Winters 2003, p. 1)
There is a long list of reasons given by different stakeholders on why countries seek
economic integration. Jovanović (2006, p. 192) mentions e.g. the reduction in the cost
of trade through the elimination of trade barriers, technological advances and downward
pressure on prices through increased competition, the exploitation of economies of scale
in larger markets, improved efficiencies and a strengthened bargaining position with
external partners. This new aspect of the current economic reality also leaves the world
with many questions. What are the characteristics and determinants of the recent
proliferation of preferential trade arrangements1 (PTAs)? How will this new trend
influence the economic landscape? What impact of a preferential trade agreement can
be expected by member countries and by the rest of the world not party to the
agreement? Will there be winners and losers in the race towards trade blocs? How will
1 The term ‘preferential trade arrangements’ is used as an umbrella term for all discriminatory forms of economic integration in the context of this thesis.

2 Preferential Trade Arrangements: Forms, Development and Implications
the expansion of bilateral (or in a few cases plurilateral) trade negotiations as a trade
policy instrument change the way countries negotiate multilaterally?
In the light of the recent developments this paper tries to answer these complex
questions making use of relevant literature and analyzing trade data. In the first chapter
the paper explores the framework surrounding preferential trade arrangements giving an
introduction to basic theoretic concepts and highlighting recent trends concerning PTAs.
The second chapter analyzes the economic impact of a specific preferential trade
agreement. For this purpose the proposed free trade agreement (FTA) between the U.S.
and the Republic of Korea has been chosen, because it would be the United States’
“most commercially significant FTA in over a decade” (USTR 2007) and a FTA is the
form of economic integration most often chosen by countries negotiating bilaterally (see
section 1.2). A special emphasis of the second chapter lies on the impact that the FTA,
upon entering into force, might have on Latin American exports to the FTA member
countries and is performed with the help of case studies of Brazilian, Chilean, Costa
Rican, Mexican and Peruvian exports. The competitiveness of Latin American countries
in the U.S. and in the Korean market is of substantial interest as the U.S. is a traditional
export market for Latin America and the South Korean market could provide Latin
America with a valuable option for a diversification of export markets. Therefore the
impact of the proposed FTA on this region of the world seems especially relevant, but
has, so far, not been analyzed thoroughly in recent studies. Finally, the third chapter
addresses the influence of the recent spread of PTAs on the multilateral trading system
and its future as discussed in the respective literature.
1.1 Forms of Preferential Trade Arrangements
Countries have many options for structuring their trade relations with other nations. They
can pursue a multilateral approach seeking and granting market access via multilateral
negotiations on the rules of trade within the framework of the World Trade Organization
(WTO). One of the guiding principles of the WTO is the most-favored-nation (MFN)
principle according to which in general all countries have to receive equal treatment (WTO
2007, p. 10). Alternatively, countries can pursue strategies that are based on preferential
market access between two partner countries or among a group of several partner countries.
Although the pursuit of strategies giving preferential access to some countries seems to be
an apparent contradiction to the WTO’s MFN principle, there are provisions within the
1 Preferential Trade Arrangements: Forms, Development and Implications 3
General Agreement on Tariffs and Trade (GATT) and the General Agreement on Trade in
Services (GATS) that allow for certain exceptions (WTO 2007, p. 64). GATT article 24 and
GATS article 5 give permission to set up preferential trade arrangements provided that
certain criteria are met (WTO 2008b; WTO 2008d). They specify that “barriers should be
reduced or removed on substantially all sectors of trade in the group” and that barriers for
the outside world should not be raised. Under the so-called Enabling Clause (WTO 2008c)
there are also exceptions provided for developing countries that wish to reduce or eliminate
trade barriers among themselves. Since these possibilities for exceptions to the MFN
principle have become widely used over the last decades in the following an overview of
different forms of economic integration is given and the extent of commitments that these
forms of preferential trade arrangements entail is explained.
According to Balassa (1961, p. 4) economic integration can be defined “as a process and
as a state of affairs”. With regard to the definition as a process, the analysis of economic
integration is concerned with the “measures leading to the suppression of
discrimination” between different national states. Understood as a state of affairs,
economic integration results in “forms of economic integration” that “can be
characterized by the absence of discrimination in various areas” (Balassa 1961, p. 5).
Subsequently Balassa distinguishes five forms of economic integration each
characterized by varying degrees of integration.
The first of the five forms of economic integration mentioned by Balassa (1961, pp. 5-
6) is the free trade area, which is characterized by the abolition of tariffs and
quantitative restrictions in trade between the participating countries. The second form
introduced is the customs union, which in addition to the provisions of a free trade area
also requires the establishment of a common external tariff towards non-member
countries. The next higher form of integration is represented by a common market,
characterized by the elimination of not only trade restrictions but also restrictions
concerning factor movements. An economic union as the fourth form of economic
integration according to Balassa goes even further in its requirements and calls for the
“harmonization of economic, monetary, fiscal, social, and countercyclical policies.” The
highest form of integration is total economic integration. It is achieved by the
unification of all policies and the setting up of a supranational authority whose decisions
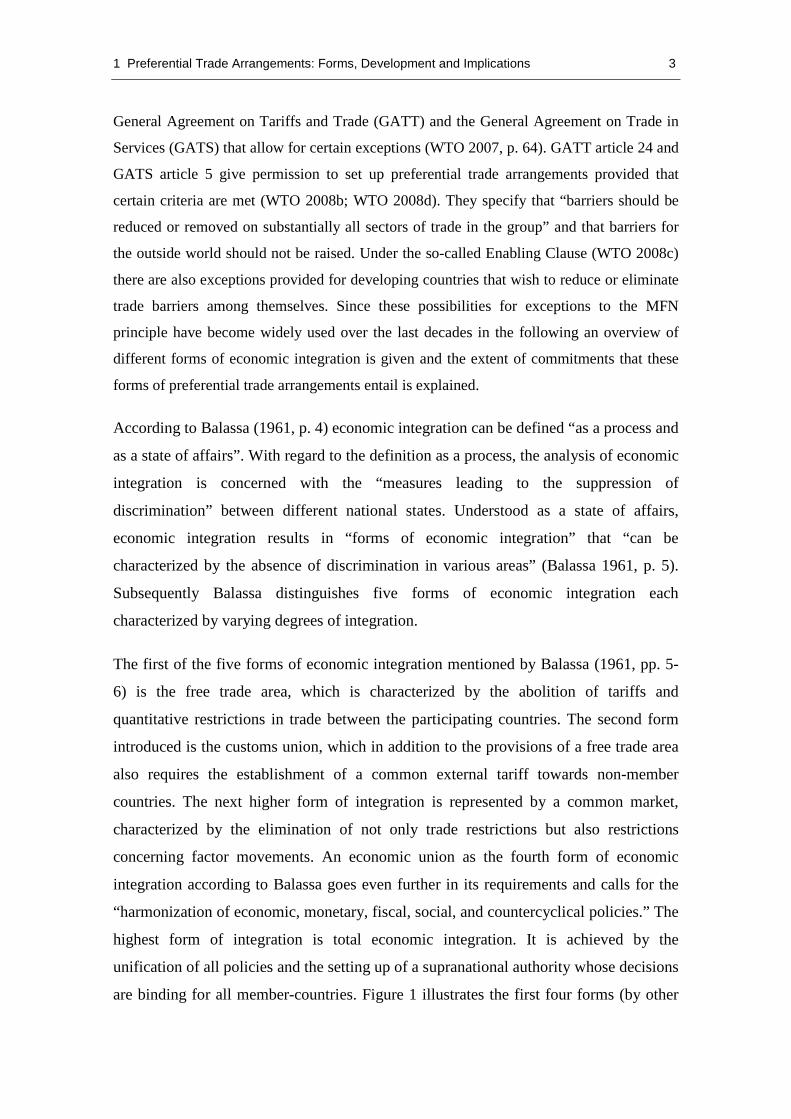
are binding for all member-countries. Figure 1 illustrates the first four forms (by other

4 Preferential Trade Arrangements: Forms, Development and Implications
authors also called ´types´, ´tiers´ or ´stages´) of economic integration of Balassa’s
concept matching each form with the corresponding areas that are characterized by the
absence of discrimination.
Figure 1: Main Forms of Economic Integration; Source: based on Blank et al. 1998, p. 35.
When comparing economic integration initiatives in real life with Balassa’s theoretic
categorization, it is noticeable that the distinctions between the different forms of
integration are not always as clear cut as Balassa’s concept might suggest. Nevertheless,
Balassa’s categorization is generally accepted and adopted by the relevant literature.
Some authors, however, do not include the last form (total economic integration)
because it is not viewed as a form of strictly economic integration but rather as political
integration (compare e.g. Blank et al. 1998, p. 34; Das 2004, p. 15). Others include this
stage of integration and express their differing view by adjusting the form’s name. It is,
e.g., termed ´complete political integration´ by El-Agraa (1989, p. 2) and ´political
union´ by Kaiser (2003, p. 28).
Furthermore, some authors add additional stages to the scheme that are embedded at a
degree of integration inferior to that of a free trade area. Jovanović (2006, p. 22), Das
(2004, p. 15) and Kaiser (2003, p. 27) e.g. include preferential trade (or tariff)
agreements, which eliminate tariffs on a specified number of commodities only or lower
tariffs among member countries relative to third parties without eliminating tariffs
completely. Jovanović also mentions the form of partial customs unions, which retain
their initial tariffs for trade among the member countries, but establish a common
external tariff on trade with the rest of the world.
In his contribution Das (2004, p. 15) distinguishes between shallow and deep stages of
integration grouping preferential trade (tariff) agreements, free trade areas and customs
unions as forms of shallow integration and common markets and economic unions as
Characteristics
Form
Free Trade Area
Customs Union
Common Market
Economic Union
harmonization/unification
of economic policy
free tradebetween members
common external tariff
full mobility offactors of production

1 Preferential Trade Arrangements: Forms, Development and Implications 5
forms of deep integration. Regardless of where you chose to draw the line between
shallow and deep integration, however, it is important to observe that economic
integration is not necessarily a gradual process in which countries continuously advance
from one stage of integration to the next higher form (Jovanović 2006, pp. 22-23).
According to their wishes and needs countries can negotiate to start at the degree of
integration that best fits their interests, they can remain at the same stage, advance
slowly, skip stages or they can cancel existing integration agreements. Furthermore, in
practice many agreements do not enter into force entailing immediate elimination or
reduction of tariffs, but are ´phased in´ lowering tariffs in various steps over a specified
period of time.
1.2 The Recent Proliferation of Preferential Trade Arrangements
Much has been talked and written about the ´new regionalism´ since the 1990s and
“´proliferation´of RTAs [regional trade arrangements] has become a common term, in
the press and relevant literature, to account for the increasing number of RTAs being
recorded in recent years” (Fiorentino et al. 2006, p. 2). But is regionalism (understood
as the spread of preferential trade arrangements) really a new phenomenon? In short:
yes and no.
Regionalism is, in fact, not a new phenomenon in itself. In 1664 e.g. a customs union of
the provinces of France was proposed and in 1834 the German Zollverein was
established as one of the earlier examples of a customs union (compare Schiff and
Winters 2003, p. 4; Jovanović 2006, p. 16; Blank et al. 1998, pp. 43-44). Furthermore,
according to Kaiser (2003, p. 20) multilateralism and regionalism have co-existed since
the multilateral trading system was established in form of the General Agreement on
Tariffs and Trade (GATT) in 1947. As she notes, however, in the past for most
countries multilateral negotiations were the dominant approach for arranging
international economic relations, whereas the massive proliferation of regional
arrangements within the last decade has definitely changed the current weighting of the
two approaches. Looking back at the last century two waves of regionalism can be
identified of which the first appears starting with the establishment of the European
Economic Community in 1957 and the second wave of regionalism dates to the 1990s
(Das 2004, p. 10; Kaiser 2003, p. 30).

6 Preferential Trade Arrangements: Forms, Development and Implications
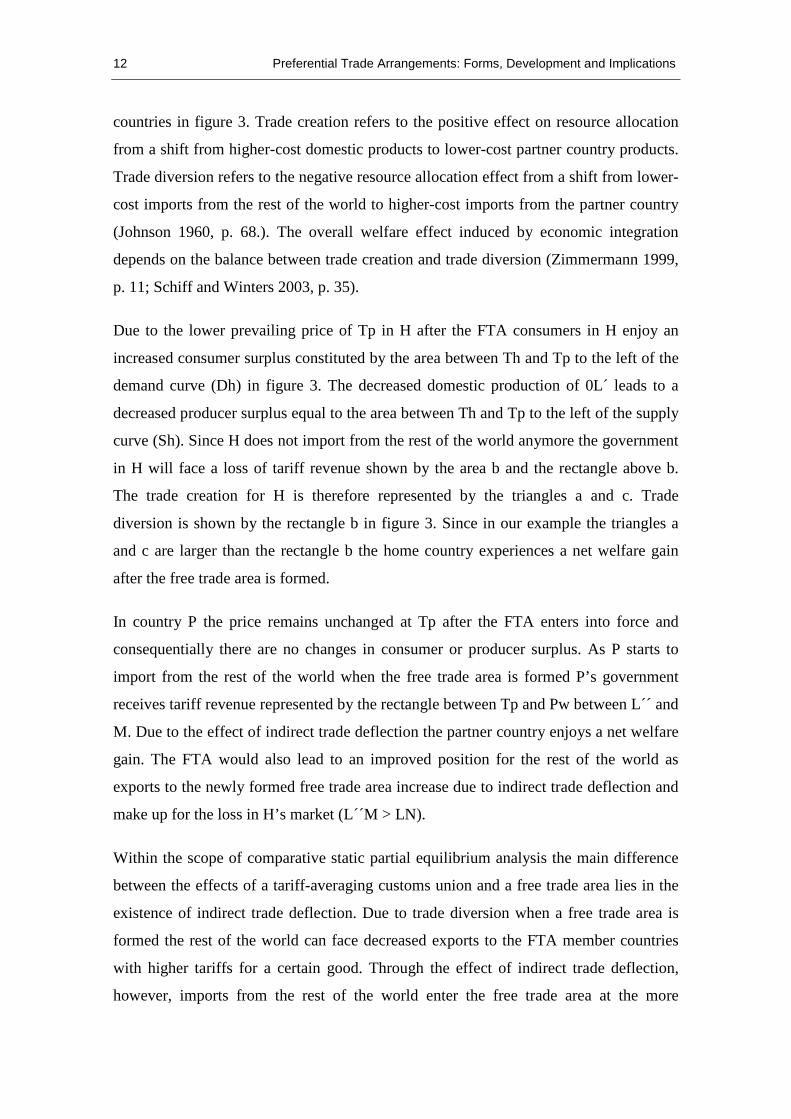
Figure 2: Preferential Trade Arrangements Notified to the WTO according to GATT Art. 24, GATS Art. 5 and Enabling Clause; Source: based on WTO data (WTO 2008a).
As figure 2 shows the number of PTAs notified to the GATT increased slowly over time
and until into the mid-1970s there were still less than 50 notified agreements. Only in
the 1990s the number of notifications increased substantially and by now almost 400
PTAs have been notified to the GATT and the WTO. Therefore, first of all, a significant
quantitative change concerning PTAs can be observed. Nevertheless, it is important to
note, that out of the almost 400 PTAs notified only slightly more than 200 are actually
active. Additionally, it has to be mentioned that the WTO figures overstate the physical
number of agreements as countries have to submit a notification in case of accession to
an existing agreement and, since 1995, have to submit separate notifications for an
agreement containing provisions on trade and services (Fiorentino et al. 2006, p. 2). In
spite of methodological limitations, however, the increasing number of notifications
received by the WTO is still a valuable indicator for the spread of PTAs. In addition, the
percentage of world trade conducted under such agreements gives an impression of the
importance of regionalism in the modern world: According to direct communication
with the WTO’s Economic Research and Statistics Division the share of exports among
partners of PTAs (excluding the overlap of PTAs) in world exports was slightly over
40% in 2005 and 2006.
Preferential Trade Arrangements Notified to the WTO
0
5
10
15
20
25
30
35
1948
1951
1954
1957
1960
1963
1966
1969
1972
1975
1978
1981
1984
1987
1990
1993
1996
1999
2002
2005
2008
0
50
100
150
200
250
300
350
400
450
notif ications(left-hand scale)
notif ied(cumulative)
notif ied and active(cumulative)

1 Preferential Trade Arrangements: Forms, Development and Implications 7
There is not only a quantitative change regarding the spread of PTAs, there is also a
qualitative change. Whereas the old wave of PTAs consisted mostly of agreements
among neighboring countries, the new wave of regionalism is first and foremost
characterized by an ever increasing number of cross-regional alliances with a diverse
range of partners (Das 2004, p. 17). While in 2006 only 12% of the PTAs notified and
in force were cross-regional, among the agreements signed but not yet notified and
those still under negotiation 43% were of a cross-regional nature (Fiorentino et al. 2007,
p. 9). This steep increase in cross-regional alliances in combination with the trend to
rely increasingly on bilateral2, not plurilateral, negotiations is, according to Fiorentino et
al. (2007, p. 8), evidence for the new focus on strategic market access that guides
modern trade policy in most countries. Since most countries are members of various
PTAs simultaneously, in fact, some members are party to more than 20 different PTAs
(WTO 2008), an ever more complex net of preferential trade relationships is created
(see also chapter 3).
Yet another distinguishing characteristic of the recent development of PTAs is the
increase in alliances between developing/emerging-market economies and industrialized
countries (Das 2004, p. 64). As of December 2006 among the PTAs in goods notified to
the WTO 27% are between a partner from a developed and a partner from a developing
country. Among the agreements in services notified to the WTO 44% fall within this
category (Fiorentino et al. 2007, p 11).
The statistics also reveal that there is a strong tendency towards forming a free trade
area (FTA) instead of a customs union (CU). As of December 2006 84% of notified
PTAs in force were intended to be FTAs, 8% CUs and 8% partial scope agreements.
Among the PTAs signed, under negotiation and proposed as of December 2006 the
share of FTAs rises to 92%, whereas the share of partial scope agreements remains
almost unchanged at 7% and the share of customs unions drops to only 1% (Fiorentino
et al. 2007, p. 6). Schiff and Winters (2003, pp. 78-82) believes the current tendency
towards the creation of FTAs is due to the fact that CUs require common external
tariffs, that can be hard to agree on, and after their establishment more ongoing
2 Bilateral in this context means that the negotiations take place between two parties. One or both of the parties can, however, be a trade bloc consisting of more than one country.

8 Preferential Trade Arrangements: Forms, Development and Implications
coordination in all areas of trade policy thereby limiting the members’ sovereignty. He
points out that in order to reap the benefits of absent customs inspections for all goods
at intra-area borders in a CU trade policy has to be harmonized not only with regard to
tariffs but also with regard to non-tariff barriers. Fiorentino et al. (2007, p. 5) attribute
the increasing popularity of FTAs among the forms of economic integration to three
characteristics of this form: Fist, FTAs usually allow for faster negotiations. Second,
they offer more flexibility regarding the scope of the agreement and the choice of
partners. And third, they provide higher selectivity by allowing member countries to
agree to ambitious preferential concession while, at the same time, safeguarding each
member’s sovereignty over its trade policy. He concludes that the FTA is the form of
economic integration that best fits the modern world’s trade policy needs and
objectives.
Although the quantitative and qualitative changes regarding PTAs have been recorded
and continue to be monitored closely, the underlying reasons for the proliferation of
PTAs over the last decade are hard to single out. Kaiser (2003, pp. 31-32) e.g. identifies
several determinants leading to a more intense second wave of PTAs such as a changed
economic environment with better integration of world markets through the successive
liberalizations of trade under the GATT, financial liberalization and better information,
communication and transportation networks. She also points to a greater willingness of
developing countries to open up their economies and the changed attitude of the U.S.
towards bilateral trade agreements as likely causes for the recent proliferation of PTAs.
1.3 The Economic Impact of Free Trade Agreements in Theory
“The decision about entering into a customs union or any other type of integration has always been primarily political, but economic considerations usually play a very important role.” (Jovanović 2006, p. 23)
Not surprisingly, therefore the analysis of the economic impact of CUs, although with
small variations in the focus of analysis, is a frequent subject in introductory books to
economic integration and trade policy (compare e.g. Robson 1998, pp. 18-19;
Zimmermann 1999, p. 10; Jovanović 2006, p. 40; Schiff and Winters 2003, p. 55). A
partial equilibrium analysis of a FTA, however, is much harder to find in the relevant
literature. This might reflect the view that FTAs and CUs are similar forms of
preferential trade arrangements (for definitions see section 1.1) and thus the analysis of

1 Preferential Trade Arrangements: Forms, Development and Implications 9
one form is sufficient to shed light on the effects of both forms of economic integration
(Kreinin and Plummer 2002, p. 5). However, there are also essential differences
between customs unions and free trade areas regarding their operation and economic
impact, which should attract the observer’s attention (Robson 1998, p. 28). Taking into
account the special role of FTAs in the proliferation of PTAs this section will focus
particularly on the economic impact of FTAs. In the following a theoretical analysis of
the economic impact of free trade areas in a comparative static partial equilibrium
setting is presented and rounded off with further explanations.
The main observation and the main concern of the so-called traditional customs union
theory, starting with Viner’s famous contribution (Viner 1950), is summed up by Schiff
and Winters (2003, p. 31) with the following words:
“A trade bloc usually increases trade between its members. An important issue, however, is whether it “creates” trade […] or “diverts” it.”
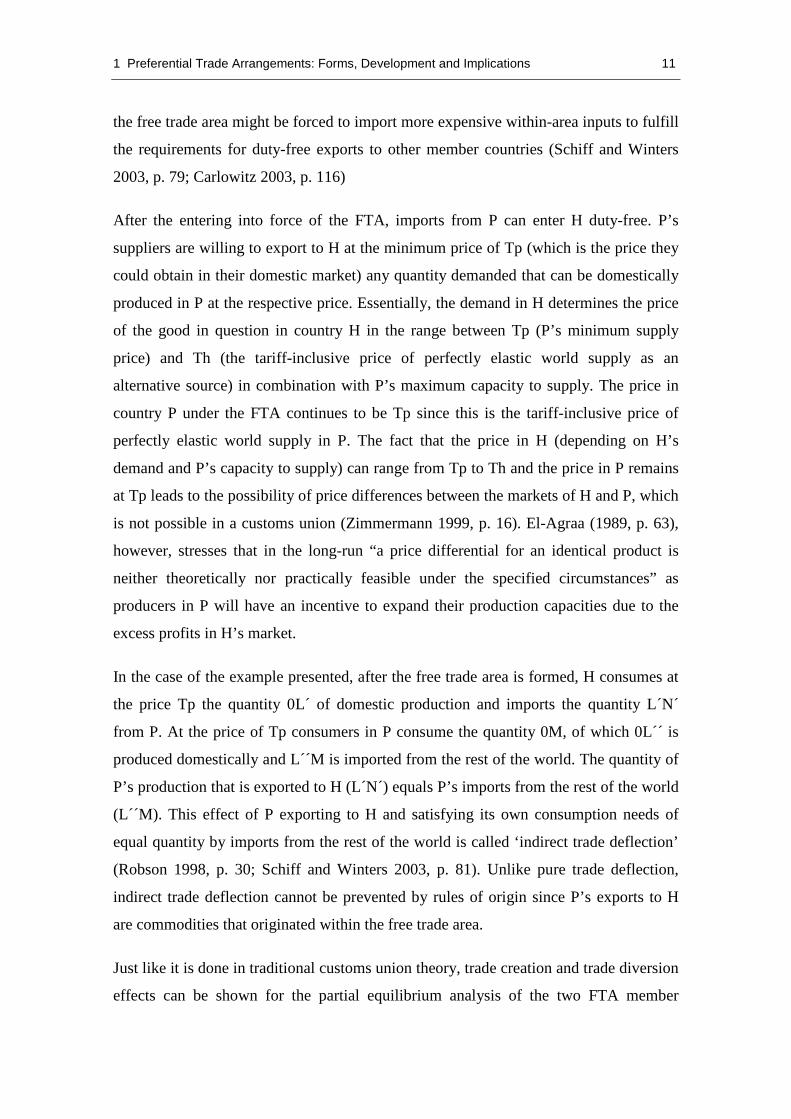
To illustrate the concepts of trade creation and trade diversion and their economic and
welfare impact on a free trade area this section uses an example given by Robson (1998,
pp. 30-35). With the help of the model we can observe how trade in a certain good
between two FTA member countries and the rest of the world is affected by the entering
into force of the FTA. Being a comparative static partial equilibrium model Robson’s
example is subject to the typical but rather restrictive assumptions of homogeneous
goods, perfect competition in goods and factor markets, increasing marginal costs, the
absence of transportation costs and production factors that are mobile on a national level
but immobile across national borders.
Robson’s example (figure 3) shows a country (country H) forming a free trade area with
a partner country (P) and their respective domestic demand (Dh, Dp) and supply curves
(Sh, Sp). Whereas demand conditions are similar in both countries for the good in
question, the partner country is a more efficient producer with a relatively elastic supply
curve (Sp). The world supply price is given by Pw for both countries with world supply
assumed to be perfectly elastic. Before the free trade area is formed the home country
applies a tariff to all imports represented by the difference between Pw (the world
supply price) and Th (the tariff-inclusive price for imports in H). Before the entering
into force of the FTA H’s market is supplied by domestic production up to the quantity

10 Preferential Trade Arrangements: Forms, Development and Implications
L and the quantity LN is imported at the tariff-inclusive price of Th from the rest of the
world. The partner country (P) applies a prohibitive tariff to imports from the rest of the
world meaning that at the tariff-inclusive price of Tp demand in P is satisfied by
domestic production only.
Figure 3: Static Partial Equilibrium Analysis of a Free Trade Area; Source: Robson 1998, p. 31.
When a free trade area is formed between H and P the two countries eliminate all tariffs
on imports from the member countries but continue to apply their respective tariffs to
the imports from the rest of the world. In order to avoid that imports from the rest of the
world enter the free trade area through the country with the lowest tariff and are
subsequently distributed duty-free to the different FTA member countries (which would
be termed ‘trade deflection’) most FTAs establish rules of origin (Robson 1998, p. 28).
Rules of origin that determine which products are sought to have originated within the
free trade area and are therefore eligible for duty-free treatment have been created using
different criteria. Frequently used rules of origin are e.g. that a commodity needs to
have changed tariff classifications between import and export by a FTA member
country, that a specified percentage of the commodity’s sales price must consist of value
added in a member country or that a specified percentage of a commodity’s parts and
components must be purchased from member countries (Krueger 1999, p. 263).
Although rules of origin are essential for protecting the effectiveness of the external
tariffs of the individual member countries (Zimmermann 1999, p. 16), they can also
give rise to “exported” protectionism and distortions in trade flows as producers within
1 Preferential Trade Arrangements: Forms, Development and Implications 11
the free trade area might be forced to import more expensive within-area inputs to fulfill
the requirements for duty-free exports to other member countries (Schiff and Winters
2003, p. 79; Carlowitz 2003, p. 116)
After the entering into force of the FTA, imports from P can enter H duty-free. P’s
suppliers are willing to export to H at the minimum price of Tp (which is the price they
could obtain in their domestic market) any quantity demanded that can be domestically
produced in P at the respective price. Essentially, the demand in H determines the price
of the good in question in country H in the range between Tp (P’s minimum supply
price) and Th (the tariff-inclusive price of perfectly elastic world supply as an
alternative source) in combination with P’s maximum capacity to supply. The price in
country P under the FTA continues to be Tp since this is the tariff-inclusive price of
perfectly elastic world supply in P. The fact that the price in H (depending on H’s
demand and P’s capacity to supply) can range from Tp to Th and the price in P remains
at Tp leads to the possibility of price differences between the markets of H and P, which
is not possible in a customs union (Zimmermann 1999, p. 16). El-Agraa (1989, p. 63),
however, stresses that in the long-run “a price differential for an identical product is
neither theoretically nor practically feasible under the specified circumstances” as
producers in P will have an incentive to expand their production capacities due to the
excess profits in H’s market.
In the case of the example presented, after the free trade area is formed, H consumes at
the price Tp the quantity 0L´ of domestic production and imports the quantity L´N´
from P. At the price of Tp consumers in P consume the quantity 0M, of which 0L´´ is
produced domestically and L´´M is imported from the rest of the world. The quantity of
P’s production that is exported to H (L´N´) equals P’s imports from the rest of the world
(L´´M). This effect of P exporting to H and satisfying its own consumption needs of
equal quantity by imports from the rest of the world is called ‘indirect trade deflection’
(Robson 1998, p. 30; Schiff and Winters 2003, p. 81). Unlike pure trade deflection,
indirect trade deflection cannot be prevented by rules of origin since P’s exports to H
are commodities that originated within the free trade area.
Just like it is done in traditional customs union theory, trade creation and trade diversion
effects can be shown for the partial equilibrium analysis of the two FTA member
12 Preferential Trade Arrangements: Forms, Development and Implications
countries in figure 3. Trade creation refers to the positive effect on resource allocation
from a shift from higher-cost domestic products to lower-cost partner country products.
Trade diversion refers to the negative resource allocation effect from a shift from lower-
cost imports from the rest of the world to higher-cost imports from the partner country
(Johnson 1960, p. 68.). The overall welfare effect induced by economic integration
depends on the balance between trade creation and trade diversion (Zimmermann 1999,
p. 11; Schiff and Winters 2003, p. 35).
Due to the lower prevailing price of Tp in H after the FTA consumers in H enjoy an
increased consumer surplus constituted by the area between Th and Tp to the left of the
demand curve (Dh) in figure 3. The decreased domestic production of 0L´ leads to a
decreased producer surplus equal to the area between Th and Tp to the left of the supply
curve (Sh). Since H does not import from the rest of the world anymore the government
in H will face a loss of tariff revenue shown by the area b and the rectangle above b.
The trade creation for H is therefore represented by the triangles a and c. Trade
diversion is shown by the rectangle b in figure 3. Since in our example the triangles a
and c are larger than the rectangle b the home country experiences a net welfare gain
after the free trade area is formed.
In country P the price remains unchanged at Tp after the FTA enters into force and
consequentially there are no changes in consumer or producer surplus. As P starts to
import from the rest of the world when the free trade area is formed P’s government
receives tariff revenue represented by the rectangle between Tp and Pw between L´´ and
M. Due to the effect of indirect trade deflection the partner country enjoys a net welfare
gain. The FTA would also lead to an improved position for the rest of the world as
exports to the newly formed free trade area increase due to indirect trade deflection and
make up for the loss in H’s market (L´´M > LN).
Within the scope of comparative static partial equilibrium analysis the main difference
between the effects of a tariff-averaging customs union and a free trade area lies in the
existence of indirect trade deflection. Due to trade diversion when a free trade area is
formed the rest of the world can face decreased exports to the FTA member countries
with higher tariffs for a certain good. Through the effect of indirect trade deflection,
however, imports from the rest of the world enter the free trade area at the more

1 Preferential Trade Arrangements: Forms, Development and Implications 13
efficiently producing countries (with assumed lower tariffs) making up for the shortfall
in domestic products in these countries due to their increased intra-FTA exports. Unlike
in the case of a tariff-averaging customs union with a common external tariff in a free
trade area imports from the rest of the world cannot be diverted completely (assuming
that the rest of the world is in fact the least-cost source for imports and that the partner
countries supply is not perfectly elastic). In fact, in the setting of a static partial
equilibrium model the rest of the world can gain from the creation of the free trade area
through the effect of indirect trade deflection (Zimmermann 1999, p. 18).
A glance at the theoretical structure of international trade and the directions of trade
flows, however, reveals that in real life the outcomes of the model cannot be observed
with the accuracy suggested by traditional customs union theory. The static partial
equilibrium model and the effect of indirect trade deflection e.g. suggest that for a given
commodity one of the following two scenarios should hold true:
Scenario A: The quantity produced in P is sufficient to satisfy H’s demand for
imports. Therefore the prevailing price in H’s market is lower than Th and P is
the exclusive source of imports in H.
Scenario B: The quantity produced in P is not sufficient to satisfy H’s demand
for imports. Therefore the prevailing price of the commodity in H is Th and H
imports from the partner country up to its maximum capacity to supply and
imports the remaining quantity from the rest of the world. Consequently, P’s
entire production is sold to H.
In the real world though we can observe that usually countries do not import from one
exclusive source only and that countries do not tend to sell their entire domestic
production abroad either. The reason for the incongruence of the model’s suggestions
with our observations may well lie in the model’s assumptions.
According to Schiff and Winters (2003, p. 31) the static partial equilibrium analysis is
“based on a view of the world in which intercountry trade is driven entirely by
differences in productivity and factor endowments.” Parting with the assumption of
homogeneous goods and assuming product differentiation instead allows for the
existence of intra-industry trade, which makes up a good part of actual international

14 Preferential Trade Arrangements: Forms, Development and Implications
trade. Allowing for product differentiation might lead to monopoly power or imperfect
competition among the producers, which would contradict the assumption of perfect
competition. Whereas the model assumes constant returns to scale there are many
products for which economies of scale can be exploited during the production process.
In fact, reaping economies of scale in production is often seen as one of the main
benefits of the access to an expanded market through economic integration (Kreinin and
Plummer 2002, p. 24; Robson 1998, pp. 37-38). Another point often stressed is that
economic integration increases competition and therefore leads to the elimination of
internal inefficiencies increasing productivity levels (Schiff and Winters 2003, p. 50). In
the world depicted by a static partial equilibrium model, however, this would not be
feasible since it is assumed that all factors of production at all times are used optimally
so that there are no inefficiencies to be eliminated. Furthermore the existence of
transport costs in the real world is not taken into account by static partial equilibrium
models either and might help to explain why there must be limits to the effect of
indirect trade deflection.
Being static in nature the model presented also disregards some dynamic effects that are
key elements within the forces that affect economic activity, such as technological
advances and decisions concerning the location of investment and its rate of growth
(Robson 1998, p. 37). In fact, regional integration might induce changes in investment
behavior and frequently leads to a temporary investment boom in the newly integrated
area (Kreinin and Plummer 2002, p. 28; Schiff and Winters 2003, pp. 220-221).
Investment opportunities in the partner country might be perceived as more attractive
due to strategic decisions to locate new production facilities in the partner country
market and, possibly, due to a more clearly defined investment environment after the
implementation of a PTA. Assuming international mobility of capital and a finite
volume of investable funds investments may be made within the economic integration
area that otherwise would have been more efficiently made outside the integration area.
Although all issues mentioned above have been discussed in more recent literature on
customs union theory no model has emerged that seems as illustrative as the “classic”
way to show the effects of trade creation, trade diversion and indirect trade deflection
with the help of a static partial equilibrium analysis. El-Agraa (1989, p. 27) concludes
that most of the effects not included in the standard static partial equilibrium analysis

1 Preferential Trade Arrangements: Forms, Development and Implications 15
are long term in nature and, with the exception of internal economies of scale, “cannot
be tackled in orthodox economic terms”. (For examples on the effects of internal
economies of scale in customs unions see El-Agraa 1989, pp. 27-28 or Robson 1998,
pp. 41-48.) Taking into account the various limitations of the assumptions of this
approach, special care has to be taken when interpreting the results of the static partial
equilibrium analysis presented in this section (Jovanović 2006, p. 30). As Robson
(1998, p. 18) puts it: taking into account “the character of modern production and trade
[…] the outcome of customs unions (and other trading blocs) may significantly differ
from the ‘predictions’ of orthodox theory.” It therefore remains up to debate if the
entering into force of a FTA might displace exports of the rest of the world to the free
trade area. Depending on the question if demand for the exports of the rest of the world
changes terms of trade changes would have to be considered as well.
In the case that after the economic integration of two countries the displacement of
exports of the rest of the world occurs, it seems relevant to dedicate a few sentences to
the situation of these third parties. According to orthodox theory a displacement of
exports of the rest of the world does not matter as far as the welfare of the rest of the
world is concerned. The resources used to produce the exports can be redirected to the
production of goods that are consumed domestically and since factors are perfectly
mobile within national borders there will be an immediate and costless adjustment to the
new situation. In the real world in contrast we might find that adjustment processes do
not run quite as smoothly as workers trained for export industries might have to change
workplaces and fixed capital has to be transferred to different industries. Furthermore,
there might be a welfare loss for the rest of the world incurred if the factors used for one
unit of exports create larger welfare as exports than the same factors redirected to
alternative uses. According to Schiff and Winters (2003, p. 214) this might be the case
if exporting generates supernormal profits because of imperfectly competitive export
markets, if the decrease in exports leads to a loss of economies of scale in production or
if exports have positive externalities.
Since no general statement about the economic impact of a free trade agreement can be
derived theoretically the effects on trade patterns and welfare have to be studied on a
case-by-case basis. Using the example of the proposed FTA between the U.S. and the

16 Preferential Trade Arrangements: Forms, Development and Implications
Republic of Korea an analysis of estimated welfare effects and possible changes in trade
flows will be performed in the following chapter.
2 The KorUS FTA and its Impact on Latin American Exports to the U.S. and Korea
The proposed FTA between the U.S. and the Republic of Korea is an interesting
example for the analysis of economic integration for various reasons. First of all, the
economic size and importance of the FTA members draws attention. A FTA between
the world’s largest economy and the world’s 13th largest economy (ranked by GDP in
2006 according to the World Bank’s World Development Indicators database) leads to
the expectation of a sizeable impact of the KorUS FTA on worldwide trade relations. In
fact, the KorUS FTA “would be the largest bilateral accord America has struck since
NAFTA was passed in 1993, as well as the first with a large Asian economy”
(Economist 2007).
Secondly, being a bilateral and cross-regional FTA the agreement between the U.S. and
Korea demonstrates the main characteristics of the form of economic integration most
commonly chosen by trade partners in the recent wave of proliferation of PTAs. In
addition, the U.S. and the Korean market play both interesting as well as differing roles
as a destination for Latin American exports. Whereas the U.S. market is a rather
established destination for Latin American countries’ exports and in many cases is of
vital importance, the Korean market could offer an interesting opportunity for
diversifying export partners and for taking advantage of the Asian economic
development.
In the following this chapter provides some background information on the
development and basic provisions of the KorUS FTA. Subsequently, the expected
effects of the agreement on the member countries are presented starting with an
overview of the state of current U.S.-Korea trade relations and moving on to the
summary of the results of different economic impact studies. As chapter 1 has

18 The KorUS FTA and its Impact on Latin American Exports to the U.S. and Korea
demonstrated FTAs can also have a profound impact on third countries not party to the
FTA since the FTA partners’ preferential market access can lead to increased
competition and altered trade flows. Therefore the chapter closes with an analysis of
current Brazilian, Chilean, Costa Rican, Mexican and Peruvian exports to the U.S. and
the Korean market in order to subsequently draw conclusions on the magnitude and
areas of impact of the entering into force of the KorUS FTA.
2.1 History and Basic Facts of the KorUS FTA
Based on the extensive trade relation between the U.S. and Korea some business groups
as well as single politicians and the academia had been discussing a possible FTA
between the two countries for several years and in late 2004 trade officials started
exploratory trade talks (Schott 2006). Only in February 2006, however, the U.S. and the
Republic of Korea announced that they intended to launch the official negotiation of a
FTA, which was to start in May 2006 (USTR 2006). From there negotiations proceeded
at an accelerated pace and after only ten months and eight rounds of negotiations the
successful conclusion of a FTA was reached on 1 April 2007 (USTR 2007). Due to the
speedy negotiations and the immediate notification of the U.S. Congress the KorUS
FTA became the last U.S. trade agreement still eligible for the so-called “fast-track”
procedures (Schott 2008, p. 83). In order to be eligible for “fast-track” procedures the
U.S. president has to notify Congress 90 days in advance about any trade agreement he
plans to sign and President Bush’s trade promotion authority was to expire the end of
June 2007. The “fast-track” rules require Congress to limit debate and cast a yes or no
vote on a trade agreement without being able to single out any provision of the
agreement (Economist 2007/2007a).
The KorUS FTA was finally signed by the two countries’ representatives on 30 June
2007 (USTR 2007a) and is still awaiting its ratification by the U.S. Congress and the
Korean National Assembly. After the U.S. International Trade Commission had
submitted its required report (USITC 2007) on the FTA the formal legislative process
could have begun in the U.S., but since then things have been moving rather slowly.
Schott (2008, p. 79) sees the ratification of the agreement as “a major challenge for both
governments in 2008.” He points to three main reasons for the slow progress which he
sees in U.S. reservations concerning Korea’s ban of American beef exports, tariff-

2 The KorUS FTA and its Impact on Latin American Exports to the U.S. and Korea 19
structures for automobile exports to Korea and the U.S. presidential primaries (Schott
2008, p. 84).
The campaigning for the U.S. presidential elections makes a passing through Congress
of the KorUS FTA unlikely in the near future as especially the Democratic majority
seems reluctant to support trade agreements (Economist 2007a). Furthermore Korea’s
17th National Assembly has not ratified the KorUS FTA before the elections in April
2008 so that the 18th National Assembly had to start a new debate on the topic, which is
expected to lead to time-consuming disputes (Cheong 2008). However, the Korean
president Lee Myung-bak said that he is “confident that the U.S. Congress will ratify
the Korea-U.S. free trade agreement by the end of this year” after having met President
Bush for consultations in April (Korea.net 2008). Additionally, the Korean government
lifted the ban on imports of U.S. beef (USTR 2008). The recent violent protests in South
Korea, however, cast a shadow on the progress towards the ratification of the KorUS
FTA (Sang-hun 2008, Economist 2008).
If ratified by the two countries’ legislative bodies, the FTA between the U.S. and South
Korea will cover more trade than any other U.S. trade agreement except NAFTA
(Schott et al. 2006, p. 17) and will encompass a wide range of topics. Of the over
10,000 tariff lines of the two countries on commodities currently 38% of U.S. and 13%
of Korean tariff lines are free of duty under MFN treatment. Upon entry into force of
the KorUS FTA an additional 45% of U.S. tariff lines and 67% of Korean tariff lines
will become free of duty immediately for the respective FTA partner country. Over the
five years following the entry into force of the KorUS FTA the total number of duty-
free tariff rates will rise to over 90% for both countries and will eventually reach 99%
for U.S. tariff lines and 98% for Korean tariff lines ten years after the trade agreement’s
implementation (USITC 2007, pp. 1-7 to 1-8). Thereby within the area of industrial and
consumer products almost 95% of bilateral trade will become duty-free within three
years of the KorUS FTA’s entry into force. The U.S. government also estimates that
over 50% of current U.S. agricultural exports will become duty-free immediately while
many of the remaining agricultural products will enjoy two- or five-year tariff phase-
outs (USTR 2007b).

20 The KorUS FTA and its Impact on Latin American Exports to the U.S. and Korea
Furthermore under the KorUS FTA the U.S. and Korea will grant each other market
access to almost all major service sectors and expand the obligations to open
government procurement processes beyond their WTO commitments among each other.
The KorUS FTA will also establish a stronger legal framework and broader protection
for investments among the member countries. Additionally, the FTA includes
provisions promoting greater protection of intellectual property rights and their
enforcement. Through the exchange of comments, the establishment of working groups
and dispute settlement mechanisms the KorUS FTA also seeks to improve transparency
and coordination in the area of regulations and technical barriers to trade.
2.2 The Impact of the KorUS FTA on the Member Countries
Since a possible FTA between the U.S. and the Republic of Korea had been discussed
for several years the effects that can be expected by the member countries upon the
entry into force of such an agreement are well studied. There is a rich set of literature
and economic impact studies on the topic that gives valuable input to the evaluation of
the likely effects of the KorUS FTA on its member countries. Although the impact
studies reviewed part from very different liberalization scenarios and use different
methods, models and database inputs, in the following a short literature summary
presents the most important findings of these contributions.
But before the different studies are presented it is essential to take a look at the status
quo of U.S.-Korea trade relations in order to get an impression of the base that leverage
is to be brought to bear on by the proposed KorUS FTA. Therefore in the following
section the quantity and characteristics of trade between the U.S. and the Republic of
Korea are analyzed. The main focus of analysis is on trade in commodities since trade
data is more readily available and classified in more detail in contrast to trade data in
services. Unless otherwise stated in the following all trade data is obtained from the
United Nations Commodity Trade Statistics Database in the classification of SITC
Rev.3.

2 The KorUS FTA and its Impact on Latin American Exports to the U.S. and Korea 21
2.2.1 Current U.S.-Korea Trade and Its Development
Since the Republic of Korea began its remarkable path of export driven growth in the
1960s it gradually turned into one of the United States’ leading trading partners. U.S.
exports to South Korea were only about US$ 5 billion in 1981, but amounted to over
US$ 32 billion in 2006. The growth in U.S. imports from Korea was even more
impressive: Whereas U.S. imports from Korea were only US$ 5.5 billion in 1981, they
reached US$ 47.5 billion in 2006. For the last twenty years, with the exception of the
years around the Asian financial crisis, the U.S. ran a trade deficit with South Korea.
Figure 4: U.S. Commodity Trade with South Korea; Source: based on UN Comtrade data.
Based on total trade South Korea is the United States’ seventh largest trading partner
(USITC 2007, p. 1-3). Korea’s share of total U.S. commodity trade was, however, only
3% in 2006, compared to a share of 18% for the United States’ neighbor and top trading
partner Canada, 12% for China of 11% for Mexico. Over the last decade Korea’s trade
share has been relatively stable, whereas Japan’s trade share decreased gradually and
China’s trade share has doubled since the year 2000 (see figure 5). In 2006 Korea was
the United States’ seventh largest export market as well as the seventh largest source of
U.S. imports.
U.S. Commodity Trade with South Korea(billions of US$)
0
10
20
30
40
50
60
1981
1982
1983
1984
1985
1986
1987
1988
1989
1990
1991
1992
1993
1994
1995
1996
1997
1998
1999
2000
2001
2002
2003
2004
2005
2006
Exports Imports

22 The KorUS FTA and its Impact on Latin American Exports to the U.S. and Korea
Figure 5: Shares of Total U.S. Commodity Trade; Source: author’s calculations, based on UN Comtrade data.
Considering total commodity trade the U.S. accounts for about 12% of the trade flows
with Korea thereby taking third place in the list of Korea’s leading trade partners after
China with a share of 19% and Japan with a share of about 12%. Whereas the United
States’ share has been decreasing since 1999 from a former level of about 20%, China’s
share of trade with South Korea has tripled since 1995. In 2006 the U.S. was Korea’s
second largest export market (following China) and its third largest source of imports
(following Japan and China).
Figure 6: Shares of Total Korean Commodity Trade; Source: author’s calculations, based on UN Comtrade data.
Shares of Total U.S. Commodity Trade for Selected Countries(Percentage)
0%
5%
10%
15%
20%
25%
1995 1996 1997 1998 1999 2000 2001 2002 2003 2004 2005 2006
Canada China Japan Mexico Korea
Shares of Total Korean Commodity Trade for Selected Countries(Percentage)
0%
5%
10%
15%
20%
25%
1995 1996 1997 1998 1999 2000 2001 2002 2003 2004 2005 2006
China Japan USA

2 The KorUS FTA and its Impact on Latin American Exports to the U.S. and Korea 23
A measure for the intensity of trade flows between two countries (Michaely 2004, p.
125) sets home country imports from a partner country divided by total home country
imports in relation to the partner country’s share of world exports (which also represents
its share of world imports). A value of one therefore indicates that the partner country’s
share of home country imports equals its average share in worldwide trade flows. A
value above unity indicates a preference of the home country for the partner country’s
exports and a value below unity the contrary. The intensity ratio jointly reflects all
factors that contribute to the bilateral trade flow with the exception of the partner
country’s size. Calculating the respective figures for the U.S. and Korea reveals that
Korea (with a value of 1.09) has a slight preference for importing from the U.S.,
whereas something is constraining U.S. imports from Korea for which the intensity ratio
is only 0.79.
A factor that can influence the intensity of trade flows is the compatibility of the
commodity structure of the home and the partner country’s bilateral trade flows. An
index of compatibility of trade flows can measure if the partner country exports to the
world market are exactly the commodities the home country seeks to import. Such an
index (Michaely 2004, pp. 127-129) can be devised as
Smjxk = 1 - ∑׀mij - xik2 / ׀
where Smjxk = index of compatibility of imports of country j (home) with exports of country k (partner), mij = share of good i in total imports of the home country and xik = share of good i in total exports of the partner country.
The index can range between zero and one. A value of one signals that the structures of
the commodity flows match exactly, whereas a value of zero would imply that there is
no similarity at all between the imports of the home country and the exports of the
partner country. The higher the index value, the stronger is also the potential for a
displacement of imports from the rest of the world by imports from the partner country
in the case that the two countries implement a PTA.
According to calculations based on data on a three digit aggregation level and as a
three-year average of import and export shares between 2004 and 2006 the index

24 The KorUS FTA and its Impact on Latin American Exports to the U.S. and Korea
assumes a value of 0.51 for the compatibility of U.S. imports and Korean exports and a
value of 0.55 for the compatibility of Korean imports and U.S. exports. Thus, the index
shows that there is a significant overlap between the two countries’ exports to the world
market and their respective import demands, although they are far less than a perfect
match. In order to take a more detailed look on the trade relation between the U.S. and
South Korea in the following the composition of the bilateral commodity trade flows is
analyzed.
Looked at on a one-digit aggregation level in 2006 U.S. exports to Korea mainly
consisted of machines and transport equipment (52%), chemicals (13%) and
miscellaneous manufactured articles (11%). Broken down on a two-digit aggregation
level U.S. exports mainly fell into the division of electrical machinery, apparatus and
appliances (20%), other transport equipment (11%), special industries machinery (6%),
organic chemicals (5%) and scientific equipment (5%). Korean exports on a one-digit
aggregation level were mostly concentrated in the area of machines and transport
equipment accounting for 67% of Korean exports to the U.S. in 2006. Manufactured
goods classified chiefly by material ranked second with 13% and mineral fuels and
lubricants and miscellaneous manufactured articles competed for third place with 7%
each. Analyzed on a two-digit level Korea exports to the U.S. mainly consisted of road
vehicles (26%), telecommunications and sound equipment (14%), electrical machinery,
apparatus and appliances (11%), petroleum and petroleum products (7%) and office and
automatic data-processing machines (6%).
According to information of the Economic Research Service of the U.S. Department of
Agriculture (USDA 2008) the U.S. has been one of the main sources of Korean
agricultural imports for decades. In 2006 the U.S. exported US$ 2.85 billion in
agricultural goods to Korea, which made Korea the sixth-largest market for agricultural
exports. Major U.S. agricultural export items were corn, meat, hides, soybeans, milling
wheat and cotton. Growth potential is seen especially in the area of consumer-ready
products (e.g. fruits, nuts, vegetables, meat, preparations thereof), which account for
roughly a third of current U.S. agricultural exports to Korea. Due to a relatively small
arable land area Korea’s agricultural production shows a weak export-focus. In 2006
U.S. agricultural imports from South Korea amounted to only US$ 217 million with the
main export items being ramen instant noodles, pears and bean pastes.
2 The KorUS FTA and its Impact on Latin American Exports to the U.S. and Korea 25
U.S. service exports to Korea in 2007 add up to US$ 13.6 billion according to U.S.
international transactions accounts data (BEA 2008). At an average annual growth rate
of about 9% U.S. service exports to Korea almost doubled between 1999 and 2007.
They currently account for 29% of total U.S. exports of goods and services to Korea, up
from 24% in 1999. In 2007 the biggest subgroup of U.S. service exports was the
subgroup of ‘other private services’ comprising about a third of service exports to
Korea. U.S. services imports from Korea amounted to US$ 8.8 billion in 2007. Their
share of total U.S. imports of goods and services from Korea has remained relatively
stable around 15% since 1999. The annual growth rate of U.S. services imports from
Korea between 1999 and 2007 was 6% on average. The biggest services subgroup in
2007 was ‘other transportation’ with a share of 36% of total U.S. services imports from
Korea.
2.2.2 Estimated Effects on Trade and Welfare for the U.S. and Korea
During the years leading up to the conclusion of negotiations between the U.S. and the
Republic of Korea a range of studies has been prepared concerning the possible effects
of a U.S.-Republic of Korea FTA. The studies simulate the results of trade policy
changes under a bilateral trade agreement in areas such as changes in imports and
exports, sectoral output and welfare. Most studies surveyed made use of the widespread
Global Trade Analysis Project (GTAP) model. Only the study by Kiyota and Stern used
the Michigan model. These two models both belong to the class of computable general
equilibrium (CGE) models and have become the two most commonly used CGE models
over the last years (Piermartini and Teh 2005, pp. 10-11).
A CGE model tries to mirror the functional relations and sectoral linkages of an
economy with the help of a large set of equations solved by a computer. It can thus be
used for the ex-ante evaluation of effects on resource allocation, distribution and
economic welfare induced by a trade policy change represented by the change in the
model’s exogenous variables (Willenbockel 1994, pp. 40-44). A large majority of CGE
models adheres to the assumptions of general equilibrium theory implying perfect
competition in goods and factor markets, market clearing, full employment of factors
and products differentiated only by country of origin. Most CGE models are
comparative static in nature and compare the equilibrium before and after the policy
change without taking into account the timeframe and costs required for the adjustment

26 The KorUS FTA and its Impact on Latin American Exports to the U.S. and Korea
or the evolution of macroeconomic variables. CGE models should therefore not be
regarded as forecasts of economic data such as the change in GDP that will actually
occur in the year following the implementation of an FTA. Instead the numbers
produced by CGE simulations should only be used to give an impression of the order of
magnitude that a trade policy change is expected to induce regarding resource
allocation, trade flows and welfare holding all other things equal (Piermartini and Teh
2005, p. 53).
With the exception of the study of the U.S. International Trade Commission (USITC)
dating from September 2007 all studies taken into account in the following had been
prepared before FTA negotiations between the U.S. and Korea have been concluded or
negotiation results were publicly available. Therefore the surveyed studies part from
different liberalization scenarios according to the authors’ interests at the time of
preparation. Whereas in general the studies analyze the effects of tariff removal for
agricultural products and manufactures, some studies exclude certain agricultural
products or additionally include a partial liberalization of trade in services. But the
studies presented do not only differ in terms of the liberalization scenario assumed, they
also use different models, databases and base years, which can affect their results (see
figure 8). The Kiyota and Stern study e.g. uses the Michigan model which, in contrast to
a typical GTAP model, allows for imperfect competition and product differentiation at
the firm level and thus does not exhibit large terms of trade effects common in the
GTAP model (Kiyota and Stern 2007, p. 6). Furthermore some studies have also
included dynamic simulations in which they allow for capital accumulation in form of
foreign direct investment.
In line with general expectations derived from customs union theory all studies
surveyed estimate a significant increase in bilateral trade flows between the U.S. and
Korea due to the preferential market access granted under the FTA. The USITC (2007,
p. 2-9) e.g. estimates that U.S. exports of goods to Korea increase by US$ 9.7 to 10.9
billion (22.6-25.3%) and U.S. imports of goods from Korea by US$ 6.4 to 6.9 billion
(9.9-10.6%) after the implementation of the KorUS FTA. According to Kiyota and
Stern (2007, p. 44) U.S. exports to Korea increase by US$ 9.2 billion and U.S. imports
from Korea by US$ 6.9 billion. Choi and Schott (2004, p. 185) give an estimate of a

2 The KorUS FTA and its Impact on Latin American Exports to the U.S. and Korea 27
46% increase of U.S. exports to Korea and a 26% increase in U.S. imports from Korea
in the medium run following the implementation of an FTA.
Some of the studies reviewed give simulation results on sectoral effects possibly
induced by a FTA between the U.S. and Korea. The USITC (2007, p. 2.12) e.g. expects
the largest percentage growth in U.S. exports to Korea in agricultural goods (dairy,
bovine and other meat products), wearing apparel and beverages and tobacco. The
largest increase in value of U.S. exports to Korea is expected in chemical, rubber and
plastic products, bovine and other meat products and food products. Schott et al. (2006,
p. 3) are of the opinion that the largest increase in U.S. exports to Korea might occur in
services, especially in financial and knowledge-based sectors, whose liberalization is
not analyzed in many CGE models. U.S. imports from Korea are found to increase the
most in percentage terms for dairy products, wearing apparel, leather products, textiles
and vegetable oils and fats by the USITC. In terms of value imports from Korea are
expected to increase the most in textiles, motor vehicles, wearing apparel, machinery
and equipment, and chemical, rubber and plastic products. Much of the estimated
increase in U.S. imports of Korean textiles and apparel (85% and 91% respectively) and
more than half of the increase in passenger vehicles will, however, be a result of trade
diversion from other sources (USITC 2007, p. 2-12). Overall the different studies found
positive sectoral output effects (see table 1) for the U.S. economy mostly for
agricultural goods and processed foods, whereas negative output effects are estimated
especially for textiles and apparel. Choi and Schott (2004, p. 190) also expect a negative
impact on the U.S. steel and electronics sector. Nevertheless, the output and
employment effects of the KorUS FTA for the U.S. are expected to be negligible
considering the overall size of the U.S. economy relative to the Korean economy
(USITC 2007, p. xvii).

28 The KorUS FTA and its Impact on Latin American Exports to the U.S. and Korea
Un
ited
Sta
tes
So
uth
Ko
rea
Un
ited
Sta
tes
Sou
th K
ore
a
McD
anie
l an
d F
ox
(200
1)ag
ricul
ture
text
iles
and
appa
rel
Ch
oi a
nd
Sch
ott
(200
1)
agric
ultu
re,
fore
stry
and
fish
erie
s,
proc
esse
d fo
od
proc
esse
d fo
od,
text
iles
and
appa
rel,
chem
ical
s, r
ubbe
r, p
last
ics
text
iles
and
appa
rel
agric
ultu
re,
fore
stry
and
fish
erie
s,
dura
ble
man
ufac
ture
s
Lee
and
Lee
(200
5)
garm
ents
and
leat
her,
text
iles,
auto
mob
iles
and
part
s,ch
emic
als,
ser
vice
s
othe
r tr
ansp
ort e
quip
men
t,el
ectr
onic
s,m
achi
nery
Sch
ott
et
al. (
2006
)(f
or v
ersi
on o
f FT
A
excl
udin
g ric
e)ot
her
prim
ary
prod
ucts
text
iles,
app
arel
, lea
ther
,m
etal
s an
d ot
her
low
er-t
echn
olog
y m
anuf
actu
ring
very
sm
all r
educ
tions
fo
r m
ost s
ecto
rs
othe
r pr
imar
y pr
oduc
ts,
dura
ble
man
ufac
ture
s,bu
sine
ss s
ervi
ces
Kiy
ota
an
d S
tern
(200
7)
agric
ultu
re, f
ood,
beve
rage
s, to
bacc
o,ch
emic
als,
nonm
etal
lic m
iner
al p
rodu
cts,
mac
hine
ry a
nd e
quip
men
t,ot
her
man
ufac
ture
s,
othe
r pr
ivat
e se
rvic
es
rice,
whe
at, l
ives
tock
, te
xtile
s an
d ap
pare
l, le
athe
r pr
oduc
ts a
nd fo
otw
ear,
tr
ansp
orta
tion
equi
pmen
t
text
iles
and
appa
rel
othe
r gr
ains
,ve
geta
bles
and
frui
ts,
oil s
eeds
, oth
er c
rops
,ot
her
man
ufac
turin
g,se
rvic
es
U.S
. Int
ern
atio
nal
Tra
de
Co
mm
issi
on(2
007)
smal
l cha
nges
in th
e ag
ricul
tura
l sec
tor
(bov
ine
and
othe
r m
eat p
rodu
cts,
ca
ttle,
cer
eal g
rain
s, d
airy
pr
oduc
ts, o
ther
ani
mal
pro
duct
s),
proc
esse
d fo
ods,
bev
erag
es
smal
l cha
nges
for
padd
y an
dpr
oces
sed
rice,
oils
eeds
,w
heat
, pla
nt-b
ased
fibe
rs,
wea
ring
appa
rel,
text
iles,
man
ufac
ture
s,el
ectr
onic
equ
ipm
ent
Su
mm
ary
of M
od
eled
Sec
tora
l Out
pu
t Eff
ects
of
the
Kor
US
FT
A
Tab
le 1
: Sum
mar
y of
Mod
eled
Sec
tora
l Out
put E
ffect
s of t
he K
orU
S F
TA
; Sou
rce:
pre
pare
d by
aut
hor.
Stu
dy
Po
siti
veN
egat
ive
Ch
ang
es in
Sec
tora
l Ou
tput

2 The KorUS FTA and its Impact on Latin American Exports to the U.S. and Korea 29
Positive output effects for the Korean economy are expected especially for textiles and
apparel as well as for leather products and footwear (see table 1). Some studies see
positive output effects also for chemicals, lower-technology manufacturing and
automobiles and parts. Negative output effects are expected for Korean agriculture and
durable manufactures. In general Choi and Schott (2004, p. 189) expect the heavily
subsidized Korean agricultural sector to be “the biggest loser” from a possible FTA
between the U.S. and Korea. Kiyota and Stern’s model foresees a shift of Korean
employment from the more capital-intensive to the relatively labor-intensive
manufacturing sectors. Depending on the pace of the implementation of the FTA the
arising sectoral changes might be large enough to cause adjustment problems for the
Korean labor market (Kiyota and Stern 2007, pp. 43-44).
Forecasts on the welfare effects of the proposed FTA vary depending on model
specifications and data input as well as on the inclusion of FTA induced changes in
capital flows3. However, all studies reviewed forecasted positive welfare gains for both
countries (see table 2). The welfare gains forecasted for the Republic of Korea range
from US$ 1.6 billion to US$ 20.2 billion with fixed capital accounts and from US$ 6.8
billion to US$ 40.9 billion for estimates allowing for foreign direct investment (FDI)
flows. This translates into Korean welfare gains ranging from 0.37% to 2.58% of GDP
and from 1.99% to 5.21% including FDI flows. The welfare gain estimates for the U.S.
vary between US$ 1.8 billion and US$ 25.1 billion for studies with fixed capital
accounts and between US$ 8.9 billion and US$ 22.9 billion allowing for FDI flows. As
the United States is the far larger economy the welfare effects translate into smaller
percentage term gains and range from less than 0.05% to 0.23% of GDP and from
0.10% to 0.13% of GDP including FDI flows.
3 Most CGE models are “timeless” rather than dated simulations and do not allow for foreign direct investment flows due to problems associated with additionally required exogenous macroeconomic variables/forecasts (Willenbockel 1994, p. 21). Models allowing for a varying capital stock generally yield higher welfare estimates.
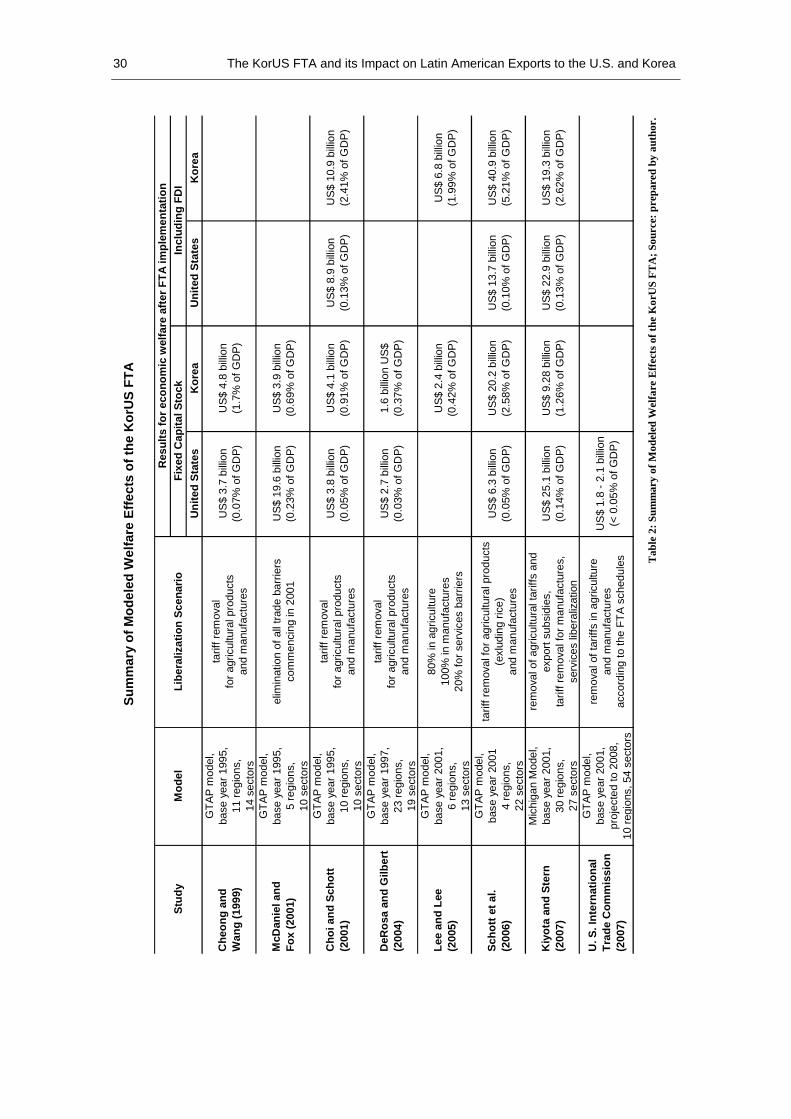
30 The KorUS FTA and its Impact on Latin American Exports to the U.S. and Korea
Un
ited
Sta
tes
Ko
rea
Un
ited
Sta
tes
Ko
rea
Ch
eon
g a
nd
W
ang
(19
99)
GT
AP
mod
el,
base
yea
r 19
95,
11 r
egio
ns,
14 s
ecto
rs
tarif
f rem
oval
fo
r ag
ricul
tura
l pro
duct
s an
d m
anuf
actu
res
US
$ 3.
7 bi
llion
(0.0
7% o
f GD
P)
US
$ 4.
8 bi
llion
(1.7
% o
f GD
P)
McD
anie
l an
d
Fo
x (2
001)
GT
AP
mod
el,
base
yea
r 19
95,
5 re
gion
s,10
sec
tors
elim
inat
ion
of a
ll tr
ade
barr
iers
com
men
cing
in 2
001
US
$ 19
.6 b
illio
n(0
.23%
of G
DP
)U
S$
3.9
billi
on(0
.69%
of G
DP
)
Ch
oi a
nd
Sch
ott
(200
1)
GT
AP
mod
el,
base
yea
r 19
95,
10 r
egio
ns,
10 s
ecto
rs
tarif
f rem
oval
fo
r ag
ricul
tura
l pro
duct
s an
d m
anuf
actu
res
US
$ 3.
8 bi
llion
(0.0
5% o
f GD
P)
US
$ 4.
1 bi
llion
(0.9
1% o
f GD
P)
US
$ 8.
9 bi
llion
(0.1
3% o
f GD
P)
US
$ 10
.9 b
illio
n(2
.41%
of G
DP
)
DeR
osa
an
d G
ilber
t(2
004)
GT
AP
mod
el,
base
yea
r 19
97,
23 r
egio
ns,
19 s
ecto
rs
tarif
f rem
oval
fo
r ag
ricul
tura
l pro
duct
s an
d m
anuf
actu
res
US
$ 2.
7 bi
llion
(0.0
3% o
f GD
P)
1.6
billi
on U
S$
(0.3
7% o
f GD
P)
Lee
an
d L
ee
(200
5)
GT
AP
mod
el,
base
yea
r 20
01,
6 re
gion
s,13
sec
tors
80%
in a
gric
ultu
re10
0% in
man
ufac
ture
s20
% fo
r se
rvic
es b
arrie
rs
US
$ 2.
4 bi
llion
(0.4
2% o
f GD
P)
US
$ 6.
8 bi
llion
(1.9
9% o
f GD
P)
Sch
ott
et
al.
(200
6)
GT
AP
mod
el,
base
yea
r 20
014
regi
ons,
22 s
ecto
rs
tarif
f rem
oval
for
agric
ultu
ral p
rodu
cts
(exl
udin
g ric
e)an
d m
anuf
actu
res
US
$ 6.
3 bi
llion
(0.0
5% o
f GD
P)
US
$ 20
.2 b
illio
n(2
.58%
of G
DP
)U
S$
13.7
bill
ion
(0.1
0% o
f GD
P)
US
$ 40
.9 b
illio
n(5
.21%
of G
DP
)
Kiy
ota
an
d S
tern
(200
7)
Mic
higa
n M
odel
,ba
se y
ear
2001
,30
reg
ions
,27
sec
tors
rem
oval
of a
gric
ultu
ral t
ariff
s an
dex
port
sub
sidi
es,
tarif
f rem
oval
for
man
ufac
ture
s,se
rvic
es li
bera
lizat
ion
US
$ 25
.1 b
illio
n(0
.14%
of G
DP
)U
S$
9.28
bill
ion
(1.2
6% o
f GD
P)
US
$ 22
.9 b
illio
n(0
.13%
of G
DP
)U
S$
19.3
bill
ion
(2.6
2% o
f GD
P)
U. S
. In
tern
atio
nal
T
rad
e C
om
mis
sio
n
(200
7)
GT
AP
mod
el,
base
yea
r 20
01,
proj
ecte
d to
200
8,
10 r
egio
ns, 5
4 se
ctor
s
rem
oval
of t
ariff
s in
agr
icul
ture
and
man
ufac
ture
sac
cord
ing
to th
e F
TA
sch
edul
es
US
$ 1.
8 -
2.1
billi
on(<
0.0
5% o
f GD
P)
Su
mm
ary
of
Mo
del
ed W
elfa
re E
ffec
ts o
f th
e K
orU
S F
TA
Tab
le 2
: Sum
mar
y of
Mod
eled
Wel
fare
Effe
cts
of th
e K
orU
S F
TA
; Sour
ce: p
repa
red
by a
utho
r.
Incl
ud
ing
FD
IR
esu
lts
for
eco
no
mic
wel
fare
aft
er F
TA
imp
lem
enta
tio
nF
ixed
Cap
ital
Sto
ckS
tud
yM
od
elL
iber
aliz
atio
n S
cen
ario

2 The KorUS FTA and its Impact on Latin American Exports to the U.S. and Korea 31
Whereas Choi and Schott (2004, p. 185) estimate the welfare gains in the U.S. to derive
mostly from terms of trade improvements through export expansion into the Korean
market after the implementation of the FTA, Korea’s welfare gains would stem from
allocative efficiency gains through resources shifted between sectors. A publication by
the Korean Ministry of Finance and Economy (2007, pp. 42-44) foresees significant
contributions to Korean productivity growth, especially in the services sector, due to the
increased competition under the KorUS FTA. Furthermore favorable effects of the FTA
for Korean small and medium-sized enterprises are expected by the Korean Ministry as
their main exports (textiles, leather and rubber) will experience large tariff cuts and
sectoral export growth.
Overall it seems that both FTA partners would experience significant welfare gains and
benefit from the implementation of the KorUS FTA. However, compared to the possible
welfare gains under multilateral free trade which according to a simulation by Kiyota
and Stern (2007, p. 51) have been estimated to be 3.4% of GDP for the U.S. and 11.7%
of GDP for South Korea the results of any proposed bilateral FTA seem to be relatively
small.
Hallaert (2008, p.18), however, argues that in general one has to be very critical of
welfare gains estimated by CGE models as long as these models do not take into
account the fast proliferation of PTAs that has been identified recently. Considering the
extent of data needed for a CGE model, data collection and preparation is a challenging
task. Therefore the databases available suffer a considerable time-lag. The fast
proliferation of PTAs leads to a process of establishing preferences and subsequent
preference erosion that affects trade diversion and the reversal of trade diversion and
produces “frequent and large” distortions of CGE model welfare estimates including
estimates of the wrong sign (Hallaert 2008, pp. 10-11).
2.3 The Impact of the KorUS FTA on Latin American Exports
One of the fundamental findings of customs union theory is that for a certain market a
PTA can lead to a change in international trade flows termed trade diversion
characterized by increased imports from the partner country at the expense of imports
from third countries that do not enjoy preferential market access. As these third
countries might lose exports and market share a PTA they are not part of can represent a

32 The KorUS FTA and its Impact on Latin American Exports to the U.S. and Korea
major concern and cost to them. The proposed FTA between the U.S. and the Republic
of Korea might have a significant impact on international trade flows since it has to be
considered big in terms of the economic size of the partner countries, the amount of
bilateral trade flows and the extent of its coverage. The KorUS FTA would lead to
immediate duty-free treatment of approximately 65% of U.S. exports to Korea and of
about 55% of U.S. imports from Korea by value and is expected to increase U.S.
exports to Korea by about 25% and Korean exports to the U.S. by approximately 10%
(USITC 2007, pp. 2-9, 2-16). But what would be the impact on third countries,
especially in Latin America, where many countries have close economic ties with the
U.S. and have been encouraged to diversify their economic ties towards Asian countries
(ECLAC 2007)?
Although there are various economic impact studies on the proposed FTA between the
U.S. and the Republic of Korea, so far little attention has been paid in the literature to
the possible impact of the FTA on Latin America. The studies generally focus on the
analysis of the impact on the two partner countries and Korea’s and the United States’
trading partners in the Asia Pacific that are expected to be most affected, such as Japan,
China and Taiwan.
In view of a lack of detailed information on possible impacts of the KorUS FTA on
trade with Latin America in the following a short literature review is performed and
supplemented by a detailed analysis of the current characteristics of trade and
competitiveness among the U.S., Korea and Latin America. The quantity, dynamics,
composition and structure of Latin American exports to the U.S. and to the Korean
market are the focus of analysis. Thereby the following sections seek to explore the
extent to which the implementation of the KorUS FTA might affect the existing trade
links between Latin America and its trade partners the U.S. and Korea and the
challenges and opportunities that arise.
As Latin America is a large and diverse region the following analysis cannot be
undertaken in detail for all Latin American countries and will therefore focus on a few
selected countries. In order to compile a sample that reflects some of the region’s
diversity Brazil, Chile, Costa Rica, Mexico and Peru have been chosen. The countries
that make up the sample differ in economic size, population, geographic conditions,
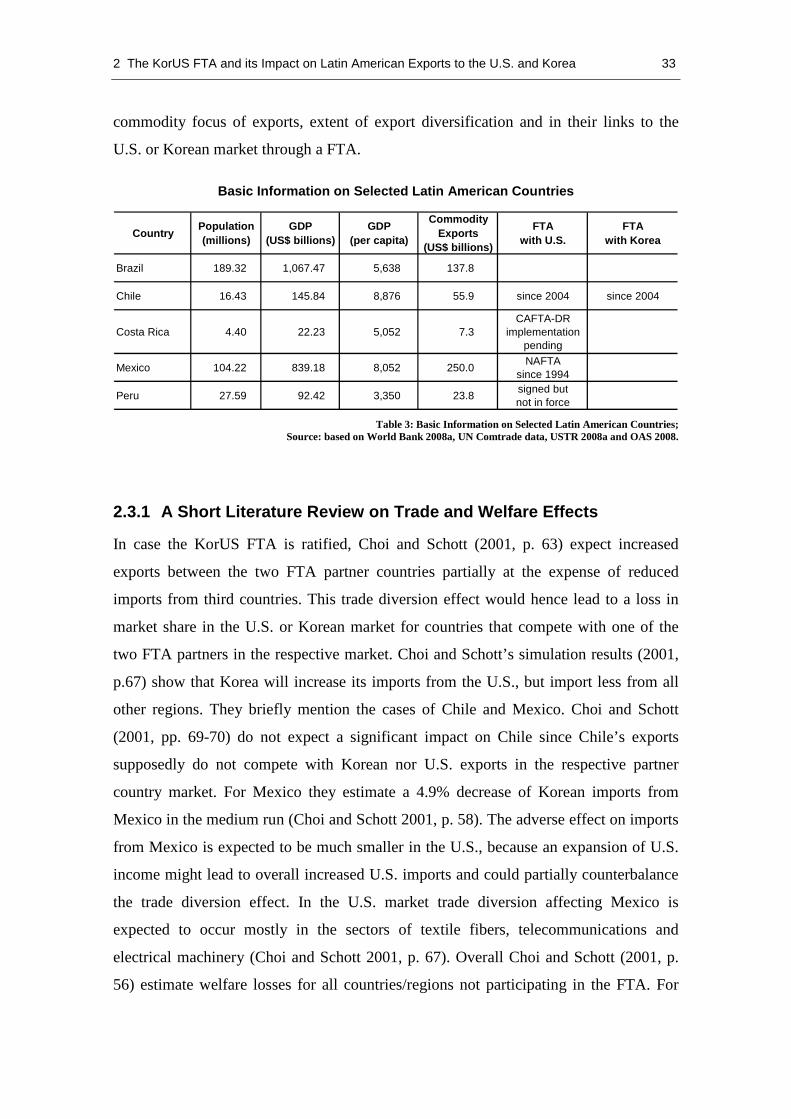
2 The KorUS FTA and its Impact on Latin American Exports to the U.S. and Korea 33
commodity focus of exports, extent of export diversification and in their links to the
U.S. or Korean market through a FTA.
Basic Information on Selected Latin American Countries
Table 3: Basic Information on Selected Latin American Countries; Source: based on World Bank 2008a, UN Comtrade data, USTR 2008a and OAS 2008.
2.3.1 A Short Literature Review on Trade and Welfare Effects
In case the KorUS FTA is ratified, Choi and Schott (2001, p. 63) expect increased
exports between the two FTA partner countries partially at the expense of reduced
imports from third countries. This trade diversion effect would hence lead to a loss in
market share in the U.S. or Korean market for countries that compete with one of the
two FTA partners in the respective market. Choi and Schott’s simulation results (2001,
p.67) show that Korea will increase its imports from the U.S., but import less from all
other regions. They briefly mention the cases of Chile and Mexico. Choi and Schott
(2001, pp. 69-70) do not expect a significant impact on Chile since Chile’s exports
supposedly do not compete with Korean nor U.S. exports in the respective partner
country market. For Mexico they estimate a 4.9% decrease of Korean imports from
Mexico in the medium run (Choi and Schott 2001, p. 58). The adverse effect on imports
from Mexico is expected to be much smaller in the U.S., because an expansion of U.S.
income might lead to overall increased U.S. imports and could partially counterbalance
the trade diversion effect. In the U.S. market trade diversion affecting Mexico is
expected to occur mostly in the sectors of textile fibers, telecommunications and
electrical machinery (Choi and Schott 2001, p. 67). Overall Choi and Schott (2001, p.
56) estimate welfare losses for all countries/regions not participating in the FTA. For
CountryPopulation(millions)
GDP(US$ billions)
GDP(per capita)
CommodityExports
(US$ billions)
FTA with U.S.
FTA with Korea
Brazil 189.32 1,067.47 5,638 137.8
Chile 16.43 145.84 8,876 55.9 since 2004 since 2004
Costa Rica 4.40 22.23 5,052 7.3 CAFTA-DR
implementation pending
Mexico 104.22 839.18 8,052 250.0 NAFTA
since 1994
Peru 27.59 92.42 3,350 23.8 signed butnot in force

34 The KorUS FTA and its Impact on Latin American Exports to the U.S. and Korea
Country/RegionBillionsof US$
% of GDP
Mexico 0.17 0.02
Argentina -0.05 -0.01
Brazil 0.51 0.06
Chile 0.04 0.03
Colombia 0.02 0.02
Peru 0.03 0.01
Uruguay 0.00 0.01
Rest of Central and Latin America
0.12 0.02
Mexico they identify a welfare loss between 0.05% and 0.14% of GDP as a
consequence of a FTA between the U.S. and Korea.
Welfare Effects of the KorUS FTA on Latin America
Table 4: Welfare Effects of the KorUS FTA on Latin America; Source: based on Kiyota and Stern 2007, p. 39.
In contrast to Choi and Schott’s estimates of trade diversion and negative welfare
effects for most countries not part of the FTA, Kiyota and Stern (2007, p. 39) expect
small welfare increases for most countries. In fact, positive, but very small, welfare
effects have been estimated for Mexico, Brazil, Chile, Colombia, Peru, Uruguay and the
rest of the region of Central and Latin America, with the exception of Argentina (see
table 4).
Changes in Latin American Exports due to the KorUS FTA
Table 5: Changes in Latin American Exports due to the KorUS FTA; Source: based on Kiyota and Stern 2007, pp. 44-45.
Kiyota and Stern (2007, pp. 44-45) estimate Latin American exports to the United
States to increase by US$ 45 million and exports to Korea to decrease by US$ 256
U.S. Korea
Mexico -8 -3
Argentina 9 -90
Brazil 41 -156
Chile 6 6
Colombia 1 0
Peru 12 0
Uruguay 0 -1
Rest of Central and Latin America
-16 -12
Total 45 -256
exports toCountry/Region

2 The KorUS FTA and its Impact on Latin American Exports to the U.S. and Korea 35
million. Imports of the region from the U.S. are expected to decline by US$ 256 million
and imports from Korea to increase by US$ 168 million.
Hinting at trade diversion Schott (2007, p. 6) assesses that the FTA between the U.S.
and South Korea, that is expected to increase U.S. agricultural exports to Korea, might
not only generate competition for Korean farmers, but also for farmers in other
countries that export to Korea under existing FTAs, e.g. in Chile. The USITC briefly
mentions Brazil in its analysis of U.S. grain exports and Chile in its analysis of U.S.
noncitrus fruit exports to Korea. The report (USITC 2007, p. 3-3) expects increased
U.S. exports of corn (that currently make up 57% of Korean corn consumption) that will
likely result from increased corn consumption and slightly lower Korean corn
production. Although Brazil’s corn exports are found not to be adversely affected in
terms of quantity exported by the proposed FTA Brazil’s market share might drop if the
U.S. is able to take greater advantage of the market expansion. The USITC (2007, pp. 3-
21 to 3-22) expects U.S. grape exports to increase in volume and to expand their market
share since under the KorUS FTA U.S. grape exports would become more price-
competitive compared to Korean or Chilean grape supplies. The effect on Chilean grape
exports would, however, be of a limited nature as most of U.S. table grape exports occur
during the months when the counterseasonal Chilean grapes are not yet in the market.
2.3.2 Current Latin American Trade with Korea and the U.S. and its
Dynamics
The Korean market is a relatively little explored market for Latin American countries, in
terms of both value of exports in US$ and share of total exports that is destined to this
market. In 2006 exports for the whole Latin American region to Korea amounted to
only US$ 7.2 billion, compared to the United States exporting US$ 32.5 billion, Japan
with US$ 50.3 billion or China’s exports of US$ 44.5 billion. The small Southeast
Asian country Malaysia with a population of only 25 million, for example, exported
US$ 5.8 billion to Korea. The only two Latin American countries that had exports of
over US$ 1 billion to the Korean market in 2006 were Chile and Brazil, whose exports
of US$ 3.4 billion and US$ 2 billion accounted for more than 70% of the region’s total
exports to Korea.

36 The KorUS FTA and its Impact on Latin American Exports to the U.S. and Korea
Trade with the Republic of Korea in 2006 (US$, percentage)
Table 6: Trade with the Republic of Korea in 2006;Source: author’s calculations, based on UN Comtrade data.
Whereas in 2006 the U.S. directed 3.1% of its total exports to Korea, Japan 7.8%,
Malaysia 3.6% and China 4.6%, Latin America directed only 1.1% of its total exports to
the Korean market. The Latin American countries with the highest export shares to the
Korean market are Chile (6.1%), Peru (2.3%) and Guatemala (1.9%). For the other
fourteen Latin American countries for which data is available ten countries direct less
than 1% of their total exports to Korea and four countries export slightly more than 1%.
Latin America does not seem to be an important source for Korean imports in general
since Korean imports from Latin America accounted for only 3.1% of total Korean
imports in 2006, compared to 16.8% for imports from Japan, 15.7% for China and
10.9% for the United States. In 2006 imports from Chile alone, who signed a free trade
agreement with the Republic of Korea in 2003, accounted for more than a third of
Korean imports from Latin America.
Choi and Schott (2004, p. 191) note that a look at import shares for countries in a
certain market can provide a “first-order approximation of countries at risk” to suffer
trade diversion in the respective market. Consequently, the higher the import share of a
country, the more it possibly stands to lose from trade diversion. And the higher the
share of exports to the specific market in total exports, the higher is the country’s
dependence on these exports. Considering the data on current trade relations presented
overall the trade links between Latin America and the Republic of Korea seem to be
relatively weak in comparison to other countries. If due to the implementation of the
exports to Koreapercentage
of total exportsKorean imports
from partnerpercentage
of total Korean imports
United States 32,455,280,553 3.1 33,796,573,866 10.9
Canada 2,879,592,023 0.7 3,091,214,457 1.0
China 44,522,206,859 4.6 48,556,596,186 15.7
Japan 50,270,020,226 7.8 51,926,274,535 16.8
Malaysia 5,808,375,138 3.6 7,242,465,515 2.3
Brazil 1,962,513,782 1.4 2,706,904,327 0.9
Chile 3,405,160,341 6.1 3,812,944,588 1.2
Costa Rica 36,452,935 0.5 58,069,829 0.0
Mexico 457,494,779 0.2 797,651,292 0.3
Peru 548,480,653 2.3 675,897,150 0.2
Rest of LA 860,146,946 0.5 1,504,417,000 0.5
Total of LA 7,270,249,436 1.1 9,555,884,186 3.1

2 The KorUS FTA and its Impact on Latin American Exports to the U.S. and Korea 37
FTA between the U.S. and Korea trade diversion occurs, it seems that currently the
region has not much to lose in the Korean market, except for Chile and Brazil who
direct larger amounts of exports to Korea as well as Peru who directs a relatively large
share of exports to the Korean market. Whereas exports to Korea accounted for only
0.1% of Mexican GDP in 2006, for 0.2% of Brazilian and Costa Rican GDP and for
0.6% of the Peruvian GDP, they accounted for 2.3% of the Chilean GDP. In order to
better understand the extent of possible effects of the KorUS FTA on Latin American
trade flows, however, it is essential to take a look at the growth performance of Latin
American exports to the Korean market. Since the implementation of the KorUS FTA
might harm the chances of Latin American exporters to expand trade with Korea in the
following an analysis of the dynamics of Latin American exports to the Korean market
is presented.
To analyze the export dynamics in Latin America’s trade relations with Korea a period
of 12 years (1994-2006) was chosen in order to gain a longer term perspective and in
order to avoid starting observations at the onset of the Asian financial crisis or shortly
after, when exports might have been especially low. To put Latin American export
growth into perspective data has also been analyzed for a few additional Korean trading
partners.
From a very low level of only US$ 1.7 billion in 1994 Latin American exports to Korea
have been growing considerably over the last twelve years at an annual average of
15.6%. In fact, Latin American exports grew at a faster pace than the exports of the two
big players in the Korean market: U.S. exports grew by 7.2% annually and Japanese
exports by 9.2% annually over the same period. Since these countries started from a
much higher level of exports they were less likely to expand exports with large
percentage increases. Latin American exports to Korea, however, also grew faster than
Malaysian exports (13.5%) that were at a similar level as Latin American exports in
1994. On the other hand Latin American export growth cannot match China’s
impressive annual export expansion of 23.3% over the same period.
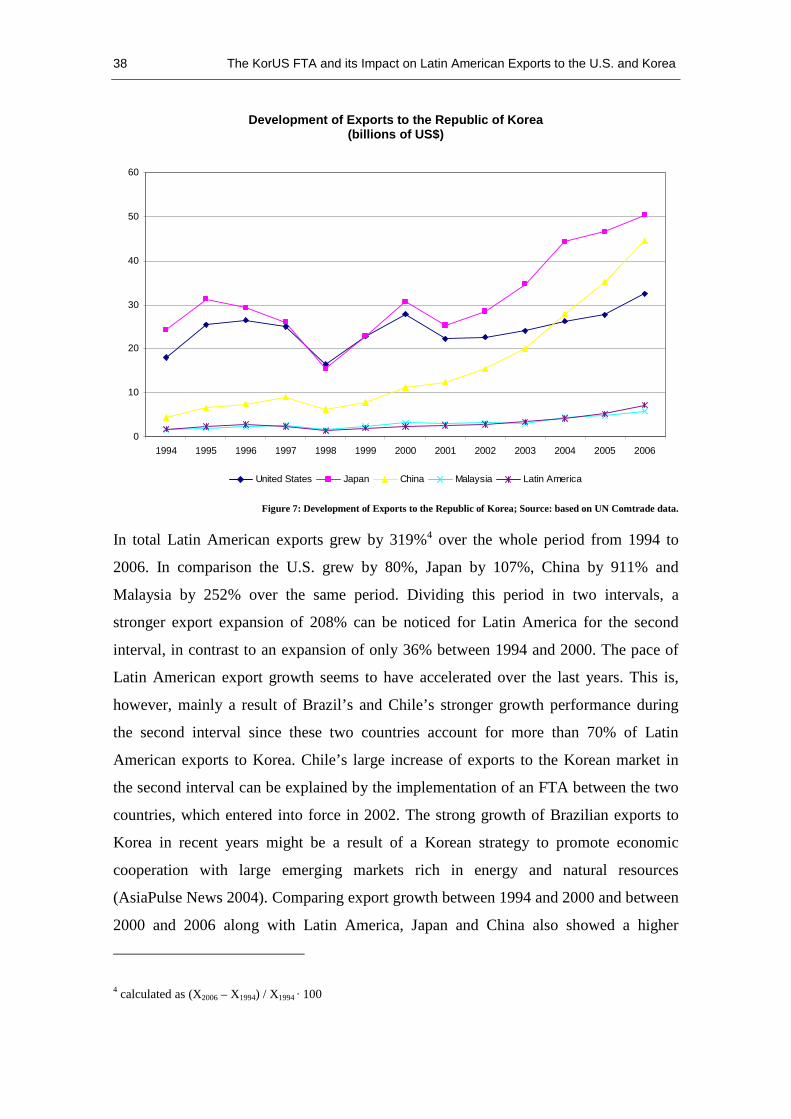
38 The KorUS FTA and its Impact on Latin American Exports to the U.S. and Korea
Development of Exports to the Republic of Korea (billions of US$)
Figure 7: Development of Exports to the Republic of Korea; Source: based on UN Comtrade data.
In total Latin American exports grew by 319%4 over the whole period from 1994 to
2006. In comparison the U.S. grew by 80%, Japan by 107%, China by 911% and
Malaysia by 252% over the same period. Dividing this period in two intervals, a
stronger export expansion of 208% can be noticed for Latin America for the second
interval, in contrast to an expansion of only 36% between 1994 and 2000. The pace of
Latin American export growth seems to have accelerated over the last years. This is,
however, mainly a result of Brazil’s and Chile’s stronger growth performance during
the second interval since these two countries account for more than 70% of Latin
American exports to Korea. Chile’s large increase of exports to the Korean market in
the second interval can be explained by the implementation of an FTA between the two
countries, which entered into force in 2002. The strong growth of Brazilian exports to
Korea in recent years might be a result of a Korean strategy to promote economic
cooperation with large emerging markets rich in energy and natural resources
(AsiaPulse News 2004). Comparing export growth between 1994 and 2000 and between
2000 and 2006 along with Latin America, Japan and China also showed a higher
4 calculated as (X2006 – X1994) / X1994 · 100
0
10
20
30
40
50
60
1994 1995 1996 1997 1998 1999 2000 2001 2002 2003 2004 2005 2006
United States Japan China Malaysia Latin America

2 The KorUS FTA and its Impact on Latin American Exports to the U.S. and Korea 39
relative export growth over the second half of the period analyzed, whereas the U.S. and
Malaysia grew faster during the first half of the entire period.
The two biggest Latin American exporters to Korea, Chile and Brazil, had an average
annual export growth rate of 22.9% and 12.4% respectively between 1994 and 2006.
Peru that exported only US$ 548 million to Korea in 2006, but was the second largest
Latin American exporter in terms of its share of total exports directed to Korea showed
an average annual export growth rate of 33.1% and Mexican exports grew by 46.9% on
average. Since Costa Rica exported very little (seen as a dollar value) to the Korean
market annual export growth rates fluctuated widely.
Although exports to the Korean market by Latin American countries are relatively
small, export expansion has occurred over the last decade and seems to have picked up
pace over the last years. A free trade agreement between the U.S. and South Korea
would give U.S. exports preferential access to the Korean market and would therefore
generally increase the competitiveness of U.S. goods. Therefore there is reason to
believe that the KorUS FTA might harm the chances of Latin American countries to
further expand exports in case similar products are exported to the Korean market.
In contrast to the Korean market, the U.S. market currently is a very important
destination for Latin American exports, especially for Mexico. In total the region
exported US$ 309 billion to the U.S. in 2006, topping Korean exports of US$ 43 billion
and Japanese exports of US$ 147 billion to the U.S. market, but not reaching the level
of Canadian exports of US$ 317 billion. Since almost 70% of Latin American exports to
the U.S. are accounted for by Mexico, which is linked to the U.S. market through
NAFTA, the regions exports not including Mexico, however, were only US$ 97 billion
in 2006.
The regions leading exporters to the U.S. market were Mexico with US$ 212 billion,
Venezuela with US$ 30 billion and Brazil with US$ 25 billion. In 2006 China came
close to catching up with Mexico’s export level exporting US$ 204 billion to the United
States. Out of the other 14 Latin American countries for which data was available four
countries exported between US$ 5 billion and 10 billion in 2006, three exported
between US$ 1 billion and 5 billion and only seven countries exported less than US$ 1
billion.

40 The KorUS FTA and its Impact on Latin American Exports to the U.S. and Korea
Trade with the United States in 2006 (US$, percentage)
Table 7: Trade with the United States in 2006; Source: author’s calculations, based on UN Comtrade data.
The share of total exports that Latin American countries direct to the U.S. is very high.
As a special trade partner under NAFTA Mexico directed 84.9% of its total exports to
the U.S. in 2006, which is in the same range as the other NAFTA partner Canada with a
share of 81.6% of export going to the U.S. market. The rest of the Latin American
countries on average still exported one fourth of total exports to the U.S. in 2006,
compared to 13.3% for Korea, 21% for China and 22.8% for Japan. Including Mexico
almost half (48.5%) of Latin American exports go to the U.S. market. Following
Mexico the highest Latin American export shares directed to the U.S. in 2006 showed
Ecuador with 54% and Venezuela with 49%. Only one country (Paraguay) exported less
than 5% of its exports to the U.S. in 2006 and only two more countries (Argentina and
Bolivia) stayed slightly below the 10% mark.
Latin American exports seen as a share of U.S. imports are relatively high as well. In
2006 Mexico supplied 10.4% of U.S. imports and the rest of Latin America 6.6%,
thereby totaling 17.0% of U.S. imports. Mexico’s share of U.S. imports did not quite
match Canada’s share of 16.0% or China’s 15.9% in 2006, but it does make Mexico a
very significant supplier for the U.S. market. The rest of Latin America held a good
share of U.S. imports in 2006 compared to Korea’s 2.5%, but trailed the 7.9% of U.S.
imports from Japan. Analyzed individually, however, most Latin American countries
did not seem to play an important role for U.S. imports. The second biggest Latin
American supplier, Venezuela, supplied 2.0% of U.S. imports and Brazil 1.5% in 2006.
The other 17 Latin American countries each supplied far less than 1% of U.S. imports.
exports to the U.S.percentage
of total exportsU.S. imports from partner
percentage of total U.S. imports
Korea 43,320,311,038 13.3 47,636,132,257 2.5
Canada 316,664,811,997 81.6 307,723,064,224 16.0
China 203,801,045,737 21.0 305,778,876,099 15.9
Japan 147,197,746,505 22.8 152,244,039,824 7.9
Malaysia 30,186,524,970 18.8 37,521,096,729 2.0
Brazil 24,774,417,482 18.0 28,031,247,072 1.5
Chile 8,947,470,009 16.0 10,291,072,878 0.5
Costa Rica 3,080,218,846 42.5 4,083,806,036 0.2
Mexico 212,131,772,801 84.9 200,499,681,947 10.4
Peru 5,707,486,624 24.0 6,155,107,712 0.3
Rest of LA 54,475,652,438 33.4 77,335,672,325 4.0
Total of LA 309,117,018,200 48.5 326,396,587,970 17.0
LA not including Mexico 96,985,245,399 25.0 125,896,906,023 6.6

2 The KorUS FTA and its Impact on Latin American Exports to the U.S. and Korea 41
Although it does not seem to be an important supplier from the U.S. point of view (with
the exception of Mexico), overall the U.S. seems to be a very important market for
almost all Latin American countries. In 2006 e.g. exports to the U.S. accounted for
about a quarter of Mexican GDP, for 14% of Costa Rica’s GDP, 6% of Chilean and
Peruvian GDP and for 2% of Brazilian GDP. Stronger competition from South Korea in
the U.S. market might therefore have a significant impact on Latin America if similar
commodities are exported.
Development of Exports to the United States (billions of US$)
Figure 8: Development of Exports to the United States; Source: based on UN Comtrade data.
Latin American exports (not including Mexico) also grew strongly by 230% from US$
29.3 billion in 1994 to almost US$ 97 billion in 2006, which is more than twice the
relative increase of 109% in Korean exports to the U.S. over the same period. This
strong growth performance also helped to narrow the gap between Latin American and
Japanese exports which only grew by 24% between 1994 and 2006. Mexico’s exports to
the U.S. showed an even stronger increase of 310% from US$ 51.7 billion in 1994 to
US$ 212.1 billion in 2006, but still cannot match China’s exceptional growth of 849%
over the same period, which helped China to almost catch up with Mexican export
levels.
0
50
100
150
200
250
300
350
1994 1995 1996 1997 1998 1999 2000 2001 2002 2003 2004 2005 2006
Korea Canada China Japan Malaysia Latin America Latin America (-Mexico)

42 The KorUS FTA and its Impact on Latin American Exports to the U.S. and Korea
Average annual export growth rates between 1994 and 2006 for Mexico and the rest of
Latin America which are 12.9% and 11.4% respectively are much higher than Korea’s
average annual export growth rate of 7.3%, Canada’s export growth rate of 7.5% or
Japan’s of 2.1%. Brazil’s average annual export growth rate between 1994 and 2006 is
9%, Costa Rica’s 13.1%, Chile’s 14.8% and Peru achieved an average growth rate of
20.2% with a significant export expansion of over 600% for the total period. China’s
average annual export growth rate of 21% and export expansion of almost 850% over
the whole period, however, remains unmatched by the countries analyzed.
The pace of Latin American export growth to the U.S. seems to have slowed down a
little over the past years. Whereas Mexico’s and the rest of Latin America’s exports to
the U.S. market increased by 184.6% and 84.5% respectively between 1994 and 2000,
Mexican and other Latin American exports increased by only 44.1% and 78.8%
respectively between 2000 and 2006. Mexico’s strong growth performance between
1994 and 2000, which in fact topped China’s export growth figures, was probably due
to Mexico’s accelerated export growth rates shortly after the implementation of NAFTA
in 1994 with export growth rates of 28% in 1995 and 20% in 1996.
The U.S. is not only an important market for Latin American exports, but it is also a
market in expansion. Since most Latin American countries are already linked by some
kind of trade agreement with the U.S. (e.g. NAFTA, CAFTA-DR, Andean Trade
Preference Program, Chile-U.S. FTA, Peru-U.S. TPA) there would be little scope for
gaining an additional competitive edge over Korean exports in the U.S. market through
classic trade policy instruments if Korean exports get preferential access as well under
the KorUS FTA. In case similar goods are exported to the U.S. market by Latin
American countries and South Korea the implementation of the KorUS FTA might bear
a significant challenge for the further expansion of Latin American exports in this
market. In case the overlap in exported goods is small, the true challenge for Latin
American exports might rather lie in having to face stronger competition when
attempting diversification of Latin American exports.
2.3.3 Composition of Latin American Exports
In order to get an impression of the level of competition that Latin American exports
might face in the U.S. or in the Korean market after the implementation of the KorUS

2 The KorUS FTA and its Impact on Latin American Exports to the U.S. and Korea 43
FTA it is important to take a look at the composition of Latin American exports to these
markets. Competition might occur in a broad way across many or all segments of the
economy or it might occur in a concentrated way in special industries. To analyze the
composition of Latin American exports several indicators have been devised and will be
presented in the following.
At first an analysis of import shares of U.S. and Korean imports from Latin America
was performed by country and main industry section in order to illustrate the
quantitative perspective of the composition of Latin American exports. A look at the
figures shows that Latin America held considerable shares of Korean imports in crude
materials (21.35%) and animal/vegetable oils (20.61%) in 2006. The high import share
in crude materials was due to high import shares of Chile (9.07%), Brazil (5.99%), Peru
(3.07%) and Mexico (1.12%) in this industry. Latin America’s high import share in
animal/vegetable oils in the Korean market was due to Argentina’s high import share of
19.08%. Other industries with import shares exceeding Latin America’s share in total
Korean imports were food/animals with 9.35%, beverages/tobacco with 9.16% and
manufactured goods with 6.17%.
Import Shares in the Korean Market in 2006 (percentage)
Table 8: Import Shares in the Korean Market in 2006; Source: author’s calculations, based on UN Comtrade data.
Whereas Latin American exports seemed to be specialized largely towards natural
resource-intensive industries in 2006, the U.S. had its highest shares across a wider
range of industry sections such as in food/animals (21.30%), machinery (18.29%),
miscellaneous manufacturing (16.39%) and chemicals (15.58%). Considering the
country profiles of Brazil, Chile, Mexico and Peru it is noticeable that all countries held
an import market share in crude materials that is substantially higher than the countries’
market shares in total imports. Costa Rica, which accounts for only a very small share
of total Korean imports, in contrast had its highest import market share in machinery in
0 1 2 3 4 5 6 7 8 9 TotalFood/
AnimalsBeverages/
TobaccoCrude
MaterialsMineral Fuels
Animal/Veg. Oils
ChemicalsManufact.
GoodsMachinery
Misc. Manufact.
Not class. elsewhere
USA 21.30 11.78 13.07 1.05 8.25 15.58 5.06 18.29 16.39 0.83 10.92Brazil 3.41 5.04 5.99 0.31 0.95 0.26 1.35 0.20 0.03 0.47 0.87Chile 1.84 2.61 9.07 0.00 0.56 0.82 3.71 0.00 0.00 0.45 1.23Costa Rica 0.01 0.04 0.02 0.00 0.00 0.00 0.00 0.05 0.02 0.00 0.02Mexico 0.35 0.75 1.12 0.00 0.01 0.13 0.36 0.28 0.33 0.02 0.26Peru 0.43 0.00 3.07 0.00 0.00 0.00 0.05 0.00 0.01 0.00 0.22Rest of LA 3.32 0.73 2.09 0.03 19.09 0.04 0.71 0.26 0.05 0.00 0.49Total of LA 9.35 9.16 21.35 0.34 20.61 1.26 6.17 0.79 0.44 0.94 3.09

44 The KorUS FTA and its Impact on Latin American Exports to the U.S. and Korea
2006. Brazil and Chile also held import market shares exceeding 1% in food/animals,
beverages/tobacco and manufactured goods.
Latin American exports to the U.S. market seemed to be specialized in natural resource-
intensive industries in 2006 as well. Latin America’s highest share of U.S. imports was
accounted for by food/animals (35.95%), followed by mineral fuels (26.45%),
beverages/tobacco (22.74%) and crude materials (20.25%). Whereas several Latin
American countries held import shares of over 1% in food/animals, only Mexico, Brazil
and Chile showed significant shares in manufactured goods and machinery in the U.S.
market in 2006. In fact, Mexico accounted for almost half of Latin America’s share in
chemicals, manufactured goods and machinery and also accounted for a good part of
Latin America’s share in beverages/tobacco and most of Latin America’s share in
miscellaneous manufacturing. Whereas Chile, Costa Rica and Peru held their highest
import market share in food/animals in 2006, Brazil had its highest import market share
in crude materials and Mexico in beverages/tobacco.
Import Shares in the U.S. Market in 2006 (percentage)
Table 9: Import Shares in the U.S. Market in 2006; Source: author’s calculations, based on UN Comtrade data.
In order to add a qualitative perspective to the analysis of the composition of exports in
the following a look at the diversification of Latin American exports across different
industry sections will be taken. One indicator to measure the diversification of Latin
American exports to the U.S. and to the Korean market is the degree of product
penetration that exports have achieved. For the calculations the number of varieties of
goods (according to SITC five digit codes) exported to the U.S. or to Korea in 2006 has
been analyzed not taking into account dollar values of exports. Figures are then
expressed as the percentage of actually exported products relative to the 3,115 items
classified within the SITC sections 0 to 8. The main idea behind this approach is to take
a look at the breadth rather than at the volume of exports to a certain market. Figures are
presented broken down into main industry categories (according to SITC one digit) to
0 1 2 3 4 5 6 7 8 9 TotalFood/
AnimalsBeverages/
TobaccoCrude
MaterialsMineral Fuels
Animal/Veg. Oils
ChemicalsManufact.
GoodsMachinery
Misc. Manufact.
Not class.elsewhere
Rep. of Korea 0.44 0.42 1.05 0.83 0.04 1.41 2.65 2.65 4.43 0.98 1.37Brazil 3.38 1.62 6.47 1.15 0.72 1.56 3.26 3.26 0.95 0.65 1.41Chile 4.96 1.10 3.50 0.07 0.10 0.19 2.03 2.03 0.01 0.04 0.80Costa Rica 2.18 0.01 0.36 0.00 0.00 0.08 0.09 0.09 0.12 0.43 0.31Mexico 13.42 15.42 3.87 9.87 1.83 2.62 6.53 6.53 14.50 7.61 12.61Peru 1.29 0.02 0.87 0.25 0.11 0.02 0.72 0.72 0.00 0.35 2.25Rest of LA 10.28 4.15 4.14 14.28 2.86 1.02 1.45 1.45 0.24 3.81 3.08Total of LA 35.95 22.74 20.25 26.45 5.67 6.90 16.73 16.73 20.25 13.87 21.84
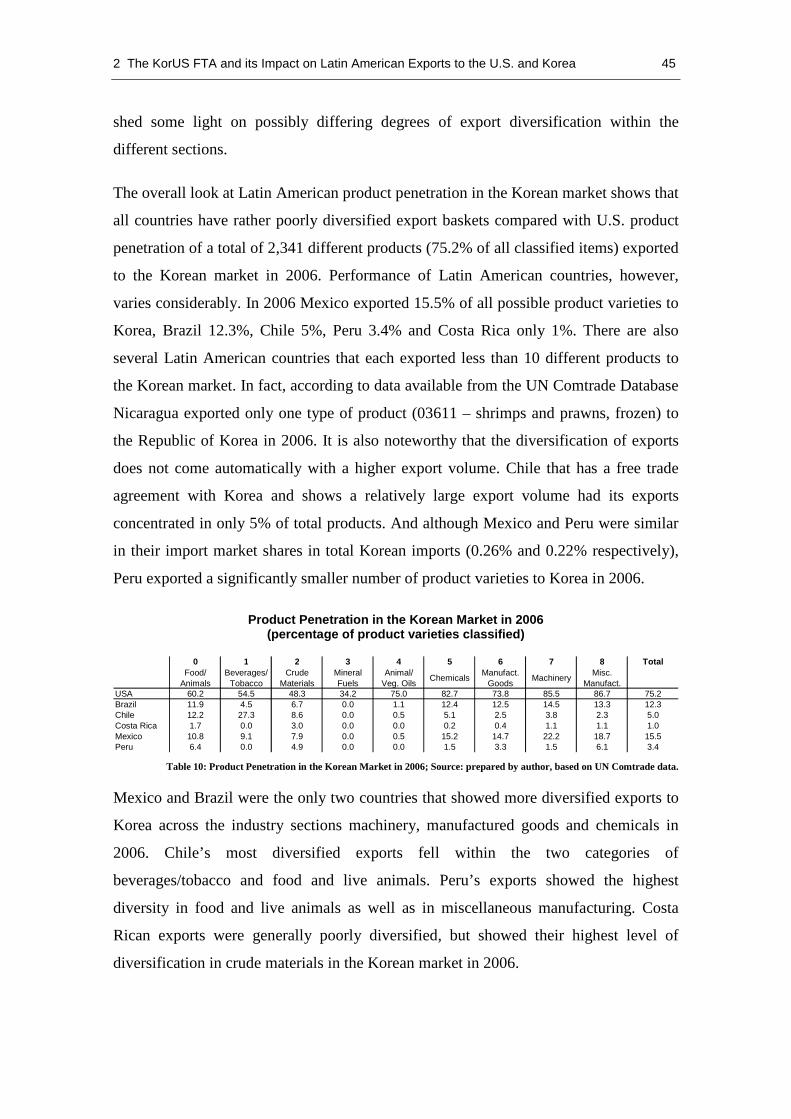
2 The KorUS FTA and its Impact on Latin American Exports to the U.S. and Korea 45
shed some light on possibly differing degrees of export diversification within the
different sections.
The overall look at Latin American product penetration in the Korean market shows that
all countries have rather poorly diversified export baskets compared with U.S. product
penetration of a total of 2,341 different products (75.2% of all classified items) exported
to the Korean market in 2006. Performance of Latin American countries, however,
varies considerably. In 2006 Mexico exported 15.5% of all possible product varieties to
Korea, Brazil 12.3%, Chile 5%, Peru 3.4% and Costa Rica only 1%. There are also
several Latin American countries that each exported less than 10 different products to
the Korean market. In fact, according to data available from the UN Comtrade Database
Nicaragua exported only one type of product (03611 – shrimps and prawns, frozen) to
the Republic of Korea in 2006. It is also noteworthy that the diversification of exports
does not come automatically with a higher export volume. Chile that has a free trade
agreement with Korea and shows a relatively large export volume had its exports
concentrated in only 5% of total products. And although Mexico and Peru were similar
in their import market shares in total Korean imports (0.26% and 0.22% respectively),
Peru exported a significantly smaller number of product varieties to Korea in 2006.
Product Penetration in the Korean Market in 2006 (percentage of product varieties classified)
Table 10: Product Penetration in the Korean Market in 2006; Source: prepared by author, based on UN Comtrade data.
Mexico and Brazil were the only two countries that showed more diversified exports to
Korea across the industry sections machinery, manufactured goods and chemicals in
2006. Chile’s most diversified exports fell within the two categories of
beverages/tobacco and food and live animals. Peru’s exports showed the highest
diversity in food and live animals as well as in miscellaneous manufacturing. Costa
Rican exports were generally poorly diversified, but showed their highest level of
diversification in crude materials in the Korean market in 2006.
0 1 2 3 4 5 6 7 8 TotalFood/
AnimalsBeverages/
TobaccoCrude
MaterialsMineral Fuels
Animal/Veg. Oils
ChemicalsManufact.
GoodsMachinery
Misc. Manufact.
USA 60.2 54.5 48.3 34.2 75.0 82.7 73.8 85.5 86.7 75.2Brazil 11.9 4.5 6.7 0.0 1.1 12.4 12.5 14.5 13.3 12.3Chile 12.2 27.3 8.6 0.0 0.5 5.1 2.5 3.8 2.3 5.0Costa Rica 1.7 0.0 3.0 0.0 0.0 0.2 0.4 1.1 1.1 1.0Mexico 10.8 9.1 7.9 0.0 0.5 15.2 14.7 22.2 18.7 15.5Peru 6.4 0.0 4.9 0.0 0.0 1.5 3.3 1.5 6.1 3.4

46 The KorUS FTA and its Impact on Latin American Exports to the U.S. and Korea
A look at Latin American product penetration in the U.S. market in 2006 reveals that
export baskets were much more diverse than they were in the Korean market. Whereas
very few Latin American countries exported more than 200 different products to the
Korean market, all Latin American countries for which data was available exported
more than 200 product varieties to the U.S. market. Nevertheless, it is evident that the
level of product penetration varies significantly across different Latin American
countries. In fact, with a share of 77.8% of exported product varieties Mexico’s exports
were even more diverse than the Korean export basket in the U.S. market in 2006 and
also showed a higher level of diversification in each of the main industry sections.
Brazil enjoyed a level of total product penetration equal to Korea’s level in the U.S.
market with a share of exported product varieties of 61.3% of total product varieties. In
2006 Chile, Costa Rica and Peru each exported about a third of all possible product
varieties to the U.S.
Product Penetration in the U.S. Market in 2006 (percentage of product varieties classified)
Table 11: Product Penetration in the U.S. Market in 2006; Source: prepared by author, based on UN Comtrade data.
Brazil, Chile, Costa Rica, Mexico and Peru all showed the highest diversification level
of exports in the section of miscellaneous manufacturing. In this area as well as in
machinery and manufactured goods Mexico even achieved an export diversification
level of over 80%. Whereas for the country cases presented the export diversification
level in the Korean market in 2006 hardly exceeded 10%, in the U.S. market Brazil,
Chile, Costa Rica, Mexico and Peru all exceeded this level in almost all industries.
Additionally the share of total exports made up by the top five product groups was
examined for the exports of the selected Latin American countries in order to get an
impression of the level of concentration of exports. It attracts attention that in 2006 most
of the selected Latin American countries’ exports to the Korean market were heavily
concentrated in only a few SITC three digit product groups (see table 12). The two
biggest export product groups of Chile, Costa Rica and Peru alone accounted for
0 1 2 3 4 5 6 7 8 TotalFood/
AnimalsBeverages/
TobaccoCrude
MaterialsMineral Fuels
Animal/Veg. Oils
ChemicalsManufact.
GoodsMachinery
Misc. Manufact.
Rep. of Korea 39.2 18.2 21.3 13.2 13.6 56.1 69.4 74.3 83.5 61.1Brazil 48.3 45.5 30.0 15.8 43.2 57.6 68.8 67.9 77.2 61.3Chile 32.6 27.3 18.0 0.0 11.4 17.7 26.4 40.2 47.9 30.5Costa Rica 31.1 18.2 13.5 2.6 4.5 21.1 29.6 41.9 46.3 31.3Mexico 66.3 40.9 53.2 28.9 54.5 75.9 83.8 86.5 87.8 77.8Peru 39.8 31.8 18.0 5.3 15.9 19.4 41.1 35.6 59.8 36.3

2 The KorUS FTA and its Impact on Latin American Exports to the U.S. and Korea 47
roughly three fourths of total exports in 2006. The share of the top five exports to the
Korean market made up 95% of total Costa Rican exports, around 90% of Chilean and
Peruvian exports and was somewhat lower for Mexico accounting for 65% of total
export and for only 61% for the case of Brazil. Another interesting characteristic of the
five most important export product groups is that they mostly fall within natural
resource-based and –related product groups such as metals, metal ores and edible or
non-edible agricultural products. Only Cost Rica escapes this general trend having the
three most important exports concentrated in the SITC section of machinery.
Top 5 Exports to the Korean Market in 2006
Table 12: Top 5 Exports to the Korean Market in 2006; Source: based on UN Comtrade data.
The picture for the top five export product groups in the U.S. market for 2006 looks
somewhat different (see table 13). The level of concentration of exports for the top five
product groups is lower for all countries in the U.S. market. The highest concentration is
shown by Chile with a share of 73% of total exports made up by the top five export
product groups, followed by Peru with 67%, Costa Rica with 54% and Mexico and
Brazil with only 37% and 26% respectively. Export shares were also more evenly
distributed over the different product groups. Especially Brazil and Mexico showed a
Percentage oftotal exports
SITCcode
Commodity description
Brazil 22.6 281 iron ore14.3 672 primary forms of iron and steel12.3 333 petroleum oils (crude)6.9 222 oil-seeds and oleaginous fruits4.7 044 maize, unmilled
sum 60.8Chile 42.4 682 copper
32.3 283 copper ores8.6 512 alcohols3.4 251 pulp and waste paper2.6 287 ores of base metals
sum 89.3Costa Rica 39.3 776 thermionic/cold cathode valves, diodes, semiconductor devices
34.6 764 telecommunications equipment15.3 759 parts and accessories for office/automatic data-proc. machines3.5 292 crude vegetable materials2.9 288 non-ferrous base metal waste and scrap
sum 95.6Mexico 26.8 682 copper
16.3 287 ores of base metals14.2 288 non-ferrous base metal waste and scrap4.5 881 photographic apparatus and equipment3.6 011 meat of bovine animals
65.4Peru 59.4 287 ores of base metals
23.1 283 copper ores3.8 281 iron ore2.7 682 copper1.8 071 coffee and coffee substitutes
sum 90.8

48 The KorUS FTA and its Impact on Latin American Exports to the U.S. and Korea
more diversified composition of exports. Chile, however, exhibited a noteworthy
concentration of exports in the product group of copper that individually accounted for a
share of 44% of total Chilean exports to the U.S. market in 2006.
Top 5 Exports to the U.S. Market in 2006
Table 13: Top 5 Exports to the U.S. Market in 2006; Source: based on UN Comtrade data.
The composition of the top five export product groups of the selected Latin American
countries in the U.S. market according to the SITC sections they fall in also differs from
the composition noted in the Korean market. Although there were still many natural
resource-based and –related products among the top five exports to the U.S. market in
2006 many important export groups fell into the SITC section of machinery. Four out of
Mexico’s top five exports to the U.S., e.g., fell into this area and two export product
groups for the cases of Brazil and Costa Rica.
The fact that especially in the Korean market Latin American countries exhibited high
levels of concentration on a few export product groups shows a high potential
vulnerability. In case similar products are exported to the respective market by the trade
partner gaining preferential access under the KorUS FTA Latin American exports might
face a significantly increased pressure of competition on their exports. Therefore in the
Percentage oftotal exports
SITCcode
Commodity description
Brazil 7.9 333 petroleum oils (crude)5.1 792 aircraft5.0 671 forms of iron4.7 713 engines3.7 512 alcohols/phenols and their derivatives
sum 26.4Chile 44.4 682 copper
9.1 034 fish (fresh, chilled or frozen)9.1 057 fruit and nuts (fresh or dried)7.0 248 wood (simply worked)3.8 971 gold (non-monetary)
sum 73.4Costa Rica 19.8 057 fruit and nuts (fresh or dried)
17.3 872 instruments/appliances for medical/surgical purposes8.6 759 parts and accessories for office/automatic data-proc. machines4.2 772 electrical apparatus for switching or protecting electrical circuits3.9 071 coffee and coffee substitutes
sum 53.8Mexico 13.2 333 petroleum oils (crude)
7.1 761 television receivers6.5 781 motor vehicles5.3 764 telecommunications equipment5.1 784 parts of motor vehicles
sum 37.2Peru 24.0 971 gold (non-monetary)
18.0 682 copper12.4 334 petroleum oils (other than crude)8.3 845 articles of apparel (of textile fabrics)4.4 681 silver, platinum and other metals of the platinum group
sum 67.1

2 The KorUS FTA and its Impact on Latin American Exports to the U.S. and Korea 49
following section the structure of exports of the competitors is compared with the help
of adequate indicators.
2.3.4 Comparison of Export Structures
Having rather narrowly specialized exports in many cases Latin American countries are
especially vulnerable to increased competition in these industries and might therefore be
adversely affected by the implementation of new free trade agreements between their
trade partners. To investigate to what extent a free trade agreement between the
Republic of Korea and the U.S. might affect exports of Latin American countries it is
useful to have a look at the overlap in export structures of the competitors in the two
markets. Choi (2001, p. 64) notes that “the closer the similarity in export structure, the
greater the possibility of trade diversion.” In the following the export structures of
Brazil, Chile, Costa Rica, Mexico and Peru are compared to the export structure of the
U.S. and Korea with the help of two indicators: the Export Similarity Index (ESI) and
the Weighted Export Similarity Index (WESI).
For the purpose of measuring the overlap in the structure of two countries’ exports to a
certain market Finger and Kreinin have devised the Export Similarity Index. The index
(World Bank 2008) for country j is calculated with the following equation:
ESIj = ∑ [min (Xij, Xik) · 100]
where X ij is the share of industry i of country j’s total exports to a certain market and X ik is the share of industry i of the competitor country k.
Index values can range from 0 to 100 and the higher the index value for a country is, the
bigger is the overlap in its export structure compared to its competitor in the market
analyzed. Since the index is calculated based on industry or product group shares of
total exports it focuses solely on export structure abstracting from the economic size of
a country and its volume of exports to a certain market.
For this analysis the ESI was calculated on a three digit-level to allow for a more
detailed perspective on overlapping product groups. To reduce the effect of possible
fluctuations in export levels the ESI was calculated using the average export share over
three years (2004 to 2006) for every product group and country. Furthermore, Japan was

50 The KorUS FTA and its Impact on Latin American Exports to the U.S. and Korea
included in the analysis as a reference for benchmarking Latin American index values.
Many studies about the economic impact of the KorUS FTA (see e.g. Choi 2004, p.
192) have estimated that Japan would face a high level of trade diversion due to the
implementation of the FTA in both the U.S. and the Korean market. Therefore, it is
assumed that Japan’s index values in the U.S. and the Korean market will be an
adequate reference mark for a degree of export structure overlap that will cause a
significant negative impact on a country’s exports.
Whereas the ESI purely focuses on export structure and is widely used, the second and
more uncommon indicator used for analysis, the Weighted Export Similarity Index
(WESI), takes into account the dollar amount of exports to a certain market by the two
competing countries and a product group’s importance for the overall export basket.
The WESI (Leelawath 2007) is calculated as
WESIj = ∑ [xij (1- ((|Xij-X ik|)/(Xij+Xik))) · 100]
where X ij (X ik) is country j’s (k’s) exports of product group i to a certain market and xij is the share of product group i in country j’s total exports to a certain market.
As the ESI the WESI can range from 0 to 100 with higher WESI values indicating a
possibly stronger impact of increased competition in a certain market for a certain
country. For the analysis WESI values were calculated on a SITC three digit level and
are based on average exports and average export shares between 2004 and 2006.
ESI values generally depend more on the competitor’s export shares (due to the use of
the smaller export share in the equation) and therefore tend to be lower if exports are
highly concentrated for one country and diversified for the competitor country. In
contrast, WESI values tend to be higher for countries with highly concentrated exports
due to the multiplication with country j’s shares in total exports. All else being equal
WESI values tend to be lower for countries of unequal economic size since the dollar
amount of exports tends to be unequal to the competitor’s exports. Since in many cases
Latin American exports to the Korean market are highly concentrated on a few product
groups in this market the concentration effect might offset the effects of unequal
economic size between the U.S. and the Latin American countries. In fact, Latin
American WESI values in many cases were found to be higher than the corresponding

2 The KorUS FTA and its Impact on Latin American Exports to the U.S. and Korea 51
ESI values, whereas Japan’s WESI has a lesser value than its ESI in the Korean as well
as in the U.S. market.
According to ESI calculations for the Korean market (see figure 9) Japan’s export
structure exhibits a much higher degree of similarity to the structure of U.S. exports to
Korea than the structure of Latin American exports does compared to the structure of
U.S. exports in this market. Whereas Japan shows an ESI value of 57.7 in the Korean
market the Latin American country with the highest ESI value in this market was Costa
Rica with an index of 26.9. Mexico with an ESI of 22.9 also scores in the higher Latin
American ESI range while Brazil with an index value of 12.2 takes a position in the
middle. Peru shows the lowest ESI value of the countries analyzed indicating that its
export structure in the Korean market is the least similar to the structure of U.S. exports.
ESI and WESI Values for the Korean Market (index value)
Figure 9: ESI and WESI Values for the Korean Market; Source: author’s calculations, based on UN Comtrade data.
In contrast to its low ESI value, however, Peru shows a very high WESI value of 56.9
index points. This value is even higher than Japan’s (the benchmark country) WESI
value of 50.8 and might be a result of narrowly diversified exports to the Korean
market. Mexico, Brazil and Chile also show significantly higher WESI than ESI values
in the Korean market, whereas Costa Rica exhibits a very low WESI value of only 2.2
index points.
Although (due to differences in the equations used for calculations) ESI and WESI
values differ, both indices seem to indicate that Mexico will face a moderate increase in
57.7
12.2
7.5
26.9
22.9
3.9
50.8
24.7
22.5
2.2
31.5
56.9
0 10 20 30 40 50 60 70
Japan
Brazil
Chile
Costa Rica
Mexico
Peru
ESI WESI
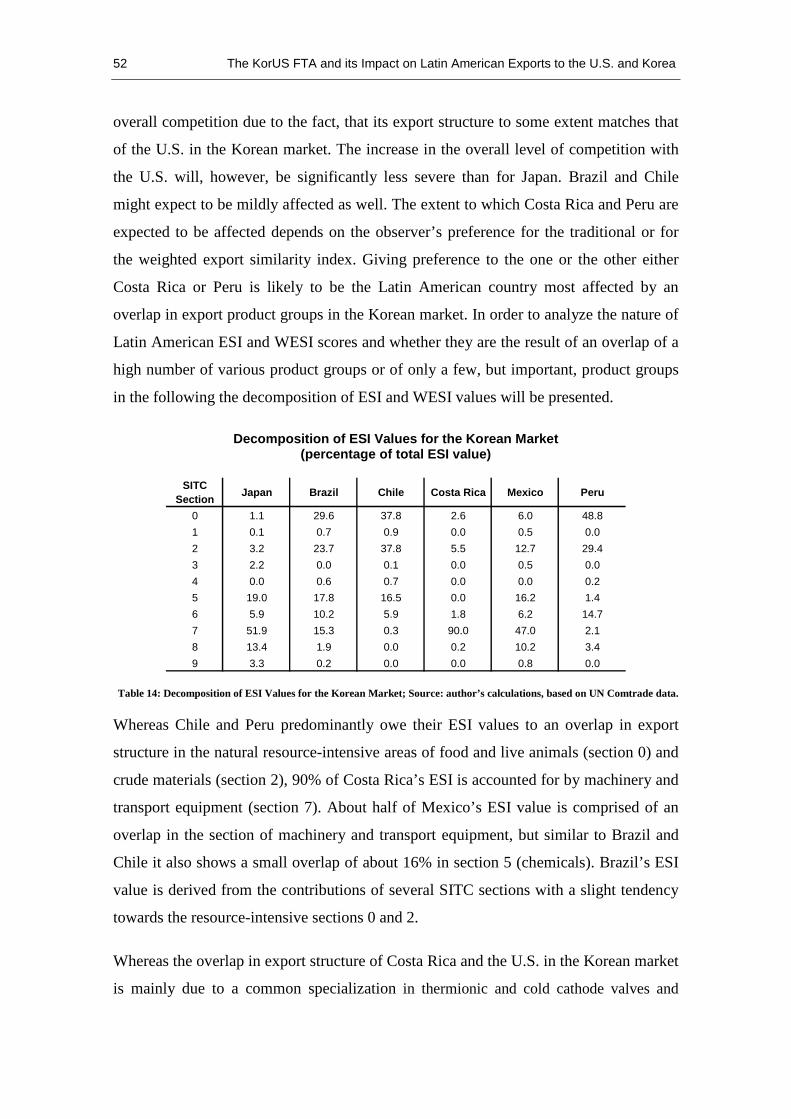
52 The KorUS FTA and its Impact on Latin American Exports to the U.S. and Korea
overall competition due to the fact, that its export structure to some extent matches that
of the U.S. in the Korean market. The increase in the overall level of competition with
the U.S. will, however, be significantly less severe than for Japan. Brazil and Chile
might expect to be mildly affected as well. The extent to which Costa Rica and Peru are
expected to be affected depends on the observer’s preference for the traditional or for
the weighted export similarity index. Giving preference to the one or the other either
Costa Rica or Peru is likely to be the Latin American country most affected by an
overlap in export product groups in the Korean market. In order to analyze the nature of
Latin American ESI and WESI scores and whether they are the result of an overlap of a
high number of various product groups or of only a few, but important, product groups
in the following the decomposition of ESI and WESI values will be presented.
Decomposition of ESI Values for the Korean Market (percentage of total ESI value)
Table 14: Decomposition of ESI Values for the Korean Market; Source: author’s calculations, based on UN Comtrade data.
Whereas Chile and Peru predominantly owe their ESI values to an overlap in export
structure in the natural resource-intensive areas of food and live animals (section 0) and
crude materials (section 2), 90% of Costa Rica’s ESI is accounted for by machinery and
transport equipment (section 7). About half of Mexico’s ESI value is comprised of an
overlap in the section of machinery and transport equipment, but similar to Brazil and
Chile it also shows a small overlap of about 16% in section 5 (chemicals). Brazil’s ESI
value is derived from the contributions of several SITC sections with a slight tendency
towards the resource-intensive sections 0 and 2.
Whereas the overlap in export structure of Costa Rica and the U.S. in the Korean market
is mainly due to a common specialization in thermionic and cold cathode valves and
SITC Section
Japan Brazil Chile Costa Rica Mexico Peru
0 1.1 29.6 37.8 2.6 6.0 48.8
1 0.1 0.7 0.9 0.0 0.5 0.0
2 3.2 23.7 37.8 5.5 12.7 29.4
3 2.2 0.0 0.1 0.0 0.5 0.0
4 0.0 0.6 0.7 0.0 0.0 0.2
5 19.0 17.8 16.5 0.0 16.2 1.4
6 5.9 10.2 5.9 1.8 6.2 14.7
7 51.9 15.3 0.3 90.0 47.0 2.1
8 13.4 1.9 0.0 0.2 10.2 3.4
9 3.3 0.2 0.0 0.0 0.8 0.0

2 The KorUS FTA and its Impact on Latin American Exports to the U.S. and Korea 53
tubes, diodes and semiconductor devices (SITC product group 776), Mexico and Brazil
show a broader range of overlapping product groups. In fact, about 60% (or 16.6 index
points) of Costa Rica’s high ESI value are due to its exports of the single product group
776. Other product groups that make up smaller parts of Costa Rica’s ESI value are the
product groups 728 (other machinery), 764 (telecommunications equipment), 288 (non-
ferrous base metal waste) and 772 (electrical apparatus). Contrastingly, Mexico’s ESI
value is accounted for by several product groups that each make a contribution equal to
or smaller than 2.2 index points. The five product groups that contributed the most to
Mexico’s ESI value are the SITC product groups 764 (telecommunications equipment),
752 (automated data-processing machines), 784 (parts of motor-vehicles), 874
(measuring instruments) and 288 (non-ferrous base metal waste). Brazil’s ESI value is
also composed of several product groups each contributing 1.7 index points or less. The
biggest overlaps between U.S. and Brazilian export structure in the Korean market fall
within the SITC product groups 044 (maize, unmilled), 251 (pulp and waste paper), 512
(alcohols/phenols), 222 (oil-seeds) and 012 (other meat). Chile’s lower ESI value of 7.5
index points is accounted for by small contributions of product groups such as pulp and
waste paper (251), non-ferrous base metal waste and scrap (288) and fish (034). 1.2
index points of Peru’s ESI of only 3.9 index points is made up by fish (034) and product
groups such as feeding stuff for animals (081) and ores and concentrates of base metals
(287) each contribute less than 0.5 index points.
Decomposition of WESI Values for the Korean Market (percentage of total WESI value)
Table 15: Decomposition of WESI Values for the Korean Market; Source: author’s calculations, based on UN Comtrade.
A more detailed look at the WESI values of Latin American countries in the Korean
market reveals that in the cases of Costa Rica, Mexico and Peru more than two thirds of
SITCSection
JAP BRA CHI COS MEX PER
0 0.7 39.2 9.6 9.1 4.1 11.3
1 0.0 3.4 1.5 0.0 1.7 0.0
2 2.9 19.8 32.2 8.7 10.8 84.4
3 2.0 0.3 0.0 0.0 0.0 0.0
4 0.0 0.8 0.1 0.0 0.0 0.0
5 18.5 7.8 37.0 0.0 2.3 0.4
6 6.3 22.5 19.7 0.1 67.1 3.9
7 53.4 6.2 0.0 82.1 5.5 0.0
8 12.7 0.0 0.0 0.0 8.4 0.0
9 3.5 0.0 0.0 0.0 0.1 0.0

54 The KorUS FTA and its Impact on Latin American Exports to the U.S. and Korea
their WESI values are accounted for by exports within a single SITC section. Whereas
81% Costa Rica’s insignificant WESI of only 2.2 index points falls into the section of
machinery and transport equipment, Mexico’s WESI was largely accounted for by
section 6 (manufactured goods classified chiefly by material) and Peru’s very high
WESI of 56.9 index points is predominantly composed of products from the section of
crude materials. Brazil’s and Chile’s WESI is mainly composed of contributions across
three different sections. Interestingly, the dominant section for the decomposition of
Chile’s WESI (compared with the decomposition of its ESI) shifts to chemicals and
related products (section 5), whereas for Brazil food and live animals gains increased
weight compared to the decomposition of its ESI value.
An even closer look at the highest Latin American WESI scores in the Korean market
reveals that these high values in some cases are due to only one or two product groups
that make up most of the sum. Almost 44 of Peru’s 56.9 index points, e.g., are made up
by ores and concentrates of base metals (product group 287). In fact, UN Comtrade data
on the top five Korean import sources for ores and concentrates of base metals in 2006
reveals that Peru was the second largest import source while the U.S. was the fourth
largest source. Competition occurred mainly in the market segments of lead ores (SITC
2874) and zinc ores (2875). More than half of Mexico’s WESI is accounted for by
copper (682). In 2006 Mexico was, however, only the seventh largest supplier of copper
to the Korean market while Chile supplied most of the Korean copper imports and the
U.S. was ranked 10th. Chile owes 8 of its 22.5 index points to alcohols and phenols
(512) and 4 index points to its copper exports. About a quarter of the Brazilian WESI is
accounted for by feeding stuff for animals (081) for which Brazil was the fourth largest
import source competing with the U.S. who took first place in 2006. About half of
Costa Rica’s 2.2 index points come from telecommunications equipment (764).
Generally the ESI values for Latin American countries in the U.S. market are slightly
higher than in the Korean market. Whereas the highest ESI value in the Korean market
was 26.9 index points shown by Costa Rica, in the U.S. market Mexico exhibits an ESI
value of 44 index points, followed by Brazil with 30.7and Costa Rica with 23.7 index
points. Peru and Chile also show higher ESI values in the U.S. than in the Korean
market, but remain in a lower range with index values around 10. Again, the selected
Latin American countries do not reach the level of export structure overlap found

2 The KorUS FTA and its Impact on Latin American Exports to the U.S. and Korea 55
between the KorUS FTA partner and Japan, but Mexico does show a rather high ESI
value and is very likely to be affected by an increase in competition with Korea in the
U.S. market. After the implementation of the KorUS FTA Brazil and Costa Rica,
compared to Japan, might face moderate increases in competition with Korea in the U.S.
market due to their overlaps in export structure.
ESI and WESI Values for the U.S. Market (index value)
Figure 10: ESI and WESI Values for the U.S. Market; Source: author’s calculations, based on UN Comtrade data.
For Brazil, Chile and Costa Rica the calculations of the ESI and the WESI return quite
similar values, whereas Mexico’s WESI value is significantly lower than its ESI value
and Peru’s WESI value is significantly higher than its ESI value. The difference for
Mexico’s lower WESI value might be explained by its relatively high export amounts to
the U.S. market when compared to Korea, which might cause a tendency towards lower
Mexican WESI values. When comparing the Japanese and the Latin American WESI
values it is noteworthy, however, that the Brazilian, the Mexican and the Peruvian
WESI are lower than Japan’s, but do fall roughly in the same range as Japan’s WESI.
Brazil’s WESI of 28.4 index points, which is the highest among the selected Latin
American countries, stays only about 5 index points behind Japan’s WESI of 33.6.
According to this measure it might be expected that Brazil, Mexico, Peru and Costa
Rica are likely to be affected by the KorUS FTA in a to some extent less severe, but
generally similar way as Japan in the U.S. market.
The decomposition of ESI values for the U.S. market shows that more than two thirds of
Mexico’s ESI value is accounted for by an overlap in export structure in the section of
60.1
30.7
9.1
23.7
11.2
33.6
28.4
10.7
25.2
26.8
26.6
44.0
0 10 20 30 40 50 60 70
Japan
Brazil
Chile
Costa Rica
Mexico
Peru
ESI WESI

56 The KorUS FTA and its Impact on Latin American Exports to the U.S. and Korea
machinery and transport equipment (section 7). Costa Rica’s overlap in this area makes
up 56.7% of its total ESI value and 48.7% of Brazil’s ESI are explained by it exports of
machinery and transport equipment. As Korean exports to the U.S. are largely made up
by machinery and transport equipment, it is not surprising that the countries with higher
ESI values in the U.S. market owe much of their score to their exports in this section.
Chile and Peru who showed significantly lower ESI values than the other selected Latin
American countries have the biggest share of their ESI values accounted for by an
export structure overlap in section 3 (mineral fuels, lubricants and related materials).
Other sections that account for higher shares of ESI values are manufactured good
classified chiefly by material (section 6) in the cases of Brazil and Chile and
miscellaneous manufacturing (section 8) in the cases of Costa Rica and Peru.
Decomposition of ESI Values for the U.S. Market (percentage of total ESI value)
Table 16: Decomposition of ESI Values for the U.S. Market; Source: author’s calculations, based on UN Comtrade data.
The countries with higher ESI values in the U.S. market owe their overlap in export
structure with Korea to a range of different product groups, many of them within the
category of machinery. The product groups that contribute most to Mexico’s high ESI
value in the U.S. market are the SITC product groups 781 (cars and motor vehicles),
764 (telecommunications equipment), 784 (parts of motor vehicles), 752 (automated
data-processing machines) and 761 (television receivers). Brazil’s high ESI value is
accounted for by product groups 784 (parts of motor vehicles), 334 (petroleum oils,
other than crude), 764 (telecommunications equipment), 723 (civil engineering
equipment) and 781 (cars and motor vehicles). The biggest product groups within the
overlap of export structures between Costa Rica and Korea in the U.S. market are the
SITC groups 759 (parts and accessories of office machines), 776 (thermionic and cold
SITCSection
Japan Brazil Chile Costa Rica Mexico Peru
0 0.5 1.1 3.9 2.5 1.1 3.0
1 0.1 0.3 0.4 0.1 0.1 0.8
2 0.4 1.1 0.9 0.4 0.4 0.6
3 0.7 9.3 38.5 1.2 3.1 43.2
4 0.0 0.0 0.0 0.0 0.0 0.0
5 3.4 7.9 5.0 3.3 3.3 3.1
6 7.9 24.2 25.8 14.8 9.4 13.1
7 82.1 48.7 15.2 56.7 70.7 8.0
8 5.0 7.2 10.1 21.0 11.8 28.2
9 0.0 0.1 0.2 0.0 0.0 0.0

2 The KorUS FTA and its Impact on Latin American Exports to the U.S. and Korea 57
cathode valves and tubes, diodes, semiconductor devices), 625 (rubber tires), 775
(household-type equipment) and 764 (telecommunications equipment). Accounting for
almost 3.5 of Chile’s 9.1 index points the biggest product group within its export
structure overlap with Korea is the SITC group 334 (petroleum oils, other than crude)
followed by much smaller contributions from the product groups 625 (rubber tires), 841
(articles of apparel for boys and men), 699 (manufactures of base metals) and 893
(articles of plastics). Peru’s biggest overlapping export product group is petroleum oils,
other than crude as well accounting for almost 5 of its 11.2 index points. The next
biggest groups that account for far less than one Peruvian index point are 845 (articles
of apparel not elsewhere specified), 841 (articles of apparel for boys and men), 842
(articles of apparel for girls and women) and 897 (jewelry and other articles of
precious/semi-precious materials).
Decomposition of WESI Values for the U.S. Market (percentage of total WESI value)
Table 17: Decomposition of WESI Values for the U.S. Market; Source: author’s calculations, based on UN Comtrade data.
The decomposition of WESI values in the U.S. market according to SITC sections
reveals that about three quarters of Mexico’s WESI value are made up by machinery
and transport equipment (section 7), which is also an important section for Brazil
accounting for 46% of its weighted export structure overlap. For Costa Rica and Peru
the dominant section is miscellaneous manufacturing (8) and Chile’s highest WESI
share falls into section 6 (manufactured goods classified chiefly by material). It is also
interesting that almost a quarter of Chile’s WESI is accounted for by section 0 (food and
live animals), whereas this section does not contribute significantly to Brazil’s and
Mexico’s WESI.
SITCSection
Japan Brazil Chile Costa Rica Mexico Peru
0 0.6 2.2 23.0 11.8 0.9 7.5
1 0.1 0.1 3.8 0.0 0.1 0.1
2 0.4 1.4 5.9 5.4 0.4 1.0
3 0.5 5.0 6.8 0.0 4.5 18.5
4 0.0 0.0 0.1 0.0 0.0 0.0
5 3.7 10.0 19.0 1.5 3.2 3.0
6 9.2 27.7 31.3 10.4 8.6 19.2
7 79.9 46.3 0.8 22.4 73.5 0.1
8 5.5 7.1 7.1 48.1 8.7 50.2
9 0.0 0.2 2.1 0.3 0.0 0.2

58 The KorUS FTA and its Impact on Latin American Exports to the U.S. and Korea
Broken down to the level of SITC product groups Mexico’s WESI is composed of a
relatively diverse profile of machinery and transport equipment exports. The product
group with the highest contribution (5 index points) to Mexico’s WESI of 26.8 index
points is motor vehicle (781), in which Mexico is the fourth largest supplier in the U.S.
market, whereas Korea is the fifth largest supplier. Telecommunications equipment
(764) accounts for 4 index points and parts of motor vehicles (784) for 2 index points of
Mexoco’s WESI. For both product groups Mexico is the second largest supplier in the
U.S. market competing with Korea in the market for telecommunications equipment
where Korea is the fourth largest supplier. The highest contributions to the Brazilian
WESI are fairly evenly distributed between the product groups 784 (parts of motor
vehicles), 723 (civil engineering) and 792 (aircraft/spacecraft vehicles and parts
thereof), 334 (petroleum oils, other than crude) and 743 (pumps, compressors and fans)
each contributing between 1 and 2 index points. The contribution of Peru’s overlapping
product groups to its WESI in the U.S. market is less evenly distributed. Whereas the
SITC group 845 (articles of apparel not elsewhere specified) accounts for 6.5 index
points, the product group 843 (men’s and boys’ apparel, knitted or crocheted) accounts
for only 2.5 index points. In the range between the product groups 334 (petroleum oils,
other than crude), 682 (copper) and 844 (women’s and girls’ apparel, knitted or
crocheted) are to be found. The highest contributions to the Costa Rican WESI range
between 1.6 and 3.8 index points and are accounted for by the product groups 872
(instruments and appliances for medical or surgical purposes), 844 (women’s and girls’
apparel, knitted or crocheted), 759 (parts and accessories for office and data-processing
machines), 841 (articles of apparel for men and boys) and 629 (articles of rubber).
Chile’s biggest overlaps in export structure according to its WESI are to be found in the
groups of 682 (copper), 522 (inorganic chemicals), 334 (petroleum oils, other than
crude), 057 (fruit and nuts) and 512 (alcohols and phenols) each contributing between
0.6 and 2.3 index points.
As was highlighted earlier there are crucial differences in the equations for the index
values of the ESI and WESI. In a few cases these differences led to significantly
different values for the two indicators, demonstrated par excellence by the cases of
Costa Rica and Peru in the Korean market. In order to give a brief summary of the
section’s findings it seems to be necessary to take a decision on the question which

2 The KorUS FTA and its Impact on Latin American Exports to the U.S. and Korea 59
results should be emphasized at this point. Generally the method of the ESI is found to
be more straightforward for comparing export structures due to its characteristic of
abstracting from the countries’ economic sizes.
Therefore the conclusions this section offers are the following. Comparing the overlap
in export structures Costa Rica and Mexico are found to exhibit the most similar export
structure with the U.S. in the Korean market. However, since their ESI values are
significantly lower than the benchmark country’s (Japan’s) ESI value, it is assumed that
Costa Rica and Mexico will face only a moderate increase in overall competition due to
the KorUS FTA in the Korean market. Both countries owe the largest share of their
export structure overlap to the area of machinery and transport equipment. Whereas
Mexico’s ESI value in the Korean market is due to an overlap of a broader range of
product groups, Costa Rica’s export structure overlap with the U.S. is mainly accounted
for by a common specialization in SITC product group 776 composed of thermionic and
cold cathode valves and tubes, diodes and semiconductor devices. In the U.S. market in
general the overlap in export structure with Korea is found to be slightly higher. Due to
its relatively large overlap in export structure Mexico is likely to be affected by an
increase in competition with Korea and Brazil and Costa Rica might face a moderate
increase in competition in the U.S. market. As Korea exports a lot within the section of
machinery and transport equipment, it was to be expected that the countries with higher
ESI values owe the lion’s share of their index points to this area. Export product groups
that are important contributors to their ESI values are cars and motor vehicles as well as
parts thereof, office and data-processing machines and parts thereof and
telecommunications equipment. For Costa Rica, again, the SITC product group 776
played an important role.
By including an element to introduce the weight of different export product groups for
the overall exports to a market, however, the WESI gives valuable input. Actually,
increased competition in an important sector (according to its weight in the export
volume) can temporarily pose a significant challenge for an economy. The WESI draws
attention to the fact that this might be the case for some countries in the Latin American
region that will not be affected by an overall increase in competition, but instead by a
significant increase in competition limited to a very specific segment of their exports.

60 The KorUS FTA and its Impact on Latin American Exports to the U.S. and Korea
To further investigate this issue in the following section an addition indicator is
introduced to identify sensitive sectors in more detail.
2.3.5 Competitiveness of Latin American Exports
The last section presented an analysis of the extent of the overlap in export structures of
the KorUS FTA trade partners and selected Latin American countries for the U.S. and
Korean market. Furthermore it highlighted some sectors that contribute more than
others to the identified overlap. Focusing more closely on the degree of competition that
might be expected for certain sectors an additional indicator measuring the intensity of
trade specialization and the degree of competitiveness of a country in a certain market is
introduced in the following.
The Index of Revealed Comparative Advantage (RCA) was introduced by Balassa in
1965 (Benedictis and Tamberi 2001, p. 3). The index is calculated as the share of a
certain product in a country’s total exports divided by the world’s share of the product
in total worldwide exports (World Bank 2008). Therefore RCA measures if a product is
more important or less important in a country’s export basket than it is on average for
countries worldwide. If the RCA for a country’s product assumes the value of 1 the
product has the same importance in the country’s export basket as it has on average
worldwide. If the RCA assumes a value higher than unity, the country is said to have a
revealed comparative advantage in this product and a value less than unity represents a
revealed comparative disadvantage for exporting the product. The respective advantages
and disadvantages are said to be ‘revealed’ advantages/disadvantages because they are
not derived theoretically, but observed in and calculated from actual trade data. The
trade specialization shown by the RCA for a country’s products can also be a result of
increased competitiveness due to trade policy distortions. For the analysis at hand,
however, it does not matter which causes led to a country’s RCA profile.
The purpose of this section is to identify areas where both the U.S./Korea and the
selected Latin American countries have comparative advantages in the Korean/U.S.
market. These areas of specialization might be the areas where competition will get
especially fierce as the respective trade partner might gain preferential market access
under the KorUS FTA. Since the interest of the analysis lies in specific markets the
countries’ RCA profiles are calculated only for trade flows to these specific markets

2 The KorUS FTA and its Impact on Latin American Exports to the U.S. and Korea 61
sometimes referred to as ‘local’ RCA. Due to questions of data availability5 RCA is
calculated for data on U.S. imports so that the equation used is
RCAij = (Mji/M ti) / (Mjn/M tn)
where M ji are Korean (U.S.) imports of product j from country i, M ti are total Korean (U.S.) imports from country i, M jn are Korean (U.S.) imports of product j from all countries and M tn are Korean (U.S.) total imports.
Calculations are based on data from UN Comtrade in the classification of SITC Rev.3
on a three digit level and as an average of imports between 2004 and 2006 to reduce
distortions due to annual fluctuations.
When analyzing of the competitiveness of Brazilian, Chilean, Costa Rican, Mexican
and Peruvian exports to the Korean market the first thing to note is that the number of
competitive U.S. exports to the Korean market largely exceeds the number of
competitive Latin American exports. Whereas the U.S. exported 115 product groups
competitively to the Korean market, Mexico exported only 55 product groups with a
RCA above unity, followed by Brazil with 31, Peru with 18, Chile with 17 and Costa
Rica with 15 export product groups.
For all of the selected Latin American countries the most competitive exports are
mainly related to natural-resources. Copper, ores and concentrates of different metals
and minerals, as well as agricultural products rank high in the list of competitive export
product groups. Brazil’s third most competitive export product group in the Korean
market, however, are motor vehicles for the transport of goods (SITC group 782) and
Chile, Mexico and Peru have one out of their five most competitive export product
groups in the area of chemicals (SITC section 5). Costa Rica, in addition to its
agricultural exports, is very competitive in the manufacturing of clothing accessories of
textile fabrics.
5 UN Comtrade does not provide aggregate world exports to the Korean/U.S. market. Therefore the reversed perspective of the same trade flow (Korean/U.S. imports from the world) is used as the next best substitute for obtaining UN Comtrade data.

62 The KorUS FTA and its Impact on Latin American Exports to the U.S. and Korea
Highest Latin American RCAs in the Korean Market
Table 18: Highest Latin American RCAs in the Korean Market; Source: author’s calculations, based on UN Comtrade data.
The extent to which Latin American countries have competitive export product groups
in common with the U.S. differs significantly. Whereas Mexico has 24 product groups
among its exports for which the U.S. as well as itself holds a RCA above unity, Peru
shows only three such groups. Brazil with 16, Chile with 10 and Costa Rica with 11
overlapping competitive product groups showed values in between. Subsequently,
Mexico will face increased competition due to the implementation of the KorUS FTA in
various segments of its economy, whereas Peru will be affected according to RCA
measures mostly in the areas of feeding stuff for animals, ores/concentrates of base
metals and crude animal materials.
RCASITC
CommodityCode
CommodityDescription
Brazil 37.6 281 iron ore and concentrates
33.0 059 fruit juices
28.1 782 motor vehicles for transport of goods
26.9 222 oil-seeds
21.0 121 tobacco, unmanufactured
Chile 41.1 283 copper ores and concentrates
35.5 682 copper
10.0 012 other meat
8.7 287 ores/concentrates of base metals
7.8 512 alcohols, phenols
Costa Rica 28.2 071 coffee and coffee substitutes
19.9 292 crude vegetable material, n.e.s.
17.1 111 non-alcoholic beverages
15.2 059 fruit juices
11.3 846 clothing accessories of textile fabrics
Mexico 37.7 278 other crude minerals
14.8 579 waste/scrap of plastics
12.2 287 ores/concentrates of base metals
12.0 288 non-ferrous base metal waste/scrap
11.4 682 copper
Peru 85.6 287 ores/concentrates of base metals
34.2 283 copper ores and concentrates
33.9 071 coffee and coffee substitutes
31.6 037 fish/crustaceans, prepared or preserved
16.3 532 dyeing and tanning extracts

2 The KorUS FTA and its Impact on Latin American Exports to the U.S. and Korea 63
RCAs Shared by the U.S. and Latin American Countries in the Korean Market
Table 19: RCAs Shared by the U.S. and Latin American Countries in the Korean Market; Source: author’s calculations, based on UN Comtrade data.
Shared RCAs are not distributed evenly across the different SITC sections. Brazil holds
its highest number of competitive export product groups within the section of food and
live animals. All countries show various shared RCAs within the section of crude
materials, but only Mexico and Costa Rica show a significant number of competitive
export product groups in common with the U.S. in the areas of machinery and transport
equipment and miscellaneous manufacturing. Mexico also faces increased competition
with the U.S. in various chemical products.
SITCCode
CommodityDescription
U.S. Brazil ChileCostaRica
Mexico Peru
012 other meat 1.8 1.7 10.0 3.8017 meat/offal, prepared 1.7 1.5024 cheese and curd 1.5 4.4025 eggs, fresh, dried or preserved 3.2 2.3044 maize, unmilled 4.2 12.1057 fruit and nuts 3.8 6.1059 fruit juices 2.9 33.0 1.1 15.2062 sugar confectionery 1.2 2.3 10.0073 chocolate and preparations 2.7 2.2081 feeding stuff for animals 1.4 19.0 2.9 1.9098 edible products and preparations 2.2 2.1111 non-alcoholic beverages 4.9 17.1121 tobacco, unmanufactured 1.7 21.0 1.7222 oil-seeds 4.6 26.9246 wood in chips/particles, wood waste 1.8 3.2251 pulp and waste paper 2.2 6.6 7.3263 cotton 3.6 9.9 1.4267 other fibers 1.3 2.3277 natural abrasives, n.e.s. 1.6 1.2287 ore/concentrates of base metals 1.0 8.7 12.2 85.6288 non-frrous base metal waste/scrap 2.6 4.4 12.0291 crude animal materials 1.5 5.6 3.6 2.7411 animal oils and fats 2.1 3.8512 alcohols, phenols 1.1 2.3 7.8513 carboxylic acids 1.0 1.1 1.9515 organo-inorganic compounds 1.3 2.6523 metal salts, peroxysalts 1.2 2.4 4.6541 medicinal/pharmaceutical products 1.6 2.6542 medicaments (incl. veterinary) 1.0 1.6 2.4573 polymers of vinyl chloride 1.9 1.3696 cutlery 2.6 4.2722 tractors 1.0 13.0747 taps, cocks, valves for pipes 1.4 1.4762 radio-broadcast receivers 1.1 9.4764 telecommunications equipment 1.4 2.5 7.1776 tubes, diodes, semiconductor devices 2.0 7.2784 parts of motor vehicles 1.3 1.1872 instruments for medical purposes 3.0 3.1 1.6873 meters and counters 1.4 1.7874 measuring instruments, n.e.s. 2.5 2.2 3.0884 optical goods, n.e.s. 1.8 1.1931 special transactions not classified 3.7 1.9

64 The KorUS FTA and its Impact on Latin American Exports to the U.S. and Korea
In contrast to the situation in the Korean market in the U.S. market Latin American
countries exhibit a higher number of competitive exports. With its 84 competitively
exported product groups for the case of Brazil and 70 competitive product groups for
the case of Mexico these two countries even show a number that exceed the number of
competitive Korean export product groups in the U.S. market. Chile holds a RCA above
unity for 41 product groups exported to the U.S. market, Peru for 40 and Costa Rica for
37 export product groups.
Highest Latin American RCAs in the U.S. Market
Table 20: Highest Latin American RCAs in the U.S. Market; Source: author’s calculations, based on UN Comtrade data.
The export product groups for which the selected Latin American countries hold the
highest RCAs fall predominantly in natural resource-based areas such as agricultural
products, crude materials and different metals. Mexico, however, holds three out of its
five highest RCAs in product groups from the miscellaneous manufacturing and the
machinery and transport equipment section.
RCASITC
CommodityCode
CommodityDescription
Brazil 24.2 281 iron ore
23.8 017 meat, preserved
19.8 121 tobacco, unmanufactured
19.7 671 iron granulates
14.6 345 other gases
Chile 113.0 044 maize, unmilled
58.6 682 copper
45.9 057 fruit and nuts
43.1 287 cores/concentrates of base metals
42.2 034 fish, fresh, chilled or frozen
Costa Rica 47.9 057 fruit and nuts
23.4 071 coffee and coffee substitutes
20.8 872 instruments for medical purposes
15.7 059 fruit juices
12.8 292 crude vegetable material, n.e.s.
Mexico 9.1 283 copper ores
5.8 873 meters and counters
5.6 054 vegetables
5.4 773 equipment for distributing electricity
4.6 761 television receivers
Peru 144.4 687 tin
96.4 971 gold, non-monetary
39.7 287 ores/concentrates of base metals
29.3 685 lead
28.7 682 copper

2 The KorUS FTA and its Impact on Latin American Exports to the U.S. and Korea 65
RCAs Shared by Korea and Latin American Countries in the U.S. Market
Table 21: RCAs Shared by Korea and Latin American Countries in the U.S. Market;
Source: author’s calculations, based on UN Comtrade data.
The number of shared RCAs between Korea and the selected Latin American countries
in the U.S. market differs widely. Brazil and Mexico export 16 and 15 product groups
respectively with a RCAs above unity and in common with Korea in the U.S. market.
The number of shared RCAs between Korea and Costa Rica as well as Peru is limited to
six while Chile shares only two competitive export groups with Korea in the U.S.
market.
Regarding the distribution of shared RCAs between Korea and the selected Latin
American countries it is noteworthy that most export product groups with shared high
SITCCode
CommodityDescription
Korea Brazil ChileCostaRica
Mexico Peru
098 edible products and preparations 1.2 1.0
122 tobacco, manufactured 2.0 1.3 1.1
232 synthetic rubber 3.1 4.1 1.1
289 ores of precious metals 1.9 1.1 3.4 8.9 1.3
334 petroleum oils, other than crude 1.1 1.2 3.5
335 residual petroleum products 1.1 1.7
511 hydrocarbons 3.1 4.6
531 synthetic organic colouring matter 1.4 1.4
572 polymers of styrene 5.1 2.6
574 polyacetals, other polyethers 2.2 1.6
625 rubber tires 3.5 1.7 1.4 3.5
651 textile yarn 2.0 1.5 1.3
652 cotton fabrics, woven 2.8 1.0
657 special yarns 1.7 2.0
673 flat-rolled products of iron, not clad 3.8 2.7
674 flat-rolled products of iron 3.8 4.2
678 wire of iron or steel 3.4 1.1
679 household equipment of base metal 2.5 1.5
691 structures of iron 1.6 1.2
693 wire products 4.8 1.3
696 cutlery 1.1 1.7
711 steam/vapour-generating boilers 3.3 1.1
722 tractors 1.6 1.8
723 civil engineering equipment 2.1 3.3
741 heating and cooling equipment 1.5 2.5
746 ball- or roller bearings 1.0 2.1
759 parts/acc. of office/data-proc. machines 2.4 3.3
761 television receivers 1.5 4.6
762 radio-broadcast receivers 1.1 2.4
764 telecommunications equipment 4.6 1.4
775 household-type equipment 3.6 2.0
776 tubes, diodes, semiconductor devices 4.5 6.0
778 electrical machinery 1.3 2.1
784 parts of motor vehicles 1.2 1.3 1.8
846 clothing accessories of textile fabrics 3.8 11.7

66 The KorUS FTA and its Impact on Latin American Exports to the U.S. and Korea
RCAs fall within the sections of manufactured goods chiefly classified by material and
machinery and transport equipment. It is mostly Brazil and Mexico that will compete in
these different product groups with Korea. Brazil and Mexico can therefore expect to
face fiercer competition in various sectors due to the implementation of the KorUS
FTA. Countries like Peru and Costa Rica will probably be affected in only very few
sectors. Nevertheless, adverse effects of the KorUS FTA in the U.S. market might be
felt by Peru e.g. in the sector of textile yarns and cotton fabrics and by Costa Rica
foremost in the field of tubes, diodes and semiconductor devices and parts and
accessories of office and data-processing machines.
2.3.6 Conclusions
Considering the value of exports and the share of total exports destined to the Korean
market, Korea seems to be a little explored market for Latin American countries. Chile
and Brazil are the only two countries that had significant exports to Korea in 2006 and
together accounted for more than 70% of Latin American exports the Korean market.
From the Korean perspective Latin America also does not seem to be an important
source for imports. However, Latin American exports to Korea have been growing
strongly over the last decade. In fact, Latin American exports grew at a faster pace than
U.S. or Japanese exports to the Korean market. Although the extent of immediate trade
diversion due to the KorUS FTA possibly affecting Latin American countries seen as
the sum across all sectors is most likely of a minor significance, the FTA might hamper
the chances of further export expansion and diversification in the future.
An analysis of import shares in the Korean market reveals that Latin American
countries hold considerable import shares in the areas of crude materials and
animal/vegetable oils. Overall the region seemed to be specialized largely towards
natural resource-intensive industries. Brazil, Chile and Peru generally follow this trend.
Mexico, Costa Rica and to some extent Brazil have found areas of specialization also in
machinery and transport equipment as well as in some manufacturing areas. Taking a
look at export diversification from a qualitative point of view all Latin American
countries compared to the U.S. had rather poorly diversified export baskets in the
Korean market. Mexico and Brazil, however, reached significantly higher levels of
export diversification than Chile, Costa Rica and Peru. The analysis of export
concentration shows that Latin American exports to the Korean market are heavily

2 The KorUS FTA and its Impact on Latin American Exports to the U.S. and Korea 67
concentrated in only a few dominant product groups that make up the lion’s share of
total exports. These product groups mostly fall within natural resource-based and
related areas with Costa Rica being the exception with its top exports concentrated in
the area of machinery.
According to the ESI as a measure for an overlap in export structure Costa Rica and
Mexico are found to exhibit the highest similarity to the U.S. in the Korean market,
mostly due to their overlap in machinery and transport equipment. Whereas Mexico
showed a broader range of overlapping product groups, Costa Rica’s overlap is largely
due to its specialization on tubes, diodes and semiconductor devices for the Korean
market. This finding was also reconfirmed for the number of sectors with shared RCAs
in the Korean market, which are more numerous for the case of Mexico and jointly with
Costa Rica’s shared RCAs to be found in the less natural resource-related areas.
Contrastingly, Brazil’s Chile’s and Peru’s competitive export groups lie in natural
resource-intensive areas and Peru’s exports are even restricted to only three different
competitive export groups.
The U.S. market, in contrast to the Korean market, currently plays a very important role
as a destination for Latin American exports. Especially Mexico that is connected to the
U.S. via NAFTA exports very much to the U.S. seen both in terms of value of exports
and share of total exports and actually accounts for almost 70% of the region’s exports
to the U.S. market. Many countries in the Latin American regions depend significantly
on exports to the U.S. market as they direct very high shares of their total exports to this
market. From the U.S. perspective Latin America as a region is also an important
supplier for U.S. imports, seen individually, however, only Mexico accounts for a quite
large share of U.S. imports. Latin American exports to the U.S. market grew strongly
over the last decade, although the pace of export growth has slowed down a little over
the past years. Due to its currently outstanding importance as a destination for Latin
American exports and the countries’ dependence on these exports the Latin American
region stands to lose much from the possible impact of the KorUS FTA.
Similarly as in the Korean market Latin America’s exports to the U.S. market were
specialized predominantly in natural resource-intensive industries as well. The analysis
of import shares revealed high import shares for the area of food and live animals. Only

68 The KorUS FTA and its Impact on Latin American Exports to the U.S. and Korea
Mexico, Brazil and Chile showed significant shares in manufactured goods and
machinery and transport equipment in the U.S. market. Measuring export diversification
in terms of product penetration it is noteworthy that Latin American countries show
much more diverse export baskets in the U.S. market than in the Korean market. But
just like it is the case for the Korean market Mexico and Brazil reached a significantly
higher level of export diversification than Chile, Costa Rica and Peru. Mexico’s and
Brazil’s level of product penetration actually exceeds Korea’s level of product
penetration in the U.S. market. The dependence on certain product groups due to a high
concentration of exports is found to be lower in the U.S. than in the Korean market as
well, especially for Mexico and Brazil. The mix of important export groups was also
more heterogeneous: Many top export groups fall within natural resource-based and –
related areas, but there are also product groups from the section of machinery and
transport equipment to be found. This could be noted mainly for the case of Mexico, but
also to some extent for the cases of Brazil and Costa Rica.
In general the selected Latin American countries showed a higher degree of similarity in
exports structure with Korea in the U.S. market than with the U.S. in the Korean
market. The highest overlap in export structure exhibits Mexico, which is expected to be
significantly affected by the implementation of the KorUS FTA. But also Brazil and
Costa Rica might face a moderate increase of competition in the U.S. market due to
their similarity in exports structure with Korea. Their higher overlap in export structure
is a result of overlapping export product groups predominantly within the section of
machinery and transport equipment, with special relevance of the automotive sector, of
office and data-processing machines and telecommunications equipment. In the case of
Costa Rica the product group of tubes, diodes and semiconductor devices, for which it
also exhibits a strong shared RCA with Korea in the U.S. market, plays an important
role as well. According to the analysis of shared RCAs, areas of increased competition
in the U.S. market due to the implementation of the KorUS FTA will mainly arise
within the SITC sections 6 (manufactured goods chiefly classified by material) and
SITC section 7 (machinery and transport equipment). In these areas especially Mexico
and Brazil might face increased competition and to some extent Costa Rica as well. Of
special importance to Mexico might be the increased competition for
telecommunications equipment and sound-recording and reproducing apparatus, while

2 The KorUS FTA and its Impact on Latin American Exports to the U.S. and Korea 69
Brazil might be affected e.g. with regard to iron products. Contrastingly competition is
likely to be experienced by Peru in a rather restricted way in areas such as textile yarns
and cotton fabrics.
The analysis of dynamics, composition and structure as well as common areas of
specialization with regard to the respective KorUS FTA member country in the Korean
and U.S. market showed that generalizations on the effects of the proposed FTA on
Latin America are not advisable. As the analysis revealed different countries are likely
to be affected to different extents, in different segments of their economies and in
different ways by the proposed FTA.

3 The Nature of International Trade Relations Under Construction
As the first chapter has highlighted one of the distinguishing characteristics of the last
decade has been the accelerated global proliferation of PTAs. These agreements,
however, do not stand in isolation. Looking at the reality of trade relations today we
observe neither a world with an exclusive net of preferential trade agreements nor a
world with trade relationships exclusively governed by multilateral negotiations. While
countries negotiate bilateral agreements like the KorUS FTA with their specific effects
on third parties, the official multilateral Doha Development Round of negotiations in
the WTO is dragging on. We observe that PTAs exist along parallel lines to the
multilateral framework of the WTO. One could also say that PTAs are embedded in the
multilateral framework of the WTO through the provisions of GATT article XXIV,
GATS article V and the Enabling Clause. As both strategies claim to pursue the same
goal of raising world welfare by liberalizing trade the following section presents the
pros and cons of regionalism6 and multilateralism7 as an approach to the international
liberalization of trade. Can one approach be said to be the superior construction plan for
structuring a country’s international relations with its trading partners?
6 In accordance with a definition given by Winters (1996, p. 2) in the following the term ‘regionalism’ is used to describe “any policy designed to reduce trade barriers between a subset of countries” regardless of their actual proximity in a strictly geographic sense.
7 In the following the term ‘multilateralism’ is used as an opposing term to ‘regionalism’. It describes an individual country’s behavior with respect to the degree of absence of discrimination in its trade policy, the “extent to which the country’s trading regime approximates free trade” (Winters 1996, p. 3) and the extent to which a country seeks to resolve questions of trade policy in multilateral fora like the WTO.

72 The Nature of International Trade Relations Under Construction
Since regionalism and multilateralism exist at the same time the question if and how
these two strategies interact gains special importance as well. In a discussion paper on
the extent and nature of modern PTAs and their significance as a policy instrument
Fiorentino et al. (2006, p. 1) note that:
“The significance of the phenomenon should not be overlooked since it will ultimately influence the nature of international trade relations and the policy choices and behaviour of the operating actors.”
Do regional and multilateral negotiations mutually reinforce each other and lead to an
overall faster accomplishment of international trade liberalization? Or does the
occurrence of one strategy obstruct progress under the respective other form of
negotiation? The second section of this chapter addresses these questions and presents
some relevant contributions to the literature on the interaction of regionalism and
multilateralism.
Furthermore this chapter concludes with the presentation of a policy options that has
been suggested in the 1990s: The concept of ‘open regionalism’. As this concept has
been announced as an approach to reconcile regionalism and multilateralism it is of
special interest within the context of this chapter. After giving an introduction to the
basic definitions and concepts the feasibility of reconciling regionalism and
multilateralism through the application of this specific policy option is assessed and
supplemented by further suggestions for reform put forward in the literature.
3.1 Is There a Superior Construction Plan?
When liberalizing trade countries have three basic strategies they can pursue with
respect to their behavior towards their trade partners. They can focus primarily on
multilateralism where countries negotiate multilaterally in fora such as the WTO to
lower their trade barriers, generally based on the principles of MFN treatment and
reciprocity. Secondly, countries have the option to liberalize trade unilaterally, which
means they lower or eliminate trade barriers independent of their trading partners’
behavior and not linked to reciprocity. This option, however, is hardly chosen by
countries since in most cases reciprocity is seen as an important contribution to
optimizing outcomes by liberalizing trade in both directions. Deardorff (2007, p. 21)
e.g. advises countries with already low tariffs to keep their “low tariffs as bargaining

3 The Nature of International Trade Relations Under Construction 73
chips” for future negotiations. As these days the option of unilateral liberalization is
rarely chosen it is to some extent removed from the focus of this chapter. A third option
for countries that wish to liberalize trade with their trading partners is to enter into
preferential agreements with some of them. Thereby the PTA partners lower or remove
barriers between each other, but measures of protection remain in place with regard to
third parties. Compared to the lowering or removal of trade barriers to the same extent
on a multilateral level, regionalism therefore leaves the world farther away from the
ultimate goal of global free trade. But if this is the case, we must raise the question why
countries increasingly pursued the regional option in the past decade.
According to orthodox trade theory it is usually agreed that global free trade is the best
option for reaching optimum welfare worldwide. The existence of preferences under
PTAs for some countries and elements of protection (be it through tariffs or non-tariff
measures such as rules of origin or differing sanitary and phytosanitary measures)
therefore leaves the world as a whole at an inferior welfare position. However, it is
usually acknowledged that this conclusion is drawn under the assumptions of perfect
competition in all national and international commodity and factor markets. If one or
more of the assumptions is violated (which a look at the economic reality today will
reveal is the case more often than it is not), the conclusions might be different. For cases
in which a first-best solution (global free trade as a Pareto-optimum) cannot be reached
because the conditions are not fulfilled, the theory of second-best (Gandolfo 1998, pp.
193-195) seeks to find the next best situation. The essential principle of this theory is
that in a situation in which one or more conditions for the Pareto-optimum are violated,
the second-best situation is not necessarily the situation in which all the remaining
conditions are fulfilled (Kreinin and Plummer 2002, p. 5).
Applying the theory of second-best to the controversy surrounding regionalism and
multilateralism it implies that in a world of imperfect competition, distortions and
barriers to trade the removal of some protection does not necessarily lead to a better
outcome for world welfare. And it equally means that the introduction of some elements
of protection does not necessarily lead to a deterioration of world welfare. As Gandolfo
(1998, p. 193) states:
“[…] the elimination of one or more of these restrictions does not necessarily mean the achievement of a better situation, and the introduction of one or more further

74 The Nature of International Trade Relations Under Construction
restrictions does not necessarily mean a deterioration of the situation but, paradoxically, might even lead to a better situation, though still suboptimal.”
In the light of the theory of second-best it is therefore not advisable to judge a priori and
in general on the outcomes of multilateralism and regionalism as strategies for
international liberalization. Thus, there is a need to debate each proposed step into the
direction of trade liberalization and evaluate if and how the road to global free trade is
to be traveled on. Consequently, this section considers both multilateralism and
regionalism as valid approaches to structure international trade relations and tries to
highlight the respective advantages claimed by proponents and disadvantages adverted
to by opponents.
One of the merits claimed by proponent of regionalism is that it leads to freer trade as it
removes trade barriers between a subset of nations. Thereby it gives incentives to non-
members to offset their losses by either joining an existing PTA or engaging in
negotiation with other excluded countries, which creates a domino effect leading to
increasingly freer trade (Hallaert 2008, p. 13; Majluf 2004, p. 1).
Supporters of regionalism also put forward that regional trade negotiations show a
higher efficiency and ensure lower negotiation costs. Due to a smaller number of
participants negotiations are less complex and can achieve faster agreements of a wider
scope than achievable on a global level (Kaiser 2002, p. 109; Kuwayama et al. 2005, p.
11). Due to a possibly lower degree of diversity among the members of regional
initiatives a regional institutions are easier to sustain than multilateral ones (De Melo et
al. 1993, p. 188) and though issues might be solved regionally that cannot be solved at
the multilateral level (Schiff and Winters 2003, p. 241).
Regionalism can also lead to more efficient outcomes in the area of public policy when
considering overall national welfare because decision-making might be less responsive
to factional interests. If special interests appear concentrated in one or a few countries,
they will have a lesser weight in decision-making as they are reduced to a smaller part
of a new, enlarged whole (Kaiser 2002, p. 118). De Melo et al. (1993, p. 183) call this
the ‘preference-dilution effect’ of regional integration. Furthermore, regionalism might
allow for the design of better institutions in case supranational institutions are created
since these can be designed from scratch.

3 The Nature of International Trade Relations Under Construction 75
An additional advantage of regionalism over multilateralism is frequently seen in lower
monitoring costs and better enforceability of sanctions. As there are fewer participants
in regional agreements it is easier to detect breaches of the agreement’s provisions and
free-rider behavior by individual countries. And in case a country does violate the terms
of a PTA the smaller number of participants facilitates the coordination and
enforcement of sanctions (Kaiser 2002, pp. 111-113; Carlowitz 2003, pp. 157-158).
There is also the possibility that regionalism diminishes protectionist pressures and
enables the lowering of external trade barriers of the region. This effect can result from
the promotion of gains in efficiency for private businesses through increased
competition on a regional level (Kaiser 2002, p. 118) and the realization of lower cost
production, if production technologies and the larger market size allow for a
reorganization of operations (Chase 2005, pp. 25-27).
Furthermore, it is often proposed that regionalism offers benefits to developing
countries in several areas. As Majluf (2004, p. 7) highlights regional integration usually
creates the expectation of increased FDI flows into and within the integration area,
which might be beneficial for investment in developing countries. In addition,
regionalism can lead to the pooling of sovereignty that enhances the capacity of
developing countries to achieve sufficient leverage to influence negotiation outcomes
and therefore improves their collective bargaining position (Kuwayama 1999, p. 18;
Pizarro 1999, p. 9). Pizarro also mentions that regionalism creates the opportunity for
developing countries to buy time for the reorganization of their sectoral policies on a
regional level before opening trade multilaterally.
Last but not least there are also non-economic effects that are put forward by the
proponents of regionalism. These include but are not limited to the strengthening of
democracy (if a prerequisite for membership in a regional initiative) or the promotion of
peace and the elimination of border disputes (Kuwayama 1999, p. 19). The
strengthening of security and military alliances is frequently mentioned as well
(American Chamber of Commerce in Korea 2007).
Equally, the opponents of regionalism find many arguments for their position. They
argue that by introducing preferences regionalism entails discrimination and the
violation of the MFN principle (Schiff and Winters 2003, p. 224). Furthermore some

76 The Nature of International Trade Relations Under Construction
stress that in contrast to the multilateral system preferences granted under PTAs are
uncertain and temporary in nature due to preference erosion through the proliferation of
PTAs (Hallaert 2008, p. 18). Many opponents also advert that regionalism is not a faster
way to liberalization than multilateralism. They claim that, when considering only the
time of actual and serious negotiation, multilateral rounds advanced at the same pace as
bilateral negotiations. And furthermore regional agreements often seem to be signed
fast, but with a closer look one can detect that in practice they usually draw on periods
for phasing-in of tariff concessions or their implementation lags behind (Carlowitz
2003, p. 154-155).
Most opponents of regionalism fear that it might lead to an increase of external barriers
of the integration area as lobby groups might seek to offset increased competition
among PTA members with the introduction of new areas or measures of protection
against outside countries (Bhagwati and Panagariya 1996, p. 20). Although the WTO
framework limits the possibilities of integration areas to increase their level of external
protection, there are some options for doing so. Countries might e.g. declare certain
areas to be “sensitive sectors” in need of protection, introduce protection via rules of
origin or implement anti-dumping measures or subsidies (Kaiser 2002, p. 115-116).
Regionalism also has the potential to lower lobbying costs for protection if special
interests are evenly spread over different countries and a customs union is formed since
in this case lobbying can be limited to the supranational level. If unanimity is required
at the supranational level of an integration area increased protection can additionally
result from the practice of ‘log-rolling’ in the consensus building process (Kaiser 2002,
p. 116-117). Since an enlargement of the integration area might further increase intra-
regional competition and benefits might be derived from the exploitation of outside
countries via terms of trade gains the current members of a regional initiative also have
incentives to block new members (Schiff and Winters 2003, p. 231).
A strong concern to opponents of regionalism is that the proliferation of PTAs opens the
possibility to pursue strategic interests for developed countries. They might wish to
“establish spheres of influence” in trade policy and other areas via the selective
implementation of PTAs (Majluf 2004, p. 1). Bhagwati and Panagariya (1996, p. 29)
also stress the ability of hegemonic powers to negotiate sequentially with smaller
countries thereby reaping greater concessions from their partners in exchange for

3 The Nature of International Trade Relations Under Construction 77
market access through a PTA. Schiff and Winters (2003, p. 241) join in this argument
by stating that agreements negotiated bilaterally between a big power and smaller
countries might be less beneficial for the latter than those achieved multilaterally
because smaller countries are put under competition. Majluf (2004, p. 5) notes that the
recent proliferation of PTAs and the inherent “fear of exclusion” might lead countries to
join bilateral agreements under greater concessions.
Opponents of regionalism often alert that bilateral agreements are used by developed
countries for the setting and spreading of specific standards. A strong tendency to
include ‘behind-the-border’ issues such as the protection of intellectual property rights
and labor and environmental standards in bilateral agreements might create blueprints
for the multilateral level without the participation and input of developing countries. As
an increasing number of countries has conceded non-trade provisions in their PTAs,
resistance to their incorporation on the multilateral level is likely to diminish
(Kuwayama et al. 2005, p. 12). Majluf (2004, p. 8) criticizes this behavior as “rule-
making […] through a bottom-up approach […] with profound implications for the
possibilities of developing countries effectively to influence the setting of multilateral
norms and disciplines.” This tendency can reduce policy space for development-
oriented policies enjoyed by developing countries.
Development problems associated with the proliferation of PTAs might also arise in
other areas. Regionalism might create a hub-and-spokes system (Hallaert 2008, p. 7) in
which “the hub (the U.S. or the EU for example) benefits more from the agreement than
the spokes” (the various bilateral partners in a PTA). While the spokes are gaining
market access only to the hub and are competing against each other in this market
(ZIMMERMANN 1999, p. 29), the hub enjoys market access to all spokes and
investment may be diverted to the hub. This development might aggravate existing
imbalances. The competition among developing countries to attract FDI might as well
result in subsidy wars among them that leave all countries worse off than with a
multilateral negotiation outcome (Majluf 2004, p. 7).
Regionalism furthermore promotes the possibility of the creation of incompatible
regulations. This effect known as the “spaghetti bowl” phenomenon (DAS 2004, p. 22)
affects all countries by introducing multiple tariff rates for multiple trade partners under

78 The Nature of International Trade Relations Under Construction
multiple schedules and with multiple rules of origin, but might especially burden
developing countries with less administrative capacities (Kuwayama 2005 et al., p. 11).
The proliferation of PTAs therefore significantly increases the complexity of trade
relations and thereby induces higher transaction costs that could be avoided to a large
extent by pursuing multilateral liberalization.
As the contemplation of the advantages and disadvantages of regionalism has shown
there are many arguments for pursuing as well as for rejecting trade liberalization on a
regional level. A preference for relying on multilateralism exclusively as well as the
attempt to supplement it with bilateral or plurilateral initiatives has its respective
strengths and weaknesses. An additional criterion to keep in mind when taking this
decision, however, is to which way regionalism and multilateralism interact.
3.2 PTAs: Building Blocks or Stumbling Blocks?
Although the contemplation of the advantages and disadvantages of regionalism as an
approach for trade liberalization already makes for much food for thought and
investigation it is not sufficient to stop at this stage. It is also crucial to take into account
in how far the two strategies interact. Does the pursuance of regional initiatives reduce
the possibilities to achieve meaningful multilateral trade liberalization? Or do the two
approaches mutually reinforce each other?
One of the earlier contributions adverting about the possibility that an interaction
between regionalism and multilateralism is to be expected if both paths are traveled on
at the same time was made by Bhagwati and Panagariya (1996, pp. 22-29). They argue
that the focus of traditional Vinerian customs union theory was on the static welfare
effects of regionalism (see also section 1.3). This view of regionalism therefore does not
properly address neither the dynamics of regionalism nor the interaction of both
strategies towards global trade liberalization. They propose that both elements should be
included into the evaluation of the strategies. Figure 11 shows the possible dynamics of
regionalism towards freer trade and world welfare maximization. Starting at point U0
PTAs either contribute to overall welfare (U2p) or have an immediate negative welfare
impact (U1p) (static effects). From there they either show stagnating membership (paths
II and III) remaining at their respective level of initial welfare or they improve world
welfare by expanding membership (paths I and IV) in the end reaching the optimum

3 The Nature of International Trade Relations Under Construction 79
level of welfare at U*. Multilateralism seen as an independent process travels its
separate path that at any moment in time can be either superior or inferior to the level of
welfare reached by the different paths of regionalism. Due to free-rider problems the
maximum level of welfare that can be achieved by process multilateralism is Um.
Bhagwati and Panagariya argue that this ‘dynamic time-path question’ is to be held
more important than the static effects of regionalism and is a starting point for the
analysis of the question whether PTAs are ‘building blocs’ or ‘stumbling blocs’. They,
however, alert that this simple model of the coexistence of regionalism and
multilateralism still falls short on the inclusion of the interaction between regionalism
and multilateralism.
Static Impact and Dynamic Time-Paths of Regionalism
Figure 11: Static Impact and Dynamic Time-Paths of Regionalism; Source: Bhagwati and Panagariya 1996, appendix fig. 8.
Winters (1996) prepared a valuable summary and classification of the earlier models
introduced to investigate the interaction between regionalism and multilateralism. In his
contribution he classifies models according to whether the models’ agents focus on
national welfare or other criteria derived from political considerations, whether initially

80 The Nature of International Trade Relations Under Construction
blocs are considered to be symmetric or asymmetric, whether interaction occurs one
time or repeatedly and in which way preferences or behavior are aggregated.
Advantages and disadvantages for the different characteristics are highlighted and
debated. As Winters (1996, p. 56) notes “the only categorical statement that can be
made […] is that one incident of regionalism is not sufficient to undermine a relatively
multilateral system immediately.”
The proponents of the ‘building blocks hypothesis’ that believe in the mutual
reinforcement of regionalism and multilateralism often stress that there are efficiency
gains to be expected form the pursuance of regional initiatives. The argument that
multilateralism might advance faster as a consequence of the parallel pursuance of
regionalism again draws on the effects of a smaller number of participants. By splitting
negotiations into two stages (regional and multilateral) there might be less participants
negotiating multilaterally and therefore reduce the complexity of the negotiation process
(Kaiser 2002, p. 119). It is also argued that countries might accept higher levels of
obligation on the regional level and that they thereby lay the foundations for progress in
these areas on the multilateral level (Kuwayama 1999, p. 17). Schiff and Winters (2003,
p. 241) as well as Carlowitz (2003, pp. 156-157) also evoke the possibility that the
existence of regional solutions fosters a faster solution of tough issues on the
multilateral stage. Furthermore acting jointly countries connected by PTAs can exert
pressure on other participants of multilateral negotiations and thereby speed up the
negotiation progress (Kaiser 2002, p. 120).
Hnát (2008, p. 11) believes that the new wave of regionalism has the potential to first
“promote the necessary structural and economic reforms” at the national level and
subsequently “encourage progress in multilateral fora.” Supporters of PTAs also put
forward that by providing time to restructure and gain competitiveness through
temporary protection regionalism increases lobby support for multilateralism in the
long-run (Chase 2005, p. 260-261).
Other lines of argumentation see the recent wave of PTAs as a consequence of the slow
progress of the multilateral trading system. Regionalism in this logic does not replace
multilateralism, but supplements it temporarily and “can provide the needed push to the
slow-moving multilateral system” (Kuwayama et al. 2005, p. 11).

3 The Nature of International Trade Relations Under Construction 81
The proponents of the ‘stumbling blocks hypothesis’ that expect detrimental effects of
regionalism on multilateralism in contrast fear that expected efficiency gains through
regionalism will not materialize. They claim that two-staged negotiations are not in
themselves more liberal or less complex than one-stage negotiations since the faster
consensus on the second stage might be more than offset by problems to agree on a
common position on the fist stage (Schiff and Winters 2003, p. 238-9; Carlowitz 2003,
p. 154-155). And as most of the agreements signed during the recent wave of PTAs
have chosen the integration form of a FTA with all parties enjoying sovereignty on the
multilateral stage it is unlikely that the number of actors in multilateral negotiations will
be reduced in the near future. Carlowitz (2003, p. 155) also draws attention to the fact
that the increasing phenomenon of overlapping membership in different regional
groupings is likely to complicate the coordination of regional interests on the
multilateral stage. Countries that enjoy a dominant position in one group (e.g. the U.S.
in NAFTA) might have fewer incentives to contribute to the consensus building in other
regional groups (e.g. in APEC).
Schiff and Winters (2003, p. 241) also question whether solutions found at the regional
level are transferable to the multilateral level as they might be unsuitable for some
countries due to a higher degree of heterogeneity on the multilateral level. The
development and establishment of incompatible sets of regulation as a consequence of
the ‘spaghetti bowl phenomenon’ might also unfold a dynamic perspective. As each
party favors the set of regulations it has advanced in its PTAs, stances on the
multilateral level are likely to become increasingly rigid, which hampers multilateral
negotiations.
There is also a genuine fear among the proponents of the ‘stumbling block hypothesis’
that the continued proliferation of PTAs will lead to increasing power asymmetries.
These imbalances give larger groups the power to obstruct any progress towards
multilateral agreements that they deem unfavorable to their interests and creates the risk
of trade wars and fragmentation of the world trading system (Carlowitz 2003, pp. 152-
153). Kaiser (2002, p. 120) also highlights the risk that the pressure exerted by larger
blocks might make smaller countries lose trust in the multilateral system as a
negotiation forum.
82 The Nature of International Trade Relations Under Construction
A line of research that has made significant contributions to the debate about the
interaction of regionalism and multilateralism and that has gained much influence over
the last decade are political economy models. These models take into account that the
decision of politicians to pursue multilateralism or not is not only influenced by
considerations about national welfare, but also by the incentive to maximize his or her
support by voters and lobby groups. Results of these models tend to support fears that
multilateralism might be rendered more difficult or infeasible due to the proliferation of
PTAs. Export-oriented companies might lose interest in pursuing multilateral
agreements as the potential gains from multilateral liberalization are reduced by earlier
regional integration and they might consider regional markets to be big enough (Kaiser
2002, p. 121). Therefore the lobby for further multilateral liberalization decreases.
Andriamananjara formalizes this idea in an interesting political economy model with
imperfect competition. The model finds that “the range of multilateral tariff cuts for
which support increases shrinks both from below and from above as the degree of
preference in the PTA increases” (Andriamananjara 2000, p. 3). This is due to the fact
that the maximum level of multilateral liberalization supported by the PTA member
countries declines as the degree of preference within the PTA rises. (The potential
market access in the outside countries is less likely to compensate for the lost protection
within the integration area if preferences are high.) At the same time the minimum level
of multilateral tariff cuts supported by the outside countries increases as preferences
among the PTA members increase. (Small multilateral tariff cuts are not enough to
offset the profit losses from the PTA’s trade diversion effect and the increased
competition in the outside countries’ home markets.) As Andriamananjara’s model
shows regionalism can have a detrimental impact on the support for multilateral trade
liberalization both inside and outside the integration area.
Additionally, opponents of regionalism put forward that countries dispose of a limited
pool of negotiation resources and that the focus on regional initiative shifts resources
away from multilateral negotiations (Fiorentino et al. 2006, p. 2). The need for highly
skilled professionals participating in multiple negotiations covering more and more
topics poses an especially severe challenge for the negotiation capacities of developing
countries (Kuwayama et al. 2005, p. 11; Schiff and Winters 2003, p. 240).

3 The Nature of International Trade Relations Under Construction 83
In 1996 Winters mentions that the debate whether regionalism is conducive to
multilateralism or exerts a negative influence on multilateral liberalization efforts is still
a very young field of research that does not provide a definite answer yet. However, the
debate has still not produced a unanimous answer. As Gavin (2007, p. 59) puts it:
“Much ink has flowed on the question of the relationship between regionalism and multilateralism. There is still, however, no definitive answer. So the debate goes on.”
Tussie and Woods (2002, p. 18) as well as Kaiser (2002, p. 121) stress the importance
of the general environment and the attitudes of the key players towards multilateralism
for the overall outcome of the interaction between regionalism and multilateralism.
As regionalism forms part of the current economic reality and PTAs further proliferate
it seems reasonable to assume that regionalism will continue to be a dominant
characteristic of international trade relations. On the other hand multilateralism is badly
needed to take account of the smaller and developing countries vulnerabilities and
cannot simply be replaced by the intensification of regional initiatives (Kuwayama et al.
2005, p. 8). Therefore the two strategies have to find a way to work together. As
Baldwin (2008) concludes: “Since regionalism is here to stay, the solution must work
with existing regionalism, not against it.” The following section presents some policy
options that claim to contribute to this goal.
3.3 Changing the Design? An Assessment of Policy Options.
During the creation of APEC in 1989 the concept of open regionalism has been
advanced which supposedly “seeks to assure that regional agreements will in practice be
building blocks for further global liberalization rather than stumbling blocks that deter
such progress” (Bergsten 2007, p. 123). Although many regional integration initiatives
claimed to practice open regionalism the concept does not have a precise definition. It
seems to be understood as a concept that in some way relates to the relationship
established with the countries outside the integration area (Pizarro 1999, p. 5).
Garnaut (1994, p. 273-274) defines open regionalism as regional economic integration
without discrimination against economies outside the region, that can be contrasted with
the traditional form of discriminatory regionalism. He mentions three analytic elements
that are characteristic of open regionalism. Firstly, a region practicing open regionalism

84 The Nature of International Trade Relations Under Construction
has to establish open policies regarding official trade barriers. Secondly, countries have
to cooperate regionally in reducing non-official barriers to trade and, thirdly, regional
integration has to be advanced through market processes without government
intervention. The facilitation of market integration can, however, be advanced by
government policies as long as these do not involve discrimination against outside
countries. The objective is to promote regional trade by overcoming resistances to trade
such as official barriers, transport and communication costs as well as subjective
resistances related to social, psychological and institutions factors such as the
perception of risk and imperfect information (Garnaut 1994, pp. 275-276). Garnaut
(1994, p. 280) basically identifies three ways to regional integration without
discrimination: Non-discriminatory reduction of protection, the expansion of public
goods to overcome resistances and the free development of market integration through
private discovery and deregulation.
Bergsten (2007, p. 128-133) gives details on five different options for defining open
regionalism. It can mean, e.g., open membership. Or it could be pursued either through
unconditional MFN treatment extended to all trade partners or through conditional MFN
extended to any country that reciprocates. A fourth option is to concentrate on both
internal liberalization and also on the lowering of external barriers as well as the
continued strong support for multilateral liberalization. The fifth option to define and
pursue open regionalism according to Bergsten is through a focus on trade facilitation
through non–tariff and non-border reforms such as the improvement of regulatory
transparency.
Concerning the lack of clear definition several aspects of the concept of open
regionalism have been criticized. Kuwayama (1999, p. 13-14) e.g. fears that the concept
as applied by APEC might lack “the rigor and institutional strength needed for an
effective process of plurilateral trade liberalization” and sees a general problem in the
fact that different members support different elements of the concept. Ziltener (2002, p.
10) notes that the Asian crisis in the 1990s led not only to a significant decrease in intra-
regional trade in East Asia, but in practice also to a stop of the implementation of the
APEC decisions.
3 The Nature of International Trade Relations Under Construction 85
Carlowitz (2003, pp. 244-247) concludes that the concept in general is either not viable
or inconsistent. If openness is pursued through the unconditional extension of
preferences to all countries there is no incentive for becoming a member. If preferences
are extended to non-member at a slower pace or not at all, the concept does not achieve
its goal of non-discrimination. The definition of openness through open membership
would make the group more heterogeneous and the costs for coordination and decision-
making would increase, while the focus on trade facilitation is not a unique feature of
the concept of open regionalism (Carlowitz 2003, pp. 252-254). Schiff and Winters
(2003, p. 244) come to conclude that
“…”open regionalism” is a slogan rather than an analytical term. It is defined in so many different ways that it conveys no information about [a regional integration area] other than that its members are embarrassed to be thought of as protectionist.”
Many of the more straightforward suggestions for policy responses to the recent
proliferation of PTAs include different ideas for the reform of the WTO legal
framework with regard to regionalism (see e.g. Kaiser 2002, pp. 122-124). The
elaboration of the “Understanding on the interpretation of Article XXIV of the General
Agreement on Tariffs and Trade 1994” has certainly been a step in the right direction by
clarifying some aspects. However, there is still much room for interpretation and as
Majluf (2004, pp. 11-13) states the WTO rules are still perceived as a framework of
uncertainty when it comes to the future regulation of regionalism. Baldwin (2008) also
calls for a more proactive engagement of the WTO in the area of PTAs with the WTO
playing a coordinating role and taking on responsibilities of a fair broker.
Gavin (2007, pp. 69-70) proposes the introduction of a system of multilevel trade
governance. The concept of multilevel governance originally emerged in the 1990s in
the EU due to the need to make the different layers of sub-national, national and
supranational regulations compatible. Multilevel regulatory governance is based on the
organizing principle of subsidiarity and is concerned with finding the right level for
decisions on different areas of regulation, assigning clear responsibilities and ensuring
coherence. By implementing a system of effective subsidiarity for the development and
administration of regulation in the area of trade a further aggravation of the spaghetti
bowl problem can be avoided and some of the current strands disentangled. This
measure seems to be indispensable for the future vitality of international trade relations.

86 The Nature of International Trade Relations Under Construction
Additionally, capacity building measures for developing countries have been proposed
(Majluf 2004, p. 16). This would provide them with the necessary skills to effectively
participate in different trade negotiations and implement multilateral trade regulation.
For this purpose a special fund could be set up in order to bear the adjustment costs
related to new trade regulation (Gavin 2007, p. 69). Furthermore, a constant and open
public debate on the advantages and disadvantages of specific regional and multilateral
initiatives should be encouraged. The future of international trade relations should be
characterized by inclusion and participation.

References
Andriamananjara, S. (2000) Regionalism and Incentives for Multilateralism. Journal of Economic Integration 15(1). March 2000. Seoul: Center for International Economics. pp. 1-18.
American Chamber of Commerce in Korea (2007) AMCHAM Korea Doorknock 2007.
Seoul: AMCHAM. AsiaPulse News (2004) Korea Targets Brazil in Bid to Diversify Trade, Investment. 17
November. http://goliath.ecnext.com/coms2/summary_0199-3054219_ITM [accessed 5 June 2008].
Balassa, B. (1961) ‘Towards a theory of economic integration’ In: Baudin, L. et al.
(eds.) Kyklos, International Review for Social Sciences, Vol. XIV. Oxford: Blackwell Publishing, pp. 1-17.
Baldwin, R. (2008) Multilateralising regionalism: The WTO’s next challenge. VOX.
Policy Portal. 29 February 2008. http://www.voxeu.org/index.php?q=node/959 [accessed 1 August 2008].
BEA - Bureau of Economic Analysis, U.S. Department of Commerce (2008)
‘International Transactions, by Area - Korea, Republic of’. U.S. International Transactions Accounts Data. http://www.bea.gov/international/bp_web/simple.cfm?anon=71&table_id=10&area_id=38 [accessed 1 July 2008].
Benedictis, L. and Tamberi M. (2001) A Note on the Balassa Index of Revealed
Comparative Advantage. Working Paper Series. Social Science Research Network. http://papers.ssrn.com/sol3/papers.cfm?abstract_id=289602 [accessed 21 July 2008].
Bergsten, F. (2007) ‘Open Regionalism’ In: Drysdale, P. and Terada, T. (eds.) Asia
Pacific Economic Cooperation. Volume III. APEC: Foundations and Evolution. London: Routledge. pp. 123-143.
Bhagwati, J. and Panagariya, A. (1996) Preferential Trading Areas and
Multilateralism: Strangers, Friends or Foes?. Discussion Paper Series. Department of Economics. New York: Columbia University.
Blank, J., Clausen, H. and Wacker, H. (1998) Internationale ökonomische Integration:
von der Freihandelszone zur Wirtschafts- und Währungsunion. München: Vahlen.
88
Carlowitz, P. v. (2003) Regionalismus in der Weltwirtschaft. Hamburg: Verlag Dr. Kovac.
Chase, K. (2005) Trading Blocs. States, Firms, and Regions in the World Economy.
Michigan Studies in International Political Economy. Ann Arbor: The University of Michigan Press.
Cheong, I. and Wang, Y. (1999) Korea-U.S. FTA Policy: Prospects and Analysis.
Working Paper 99-03. Seoul: Korea Institute for International Economic Policy. Cheong, I. (2008) Ratification of KORUS FTA and FTA Policy for 2008. Korea.net –
The Korean Government’s official English-language homepage. 19 January 2008. http://www.korea.net/News/News/NewsView.asp?serial_no=20080116012 [accessed 13 June 2008].
Choi, I. and Schott, J. (2001) Free Trade between Korea and the United States?. Policy
Analyses in International Economics, No. 62. Washington, D.C.: Institute for International Economics.
Choi, I. and Schott, J. (2004) ‘Korea-U.S. Free Trade Revisited’ In: Schott, J. (ed.) Free
Trade Agreements: U.S. Strategies and Priorities. Washington, D.C.: Institute for International Economics. pp. 173-196.
Das, D. (2004) Regionalism in Global Trade. Cheltenham: Edward Elgar Publishing. Deardorff, A. (2007) Trade Policy Options for Developing Countries Outside the Doha
Round. Presentation prepared for the ARTNet Research Workshop on Emerging Trade Issues for Developing Countries in the Asia-Pacific Region. 11 December 2007. http://www.unescap.org/tid/projects/tradeissue_s8deardorff.pdf [accessed 1 August 2008].
De Melo, J., Panagariya, A. and Rodrik, D. (1993) ‘The new regionalism: a country
perspective’ In: De Melo, J. and Panagariya, A. (eds.) New dimensions in regional integration. Cambridge: Cambridge University Press. pp. 159-193.
DeRosa, D. and Gilbert, J (2004) ‘Technical Appendix: Quantitative Estimates of the
Economic Impacts of US Bilateral Free Trade Agreements’ In: Schott, J. (ed.) Free Trade Agreements: U.S. Strategies and Priorities. Washington, D.C.: Institute for International Economics. pp. 383-417.
ECLAC (2007) La región refuerza sus vínculos comerciales con países asiáticos. Notas
de la CEPAL, No. 54. September 2007. Santiago de Chile: Economic Commission for Latin America and the Caribbean. pp. 1 and 6.
Economist (2007) The trade two-step. The Economist, Volume 383 Number 8523.
London. 7 April 2007. pp. 41-42. Economist (2007a) Buying off the opposition. The Economist, Volume 385 Number
8554. London. 10 November 2007. p. 94.

89
Economist (2008) Still beefing. The Economist – Web Edition. 26 June 2008 http://www.economist.com/world/asia/displaystory.cfm?story_id=11622408 [accessed 27 June 2008].
El-Agraa, A. (1989) The Theory and Measurement of International Economic
Integration. London: Macmillan Press. Fiorentino, R., Verdeja, L. and Toqueboeuf, C. (2007) The Changing Landscape of
Regional Trade Agreements: 2006 Update. Discussion Paper No. 12. Geneva: World Trade Organization.
Gandolfo, G. (1998) International Trade Theory and Policy. Berlin: Springer. Garnaut, R. (1994) Open Regionalism: Its Analytic Basis and Relevance to the
International System. Journal of Asian Economics, Vol. 5, No. 2. pp. 273-290. Gavin, B. (2007) ‘Reconciling Regionalism and Multilateralism: Towards Multilevel
Trade Governance’ In: De Lombaerde, P. (ed.) Multilateralism, Regionalism and Bilateralism in Trade and Investment. 2006 World Report on Regional Integration. Dordrecht: Springer.
Hallaert, J. (2008) Proliferation of preferential trade agreements: A quantification of its
impact. GEM Working Paper. February 2008. Paris: Sciences Po. Hnát, P. (2008) Globalization, Multilateralism, Regionalism: from dilemma to multi-
dimensionality. Acta Oeconomica Pragensia, ročník 16, 2/2008. Prague: Vysoká škola ekonomická v Praze.
Johnson, H. (1960) ‘The Economic Theory of Customs Union’ In: Pomfret, R. (ed.)
(2003) Economic Analysis of Regional Trading Arrangements. Cheltenham: Edward Elgar Publishing. pp. 64-76.
Jovanović, M. (2006) The economics of International Integration. Cheltenham: Edward
Elgar Publishing. Kaiser, C. (2002) ‚Regionale versus weltwirtschaftliche Integration’ In: Schüller, A. and
Thieme, J. (eds.) Ordnungsprobleme der Weltwirtschaft. Schriften zu Ordnungsfragen der Wirtschaft. Band 71. Stuttgart: Lucius & Lucius. pp. 105-125.
Kaiser, C. (2003) Regionale Integration und das globale Handelssystem. Duisburger
Volkswirtschaftliche Schriften, Vol. 38. Berlin: Duncker & Humblot. Kreinin, M. and Plummer, M. (2002) Economic Integration and Development, Has
Regionalism Delivered for Developing Countries?. Cheltenham: Edward Elgar Publishing.

90
Krueger, A. (1999) ‘Free Trade Agreements as Protectionist Devices: Rules of Origin’ In: Pomfret, R. (ed.) (2003) Economic Analysis of Regional Trading Arrangements. Cheltenham: Edward Elgar Publishing. pp. 261-272.
Kiyota, K. and Stern, R. (2007) Economic Effects of a Korea-U.S. Free Trade
Agreement. Washington, D.C.: Korea Economic Institute. Korean Ministry of Finance and Economy (2007) KORUS FTA: Expected Effects.
Republic of Korea Economic Bulletin, Vol.29 No.4. April 2007. Seoul: Korean Ministry of Finance and Economy. pp. 40-50.
Korea.net – The Korean Government’s official English-language homepage (2008) Lee
says Washington to ratify Korea-U.S. FTA this year. 21 April 2008. http://www.korea.net/News/Issues/IssueDetailView.asp?board_no=19257 [accessed 13 June 2008].
Kuwayama, M. (1999) Open regionalism in Asia Pacific and Latin America: a survey of
the literature. CEPAL-SERIE Comercio internacional, No. 4. Santiago: United Nations.
Kuwayama, M., Durán Lima, J. and Silva, V. (2005) Bilateralism and Regionalism: Re-
establishing the primacy of Multilateralism a Latin American and Caribbean Perspective. CEPAL-SERIE Comercio internacional, No. 58. Santiago: United Nations.
Lee, J. and Lee, H. (2005) Feasibility and Economic Effects of a Korea-U.S. FTA.
Policy Analysis 05-05-02. Seoul: Korea Institute for International Economic Policy.
Leelawath, W. (2007) ‘Weighted Export Similarity Index: An alternative measurement
and its uses’. Articles 2007. International Institute for Trade and Development. http://www.itd.or.th/en/node/436 [accessed 3 June 2008].
Majluf, L. (2004) Swimming in the Spaghetti Bowl: Challenges for Developing
Countries under the „New Regionalism“. Study Series No. 27. Policy Issues in International Trade and Commodities. Geneva: UNCTAD.
McDaniel, C. and Fox, A. (2001) U.S.-Korea FTA: The Economic Impact of
Establishing a Free Trade Agreement between the United States and the Republic of Korea. Investigation No. 332-425, USITC Publication 3452. Washington, D.C.: U.S. International Trade Commission.
Michaely, M. (2004) Trade Liberalization and Trade Preferences. Burlington: Ashgate. OAS – Organization of American States (2008) ‘Foreign Trade Information System’
http://www.sice.oas.org/agreements_e.asp [accessed 4 August 2008]. Piermartini, R. and Teh, R. (2005) Demystifying Modelling Methods for Trade Policy.
WTO Discussion Paper No.10. Geneva: World Trade Organization.

91
Pizarro, R. (1999) Comparative Analysis of regionalism in Latin America and Asia-Pacific. CEPAL-SERIE Comercio internacional, No. 6. Santiago: United Nations.
Robson, P. (1998) The economics of international integration. 4. ed. London:
Routledge. Sang-hun, C. (2008) South Korea lifts ban on U.S. beef. The New York Times. 26 June
2008. Schiff, M. and Winters, A. (2003) Regional integration and development. Washington
D.C.: World Bank. Schott, J., Bradford, S. and Moll, T. (2006) Negotiating the Korea-United States Free
Trade Agreement, Policy Briefs in International Economics, Number PB06-4. Washington D.C.: Institute for International Economics.
Schott, J. (2007) The Korea-US Free Trade Agreement: A Summary Assessment. Policy
Brief PB07-7. Washington, D.C.: Institute for International Economics. Schott, J. (2008) ‘Implementing the KORUS FTA: Key Challenges and Policy
Proposals’. In: Flake, G. and Ro-byug, P. (eds.) Understanding New Political Realities in Seoul, Working toward a Common Approach to Strengthen U.S.-Korean Relations. Washington D.C.: Maureen and Mike Mansfield Foundation. pp. 79-98.
Tussie, D. and Woods, N. (2000) Trade, Regionalism and the Threat to Multilateralism.
LATN Working Papers #6. Buenos Aires: FLACSO. United Nations Commodity Trade Statistics Database. http://comtrade.un.org/db/ USDA - U.S. Department of Agriculture (2008)’South Korea: Trade’. Briefing Rooms,
Economic Research Service. http://www.ers.usda.gov/Briefing/SouthKorea/trade.htm [accessed 1 July 2008].
USITC - U.S. International Trade Commission (2007) U.S.-Korea Free Trade
Agreement: Potential Economy-wide and Selected Sectoral Effects. Investigation No. TA-2104-24, USITC Publication 3949. Washington, D.C.
USTR - Office of the U. S. Trade Representative (2006) ‘United States, South Korea
Announce Intention to Negotiate Free Trade Agreement’. Press Releases. 2 February 2006. http://www.ustr.gov/Document_Library/Press_Releases/2006/February/United_States,_South_Korea_Announce_Intention_to_Negotiate_Free_Trade_Agreement.html [accessed 30 May 2008].
USTR - Office of the U. S. Trade Representative (2007) ‘United States and Korea
Conclude Historic Trade Agreement’. Press Releases. 2 April 2007. http://www.ustr.gov/Document_Library/Press_Releases/2007/April/United_States_Korea_Conclude_Historic_Trade_Agreement.html [accessed 30 May 2008].

92
USTR - Office of the U. S. Trade Representative (2007a) ‘United States and the Republic of Korea Sign Landmark Free Trade Agreement’. Press Releases. 30 June 2007. http://www.ustr.gov/Document_Library/Press_Releases/2007/June/United_States_the_Republic_of_Korea_Sign_Lmark_Free_Trade_Agreement.html [accessed 30 May 2008].
USTR - Office of the U. S. Trade Representative (2007b) ‘Trade Facts, Free Trade with
Korea, Brief Summary of the Agreement’. KorUS FTA Briefing Book. http://www.ustr.gov/assets/Document_Library/Fact_Sheets/2007/asset_upload_file302_11035.pdf [accessed 27 June 2008].
USTR - Office of the U. S. Trade Representative (2008) ‘Fact Sheet on South Korea
Beef Protocol’. Fact Sheets. http://www.ustr.gov/assets/Document_Library/Fact_Sheets/2008/asset_upload_file661_14966.pdf [accessed 27 June 2008].
USTR – Office of the U.S. Trade Representative (2008a) ‘Bilateral Trade Agreements’
http://www.ustr.gov/Trade_Agreements/Bilateral/Section_Index.html [accessed 4 August 2008].
Viner, J. (1950) ‘The Economics of Customs Unions’ In: Pomfret, R. (ed.) (2003)
Economic Analysis of Regional Trading Arrangements. Cheltenham: Edward Elgar Publishing. pp. 3-45.
Willenbockel, D. (1994) Applied General Equilibrium Modelling: Imperfect
Competition and European Integration. Chichester: Wiley & Sons. Winters, A. (1996) Regionalism versus Multilateralism. Policy Research Working Paper
No. 1687. International Trade Division. November 1996. Washington, D.C.: The World Bank.
World Bank (2008) Trade Indicators & Indices.
http://web.worldbank.org/WBSITE/EXTERNAL/COUNTRIES/EASTASIAPACIFICEXT/EXTEAPREGTOPINTECOTRA/0,,menuPK:580028~pagePK:51065911~piPK:64171011~theSitePK:580005,00.html [accessed 29 May 2008].
World Bank (2008a) World Development Indicators 2008. Washington, D.C.: The
World Bank. WTO (2007) Understanding the WTO. 3. ed. Geneva: World Trade Organization. WTO (2008) ‘Facts and Figures’ Regional Trade Agreements, Trade Topics.
http://www.wto.org/english/tratop_e/region_e/regfac_e.htm [accessed 20 June 2008].
93
WTO (2008a) ‘Notifications to the GATT/WTO’ Facts and Figures, Regional Trade Agreements, Trade Topics. Up-dated 20 May 2008. http://www.wto.org/english/tratop_e/region_e/summary_e.xls [accessed 20 June 2008].
WTO (2008b) ‘Article XXIV’ The Mandate, Facts and Figures, Regional Trade
Agreements, Trade Topics. http://www.wto.org/english/docs_e/legal_e/gatt47_02_e.htm#articleXXIV [accessed 20 June 2008].
WTO (2008c) ‘Differential and more favourable treatment reciprocity and fuller participation of developing countries’ The Mandate, Facts and Figures, Regional Trade Agreements, Trade Topics. http://www.wto.org/english/docs_e/legal_e/enabling1979_e.htm [accessed 20 June 2008].
WTO (2008d) ‘Article V: Economic Integration’ The Mandate, Facts and Figures,
Regional Trade Agreements, Trade Topics. http://www.wto.org/english/docs_e/legal_e/26-gats_01_e.htm#articleV [accessed 20 June 2008].
Ziltener, P. (2002) Ostasiatische oder pazifische Handelsdynamik? Eine Analyse von
UNCTAD-Handelsdaten, 1970-2000. MPIfG Working Paper 02/9. July 2002. Cologne: Max Planck Institute for the Study of Societies.
Zimmermann, R. (1999) Regionale Integration und multilaterale Handelsordnung.
Untersuchungen zur Wirtschaftspolitik 115. Köln: Institut für Wirtschaftspolitik an der Universität zu Köln.

95
Eidesstattliche Erklärung
Hiermit erkläre ich eidesstattlich, die vorliegende Diplomarbeit zum Thema „The U.S.-
Republic of Korea Free Trade Agreement and its Impact on Latin America“ selbständig
und ohne fremde Hilfe angefertigt zu haben. Direkte oder indirekte Angaben aus
fremden Quellen sind als solche kenntlich gemacht.
Die Arbeit wurde bisher bei noch keiner weiteren Prüfungsbehörde vorgelegt und auch
nicht veröffentlicht. Mir ist bewusst, dass eine unwahre Erklärung rechtliche Folgen
haben kann.
Bremen, den 20. August 2008 ……………………………………... Anja Breuer