the use of mt. mazama volcanic ash as natural pozzolans
TRANSCRIPT

Portland State University Portland State University
PDXScholar PDXScholar
TREC Final Reports Transportation Research and Education Center (TREC)
6-2018
The Use of Mt. Mazama Volcanic Ash as Natural The Use of Mt. Mazama Volcanic Ash as Natural
Pozzolans for Sustainable Soil and Unpaved Road Pozzolans for Sustainable Soil and Unpaved Road
Improvement Improvement
Matthew D. Sleep Oregon Institute of Technology
Morgan B. Masley Oregon Institute of Technology
Follow this and additional works at: https://pdxscholar.library.pdx.edu/trec_reports
Part of the Transportation Commons, and the Urban Studies Commons
Let us know how access to this document benefits you.
Recommended Citation Recommended Citation Sleep, Matthew and Masley, Morgan. The use of Mt. Mazama volcanic ash as natural pozzolans for sustainable soil and unpaved road improvement. NITC-RR-1075. Portland, OR: Transportation Research and Education Center (TREC), 2018. https://www.doi.org/10.15760/trec.202
This Report is brought to you for free and open access. It has been accepted for inclusion in TREC Final Reports by an authorized administrator of PDXScholar. Please contact us if we can make this document more accessible: [email protected].

The Use of Mt. Mazama Volcanic Ash as Natural Pozzolans for Sustainable Soil and UnpavedRoad Improvement
FINAL REPORT
NITC-RR-1075 June 2018
NITC is a U.S. Department of Transportation national university transportation center.


ii
THE USE OF MT. MAZAMA VOLCANIC ASH AS
NATURAL POZZOLANS FOR SUSTAINABLE SOIL AND UNPAVED ROAD IMPROVEMENT
Final Report
NITC-RR-1075
by
Dr. Matthew D. Sleep Morgan B. Masley
Oregon Institute of Technology
for
National Institute for Transportation and Communities (NITC) P.O. Box 751
Portland, OR 97207
June 2018

iii
Technical Report Documentation Page 1. Report No.
NITC-RR-1075
2. Government Accession No.
3. Recipient’s Catalog No.
4. Title and Subtitle The Use of Mt. Mazama Volcanic Ash as Natural Pozzolans for Sustainable Soil and Unpaved Road Improvement
5. Report Date June 2018
6. Performing Organization Code
7. Author(s) Dr. Matthew Sleep Morgan Masley
8. Performing Organization Report No.
9. Performing Organization Name and Address Oregon Institute of Technology 3201 Campus Drive Klamath Falls, OR 97601
10. Work Unit No. (TRAIS)
11. Contract or Grant No.
12. Sponsoring Agency Name and Address National Institute for Transportation and Communities (NITC) P.O. Box 751 Portland, OR 97207
13. Type of Report and Period Covered
14. Sponsoring Agency Code
15. Supplementary Notes
16. Abstract This report investigates the viability of using volcanic ash deposited from the eruption of Mt. Mazama as a natural pozzolan and substitute for the more conventional methods of soil stabilization and unpaved roadway improvement, including dust abatement. Chemical analyses show that Mt. Mazama volcanic ash has similar chemistry to that found in many pozzolanic materials. Standard and modified ASTM strength activity index (SAI) testing was performed on a variety of mixtures containing volcanic ash, hydrated lime, crushed volcanic ash and portland cement at different percentages. A gravel wash sieve test and a slurry mix test were devised in order to determine how the ash could be used to both penetrate into compacted gravel layers and bind material together for the prevention of dust mitigation as defined by the EPA. These new procedures indicate that Mt. Mazama ash can be effective as a supplement to portland cement for binding compacted gravel layers and reducing the dust particulate percentage. Mt. Mazama ash, mixed with highly compressible and organic soil, does not increase unconfined compressive strength. Sustainability studies show that any replacement of portland cement with volcanic ash reduces carbon dioxide emissions and embodied energy.
17. Key Words
18. Distribution Statement No restrictions. Copies available from NITC: www.nitc-utc.net
19. Security Classification (of this report) Unclassified
20. Security Classification (of this page) Unclassified
21. No. of Pages 76
22. Price
iv
ACKNOWLEDGEMENTS Matthew Sleep would like to acknowledge support from the National Institute for Transportation and Communities (NITC) under grant number (1075).
DISCLAIMER The contents of this report reflect the views of the authors, who are solely responsible for the facts and the accuracy of the material and information presented herein. This document is disseminated under the sponsorship of the U.S. Department of Transportation University Transportation Centers Program in the interest of information exchange. The U.S. Government assumes no liability for the contents or use thereof. The contents do not necessarily reflect the official views of the U.S. Government This report does not constitute a standard, specification, or regulation.
RECOMMENDED CITATION Sleep, Matthew and Masley, Morgan. The use of Mt. Mazama volcanic ash as natural pozzolans for sustainable soil and unpaved road improvement. NITC-RR-1075. Portland, OR: Transportation Research and Education Center (TREC), 2018.
v
TABLE OF CONTENTS EXECUTIVE SUMMARY .......................................................................................................... 9 1.0 INTRODUCTION........................................................................................................... 10 2.0 THE PROBLEM ............................................................................................................. 10 3.0 METHODOLOGY ......................................................................................................... 11 4.0 VOLCANIC MATERIAL STUDY AND COLLECTION ......................................... 12 5.0 LITERATURE REVIEW .............................................................................................. 15
5.1 POZZOLANS ................................................................................................................... 15 5.1.1 Pozzolan Classification ............................................................................................. 16 5.1.2 Chemical Composition.............................................................................................. 16 5.1.3 Use in Concrete ......................................................................................................... 17
5.1.3.1 Water demand ....................................................................................................... 17 5.1.3.2 Setting time............................................................................................................ 17 5.1.3.3 Heat of hydration .................................................................................................. 18 5.1.3.4 Strength ................................................................................................................. 18 5.1.3.5 Durability .............................................................................................................. 19
5.2 UNPAVED ROAD DUST MITIGATION ....................................................................... 20 5.3 TRAIL IMPROVEMENT METHODS ............................................................................ 21 5.4 SOIL IMPROVEMENT ................................................................................................... 21 5.5 VOLCANIC ASH TESTING ........................................................................................... 22
6.0 METHODOLOGY AND RESULTS............................................................................. 23 6.1 CLASSIFICATION OF MT. MAZAMA VOLCANIC ASH AS A NATURAL
POZZOLAN ..................................................................................................................... 23 6.1.1 Moisture Percentage.................................................................................................. 23 6.1.2 Loss on Ignition ........................................................................................................ 24 6.1.3 Fineness..................................................................................................................... 25 6.1.4 Chemical Analysis .................................................................................................... 25 6.1.5 Dynamic Chemical Analysis..................................................................................... 26
6.2 MODIFIED SAI TESTING .............................................................................................. 30 6.3 UNPAVED ROAD IMPROVEMENT ............................................................................. 37
6.3.1 Cylinder Slurry Mix Testing ..................................................................................... 37 6.3.2 Dust/Gravel Wash Sieve Test ................................................................................... 42
6.4 ORGANIC SOIL IMPROVEMENT ................................................................................ 45 6.5 SUSTAINABILITY ANALYSIS OF MT. MAZAMA VOLCANIC ASH ..................... 53
7.0 CONCLUSIONS AND RECOMMENDATIONS ........................................................ 58 8.0 RECOMMENDATIONS FOR FUTURE WORK ....................................................... 59 9.0 REFERENCES ................................................................................................................ 60 10.0 APPENDIX ...................................................................................................................... 63
10.1 SAI TESTING TRIAL 1 ................................................................................................... 63 10.2 SAI TESTING TRIAL 2 ................................................................................................... 65 10.3 SAI TESTING TRIAL 3 ................................................................................................... 67 10.4 CYLINDER SLURRY TESTING .................................................................................... 68 10.5 GRAVEL WASH SIEVES ............................................................................................... 71

vi
10.6 MOISTURE CONTENT, LOSS ON IGNITION, FINENESS, AND CHEMICAL ANALYSIS ....................................................................................................................... 72
10.7 SUSTAINABILITY ANALYSIS ..................................................................................... 74 10.8 FOREST SERVICE LETTER .......................................................................................... 75
LIST OF FIGURES
Figure 1 – Distribution of pumice and ash deposits from the eruption of Mt. Mazama (Williams
and Bacon, 1988) .................................................................................................................. 13 Figure 2 – Pumice flow and ash deposits collected for this study, limits from Walker 1951 ...... 14 Figure 3 – Sampled and dried Mt. Mazama ash ........................................................................... 24 Figure 4 – Comparison of control (S-0) and S-1, SC-1 at seven days of curing ......................... 32 Figure 5 – Comparison of control (S-0) and S-1, SC-1 at 28 days of curing ............................... 32 Figure 6 – Trial 1 strength values at seven days of curing ........................................................... 33 Figure 7 – Trial 1 strength values at 28 days of curing ................................................................ 33 Figure 8 – Compressive strengths at seven days of curing, trial 2 ............................................... 34 Figure 9 – Compressive strengths at 28 days of curing, trial 2..................................................... 34 Figure 10 – Comparison of samples with lime (SL samples) with S-12 from trial 1 ................... 35 Figure 11 – Comparison of uncrushed (S-1, S-6 and S-7) strengths and crushed strengths (SC-1,
SC-2, SC-3) at seven days of curing ..................................................................................... 36 Figure 12 – Comparison of uncrushed (S-1, S-6 and S-7) strengths and crushed strengths (SC-1,
SC-2, SC-3) at 28 days of curing .......................................................................................... 36 Figure 13 – Increase in compressive strength of trial 3 mortar cubes with length of curing ........ 37 Figure 14 – Gradation of gravel samples tested with mixtures of portland cement and volcanic
ash ......................................................................................................................................... 38 Figure 15 – W/c ratio tests conducted on the compacted gravel samples indicating a w/c ratio of
1.5 to be ideal for binding the most material ........................................................................ 39 Figure 16 – Bound portion measurement for slurry mix sample SC200.2 ................................... 41 Figure 17 – Bound portion measurement for slurry mix sample CS4.4 ....................................... 41 Figure 18 – Percentage of cement replaced with volcanic ash vs. penetration into gravel layer for
cylinder slurry mix test ......................................................................................................... 42 Figure 19 – Percentage of cement replaced with volcanic ash vs. bound material of gravel for
cylinder slurry mix test ......................................................................................................... 42 Figure 20 – Wash No. 200 sieve results for seven-day cure tests ................................................. 44 Figure 21 – Wash No. 200 sieve results for 28-day cure tests ...................................................... 44 Figure 22 – Compilation of Harichane et al. (2012) soil mixing data for CH and CL soils
replaced with lime and volcanic ash ..................................................................................... 47 Figure 23 – Comparison of Harichane et al. 2012 data with Sleep et al. 2018 data ..................... 48 Figure 24 – Effect of volcanic ash replacement on unconfined compressive strength between
Cimen et al. (2015) and Sleep et al. (2018) .......................................................................... 49 Figure 25 – Comparison of Hossain and Easa 2006 unconfined compression strength of a CL soil
with volcanic ash replacement and Sleep et al. 2018 data – Organic soil ............................ 50 Figure 26 – Comparison of Hossain and Easa (2006) unconfined compression strength of a CH
soil with volcanic ash replacement and Sleep et al. (2018) – Organic soil .......................... 51 Figure 27 – Unconfined compressive strength of Wood River Wetland Soil with an airfall
deposit of Mt. Mazama volcanic ash after seven-day cure ................................................... 52
vii
Figure 28 - Maximum embodied energy in GJ for different material mix types .......................... 57 Figure 29 - CO2 emissions based on different material mix types ............................................... 57
LIST OF TABLES Table 1. Chemical requirements for ASTM C-618 pozzolan classifications ............................... 16 Table 2. Physical requirements for ASTM C-618 pozzolan classifications ................................. 16 Table 3. Moisture percentage of in-situ ash vs. ASTM requirements .......................................... 23 Table 4. Loss on ignition of laboratory test vs. ASTM requirements........................................... 24 Table 5. Fineness of ash vs. ASTM requirements ........................................................................ 25 Table 6. Chemical constituents of Mt. Mazama ash with comparison to ASTM standards for
class N and class F pozzolans ............................................................................................... 26 Table 7. Mix composition by percentage of component and cure time before drying ................. 28 Table 8. Results of the dynamic chemical testing......................................................................... 29 Table 9. Strength activity index testing trials ............................................................................... 30 Table 10. Mix components for trial 1 SAI testing ........................................................................ 30 Table 11. Mix components for trial 2 SAI testing ........................................................................ 30 Table 12. Mix components for trial 3 SAI testing ........................................................................ 31 Table 13. W/c ratio test samples ................................................................................................... 38 Table 14. Cylinder sample testing of portland cement replaced with volcanic ash ...................... 40 Table 15. Trial mixes for potential dust abatement ...................................................................... 43 Table 16. Chemical composition of Mt. Mazama volcanic ash compared to the ash from other
studies ................................................................................................................................... 45 Table 17. Comparison of percentage increase in compressive strength between Harichane et al.
2012 and Sleep et al. 2018 data ............................................................................................ 48 Table 18. Comparison of percentage increase in compressive strength between Hossain and Easa
2006 and Sleep et al. 2018 data ............................................................................................ 51 Table 19. Hypothetical trail mixes applied in the SEEAM analysis............................................. 56

viii

9
EXECUTIVE SUMMARY
Natural pozzolans can be a replacement for portland cement in many applications. Some natural pozzolans are byproducts of industrial processes. Other natural pozzolans, such as volcanic ash, occur naturally. This study determined the suitability of Mt. Mazama volcanic ash as a natural pozzolan and explored innovative uses of the material for roadway improvement. Requirements of natural pozzolans are specified in ASTM C618 – coal fly ash and raw or calcined natural pozzolan for use in concrete. This study concluded that volcanic ash from Mt. Mazama meets chemical requirements of a natural pozzolan. In its unprocessed, natural form, Mt. Mazama volcanic ash does not meet fineness, moisture or strength requirements as a natural pozzolan.
An innovative study of the strength of mortar cubes created with increasing replacement of portland cement with Mt. Mazama volcanic ash showed that decreases in strength occur with increased percentage replacements. When the Mt. Mazama volcanic ash is crushed and passed through a No. 200 sieve, this decrease in strength is less than unprocessed material.
Slurry mixes of Mt. Mazama volcanic ash, lime and portland cement applied to gravel materials bound material to a greater percentage, and reduced potentially airborne particulates to a greater degree than using portland cement slurry alone.
A sustainability analysis concluded that any replacement of portland cement with volcanic ash reduces embodied energy and carbon dioxide emissions.

10
1.0 INTRODUCTION
This report investigates the viability of using volcanic ash deposited from the eruption of Mt. Mazama as a natural pozzolan and substitute for the more conventional methods of soil stabilization and unpaved roadway improvement, including dust abatement. This report first examines the use of natural pozzolans in portland cement concrete. The chemical process of the pozzolanic reaction is also explained. Chemical analyses show that Mt. Mazama volcanic ash has similar chemistry to that found in many pozzolanic materials. Standard and modified ASTM strength activity index (SAI) testing was performed on a variety of mixtures containing volcanic ash, hydrated lime, crushed volcanic ash and portland cement at different percentages. A gravel wash sieve test and a slurry mix test were devised in order to determine how the volcanic ash could be used to both penetrate into compacted gravel layers and bind material together for roadway dust mitigation. These procedures indicate that Mt. Mazama volcanic ash can be effective as a supplement to portland cement for binding compacted gravel layers and reducing the dust particulate percentage. Mt. Mazama volcanic ash, mixed with highly compressible and organic soil, does not increase unconfined compressive strength. Sustainability studies show that any replacement of portland cement with volcanic ash reduces carbon dioxide emissions and embodied energy.
2.0 THE PROBLEM
Portland cement is an expensive and energy-intensive material to produce. Natural pozzolans, which may be industrial byproducts or occur naturally, have been shown as a potential replacement for portland cement. Replacing portland cement with a natural pozzolan has the benefit of being less expensive and uses less energy. Previous research on soil improvement conducted by Millar (2016) and Sleep et al. (2018) show that locally available volcanic ash from the eruption of Mt. Mazama in Southern Oregon may have properties of a natural pozzolan. This research hopes to further characterize these materials as natural pozzolans and explore innovative uses. In addition to soil and gravel roadway stabilization, there is the potential to use Mt. Mazama volcanic ash to reduce the dust produced from gravel roadways. The Environmental Protection Agency (EPA) has listed particulate pollution (PM) as one of the six principle air pollutants. A 2005 study by the EPA showed that 33% of this pollutant comes from the dust of unpaved roads. Dust produced by gravel roadways has been linked to asthma, emphysema, heart disease and chronic bronchitis, among other health problems.

11
3.0 METHODOLOGY
Published data was reviewed to determine locations of geologic deposits of Mt. Mazama volcanic ash. Field work was conducted, in consultation with the United States Forest Service, to collect samples of the volcanic ash. Literature was reviewed on natural pozzolans, roadway dust mitigation, and trail and soil improvements. After sample collection, six chemical analyses were conducted on samples to determine suitability as a Class N Natural Pozzolan according to ASTM standards. Loss on ignition and fineness of the volcanic ash was also determined. A total of 138 conventional and modified strength activity index tests were completed to determine the strength of mortar mixes replacing portland cement with volcanic ash. Twenty-two slurry mixes of various proportions of volcanic ash, portland cement and lime were mixed, and the effects on compacted aggregate samples were observed. Seven mixtures of highly organic soil and volcanic ash were created, complementing the work conducted by Sleep et al. (2018). These samples were compacted and tested in unconfined compression to determine the effects of volcanic ash on mixed soil strength. Thirteen aggregate samples, mixed with various amounts of lime, portand cement and volcanic ash, were created and, after curing, a wash #200 sieve test was conducted on the mixture. This testing investigated the effectiveness of the material as a dust abatement admixture. Fifteen dynamic chemical analyses were conducted on various samples of portland cement, lime and the volcanic ash before and after hydrating to determine changes in chemical composition. A sustainability analysis was conducted, using newly published research from the Geotechnical Center for Practice and Research at Virginia Tech, to determine the benefits of replacing portland cement and lime with volcanic ash.

12
4.0 VOLCANIC MATERIAL STUDY AND COLLECTION
One objective of this project is to identify sources and collect samples of Mt. Mazama volcanic ash for further testing as a natural pozzolan. The materials used in this study have their geologic origins in the eruption of Mt. Mazma in Southern Oregon. As described in Bacon (1983), Mt. Mazama is one of a series of volcanoes in the High Cascades related to the subduction of the Juan de Fuca plate beneath the North American plate. Approximately 7,700 years ago, Mt. Mazama erupted and collapsed, forming the caldera now known as Crater Lake National Park . Pumice and volcanic ash reached 30 miles high in the eruption event and predominant winds carried materials throughout the Pacific Northwest and Southern Canada (USGS, 2002). Estimates of the volume of ash from the preliminary eruptive event are estimated at seven to nine cubic miles (Williams and Goles, 1968). Thicknesses of ash deposits nearest the caldera are shown in Figure 1. In 1951, an economic analysis was conducted by George Walker from the United States Department of the Interior on pumice and ash deposits of the then Klamath Indian Reservation north of Klamath Falls, OR. That study identified several deposits in the form of flow and airfall pumice and ash with economic viability from the eruption of Mt. Mazama. The study did not identify if the materials could be used as a natural pozzolan. This report located and tested several samples of volcanic ash and pumice from the eruption of Mt. Mazama. For the purposes of this study, focus was placed on airfall pumice deposits as opposed to flow deposits. Airfall deposits are less likely to be welded and thus will need less processing as a natural pozzolan. Limits of airfall deposits are shown in Figure 2. Limited amounts of material, shown in Figure 2 as “Material Collection A,” were collected as part of a study conducted by Millar (2016) and Sleep et al. (2018). This material, partially welded, required significant processing prior to use in the Sleep et al. study. After extensive field investigations, material for this study was collected as shown in Figure 2 as ‘Material Collection B.’ This site, located in the Fremont-Winema National Forest, is situated near the headwaters of Spring Creek. The material collected was at ground surface, just below a limited amount of organic material. Permission to obtain this material was given by the district ranger (Appendix 10.8). A cultural resources monitor was present during material collection. Approximately 25 gallons of material was collected.

13
Figure 1 – Distribution of pumice and ash deposits from the eruption of Mt. Mazama (Williams and Bacon, 1988)

14
5 mi
Limits of Walker 1951 Study
Crater Lake
Pumice Flow
Contours of Airfall Pumice Thickness
N
5'
0.5'
Material Collection ‘A’
Material Collection ‘B’
Figure 2 – Pumice flow and ash deposits collected for this study, limits from Walker 1951

15
5.0 LITERATURE REVIEW
5.1 POZZOLANS
Pozzolans are supplementary cementitious materials (SCM) which are defined by Michael Thomas as “material that, when used in conjunction with portland cement, contributes to the properties of the hardened concrete through hydraulic or pozzolanic activity, or both” (2013, pg. 5). The American Concrete Institute defines a pozzolan as, “a siliceous or siliceous and aluminous material, which in itself possesses little or no cementitious value but will, in finely divided form and in the presence of moisture, chemically react with calcium hydroxide at ordinary temperatures to form compounds possessing cementitious properties” (Tikalsky et al., 1994, pg. 410). These materials react with the main detrimental byproducts (hydroxides) of the hydration reaction process to produce an increased amount of high-strength, cementitious material. While today pozzolans are known mainly as additives in portland cement concretes, pozzolanic types of cement were among some of the first adequate concrete binders used in human history. According to Steven Kosmatka at the Portland Cement Association (PCA), the Romans learned of pozzolanic cement from the Greeks and mastered it. They mixed volcanic ash with lime and used the paste to build structures such as the Theatre at Pompeii, the Coliseum and the Pantheon (1994, pg. 410-415). The main compounds that react in a pozzolanic reaction are the calcium hydroxide (Ca(OH)2) from the hydration reaction and a silicic acid from the pozzolan. The silica glass (SiO2) in a natural pozzolan such as volcanic ash reacts with water to form a silicic acid. This reaction is demonstrated in Equation 1.
Equation 1.
One of the more common acids produced is orthosilicic acid (H4SiO4). The product of these reactions is a calcium silica hydrate (CSH); one possible reaction with these compounds is shown in Equation 2.
Equation 2.
Because the ratios and exact compounds can vary, this chemical equation is often shortened to a version shown as Equation 3.
Equation 3.
The same reaction may occur with aluminates as well, replacing the silicate they form aluminate hydrates instead of silicate hydrates.

16
5.1.1 Pozzolan Classification
ASTM has three classifications for pozzolans. Classes C and F are reserved strictly for different types of fly ash derived from the coal burning process. Class C is a fly ash with cementitious properties whereas a class F fly ash has pozzolanic properties. Class N pozzolans are known as natural pozzolans . The most common class N materials include calcined clay, shales, or volcanic ash . Typically, natural pozzolans are either found in a relatively suitable condition for use, such as with many volcanic ash deposits, or produced by heating a raw material to produce a pozzolan. To be classified as a pozzolan, natural materials must meet certain physical and chemical properties. The two most important physical properties of a natural pozzolan are particle size and relative density. The material must be of a small enough particle size to provide adequate surface area for the pozzolanic reaction to occur. The optimal grain size for class N pozzolans is often below 75 microns or that which passes through the No.200 sieve (ASTM, 2005). Table 1 and Table 2 show the chemical and physical requirements (respectively) of ASTM C-618 for the classification of Class N, F, and C pozzolans. Table 1. Chemical requirements for ASTM C-618 pozzolan classifications
Chemical Requirements Class
Component N F C SiO2 + Al2O3 + Fe2O3 min, % 70.0 70.0 50.0 SO3, max % 4.0 5.0 5.0 Moisture content, max % 3.0 3.0 3.0 Loss on ignition, max % 10.0 6.0 6.0 Table 2. Physical requirements for ASTM C-618 pozzolan classifications
Physical Requirements Class
Requirement N F C Fineness (retained on No. 325 sieve), max % 34 34 34 Strength activity index seven days, % of control
75 75 75
Strength activity index 28 days, % of control 75 75 75 Water requirement max % of control 115 105 105 Autoclave expansion or contraction, max % 0.8 0.8 0.8 Max density variation from average, % 5 5 5 5.1.2 Chemical Composition
Perhaps the most important component of a natural pozzolan is the material's chemical composition; as previously mentioned, silica and alumina content are critical. Some pozzolans can contain 5% to 10% calcium oxide, giving them cementitious properties when mixed with water. However, the most active chemical ingredients found in most non-calcined natural pozzolans are silica and alumina. These two chemicals typically account for 95% (often greater)

17
of the mass of a pozzolan and are responsible for reacting with the hydroxides. The remainder of the mass is commonly iron, calcium and some alkalies (Kosmatka et al., 2013, pg. 71-72). Calcium silica hydrate is commonly referred to as C-S-H and is the “strongest” or most cementitious byproduct of the hydration reaction between portland cement and water (and the goal of pozzolanic reactions), creating the conditions for aggregate to be bound together after the reaction is complete. Another byproduct of the hydration reaction is one of the aforementioned hydroxides, calcium hydroxide or CH. According to the Portland Cement Association, CH “has little or no cementitious properties and contributes little to the strength of the hydrated material” (2013, pg. 72). The rate at which pozzolanic reactions take place depends on both the physical and chemical properties of the pozzolan. As with most chemical reactions the surface area present for reaction is directly proportional to the rate of reaction, the finer the material the more rapid the reaction. In terms of chemical composition, pozzolans make use of different cements. For example, a pozzolan could have a high concentration of silica-glass, “the solubility of glass increases with pH and this in turn increases its availability for reaction with CH. Because of this a pozzolan will tend to react more quickly when combined with a high-alkali portland cement” (Kosmatka et al., 2013, pg. 73). A faster hydration reaction means faster setting concrete and could be applicable in areas when strength is needed quickly. The use of natural pozzolans can also apply to the use of other SCMs. Slag cement is often used as an additive in portland cement concrete, and “the most effective activators for slag cement are calcium hydroxide or alkali compounds” (Kosmatka et al., 2013, pg. 73), which suggests the use of pozzolans with high alkali content could further benefit the addition of slag cement and reduce the quantities of CH after reaction occurs. 5.1.3 Use in Concrete
Natural pozzolans have the potential to influence several properties in portland cement concrete mixing and curing. The factors most significantly affected by natural pozzolans are water demand, set time, heat of hydration, and strength (Kosmatka et al., 2013, pg. 73).
5.1.3.1 Water demand
Water demand in a mix is the amount of water required in order to achieve a sufficient reaction with all reactants; those include portland cement and whatever SCMs have been added. The water content in a mix may also have influences on other properties such as workability and heat of hydration. When it comes to natural pozzolans, the effect they have on water demand for a given mix depends on the type; “calcined clays and calcined shales generally have little effect on water demand in lower dosages; however, other natural pozzolans [such as volcanic ash] can significantly increase or decrease water demand” (Kosmatka et al., 2013, pg. 73).
5.1.3.2 Setting time
As a general rule, SCMs increase the setting time of portland cement concrete. For most fly ash, calcined material and other natural pozzolans, “the extent of the retardation is generally in the range of 15 minutes to one hour for initial set and 30 minutes to two hours for final set” (Kosmatka et al., 2013, pg. 75). However, the amount of additional set time is also directly proportional to the ratios of cement to SCM in the mix as well. These set-time delays are

18
typically more noticeable at low curing temperatures and less so at high temperature. Too much delay in set time also has the potential to increase the risk of shrinkage and cracking, particularly because they are often less permeable unless an air entertainer has been added (Kosmatka et al., 2013, pg. 75).
5.1.3.3 Heat of hydration
Commonly, natural pozzolans lower the heat of hydration in a given hydration reaction. Per PCA, “the majority of supplementary cementing materials (fly ash, natural pozzolans…typically have a lower heat of hydration than portland cement” (Kosmatka et al., 2013, pg. 76). The lower heat of hydration is particularly beneficial when pouring large masses of concrete as it allows for an easier maintained temperature gradient throughout the mix which can help prevent thermal cracking. According to the PCA, higher levels of calcium oxide in class C fly ash leads to higher heat of hydration (2013, pg. 76), which may suggest the same trends for other natural pozzolans including volcanic ash.
5.1.3.4 Strength
Strength increase in regard to natural pozzolans can be likened to any chemical reaction, it all depends on the quantities, ratios, and inherent qualities of the reactants. If a mix has too much pozzolan and not enough cement, it is going to have less strength than a pure cement mix. However, if used correctly “supplementary cementitious materials (fly ash, slag cement, silica fume, calcined shale, and calcined clay including metakaolin) all contribute to the long-term strength gain of concrete” (Kosmatka et al., 2013, pg. 77). Depending on the exact composition and physical properties of a given natural pozzolan, the time to control strength can range from one day for some slag cements and up to 90 days for more common natural pozzolans . Several studies suggest two main actions that natural pozzolans can serve in concrete. They can either be used as a supplement for the aggregate portion or the cement portion of the mix. A study by Campbell et al. in 1982 showed that replacing the aggregate portion of a concrete mix, which is usually sand with volcanic ash from the 1980 Mt. St. Helens eruption, increased the 28-day compressive strength of the samples by approximately 25%. The portions of sand replaced with volcanic ash to achieve this increase was 20%. Campbell et al. also tested replacing 20% of the portland cement in the mix with the St. Helens ash and found that it decreased the 28-day strength of the samples by over 40% . This same study also tested the effectiveness of grinding the ash after collection as a means to increase reactivity. When testing the St. Helens ash for compliance with ASTM standards for compressive strength of mortar cubes (ASTM C 618/ASTM C 109) Campbell et al. tested the replacement of 20% cement replaced with either unground or ground St. Helens ash. They found that the unground ash yielded cubes of 75% control strength and the ground ash produced cubes of up to 90% of control strength. The trends shown by the Campbell study were corroborated in 2006 by Hossain and Lachemi when they also replaced 20% of the cement portion of a mix with volcanic ash. The Hossain study found that replacing these portions reduced the compressive strength of samples by 16% . Hossain and Lachemi published another article in the ACI Materials Journal where they tested the compressive strength of cement replaced in increments of 10, 20 and 30% by volcanic ash. The results supported their findings with compressive strengths 8, 16 and 30% lower than the control, respectively, suggesting an inverse relationship between compressive strength and

19
amount of cement supplemented with volcanic ash . It should be noted that in the incremental study the samples were allowed to cure for 91 days. The relationship was supported further when a year later Hossain and Lachemi again replaced another 20% of cement with volcanic ash and found that it reduced the compressive strength of the samples by 23% (Hossain and Lachemi, 2007). Specific strength testing of concrete mixtures containing Mt. Mazama ash were performed early in 2018 by Sleep et al. Strength activity index testing according to ASTM standards performed in the study on a concrete mixture using a replacement of Mt. Mazama ash yielded a strength of up to 95% of control strength . Sleep et al found that “Mt. Mazama ash meets Strength Activity Index criteria according to ASTM C311 for a natural pozzolan.” The study also performed unconfined compression strength tests on proportions replacing 50% of the pozzolan portion with hydrated lime, concluding “in the presence of hydrated lime, Mt. Mazama ash has more significant pozzolanic reaction, in terms of strength, than fly ash and lime.” . Sleep also examined the results of soil mixing with Mt. Mazama ash on compressive strength of soil and found that “soil mixing of Mt. Mazma ash has negative effects on soil strength in contrast to previous studies by others” (Sleep et al., 2018).
5.1.3.5 Durability
Studies that have been involved in testing the effects on durability that supplemental volcanic ash has on concrete focus mainly on alkali-silica reactions (ASR). The 1982 Campbell study tested their 20% volcanic ash supplemented samples over a period of five months. In accordance with ASTM C 441, Campbell et al. concluded that the ASR expansion had been reduced by around 60% . In 2005, Hossain observed that using ash from Papua New Guinea’s Mt. Tavurvur stratovolcano only required a cement replacement of 10% in order to reduce ASR expansion to within acceptable limits. In their 2006 study for Cement and Concrete Research, Hossain and Lachemi observed an increased sensitivity to sulfates in specimens where 20% of cement mass was replaced with volcanic ash. The Hossain and Lachemi ACI article tested the impact of volcanic ash on shrinkage and cracking due to drying. They found that the traditional 20% replacement mix had no observable effect . As far as impact on abrasion resistance is concerned, in general SCMs do not have an established impact. The same is true for volcanic ash. It is also worth noting that the other factors and properties of portland cement concrete generally remain the same between mixes with added natural pozzolans, specifically volcanic ash, and those without. Those include freezing and thawing and deicer scaling resistance (although some calcined materials lower deicer scaling resistance). Furthermore, all of these factors and properties can be made unpredictable if components are not added in known or carefully measured and observed ratios.

20
5.2 UNPAVED ROAD DUST MITIGATION
Suspended dust has the potential to be a serious problem. Excessive dust in the air can cause serious lung problems; dust can also travel long distances carried by air, accumulate into storms, and even contaminate a water supply. The EPA defines these pollutants as particulate matter (PM) a “term for a mixture of solid particles and liquid droplets found in the air” (EPA). The EPA has two classifications for PM, the first is PM10 which is any inhalable or suspended particles with a size of 10 microns. The second is PM2.5, particles 2.5 microns or smaller (EPA). The National Ambient Air Quality Standards limits these particulates to 150 μg/m3 over a 24-hour period for PM10 and 15 μg/m3 annually as well as 35 μg/m3 over a 24-hour period for PM2.5. Typically dust control becomes an issue when dealing with dry, unimproved roadways commonly found on construction sites or in the rural environment. The State of Alaska Division of Air Quality (SADAQ) offers some guidelines for effective dust abatement. However, some of their suggestions, such as reducing traffic and simply improving the roadway design, are not necessarily applicable to situations such as a construction site. SADAQ offers a solution to the challenges presented by conditions similar to a rural unimproved road or construction site. They list four different kinds of chemical dust palliatives. One older chemical used was a petroleum-based binder which simply operates on the principal of adding mass to the particles to prevent them from becoming airborne. Petrol-based binders are not used very often anymore because runoff from them can contaminate waterways. Another option offered by SADAQ is the use of organic nonpetroleum dust suppressants, which are essentially a resin byproduct from the production of paper. These resin-based materials are not common due to the fact they are water soluble and can be easily washed away with rainfall. Electrochemical stabilizers "neutralize soils that attract water and allow bonds to form between particles" and can are used for dust abatement but need to be worked into the soil by equipment (SADAQ, 2017). Some examples of electrochemical stabilizers are bentonite and sulfonated petroleum, which also have the potential to contaminate groundwater. The last kind of dust palliatives are synthetic polymer products; “they bind soil particles and form a semi-rigid film on the road. These products are either liquids or powders that are mixed with water. Products are applied in liquid form and require drying” (SADAQ, 2017). Synthetic polymer products are likely the most similar to the potential application of a pozzolan/portland cement mixture on a roadway for dust mitigation. John F. Rushing and Kent Newman, two physical research scientists for the U.S. Army Engineer Research and Development Center, conducted an experiment on two chemical dust palliatives in 2007. The two types of palliatives they tested were a synthetic oil and an emulsifying polymer. They used a silty sand soil type for their test sample and modeled traffic with a C-17 aircraft tire loaded with 34,000 pounds. They analyzed the effectiveness of the palliatives through the use of video monitoring as well as gravimetric analysis methods. Their results "show nearly complete reduction in dust for Palliative 2 (a synthetic oil) and heavy applications of Palliative 1 (an emulsion polymer)” (Rushing and Newman, 2007). These results demonstrate the effectiveness of these methods. They also show how popular manufactured dust mitigation products are

21
typically oils and resins produced from byproducts of the coal or petroleum production processes.
5.3 TRAIL IMPROVEMENT METHODS
Application sprays for the stabilization of unimproved roadways are common throughout the country with both private and public entities. In 2000, the Federal Highway Administration conducted a study on the use of various natural and commercial applications to determine their effectiveness in the stabilization of forestry trails. The goal of this experiment was to meet compliance with the Americans with Disabilities Act guidelines, which are to provide and maintain a firm, stable and slip-resistant surface of the trail. The experiment involved four test zones around the country and included the testing of the following products; pine tree resin, enzymes, sulfuric acid, latex polymer, ground seed hulls, clay and fly ash. During the experiment, the products are applied to a ¾-inch, nominal size aggregate compacted using a plate compactor over a 48-inch wide trail cross-section. Of all of these products tested the only ones with significantly noticeable improvements were the ground seed hulls and pine tree resin. The ground seed hulls "allow(s) water to permeate through the surface when it gets wet . The aggregate material will get firmer again as the material dries out providing a firm surface in the summer . The pine tree resin was the most expensive and the most difficult to apply, but it provided the best surface for universal accessibility” (Bergmann, 2000).
5.4 SOIL IMPROVEMENT
Due to the rise in sustainable practice and environmental concerns in regards to infrastructure, many SCMs are being tested for use in soil stabilization. A large area of benefit for stabilization of soil is in road construction. One study conducted by Ҫimen et al. in 2013 tested the effectiveness of waste pumice for the stabilization of clayey subgrades for highway construction. The pertinent tests involved in the study were standard compaction testing, unconfined compression tests and the California bearing ratio test (CBR). The standard compaction testing yielded results that indicated a direct correlation between the percentages of clay replaced with pumice and the density of the material. The density of the clay was increased from an initial density of 1.19 g/cm3 to 1.46 g/cm3 when it was supplemented with 50% pumice . The clay/pumice material reached a maximum strength of 4.44 kg/cm3 when replaced with 30% pumice by mass, roughly a 215% increase from the 2.06 kg/cm3 yielded from the 100% clay material . For the CBR test results the resistance to penetration of the initial clay sample after compaction was 0.95%; this was increased up to 4.00% for a mixture of 40% pumice and 60% clay. However, when the mixture was increased to 50% pumice the resistance dropped down to 3.5% (Ҫimen et al., 2013). A study by Ruff and Davidson in 1961 confirmed that the addition of sodium silicates and lime to an unstable clay layer have the potential to stabilize the clay layer over time. Further research by Ding et al. has shown that the addition of sodium silicates on their own does not necessarily lead to an increase in soil strength and, in fact, it may decrease it. However, this is likely only an issue with clay soils as they are the only particles affected by electrical charges induced in the

22
silicate reaction (Ding et al., 1996). The addition of the silicates with another calcium source such as hydrated lime “may strengthen clay if lime is added along with the sodium silicates. The lime can be used as a source of calcium ions, and with the presence of both calcium ions and silicate ions, calcium silicate gel can form, hydrate, and harden, thereby cementing the clay particles together” (Rafalko, 2006).
5.5 VOLCANIC ASH TESTING
There are several studies that have been performed on volcanic ash that have directly tested its application in terms of compressive strength when used with other materials. Harichane (2012) shows a positive correlation between increasing replacement of CH and CL soils with lime and volcanic ash. Harichane found a slight increase in unconfined compressive strength in 10% replacement with volcanic ash and even more increase in strength when replaced with four, eight and 10 percent lime. Cimen et al. (2015) tested unconfined compression strength of a CH material mixed with pumice and ash and found a positive correlation between percent CH replaced with ash and increased unconfined compressive strength, with zero percent ash replacement producing barely 30 psi and 30% ash replacement producing over 60 psi. Hossain and Easa did similar testing in 2006 replacing CH and CL materials with volcanic ash, finding another positive correlation between replacing these materials and an increase in unconfined compressive strength. The 2006 Hossain and Easa testing saw 20% ash replacement increase to around 260 psi after 27 days of curing. Comparisons between the findings of this report and those of Harichane, Cimen et al., and Hossain and Easa can be found later in this report.
23
6.0 METHODOLOGY AND RESULTS
6.1 CLASSIFICATION OF MT. MAZAMA VOLCANIC ASH AS A NATURAL POZZOLAN
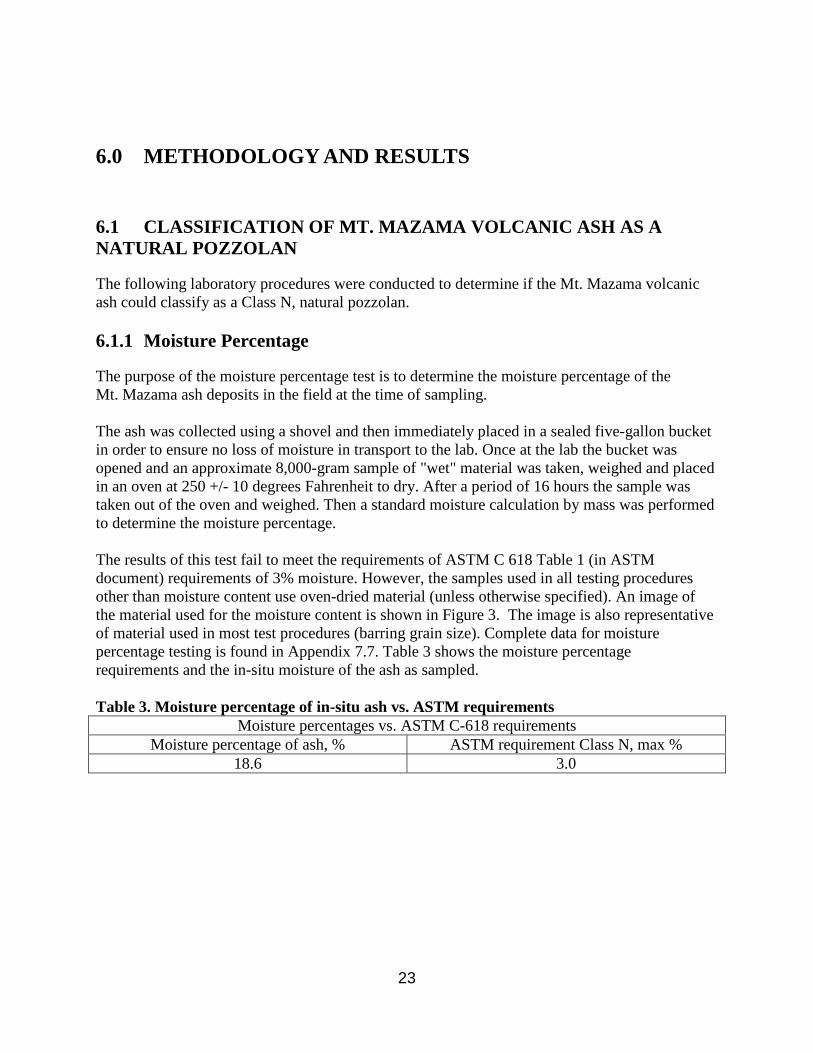
The following laboratory procedures were conducted to determine if the Mt. Mazama volcanic ash could classify as a Class N, natural pozzolan. 6.1.1 Moisture Percentage
The purpose of the moisture percentage test is to determine the moisture percentage of the Mt. Mazama ash deposits in the field at the time of sampling. The ash was collected using a shovel and then immediately placed in a sealed five-gallon bucket in order to ensure no loss of moisture in transport to the lab. Once at the lab the bucket was opened and an approximate 8,000-gram sample of "wet" material was taken, weighed and placed in an oven at 250 +/- 10 degrees Fahrenheit to dry. After a period of 16 hours the sample was taken out of the oven and weighed. Then a standard moisture calculation by mass was performed to determine the moisture percentage. The results of this test fail to meet the requirements of ASTM C 618 Table 1 (in ASTM document) requirements of 3% moisture. However, the samples used in all testing procedures other than moisture content use oven-dried material (unless otherwise specified). An image of the material used for the moisture content is shown in Figure 3. The image is also representative of material used in most test procedures (barring grain size). Complete data for moisture percentage testing is found in Appendix 7.7. Table 3 shows the moisture percentage requirements and the in-situ moisture of the ash as sampled. Table 3. Moisture percentage of in-situ ash vs. ASTM requirements
Moisture percentages vs. ASTM C-618 requirements Moisture percentage of ash, % ASTM requirement Class N, max %
18.6 3.0

24
Figure 3 – Sampled and dried Mt. Mazama ash 6.1.2 Loss on Ignition
The purpose of performing a loss on ignition test on the Mt. Mazama ash is to investigate if it conforms to the ASTM C 618 Table 1 requirements of a maximum loss on ignition of 10% by mass. The methods used for this test conform to ASTM standard C 311 for the testing of natural pozzolans. The specimen was taken from the moisture content sample and was 1.00 grams in weight. It was placed in a ceramic uncovered crucible and heated to 750 degrees Celsius. It was checked for constant mass at 15, 20 and 25 minutes, constant mass being reached at 25 minutes. The results of the loss on ignition test(s) conform to the standards of natural pozzolans in Table 1 of ASTM C 618. There were two tests performed, one at Oregon Tech and another by the accredited lab the sample was sent to for chemical analysis. The tests found a loss of 6% and 2%, respectively, with an average of 4% mass, well below the 10% maximum. Complete data for loss on ignition testing is found in Appendix 7.7 as well as Appendix 7.8. Table 4 shows a comparison between measured loss on ignition and ASTM C-618 requirements. Table 4. Loss on ignition of laboratory test vs. ASTM requirements
Loss on ignition vs. ASTM C-618 requirements Loss on ignition of in laboratory test, % ASTM requirement Class N, max %
6.00 10.0
25
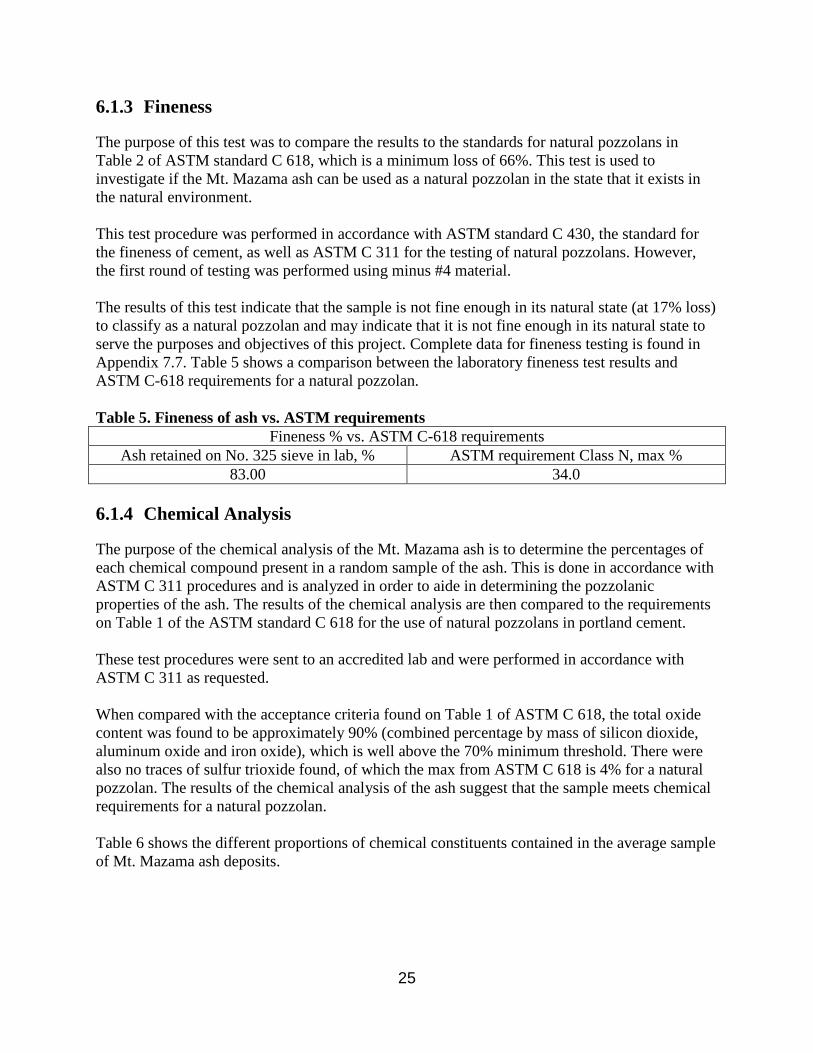
6.1.3 Fineness
The purpose of this test was to compare the results to the standards for natural pozzolans in Table 2 of ASTM standard C 618, which is a minimum loss of 66%. This test is used to investigate if the Mt. Mazama ash can be used as a natural pozzolan in the state that it exists in the natural environment. This test procedure was performed in accordance with ASTM standard C 430, the standard for the fineness of cement, as well as ASTM C 311 for the testing of natural pozzolans. However, the first round of testing was performed using minus #4 material. The results of this test indicate that the sample is not fine enough in its natural state (at 17% loss) to classify as a natural pozzolan and may indicate that it is not fine enough in its natural state to serve the purposes and objectives of this project. Complete data for fineness testing is found in Appendix 7.7. Table 5 shows a comparison between the laboratory fineness test results and ASTM C-618 requirements for a natural pozzolan. Table 5. Fineness of ash vs. ASTM requirements
Fineness % vs. ASTM C-618 requirements Ash retained on No. 325 sieve in lab, % ASTM requirement Class N, max %
83.00 34.0 6.1.4 Chemical Analysis
The purpose of the chemical analysis of the Mt. Mazama ash is to determine the percentages of each chemical compound present in a random sample of the ash. This is done in accordance with ASTM C 311 procedures and is analyzed in order to aide in determining the pozzolanic properties of the ash. The results of the chemical analysis are then compared to the requirements on Table 1 of the ASTM standard C 618 for the use of natural pozzolans in portland cement. These test procedures were sent to an accredited lab and were performed in accordance with ASTM C 311 as requested. When compared with the acceptance criteria found on Table 1 of ASTM C 618, the total oxide content was found to be approximately 90% (combined percentage by mass of silicon dioxide, aluminum oxide and iron oxide), which is well above the 70% minimum threshold. There were also no traces of sulfur trioxide found, of which the max from ASTM C 618 is 4% for a natural pozzolan. The results of the chemical analysis of the ash suggest that the sample meets chemical requirements for a natural pozzolan. Table 6 shows the different proportions of chemical constituents contained in the average sample of Mt. Mazama ash deposits.

26
Table 6. Chemical constituents of Mt. Mazama ash with comparison to ASTM standards for class N and class F pozzolans
Compound Average % ASTM Class N ASTM Class FSiO2 65.81Al2O3 18.75Fe2O3 4.4CaO 3.42MgO 1.45SO3 -0.01 4.00% max 5.00% maxNa2O 3.2K2O 1.98TiO2 0.63P2O5 0.11Mn2O3 0.08Loss on ignition 2.06 10.00% max 6.00%maxTotal Alkali 4.51
N/A
N/A
N/A
70.00% min
6.1.5 Dynamic Chemical Analysis
A dynamic chemical analysis was conducted on mixtures of Mt. Mazama volcanic ash, portland cement and lime. This chemical analysis included mixing these materials in specific proportions, allowing them to hydrate in the laboratory for seven or 28 days, and performing a standard ASTM C144 – Chemical analysis of hydraulic cement procedure on the materials. Performing these analyses had two objectives: 1) to determine if the chemical composition of a mixture of these three materials could be calculated based on proportions mixed by weight and 2) to determine if the chemical compositions changed after seven or 28 days of hydration. Samples were made by placing dry amounts of portland cement, lime or volcanic ash in a non-reactive plastic container with water. Three samples were created for each combination, two samples had water added and a control sample was kept with no water added. Samples were mixed and sealed, one was opened and dried in an oven to remove moisture at seven days of reaction time and the other at 28 days. The samples were then tested using the procedures of ASTM C114. Table 7 shows each dynamic chemical analysis sample created and tested. Using the percentages by weight shown in Table 7, and the chemical compositions of the volcanic ash, lime and portland cement, the expected values of the chemical components of mixed samples can be calculated. These are shown in Table 8, along with the measured chemical compositions from ASTM C114 testing and the difference between the measured and expected. Differences between measured and expected values are observed in a few instances. There was a significant difference between measured and expected values in samples B-1, B2-7 and B2-28 in the amounts of silica, calcium and magnesium oxides. Because this difference is similar in all three samples, and sample B-1 had no mixing water so no reaction likely took place, it is unclear

27
why this difference exists. Another large difference between measured and expected values is observed in samples C3-7 and C3-28. Similar to the differences observed in B-1, B2-7 and B2-28, these samples had large proportions of lime. It is unclear why significant differences between measured and expected chemical compositions are present when lime is introduced into the material. This testing clearly shows that chemical composition, by component, is not changed with seven and 28 days of hydration. Chemical proportions of mixes with Mt. Mazama volcanic ash and portland cement can be readily calculated based on percentages of dry weight. When lime is introduced into a potential mix, unanticipated chemical compositions are observed.

28
Table 7. Mix composition by percentage of component and cure time before drying
Bagged Sample name% Volcanic
ash% Portland
cement % Lime
Yes A1 60 40 0
Yes A2-7 60 40 0
Yes A2-28 60 40 0
Yes A3-7 0 100 0
Yes A3-28 0 100 0
Yes B1 60 0 40
Yes B2-7 60 0 40
Yes B2-28 60 0 40
Yes B3-7 0 0 100
Yes B3-28 0 0 100
Yes C1 60 20 20
Yes C2-7 60 20 20
Yes C2-28 60 20 20
Yes C3-7 0 50 50
Yes C3-28 0 50 50
30g pozzolan + 10g portland cement + 10g lime, 250g water, cured for 28 days before being placed
in oven to remove excess moisture.10g portland cement + 10g lime, 125g water, cured
for seven days before being placed in oven to remove excess moisture.
10g portland Cement + 10g lime, 125g water, cured for 28 days before being placed in oven to remove
excess moisture.
Description
30g pozzolan + 20g lime, 250g water, cured for seven days before being placed in oven to remove
excess moisture.30g pozzolan + 20g lime, 250g water, cured for 28 days before being placed in oven to remove excess
moisture.20g lime, 125g water, cured for seven days before being placed in oven to remove excess moisture.20g lime, 125g water, cured for 28 days before being placed in oven to remove excess moisture.
30g pozzolan + 10g portland cement + 10g lime, no water.
30g pozzolan + 10g portland cement + 10g lime, 250g water, cured for seven days before being
placed in oven to remove excess moisture.
30g pozzolan + 20g portland cement, no water.30g Pozzolan + 20g Portland Cement, 250g water, cured for seven days before being placed in oven to
remove excess moisture.30g pozzolan + 20g portland cement, 250g water, cured for 28 days before being placed in oven to
remove excess moisture.20g portland cement, 125g water, cured for seven7 days before being placed in oven to remove excess
moisture.20g portland cement, 125g water, cured for 28
days before being placed in oven to remove excess moisture.
30g pozzolan + 20g lime, no water.

29
Table 8. Results of the dynamic chemical testing
Compound A1 A2-7 A2-28 B1 B2-7 B2-28 C1 C2-7 C2-28 C3-7 C3-28SiO2 48.12 48.29 49.12 45.36 46.40 47.12 46.74 47.12 47.65 12.11 12.01Al2O3 13.19 13.82 13.34 12.79 13.10 13.31 12.97 14.00 13.15 2.94 2.95Fe2O3 3.78 3.79 3.96 2.66 2.68 2.78 3.21 3.21 3.35 2.19 2.19CaO 27.48 26.67 25.60 20.56 19.16 18.37 24.05 23.22 22.94 62.24 60.27MgO 1.33 1.33 1.38 13.70 12.90 12.11 7.27 6.49 5.89 17.55 16.91SO3 1.12 1.09 0.99 0.12 0.16 0.18 0.65 0.70 0.72 1.83 1.80
Na2O 1.75 0.18 1.74 1.96 2.01 2.09 1.84 1.83 1.87 0.18 0.23K2O 1.53 1.46 1.43 1.52 1.53 1.55 1.54 1.49 1.48 0.11 0.05TiO2 0.47 0.48 0.49 0.42 0.42 0.43 0.45 0.44 0.46 0.17 0.17P2O5 0.13 0.13 0.13 0.11 0.10 0.11 0.12 0.12 0.12 0.10 0.10
Mn2O3 0.10 0.10 0.09 0.05 0.05 0.05 0.07 0.08 0.08 0.09 0.09Loss on Ignition 4.20 12.94 12.20 20.63 18.81 17.70 10.67 14.91 14.10 32.51 28.05
Total Alkali 2.76 2.71 2.68 2.96 3.02 3.11 2.85 2.81 2.84 0.25 0.26
Compound A1 A2-7 A2-28 B1 B2-7 B2-28 C1 C2-7 C2-28 C3-7 C3-28SiO2 47.73 47.73 47.73 39.58 39.58 39.58 43.65 43.65 43.65 20.60 20.60
Al2O3 13.59 13.59 13.59 11.31 11.31 11.31 12.45 12.45 12.45 5.82 5.82Fe2O3 4.07 4.07 4.07 2.69 2.69 2.69 3.38 3.38 3.38 3.57 3.57CaO 27.06 27.06 27.06 25.18 25.18 25.18 26.12 26.12 26.12 62.52 62.52MgO 1.69 1.69 1.69 16.48 16.48 16.48 9.08 9.08 9.08 2.04 2.04SO3 1.06 1.06 1.06 0.15 0.15 0.15 0.60 0.60 0.60 2.67 2.67
Na2O 1.99 1.99 1.99 1.99 1.99 1.99 1.99 1.99 1.99 0.16 0.16K2O 1.27 1.27 1.27 1.18 1.18 1.18 1.22 1.22 1.22 0.19 0.19TiO2 0.98 0.98 0.98 0.38 0.38 0.38 0.68 0.68 0.68 1.50 1.50P2O5 0.12 0.12 0.12 0.09 0.09 0.09 0.10 0.10 0.10 0.13 0.13
Mn2O3 0.11 0.11 0.11 0.06 0.06 0.06 0.08 0.08 0.08 0.14 0.14Loss on Ignition 9.06 9.06 9.06 18.76 18.76 18.76 13.91 13.91 13.91 19.57 19.57
Total Alkali 2.83 2.83 2.83 2.77 2.77 2.77 2.80 2.80 2.80 0.29 0.29
Compound A1 A2-7 A2-28 B1 B2-7 B2-28 C1 C2-7 C2-28 C3-7 C3-28SiO2 0.39 0.56 1.39 5.78 6.82 7.54 3.09 3.47 4.00 -8.49 -8.59Al2O3 -0.40 0.23 -0.25 1.48 1.79 2.00 0.52 1.55 0.70 -2.88 -2.87Fe2O3 -0.29 -0.27 -0.11 -0.03 -0.01 0.09 -0.17 -0.17 -0.03 -1.38 -1.38CaO 0.42 -0.39 -1.46 -4.62 -6.02 -6.81 -2.07 -2.90 -3.18 -0.27 -2.25MgO -0.36 -0.36 -0.31 -2.78 -3.58 -4.37 -1.81 -2.59 -3.19 15.52 14.88SO3 0.06 0.03 -0.07 -0.03 0.01 0.03 0.05 0.10 0.12 -0.84 -0.87
Na2O -0.23 -1.81 -0.25 -0.04 0.02 0.09 -0.15 -0.16 -0.12 0.02 0.07K2O 0.26 0.19 0.16 0.35 0.35 0.38 0.32 0.27 0.26 -0.08 -0.15TiO2 -0.51 -0.50 -0.49 0.04 0.04 0.05 -0.23 -0.24 -0.22 -1.33 -1.33P2O5 0.01 0.00 0.01 0.02 0.02 0.02 0.02 0.02 0.01 -0.03 -0.03
Mn2O3 -0.01 -0.01 -0.02 -0.01 -0.01 0.00 -0.01 0.00 0.00 -0.05 -0.05Loss on Ignition -4.86 3.88 3.14 1.87 0.05 -1.06 -3.24 1.00 0.19 12.95 8.49
Total Alkali -0.07 -0.12 -0.15 0.18 0.24 0.33 0.05 0.01 0.04 -0.03 -0.02
Measured Values from ASTM C114 Testing
Expected Values from Proportions Mixed by Weight
Measured - Expected Values

30
6.2 MODIFIED SAI TESTING
Strength activity index (SAI) testing, including conventional testing following ASTM C311 and modified ASTM C311, was conducted. The SAI testing was performed to determine the pozzolanic properties of the Mt. Mazama volcanic ash. The function of a natural pozzolan when used in portland cement concrete is to react with one of the weaker chemical compounds formed in the hydration reaction, calcium carbonate, and form more cementitious material that is stronger, therefore improving the concrete’s overall strength. By comparing the compressive strength of mortar cubes mixed with ash deposited from Mt. Mazama to standard mortar cubes, this test aims to indirectly measure the ability of the ash to react with calcium carbonate and create more cementitious material with the ability to bind smaller particles together. The SAI testing was completed in three trials as shown in Table 9 to Table 12. Table 9. Strength activity index testing trials
Strength activity index testing trial
Description
#1 Standard ASTM C311 testing, with Mt. Mazama ash passing the No. 4 sieve. Modified ASTM C311 testing by increasing
percentage of Mt. Mazama ash from 0 – 90%.
#2 Modified ASTM C311 testing, introducing lime (CaO) into the mortar cubes
#3 Modified ASTM C311 testing, using crushed Mt. Mazama ash passing the No. 200 sieve
Table 10. Mix components for trial 1 SAI testing
Table 11. Mix components for trial 2 SAI testing

31
Table 12. Mix components for trial 3 SAI testing
The first trial of SAI testing was performed using grain sizes of proposed pozzolan passing the No. 4 sieve. The second trial of testing using ASTM C 311 as a guide substitutes more of the cement weight with hydrated lime in order to directly expose the ash to the byproducts of the hydration reaction. The third trial of SAI testing was done using ash material passing the No. 200 sieve. The third round also included testing for extended periods of curing out to 42, 56, 70 and 84 days. Each SAI test used ASTM C 109 for mixing and preparing specimens. All specimens were made within a standard six-specimen mold compliant with ASTM standard C 109 using ASTM standard graded sand. Each material to be added was weighed in a separate bowl and then all were added to a mixing bowl in order to ensure correct amounts. Then all were thoroughly mixed and compacted in accordance with ASTM C 109. The cubes were then placed in a water bath at a temperature of 73.5 +/- 3.5 degrees Fahrenheit. Trail 1 sample compositions (Table 10) included a standard cube set made using 500 grams of cement in the variant portion (S-0). Then a specimen was made in accordance with ASTM C 311 with 400 grams of cement and 100 grams of volcanic ash in the variant portion (S-1). After these specimens were made, another 10 samples were made increasing the percentage of ash and decreasing the percentage of cement in order to investigate how decreasing portland cement content affects strength (S-2 through S-12). In trial 2 lime was the variable that was increased and the cement decreased while the ash percentage remained constant (Table 11). The third trial of SAI testing was done using some of the same percentage variants as the first round (20%, 30% and 40% by mass of mix material) (Table 12). These samples, however, were constructed using crushed volcanic ash that passed the No. 200 sieve. Trial 1 and 2 samples were tested in unconfined compression at seven and 28 days of curing. Trial 3 was tested at seven, 28, 42, 70 and 84 days of curing to study the effects of time on compressive strength.

32
Conventional SAI testing following ASTM C311 compares the strength of samples S-0 in trial 1 at seven and 28 strengths, to samples S-1 and SC-1 in trials 1 and 3. This is shown in Figure 4 and Figure 5. Samples S-1, which were only passed through the No. 4 sieve, do not meet SAI criteria of 75% of control strength. When the volcanic ash is crushed and passed through the No. 200 sieve, it appears to meet SAI criteria of 75% strength of control. There was variability of control strength of samples S-0 and further testing is necessary to confirm 75% SAI criteria.
0500
10001500200025003000350040004500
Com
pres
sive
Stre
ngth
(ps
i)
7 Day Strengths
S-0 Average Control
S-1 Uncrushed
SC - 1 Crushed
Figure 4 – Comparison of control (S-0) and S-1, SC-1 at seven days of curing
0
1000
2000
3000
4000
5000
6000
Com
pres
sive
Stre
ngth
(ps
i)
28 Day Strengths
S-0 Average Control
S-1 Uncrushed
SC - 1 Crushed
Figure 5 – Comparison of control (S-0) and S-1, SC-1 at 28 days of curing Compressive strengths of the modified SAI testing of trial 1 is shown in Figure 6 and Figure 7. These modified tests increased the percentage of volcanic ash to portland cement from 0 to 90%. As shown in the figures of results, significant decrease in unconfined compressive strength is not

33
observed until samples S-6 and S-7, which represent a percentage of volcanic ash of 30 and 40%, respectively. This testing suggests that replacing portland cement with Mt. Mazama volcanic ash from 20% to 30% does not cause a significant effect on compressive strength.
3625
2425 2425 2433 24362134 2226
1432983
607285
64 650
5001000150020002500300035004000
S-0 S-1 S-2 S-3 S-4 S-5 S-6 S-7 S-8 S-9 S-10 S-11 S-12
Cop
mre
ssiv
e St
reng
th (
psi)
Sample
7-Day Compressive Strength (Trial 1)
Figure 6 – Trial 1 strength values at seven days of curing
5653
3734 3573 37863260 2993 3297
19531290
710324 194 74
0
1000
2000
3000
4000
5000
6000
S-0 S-1 S-2 S-3 S-4 S-5 S-6 S-7 S-8 S-9 S-10 S-11 S-12
Com
pres
sive
Stre
ngth
(ps
i)
Sample
28-Day Compressive Strength (Trial 1)
Figure 7 – Trial 1 strength values at 28 days of curing The second trial of SAI testing was conducted to observe the effects of limited portland cement on mortar cube strength. These samples also introduced lime into the mortar cube mix to supply the necessary components for a pozzolanic reaction. As shown in Figure 8 and Figure 9, samples

34
were tested at considerably low strengths, indicating that portland cement is necessary to realize strength. Sample S-12 from trial 1 had the same amount of portland cement as samples SL 1-4 at 50 grams per sample. When comparing the strength of sample S-12 to samples SL 1-4 (Figure 10), it is clear that lime does increase compressive strength of mortar cubes with volcanic ash.
S-0, 4127
SL-1, 100 SL-2, 123 SL-3, 120 SL-4, 115 SL-5, 1000
500
1000
1500
2000
2500
3000
3500
4000
4500
Com
pres
sive
Stre
ngth
(ps
i)
7-Day Compressive Strength Trial 2
Figure 8 – Compressive strengths at seven days of curing, trial 2
S-0, 5408
SL-1, 117 SL-2, 200 SL-3, 249 SL-4, 207 SL-5, 1830
1000
2000
3000
4000
5000
6000
Com
pres
sive
Stre
ngth
(ps
i)
Samples
Average 28-Day Breaks Trial 2
Figure 9 – Compressive strengths at 28 days of curing, trial 2

35
SL 1-4 Average 7-Day, 112
S-12 7-Day, 65
SL 1-4 Average 28-Day, 191
S-12 28-Day, 74
0
50
100
150
200
250
Com
pres
sive
Stre
ngth
(ps
i)
Figure 10 – Comparison of samples with lime (SL samples) with S-12 from trial 1 Based on the results of trial 1, it was hypothesized that reducing the grain size and therefore increasing the surface area for chemical reaction would increase the pozzolanic reaction of the ash and give it a greater probability of reaching 75% of the control sample strength. Trial 3 of testing included crushed volcanic ash samples that passed the No. 200 sieve prior to creation of the mortar cubes. The proportions of these samples are shown in Table 12. As shown in Figure 4 and Figure 5 discussed previously, the mortar cubes with crushed volcanic ash had higher measured strengths than uncrushed samples. Trial samples S-6 and S-7 have the same composition as SC-2 and SC-3, respectively, from trial 3; the only difference being that trial 3 had crushed volcanic ash. As show in Figure 11 and Figure 12, crushed volcanic ash had higher strengths at all tested percentages and days of curing with the exception of S-6 and SC-2 at 28 days.

36
Trial 1 S-1, 2425
Trial 3 SC-1, 3856
Trial 1 S-6, 2226
Trial 3 SC-2, 2629
Trial 1 S-7, 1432Trial 3 SC-3, 1583
0
500
1000
1500
2000
2500
3000
3500
4000
4500C
ompr
essiv
e St
reng
th (
psi)
7 Day Strengths
Figure 11 – Comparison of uncrushed (S-1, S-6 and S-7) strengths and crushed strengths (SC-1, SC-2, SC-3) at seven days of curing
Trial 1 S-1, 3734
Trial 3 SC-1, 4483
Trial 1 S-6, 3297
Trial 3 SC-2, 2952
Trial 1 S-7, 1953
Trial 3 SC-3, 1967
0
500
1000
1500
2000
2500
3000
3500
4000
4500
5000
Com
pres
sive
Stre
ngth
(ps
i)
28 Day Strengths
Figure 12 – Comparison of uncrushed (S-1, S-6 and S-7) strengths and crushed strengths (SC-1, SC-2, SC-3) at 28 days of curing Trial 3 mortar cube specimens were tested at seven, 28, 42, 56, 70 and 84 days of curing to see if the crushed volcanic ash would display a slow increase in strength. As shown in Figure 13, notable increases in strength are seen between all times measured, up to 84 days.
37
1000
1500
2000
2500
3000
3500
4000
4500
5000
5500
6000
0 10 20 30 40 50 60 70 80 90
Com
pres
sive
Stre
ngth
(ps
i)
Days of Curing
SC-1
SC-2
SC-3
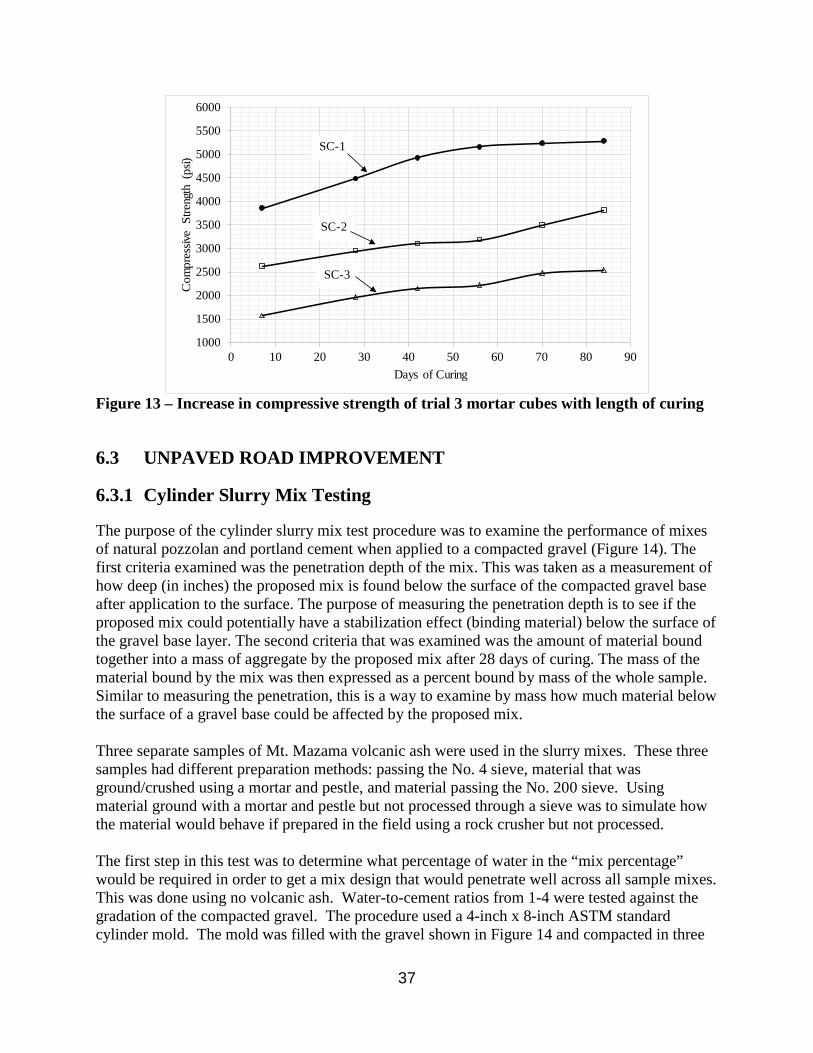
Figure 13 – Increase in compressive strength of trial 3 mortar cubes with length of curing
6.3 UNPAVED ROAD IMPROVEMENT
6.3.1 Cylinder Slurry Mix Testing
The purpose of the cylinder slurry mix test procedure was to examine the performance of mixes of natural pozzolan and portland cement when applied to a compacted gravel (Figure 14). The first criteria examined was the penetration depth of the mix. This was taken as a measurement of how deep (in inches) the proposed mix is found below the surface of the compacted gravel base after application to the surface. The purpose of measuring the penetration depth is to see if the proposed mix could potentially have a stabilization effect (binding material) below the surface of the gravel base layer. The second criteria that was examined was the amount of material bound together into a mass of aggregate by the proposed mix after 28 days of curing. The mass of the material bound by the mix was then expressed as a percent bound by mass of the whole sample. Similar to measuring the penetration, this is a way to examine by mass how much material below the surface of a gravel base could be affected by the proposed mix. Three separate samples of Mt. Mazama volcanic ash were used in the slurry mixes. These three samples had different preparation methods: passing the No. 4 sieve, material that was ground/crushed using a mortar and pestle, and material passing the No. 200 sieve. Using material ground with a mortar and pestle but not processed through a sieve was to simulate how the material would behave if prepared in the field using a rock crusher but not processed. The first step in this test was to determine what percentage of water in the “mix percentage” would be required in order to get a mix design that would penetrate well across all sample mixes. This was done using no volcanic ash. Water-to-cement ratios from 1-4 were tested against the gradation of the compacted gravel. The procedure used a 4-inch x 8-inch ASTM standard cylinder mold. The mold was filled with the gravel shown in Figure 14 and compacted in three

38
equal lifts, rodded 25 times per lift using a 3/8=inch diameter steel rod. After the material was rodded and in place, the portland cement mix (Table 13) was applied to the top of the sample. The samples were then sealed to prevent moisture loss and allowed to cure for 28 days. After 28 days, the samples were removed from the testing cylinders and the depth of penetration and percent of bound material were recorded. Testing indicated that a w/c ratio of 1.5 would provide a mix with a viscosity that would penetrate the compacted gravel (Figure 14) sample.
0.010.020.030.040.050.060.070.080.090.0
100.0
110100
Perc
ent p
assin
g (%
)
Grain size (mm)
Figure 14 – Gradation of gravel samples tested with mixtures of portland cement and volcanic ash Table 13. W/c ratio test samples
CSW1 N/A N/A N/A N/ACSW2 809.1 2312.6 5 35.0CSW3 749.1 1808.2 4 41.4CSW4 1204.3 2437.4 7 49.4CSW5 660.5 2340.0 4 28.2CSW6 72.4 2388.2 1 3.0CSW7 N/A 2291.6 N/A N/A4
23
21
1.21.5
% of total weight bound
Optimum Water Test SamplesWeight of bound
portion (g)Penetration depth (in)
Total weight (g)
Sample w/c

39
0.0
10.0
20.0
30.0
40.0
50.0
60.0
0 0.5 1 1.5 2 2.5 3 3.5
Perc
ent o
f bou
nd m
ater
ial
(%)
w/c ratio
Figure 15 – W/c ratio tests conducted on the compacted gravel samples indicating a w/c ratio of 1.5 to be ideal for binding the most material The second step in this test was to perform the procedure using the three different grain sizes of volcanic ash. The procedure was the same as that from the mix water and used a 4-inch x 8-inch ASTM standard cylinder mold. The mold was filled with gravel (Figure 14), compacted in three equal lifts and rodded 25 times per lift using a 3/8-inch diameter steel rod. After the material was rodded and in place, the concrete/volcanic ash mix was applied as shown in Table 14. Percentages of ash present in the mixture ranged from 50% of the solid portion (40% of mix remaining by mass after 60% water is accounted for) to 90% of the solid portion at 10% increments. The samples were then sealed to prevent moisture loss and allowed to cure for 28 days.

40
Table 14. Cylinder sample testing of portland cement replaced with volcanic ash
CS4.1 1.5 50 657.1 2178.6 4.0 30.2CS4.2 1.5 60 689.6 2306.9 3.3 29.9CS4.3 1.5 70 266.1 2270.5 2.0 11.7CS4.4 1.5 80 152.8 2258.6 1.5 6.8CS4.5 1.5 90 0 2312.6 0.0 0.0
CSC1 1.5 50 488.3 2454.8 3.0 19.9CSC2 1.5 60 1056.6 2127.1 5.5 49.7CSC3 1.5 70 646.5 2361.2 4.0 27.4CSC4 1.5 80 356.4 2247.6 3.5 15.9CSC5 1.5 90 137.2 2279.4 1.5 6.0
SC200.1 1.5 50 865.7 2251.9 6.0 38.4SC200.2 1.5 60 1358.9 2261.3 6.5 60.1SC200.3 1.5 70 1034 2167 6.5 47.7SC200.4 1.5 80 855.5 2281.1 4.5 37.5SC200.5 1.5 90 780.5 2212.4 4.5 35.3
Samples using pozzolan passing No.4 sieve
Sample w/c Weight of bound portion (g)
Total weight (g)
Penetration depth (in)
% of total weight bound
% of cement replaced with volcanic ash
Samples using crushed pozzolan
Sample w/c % of cement replaced with volcanic ash
Weight of bound portion (g)
Total weight (g)
Penetration depth (in)
% of total weight bound
Samples using pozzolan crushed and passing No.200
Sample w/c % of cement replaced with volcanic ash
Weight of bound portion (g)
Total weight (g)
Penetration depth (in)
% of total weight bound
After the 28-day curing period, the samples were examined. Each sample was carefully extracted from the mold. The bound portion of aggregate was measured longitudinally and this length was recorded as the penetration depth in inches. The bound portion was then weighed and the mass in grams of the bound portion was divided by the total mass of aggregate/mix sample in grams. This value was then recorded as the percentage of total weight bound by the mix. Figure 16 and Figure 17 show a sample being measured for the bound portion.
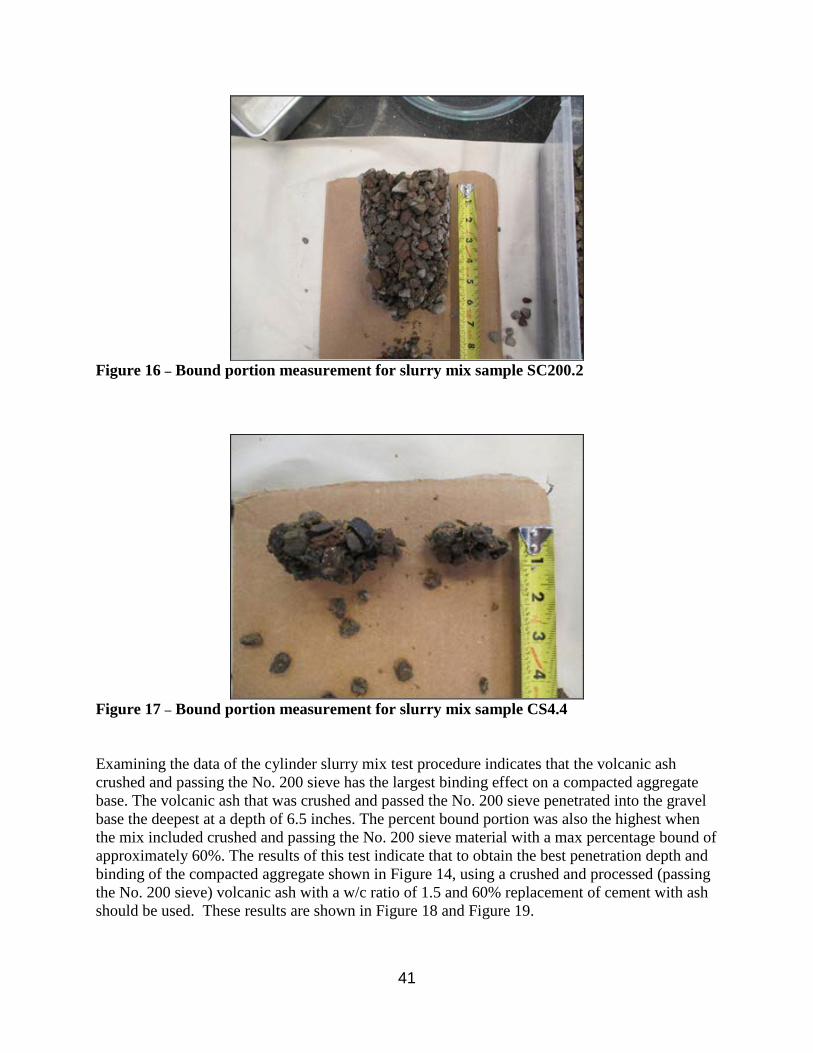
41
Figure 16 – Bound portion measurement for slurry mix sample SC200.2
Figure 17 – Bound portion measurement for slurry mix sample CS4.4 Examining the data of the cylinder slurry mix test procedure indicates that the volcanic ash crushed and passing the No. 200 sieve has the largest binding effect on a compacted aggregate base. The volcanic ash that was crushed and passed the No. 200 sieve penetrated into the gravel base the deepest at a depth of 6.5 inches. The percent bound portion was also the highest when the mix included crushed and passing the No. 200 sieve material with a max percentage bound of approximately 60%. The results of this test indicate that to obtain the best penetration depth and binding of the compacted aggregate shown in Figure 14, using a crushed and processed (passing the No. 200 sieve) volcanic ash with a w/c ratio of 1.5 and 60% replacement of cement with ash should be used. These results are shown in Figure 18 and Figure 19.
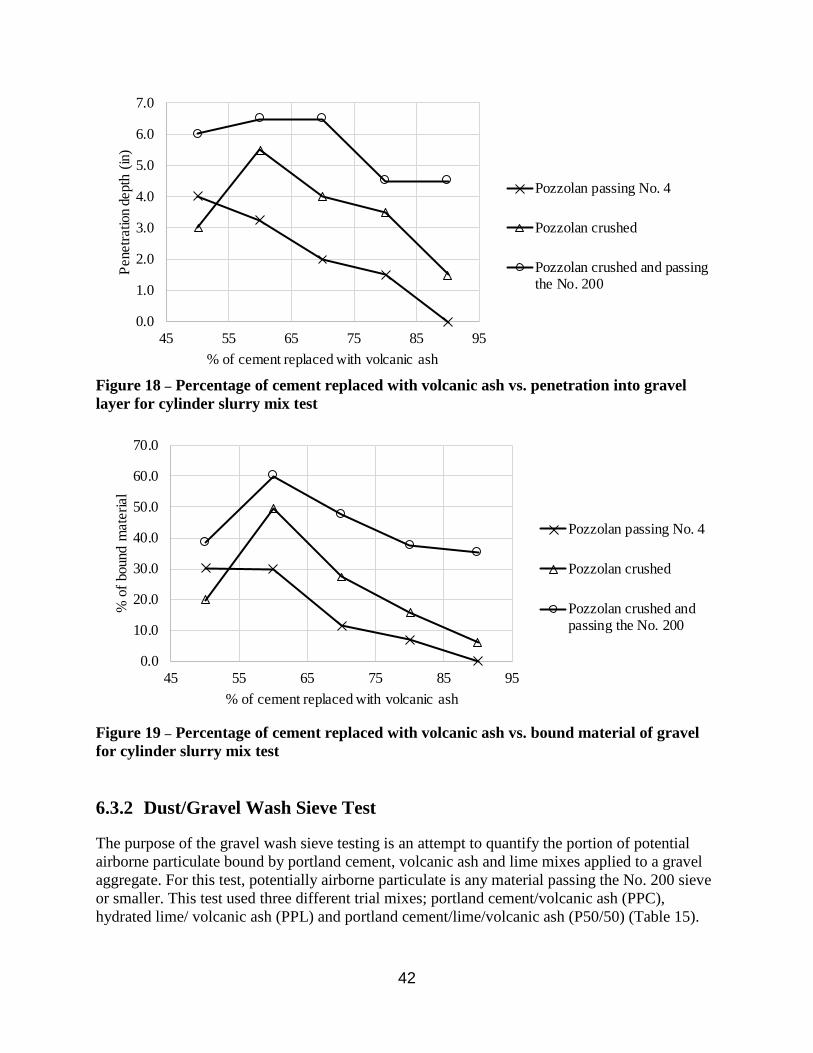
42
0.0
1.0
2.0
3.0
4.0
5.0
6.0
7.0
45 55 65 75 85 95
Pene
tratio
n de
pth
(in)
% of cement replaced with volcanic ash
Pozzolan passing No. 4
Pozzolan crushed
Pozzolan crushed and passingthe No. 200
Figure 18 – Percentage of cement replaced with volcanic ash vs. penetration into gravel layer for cylinder slurry mix test
0.0
10.0
20.0
30.0
40.0
50.0
60.0
70.0
45 55 65 75 85 95
% o
f bou
nd m
ater
ial
% of cement replaced with volcanic ash
Pozzolan passing No. 4
Pozzolan crushed
Pozzolan crushed andpassing the No. 200
Figure 19 – Percentage of cement replaced with volcanic ash vs. bound material of gravel for cylinder slurry mix test
6.3.2 Dust/Gravel Wash Sieve Test
The purpose of the gravel wash sieve testing is an attempt to quantify the portion of potential airborne particulate bound by portland cement, volcanic ash and lime mixes applied to a gravel aggregate. For this test, potentially airborne particulate is any material passing the No. 200 sieve or smaller. This test used three different trial mixes; portland cement/volcanic ash (PPC), hydrated lime/ volcanic ash (PPL) and portland cement/lime/volcanic ash (P50/50) (Table 15).

43
From the results of the cylinder slurry mixes it was determined that the percentage of volcanic ash should be 60% of the solid mass of the mix to bind the largest proportion of gravel. Table 15. Trial mixes for potential dust abatement
Mix Volcanic ash (g) Portland cement (g) Lime (g) Water (g) Gravel (g)PPC1 18 12 0 45 1500PPC2 18 12 0 45 1500PPC3 18 12 0 45 1500PPL1 18 0 12 45 1500PPL2 18 0 12 45 1500PPL3 18 0 12 45 1500
P50/50.1 18 6 6 45 1500P50/50.2 18 6 6 45 1500P50/50.3 18 6 6 45 1500
A set of four control samples, with the addition of no potential binder, were tested with ASTM C117 - wash sieve procedure. Each control sample was approximately 1,800 grams of gravel (Figure 14). After the gravel was oven-dried, the material was washed through a No.200 sieve and the percentage loss of mass was recorded. For the test mix design samples, each mix was added to approximately 1,500 grams (dry weight) of the gravel. The mix was added to the aggregate and mixed thoroughly in a mixing bowl. After the mix and aggregate were effectively combined, the material was placed, uncompacted, in a 4-inch x 8-inch standard ASTM cylinder mold. Each sample was then sealed inside its respective mold in order to ensure no moisture loss and left to cure. After a period of seven days the first samples were unsealed and tested. First the samples were dried to constant mass in a drying oven. After the samples were dried they were then weighed, mass recorded and washed over the No. 200 sieve, then dried again to constant mass in a drying oven. After the washed sample was dried, its mass was recorded and compared to the mass before wash; the difference in percentage of material before wash was then recorded as the percentage loss of the respective mix. The same procedure was followed for 28-day samples. The four control samples tested averaged a percentage loss of 4.1%. The seven-day specimens had an average percentage loss of 2.5% for all three mix designs. This indicates that by adding any of the mix combinations, the percentage of potentially airborne particulate is decreased. Of the three seven-day samples tested, the one that bound the most material was the P50/50 mix, with percentage finer than the No. 200 sieve of 0.9%, which would suggest that a combination of lime and cement with the natural ash is potentially the most efficient way to bind potentially airborne particulate. Results of the seven-day tests are shown in Figure 20.

44
0.00.51.01.52.02.53.03.54.04.5
PPC1 PPL1 P50/50 Control
Perc
ent f
iner
than
No.
200
siev
e
Sample Figure 20 – Wash No. 200 sieve results for seven-day cure tests The results from the 28-day samples are similar to the seven-day testing. All tested mix designs for binders reduced the percentage of potentially airborne particulate compared to the control sample (Figure 21). Minus No. 200 sieve material is considered by the EPA to be an airborne particulate classified as PM10. This data indicates that the mixes are capable of reducing PM10 by up to 85% for this gravel material. Complete data for gravel wash sieve comparisons is found in Appendix 7.5.
0.00.51.01.52.02.53.03.54.04.5
PPC PPL P50/50 Control
Perc
ent f
iner
than
No.
200
siev
e
Sample
Figure 21 – Wash No. 200 sieve results for 28-day cure tests
45
6.4 ORGANIC SOIL IMPROVEMENT
The purpose of organic soil improvement testing was to investigate the potential for soil improvement when introducing Mt. Mazama volcanic ash. In particular, the unconfined compressive strength of highly organic soil, mixed with various percentages of Mt. Mazama ash, was measured. The research also included a review of the Sleep et al. 2018 data, with comparisons to published values of unconfined compressive strength of soil mixed with volcanic ash. An attempt was made to determine if strength would be improved with the addition of Mt. Mazama ash. Many unpaved roadways in the Klamath Basin, including the access road at the Wood River Wetland (the location where soil samples were taken for this study), are comprised of highly compressible, organic soils. A description of the access road where soil samples were taken for improvement is described in detail in Sleep et al. (2018) and Millar (2016). The soil is highly organic, with contents ranging from 49% to 76%, and compresses significantly under load. Mt. Mazama volcanic ash is a more sustainable material than common soil mixing additives such as portland cement or lime. A description of the sustainability benefits of using Mt. Mazama volcanic ash in place of portland cement are described in Section 6.3. As part of the Sleep et al. study, soil additives were mixed with the highly organic soil from the Wood River Wetland access road at 5, 10 and 15% replacement. In that study, Mt. Mazama volcanic ash, portland cement, fly ash and lime were used as soil additives. The Mt. Mazama ash used in the Sleep et al. study was collected from Site ‘A’ in Figure 2. Soil samples were mixed with the soil additives at the standard proctor optimum moisture content and compacted in the Harvard miniature apparatus. They were then tested in unconfined compression. Here a review of the Sleep et al. data is provided, with extensive comparison to data published by others. Shown in Table 16 are the chemical compositions of volcanic ash used in other soil mixing studies compared to the Mt. Mazama volcanic ash. The four studies shown in Table 16 all mixed various percentages of volcanic ash with soils and tested them in unconfined compression, similar to the Sleep et al. 2018 study and this study. Table 16. Chemical composition of Mt. Mazama volcanic ash compared to the ash from other studies

46
Compound % Compound % Compound % Compound %SiO2 46.4 SiO2 63.4 SiO2 59.3 SiO2 65.8
Al2O3 17.5 Al2O3 16.7 Al2O3 17.5 Al2O3 18.8
Fe2O3 9.69 Fe2O3 6.5 Fe2O3 7.1 Fe2O3 4.4CaO 9.9 CaO 2.5 CaO 6.1 CaO 3.42MgO 2.42 MgO 2.15 MgO 2.6 MgO 1.45SO3 0.83 SO3 NA SO3 0.7 SO3 0
Na2O 3.3 Na2O 3.4 Na2O 3.8 Na2O 3.2
K2O 1.51 K2O 5.35 K2O 2 K2O 1.98
TiO2 2.1 TiO2 NA TiO2 NA TiO2 0.63
P2O5 0.8 P2O5 NA P2O5 NA P2O5 0.11
Mn2O3 NA Mn2O3 NA Mn2O3 NA Mn2O3 0.08Loss On Ignition 5.34 Loss On Ignition 5.34 Loss On Ignition 1 Loss On Ignition 2.1
Harichane et al. 2012 Cimen et al. 2015 Hossain and Easa 2006 Mt. Mazama Ash
Shown in Figure 22 is data from Harichane et al. (2012). In that study, a CH and CL material were mixed with both volcanic ash and lime. Specimens were compacted using standard proctor compaction energy and tested in unconfined compression. The study indicated that volcanic ash had little appreciable effect on unconfined compressive strength. Table 17 shows calculated increases in strength from the volcanic ash and lime mixtures from seven to 28 days. Very little strength increase is seen in the volcanic ash mixed samples, at 21% and 4% for the CH and CL materials, respectively, but significant increase is seen in the lime mixed samples. When compared to the Sleep et al. 2018 study, as shown in Table 17 and Figure 23, no appreciable increase in unconfined compressive strength is shown when Wood River Wetland organic soils are mixed with volcanic ash or lime.

47
0
0.5
1
1.5
2
2.5
3
3.5
4
0 20 40 60 80 100
Unc
onfin
ed C
ompr
essiv
e St
reng
th (
MPa
)
Curing (days)
Harichane 10% Ash Replacement CHHarichane 4% Lime CHHarichane 8% Lime CHHarichane 10% Lime CHHarichane 10% Ash Replacement CLHarichane 4% Lime CLHarichane 8% Lime CLHarichane 10% Lime CL
Figure 22 – Compilation of Harichane et al. (2012) soil mixing data for CH and CL soils replaced with lime and volcanic ash

48
0
0.2
0.4
0.6
0.8
1
1.2
0 5 10 15 20 25 30
Unc
onfin
ed C
ompr
essiv
e St
reng
th (
MPa
)
Curing (days)
Harichane 10% Ash Replacement CHHarichane 4% Lime CHHarichane 8% Lime CHHarichane 10% Lime CHHarichane 10% Ash Replacement CLHarichane 4% Lime CLHarichane 8% Lime CLHarichane 10% Lime CLSleep 2018 5% Lime OrganicSleep 2018 10% Ash OrganicSleep 2018 15% Lime Organic
Figure 23 – Comparison of Harichane et al. 2012 data with Sleep et al. 2018 data Table 17. Comparison of percentage increase in compressive strength between Harichane et al. 2012 and Sleep et al. 2018 data
Soil Replacement
(%) Days
Percent Difference in Unconfined
Compressive Strength – Haricahne et al. 2012
Percent Difference in Unconfined Compressive
Strength – Sleep et al. 2018
CH 10% Ash 7-28 21% -31% 4% Lime 7-28 110% 8% Lime 7-28 98% 10% Lime 7-28 108% -1%
CL 10% Ash 7-28 4% -31% 4% Lime 7-28 41% 8% Lime 7-28 64% 10% Lime 7-28 31% -1%
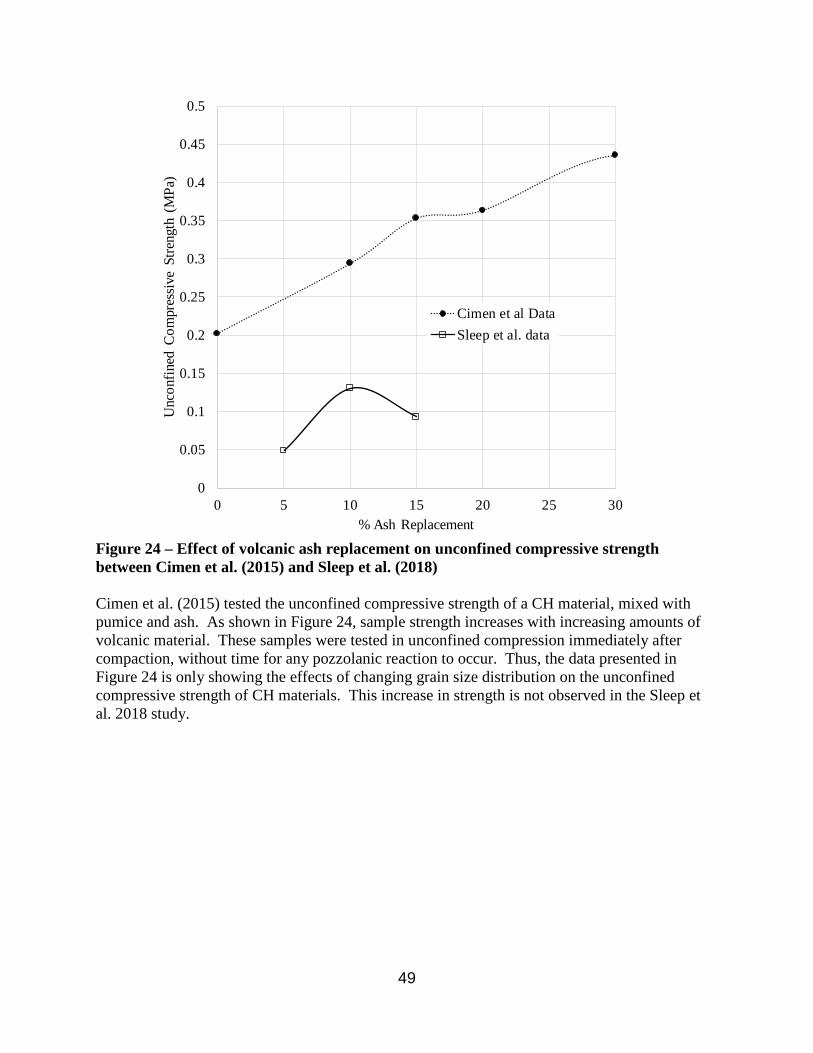
49
0
0.05
0.1
0.15
0.2
0.25
0.3
0.35
0.4
0.45
0.5
0 5 10 15 20 25 30
Unc
onfin
ed C
ompr
essi
ve S
treng
th (
MPa
)
% Ash Replacement
Cimen et al DataSleep et al. data
Figure 24 – Effect of volcanic ash replacement on unconfined compressive strength between Cimen et al. (2015) and Sleep et al. (2018) Cimen et al. (2015) tested the unconfined compressive strength of a CH material, mixed with pumice and ash. As shown in Figure 24, sample strength increases with increasing amounts of volcanic material. These samples were tested in unconfined compression immediately after compaction, without time for any pozzolanic reaction to occur. Thus, the data presented in Figure 24 is only showing the effects of changing grain size distribution on the unconfined compressive strength of CH materials. This increase in strength is not observed in the Sleep et al. 2018 study.
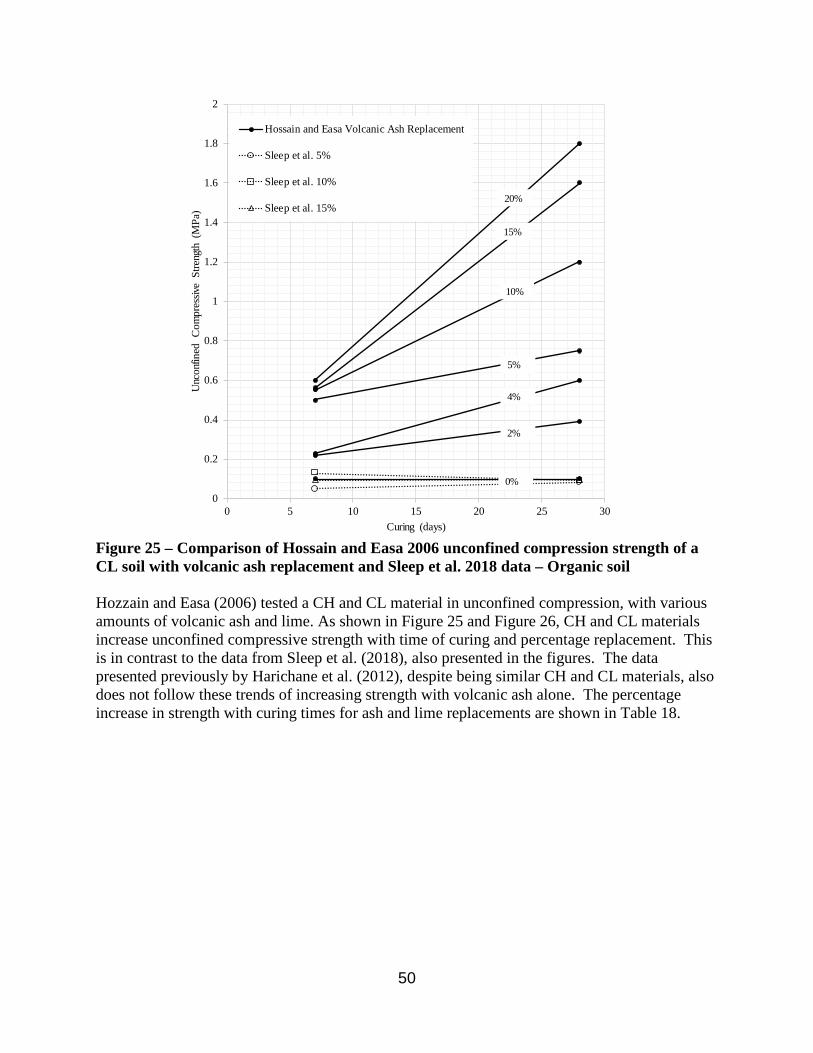
50
0
0.2
0.4
0.6
0.8
1
1.2
1.4
1.6
1.8
2
0 5 10 15 20 25 30
Unc
onfin
ed C
ompr
essiv
e St
reng
th (
MPa
)
Curing (days)
Hossain and Easa Volcanic Ash Replacement
Sleep et al. 5%
Sleep et al. 10%
Sleep et al. 15%20%
15%
10%
5%
4%
2%
0%
Figure 25 – Comparison of Hossain and Easa 2006 unconfined compression strength of a CL soil with volcanic ash replacement and Sleep et al. 2018 data – Organic soil Hozzain and Easa (2006) tested a CH and CL material in unconfined compression, with various amounts of volcanic ash and lime. As shown in Figure 25 and Figure 26, CH and CL materials increase unconfined compressive strength with time of curing and percentage replacement. This is in contrast to the data from Sleep et al. (2018), also presented in the figures. The data presented previously by Harichane et al. (2012), despite being similar CH and CL materials, also does not follow these trends of increasing strength with volcanic ash alone. The percentage increase in strength with curing times for ash and lime replacements are shown in Table 18.
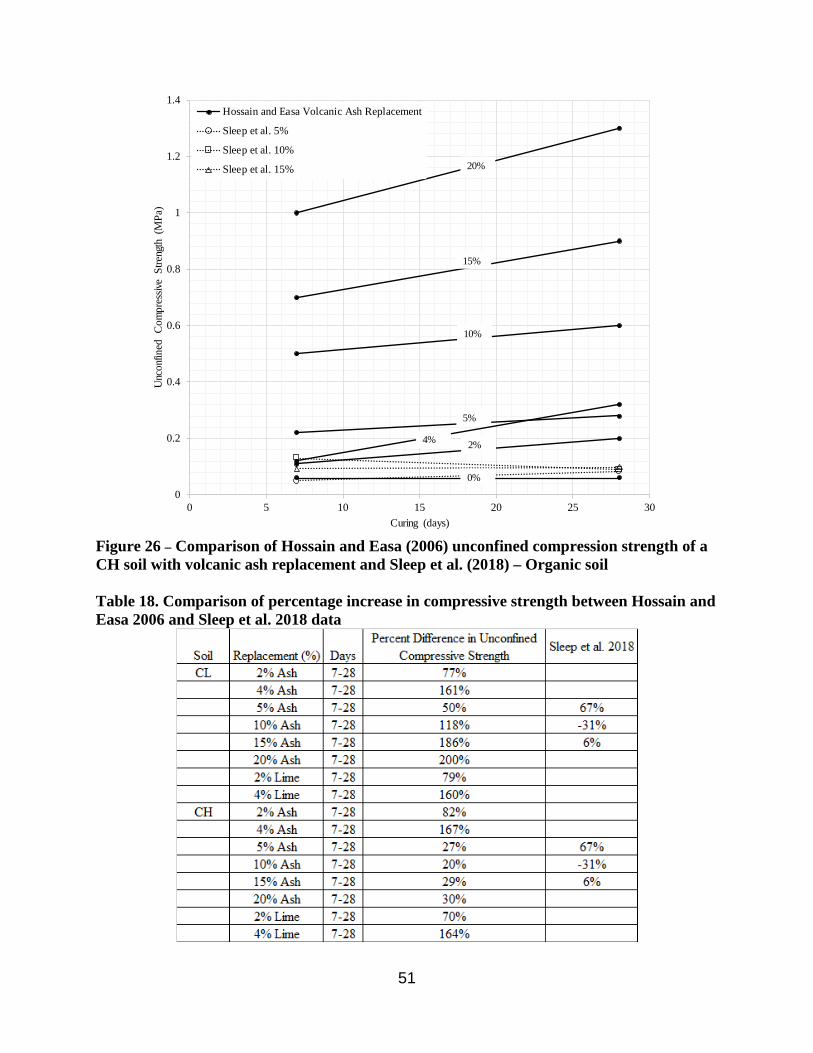
51
0
0.2
0.4
0.6
0.8
1
1.2
1.4
0 5 10 15 20 25 30
Unc
onfin
ed C
ompr
essiv
e St
reng
th (
MPa
)
Curing (days)
Hossain and Easa Volcanic Ash Replacement
Sleep et al. 5%
Sleep et al. 10%
Sleep et al. 15% 20%
15%
10%
5%
4% 2%
0%
Figure 26 – Comparison of Hossain and Easa (2006) unconfined compression strength of a CH soil with volcanic ash replacement and Sleep et al. (2018) – Organic soil Table 18. Comparison of percentage increase in compressive strength between Hossain and Easa 2006 and Sleep et al. 2018 data

52
0
0.005
0.01
0.015
0.02
0.025
0.03
0 2 4 6 8 10 12 14 16
Unc
onfin
ed C
ompr
essiv
e St
reng
th (
MPa
)
Percent Ash Replacement (%)
Ash Passing the No. 4 Sieve
Ash Passing the No. 200 Sieve
Figure 27 – Unconfined compressive strength of Wood River Wetland Soil with an airfall deposit of Mt. Mazama volcanic ash after seven-day cure The data from the Sleep et al. 2018 study included Mt. Mazama volcanic materials from site collection ‘A’ (Figure 2). This volcanic ash deposit described by Walker (1951) is characterized as a flow deposit. During collection, the material had significant welded portions. This study created seven more soil mixed samples, compacted in the Harvard miniature apparatus and tested in unconfined compression after seven days of curing, with volcanic ash materials collected from site ‘B’ in Figure 2, to observe the effects of using an airfall volcanic ash deposit. As shown in Figure 27, the volcanic ash does not increase unconfined compressive strength. As percentage of volcanic ash replacement increased, the unconfined compressive strength decreased from that of the soil alone. When soil was mixed with volcanic ash that was crushed and passed the No. 200 sieve, higher unconfined compressive strengths were observed than when the material was not crushed and passed through a No. 4 sieve. The large volume of data reviewed as part of this study indicates that even with similar chemical composition, volcanic ash will not increase the unconfined compressive strength of CH, CL and organic soil uniformly. While the Hossain and Easa (2006) and Cimen et al. (2015) studies did show an increase in unconfined compressive strength with volcanic ash replacement, the results of the Harichane et al. (2012), Sleep et al. (2018) and this study do not. All reviewed studies showed that the addition of lime will increase the unconfined compressive strength of CH, CL and organic materials.

53
6.5 SUSTAINABILITY ANALYSIS OF MT. MAZAMA VOLCANIC ASH
The sustainability analysis shown here quantifies the sustainable benefits of using volcanic ash as a replacement for portland cement. This sustainability analysis utilizes the Streamlined Energy & Emissions Assessment Model (SEEAM) spreadsheet calculator. Developed at the Center for Geotechnical Practice and Research at Virginia Tech, SEEAM was designed specifically for geotechnical ground improvement projects in order to calculate total embodied energy and carbon dioxide emissions. The basis for the SEEAM model comes from the dissertation of Craig Shillaber (the key developer of the SEEAM computational tool) and is described by him as a combination of life cycle analysis, embodied energy, and carbon footprinting. The purpose of the development of the SEEAM model, according to Shillaber was to address the lack of a simplified means for geotechnical engineers to estimate both the life cycle embodied energy and carbon dioxide emissions produced by a geotechnical project or geotechnical aspect of a larger construction project. Some of the more prevalent ‘energy categories’ as they are referred to that the SEEAM spreadsheet initially included in the scope of life cycle analysis (LCA) were derived from Cole and Kernan 1996 and Dixit et al. 2010 and are defined by Shillaber as follows:
• Initial energy: Materials extraction and initial construction • Operational energy: Energy used in the operation of a facility (ventilation, air
conditioning, electricity, etc.) • Recurring energy: Energy needed for maintenance and repair • Demolition energy: Energy used to remove and dispose of project after life cycle is
complete However, operational energy and recurring energy were not included and instead the life cycle cost in SEEAM is considered to end after construction. This is reasonable because most often geotechnical projects such as foundations and ground improvement do not require any operational energy and if constructed and designed correctly should not need maintenance or repair (Shillaber, 2016). SEEAM considers the construction materials, energy sources, and transportation methods/distances involved in a project and estimates the total embodied energy and carbon emissions for that project. Embodied energy (EE), as used in the SEEAM spreadsheet, represents all of the processes included in producing any kind of product, including harvesting of materials, processing, manufacturing and transportation. It is defined by Shillaber as “the sum of the energy consumed to produce required inputs and the energy consumed by the production process” (Shillaber, 2016). The EE for a given material is determined by conducting a life cycle energy analysis (LCEA) involving input materials from sources upstream in production. The SEEAM spreadsheet calculates the LCEA for a given material by using an embodied energy coefficient (EEC). An EEC is defined as “the amount of EE in the production of a material from cradle to factory gate on a unit basis such as MJ/kg or MJ/L” (Shillaber, 2016). The exact EEC given to a material is a result of performing a Monte Carlo probability analysis in which the EEC of said material is treated as a random variable along a distribution curve. Therefore, a given material(s)

54
quantity for a project is estimated and input into the spreadsheet, which uses published values for averages of EEC to multiply against the quantity and obtain an EE. The sum of all of the EEs for all the materials in a project is taken as the overall EE for the project. The SEEAM worksheet outputs the embodied energy of a given substance or material in a measure of gigajoules (GJ). Carbon dioxide emissions in the SEEAM worksheet attempt to estimate how much carbon dioxide will be released into the atmosphere during the entire life cycle of the product (similar to embodied energy). Because carbon dioxide is a greenhouse gas (GHG) there exist standards for the measure of direct emission which come from the GHG Protocol Product Standard (2012) and the ISO 14067 (2013). The SEEAM spreadsheet takes these two guidance documents into account but also attempts to capture indirect carbon dioxide emissions as well, furthermore, the GHG Protocol Product Standard of 2012 provides greater detail for assessment. The calculation of total carbon emissions is done very similarly to how the EE is calculated. First a given construction or production action or product that involves the use of anything that emits carbon dioxide is assigned a CO2 coefficient (CC) obtained from a ‘cradle to gave’ life cycle carbon dioxide analysis (LCCA) (Shillaber, 2016). The CCs are then multiplied by an estimated amount input into the spreadsheet (the CCs go through the same Monte Carlo probability analysis as the EEs, the same is said for the estimated amount for consumption of fuel in an indirect setting) and the sum of all of the CCs multiplied by quantities of material is then taken as the total carbon emission of the project. The SEEAM worksheet outputs the carbon emissions of a project in a measure of tons of CO2. The calculations of both embodied energy and carbon emissions in the SEEAM worksheet are derived from the EEs and CCs “obtained from life cycle energy and CO2 analyses published in peer reviewed articles, lab and field measurements, or published databases” (Shillaber, 2016). The key database used in the SEEAM spreadsheet tool is from the Inventory of Carbon and Energy (ICE) version 2.0 which was conceived in the U.K. by Hammond and Jones (2011). The database considers the minimum, maximum, average and standard deviation of EECs in order to recommend the best average EEC, it then uses correlations between EEC and CC to determine an appropriate CC, this is due to the difficult of actually measuring the exact amount of carbon dioxide is produced from a very specific amount of material in an industrial setting. The material/energy inputs used in the SEEAM spreadsheet calculator are listed below:
• Construction materials: Users can choose from six different material types for different aspects of construction. The options are steel, cementitious materials (CM), concrete, plastics, wood products and earth materials. From the six base types there is also a sub type option. There are eight kinds of steel, four kinds of CMs, 10 concretes, 12 plastics, three wood materials, three earth materials and one sub-type option offered for water. The spreadsheet allows for 10 different material type and sub-type selections, for each selection it asks for quantity in kilograms for solids or liters for liquids. The material types used in this analysis included cementitious materials, earth materials, and water.
• Recycled or reused materials: Here the spreadsheet asks for a material description and then a quantity; it then offers a list of units to select from which are kilograms, liters, and cubic meters. The sheet has space to account for three recycled materials. No recycled or reused materials were input for this analysis.
55
• Construction site energy: Here the sheet asks for a selection of each fuel type from a list containing diesel, gasoline, natural gas and electricity. After that a description can be entered and units consumed is estimated and input. The sustainability models for this project account for the gasoline required for an ATV, electricity embodied in mixing and preparing the sample, and electricity for drying ovens was accounted for separately. The spreadsheet can account for four separate types of energy consumption.
• Construction materials transportation: This is where the spreadsheet asks how far a material needs to be transported and using what kind of vehicle. First the type of transportation is selected from a list composed of road vehicle, water freight, or rail freight. For this analysis road vehicles were selected. Vehicle options include, minivans/small trucks, SUVs, and light, medium duty and heavy duty trucks. For this analysis a minivan/small truck was used. There are up to 10 different material transportation inputs available and can include staging for more complex projects as well.
• Waste materials transportation: Essentially the same as materials transportation but for solid waste after construction. For this analysis it was assumed that a significant amount of waste material would not be produced that could be accounted for in a conservative materials transportation input.
For the sustainability analysis of Mt. Mazama ash, five SEEAM models were created based on data from the cylinder slurry mix test. The five models were compared by their estimated embodied energy and carbon dioxide emissions. The five models assumed that a 12-foot-wide, one-mile-long gravel road would be improved by applying slurry mixes of different proportions. For the purposes of this analysis, the volcanic ash was assumed to have the same sustainability as mined aggregate defined by the SEEAM model. The amounts of material input for each model, as applied hypothetically to a 12-foot-wide, one-mile-long gravel road, are displayed in Table 19.

56
Table 19. Hypothetical trail mixes applied in the SEEAM analysis
Weight (kg) Percent of total mix (%)Water 32694 60
Portland cement 8718 16Volcanic ash 0 0
Lime 0 0Fly ash 13078 24
Total mass 54490 100
Weight (kg) Percent of total mix (%)Water 32694 60
Portland cement 4359 8Volcanic ash 13078 24
Lime 4359 8Fly ash 0 24
Total mass 54490 100
Weight (kg) Percent of total mix (%)Water 32694 60
Portland cement 21796 40Volcanic ash 0 0
Lime 0 0Fly ash 0 0
Total mass 54490 100
Weight (kg) Percent of total mix (%)Water 32694 60
Portland cement 0 0Volcanic ash 13078 24
Lime 8718 16Fly ash 0 0
Total mass 54490 100
Weight (kg) Percent of total mix (%)Water 32694 60
Portland cement 8718 16Volcanic ash 13078 24
Lime 0 0Fly ash 0 0
Total mass 54490 100
Portland cement and volcanic ash (5)
Trial slurry mix applied to 12 foot wide, 1 mile long gravel roadPortland cement and fly ash (1)
Portland cement, volcanic ash, and lime (2)
Portland cement (3)
Volcanic ash and lime (4)
Based on the results of the sustainability analysis of these five models, the volcanic ash is similar to fly ash in terms of embodied energy and CO2 emissions when used in the same proportions. All proposed mixes are significantly more sustainable than the pure portland cement mix. The half and half mix (2) appeared to be a balance between the portland cement and fly ash (1), and portland cement and volcanic ash mixes (5). Found in Figure 28 and Figure 29, the comparisons of maximum embodied energy and maximum CO2 emissions, respectively, are displayed. Complete data from the SEEAM worksheet is presented in Appendix 7.9.

57
0
20
40
60
80
100
120
140
160
Portland cementand fly ash (1)
Portlandcement,
volcanic ashand lime (2)
Portland cement(3)
Volcanic ashand lime (4)
Embo
died
ene
rgy
(GJ)
Portlandcement and volcanic ash (5)
Figure 28 - Maximum embodied energy in GJ for different material mix types
0
5
10
15
20
25
30
Portland cementand fly ash (1)
Portland cement,volcanic ash and
lime (2)
Portland cement(3)
Volcanic ash andlime (4)
Portland cementand volcanic ash
(5)
CO
2 Em
issio
ns (
tonn
es)
Figure 29 - CO2 emissions based on different material mix types
As shown in Figure 28, the portland cement and volcanic ash mix, and portland cement and fly ash mix embodied energies differed by approximately 1% (about 62 GJ), and they both used approximately 82 GJ less than pure portland cement per mile of 12-foot trail. As shown in Figure 29, both volcanic ash and fly ash mixes produce approximately 14 tons of CO2 less than a pure portland cement mix. This analysis, while a simplification, shows the direct sustainable benefits of replacing portland cement with volcanic ash in gravel trail stabilization mixes.

58
7.0 CONCLUSIONS AND RECOMMENDATIONS
A thorough and innovative laboratory and field research project has been conducted on the natural pozzolanic abilities of Mt. Mazama volcanic ash. In addition to standard ASTM testing procedures, modified strength activity index testing, cylinder slurry tests, dynamic chemical tests, organic soil tests and a sustainability analysis have been conducted. In the Klamath Basin area of Southern Oregon, two Mt. Mazama volcanic ash deposits have been identified through literature review and confirmed with field sampling, an airfall deposit and a flow deposit. The airfall deposit, collected as part of this study, meets ASTM C618 chemical requirements as a class N pozzolan. In its natural state, the volcanic ash does not meet maximum moisture content requirements of ASTM C618. In an unprocessed, naturally occurring state, Mt. Mazama volcanic ash does not meet fineness requirements. Using volcanic ash that is not crushed, the material does not meet strength activity index requirements. When the material is crushed and passed through a No. 200 sieve, the material appears to meet strength activity index requirements of ASTM C618. Variability of control specimen strength was high during the testing and it is proposed to perform the strength activity index testing again to confirm these results. These tests confirm that chemically, Mt. Mazama volcanic ash is nearly identical to fly ash but would need to be crushed and processed prior to use as a conventional natural pozzolan material for replacement in portland cement concrete. Dynamic chemical analyses show that chemical proportions of a mix can be calculated accurately by weight for portland cement and Mt. Mazama volcanic ash. Modified strength activity index testing confirmed that crushing of the Mt. Mazama volcanic ash increased the unconfined compressive strength of mortar cubes compared to uncrushed Mt. Mazama volcanic ash. Low strength mortar can be produced using Mt. Mazama volcanic ash and lime without portland cement. When lime is introduced into a mix design for mortar cubes with Mt. Mazama volcanic ash, compressive strength is increased. Mortar cubes created with portland cement and crushed Mt. Mazama volcanic ash showed notable increases in strength up to 84 days of curing. When topically applied to compacted gravel samples, slurries of portland cement and water with a w/c ratio of 1.5 bound the largest percentage of the gravel material. When the portland cement in the slurry mix was replaced with Mt. Mazama volcanic ash, replacements of 60% bound the largest percentage of gravel material. Similar to the strength activity index testing, Mt. Mazama ash that was crushed and passed through a No. 200 sieve performed better than uncrushed or unprocessed material. Introducing Mt. Mazama volcanic ash as a replacement for the portland cement, reduced the depth of penetration of the slurry mix, but bound a larger percentage of material by weight than portland cement alone. Innovative dust abatement testing showed that Mt. Mazama volcanic ash, portland cement and lime slurries can reduce dust in compacted aggregate samples.

59
Mt. Mazama volcanic ash, when mixed with highly organic soil, will not improve the unconfined compressive strength of compacted samples. Lime and/or portland cement is necessary to increase the unconfined compressive strength of compacted samples of highly organic soils from the Wood River Wetland. A sustainability analysis using the recently published Streamlined Energy and Emissions Assessment Model from the Center for Geotechnical Practice and Research at Virginia Tech clearly indicates that any replacement of portland cement with Mt. Mazama volcanic ash decreases embodied energy and CO2 emissions.
8.0 RECOMMENDATIONS FOR FUTURE WORK
This report showed that Mt. Mazama volcanic ash, when processed, can be used as a natural pozzolan. Additional strength activity index tests should be performed. It has been shown that Mt. Mazama volcanic ash could be used as a replacement for portland cement in soil mixing, dust abatement and unpaved roadway stabilization. More slurry mix tests should be conducted on a larger variety of gravel gradations to determine if topically applied portland cement and volcanic ash can improve the stability of placed materials. The benefits of fly ash in portland cement concrete mix design are well known. Because Mt. Mazama volcanic ash is chemically similar to fly ash, tests should be conducted using fly ash replacement as a control to determine if Mt. Mazama volcanic ash could serve as a replacement for fly ash. A study should be conducted to determine the minimum amount of crushing and processing that must be done to Mt. Mazama volcanic ash to meet ASTM C618 requirements.

60
9.0 REFERENCES
“Air Non-Point and Mobile Sources.” n.d. Top Ten Dust Control Techniques. State of Alaska Division of Air Quality. Accessed May 1, 2017. https://dec.alaska.gov/air/anpms/Dust/topten_dustctrl2.htm#bindingparticles. ASTM C109 / C109M-16a, Standard Test Method for Compressive Strength of Hydraulic
Cement Mortars (Using 2-in. or [50-mm] Cube Specimens), ASTM International, West Conshohocken, PA, 2016, doi: 10.1520/C0109_C0109M-16A
ASTM C114-15, Standard Test Methods for Chemical Analysis of Hydraulic Cement, ASTM
International, West Conshohocken, PA, 2015, doi: 10.1520/C0114-15 ASTM C144-17, Standard Specification for Aggregate for Masonry Mortar, ASTM
International, West Conshohocken, PA, 2017, doi: 10.1520/C0144-17 ASTM C311 / C311M-17, Standard Test Methods for Sampling and Testing Fly Ash or Natural
Pozzolans for Use in Portland-Cement Concrete, ASTM International, West Conshohocken, PA, 2017, doi:10.1520/C0311_C0311M-17
ASTM C618-17a, Standard Specification for Coal Fly Ash and Raw or Calcined Natural
Pozzolan for Use in Concrete, ASTM International, West Conshohocken, PA, 2017, doi: 10.1520/C0618-17A
Bacon, Charles. 1983. “Eruptive history of Mount Mazama and Crater Lake Caldera, Cascade Range, U.S.A.” Journal of Volcanology and Geothermal Research. 18. 57-115.
Ҫimen, Ӧmür. Saltan, Mehmet. Keskin, Nilay. 2015. “Stabilization of clayey subgrade with waster pumice for road infrastructure” De Gruyter. Accessed Feb 3, 2018. DOI 10.1515/secm-2013-0315
Cole, R. J., and Kernan, P. C. (1996). “Life-cycle energy use in office buildings.” Building and Environment, 31(4), 307-317.
D.H. Campbell, C.H. Weise, H. Love, Mount St. Helens Volcanic Ash in Concrete,
Concrete International July (1982) 24–31
Ding, R., Qui, Z., and Li, J. (1996). "Soluble-Silicate Mud Additives Inhibit Unstable Clays." Oil & Gas Journal, 94(14), 66-68.
Dixit, M. K., Fernandez-Solis, J. L., Lavey, S., and Culp, C. H. (2010). “Identification of parameters for embodied energy measurement: a literature review.” Energy and Buildings, 42(8), 1238-1247.
61
Greenhouse Gas Protocol (2012). “Product life cycle accounting and reporting standard.” <http://www.ghgprotocol.org/files/ghgp/public/Product-Life-Cycle-AccountingReporting-Standard_041613.pdf>. (May,12 2018).
Hammond, G., and Jones, C. (2011a). “Embodied carbon - the inventory of carbon and energy (ICE).” A BSRIA guide, F. Lowrie, and P. Tse, eds., BSRIA, Bracknell, Berkshire, United Kingdom.
Hammond, G., and Jones, C. (2011b). “Inventory of Carbon and Energy (ICE).” Version 2.0, Sustainable Energy Research Team (SERT), University of Bath, UK.
Harichane, Khelifa. Ghrici, Mohamed. Kenai, Said. 2012. “Effect of the combination of lime and natural pozzolana on the compaction and strength of soft clayey soils: a preliminary study” Environmental Earth Science (66): 2197-2205. doi: 10.1007/s12665-011-1441-x
ISO (International Organization for Standardization) (2013). “Greenhouse gases – carbon
footprint of products - requirements and guidelines for quantification and communication.” ISO 14067, Geneva, Switzerland.
Klimasauskas, Ed. Bacon, Charles. Alexander, Jim. 2002 “Mount Mazama and Crater Lake:
Growth and Destruction of a Cascade Volcano” U.S. Geological Survey
K.M.A Hossain. Easa, Said. 2006. “Characteristics of Volcanic Ash and Natural Lime Based Stabilized Clayey Soils. Canadian Journal of Civil Engineering. doi: 10.1139/l06-099
K.M.A. Hossain, M. Lachemi, Performance of volcanic ash and pumice based blended cement concrete in mixed sulfate environment, Cement and Concrete Research 36 (2006) 1123–1133.
K.M.A. Hossain, M. Lachemi, Development of Volcanic Ash Concrete: Strength, Durability, and Microstructural Investigations, ACI Materials Journal 103 (2006) 11–17
K.M.A. Hossain, M. Lachemi, Strength, Durability and Micro-Structural Aspects of High
Performance Volcanic Ash Concrete, Cement and Concrete Research 37 (2007) 759–766
K.M.A. Hossain, Volcanic ash and pumice as cement additives: pozzolanic, alkali-silica reaction and autoclave expansion characteristics, Cement and Concrete Research 35 (2005) 1141–1144
Millar, J., 2016. “Analysis of the Center Levee at the Wood River Wetland.” MS Thesis, Oregon Institute of Technology, Klamath Falls, OR.
“Pozzolan.” n.d. . American Concrete Institute. ACI. Accessed May 2, 2017 https://www.concrete.org/topicsinconcrete/topicdetail/pozzolan.
62
Rafalko, Susan. 2006. “Rapid Soil Stabilization of Soft Clay Soils for Contingency Airfields.” MS thesis, Virginia Polytechnic Institute and State University
Ruff, C. G., and Davidson, D. T. (1961). "Lime and Sodium Silicate Stabilization of Montmorillonite Clay Soil." Highway Research Record, (304), 76-92.
Rushing, John F., and Kent Newman. 2009. “Full-Scale Testing of Chemical Dust Palliatives in a Semicontrolled Environment.” Journal of Materials in Civil Engineering 21 (9): 454– 59. doi:10.1061/(ASCE)0899-1561(2009)21:9(454). Shillaber, Craig M. 2016. “Towards Sustainable Development: Quantifying Environmental
Impact via Embodied Energy and CO2 Emissions for Geotechnical Construction.” Dr. Thesis, Virginia Polytechnic Institute and State University
Shillaber, Craig M. Mitchell, James K. Dove, Joseph E. Hamilton, Megan. 2016. “Streamlined
Energy & Emissions Assessment Model (SEEAM) v. 1.0 Spreadsheet Calculator User Manual” Virginia Polytechnic Institute and State University, March 2016.
Sleep, M. D., Millar, J., and Reed, S. 2018. “Improvement of organic soils at the Wood River
Wetland in the Klamath Basin with volcanic materials from the eruption of Mt. Mazama.” Proceedings of the International Foundations Congress and Equipment Exposition, ASCE GeoInstitute, Orlando, FL.
Thomas, Michael D. A. 2013. Supplementary Cementing Materials in Concrete. pg. 1-20, Boca
Raton: CRC Press/Taylor & Francis Group. Tikalsky, Paul J. 1994. “Use of Natural Pozzolans in Concrete (ACI 232.1R).” ACI Materials
Journal 91 (4). pg. 410-426 doi:10.14359/4060 United States Department of Transportation Federal Highway Administration “Soil Stabilizers on Universally Accessible Trails.” 2000., September. Washington DC GPO. Walker, George W. 1951 Pumice Deposits of the Klamath Indian Reservation Klamath County,
Oregon. Geological Survey. United States Department of the Interior, August 1951 William, H. Goles, G. 1968. Volume of the Mazama ash-fall and the Origin of the Crater Lake
Caldera. Andesite Conference Guidebook, Bulletin 62. State of Oregon Department of Geology and Mineral Industries
Williams, Howel. Bacon, Charles R. 1988. “Crater Lake National Park and Vicinity” Oregon, 1:62-scale topographic map. U.S. Geological Survey, Reston Va.

63
10.0 APPENDIX
10.1 SAI TESTING TRIAL 1
Sample % Volcanic AshS-0 0S-1 20S-2 22S-3 24S-4 26S-5 28S-6 30S-7 40S-8 50S-9 60S-10 70S-11 80S-12 90

64
Sample Weight (g) 7 day strength (psi) 28 day strength (psi) 28 day strength average (psi) Percent of Control (S-0)S-0 290.0 3625
291.2 4089291.5 5955295.1 5755293.2 6037290.5 6428 5653 100.00
S-1 276.0 2425277.3 3530278.9 3785279.1 3814279.7 3816279.6 3727 3734 66.06
S-2 274.8 2425278.8 3553277.4 3719275.5 3238281.3 3739280.1 3614 3573 63.20
S-3 278.2 2433280.3 3711280.7 3959279.5 3693279.3 3831277.6 3736 3786 66.98
S-4 275.5 2436275.7 3203277.5 3223277.8 3329276.9 3329274.3 3215 3260 57.67
S-5 273.2 2134276.3 1737275.5 3214276.3 3202274.1 3246278.2 3567 2993 52.95
S-6 274.4 2226275.4 3267276.5 3393275.6 3282275.9 3321274.3 3224 3297 58.33
S-7 256.6 1432259.7 1887260.1 2042259.4 1894259.8 1987 1953 34.54
S-8 242.2 983249 1448
245.9 1239246.3 980248.3 1387249.8 1397 1290 22.82
S-9 232.1 607242.3 799241.9 517238.9 805
238 746237.3 684 710 12.56
S-10 230.3 285232.6 342233.3 354
234 285231.6 281234.8 357 324 5.73
S-11 223.4 64224.8 160228.3 208226.5 210225.6 183228.8 208 194 3.43
S-12 219.7 65230.6 65229.1 78
228 75229.1 83226.4 68 74 1.31
Breaks

65
10.2 SAI TESTING TRIAL 2
Sample Ash (g) Portland Cement (g) Lime (g)S-0 0 500 0SL-1 100 50 350SL-2 110 50 340SL-3 120 50 330SL-4 130 50 320SL-5 140 50 310
Mix
Sample %LimeS-0 0S-1 70S-2 68S-3 66S-4 64S-5 62

66
Sample Weight (g) 7 day strength (psi) 28 day strength (psi) 28 day strength average (psi) Percent of Control (S-0)S-0 293.8 4127
481260465366
5408 100.00SL-1 229.9 100
80120150
117 2.16SL-2 241.1 123
200210190
200 3.70SL-3 242.4 120
240220287
249 4.60SL-4 234.9 115
200230190
207 3.82SL-5 232.8 100
190190170
183 3.39
Breaks
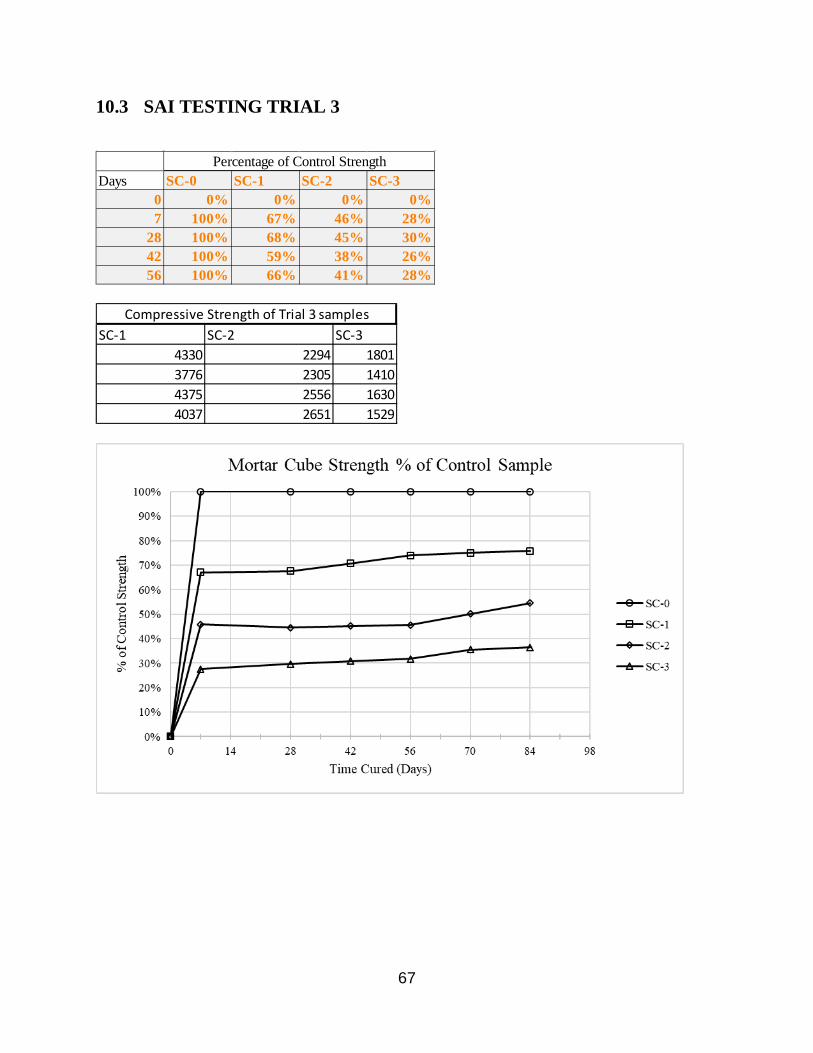
67
10.3 SAI TESTING TRIAL 3
Days SC-0 SC-1 SC-2 SC-30 0% 0% 0% 0%7 100% 67% 46% 28%
28 100% 68% 45% 30%42 100% 59% 38% 26%56 100% 66% 41% 28%
Percentage of Control Strength
SC-1 SC-2 SC-34330 2294 18013776 2305 14104375 2556 16304037 2651 1529
Compressive Strength of Trial 3 samples

68
10.4 CYLINDER SLURRY TESTING

69

70
Batch 1Sieve base wt (kg) wt w/ agg (kg) agg wt (kg) %retain Cumul % retain %pass
25 7 7 0 0% 0% 100%19 7.09 7.09 0 0% 0% 100%
12.5 6.97 7.2 0.23 3% 3% 97%9.5 6.9 9 2.1 25% 27% 73%
4.75 6.84 12.68 5.84 69% 96% 4%2.36 6.59 6.76 0.17 2% 98% 2%
0 5.53 5.67 0.14 2% 100% 0%Total 46.92 55.4 8.48 100%
Batch 2Sieve base wt (kg) wt w/ agg (kg) agg wt (kg) %retain Cumul % retain %pass
25 6.99 6.99 0 0% 0% 100%19 7.09 7.09 0 0% 0% 100%
12.5 6.91 7.34 0.43 4% 4% 96%9.5 6.9 9.52 2.62 26% 31% 69%
7.45 6.83 13.4 6.57 66% 97% 3%2.36 6.59 6.72 0.13 1% 98% 2%
0 5.53 5.7 0.17 2% 100% 0%Total 46.84 56.76 9.92 100%
Batch 3Sieve base wt (kg) wt w/ agg (kg) agg wt (kg) %retain Cumul % retain %pass
25 6.99 6.99 0 0% 0% 100%19 7.09 7.1 0.01 0% 0% 100%
12.5 6.91 7.64 0.73 6% 6% 94%9.5 6.90 10.36 3.46 27% 33% 67%
7.45 6.83 14.94 8.11 63% 96% 4%2.36 6.59 6.8 0.21 2% 98% 2%
0 5.53 5.8 0.27 2% 100% 0%Total 46.84 59.63 12.79 100%
Batch 4Sieve base wt (kg) wt w/ agg (kg) agg wt (kg) %retain Cumul % retain %pass
25 6.99 6.99 0 0% 0% 100%19 7.09 7.11 0.02 0% 0% 100%
12.5 6.97 7.57 0.6 5% 5% 95%9.5 6.92 10.02 3.1 25% 30% 70%
7.45 6.84 14.74 7.9 64% 94% 6%2.36 6.58 6.88 0.3 2% 97% 3%
0 5.56 5.95 0.39 3% 100% 0%Total 46.95 59.26 12.31 100%
Batch 5Sieve base wt (kg) wt w/ agg (kg) agg wt (kg) %retain Cumul % retain %pass
25 7.00 7 0 0% 0% 100%19 7.10 7.1 0 0% 0% 100%
12.5 6.98 7.64 0.66 5% 5% 95%9.5 6.94 10.34 3.4 28% 33% 67%
7.45 6.84 14.37 7.53 62% 96% 4%2.36 6.58 6.82 0.24 2% 98% 2%
0 5.54 5.83 0.29 2% 100% 0%Total 46.98 59.1 12.12 100%
AverageSieve Average %pass
25 100.019 100.0
12.5 95.39.5 69.0
7.45 4.12.36 2.2
0 0.0
Summer 2017Batch data for Cylinder Slurry Mixes
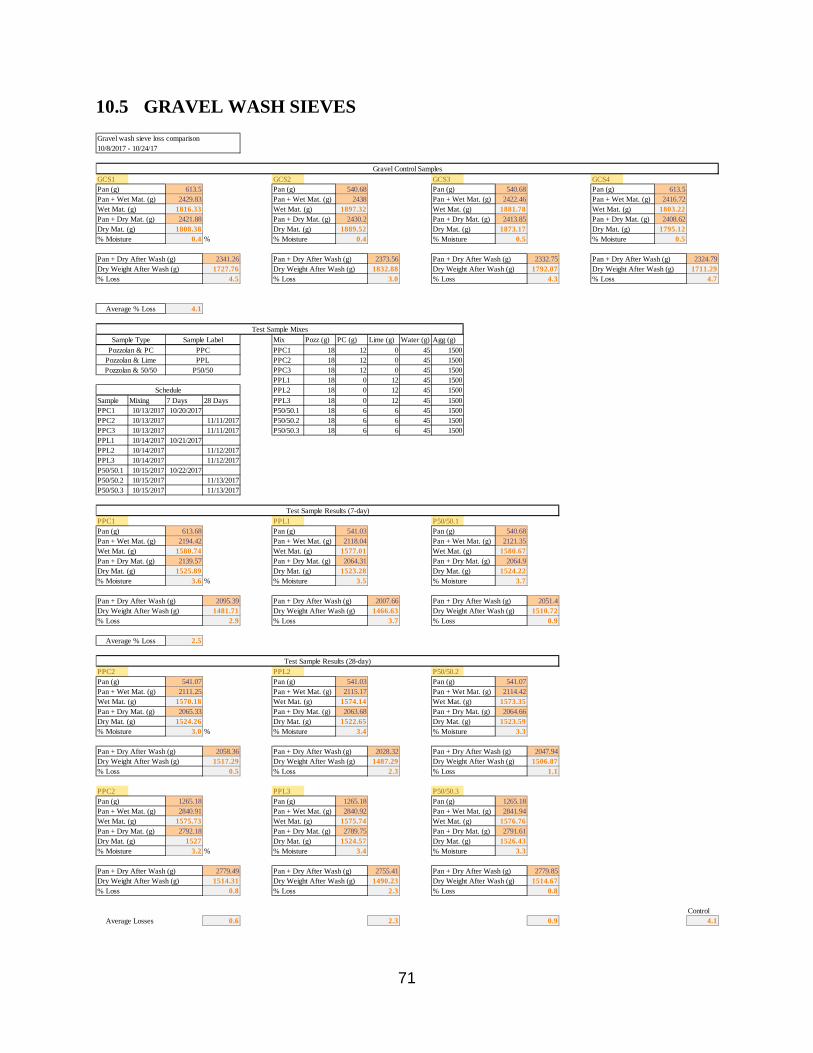
71
10.5 GRAVEL WASH SIEVES Gravel wash sieve loss comparison 10/8/2017 - 10/24/17
GCS1 GCS2 GCS3 GCS4613.5 540.68 540.68 613.5
2429.83 2438 2422.46 2416.721816.33 1897.32 1881.78 1803.222421.88 2430.2 2413.85 2408.62
1808.38 1889.52 1873.17 1795.120.4 % 0.4 0.5 0.5
2341.26 2373.56 2332.75 2324.79Dry Weight After Wash (g) 1727.76 Dry Weight After Wash (g) 1832.88 Dry Weight After Wash (g) 1792.07 Dry Weight After Wash (g) 1711.29
4.5 3.0 4.3 4.7
4.1
Mix Pozz (g) PC (g) Lime (g) Water (g) Agg (g)PPC1 18 12 0 45 1500PPC2 18 12 0 45 1500PPC3 18 12 0 45 1500PPL1 18 0 12 45 1500PPL2 18 0 12 45 1500
Sample Mixing 7 Days 28 Days PPL3 18 0 12 45 1500PPC1 10/13/2017 10/20/2017 P50/50.1 18 6 6 45 1500PPC2 10/13/2017 11/11/2017 P50/50.2 18 6 6 45 1500PPC3 10/13/2017 11/11/2017 P50/50.3 18 6 6 45 1500PPL1 10/14/2017 10/21/2017PPL2 10/14/2017 11/12/2017PPL3 10/14/2017 11/12/2017P50/50.1 10/15/2017 10/22/2017P50/50.2 10/15/2017 11/13/2017P50/50.3 10/15/2017 11/13/2017
PPC1 PPL1 P50/50.1613.68 541.03 540.68
2194.42 2118.04 2121.351580.74 1577.01 1580.672139.57 2064.31 2064.9
1525.89 1523.28 1524.223.6 % 3.5 3.7
2095.39 2007.66 2051.4Dry Weight After Wash (g) 1481.71 Dry Weight After Wash (g) 1466.63 Dry Weight After Wash (g) 1510.72
2.9 3.7 0.9
2.5
PPC2 PPL2 P50/50.2541.07 541.03 541.07
2111.25 2115.17 2114.421570.18 1574.14 1573.352065.33 2063.68 2064.66
1524.26 1522.65 1523.593.0 % 3.4 3.3
2058.36 2028.32 2047.94Dry Weight After Wash (g) 1517.29 Dry Weight After Wash (g) 1487.29 Dry Weight After Wash (g) 1506.87
0.5 2.3 1.1
PPC2 PPL3 P50/50.31265.18 1265.18 1265.182840.91 2840.92 2841.94
1575.73 1575.74 1576.762792.18 2789.75 2791.61
1527 1524.57 1526.433.2 % 3.4 3.3
2779.49 2755.41 2779.85Dry Weight After Wash (g) 1514.31 Dry Weight After Wash (g) 1490.23 Dry Weight After Wash (g) 1514.67
0.8 2.3 0.8
Control0.6 2.3 0.9 4.1Average Losses
Pan + Dry After Wash (g) Pan + Dry After Wash (g) Pan + Dry After Wash (g)
% Loss % Loss % Loss
Dry Mat. (g) Dry Mat. (g) Dry Mat. (g)% Moisture % Moisture % Moisture
Wet Mat. (g) Wet Mat. (g) Wet Mat. (g)Pan + Dry Mat. (g) Pan + Dry Mat. (g) Pan + Dry Mat. (g)
Pan (g) Pan (g) Pan (g)Pan + Wet Mat. (g) Pan + Wet Mat. (g) Pan + Wet Mat. (g)
Pan + Dry After Wash (g) Pan + Dry After Wash (g) Pan + Dry After Wash (g)
% Loss % Loss % Loss
Dry Mat. (g) Dry Mat. (g) Dry Mat. (g)% Moisture % Moisture % Moisture
Wet Mat. (g) Wet Mat. (g) Wet Mat. (g)Pan + Dry Mat. (g) Pan + Dry Mat. (g) Pan + Dry Mat. (g)
Average % Loss
Test Sample Results (28-day)
Pan (g) Pan (g) Pan (g)Pan + Wet Mat. (g) Pan + Wet Mat. (g) Pan + Wet Mat. (g)
Pan + Dry After Wash (g) Pan + Dry After Wash (g) Pan + Dry After Wash (g)
% Loss % Loss % Loss
Dry Mat. (g) Dry Mat. (g) Dry Mat. (g)% Moisture % Moisture % Moisture
Wet Mat. (g) Wet Mat. (g) Wet Mat. (g)Pan + Dry Mat. (g) Pan + Dry Mat. (g) Pan + Dry Mat. (g)
Pan (g) Pan (g) Pan (g)Pan + Wet Mat. (g) Pan + Wet Mat. (g) Pan + Wet Mat. (g)
Pozzolan & Lime PPLPozzolan & 50/50 P50/50
Schedule
Test Sample Results (7-day)
Average % Loss
Test Sample MixesSample Type Sample Label
Pozzolan & PC PPC
Pan + Dry After Wash (g) Pan + Dry After Wash (g) Pan + Dry After Wash (g) Pan + Dry After Wash (g)
% Loss % Loss % Loss % Loss
Dry Mat. (g) Dry Mat. (g) Dry Mat. (g) Dry Mat. (g)% Moisture % Moisture % Moisture % Moisture
Wet Mat. (g) Wet Mat. (g) Wet Mat. (g) Wet Mat. (g)Pan + Dry Mat. (g) Pan + Dry Mat. (g) Pan + Dry Mat. (g) Pan + Dry Mat. (g)
Gravel Control Samples
Pan (g) Pan (g) Pan (g) Pan (g)Pan + Wet Mat. (g) Pan + Wet Mat. (g) Pan + Wet Mat. (g) Pan + Wet Mat. (g)
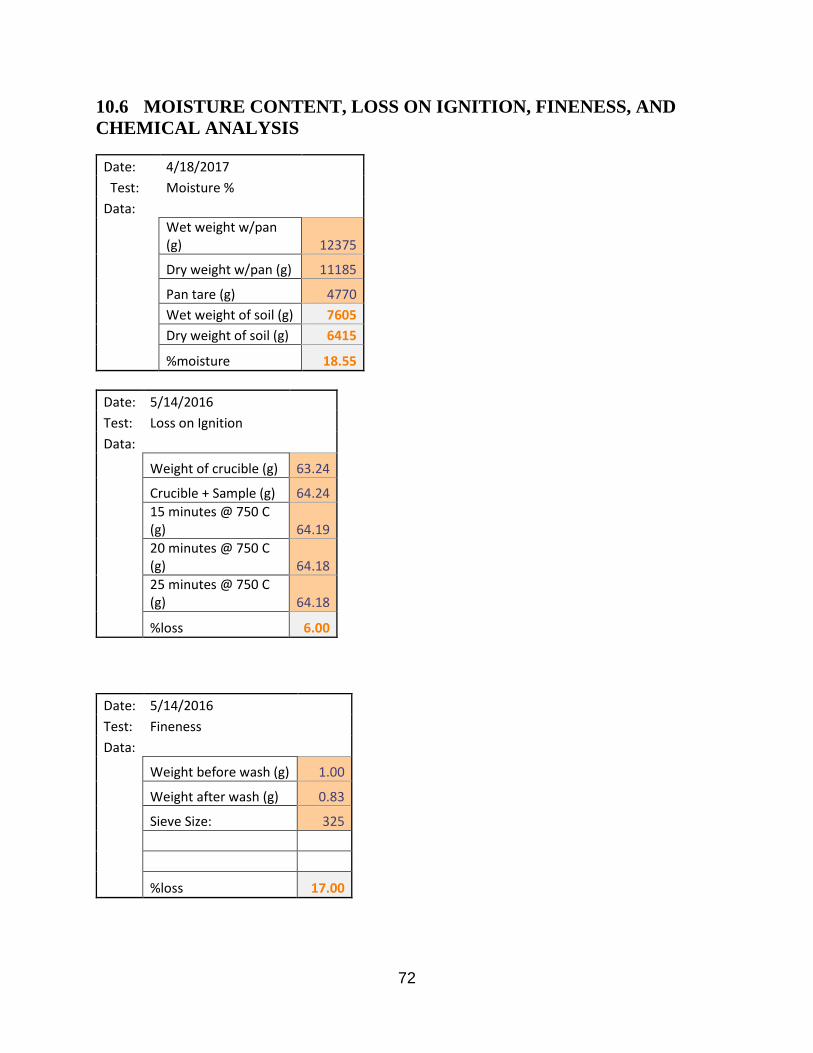
72
10.6 MOISTURE CONTENT, LOSS ON IGNITION, FINENESS, AND CHEMICAL ANALYSIS
Date: 4/18/2017 Test: Moisture % Data:
Wet weight w/pan (g) 12375
Dry weight w/pan (g) 11185
Pan tare (g) 4770 Wet weight of soil (g) 7605 Dry weight of soil (g) 6415
%moisture 18.55
Date: 5/14/2016 Test: Loss on Ignition Data:
Weight of crucible (g) 63.24
Crucible + Sample (g) 64.24
15 minutes @ 750 C (g) 64.19
20 minutes @ 750 C (g) 64.18
25 minutes @ 750 C (g) 64.18
%loss 6.00
Date: 5/14/2016 Test: Fineness Data:
Weight before wash (g) 1.00
Weight after wash (g) 0.83
Sieve Size: 325
%loss 17.00

73
Test: Chemical AnalysisCompound Sample_AA_#1 Sample_AA_#2 Sample_BB_#1 Sample_BB_#2 Sample_CC_#1 Sample_CC_#2 Compound Average %SiO2 68.04 67.73 65.48 65.23 64.19 64.21 SiO2 65.81
Al2O3 18.06 18.02 19.2 19.16 19.02 19.05 Al2O3 18.75
Fe2O3 3.98 3.96 4.52 4.45 4.71 4.77 Fe2O3 4.40CaO 2.84 2.85 3.45 3.38 4 3.99 CaO 3.42MgO 1.15 1.16 1.46 1.42 1.76 1.76 MgO 1.45SO3 0.01 0.03 -0.01 -0.01 -0.04 -0.05 SO3 -0.01
Na2O 3.293 3.272 3.139 3.119 3.187 3.218 Na2O 3.20
K2O 2.301 2.297 1.958 1.956 1.692 1.7 K2O 1.98
TiO2 0.59 0.59 0.638 0.643 0.658 0.661 TiO2 0.63
P2O5 0.104 0.102 0.112 0.113 0.127 0.128 P2O5 0.11
Mn2O3 0.078 0.075 0.082 0.081 0.091 0.093 Mn2O3 0.08Loss On Ignigtion 2.14 2.08 1.88 2.01 2.04 2.23 Loss On Ignigtion 2.06Total Alkali 4.807 4.783 4.427 4.406 4.3 4.337 Total Alkali 4.51
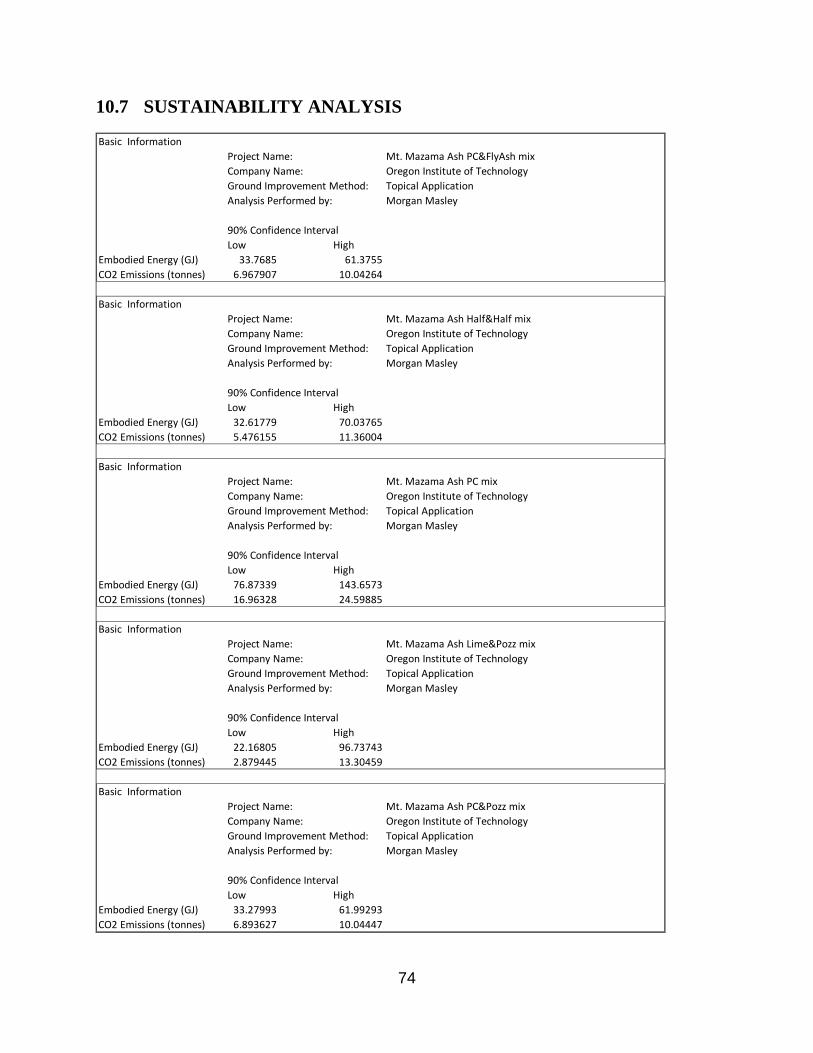
74
10.7 SUSTAINABILITY ANALYSIS
Basic InformationProject Name: Mt. Mazama Ash PC&FlyAsh mixCompany Name: Oregon Institute of TechnologyGround Improvement Method: Topical ApplicationAnalysis Performed by: Morgan Masley
90% Confidence IntervalLow High
Embodied Energy (GJ) 33.7685 61.3755CO2 Emissions (tonnes) 6.967907 10.04264
Basic InformationProject Name: Mt. Mazama Ash Half&Half mixCompany Name: Oregon Institute of TechnologyGround Improvement Method: Topical ApplicationAnalysis Performed by: Morgan Masley
90% Confidence IntervalLow High
Embodied Energy (GJ) 32.61779 70.03765CO2 Emissions (tonnes) 5.476155 11.36004
Basic InformationProject Name: Mt. Mazama Ash PC mixCompany Name: Oregon Institute of TechnologyGround Improvement Method: Topical ApplicationAnalysis Performed by: Morgan Masley
90% Confidence IntervalLow High
Embodied Energy (GJ) 76.87339 143.6573CO2 Emissions (tonnes) 16.96328 24.59885
Basic InformationProject Name: Mt. Mazama Ash Lime&Pozz mixCompany Name: Oregon Institute of TechnologyGround Improvement Method: Topical ApplicationAnalysis Performed by: Morgan Masley
90% Confidence IntervalLow High
Embodied Energy (GJ) 22.16805 96.73743CO2 Emissions (tonnes) 2.879445 13.30459
Basic InformationProject Name: Mt. Mazama Ash PC&Pozz mixCompany Name: Oregon Institute of TechnologyGround Improvement Method: Topical ApplicationAnalysis Performed by: Morgan Masley
90% Confidence IntervalLow High
Embodied Energy (GJ) 33.27993 61.99293CO2 Emissions (tonnes) 6.893627 10.04447
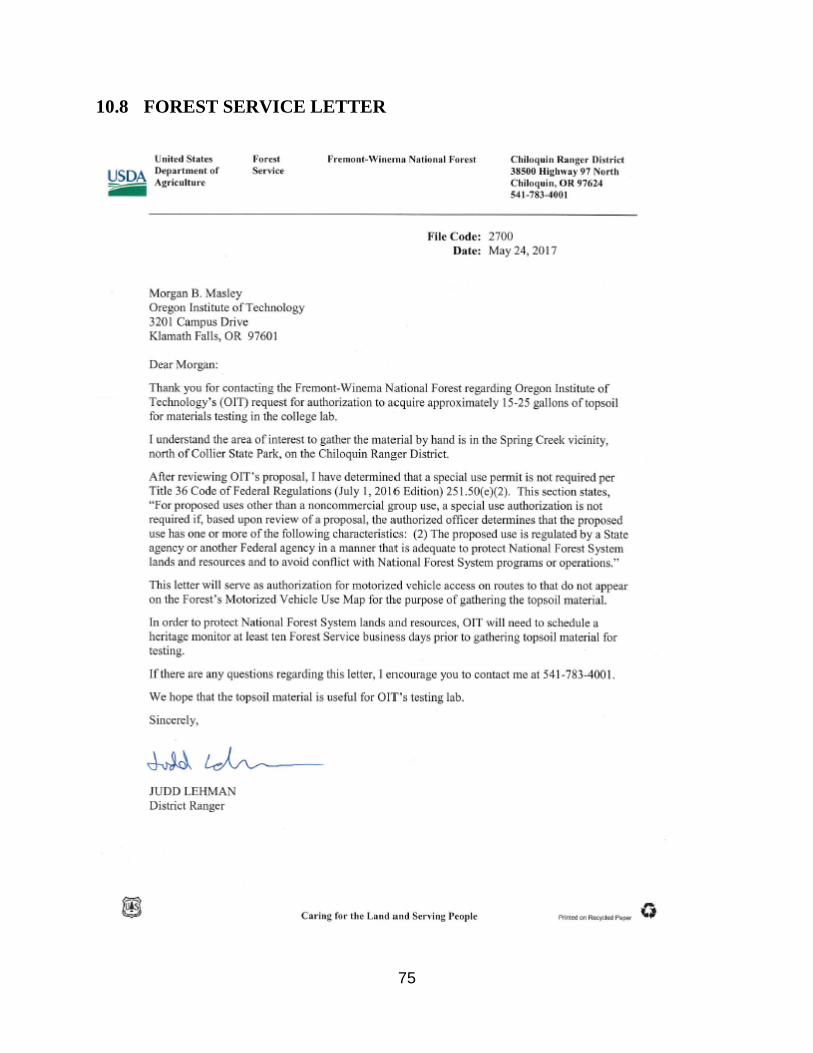
75
10.8 FOREST SERVICE LETTER

Transportation Research and Education Center
Portland State University
1900 S.W. Fourth Ave., Suite 175
Portland, OR 97201