the very young_type_ia_supernova_2012cg_discovery_and_early_time_follow_up_observations
TRANSCRIPT

The Very Young Type Ia Supernova 2012cg: Discovery and
Early-Time Follow-Up Observations
Jeffrey M. Silverman1,2, Mohan Ganeshalingam1, S. Bradley Cenko1, Alexei V. Filippenko1,
Weidong Li1,3, Aaron J. Barth4, Daniel J. Carson4, Michael Childress5, Kelsey I. Clubb1,
Antonino Cucchiara6, Melissa L. Graham7,8, G. H. Marion9, My L. Nguyen4, Liuyi Pei4,
Brad E. Tucker5, Jozsef Vinko10,11, J. Craig Wheeler11, and Gabor Worseck5
ABSTRACT
On 2012 May 17.2 UT, only 1.5 ± 0.2 d after explosion, we discovered
SN 2012cg, a Type Ia supernova (SN Ia) in NGC 4424 (d ≈ 15 Mpc). As
a result of the newly modified strategy employed by the Lick Observatory SN
Search, a sequence of filtered images was obtained starting 161 s after discovery.
Utilizing recent models describing the interaction of SN ejecta with a compan-
ion star, we rule out a ∼1 M� companion for half of all viewing angles and a
red-giant companion for nearly all orientations. SN 2012cg reached a B-band
maximum of 12.09 ± 0.02 mag on 2012 June 2.0 and took ∼17.3 d from explo-
sion to reach this, typical for SNe Ia. Our pre-maximum-brightness photometry
shows a narrower-than-average B-band light curve for SN 2012cg, though slightly
overluminous at maximum brightness and with normal color evolution (including
1Department of Astronomy, University of California, Berkeley, CA 94720-3411, USA.
2email: [email protected].
3Deceased 12 December 2011.
4Department of Physics and Astronomy, University of California, Irvine, CA 92697-4575, USA.
5The Research School of Astronomy and Astrophysics, The Australian National University, Mount
Stromlo and Siding Spring Observatories, Weston Creek, ACT 2611, Australia.
6Department of Astronomy and Astrophysics, UCO/Lick Observatory, University of California, Santa
Cruz, CA 95064, USA.
7Las Cumbres Observatory Global Telescope Network, 6740 Cortona Dr., Goleta, CA 93117, USA.
8Department of Physics, Broida Hall, University of California, Santa Barbara, CA 93106, USA.
9Harvard-Smithsonian Center for Astrophysics, 60 Garden St., Cambridge, MA 02138, USA.
10Department of Optics and Quantum Electronics, University of Szeged, Dom ter 9, 6720 Szeged, Hungary.
11Department of Astronomy, University of Texas, Austin, TX 78712-0259, USA.
arX
iv:1
206.
1328
v2 [
astr
o-ph
.CO
] 2
7 Ju
n 20
12

– 2 –
some of the earliest SN Ia filtered photometry ever obtained). Spectral fits to
SN 2012cg reveal ions typically found in SNe Ia at early times, with expansion
velocities & 14,000 km s−1 at 2.5 d past explosion. Absorption from C II is de-
tected early, as well as high-velocity components of both Si II λ6355 and Ca II.
Our last spectrum (13.5 d past explosion) resembles that of the somewhat pecu-
liar SN Ia 1999aa. This suggests that SN 2012cg will have a slower-than-average
declining light curve, which may be surprising given the faster-than-average rising
light curve.
Subject headings: supernovae: general — supernovae: individual (SN 2012cg)
1. Introduction
Type Ia supernovae (SNe Ia) provided the first clear indication that the expansion of
the Universe is accelerating (Riess et al. 1998; Perlmutter et al. 1999) and have been used
as precise distance indicators to accurately measure cosmological parameters (e.g., Conley
et al. 2011; Suzuki et al. 2012). Broadly speaking, SNe Ia are the result of the thermonuclear
explosion of C/O white dwarfs (WDs); however, the specifics of the progenitor systems and
explosion mechanisms are still unclear (see Howell 2011, for further information).
While there is much value in large statistical studies of SNe Ia, an in-depth investigation
of an individual object can be extremely enlightening as well. Two recent examples of this
are SN 2009ig and SN 2011fe (PTF11kly). Both are very nearby, normal SNe Ia that were
discovered extremely young (Kleiser et al. 2009; Nugent et al. 2011a) and have been intensely
studied by many groups and at all wavelengths. These rich datasets are excellent test cases
for simulations of SNe Ia and also place strong observational constraints on many theoretical
models (e.g., Foley et al. 2012; Bloom et al. 2012; Ropke et al. 2012; Horesh et al. 2012;
Parrent et al. 2012).
Here we add to this list a nearby SN Ia that was found 1.5 d after explosion: SN 2012cg.
In §2 we describe our discovery and present our autonomously triggered follow-up observa-
tions, initiated mere minutes after discovery. We present our post-discovery observations
and describe our data reduction in §3, and our analysis of the pre-maximum-brightness data
is discussed in §4. We summarize our conclusions in §5.

– 3 –
2. Discovery and Autonomous Follow-Up Observations
As part of the Lick Observatory Supernova Search (LOSS; Filippenko et al. 2001), we
have imaged the field of NGC 4424 with the 0.76 m Katzman Automatic Imaging Telescope
(KAIT; Richmond et al. 1993) more than 200 times over the last 14 years. In an 18 s unfiltered
KAIT image beginning at 05:21:26 on 2012 May 17 (UT dates are used throughout), we iden-
tified a new transient source with J2000.0 coordinates α = 12h27m12.′′83, δ = +09◦25′13.′′1
(with an uncertainty of 200 mas in each coordinate; Cenko et al. 2012). We found that
SN 2012cg had R = 16.92± 0.05 mag at the time of the KAIT discovery (statistical uncer-
tainty only). The next day the object was spectroscopically classified as an extremely young
SN Ia (Cenko et al. 2012).
SN 2012cg is located 17.′′3 east and 1.′′5 south of the center of the the peculiar SBa
galaxy NGC 4424, at a distance of 15.2 ± 1.9 Mpc (from the Tully-Fisher relation, Cortes
et al. 2008); thus, SN 2012cg lies a projected distance of ∼1.4 kpc from the host-galaxy
center. This places the SN just outside a central concentration of CO and Hα emission, but
among many blue stars which may indicate recent (but not ongoing) star formation in the
vicinity of SN 2012cg (Cortes et al. 2006).
Beginning in early 2011, we modified the LOSS search strategy with the principal ob-
jective of promptly identifying very young (i.e., hours to days after explosion) SNe in nearby
galaxies. In addition to decreasing the number of galaxies monitored regularly by KAIT
(to increase our observing cadence), we also implemented new software tools to identify SN
candidates in nearly real time. Consequently, KAIT autonomously obtained a sequence of
U , B, V , and unfiltered (roughly R) images of the transient beginning only 161 s after the
completion of the discovery image. These are some of the earliest filtered photometry data
ever obtained of a SN. Subsequent filtered (BVRI) photometry was manually inserted into
the KAIT schedule (see §3.1).
3. Post-Discovery Observations and Data Reduction
3.1. Photometry
KAIT continued to monitor SN 2012cg, and the filtered BVRI follow-up photometry
through ∼2.5 weeks after discovery is analyzed herein. These data were reduced using our
image-reduction pipeline (Ganeshalingam et al. 2010). Lacking host-galaxy templates, point-
spread function (PSF) fitting photometry was performed at the position of the SN and seven

– 4 –
local comparison stars using the DAOPHOT package in IRAF1. Instrumental magnitudes
were transformed to Landolt (1992) system magnitudes using color terms derived from mul-
tiple photometric nights. The photometric zero point for each image was determined using
the measured magnitudes of the local standards from Sloan Digital Sky Survey transformed
into the Landolt standard system (Jordi et al. 2006).
3.2. Spectroscopy
Nearly nightly spectroscopic follow-up observations of SN 2012cg were also initiated
after discovery. Low-resolution optical spectra were obtained mainly using the Kast double
spectrograph on the Shane 3 m telescope at Lick Observatory (Miller & Stone 1993), though
data were also acquired with the Marcario Low-Resolution Spectrograph (LRS; Hill et al.
1998) on the 9.2 m Hobby-Eberly Telescope (HET) at McDonald Observatory and the Wide
Field Spectrograph (WiFeS, an integral field unit) on the Australian National University
2.3 m telescope at Siding Springs Observatory (Dopita et al. 2007). Table 1 summarizes the
spectral data of SN 2012cg presented here.
All spectra were reduced using standard techniques (e.g., Silverman et al. 2012b). Rou-
tine CCD processing and spectrum extraction were completed with IRAF. We obtained the
wavelength scale from low-order polynomial fits to calibration-lamp spectra. Small wave-
length shifts were then applied to the data after cross-correlating a template sky to the
night-sky lines that were extracted with the SN. Using our own IDL routines, we fit spec-
trophotometric standard-star spectra to the data in order to flux calibrate our spectra and
to remove telluric lines (Wade & Horne 1988; Matheson et al. 2000).
4. Analysis and Results
4.1. Light Curves
We present our BVRI light curves of SN 2012cg in Figure 1, compared with those of
SN 2011fe (unpublished KAIT data), SN 1999aa (Jha et al. 2006), and SN 2005cf (Wang
et al. 2009). From a low-order polynomial fit, we find that SN 2012cg reached a peak B-band
magnitude of 12.09± 0.02 on 2012 June 2.0± 0.75.
1IRAF: The Image Reduction and Analysis Facility is distributed by the National Optical Astronomy
Observatory, which is operated by the Association of Universities for Research in Astronomy (AURA) under
cooperative agreement with the National Science Foundation (NSF).

– 5 –
Table 1: Journal of Spectroscopic Observations of SN 2012cg
UT Date Epocha Instrument Range (A) Resolution (A)b Exposure (s)
2012 May 18.234 2.5 Kast 3434–8198 4.3/5.7 2×1500
2012 May 19.231 3.5 Kast 3440–8200 4.3/5.6 2×1200
2012 May 20.226 4.5 LRS 4200–10200 13.5 1200
2012 May 20.191 4.5 Kast 3482–5550 4.4 1800
2012 May 21.186 5.5 Kast 3456–10250 4.4/10.9 2×300
2012 May 22.454 6.8 WIFeS 3700–9550c 0.8/1.3 600
2012 May 23.368 7.7 WIFeS 3700–9550c 0.8/1.3 600
2012 May 25.200 9.5 LRS 4200–10200 13.5 900
2012 May 26.235 10.5 Kast 3490–8314 5.2/5.9 300
2012 May 28.198 12.5 Kast 3490–8124 5.1/5.8 300
2012 May 29.180 13.5 Kast 3452–10232 4.0/10.5 300
2012 May 29.194 13.5 LRS 4200–10200 13.5 300aDays relative to the date of explosion, 2012 May 15.7. To convert to days relative to
B-band maximum brightness, subtract the 17.3 d rise time from this number (see §4.1
for more information).bApproximate full width at half-maximum intensity (FWHM) resolution. If two num-
bers are listed, they represent the blue- and red-side resolutions, respectively.cThere is a gap in the spectral coverage at 5574–5630 A.

– 6 –
Assuming E(B − V )host = 0.18 mag (see below) and d = 15.2 Mpc (Cortes et al. 2008),
this implies MB = −19.73±0.30 mag, which is ∼0.5 mag brighter than a “normal” SN Ia and
∼0.25 mag brighter than the somewhat peculiar SN 1999aa (Ganeshalingam et al. 2010).
However, based on our data through maximum brightness, SN 2012cg appears to have a
narrower B-band light curve than the “normal” Type Ia SNe 2011fe and 2005cf and the
slightly overluminous SN 1999aa (even though it resembles this object spectroscopically; see
§4.2.3).
To determine the date of explosion, we model SN 2012cg as an expanding fireball whose
luminosity increases quadratically with time (Riess et al. 1999; Nugent et al. 2011b). Re-
stricting ourselves to the 5 earliest B-band points (−15.8 < t < −11.8 d relative to B-band
maximum brightness), we find that SN 2012cg was discovered 1.5 ± 0.2 d after explosion
(which occurred on 2012 May 15.7). This is consistent with nondetections on May 12.3
(R > 19.8 mag, KAIT) and May 14.9 (R > 19.0 mag, Cortini 2012), as well as with the faint
“pre-discovery detection” on May 15.8 (R ≈ 19.0 mag; Lipunov & Krushinsky 2012). We
measure a rise from explosion to maximum light in the B band of ∼17.3 d, which is within
the range of rise times of typical SNe Ia (e.g., Ganeshalingam et al. 2011). We note, however,
that our earliest photometry epochs may include a contribution from the host galaxy due to
a lack of galaxy templates. A more accurate measurement will be made after galaxy tem-
plates are obtained and will likely push our earliest photometric data slightly fainter than
presented here.
Shock heating of SN Ia ejecta via interaction with a companion is predicted (Kasen
2010) to produce thermal emission whose temperature and luminosity depend both on the
binary separation (a) and the observer angle (θ). In the case of SN 2012cg, the early-time
(t < 2 d) KAIT observations limit any emission from companion interaction with the SN
ejecta to be νLν < 1041 erg s−1 at optical frequencies. Using the analytic models from Kasen
(2010), our limits can rule out a ∼1 M� (a ≈ 2 R�) main-sequence companion for orientations
with θ & 90◦ (i.e., the companion is perpendicular to our line of sight, or slightly farther
away than the exploding WD) and red-giant companions (a ≈ 400 R�) for all orientations
except when the companion is directly behind the WD. Analytic models of the emission
signature of shock breakout (e.g., Chevalier 1992; Rabinak et al. 2011) predict very similar
behavior to the (on-axis, or θ = 0◦) interaction models of Kasen (2010). From a similar line
of reasoning, our early KAIT limits also require that the exploding star must have an initial
radius R0 . 2 R�.
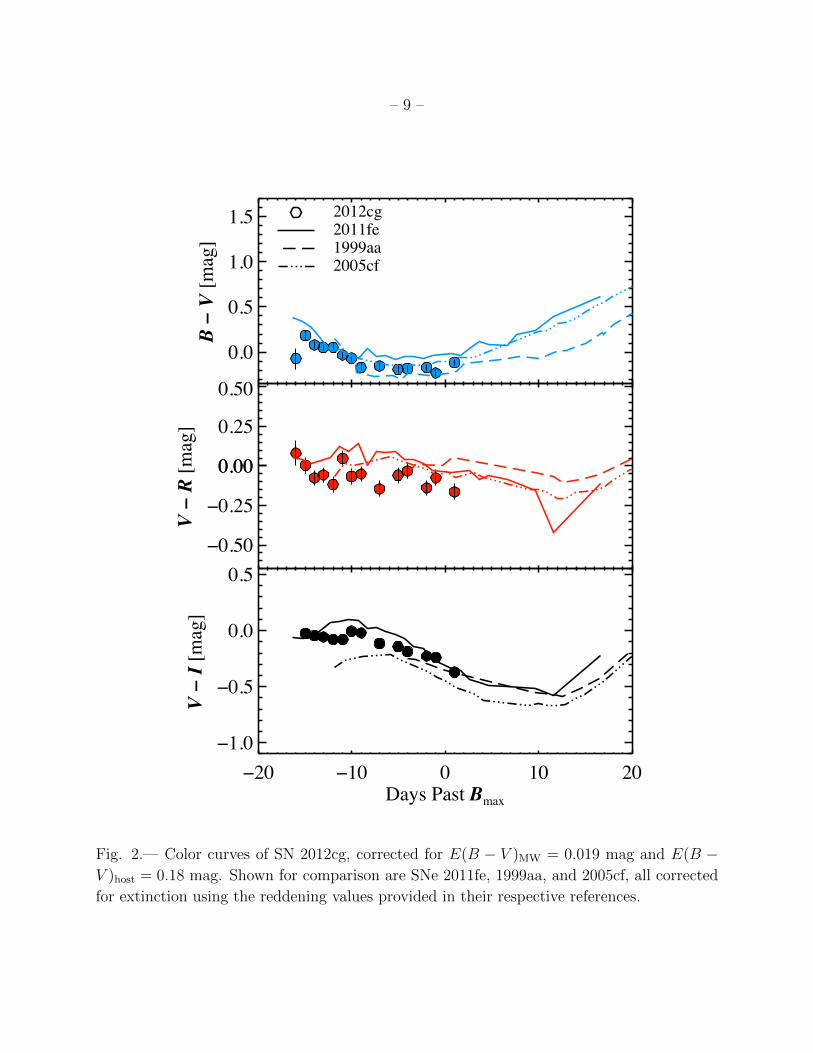
In Figure 2 we plot the evolution of the color of SN 2012cg with time, along with
some comparison objects. All objects have been corrected for Galactic extinction using the
dust maps of Schlegel et al. (1998) and host-galaxy extinction values from their respective

– 7 –
20 10 0 10 20Days Past Bmax
18
16
14
12
10M
agni
tude
+ C
onst
ant
B + 1
R 1
V
I 2
2012cg2011fe1999aa2005cf
Fig. 1.— BVRI light curves of SN 2012cg, along with comparisons to SNe Ia 2011fe, 1999aa,
and 2005cf. Comparison light curves have been shifted to have the same peak magnitude and
phase as SN 2012cg. Our multi-filter data start within minutes after our discovery image,
∼1.5 d after explosion. A nondetection (upper limit, Cortini 2012) and the pre-discovery
detection (open circle, Lipunov & Krushinsky 2012) are also shown.

– 8 –
references. No host-galaxy extinction is adopted for SN 2011fe. In order to match our color
curves to those of other SNe Ia, we require E(B−V )host ≈ 0.18 mag. In general, SN 2012cg
appears to follow the color evolution of the “normal” Type Ia SNe 2011fe and 2005cf, as well
as the somewhat peculiar SN 1999aa. We also note that these are some of the earliest color
data for any SN Ia.
4.2. Spectra
Our spectra of SN 2012cg from the first ∼2 weeks are shown in Figure 3. All of the
spectra exhibit narrow Na I D and Ca II H&K absorption from the host galaxy, though
we usually do not resolve the former. The median redshift as determined from both of
these features is z = 0.00152± 0.00024, consistent with the published redshift of NGC 4424
(z = 0.00146; Kent et al. 2008).
The equivalent width (EW) of Na I D absorption is often converted into reddening, but
there is some controversy over the exact relationship (Poznanski et al. 2011, and references
therein). No Na I D absorption is detected at z = 0; thus, we use E(B−V )MW = 0.019 mag,
as given by Schlegel et al. (1998). The median EW of Na I D from the host galaxy is
measured to be ∼0.7 A, which yields a range of possible reddening values (0.00–0.60 mag)
with a nominal value of 0.22 mag (with the majority of the uncertainty coming from the
scatter in the relationship presented in Poznanski et al. 2011). This is consistent with
E(B − V )host ≈ 0.18 mag, the value derived from the photometry in §4.1.
4.2.1. SYN++
To help identify the species present in our spectra of SN 2012cg, we used the spectrum-
synthesis code SYN++ (Thomas et al. 2011). SYN++ is derived from SYNOW (Fisher et al. 1997)
and is a parameterized resonance-scattering code that allows for the adjustment of chemical
composition, optical depths, temperatures, and velocities. Three examples of our SYN++ fits
are shown in Figure 3.
Our first spectrum of SN 2012cg (2.5 d after explosion) consists of absorption features
from ions usually seen in SNe Ia (Ca II, Si II, Fe II, Mg II, S II, and O I), as well as C II
which is found in over one-fourth of all SNe Ia (e.g., Silverman & Filippenko 2012). All of
these species have expansion velocities & 14,000 km s−1, similar to what was found in the
earliest spectra of SN 2011fe (Parrent et al. 2012) and SN 2009ig (Foley et al. 2012). The
C II features λ6580 and λ7234 are detected in our first spectrum, become more distinct but
– 9 –
0.0
0.5
1.0
1.5B
V [m
ag]
2012cg2011fe1999aa2005cf
0.50
0.25
0.00
0.25
0.50
0.00
V
R [m
ag]
20 10 0 10 20Days Past Bmax
1.0
0.5
0.0
0.5
V I
[mag
]
Fig. 2.— Color curves of SN 2012cg, corrected for E(B − V )MW = 0.019 mag and E(B −V )host = 0.18 mag. Shown for comparison are SNe 2011fe, 1999aa, and 2005cf, all corrected
for extinction using the reddening values provided in their respective references.

– 10 –
3000 4000 5000 6000 7000 8000 9000Rest Wavelength (Å)
0
2
4
6
8
10lo
g(F λ
) +
con
stan
t
+2.5
+3.5
+4.5
+4.5
+5.5
+6.8
+7.7+9.5+10.5
+12.5
+13.5
+13.5
+1.511fe
+2.709ig
+16.899dq
+15.511fe
SN 2012cgSYN++ fits
Ca IISi II Si II
C II C IIO I
Ca IIFe II / Mg II
Fig. 3.— Spectra of SN 2012cg (black) and some SYN++ fits (red), along with comparisons
to other young SNe Ia: SNe 2011fe (dark blue, Parrent et al. 2012), 2009ig (green, Foley
et al. 2012), and 1999dq (light blue, Silverman et al. 2012b). Each spectrum is labeled with
its age relative to explosion. The data have all been deredshifted and dereddened. Major
spectral features are identified. The noise at the red end in the ∼7 and ∼8 d spectra is due
to incomplete removal of night-sky emission lines.

– 11 –
weaken with time, and by 10.5 d past explosion the only sign of C is a flattening of the red
wing of the Si II λ6355 feature (presumably due to C II λ6580). Just 2 d later no C II is
required in our SYN++ fits.
In addition to the usual photospheric Si II absorption, SN 2012cg exhibits high-velocity
(HV) Si II λ6355 in its earliest spectra. This HV absorption appears to be detached from
the rest of the photosphere, with our SYN++ fits showing a gap of ∼4000 km s−1 separating
the normal and HV Si II λ6355 features. The HV feature dominates the Si II λ6355 profile
in our first spectrum (also seen by Marion et al. 2012), but only 1 d later the normal and
HV features are roughly equal in strength. By ∼7 d past explosion, the normal-velocity
feature dominates the Si II λ6355 profile and our SYN++ fits to spectra older than 12.5 d past
explosion do not require any HV Si II. This temporal evolution of the HV Si II λ6355 feature
almost exactly mirrors that of SN 2009ig (Foley et al. 2012).
Similarly, Ca II also displays HV features in our first spectrum. Both the Ca II H&K
feature and the Ca II near-IR triplet show absorption profiles that consist of a photospheric
component as well as a HV component with a velocity gap of 4000–8000 km s−1. In contrast
to the HV Si II, the HV Ca II is required in all of our SYN++ fits, through 13.5 d past
explosion. HV Ca II was also seen in spectra of SN 2011fe younger than ∼8 d past explosion
(Parrent et al. 2012).
4.2.2. Individual Line Measurements
To more precisely study the evolution of our spectra of SN 2012cg, we directly measured
the expansion velocities and EWs of some of the absorption features; see Silverman et al.
(2012a) for details. All of the measured velocities are consistent with our SYN++ fits and are
plotted in Figure 4.
As mentioned previously, all of our SN 2012cg spectra show evidence for HV Ca II. In
our first spectrum, 2.5 d past explosion, the Ca II H&K feature and Ca II near-IR triplet have
velocities of ∼30,000 km s−1, which is even higher than in the earliest spectra of SN 2011fe
(Parrent et al. 2012). As seen in the top panel of Figure 4, the two Ca II features have very
similar velocity evolution in both the HV and photospheric components.
Also plotted in the top panel of Figure 4 is the velocity evolution of the O I triplet.
Initially, these velocities are relatively large and similar to the photospheric O I velocity seen
in the earliest spectra of SN 2011fe. However, that SN also showed HV O I earlier than 5 d
after explosion which is absent from SN 2012cg (Parrent et al. 2012).

– 12 –
2 4 6 8 10 12 14Days Relative to Explosion
10
15
20
25
30V
eloc
ity (
103 k
m s−
1 )HV Ca II H&KCa II H&KHV Ca II IR tripletCa II IR tripletO I triplet
2 4 6 8 10 12 14Days Relative to Explosion
10
12
14
16
18
20
22
Vel
ocity
(10
3 km
s−1 )
HV Si II λ6355Si II λ6355C II λ6580C II λ7234Si II λ4000
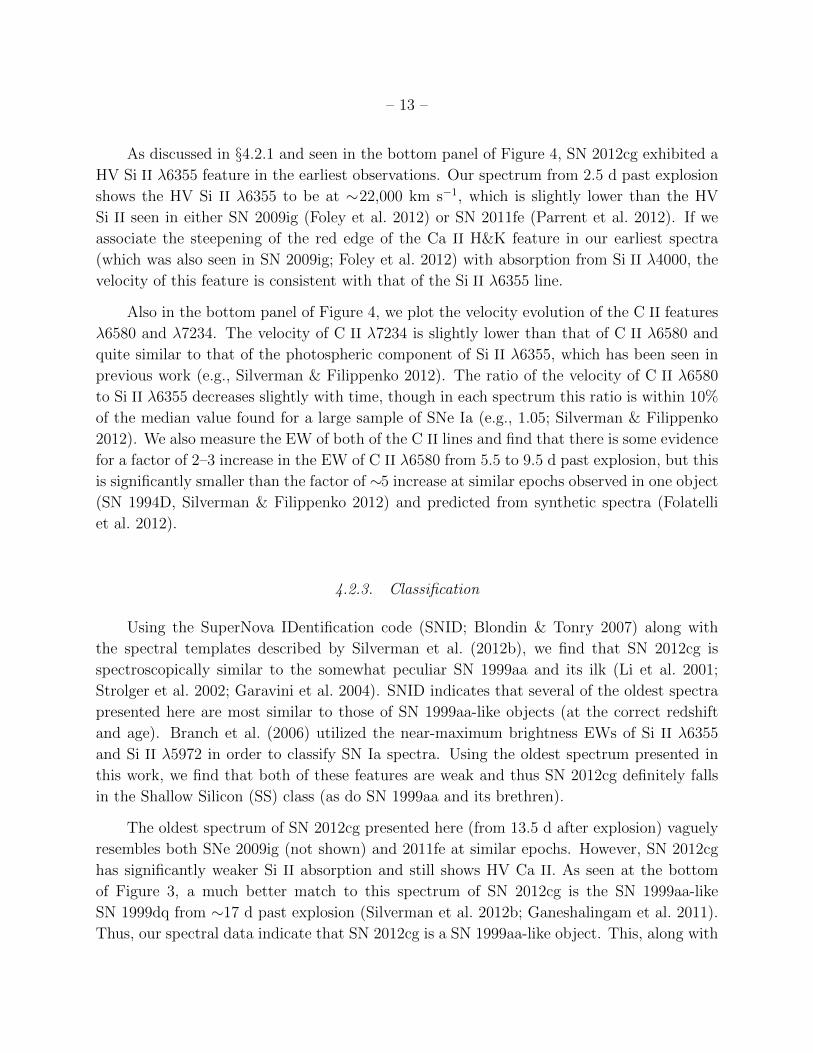
Fig. 4.— The temporal evolution of the expansion velocity of Ca II (both HV and photo-
spheric components) and O I features (top) and of Si II (both HV and photospheric com-
ponents) and C II features (bottom). Uncertainties are smaller than the size of the data
points.
– 13 –
As discussed in §4.2.1 and seen in the bottom panel of Figure 4, SN 2012cg exhibited a
HV Si II λ6355 feature in the earliest observations. Our spectrum from 2.5 d past explosion
shows the HV Si II λ6355 to be at ∼22,000 km s−1, which is slightly lower than the HV
Si II seen in either SN 2009ig (Foley et al. 2012) or SN 2011fe (Parrent et al. 2012). If we
associate the steepening of the red edge of the Ca II H&K feature in our earliest spectra
(which was also seen in SN 2009ig; Foley et al. 2012) with absorption from Si II λ4000, the
velocity of this feature is consistent with that of the Si II λ6355 line.
Also in the bottom panel of Figure 4, we plot the velocity evolution of the C II features
λ6580 and λ7234. The velocity of C II λ7234 is slightly lower than that of C II λ6580 and
quite similar to that of the photospheric component of Si II λ6355, which has been seen in
previous work (e.g., Silverman & Filippenko 2012). The ratio of the velocity of C II λ6580
to Si II λ6355 decreases slightly with time, though in each spectrum this ratio is within 10%
of the median value found for a large sample of SNe Ia (e.g., 1.05; Silverman & Filippenko
2012). We also measure the EW of both of the C II lines and find that there is some evidence
for a factor of 2–3 increase in the EW of C II λ6580 from 5.5 to 9.5 d past explosion, but this
is significantly smaller than the factor of ∼5 increase at similar epochs observed in one object
(SN 1994D, Silverman & Filippenko 2012) and predicted from synthetic spectra (Folatelli
et al. 2012).
4.2.3. Classification
Using the SuperNova IDentification code (SNID; Blondin & Tonry 2007) along with
the spectral templates described by Silverman et al. (2012b), we find that SN 2012cg is
spectroscopically similar to the somewhat peculiar SN 1999aa and its ilk (Li et al. 2001;
Strolger et al. 2002; Garavini et al. 2004). SNID indicates that several of the oldest spectra
presented here are most similar to those of SN 1999aa-like objects (at the correct redshift
and age). Branch et al. (2006) utilized the near-maximum brightness EWs of Si II λ6355
and Si II λ5972 in order to classify SN Ia spectra. Using the oldest spectrum presented in
this work, we find that both of these features are weak and thus SN 2012cg definitely falls
in the Shallow Silicon (SS) class (as do SN 1999aa and its brethren).
The oldest spectrum of SN 2012cg presented here (from 13.5 d after explosion) vaguely
resembles both SNe 2009ig (not shown) and 2011fe at similar epochs. However, SN 2012cg
has significantly weaker Si II absorption and still shows HV Ca II. As seen at the bottom
of Figure 3, a much better match to this spectrum of SN 2012cg is the SN 1999aa-like
SN 1999dq from ∼17 d past explosion (Silverman et al. 2012b; Ganeshalingam et al. 2011).
Thus, our spectral data indicate that SN 2012cg is a SN 1999aa-like object. This, along with

– 14 –
the fact that SN 2012cg is overluminous at maximum brightness (§4.1), suggests that it will
have a slower-than-average light-curve decline.2
5. Conclusions
In this Letter we presented optical photometry and spectroscopy of SN 2012cg, a SN Ia
discovered a mere 1.5 ± 0.2 d after explosion. It is found to be overluminous at maximum
brightness and spectroscopically similar to the somewhat peculiar SN Ia 1999aa. These
properties imply that SN 2012cg will have a slowly declining light curve. However, the pre-
maximum-brightness photometry indicates a faster-than-average rising light curve. Future
observations will be required to definitively determine the relative normalcy (or peculiarity)
of SN 2012cg.
This object will certainly become one of the best-studied SNe Ia ever. In under 3 years
there have been three very nearby SNe Ia discovered within days after explosion (SNe 2009ig,
2011fe, and 2012cg). During that time transient surveys of various sizes and cadences have
continued to grow and evolve, and yet these extremely young SNe Ia are still rare finds.
Therefore, they will serve as excellent case studies well into the future and will help us
answer some of the many outstanding questions in the field of SNe Ia that plague us today.
We would like to thank J. Caldwell, J. R. Mould, S. Odewahn, J. X. Prochaska, S. Ros-
topchin, M. Shetrone, and I. Shivvers for their assistance with some of the observations. We
are grateful to the staff at Lick Observatory for their support and are indebted to the bene-
factors, builders, and partners of the HET and LRS. This work was supported in part by NSF
grant AST–1109801 and Hungarian grant OTKA K76816. A.V.F.’s group at UC Berkeley,
and KAIT and its ongoing operation, have received financial assistance from the Sylvia &
Jim Katzman Foundation, Gary & Cynthia Bengier, the Richard & Rhoda Goldman Fund,
the TABASGO Foundation, and NSF grant AST-0908886.
REFERENCES
Blondin, S., & Tonry, J. L. 2007, ApJ, 666, 1024
Bloom, J. S., et al. 2012, ApJ, 744, L17
2Post-maximum photometric data indicate ∆m15 ≈ 0.83 mag, which is indeed slower than average.
– 15 –
Branch, D., et al. 2006, PASP, 118, 560
Cenko, S. B., et al. 2012, ATel, 4115, 1
Chevalier, R. A. 1992, ApJ, 394, 599
Conley, A., et al. 2011, ApJS, 192, 1
Cortes, J. R., Kenney, J. D. P., & Hardy, E. 2006, AJ, 131, 747
—. 2008, ApJ, 683, 78
Cortini, G. 2012, CBET, 3111, 1
Dopita, M., Hart, J., McGregor, P., Oates, P., Bloxham, G., & Jones, D. 2007, Ap&SS, 310,
255
Filippenko, A. V., Li, W. D., Treffers, R. R., & Modjaz, M. 2001, in Small-Telescope Astron-
omy on Global Scales., ed. B. Paczynski, W. P. Chen, & C. Lemme (San Francisco:
ASP), 121
Fisher, A., Branch, D., Nugent, P., & Baron, E. 1997, ApJ, 481, L89
Folatelli, G., et al. 2012, ApJ, 745, 74
Foley, R. J., et al. 2012, ApJ, 744, 38
Ganeshalingam, M., Li, W., & Filippenko, A. V. 2011, MNRAS, 416, 2607
Ganeshalingam, M., et al. 2010, ApJS, 190, 418
Garavini, G., et al. 2004, AJ, 128, 387
Hill, G. J., et al. 1998, SPIE, 3355, 375
Horesh, A., et al. 2012, ApJ, 746, 21
Howell, D. A. 2011, Nature Comm. 2
Jha, S., et al. 2006, AJ, 131, 527
Jordi, K., Grebel, E. K., & Ammon, K. 2006, A&A, 460, 339
Kasen, D. 2010, ApJ, 708, 1025
Kent, B. R., et al. 2008, AJ, 136, 713

– 16 –
Kleiser, I., Cenko, S. B., Li, W., & Filippenko, A. V. 2009, CBET, 1918, 1
Landolt, A. U. 1992, AJ, 104, 340
Li, W., Filippenko, A. V., Treffers, R. R., Riess, A. G., Hu, J., & Qiu, Y. 2001, ApJ, 546,
734
Lipunov, V., & Krushinsky, V. 2012, ATel, 4138, 1
Marion, G. H., Kirshner, R. P., Foley, R. J., & P., C. 2012, CBET, 3111, 3
Matheson, T., Filippenko, A. V., Ho, L. C., Barth, A. J., & Leonard, D. C. 2000, AJ, 120,
1499
Miller, J. S., & Stone, R. P. S. 1993, Lick Obs. Tech. Rep. 66 (Santa Cruz: Lick Obs.)
Nugent, P., Sullivan, M., Bersier, D., Howell, D. A., Thomas, R., & James, P. 2011a, ATel,
3581, 1
Nugent, P. E., et al. 2011b, Nature, 480, 344
Parrent, J. T., et al. 2012, ApJ, in press (arXiv:1205.6011)
Perlmutter, S., et al. 1999, ApJ, 517, 565
Poznanski, D., Ganeshalingam, M., Silverman, J. M., & Filippenko, A. V. 2011, MNRAS,
415, L81
Rabinak, I., Livne, E., & Waxman, E. 2011, ArXiv e-prints (1108.5548)
Richmond, M., Treffers, R. R., & Filippenko, A. V. 1993, PASP, 105, 1164
Riess, A. G., Filippenko, A. V., Li, W., & Schmidt, B. P. 1999, AJ, 118, 2668
Riess, A. G., et al. 1998, AJ, 116, 1009
Ropke, F. K., et al. 2012, ApJ, 750, L19
Schlegel, D. J., Finkbeiner, D. P., & Davis, M. 1998, ApJ, 500, 525
Silverman, J. M., & Filippenko, A. V. 2012, MNRAS, in press (arXiv:1202.3788)
Silverman, J. M., Kong, J. J., & Filippenko, A. V. 2012a, MNRAS, in press (arXiv:1202.2129)
Silverman, J. M., et al. 2012b, MNRAS, in press (arXiv:1202.2128)

– 17 –
Strolger, L., et al. 2002, AJ, 124, 2905
Suzuki, N., et al. 2012, ApJ, 746, 85
Thomas, R. C., Nugent, P. E., & Meza, J. C. 2011, PASP, 123, 237
Wade, R. A., & Horne, K. 1988, ApJ, 324, 411
Wang, X., et al. 2009, ApJ, 697, 380
This preprint was prepared with the AAS LATEX macros v5.2.