the world market for screen advertising
TRANSCRIPT

The World Market forScreen AdvertisingAssessment and forecasts
screendigest
The World Market for Screen Advertising
Published May 2004 byScreen Digest Limited
screendigestScreen Digest LimitedLymehouse Studios38 Georgiana StreetLondon NW1 0EBtelephone +44/20 7424 2820fax +44/20 7580 0060e-mail [email protected] www.screendigest.com
Printed by Fotodirect, Brighton BN1 8AF
All rights reserved. No part of this publication may bereproduced, transmitted, or stored in a retrievalsystem, in any form or by any means without theprior written permission of the publisher, nor beotherwise circulated in any form of cover or bindingother than that in which is it published and without asimilar condition (including this condition) beingimposed on the subsequent publisher.
Copyright © Screen Digest 2004
AcknowledgementsMany people were very helpful in thepreparation of this report. Screen Digest andSAWA would like to thank very warmly all thenational member companies of SAWA whoreplied to the questionnaire and follow-upcommunications in the preparation of thisreport. Some of these companies provided strongsupport and helpful guidance in the developmentof this unique report. We would also like tothank the sources of national data in the cinemaexhibition field, who continue to support ourwork in the field of provision of cinema data.
Comments about the report and itscontents should be sent in the first instance toDavid Hancock at Screen Digest([email protected]). Fullcontact details for all the companies mentionedin the report can be found in Chapter 7 of thereport (Contacts).
For Screen Digest
Author David Hancock
Additional material Patrick von SychowskiCharlotte Jones
Design/Layout David Fisher/Dennis Shearman
For SAWA
President Trevor Ormerod
Secretariat Cheryl Wannell
3screendigest © 2004
Screen Advertising World Association (SAWA)is a worldwide trade body of screen advertisingcompanies. The aims of SAWA are to developinternational standards and practices for screenadvertising and to improve communicationbetween screen advertising companies aroundthe world to facilitate the easier buying of thecinema medium for advertisers. The ScreenAdvertising World Association (SAWA) is theofficial industry body of screen advertisingorganisations world-wide, with its registeredoffice in London. The main platform of theExecutive Council of SAWA is to developcinema as an advertising medium and this isachieved most effectively by having a widemembership of screen contractors from all partsof the world.
Now in its 50th year, SAWA has 50different members across 32 countries. Amongstits activities, SAWA hosts a major conferenceevery one to two years to review how best wecan help media buyers and advertisers to makethe decision to buy cinema.
The benefits of being a SAWArepresentative are many. The most importantare;
The opportunity to contact and exchangeinformation with existing SAWA members and
to discover how they market the medium ofcinema in their country.
The opportunity to attend a bi-annualcinema advertising convention. At thisconvention, a range of seminars and speakers talkabout the medium of cinema, including creativeopportunities, advances in technology, latestresearch and other key issues.
SAWA members receive an on-line bi-monthly newsletter, covering the latest news andtrends in the screen advertising business in manymarkets around the world.
Existing SAWA members have found greatbenefits in belonging to the industry body,particularly with the increasing globalisation ofthe cinema exhibition and advertising industries,and accordingly new members are invited to joinour association.
The initial joining fee is £595, whichincludes the first year’s membership andthereafter £500 annual membership, which ispayable in May each year.
For further information about SAWA,please contact either Trevor Ormerod c/oPrimedia in South Africa, Cheryl Wannell at theSecretariat office based in London or RobCooksey c/o Pearl and Dean in London.
Screen AdvertisingWorld Association
Trevor OrmerodPresidentScreen Advertising World AssociationC/- Primedia Limited6th Floor5 Gwen StreetSandton SOUTH AFRICAe-mail: [email protected]: +27/11 506 3166Fax: +27/11 506 3188
Rob CookseyFinanceScreen Advertising World Associationc/o Pearl and Dean3 Waterhouse Square138 – 142 HolbornLondon EC1N 2NY UNITED KINGDOMe-mail: [email protected]: +44/207 882 1100Fax: +44/207 882 1111
Cheryl WannellSecretariatScreen Advertising World Association59 Chester RowBelgraviaLondon SW1W 8JL UNITED KINGDOMe-mail: [email protected]: +44/207 730 4313Fax: +44/207 730 4313

4
The World Market for Screen Advertising
screendigest © 2004
5
New geographical markets are opening up to screen advertisers as the multiplex revolution spreadsthroughout the world, with the screen advertising sector now worth over $1.3billion and growthrates outpacing several other areas of display advertising. Europe and USA are the dominant regions;however, Asian and Eastern European multiplex growth indicate the growing importance of theseregions in the screen advertising sector in years to come. The screen contractors are well placed toexploit the desire by advertisers to target alternative media, as they deliver high quality audiences ina high impact environment in what is a proven and accepted medium.
Screen advertising is driving the awareness and conversion of cinemas into digital cinemas, installinglow-end projectors to deliver connected screen networks giving increased client flexibility andtransparency. While these systems are not generally powerful enough to cope with projectingfeature films, they are driving up transparency and accountability levels in the sector and providingopenings for an alternative content income stream within the cinema. There are 40 times morescreens equipped for digital screen advertising than for digital feature film projection.
North America is playing catch-up to Europe, but is fast making inroads in Europe’s dominance ofthe sector. Screen advertising revenue increases in USA are displaying double-digit growth, althoughEurope still accounts for 60 per cent of global sector revenues in 2003 (down from 68 per cent in2002). In 2003, USA became the largest screen advertising sector in the world, for the first timeever, and growth will remain strong in coming years.
Despite being behind other markets in the size and development of screen advertising, the USA is afrontrunner in installing digital cinema advertising systems and is a key driver behind the push todigital technology in cinema advertising. The three major US companies have all introduced digitalsystems, which account for 87.9 per cent of all D-screens in place worldwide.
The demographics of cinema audiences, especially in areas with high multiplex penetration, are idealfor many premium advertisers. Although representing an average of one per cent of total displayadvertising, the audience is generally young and affluent and receptive to screen adverts. Whilecinema advertising remains set to be a small element of the marketing mix, it is an essentialadvertising medium for agencies and advertisers.
Executive summary
screendigest © 2004

6
The World Market for Screen Advertising
screendigest © 2004
Contents
7screendigest © 2004
2 Acknowledgements
5 Executive Summary
13 List of tables of charts25 Introduction 27 Methodology and Sources
1 Global screen advertisingoverview
31 Introduction33 Sector Value35 Screen advertising v box office37 Screen advertising companies 38 Who is advertising?39 Digital impact
2 Digital cinema advertising
41 Overview42 Geographical development43 Analogue limitations43 The digital proposition44 Arguments against digital44 Standards – HD or SD?44 US-Europe differences45 The digital Trojan Horse
3 Digital cinema exhibition47 Summary47 Geographical divisions48 Digital screens49 Digital releases
4 Global statistical overviewsee list of tables and graphs
5 Sound
117 Quality through standardisation118 Useful contacts
6 Territory profiles
FULL PROFILES
Argentina
121 Screen advertising122 Market drivers123 Screen advertising companies124 Cinema exhibition127 Audience demographics128 Digital progress128 Forecasts
Australia
129 Screen advertising130 Market drivers131 Screen advertising companies132 Cinema exhibition135 Audience demographics136 Digital progress136 Forecasts
Austria
137 Screen advertising138 Market drivers139 Screen advertising companies140 Cinema exhibition143 Audience demographics144 Digital progress144 Forecasts
Belgium
145 Screen advertising146 Market drivers147 Screen advertising companies148 Cinema exhibition151 Audience demographics152 Digital progress152 Forecasts
Brazil
153 Screen advertising154 Market drivers155 Screen advertising companies156 Cinema exhibition159 Audience demographics160 Digital progress160 Forecasts
Canada
161 Screen advertising162 Market drivers163 Screen advertising companies164 Cinema exhibition167 Audience demographics
8 screendigest © 2004
168 Digital progress168 Forecasts
Chile
169 Screen advertising170 Market drivers171 Screen advertising companies172 Cinema exhibition175 Audience demographics176 Digital progress176 Forecasts
Czech Republic
177 Screen advertising178 Market drivers179 Screen advertising companies180 Cinema exhibition183 Audience demographics184 Digital progress184 Forecasts
Denmark
185 Screen advertising186 Market drivers187 Screen advertising companies188 Cinema exhibition191 Audience demographics192 Digital progress192 Forecasts
France
193 Screen advertising194 Market drivers
The World Market for Screen Advertising
195 Screen advertising companies196 Cinema exhibition199 Audience demographics200 Digital progress200 Forecasts
Germany
201 Screen advertising202 Market drivers203 Screen advertising companies204 Cinema exhibition208 Audience demographics209 Digital progress209 Forecasts
Greece
211 Screen advertising212 Market drivers213 Screen advertising companies214 Cinema exhibition217 Audience demographics218 Digital progress218 Forecasts
Ireland
219 Screen advertising220 Market drivers221 Screen advertising companies222 Cinema exhibition225 Audience demographics225 Digital progress225 Forecasts
9screendigest © 2004
Italy
227 Screen advertising228 Market drivers229 Screen advertising companies230 Cinema exhibition233 Audience demographics234 Digital progress234 Forecasts
Netherlands
235 Screen advertising236 Market drivers237 Screen advertising companies238 Cinema exhibition241 Audience demographics242 Digital progress242 Forecasts
New Zealand
243 Screen advertising244 Market drivers245 Screen advertising companies246 Cinema exhibition249 Audience demographics250 Digital progress250 Forecasts
Norway
251 Screen advertising252 Market drivers253 Screen advertising companies254 Cinema exhibition257 Audience demographics
Contents
258 Digital progress258 Forecasts
Poland
259 Screen advertising260 Market drivers261 Screen advertising companies262 Cinema exhibition265 Audience demographics266 Digital progress266 Forecasts
Portugal
267 Screen advertising268 Market drivers269 Screen advertising companies270 Cinema exhibition273 Audience demographics274 Digital progress274 Forecasts
Russia
275 Screen advertising276 Market drivers277 Screen advertising companies278 Cinema exhibition281 Audience demographics282 Digital progress282 Forecasts
Singapore
283 Screen advertising284 Market drivers
10 screendigest © 2004
285 Screen advertising companies286 Cinema exhibition289 Audience demographics290 Digital progress290 Forecasts
South Africa
291 Screen advertising292 Market drivers293 Screen advertising companies294 Cinema exhibition297 Audience demographics298 Digital progress298 Forecasts
Spain
299 Screen advertising300 Market drivers301 Screen advertising companies302 Cinema exhibition306 Audience demographics307 Digital progress307 Forecasts
Sweden
309 Screen advertising310 Market drivers311 Screen advertising companies312 Cinema exhibition315 Audience demographics316 Digital progress316 Forecasts
The World Market for Screen Advertising
Switzerland
317 Screen advertising318 Market drivers319 Screen advertising companies320 Cinema exhibition323 Audience demographics324 Digital progress324 Forecasts
Turkey
325 Screen advertising326 Market drivers327 Screen advertising companies328 Cinema exhibition331 Audience demographics332 Digital progress332 Forecasts
United Arab Emirates (UAE)
333 Screen advertising334 Market drivers335 Screen advertising companies336 Cinema exhibition339 Audience demographics340 Digital progress340 Forecasts
UK
341 Screen advertising343 Market drivers344 Screen advertising companies345 Cinema exhibition
348 Audience demographics349 Digital progress349 Forecasts
USA
351 Screen advertising352 Market drivers353 Screen advertising companies355 Cinema exhibition358 Audience demographics359 Digital progress359 Forecasts
MINI-PROFILES
China
361 Screen advertising361 Cinema exhibition363 Digital progress
Finland
365 Screen advertising365 Cinema exhibition366 Digital progress
Hong Kong
369 Screen advertising369 Cinema exhibition370 Digital progress
11screendigest © 2004
Contents
Japan
373 Screen advertising373 Cinema exhibition374 Digital progress
Slovakia
377 Screen advertising377 Cinema exhibition378 Digital progress
Thailand
381 Screen advertising381 Cinema exhibition382 Digital progress
7 Contacts
385 Argentina385 Australia385 Austria385 Belgium386 Brazil386 Canada386 Chile386 Czech Republic386 Denmark386 Finland387 France387 Germany387 Greece387 Ireland387 Italy388 Netherlands388 New Zealand388 Norway388 Poland388 Portugal388 Russia389 Singapore389 Slovakia389 South Africa389 Spain389 Sweden390 Switzerland390 Turkey390 UAE390 UK391 USA391 SAWA Secretariat
12
The World Market for Screen Advertising
screendigest © 2004
13screendigest © 2004
1 Global screen advertisingoverview
31 Screen advertising revenues by world region
31 Screen advertising global summary32 Screen advertising revenues32 Screen advertising revenues33 Regional screen advertising growth34 Average revenues per screen34 Screen advertising revenues per screen34 Screen advertising revenues as a
proportion of box office34 Screen advertising revenue per head as a
proportion of average ticket price35 Screen advertising as a proportion of total
display advertising35 Screen advertising revenues per
admission36 Number of screen advertising companies 36 Number of screen advertising companies
by world region36 Concentration curve of the screen
advertising sector38 Screen advertising revenues per company
2 Digital cinema advertising
41 Digital cinema advertising42 Summary of digital cinema advertising
activity42 Digital cinema advertising development:
sites; D-slide screens; D-RS screens; D-screens
3 Digital Cinema exhibition
47 Commercial digital sites and screens world-wide by region
48 Commercial digital screens world-wide by country
48 Digital cinema screen growth49 Commercial digital screens world-wide
by operator49 Digital screens49 Digital cinema titles released49 Digital releases by country of origin50 Digital releases50 Digital releases: Hollywood50 Digital releases: Other
4 Global statistical overviewWhere appropriate, the data is presented inalphabetical (right hand page) and ranked(left hand page) order
52 Population 55 Total value of screen advertising (local
currency)56 Total value of screen advertising ($)58 Screen advertising growth rates61 Screen advertising revenue per screen
(local currency)Screen advertising revenue per screen ($)
65 Screen advertising revenue per 1,000 admissions (local currency)
66 Screen advertising revenue per 1,000 admissions ($)
68 Screen advertising revenue as a proportion of gross box office
70 Cinema admissions
List of tables and charts
73 Gross box office (local currency)75 Gross box office ($)76 Admissions per head79 Box office per head (local currency)80 Box office per head ($)83 Average ticket price (local currency)85 Average ticket price ($)86 Cinema sites88 Cinema screens90 Average screens per site92 Multiplex sites94 Multiplex screens96 Average screens per multiplex site98 Multiplex sites as a proportion of total
sites100 Multiplex screens as a proportion of total
screens102 Number of seats104 Average seats per screen107 Average revenues per screen (local
currency)108 Average revenues per screen ($)110 Average admissions per screen112 Screens per mn people114 Top 10 Films share of gross box office
6 Territory profiles
FULL PROFILES
Argentina
121 Screen advertising market at a glance121 Box office-advertising split121 Screen advertising revenue 1998-2003122 Screen advertising market 1998-2003
14 screendigest © 2004
123 Screen advertising practice123 Market shares123 Screen advertising companies123 Leading advertisers123 Market share breakdown between
companies124 Cinema admissions 1998-2003125 Leading exhibition circuits125 Cinema sites and screens of leading
exhibitors126 Cinema exhibition 1998-2003127 Audience data - age breakdown127 Audience data - gender breakdown127 Audience data - regional breakdown127 Audience data - urban/rural split127 Audience data - income breakdown127 Cinema audience profile128 Forecasts
Australia
129 Screen advertising market at a glance129 Box office-advertising split129 Screen advertising revenue 1998-2003130 Screen advertising market 1998-2003131 Screen advertising practice131 Market shares131 Screen advertising companies131 Leading advertisers131 Market share breakdown between
companies132 Cinema admissions 1998-2003133 Leading exhibition circuits133 Cinema sites and screens of leading
exhibitors134 Cinema exhibition 1998-2003135 Audience data - age breakdown
The World Market for Screen Advertising
146 Screen advertising market 1998-2003147 Screen advertising practice147 Market shares147 Screen advertising companies147 Leading advertisers147 Market share breakdown between
companies148 Cinema admissions 1998-2003149 Leading exhibition circuits149 Cinema sites and screens of leading
exhibitors150 Cinema exhibition 1998-2003151 Audience data - age breakdown151 Audience data - gender breakdown151 Audience data - regional breakdown151 Audience data - urban/rural split151 Audience data - income breakdown151 Cinema audience profile152 Forecasts
Brazil
153 Screen advertising market at a glance153 Box office-advertising split153 Screen advertising revenue 1998-2003154 Screen advertising market 1998-2003155 Screen advertising practice155 Market shares155 Screen advertising companies155 Leading advertisers155 Market share breakdown between
companies156 Cinema admissions 1998-2003157 Leading exhibition circuits157 Cinema sites and screens of leading
exhibitors158 Cinema exhibition 1998-2003
135 Audience data - gender breakdown135 Audience data - regional breakdown135 Audience data - urban/rural split135 Audience data - income breakdown135 Cinema audience profile136 Forecasts
Austria
137 Screen advertising market at a glance137 Box office-advertising split137 Screen advertising revenue 1998-2003138 Screen advertising market 1998-2003139 Screen advertising practice139 Market shares139 Screen advertising companies143 Leading advertisers139 Market share breakdown between
companies140 Cinema admissions 1998-2003141 Leading exhibition circuits141 Cinema sites and screens of leading
exhibitors142 Cinema exhibition 1998-2003143 Audience data - age breakdown143 Audience data - gender breakdown143 Audience data - regional breakdown143 Audience data - urban/rural split143 Audience data - income breakdown143 Cinema audience profile144 Forecasts
Belgium
145 Screen advertising market at a glance145 Box office-advertising split145 Screen advertising revenue 1998-2003
15
List of tables and charts
screendigest © 2004
159 Audience data - age breakdown159 Audience data - gender breakdown159 Audience data - regional breakdown159 Audience data - urban/rural split159 Audience data - income breakdown159 Cinema audience profile160 Forecasts
Canada
161 Screen advertising market at a glance161 Box office-advertising split162 Screen advertising market 1998-2003163 Screen advertising practice163 Market shares163 Screen advertising companies163 Leading advertisers163 Market share breakdown between
companies164 Cinema admissions 1998-2003165 Leading exhibition circuits165 Cinema sites and screens of leading
exhibitors166 Cinema exhibition 1998-2003167 Audience data - age breakdown167 Audience data - gender breakdown167 Audience data - regional breakdown167 Audience data - urban/rural split167 Audience data - income breakdown167 Cinema audience profile168 Forecasts
Chile
169 Screen advertising market at a glance169 Box office-advertising split170 Screen advertising market 1998-2003
16 screendigest © 2004
171 Screen advertising practice171 Market shares171 Screen advertising companies171 Leading advertisers171 Market share breakdown between
companies172 Cinema admissions 1998-2003173 Leading exhibition circuits173 Cinema sites and screens of leading
exhibitors174 Cinema exhibition 1998-2003175 Audience data - age breakdown175 Audience data - gender breakdown175 Audience data - regional breakdown175 Audience data - urban/rural split175 Audience data - income breakdown175 Cinema audience profile176 Forecasts
Czech Republic
177 Screen advertising market at a glance177 Box office-advertising split177 Screen advertising revenue 1998-2003178 Screen advertising market 1998-2003179 Screen advertising practice179 Market shares179 Screen advertising companies183 Leading advertisers179 Market share breakdown between
companies180 Cinema admissions 1998-2003181 Leading exhibition circuits181 Cinema sites and screens of leading
exhibitors182 Cinema exhibition 1998-2003183 Audience data - age breakdown
The World Market for Screen Advertising
195 Market shares195 Screen advertising companies195 Leading advertisers195 Market share breakdown between
companies196 Cinema admissions 1998-2003197 Leading exhibition circuits197 Cinema sites and screens of leading
exhibitors198 Cinema exhibition 1998-2003199 Audience data - age breakdown199 Audience data - gender breakdown199 Audience data - regional breakdown199 Audience data - urban/rural split199 Audience data - income breakdown199 Cinema audience profile200 Forecasts
Germany
201 Screen advertising market at a glance201 Box office-advertising split201 Screen advertising revenue 1998-2003202 Screen advertising market 1998-2003203 Screen advertising practice203 Market shares203 Screen advertising companies203 Leading advertisers203 Market share breakdown between
companies204 Cinema admissions 1998-2003206 Leading exhibition circuits206 Cinema sites and screens of leading
exhibitors207 Cinema exhibition 1998-2003208 Audience data - age breakdown208 Audience data - gender breakdown
183 Audience data - gender breakdown183 Audience data - regional breakdown183 Audience data - urban/rural split183 Audience data - income breakdown183 Cinema audience profile184 Forecasts
Denmark
185 Screen advertising market at a glance185 Box office-advertising split185 Screen advertising revenue 1998-2003186 Screen advertising market 1998-2003187 Screen advertising practice187 Market shares187 Screen advertising companies187 Leading advertisers188 Cinema admissions 1998-2003189 Leading exhibition circuits189 Cinema sites and screens of leading
exhibitors190 Cinema exhibition 1998-2003191 Audience data - age breakdown191 Audience data - gender breakdown191 Audience data - regional breakdown191 Audience data - urban/rural split191 Audience data - income breakdown191 Cinema audience profile192 Forecasts
France
193 Screen advertising market at a glance193 Box office-advertising split193 Screen advertising revenue 1998-2003194 Screen advertising market 1998-2003195 Screen advertising practice
17
List of tables and charts
screendigest © 2004
208 Audience data - regional breakdown208 Audience data - urban/rural split208 Audience data - income breakdown208 Cinema audience profile209 Forecasts
Greece
211 Screen advertising market at a glance211 Box office-advertising split211 Screen advertising revenue 1998-2003212 Screen advertising market 1998-2003213 Screen advertising practice213 Market shares213 Screen advertising companies213 Leading advertisers213 Market share breakdown between
companies214 Cinema admissions 1998-2003215 Leading exhibition circuits215 Cinema sites and screens of leading
exhibitors216 Cinema exhibition 1998-2003217 Audience data - age breakdown217 Audience data - gender breakdown217 Audience data - regional breakdown217 Audience data - urban/rural split217 audience data - income breakdown217 Cinema audience profile218 Forecasts
Ireland
219 Screen advertising market at a glance219 Box office-advertising split219 Screen advertising revenue 1998-2003220 Screen advertising market 1998-2003
18 screendigest © 2004
221 Market shares221 Leading advertisers222 Cinema admissions 1998-2003223 Leading exhibition circuits223 Cinema sites and screens of leading
exhibitors224 Cinema exhibition 1998-2003225 Forecasts
Italy
227 Screen advertising market at a glance227 Box office-advertising split227 Screen advertising revenue 1998-2003228 Screen advertising market 1998-2003229 Screen advertising practice229 Market shares229 Screen advertising companies229 Leading advertisers230 Cinema admissions 1998-2003231 Leading exhibition circuits231 Cinema sites and screens of leading
exhibitors232 Cinema exhibition 1998-2003233 Audience data - age breakdown233 Audience data - gender breakdown233 Audience data - regional breakdown233 Audience data - urban/rural split233 Audience data - income breakdown233 Cinema audience profile234 Forecasts
Netherlands
235 Screen advertising market at a glance235 Box office-advertising split235 Screen advertising revenue 1998-2003
The World Market for Screen Advertising
249 Audience data - age breakdown248 Audience data - gender breakdown249 Audience data - regional breakdown249 Audience data - urban/rural split249 Audience data - income breakdown249 Cinema audience profile250 Forecasts
Norway
251 Screen advertising market at a glance251 Box office-advertising split251 Screen advertising revenue 1998-2003252 Screen advertising market 1998-2003253 Screen advertising practice253 Market shares253 Screen advertising companies253 Leading advertisers254 Cinema admissions 1998-2003255 Leading exhibition circuits255 Cinema sites and screens of leading
exhibitors256 Cinema exhibition 1998-2003257 Audience data - age breakdown257 Audience data - gender breakdown257 Audience data - regional breakdown257 Audience data - urban/rural split257 Audience data - income breakdown257 Cinema audience profile258 Forecasts
Poland
259 Screen advertising market at a glance259 Box office-advertising split259 Screen advertising revenue 1998-2003260 Screen advertising market 1998-2003
236 Screen advertising market 1998-2003237 Screen advertising practice237 Market shares237 Screen advertising companies237 Leading advertisers237 Market share breakdown between
companies238 Cinema admissions 1998-2003239 Leading exhibition circuits239 Cinema sites and screens of leading
exhibitors240 Cinema exhibition 1998-2003241 Audience data - age breakdown241 Audience data - gender breakdown241 Audience data - regional breakdown241 Audience data - urban/rural split241 Audience data - income breakdown241 Cinema audience profile242 Forecasts
New Zealand
243 Screen advertising market at a glance243 Box office-advertising split243 Screen advertising revenue 1998-2003244 Screen advertising market 1998-2003245 Screen advertising practice245 Market shares245 Screen advertising companies245 Leading advertisers245 Market share breakdown between
companies246 Cinema admissions 1998-2003247 Leading exhibition circuits247 Cinema sites and screens of leading
exhibitors248 Cinema exhibition 1998-2003
19
List of tables and charts
screendigest © 2004
261 Screen advertising practice261 Market shares261 Screen advertising companies261 Leading advertisers261 Market share breakdown between
companies262 Cinema admissions 1998-2003263 Leading exhibition circuits263 Cinema sites and screens of leading
exhibitors264 Cinema exhibition 1998-2003265 Audience data - age breakdown265 Audience data - gender breakdown265 Audience data - regional breakdown265 Audience data - urban/rural split265 Audience data - income breakdown265 Cinema audience profile266 Forecasts
Portugal
267 Screen advertising market at a glance267 Box office-advertising split267 Screen advertising revenue 1998-2003268 Screen advertising market 1998-2003269 Screen advertising practice269 Market shares269 Screen advertising companies269 Leading advertisers269 Market share breakdown between
companies270 Cinema admissions 1998-2003271 Leading exhibition circuits271 Cinema sites and screens of leading
exhibitors272 Cinema exhibition 1998-2003273 Audience data - age breakdown
20 screendigest © 2004
273 Audience data - gender breakdown273 Audience data - regional breakdown273 Audience data - urban/rural split273 Audience data - income breakdown273 Cinema audience profile274 Forecasts
Russia
275 Screen advertising market at a glance275 Box office-advertising split275 Screen advertising revenue 1998-2003276 Screen advertising market 1998-2003277 Screen advertising practice277 Market shares277 Screen advertising companies277 Leading advertisers277 Market share breakdown between
companies278 Cinema admissions 1998-2003279 Leading exhibition circuits279 Cinema sites and screens of leading
exhibitors280 Cinema exhibition 1998-2003281 Audience data - age breakdown281 Audience data - gender breakdown281 Audience data - regional breakdown281 Audience data - urban/rural split281 Audience data - income breakdown281 Cinema audience profile282 Forecasts
Singapore
283 Screen advertising market at a glance283 Box office-advertising split283 Screen advertising revenue 1998-2003
The World Market for Screen Advertising
284 Screen advertising market 1998-2003285 Screen advertising practice285 Market shares285 Screen advertising companies285 Leading advertisers285 Market share breakdown between
companies286 Cinema admissions 1998-2003287 Leading exhibition circuits287 Cinema sites and screens of leading
exhibitors288 Cinema exhibition 1998-2003289 Audience data - age breakdown289 Audience data - gender breakdown289 Audience data - regional breakdown289 Audience data - urban/rural split289 Audience data - income breakdown289 Cinema audience profile290 Forecasts
South Africa
291 Screen advertising market at a glance291 Box office-advertising split291 Screen advertising revenue 1998-2003292 Screen advertising market 1998-2003293 Screen advertising practice293 Market shares293 Screen advertising companies293 Leading advertisers294 Cinema admissions 1998-2003295 Leading exhibition circuits295 Cinema sites and screens of leading
exhibitors296 Cinema exhibition 1998-2003297 Audience data - age breakdown297 Audience data - gender breakdown
297 Audience data - regional breakdown297 Audience data - urban/rural split297 Audience data - income breakdown297 Cinema audience profile298 Forecasts
Spain
299 Screen advertising market at a glance299 Box office-advertising split299 Screen advertising revenue 1998-2003300 Screen advertising market 1998-2003301 Screen advertising practice301 Market shares301 Screen advertising companies301 Leading advertisers301 Market share breakdown between
companies302 Cinema admissions 1998-2003304 Leading exhibition circuits304 Cinema sites and screens of leading
exhibitors305 Cinema exhibition 1998-2003306 Audience data - age breakdown306 Audience data - gender breakdown306 Audience data - regional breakdown306 Audience data - urban/rural split306 Audience data - income breakdown306 Cinema audience profile307 Forecasts
Sweden
309 Screen advertising market at a glance309 Box office-advertising split309 Screen advertising revenue 1998-2003310 Screen advertising market 1998-2003
21
List of tables and charts
screendigest © 2004
311 Screen advertising practice311 Market shares311 Screen advertising companies311 Leading advertisers311 Market share breakdown between
companies312 Cinema admissions 1998-2003313 Leading exhibition circuits313 Cinema sites and screens of leading
exhibitors314 Cinema exhibition 1998-2003315 Audience data - age breakdown315 Audience data - gender breakdown315 Audience data - regional breakdown315 Audience data - urban/rural split315 Audience data - income breakdown315 Cinema audience profile316 Forecasts
Switzerland
317 Screen advertising market at a glance317 Box office-advertising split317 Screen advertising revenue 1998-2003318 Screen advertising market 1998-2003319 Screen advertising practice319 Market shares319 Screen advertising companies319 Leading advertisers320 Cinema admissions 1998-2003321 Leading exhibition circuits321 Cinema sites and screens of leading
exhibitors322 Cinema exhibition 1998-2003323 Audience data - age breakdown323 Audience data - gender breakdown323 Audience data - regional breakdown
323 Audience data - urban/rural split323 Audience data - income breakdown323 Cinema audience profile324 Forecasts
Turkey
325 Screen advertising market at a glance325 Box office-advertising split325 Screen advertising revenue 1998-2003326 Screen advertising market 1998-2003327 Screen advertising practice327 Market shares327 Screen advertising companies327 Leading advertisers327 Market share breakdown between
companies328 Cinema admissions 1998-2003329 Leading exhibition circuits329 Cinema sites and screens of leading
exhibitors330 Cinema exhibition 1998-2003331 Audience data - age breakdown331 Audience data - gender breakdown331 Audience data - regional breakdown331 Audience data - urban/rural split331 Audience data - income breakdown331 Cinema audience profile332 Forecasts
United Arab Emirates (UAE)
333 Screen advertising market at a glance333 Box office-advertising split333 Screen advertising revenue 1998-2003334 Screen advertising market 1998-2003335 Screen advertising practice
22 screendigest © 2004
The World Market for Screen Advertising
335 Market shares335 Screen advertising companies335 Leading advertisers335 Market share breakdown between
companies336 Cinema admissions 1998-2003337 Leading exhibition circuits337 Cinema sites and screens of leading
exhibitors338 Cinema exhibition 1998-2003339 Audience data - age breakdown339 Audience data - gender breakdown339 Audience data - regional breakdown339 Audience data - urban/rural split339 Audience data - income breakdown339 Cinema audience profile340 Forecasts
UK
341 Screen advertising market at a glance341 Box office-advertising split341 Screen advertising revenue 1998-2003342 Screen advertising market 1998-2003343 Screen advertising practice344 Market shares344 Screen advertising companies343 Leading advertisers344 Market share breakdown between
companies345 Cinema admissions 1998-2003346 Leading exhibition circuits346 Cinema sites and screens of leading
exhibitors347 Cinema exhibition 1998-2003348 Audience data - age breakdown348 Audience data - gender breakdown
348 Audience data - regional breakdown348 Audience data - urban/rural split348 Audience data - income breakdown348 Cinema audience profile349 Forecasts
USA
351 Screen advertising market at a glance351 Box office-advertising split351 Screen advertising revenue 1998-2003352 Screen advertising market 1998-2003354 Screen advertising practice354 Market shares353 Screen advertising companies354 Leading advertisers354 Market share breakdown between
companies355 Cinema admissions 1998-2003356 Leading exhibition circuits356 Cinema sites and screens of leading
exhibitors357 Cinema exhibition 1998-2003358 Audience data - age breakdown358 Audience data - gender breakdown358 Audience data - regional breakdown358 Audience data - urban/rural split358 Audience data - income breakdown358 Cinema audience profile359 Forecasts
23
List of tables and charts
screendigest © 2004
MINI-PROFILES
China363 Cinema admissions 1998-2003362 Cinema exhibition 1998-2003364 Leading exhibitors 2004364 Cinema sites and screens of leading
exhibitors
Finland365 Cinema admissions 1998-2003366 Cinema exhibition 1998-2003367 Leading exhibitors 2004367 Cinema sites and screens of leading
exhibitors
Hong Kong369 Cinema admissions 1998-2003370 Cinema exhibition 1998-2003371 Leading exhibitors 2004371 Cinema sites and screens of leading
exhibitors
Japan374 Cinema admissions 1998-2003375 Cinema exhibition 1998-2003376 Leading exhibitors 2004376 Cinema sites and screens of leading
exhibitors
Slovakia377 Cinema admissions 1998-2003378 Cinema exhibition 1998-2003379 Leading exhibitors 2004379 Cinema sites and screens of leading
exhibitors
Thailand382 Cinema admissions 1998-2003383 Cinema exhibition 1998-2003384 Leading exhibitors 2004384 Cinema sites and screens of leading
exhibitors
24
The World Market for Screen Advertising
screendigest © 2004

25
This is the first report of its type to be publishedon the screen advertising sector, and is done soas a joint collaboration between the global tradebody for the sector, Screen Advertising WorldAssociation (SAWA – www.sawa.com) andScreen Digest (www.screendigest.com). Screenadvertising is a growing business sector, withdigital developments and the spread of multiplexcinemas acting as a driver to new and existingcompanies to join the sector. The spread ofmultiplex cinemas across much of the world haspushed up admissions into cinemas, therebyincreasing the attraction for advertisers to use themedium.
This report takes a detailed look at themarket structures, values, players and audiencesof global screen advertising and cinemaexhibition, together with detailed data sets andforecasts. The data provided has been puttogether in such a way as to make it ascomparable as possible given the heterogeneity ofdata in the world.
Screen Digest has been covering theworldwide film and cinema business as part ofthe greater screen entertainment industry since1971. Screen advertising has rarely been studied,even by us, and in 2001, Screen Digest andSAWA decided that it was time for further studyinto the screen advertising sector.
This was a huge challenge, as the data isdisparate, patchy at best but we thought the bestpeople to procure the data were the companies
that operate on a daily basis in the sector. Despite the goodwill of all the relevant
companies, gathering and processing data on thescreen advertising sector has been a challengingexercise. The differing definitions of such thingsas screen advertising revenues, box office andmultiplex screens brings issues of comparabilityand consistency. Where possible these have beenironed out to give accurate and comparable data.Where not possible, a note has been added.Some areas of the screen advertising field are notcovered in this report (such as production) asvery little data was gathered. The longer-termambition will be to widen the areas of coverage.
The process of data-gathering andprocessing is subject to constant revision andimprovement, often resulting in the revision ofhistoric data. This process continues right up to– and beyond – the final deadlines; as a resultsome of the figures in this report may vary fromthose published by Screen Digest in other forms(reports, Screen Digest, online services). Thelonger-term ambition of Screen Digest andSAWA is to improve the harmonisation of globalscreen advertising figures.
However, taken as a whole, we believethat this report is a ground-breaking one andcontains a huge amount of useful information foranyone with an interest in the screen advertisingsector, whether for investment, advertising,strategic or educational purposes.
Introduction
screendigest © 2004
26
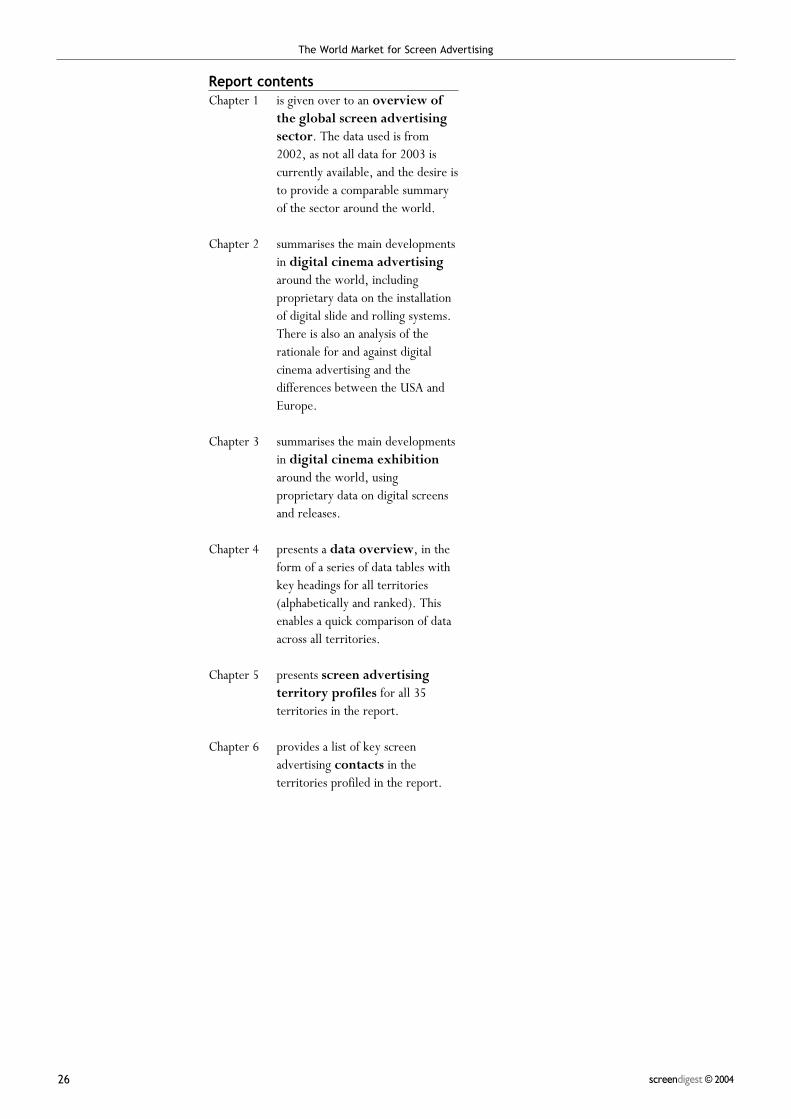
Report contents Chapter 1 is given over to an overview of
the global screen advertisingsector. The data used is from2002, as not all data for 2003 iscurrently available, and the desire isto provide a comparable summaryof the sector around the world.
Chapter 2 summarises the main developmentsin digital cinema advertisingaround the world, includingproprietary data on the installationof digital slide and rolling systems.There is also an analysis of therationale for and against digitalcinema advertising and thedifferences between the USA andEurope.
Chapter 3 summarises the main developmentsin digital cinema exhibitionaround the world, usingproprietary data on digital screensand releases.
Chapter 4 presents a data overview, in theform of a series of data tables withkey headings for all territories(alphabetically and ranked). Thisenables a quick comparison of dataacross all territories.
Chapter 5 presents screen advertisingterritory profiles for all 35territories in the report.
Chapter 6 provides a list of key screenadvertising contacts in theterritories profiled in the report.
screendigest © 2004
The World Market for Screen Advertising
27
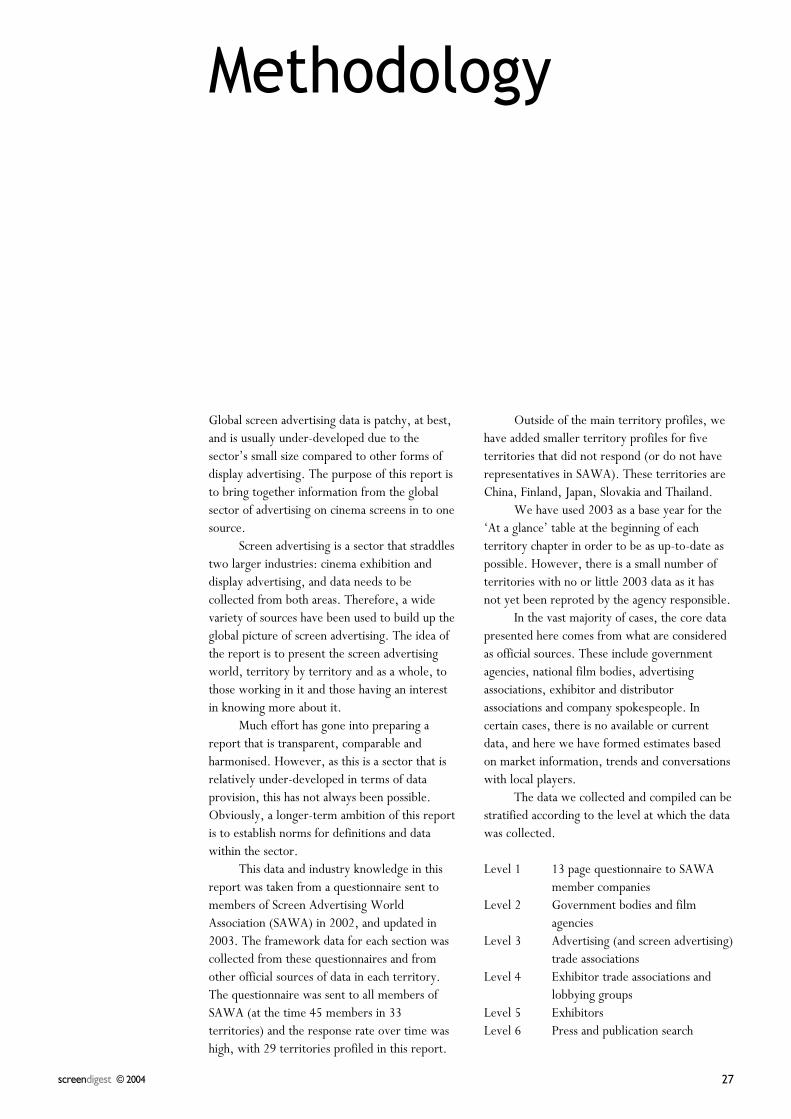
Global screen advertising data is patchy, at best,and is usually under-developed due to thesector’s small size compared to other forms ofdisplay advertising. The purpose of this report isto bring together information from the globalsector of advertising on cinema screens in to onesource.
Screen advertising is a sector that straddlestwo larger industries: cinema exhibition anddisplay advertising, and data needs to becollected from both areas. Therefore, a widevariety of sources have been used to build up theglobal picture of screen advertising. The idea ofthe report is to present the screen advertisingworld, territory by territory and as a whole, tothose working in it and those having an interestin knowing more about it.
Much effort has gone into preparing areport that is transparent, comparable andharmonised. However, as this is a sector that isrelatively under-developed in terms of dataprovision, this has not always been possible.Obviously, a longer-term ambition of this reportis to establish norms for definitions and datawithin the sector.
This data and industry knowledge in thisreport was taken from a questionnaire sent tomembers of Screen Advertising WorldAssociation (SAWA) in 2002, and updated in2003. The framework data for each section wascollected from these questionnaires and fromother official sources of data in each territory.The questionnaire was sent to all members ofSAWA (at the time 45 members in 33territories) and the response rate over time washigh, with 29 territories profiled in this report.
Outside of the main territory profiles, wehave added smaller territory profiles for fiveterritories that did not respond (or do not haverepresentatives in SAWA). These territories areChina, Finland, Japan, Slovakia and Thailand.
We have used 2003 as a base year for the‘At a glance’ table at the beginning of eachterritory chapter in order to be as up-to-date aspossible. However, there is a small number ofterritories with no or little 2003 data as it hasnot yet been reproted by the agency responsible.
In the vast majority of cases, the core datapresented here comes from what are consideredas official sources. These include governmentagencies, national film bodies, advertisingassociations, exhibitor and distributorassociations and company spokespeople. Incertain cases, there is no available or currentdata, and here we have formed estimates basedon market information, trends and conversationswith local players.
The data we collected and compiled can bestratified according to the level at which the datawas collected.
Level 1 13 page questionnaire to SAWAmember companies
Level 2 Government bodies and filmagencies
Level 3 Advertising (and screen advertising)trade associations
Level 4 Exhibitor trade associations andlobbying groups
Level 5 Exhibitors Level 6 Press and publication search
Methodology
screendigest © 2004

28
Total value of screen advertising Total value of screen advertising revenues. Definitions differ slightly between territories.
of which rolling stock Value of the rolling stock element of screen ad revenues
of which slide advertising Value of the slide element of screen ad revenues
Total value of screen advertising Figures in dollars.
of which rolling stock Figures in dollars
of which slide advertising Figures in dollars
Screen advertising revenues per screens Calculation using total number of screens, not just those that accept advertising
Screen advertising revenues per screens
Screen advertising revenues per site Calculation using total number of cinemas, not just those that accept advertising
Screen advertising revenues per site
Screen advertising revenues per seat Calculation using total number of seats
Screen advertising revenues per seat
Screen advertising revenues per capita Calculation using population data (see below)
Screen advertising revenues per capita
Screen advertising revenues per admission Calculation using total national admissions
Screen advertising revenues per admission
Screen advertising revenues per 1000 admissions Above calculation multipled by 1,000
Screen advertising revenues per 1000 admissions
Screen advertising as proportion of display advertising The percentage of total display advertising that screen advertising represents
Screen advertising as a proportion of box office The percentage of total box office that screen advertising represents
Population Population data taken from UN
Dollar exchange rate Exchange rate data taken from Federal Reserve Bank, European Central Bank and others
Admissions Total cinema admissions
Gross box office revenue Gross box office revenue in national currency
Gross box office revenue Gross box office in dollars
Admissions per head Average number of visits per person per year
Box office per head Average spend per head
Box office per head in dollars
Admissions change Growth rate of cinema admisisons
Box office growth Growth rate of box office
Screen change Growth rate of total screens
Average ticket price Box office divided by admissions
Average ticket price in dollars
cinema sites Total number of cinemas at end of year
cinema screens Total screen base at end of year
multiplex sites Total number of multiplex cinemas at end of year (five screens or more)
multiplex screens Total multiplex screen base at end of year (defined as five screens or more)
% multiplex sites Multiplex sites as a proportion of total sites
% multiplex screens: > 5 screens Multiplex screens as a proportion of total screens
% multiplex screens: > If used, this figure represents the local definition of a multiplex
Average screen per site Average screens at each cinema site
Number of seats Total number of seats in all cinemas
Average seats per screen
Average revenue per screen Total box office divided by total screens
Average revenue per screen in dollars
Average admissions per screen Admissions divided by total screens
screens per mn people Number of screens per million head of population
Box office of leading 10 films The proportion of total box office represented by Top 10 films
screendigest © 2004
The World Market for Screen Advertising
Screen advertising
Cinema exhibition
29
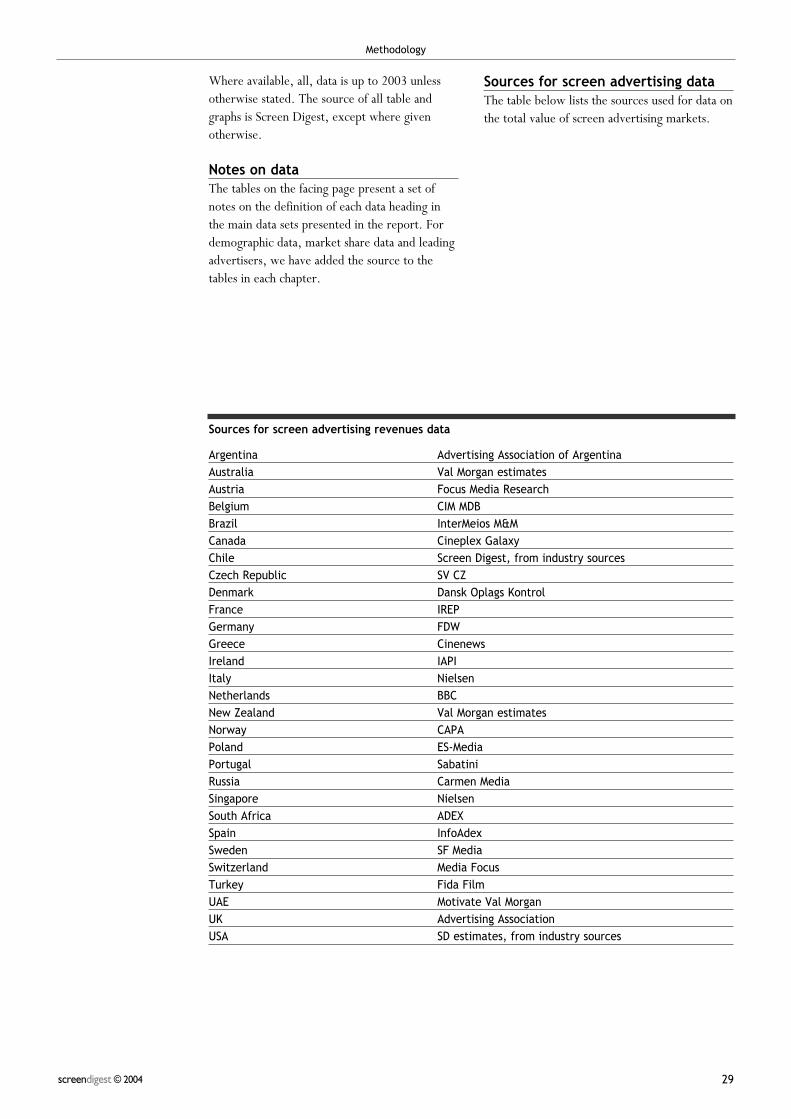
Where available, all, data is up to 2003 unlessotherwise stated. The source of all table andgraphs is Screen Digest, except where givenotherwise.
Notes on dataThe tables on the facing page present a set ofnotes on the definition of each data heading inthe main data sets presented in the report. Fordemographic data, market share data and leadingadvertisers, we have added the source to thetables in each chapter.
screendigest © 2004
Sources for screen advertising dataThe table below lists the sources used for data onthe total value of screen advertising markets.
Methodology
Argentina Advertising Association of Argentina
Australia Val Morgan estimates
Austria Focus Media Research
Belgium CIM MDB
Brazil InterMeios M&M
Canada Cineplex Galaxy
Chile Screen Digest, from industry sources
Czech Republic SV CZ
Denmark Dansk Oplags Kontrol
France IREP
Germany FDW
Greece Cinenews
Ireland IAPI
Italy Nielsen
Netherlands BBC
New Zealand Val Morgan estimates
Norway CAPA
Poland ES-Media
Portugal Sabatini
Russia Carmen Media
Singapore Nielsen
South Africa ADEX
Spain InfoAdex
Sweden SF Media
Switzerland Media Focus
Turkey Fida Film
UAE Motivate Val Morgan
UK Advertising Association
USA SD estimates, from industry sources
Sources for screen advertising revenues data

30 screendigest © 2004
The World Market for Screen Advertising
It is not clear how much the screenadvertising market is worth in Chile, asthere is no firm data. However, estimatesput the sector’s value at around $1m.This is equal to about one per cent oftotal display advertising. The sector hasgrown in recent years on the back ofmultiplex cinema construction. It grew(in terms of screens accepting screenadvertising) particularly between 1997and 1999 (66 screens to 160 screens overthe two year period). However,advertising in Chile has been goingthrough a difficult period in general andit remains to be seen if the advantagesoffered by screen advertising canovercome the lack of confidence and
unwillingness to invest in the sector. The selling philosophy in Chile is on
a screen by screen basis. The averageamount of time given over to screenadvertising in the pre-showentertainment is six minutes, whereasthere are an average of 10 minutes oftrailers. Screen adverts are generallyshown before trailers, althoughoccasionally a premium ad may be playedbetween two trailers.
The cost of showing an ad on 1screen for a 30-second spot over a sixweek period is $1,800.
The leading advertisers in the
territory are for food, communications,higher education, automobiles andsporting goods.
There are two laws that areparticularly relevant for cinemaadvertising (Ley de la Censura refers toalcohol and tobacco and Ley deCalificacion refers to a PG rating).TheGovernment is responsible for enforcingthese laws.
Apart from screen time, companiesalso offer the use of product samples, in-lobby promotions and stands to advertiseproducts.
ChileThe World Market for Screen Advertising
CL
screendigest © 2004 169
Chile
2002 change 02/01
Population 000s 15,601 1.35%
Box office revenues Peso m 18,229 4.87%
$m 26 -4.24%
Admissions 000s 12,500 1.86%
Number of cinema sites : :
Number of cinema screens 238 32.22%
Number of cinema seats : :
Value of screen advertising Peso m 704 :
$ m 1 :
Average ticket price Peso 1458.32 2.96%
$ 1.42 -8.69%
Chilel: Screen advertising market in 2002 at a glance
Screenadvertising
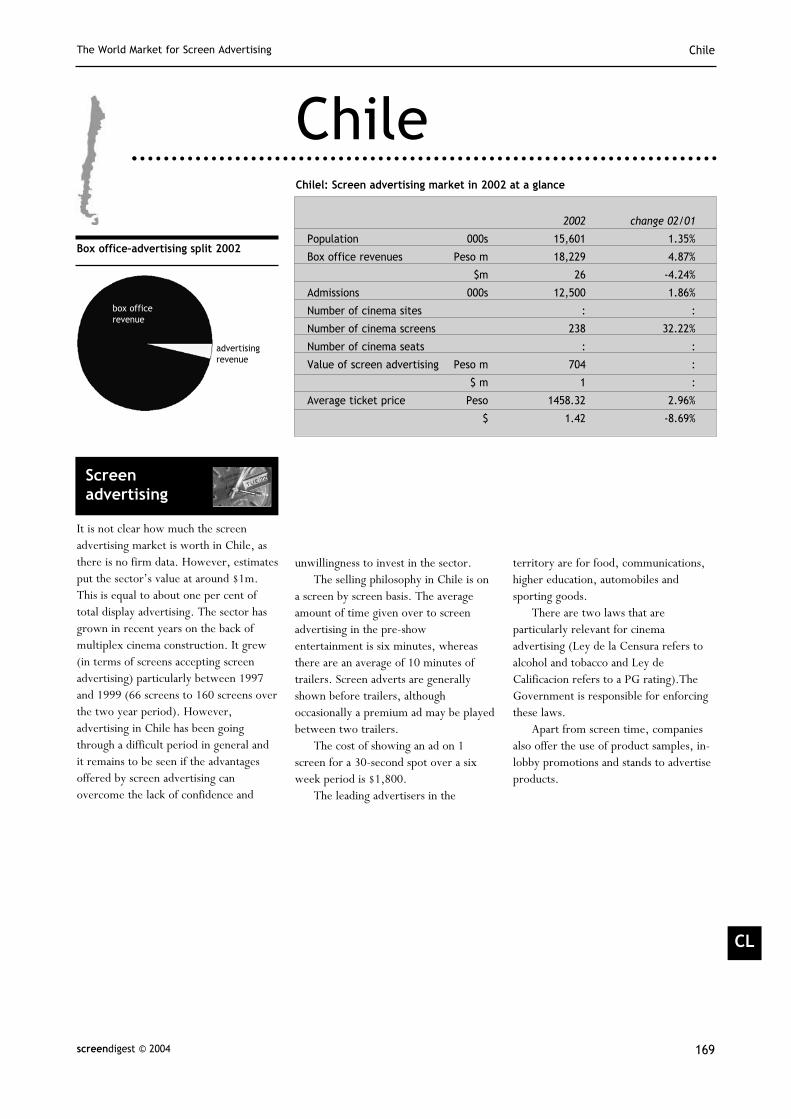
Box office–advertising split 2002
box officerevenue
advertisingrevenue
Chile The World Market for Screen Advertising
screendigest © 2004170
Screen advertising market 1998 1999 2000 2001 2002 2003
Total value of screen advertising Peso : : : : 703,770,000.0
of which rolling stock Peso : : : : na
of which slide advertising Peso : : : : na
Total value of screen advertising $ : : : : 1,000,000.0
of which rolling stock $ : : : : na
of which slide advertising $ : : : : na
Screen advertising revenues
Revenues per screens Peso : : : : 2,957,016.81
Revenues per screens $ : : : : 4,201.68
Revenues per site Peso : : : : :
Revenues per site $ : : : : :
Revenues per seat Peso : : : : :
Revenues per seat $ : : : : :
Revenues per capita Peso : : : : 45.11
Revenues per capita $ : : : : 0.06
Revenues per admission Peso : : : : 56.30
Revenues per admission $ : : : : 0.08
Revenues per 1000 admissions Peso : : : : 56,303.0
Revenues per 1000 admissions $ : : : : 80.0
Screen advertising as proportion of overall display advertising % : : : : 1
Screen advertising as a proportion of box office % : : : : 3.86%
Chile: Screen advertising market 1998-2003
Market Drivers Chile has a fairly high proportion ofmultiplex cinemas, with threeinternational chains building in theterritory. These cinemas are all signed upwith screen advertising companies andthe rate of growth of screen advertisingsector will depend largely on how fastmew multiplex sites are built andsecondly, how fast this screen growth
pushes admissions. All new multiplexcinemas are technologically advanced andthe role of technology, particularly digitaltechnology, will also play a large part inhow cinema advertising develops.Advertisers will particularly want to seehigh levels of accountability, which isachieved largely by computer systems.
In addition, screen advertising offersa new alternative to advertisers and a
cinema offers a valuable target market ofrelatively young and affluent people. Thiswill push the medium with advertisers ofparticular products (mobile phones,sporting goods…)
Screen advertisingcompaniesTwo companies are active in screenadvertising in Chile. The first (and amember of SAWA) is ValMorganFilmSuez Publicidad Chile. The companyis a joint venture between Australiancompany Val Morgan and local companyFilmsuez. It was established in 1998 andis only engaged in screen advertising. Thecompany has six employees. VMFScovers 74 screens (or 31 per cent ofChile’s 238 screens in 2002). Theyrepresent CineHoyts and Showcase, bothinternational cinema groups operating inChile. They account for a 60 per centmarket share by revenues. They have setup a trial for a digital cinema advertisingnetwork.
The second company is Avicine,which is a subsidiary of local media groupChileFilms. It represents Chilefilms’ owncircuit, Conate, and US exhibitorCinemark. It represents 93 screens.
ChileThe World Market for Screen Advertising
CL
screendigest © 2004 171
Chile: Screen advertising companies
Company 1 Val Morgan FilmSuez Publicidad
Contact Juan Carlos Labriola
Details [email protected]
Corporate structure Joint venture
Year established 1998
Employees 6
Main activity Cinema advertising
Other activities None
Screens covered 74
Digital networks and/or plans Trials done
Company 2 Avicine
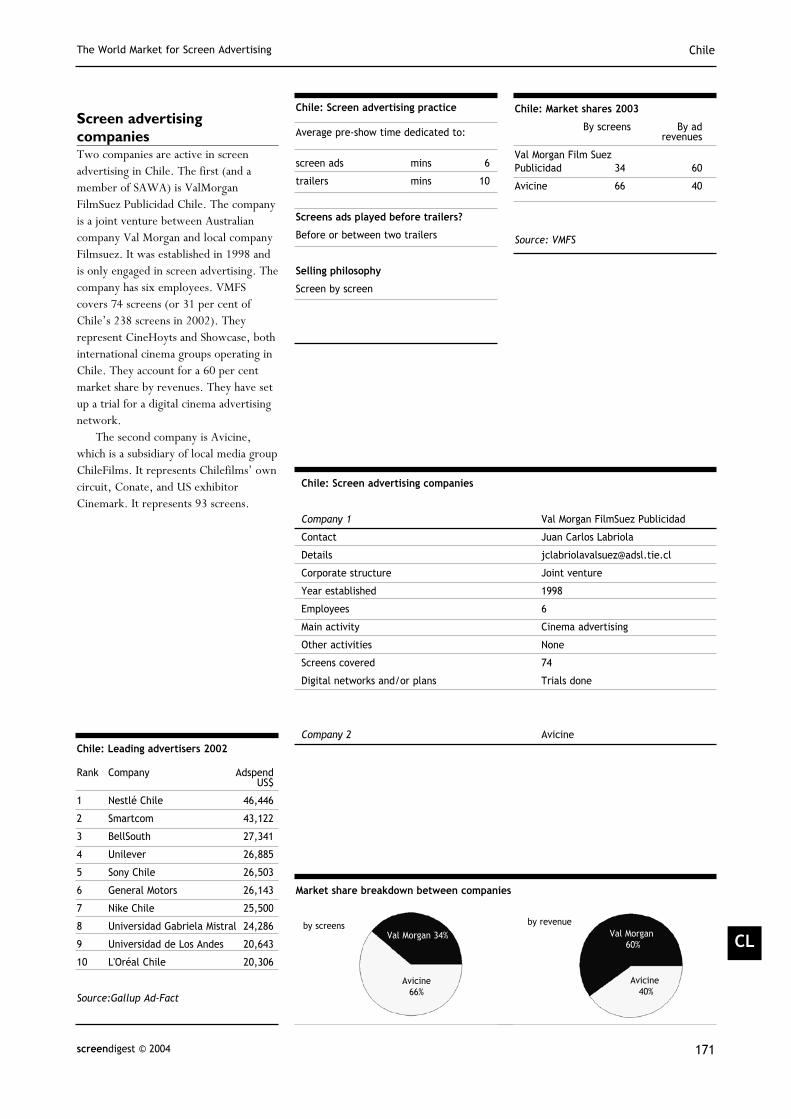
Chile: Market shares 2003
By screens By adrevenues
Val Morgan Film Suez Publicidad 34 60
Avicine 66 40
Source: VMFS
Rank Company AdspendUS$
1 Nestlé Chile 46,446
2 Smartcom 43,122
3 BellSouth 27,341
4 Unilever 26,885
5 Sony Chile 26,503
6 General Motors 26,143
7 Nike Chile 25,500
8 Universidad Gabriela Mistral 24,286
9 Universidad de Los Andes 20,643
10 L'Oréal Chile 20,306
Source:Gallup Ad-Fact
Chile: Leading advertisers 2002
Average pre-show time dedicated to:
screen ads mins 6
trailers mins 10
Screens ads played before trailers?
Before or between two trailers
Selling philosophy
Screen by screen
Chile: Screen advertising practice
Market share breakdown between companies
Val Morgan 34%
Avicine66%
by screensVal Morgan
60%
Avicine40%
by revenue
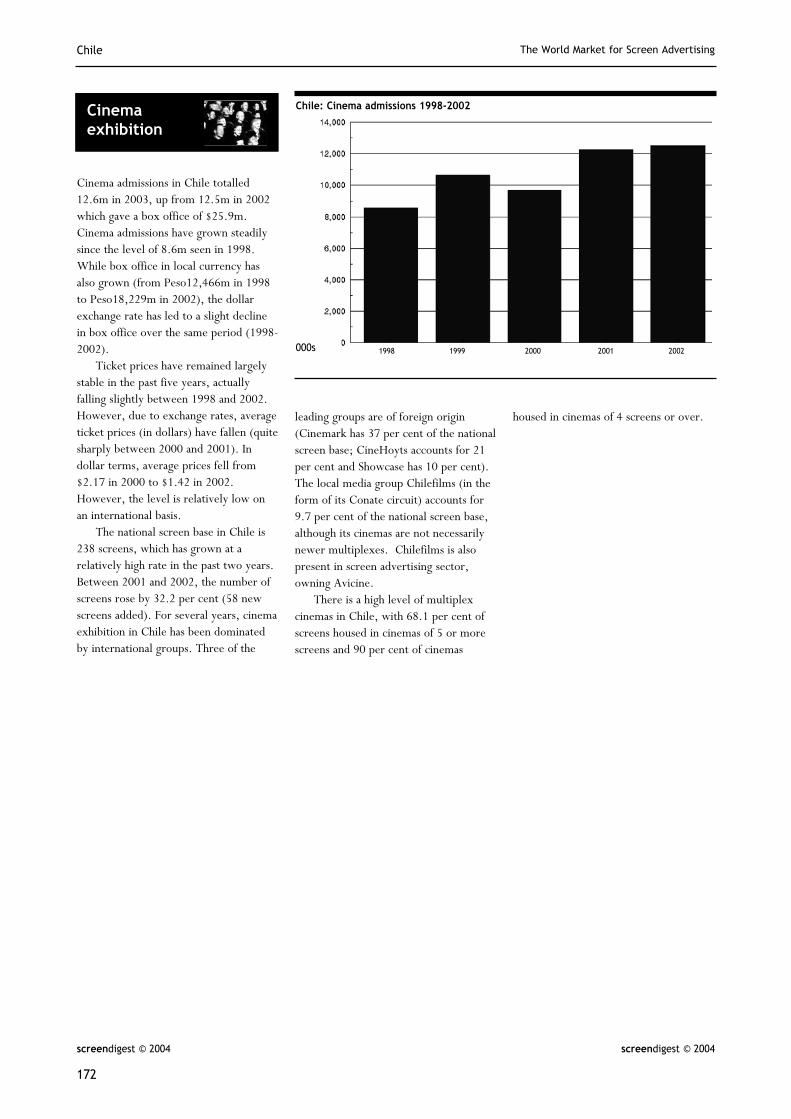
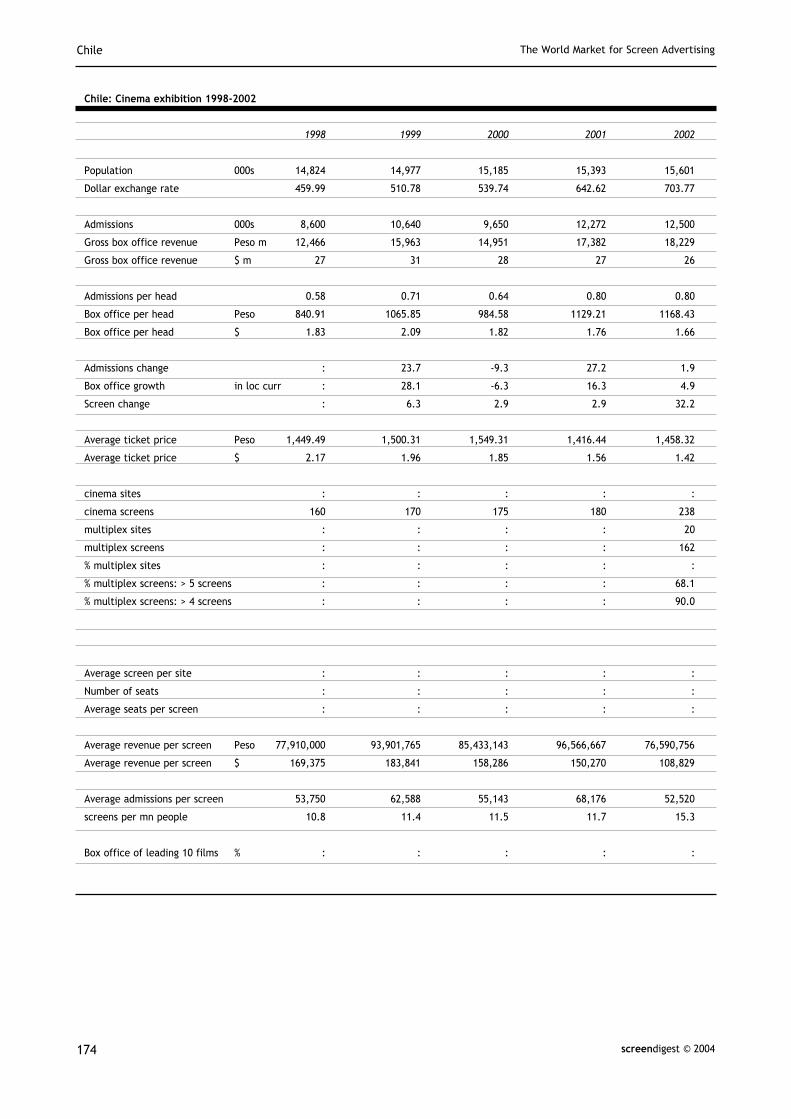
Cinema admissions in Chile totalled12.6m in 2003, up from 12.5m in 2002which gave a box office of $25.9m.Cinema admissions have grown steadilysince the level of 8.6m seen in 1998.While box office in local currency hasalso grown (from Peso12,466m in 1998to Peso18,229m in 2002), the dollarexchange rate has led to a slight declinein box office over the same period (1998-2002).
Ticket prices have remained largelystable in the past five years, actuallyfalling slightly between 1998 and 2002.However, due to exchange rates, averageticket prices (in dollars) have fallen (quitesharply between 2000 and 2001). Indollar terms, average prices fell from$2.17 in 2000 to $1.42 in 2002.However, the level is relatively low onan international basis.
The national screen base in Chile is238 screens, which has grown at arelatively high rate in the past two years.Between 2001 and 2002, the number ofscreens rose by 32.2 per cent (58 newscreens added). For several years, cinemaexhibition in Chile has been dominatedby international groups. Three of the
leading groups are of foreign origin(Cinemark has 37 per cent of the nationalscreen base; CineHoyts accounts for 21per cent and Showcase has 10 per cent).The local media group Chilefilms (in theform of its Conate circuit) accounts for9.7 per cent of the national screen base,although its cinemas are not necessarilynewer multiplexes. Chilefilms is alsopresent in screen advertising sector,owning Avicine.
There is a high level of multiplexcinemas in Chile, with 68.1 per cent ofscreens housed in cinemas of 5 or morescreens and 90 per cent of cinemas
housed in cinemas of 4 screens or over.
Chile The World Market for Screen Advertising
screendigest © 2004
172
screendigest © 2004
Chile: Cinema admissions 1998-2002
1998 1999 2000 2001 2002
Cinemaexhibition
000s
ChileThe World Market for Screen Advertising
CL
screendigest © 2004 173
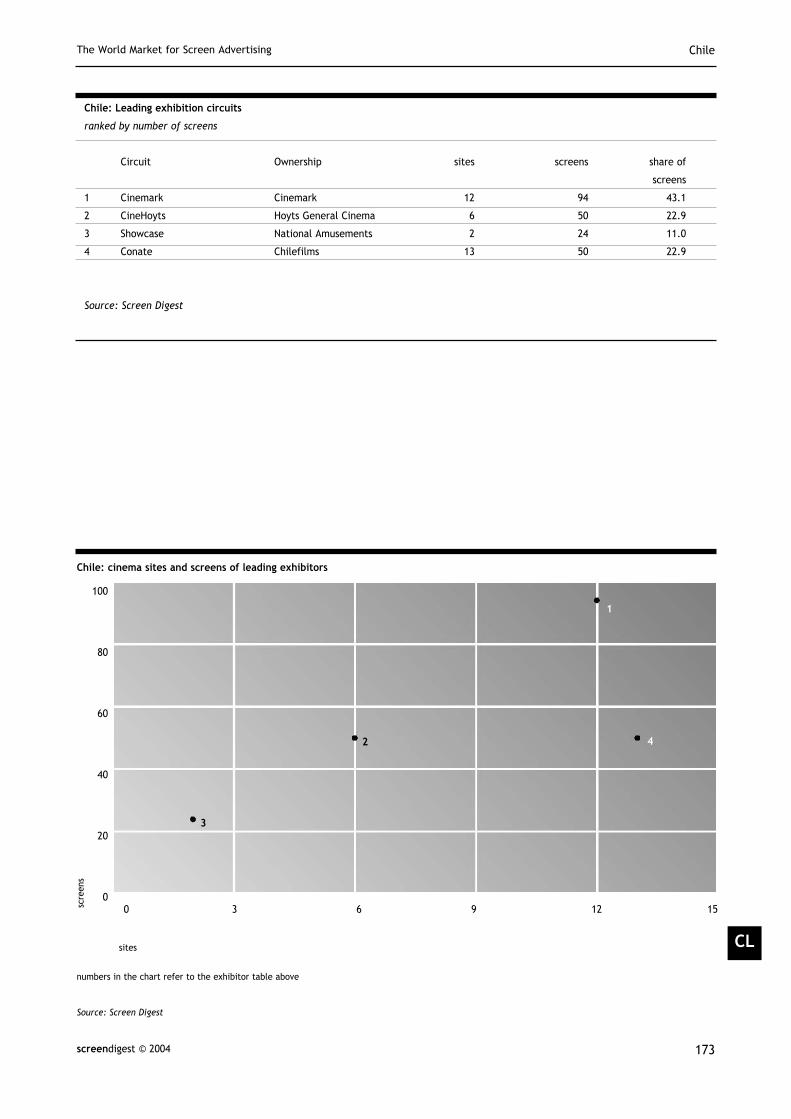
Chile: Leading exhibition circuits
ranked by number of screens
Circuit Ownership sites screens share of
screens
1 Cinemark Cinemark 12 94 43.1
2 CineHoyts Hoyts General Cinema 6 50 22.9
3 Showcase National Amusements 2 24 11.0
4 Conate Chilefilms 13 50 22.9
Source: Screen Digest
0 3 6 9 12 15
100
80
60
40
20
0
sites
numbers in the chart refer to the exhibitor table above
Source: Screen Digest
scre
ens
Chile: cinema sites and screens of leading exhibitors
1
42
3
Chile The World Market for Screen Advertising
screendigest © 2004174
Chile: Cinema exhibition 1998-2002
1998 1999 2000 2001 2002
Population 000s 14,824 14,977 15,185 15,393 15,601
Dollar exchange rate 459.99 510.78 539.74 642.62 703.77
Admissions 000s 8,600 10,640 9,650 12,272 12,500
Gross box office revenue Peso m 12,466 15,963 14,951 17,382 18,229
Gross box office revenue $ m 27 31 28 27 26
Admissions per head 0.58 0.71 0.64 0.80 0.80
Box office per head Peso 840.91 1065.85 984.58 1129.21 1168.43
Box office per head $ 1.83 2.09 1.82 1.76 1.66
Admissions change : 23.7 -9.3 27.2 1.9
Box office growth in loc curr : 28.1 -6.3 16.3 4.9
Screen change : 6.3 2.9 2.9 32.2
Average ticket price Peso 1,449.49 1,500.31 1,549.31 1,416.44 1,458.32
Average ticket price $ 2.17 1.96 1.85 1.56 1.42
cinema sites : : : : :
cinema screens 160 170 175 180 238
multiplex sites : : : : 20
multiplex screens : : : : 162
% multiplex sites : : : : :
% multiplex screens: > 5 screens : : : : 68.1
% multiplex screens: > 4 screens : : : : 90.0
Average screen per site : : : : :
Number of seats : : : : :
Average seats per screen : : : : :
Average revenue per screen Peso 77,910,000 93,901,765 85,433,143 96,566,667 76,590,756
Average revenue per screen $ 169,375 183,841 158,286 150,270 108,829
Average admissions per screen 53,750 62,588 55,143 68,176 52,520
screens per mn people 10.8 11.4 11.5 11.7 15.3
Box office of leading 10 films % : : : : :
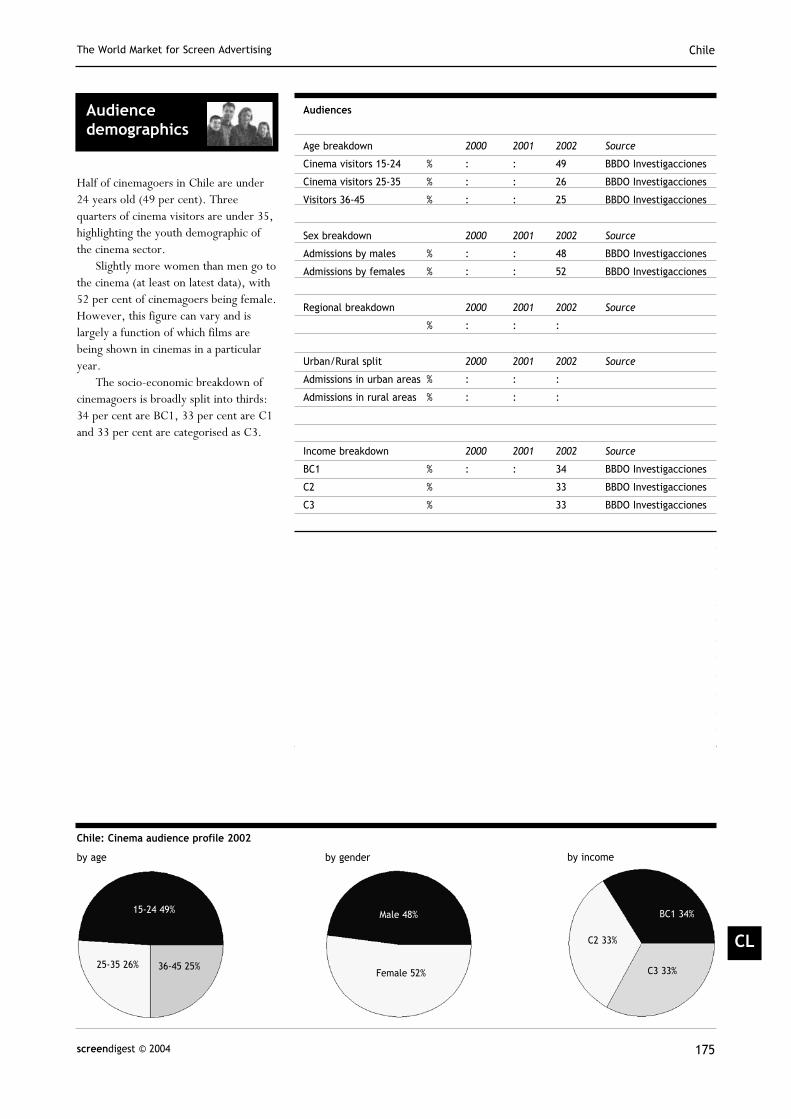
Half of cinemagoers in Chile are under24 years old (49 per cent). Threequarters of cinema visitors are under 35,highlighting the youth demographic ofthe cinema sector.
Slightly more women than men go tothe cinema (at least on latest data), with52 per cent of cinemagoers being female.However, this figure can vary and islargely a function of which films arebeing shown in cinemas in a particularyear.
The socio-economic breakdown ofcinemagoers is broadly split into thirds:34 per cent are BC1, 33 per cent are C1and 33 per cent are categorised as C3.
ChileThe World Market for Screen Advertising
CL
screendigest © 2004 175
Audiencedemographics
Audiences
Age breakdown 2000 2001 2002 Source
Cinema visitors 15-24 % : : 49 BBDO Investigacciones
Cinema visitors 25-35 % : : 26 BBDO Investigacciones
Visitors 36-45 % : : 25 BBDO Investigacciones
Sex breakdown 2000 2001 2002 Source
Admissions by males % : : 48 BBDO Investigacciones
Admissions by females % : : 52 BBDO Investigacciones
Regional breakdown 2000 2001 2002 Source
% : : :
Urban/Rural split 2000 2001 2002 Source
Admissions in urban areas % : : :
Admissions in rural areas % : : :
Income breakdown 2000 2001 2002 Source
BC1 % : : 34 BBDO Investigacciones
C2 % 33 BBDO Investigacciones
C3 % 33 BBDO Investigacciones
25-35 26% 36-45 25%
15-24 49%
Chile: Cinema audience profile 2002
by age by gender by income
Male 48%
Female 52%
C2 33%
BC1 34%
C3 33%
Chile did not have any digital cinema ordigital advertising activity as of early2004. However, Val Morgan Filmsuezhas had a trial underway for nearly a yearnow.
Chile The World Market for Screen Advertising
screendigest © 2004176
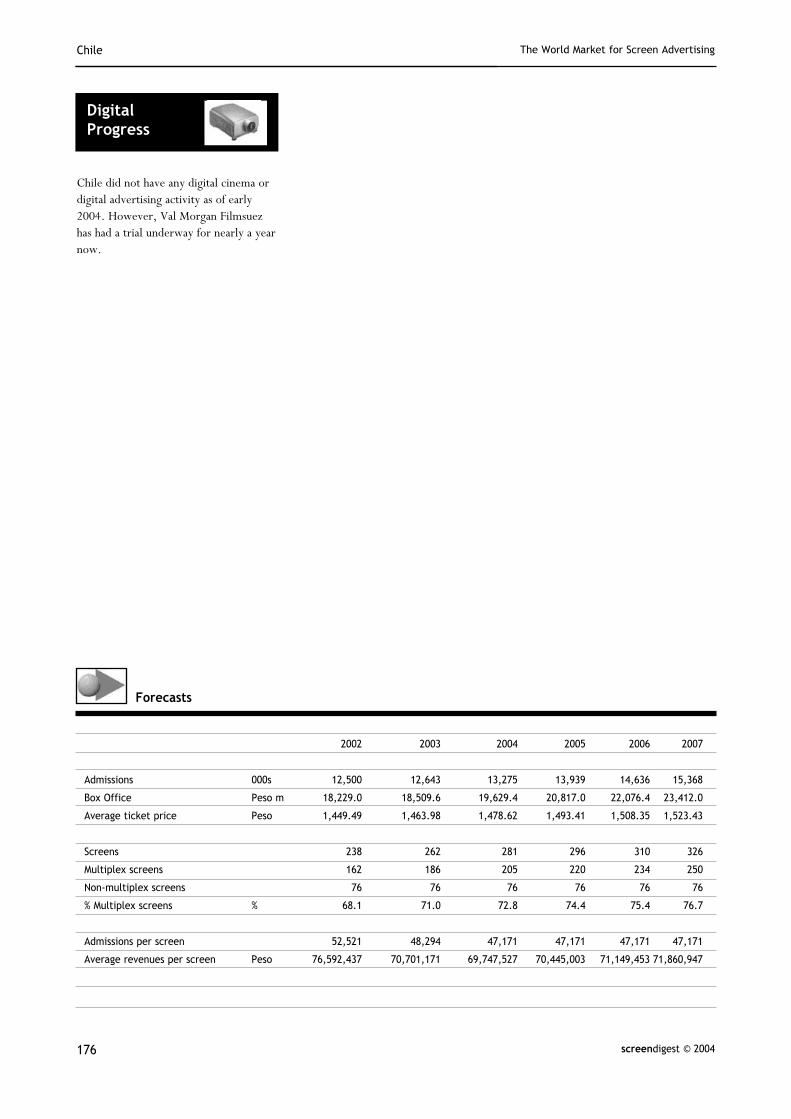
2002 2003 2004 2005 2006 2007
Admissions 000s 12,500 12,643 13,275 13,939 14,636 15,368
Box Office Peso m 18,229.0 18,509.6 19,629.4 20,817.0 22,076.4 23,412.0
Average ticket price Peso 1,449.49 1,463.98 1,478.62 1,493.41 1,508.35 1,523.43
Screens 238 262 281 296 310 326
Multiplex screens 162 186 205 220 234 250
Non-multiplex screens 76 76 76 76 76 76
% Multiplex screens % 68.1 71.0 72.8 74.4 75.4 76.7
Admissions per screen 52,521 48,294 47,171 47,171 47,171 47,171
Average revenues per screen Peso 76,592,437 70,701,171 69,747,527 70,445,003 71,149,453 71,860,947
Forecasts
DigitalProgress

Screen Digest is the leading news and market research journal for theinternational media business. Read by senior executives in over 40countries, it has an unrivaled reputation for concise, impartial reportingand comprehensive coverage of all audio-visual media.
Since being founded in 1971, it has built up a remarkable database ofreference material and statistics, frequently cited in business and officialreports around the world.The company also undertakes private clientresearch for major international media companies and trade associations.
Visit www.screendigest.com
The Screen Advertising World Association (SAWA) is aworldwide trade body of screen advertising companies and associatedcompanies that have relationships with and supply services to the screenadvertising industry.The aims of SAWA are to develop internationalstandards and practices for screen advertising and to improvecommunication between screen advertising companies around the worldto facilitate the easier buying of the cinema medium for advertisers.
Now in its 51st year, SAWA has 55 different members across 35countries.Among its activities, SAWA hosts a major conference everyone to two years to review how best to help media buyers andadvertisers to make the decision to buy cinema.
Visit www.sawa.com
R040502
screendigest Global media intelligence