the world of vopak€¦ · the world of vopak full year 2015 results royal vopak fy 2015 roadshow...
TRANSCRIPT

THE WORLD OF VOPAK FULL YEAR 2015 RESULTS
ROYAL VOPAK
FY 2015 ROADSHOW PRESENTATION

2 FY 2015 ROADSHOW PRESENTATION
This presentation contains ‘forward-looking statements’, based on currently available plans and forecasts.
By their nature, forward-looking statements involve risks and uncertainties because they relate to events and
depend on circumstances that may or may not occur in the future, and Vopak cannot guarantee the accuracy
and completeness of forward-looking statements.
These risks and uncertainties include, but are not limited to, factors affecting the realization of ambitions and
financial expectations, developments regarding the potential capital raising, exceptional income and expense
items, operational developments and trading conditions, economic, political and foreign exchange
developments and changes to IFRS reporting rules.
Vopak’s outlook does not represent a forecast or any expectation of future results or financial performance.
Statements of a forward-looking nature issued by the company must always be assessed in the context of the
events, risks and uncertainties of the markets and environments in which Vopak operates. These factors
could lead to actual results being materially different from those expected, and Vopak does not undertake to
publicly update or revise any of these forward-looking statements.
FORWARD-LOOKING STATEMENTS

GENERAL INTRODUCTION
ROYAL VOPAK
FY 2015 ROADSHOW PRESENTATION

4
General
introduction
Market
trends
Strategy
execution
Capital
management
Business
performance
Looking ahead & other topics
FY 2015 ROADSHOW PRESENTATION
VOPAK AT A GLANCE
THE WORLD’S LEADING INDEPENDENT TANK STORAGE COMPANY
Building on an
impressive history of
400 years
Track record
developing new
terminals in new
markets
Share price from
EUR 7.8 in 2004 to
EUR 41.5 in 2016*
Thorough analysis of
future flows and
imbalances
World’s largest
independent
tank terminal operator:
74 terminals in
26 countries*
* As per 26 February 2016
Listed at the
Euronext AEX
Market cap. of
EUR 5.3 billion*

5 FY 2015 ROADSHOW PRESENTATION
General
introduction
Market
trends
Strategy
execution
Capital
management
Business
performance
Looking ahead & other topics
FINANCIAL DEVELOPMENT
812763753768636598
513429
370314
2014 2013
2012 2011 2010 2009 2008 2007 2006 2015
EBITDA development In EUR million
2014
0.90
2013
0.90
2012
0.88
2011
0.80
2010
0.70
2009
0.63
2008
0.55
2007
0.48
2006
0.38
2015
1.00
Dividend In EUR
Cash flow from operating activities (gross) In EUR million
867787760
685
523492474401
341289
2014 2013 2012 2011 2010 2009 2008 2007 2006 2015
Occupancy rate In percent
92888891939394959694
2013 2014 2012 2011 2010 2009 2008 2007 2006 2015

6 FY 2015 ROADSHOW PRESENTATION
General
introduction
Market
trends
Strategy
execution
Capital
management
Business
performance
Looking ahead & other topics
Strategic
locations along major
trade routes
Safe,
efficient
and clean services
Strong and
reliable link in
the value
chain
Ability to
innovate and
stay
relevant
Operating
according to
our core
values
VOPAK’S AMBITION
TO BE THE PARTNER OF CHOICE FOR ALL OUR STAKEHOLDERS
7 FY 2015 ROADSHOW PRESENTATION
General
introduction
Market
trends
Strategy
execution
Capital
management
Business
performance
Looking ahead & other topics
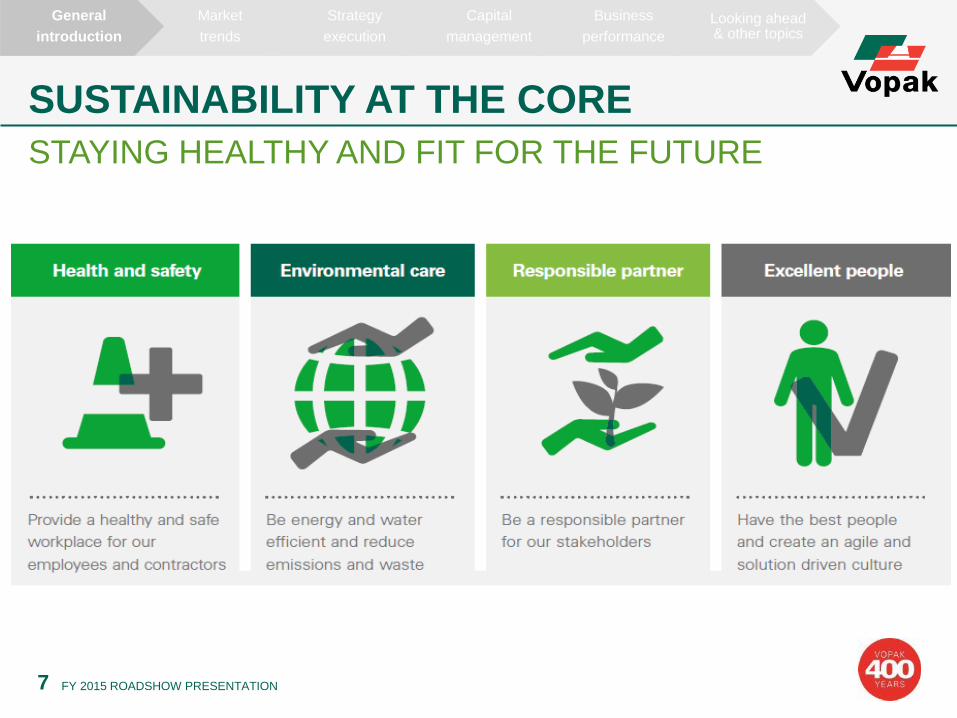
SUSTAINABILITY AT THE CORE
STAYING HEALTHY AND FIT FOR THE FUTURE

8 FY 2015 ROADSHOW PRESENTATION
General
introduction
Market
trends
Strategy
execution
Capital
management
Business
performance
Looking ahead & other topics
EXECUTION OF THE STRATEGY
HIGHLIGHTS OF 2015
Optimization of the terminal
portfolio through the:
o divestment program
o commissioning of new
terminals
o capacity expansions at
existing terminals
o Storage agreement Sadara
in Jubail
Focus on safety and the
prevention of incidents
(‘My Learning Operations’)
Upgrading the integrity of our
assets and service offerings
through a systematic capital
expenditure approach
(‘ME2’ - global maintenance
management system)
Service improvement
initiatives*:
o modernized port information
systems (Deer Park,
Americas)
o new rail (un)loading station
(Vlaardingen, NL)
o new pipeline connections to
customers (Banyan, Asia
and Laurenshaven, NL)
*Note: these are a few examples of the service improvement initiatives that materialized in 2015

9 FY 2015 ROADSHOW PRESENTATION
General
introduction
Market
trends
Strategy
execution
Capital
management
Business
performance
Looking ahead & other topics
PRIORITIES FOR CASH
Debt servicing EUR 2.3 billion, remaining maturity 8 years, average interest 4.2%
Dividend EUR 0.9b paid to shareholders in the last 12 years
Disciplined growth Network expanded from 19.9 to 34.3 million cbm*
Capital optimization Create further flexibility for growth
1
2
3
4
* As per 26 February with 4.2 million cbm under construction up to and including 2019

10 FY 2015 ROADSHOW PRESENTATION
General
introduction
Market
trends
Strategy
execution
Capital
management
Business
performance
Looking ahead & other topics
BUSINESS CHALLENGES
Strategic Operational
Compliance
Competitive environment
Changing flows
Financial
Geopolitics
Legislation
Safety and service
Global maintenance
management
Systems and technology
Cash flow generation
Capital management

11 FY 2015 ROADSHOW PRESENTATION
General
introduction
Market
trends
Strategy
execution
Capital
management
Business
performance
Looking ahead & other topics
DISCUSSIONS WITH INVESTORS
Market dynamics
Growth in China
Projects
Pricing development
Impact contango
Projects under construction
New opportunities
Governance
Governing joint ventures and
associates
Network alignment
Portfolio optimization

MARKET TRENDS
ROYAL VOPAK
FY 2015 ROADSHOW PRESENTATION

13 FY 2015 ROADSHOW PRESENTATION
General
introduction
Market
trends
Strategy
execution
Capital
management
Business
performance
Looking ahead & other topics
MEGA TRENDS
Population In billion
GDP In trillion 2010$
Energy demand In quadrillion BTUs
Note: figures and growth scenarios based on research by various institutions such as the World Bank, IMF and IEA
LONG-TERM STORAGE DEMAND DRIVERS
0
2
4
6
8
10
2040 2020 2000
Global population
expected to rise to
~9 billion in 2040
0
40
80
120
160
2040 2020 2000
GDP expected to
double in 2040 0
200
400
600
800
1.000
2040 2020 2000
Energy consumption
continues to increase
sharply despite
efficiency trends
LNG as
transport fuel
Shale gas in
China
European refining
& petrochemical
Biofuel
scenarios
Energy role of
Africa
US oil and gas
export scenarios

14 FY 2015 ROADSHOW PRESENTATION
General
introduction
Market
trends
Strategy
execution
Capital
management
Business
performance
Looking ahead & other topics
STRUCTURAL IMBALANCES
INCREASING TRADE EXPECTED TO CONTINUE
Refined petroleum accumulated surpluses
Refined petroleum accumulated deficits
2020 2015
2015 2020
2015 2020
2015 2020
2020 2015
2020 2015
2015 2020
Note: source IEA 2015

15 FY 2015 ROADSHOW PRESENTATION
General
introduction
Market
trends
Strategy
execution
Capital
management
Business
performance
Looking ahead & other topics
IMBALANCES CONTINUE TO DEVELOP
US AND MIDDLE EAST EXPORT, ASIA AND EUROPE IMPORT
10
0
20
2020 2015
0
-5
-20
0
-10
5,0
0,0
2,5
2015 2020
0
-5
60
40
20
0
2015 2020
0
-20
-40
0
-5
2015 2020
Source: ICIS database and Vopak intelligence
Aromatics & Derivatives
Olefins & Derivatives
2015
Major Trade flows ( Mln Tons)
2020
2015 2020
2015 2020
2015 2020

16 FY 2015 ROADSHOW PRESENTATION
General
introduction
Market
trends
Strategy
execution
Capital
management
Business
performance
Looking ahead & other topics
Chemicals and gases
High integration and
lower feedstock costs
have narrowed the
competitive gap between
regions
Oil products
Lower oil price
environment
Oversupply refined
products and contango
mainly in the crude oil
market
DEVELOPMENTS PER PRODUCT GROUP
OVERALL SOLID DEMAND FOR STORAGE
LNG
Increase in LNG supply
More short-term and
spot trading
Increased destination
and volume flexibility
Vegoils and biofuels
Demand for vegoils
supported by macro-
economics
Limited discretionary
blending of biofuels as a
result of lower oil price
environment

17 FY 2015 ROADSHOW PRESENTATION
General
introduction
Market
trends
Strategy
execution
Capital
management
Business
performance
Looking ahead & other topics
MARKET DYNAMICS
GLOBAL IMBALANCES CONTINUE TO DEVELOP
Netherlands
Favorable trading
dynamics supporting
oil storage
Oversupply in NWE,
high Russian exports
and reduced bunker
demand result in
increased fuel oil
volumes to Asia
Steady demand in the
chemicals and gases
market
EMEA Asia Americas
Uncertainty China
impacts hubs
(Singapore and
Pengerang)
Oversupply of refined
products needs
storage
Slower growth in the
end-markets such as
Indonesia, India and
Vietnam
Strong demand for road
fuels and stable bunker
fuel markets supporting
refineries
Healthy demand from
chemical end-markets
such as packaging,
automotive and
coatings
Oil producing
countries impacted
by the lower oil
price environment
In Latin America,
exchange rate
deteriorating
putting pressure on
import volumes

STRATEGY EXECUTION GROWTH LEADERSHIP
ROYAL VOPAK
FY 2015 ROADSHOW PRESENTATION

19 FY 2015 ROADSHOW PRESENTATION
General
introduction
Market
trends
Strategy
execution
Capital
management
Business
performance
Looking ahead & other topics
Growing our global network through
strategic focus and clear choices
*Including the announced projects under development estimated to be commissioned up to and including 2019, however excluding the announced divestment of the UK assets
(to be completed in Q1 2016) and the other to be realized divestments as stipulated in the business review July 2014
STORAGE CAPACITY DEVELOPMENTS
FOCUS ON SELECTIVE DISCIPLINED GROWTH
19.9
2003
33.8
34.3
+14.4
2014 2015
Projects under
development up
to and including
2019
+4.2*
Storage capacity In million cbm

20 FY 2015 ROADSHOW PRESENTATION
General
introduction
Market
trends
Strategy
execution
Capital
management
Business
performance
Looking ahead & other topics
GLOBAL PRESENCE
Teesside
Windmill
Tarragona
Barcelona
Algeciras
Quebec
Hamilton
Montreal
Long Beach
Los Angeles
Houston*
Savanah
Altamira
Vera Cruz
Coatzacoalcos
Barranquilla
Cartagena
Puerto Cabello Paranaque Alemoa Rocio Durban Yanbu Al Jubail Fujairah* Darwin
Zhangjiagang Ulsan Karachi Nagoya Moji Yokohama Kobe Kawasaki Kandla Rayong Ho Chi Mihn City Kertih Pengerang Singapore* Jakarta Merak Sydney
London Hamburg Talinn Amsterdam Rotterdam* Antwerp Ningbo Lanshan Tianjin
Terminal
Terminal(s) at hub location
Note: the divestment of the UK terminals London, Windmill and Teesside to be completed in Q1 2016

21 FY 2015 ROADSHOW PRESENTATION
General
introduction
Market
trends
Strategy
execution
Capital
management
Business
performance
Looking ahead & other topics
RETURN REQUIREMENTS FOR INVESTMENTS
Footprint in emerging markets
Mitigating downward risks
Optimization growth opportunities
Commercial coverage on projects Local WACC
Contribution from key accounts
IV
III
I
V
VI
II First-mover
advantage Option
value
Growth along
with key accounts
Strategic
alliances
Pay-back period
Project NPV / IRR
Equity IRR
Contracted infrastructure
Launching Customers
MoUs/LoIs

22 FY 2015 ROADSHOW PRESENTATION
General
introduction
Market
trends
Strategy
execution
Capital
management
Business
performance
Looking ahead & other topics
INVESTMENT AND DIVESTMENTS 2015
(170,000 cbm)
Galena park
Note: The above depicted projects are a selection of the total investments and divestments. The announced divestment of the three UK terminals to be concluded in Q1 2016
(130,700 cbm)
Wilmington
(1,260,700 cbm) (175,400 cbm)
Sweden Finland
413,000 cbm
Pengerang
1,350,000 cbm
Hainan Vlissingen
36,800 cbm
Oil
Chemicals
Industrial
Gasses
Divestments
23 FY 2015 ROADSHOW PRESENTATION
General
introduction
Market
trends
Strategy
execution
Capital
management
Business
performance
Looking ahead & other topics
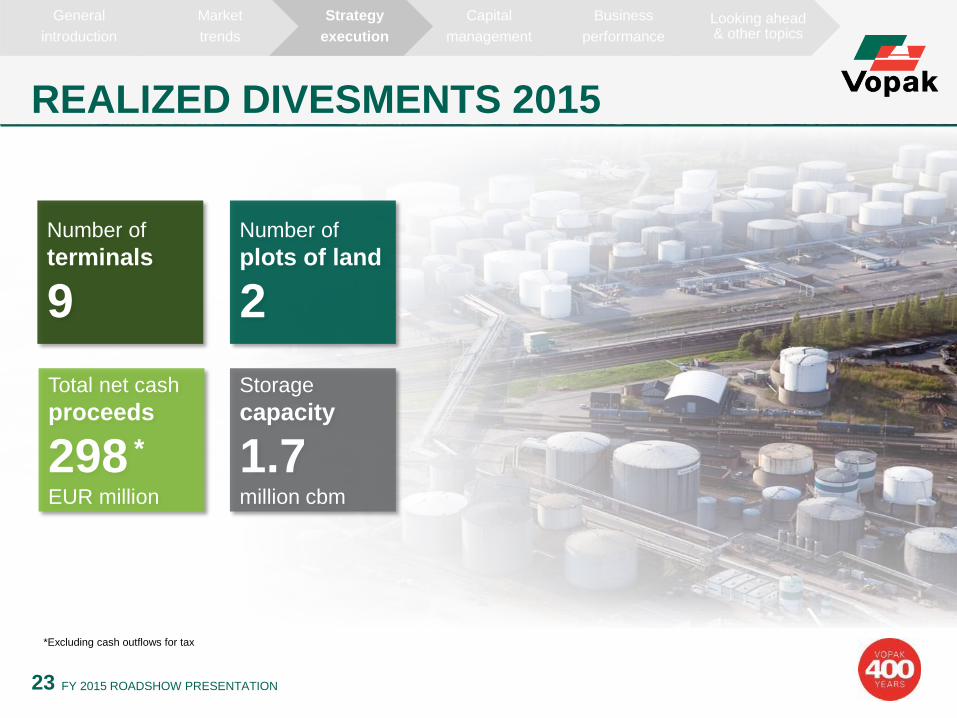
REALIZED DIVESMENTS 2015
Number of
plots of land
2
Number of
terminals
9
Storage
capacity
1.7 million cbm
Total net cash
proceeds
298 EUR million
*Excluding cash outflows for tax
*

24 FY 2015 ROADSHOW PRESENTATION
General
introduction
Market
trends
Strategy
execution
Capital
management
Business
performance
Looking ahead & other topics
SELECTIVE GROWTH OPPORTUNITIES
EFFECTIVE AND SOUND STRATEGIC ORIENTATION
Div
estm
en
ts
1.7
Acqu
isitio
n
0.2
Gre
en
field
Bro
wn
field
0.3
2014
33.8
1.7
+3.5
+0.5
2019
37.8
Div
estm
en
ts*
34.3
Gre
en
field
3.5
Bro
wn
field
0.7
2015
0.7
Note: in million cbm; *Announced divestment of the UK assets to be completed in Q1 2016
25 FY 2015 ROADSHOW PRESENTATION
General
introduction
Market
trends
Strategy
execution
Capital
management
Business
performance
Looking ahead & other topics
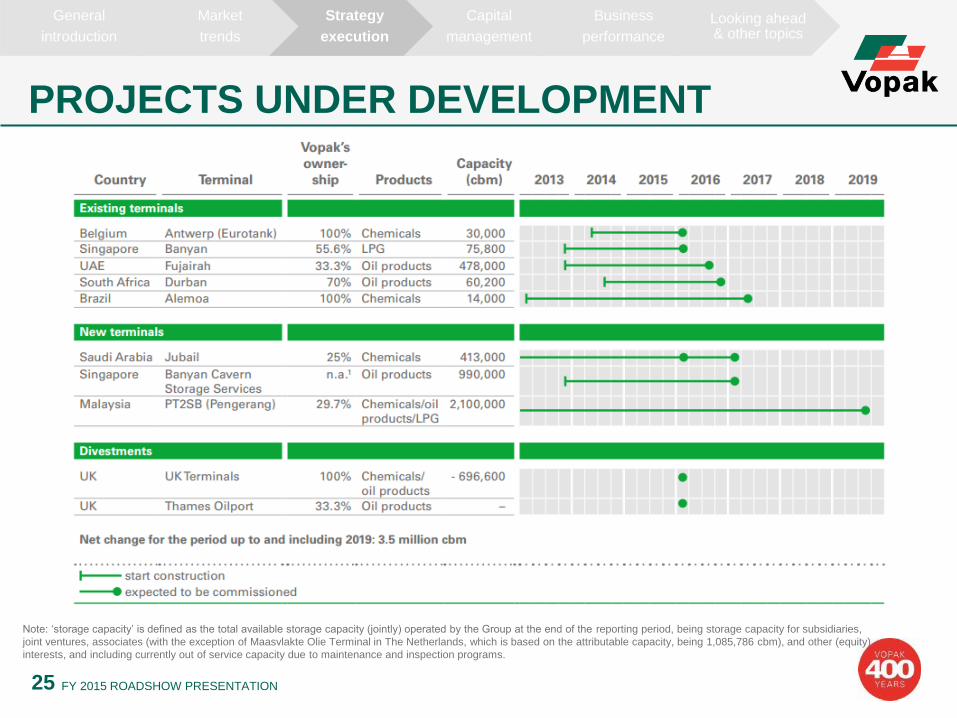
PROJECTS UNDER DEVELOPMENT
Note: ‘storage capacity’ is defined as the total available storage capacity (jointly) operated by the Group at the end of the reporting period, being storage capacity for subsidiaries,
joint ventures, associates (with the exception of Maasvlakte Olie Terminal in The Netherlands, which is based on the attributable capacity, being 1,085,786 cbm), and other (equity)
interests, and including currently out of service capacity due to maintenance and inspection programs.

STRATEGY EXECUTION OPERATIONAL LEADERSHIP
ROYAL VOPAK
FY 2015 ROADSHOW PRESENTATION

27 FY 2015 ROADSHOW PRESENTATION
General
introduction
Market
trends
Strategy
execution
Capital
management
Business
performance
Looking ahead & other topics
EXECUTION OF THE BUSINESS
Safety Committed to improving our
personal and process safety
Efficiency Continuous focus on cost
management and capital
efficiency
Service improvement Always working on service
improvements for our
customers
OPERATIONAL EXCELLENCE IS CORE TO VOPAK’S
SERVICE OFFERING

28 FY 2015 ROADSHOW PRESENTATION
General
introduction
Market
trends
Strategy
execution
Capital
management
Business
performance
Looking ahead & other topics
Total injury rate (TIR)
Total injuries per 200,000 hours worked by
own employees and contractors
Process incidents
# API RP 754 Tier 1 and Tier 2 incidents
5636 38
2015 2014 2013
Lost time injury rate (LTIR)
Total injuries leading to lost time per 200,000 hours
worked by own employees and contractors
Process safety events rate (PSER)
Tier 1 and Tier 2 incidents per 200,000 hours worked by
own employees and contractors (excluding greenfield projects)
2013
0.35
2015
0.27
2014
0.20
0,0
0,2
0,4
0,6
0,8
1,0
1,2
2009 2008 2012 2011 2014 2013 2010 2015
0.39
0,00
0,05
0,10
0,15
0,20
0,25
0,30
0,35
2009 2008 2010 2011 2012 2015 2014 2013
0.12
COMMITMENT TO SAFETY

STRATEGY EXECUTION CUSTOMER LEADERSHIP
ROYAL VOPAK
FY 2015 ROADSHOW PRESENTATION

30 FY 2015 ROADSHOW PRESENTATION
General
introduction
Market
trends
Strategy
execution
Capital
management
Business
performance
Looking ahead & other topics
BUSINESS MODEL
Tank storage
Blending nitrogen
Adding / cooling
Heating / unloading of ships / railcars / trucks
Loading
Excess througput fees
Monthly invoicing in arrears
Fixed rental fees for capacity
Fixed number of throughputs per year
V opak does not own the product
Monthly invoicing in advance
Sh
are
of re
ve
nu
es
Services
Note: general overview of Vopak’s business model. This can very per terminal.

31 FY 2015 ROADSHOW PRESENTATION
General
introduction
Market
trends
Strategy
execution
Capital
management
Business
performance
Looking ahead & other topics
CUSTOMER PORTFOLIO
Global clients Regional clients Local clients
Active at multiple Vopak
locations around the
world
Current turnover and
future potential define
Vopak’s global network
account approach
Active in more than one
Vopak location on a
regional level
Can be the largest clients
at a division
Regional marketing
Active in one Vopak
location
Can be largest clients at
a specific Vopak location.
Local sales approach

32 FY 2015 ROADSHOW PRESENTATION
General
introduction
Market
trends
Strategy
execution
Capital
management
Business
performance
Looking ahead & other topics
SOUND CONTRACT DURATIONS
Contract position FY2014 In percent of revenues
Contract position FY2015 In percent of revenues
26%
21%
53%
28%
48%
24%
> 3 year < 1-3 year
Note: Based on original contract duration; Subsidiaries only
Contract position FY2013 In percent of revenues
20%
52%
28%
1 year

33 FY 2015 ROADSHOW PRESENTATION
General
introduction
Market
trends
Strategy
execution
Capital
management
Business
performance
Looking ahead & other topics
MARKET SHARE ACCORDING TO DEFINITION
Vopak share
As a % of world market
As a % of primary
storage market**
Total
Vopak
Secondary competition
Primary competition
* Non-oil includes chemicals, vegoils, biofuels and gasses; ** Defined as the primary competition plus Vopak’s Storage Capacity. Note: In million cbm per
August 2015; excluding storage market for LNG. Source: Vopak own research.
Oil storage market In million cbm
8%
12%
152.0
89.0
20.8
261.8
Non-oil storage market* In million cbm
21%
26%
36.6
11.8
12.7
61.1
Total storage market In million cbm
10%
15%
188.6
100.8
33.5
322.9

CAPITAL MANAGEMENT
ROYAL VOPAK
FY 2015 ROADSHOW PRESENTATION

35
General
introduction
Market
trends
Strategy
execution
Capital
management
Business
performance
Looking ahead & other topics
FY 2015 ROADSHOW PRESENTATION
Total investments 2004-2019 In EUR million
* Forecasted sustaining and improvement capex up to and including 2016. ** Total approved expansion capex related to 4.2 million cbm under development is ~2,700 million in the years 2016 up to and including 2019.
200
300
2016 2017-2019 2004-2007
1,048
2012-2015 2008-2011
2,610 2,588
Other capex* Expansion
capex**
~200
Expansion capex** In EUR million; 100% = EUR 2,700 million
Remaining
Vopak share
in capex
(Group
capex and
equity share
in JV’s)
Group capex spent
Contributed Vopak equity share in JV’s and associates
Total partner’s equity share in JV’s and associates
Total non recourse finance in JV’s and associates
~2,500
Forecasted capex
DISCIPLINED GROWTH
SELECTIVE CAPITAL ALLOCATION
~≤500

36
General
introduction
Market
trends
Strategy
execution
Capital
management
Business
performance
Looking ahead & other topics
FY 2015 ROADSHOW PRESENTATION
Note: the 2003 figures are based on Dutch GAAP. For certain projects in joint ventures, additional limited guarantees have been provided, affecting the Senior net debt : EBITDA;
Maximum ratio under current
US PP programs
Maximum ratio under other PP
programs and syndicated
revolving credit facility
0
1
2
3
4
5
2.42
3.00
2003
2.83
2014
2.73
3.75
2015
2.75
Senior net debt : EBITDA ratio
DISCIPLINED CAPITAL MANAGEMENT
MAINTAINING A SOLID FINANCIAL POSITION

37
General
introduction
Market
trends
Strategy
execution
Capital
management
Business
performance
Looking ahead & other topics
FY 2015 ROADSHOW PRESENTATION
Ordinary shares
Subordinated loans
Subordinated USPP
loans: USD 94 million
Preference shares
Cancelled as per
January 2015
(EUR 44 million)
USD: 2.0 billion
SGD: 225 million and
JPY: 20 billion
Average remaining
duration ~ 8 years
EUR 1.0 billion
15 banks participating
duration until
February 2018
EUR 100 million drawn
Private placement
program*
Syndicated
revolving
credit facility*
Equity(-like)*
Listed on Euronext
Market capitalization:
EUR 5.3 billion as per
26 February, 2016
CAPITAL STRUCTURE

38
General
introduction
Market
trends
Strategy
execution
Capital
management
Business
performance
Looking ahead & other topics
FY 2015 ROADSHOW PRESENTATION
DEBT REPAYMENT SCHEDULE
Debt repayment schedule In EUR million
200
1,200
1,000
1,100
500
0
100
300
400
2040 2029 2028 2027 2026 2025 2024 2023 2022 2021 2018 2019 2017 2016 2015 2020
US PP
Subordinated US PP
RCF flexibility
Other
Asian PP RCF drawn

39
General
introduction
Market
trends
Strategy
execution
Capital
management
Business
performance
Looking ahead & other topics
FY 2015 ROADSHOW PRESENTATION
NET FINANCE COSTS
Net finance costs 2015 In EUR million
Net finance costs -105.2
Finance costs -115.9
Interest and
dividend income 10.7
-89.8
-97.7
7.9
2014
4.0%
2013
4.5%
2012
4.4%
2011
4.7%
2010
5.2%
2009
5.4%
2008
5.4%
2007
6.3%
2006
7.0%
2015
4.2%
Average interest rate In percent
997562426
2013 2014
2,266 1,825
2012
1,748
2011
1,606
2010
1,431
2009
1,018
2008 2007 2006 2015
2,296
Net interest bearing debt In EUR million
Net finance costs 2014 In EUR million

40
General
introduction
Market
trends
Strategy
execution
Capital
management
Business
performance
Looking ahead & other topics
FY 2015 ROADSHOW PRESENTATION
Note: the 2003 figures are based on Dutch GAAP. In addition, due to the retrospective application of the Revised IAS 19, Equity and Liabilities for 2012 have been restated. * Cash and cash equivalents are subtracted from Liabilities.
SOLID FINANCIAL POSITION MAINTAINING A CONSISTENT SOLVENCY WHILST
GROWING OUR GLOBAL NETWORK
60%
2014
36%
64%
2003
36%
64%
2015
40%
Total equity and net liabilities In EUR million
Net liabilities*
Equity

41
General
introduction
Market
trends
Strategy
execution
Capital
management
Business
performance
Looking ahead & other topics
FY 2015 ROADSHOW PRESENTATION
Barring
exceptional
circumstances, the
intention is to pay
an annual cash
dividend of 25-50%
of the net profit*
Note: the 2003 figures are based on Dutch GAAP. In addition, due to the retrospective application of the Revised IAS 19, Equity and Liabilities for 2012 have been restated. * Excluding exceptional items; attributable to holders of ordinary shares; and also adjusted for 1:2 share split effectuated 17 May 2010.
2.5
3.0
2.0
1.5
1.0
0.5
0.0
+11%
2015
1.00
2.55
2014
0.90
2.31
2003
0.25
0.64
Dividend and EPS* 2003-2015 In EUR
EPS
STABLE DIVIDEND GROWTH PROPOSED DIVIDEND INCREASED WITH 11% TO EUR 1.00 PER SHARE
EUR 0.9 billion
paid out to
shareholders in
cash in the last 12
years

BUSINESS PERFORMANCE
ROYAL VOPAK
FY 2015 ROADSHOW PRESENTATION

43
General
introduction
Market
trends
Strategy
execution
Capital
management
Business
performance
Looking ahead & other topics
FY 2015 ROADSHOW PRESENTATION
* Terminal network is defined as the total available storage capacity (jointly) operated by the Group at the end of the reporting period, being storage capacity for subsidiaries, joint ventures, associates (with the exception of Maasvlakte Olie Terminal in The Netherlands which is based on the attributable capacity, being 1,085,786 cbm), and other (equity) interests, and including currently out of service capacity due to maintenance and inspection programs”; ** Subsidiaries only; *** EBITDA (Earnings Before Interest, Tax, Depreciation and Amortization) excluding exceptional items and including net result of joint ventures and associates. **** Cash flows from operating activities (gross)
Terminal Network *
34.3 In million cbm
Occupancy Rate **
92 In percent
EBITDA ***
812 In EUR million
Cash flows Operating ****
867 In EUR million
FY 2015 BUSINESS HIGHLIGHTS
SOLID FINANCIAL RESULTS ALIGNED WITH OUTLOOK

44
General
introduction
Market
trends
Strategy
execution
Capital
management
Business
performance
Looking ahead & other topics
FY 2015 ROADSHOW PRESENTATION
Oil price developments
TOPICS INFLUENCING 2015
Growth
in China
Geopolitical
events
OPERATING IN A COMPLEX ENVIRONMENT

45 FY 2015 ROADSHOW PRESENTATION
General
introduction
Market
trends
Strategy
execution
Capital
management
Business
performance
Looking ahead & other topics
LONG-TERM VALUE CREATION
KEY ELEMENTS SUPPORTING OUR BUSINESS MODEL
Diversified
portfolio of
terminals at
key
locations
Stable margins
and take-or-pay
contracts with
sound durations
Strong capital
structure with
balanced
leverage
Disciplined
capital
management
Focus on
operational
cash flow
generation

46 FY 2015 ROADSHOW PRESENTATION
General
introduction
Market
trends
Strategy
execution
Capital
management
Business
performance
Looking ahead & other topics
90-95%
85-90%
+4pp
2004
84
2011 2010
2009
2008
2007
2006
2005
92
2015
88
2013 2012 2014
Note: Subsidiaries only
ENDURING DEMAND FOR STORAGE CONTINUE OPERATING AT HEALTHY OCCUPANCY RATES
Occupancy rate In percent

47 FY 2015 ROADSHOW PRESENTATION
General
introduction
Market
trends
Strategy
execution
Capital
management
Business
performance
Looking ahead & other topics
Note: the 2003 figures are based on Dutch GAAP *Group operating profit before depreciation and amortization (EBITDA) –excluding exceptional items– and excluding net result joint ventures and associates; **Cash flows from operating activities (gross). The cash outflow from dividends paid to non-controlling interests is included as a cash flow from financing activities as per 2015 (2014: cash flows from operating activities). The comparative figures were accordingly adjusted.
10488
2010 2009 2008 2007 2006 2005 2004 2003
304
37
2014 2015
+6%
812 763
EBITDA: +9% Cash flows: +13%
2012 2011 2013
EBITDA*
Net result
joint ventures
and associates
ROBUST BUSINESS MODEL SOUND CONTRACTS, EFFECTIVE SUPPLY CHAIN
POSITIONING AND STRONG CASH FLOW FOCUS
EBITDA, Net result joint ventures and associates and Cash flows In EUR million
Cash flows**
CAGR

48 FY 2015 ROADSHOW PRESENTATION
General
introduction
Market
trends
Strategy
execution
Capital
management
Business
performance
Looking ahead & other topics
60
50
40
30
20
10
2014 2015
50%
32%
2013 2012 2011 2010 2009 2008 2007 2006 2005 2004
*EBIT(DA) margins excluding exceptional items and excluding net result from joint ventures and associates
STABLE MARGIN DEVELOPMENTS
BALANCED RISK-RETURN PROFILE AND CONTINUOUS
FOCUS ON COST COMPETITIVENESS
EBIT margin EBITDA margin
EBIT(DA) margins* In percent
49 FY 2015 ROADSHOW PRESENTATION
General
introduction
Market
trends
Strategy
execution
Capital
management
Business
performance
Looking ahead & other topics
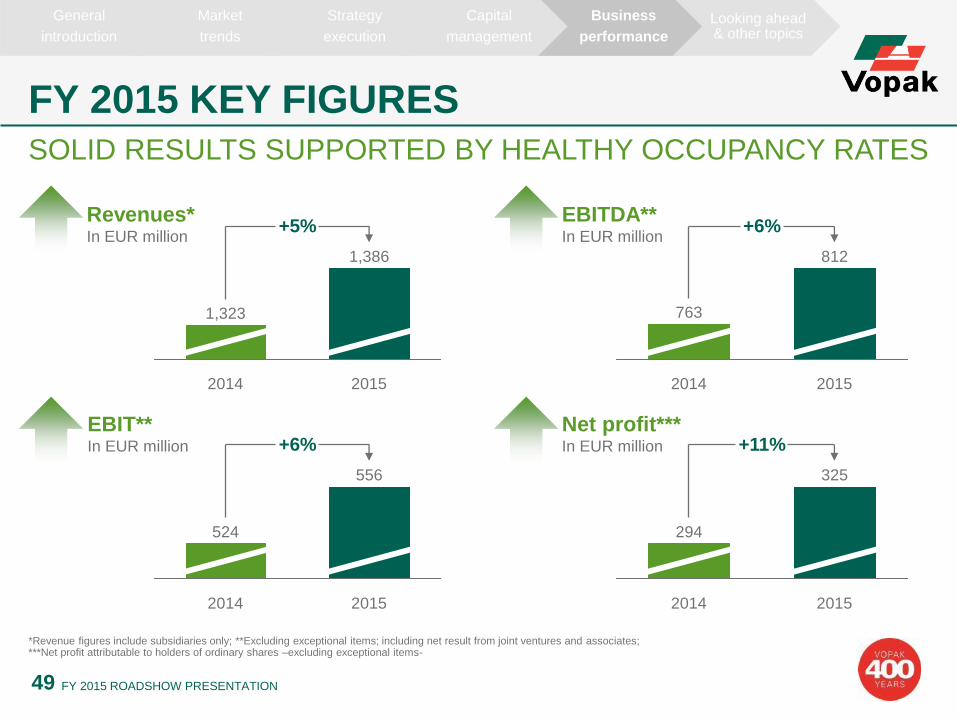
FY 2015 KEY FIGURES SOLID RESULTS SUPPORTED BY HEALTHY OCCUPANCY RATES
*Revenue figures include subsidiaries only; **Excluding exceptional items; including net result from joint ventures and associates; ***Net profit attributable to holders of ordinary shares –excluding exceptional items-
EBITDA** In EUR million
+6%
2015
812
2014
763
+6%
2015
556
2014
524
1,386
2014
1,323
+5%
2015
2015
+11%
325
2014
294
Net profit*** In EUR million
Revenues* In EUR million
EBIT** In EUR million

50 FY 2015 ROADSHOW PRESENTATION
General
introduction
Market
trends
Strategy
execution
Capital
management
Business
performance
Looking ahead & other topics
Q4 2015 KEY FIGURES
ALIGNED WITH 2015 OUTLOOK
*Occupancy rates and revenue figures include subsidiaries only; **Excluding exceptional items; including net result from joint ventures and associates
+2%
Q4
2015
350
Q3
2015
335
Q2
2015
351
Q1
2015
350
Q4
2014
344
+8%
Q4
2015
209
Q3
2015
194
Q2
2015
203
Q1
2015
206
Q4
2014
194
+6pp
Q4
2015
94
Q3
2015
93
Q2
2015
91
Q1
2015
91
Q4
2014
88
+9%
Q4
2015
143
Q3
2015
131
Q2
2015
139
Q1
2015
143
Q4
2014
131
Revenues* In EUR million
EBIT*** In EUR million
Occupancy* In percent
EBITDA** In EUR million

51 FY 2015 ROADSHOW PRESENTATION
General
introduction
Market
trends
Strategy
execution
Capital
management
Business
performance
Looking ahead & other topics
FY 2015 EBITDA ANALYSIS WELL-DIVERSIFIED PORTFOLIO SUPPORTING EBITDA INCREASE
Other
9.6
Asia
27.7
LNG
6.2
Americas
19.7
14.5
FX-effect
Acq
uis
itio
ns/
Gre
en
field
s,
Div
estm
ents
,
Pre
-OP
EX
41.2
Netherlands Actual
2014
against
FX 2015
7.5
EMEA
25.9
762.8
+6%
Actual
2015
811.5
Actual
2014
804.0
Note: EBITDA in EUR million, excluding exceptional items; including net result from joint ventures and associates.

52 FY 2015 ROADSHOW PRESENTATION
General
introduction
Market
trends
Strategy
execution
Capital
management
Business
performance
Looking ahead & other topics
FX TRANSLATION EFFECTS
2015 EBITDA* transactional currencies In percent
FX translation-effect on 2015 EBITDA* In EUR million
24%
37%
23%
16%
Other
EUR
SGD
USD
Total
Non-allocated 0.7
Americas 2.5
Asia 31.2
EMEA 6.8
Netherlands
41.2
* Excluding exceptional items

53 FY 2015 ROADSHOW PRESENTATION
General
introduction
Market
trends
Strategy
execution
Capital
management
Business
performance
Looking ahead & other topics
FY 2015 EXCEPTIONAL TAX ITEMS
Net profit
attributable to
holders of
ordinary shares
325.3
Non-controlling
interest
45.3
Net profit
370.6
Income tax
82.0
Net finance costs
102.9
EBIT
555.5
Consolidated statement of income -excluding exceptional items- In EUR million
326.7
Non-controlling
interest
Net profit
attributable to
holders of
ordinary shares
282.2
44.5
Net profit
117.3
Net finance costs
105.2
EBIT
549.2
Income tax
EPS
2.55
EPS
2.21
Consolidated statement of income –including exceptional items- In EUR million
Mainly impact tax
charge relating to
the divestment of
the US terminals
Note: the exceptional items comprise of several gains and losses. For a detailed overview of all exceptional items, we refer to note 2.2 of the Consolidated Financial Statements in the Annual Report 2015.

54 FY 2015 ROADSHOW PRESENTATION
General
introduction
Market
trends
Strategy
execution
Capital
management
Business
performance
Looking ahead & other topics
FY2015 RETURN INDICATORS
ROE* In percent
2015
17.3
2014
16.7
2013
18.8
2012
21.9
* Return on equity is defined as the net profit excluding exceptionals as a percentage of the equity excluding financing preference shares and non-controlling interest ** CFROGA is defined as EBITDA minus the statutory income tax charge on EBIT divided by the average historical investment (gross assets)
Non-IFRS
Proportional
information
CFROGA** (after tax) In percent
11.8 10.9 10.2
2014 2012 2013
10.3
2015
FOCUS ON FREE CASH FLOW AND CAPITAL EFFICIENCY

55 FY 2015 ROADSHOW PRESENTATION
General
introduction
Market
trends
Strategy
execution
Capital
management
Business
performance
Looking ahead & other topics
FY 2015 NON-IFRS PROPORTIONAL INFORMATION
Proportionate EBITDA* In EUR million 904824817836
660
+10%
2015 2014 2013 2012 2011
Cash Flow Return on Gross Assets (after tax)** In percent
10.9
2012
11.9
2011
11.7
-0.1pp
2015
10.2
2014
10.3
2013
Occupancy rate In percent
92
2015 2014
+4pp
88 92
2013
88
2012
90
2011
* EBITDA in EUR million excluding exceptional items ** CFROGA is defined as EBITDA minus the statutory income tax charge on EBIT divided by the average historical investment (gross assets)

BUSINESS PERFORMANCE DIVISIONAL RESULTS
ROYAL VOPAK
FY 2015 ROADSHOW PRESENTATION

57 FY 2015 ROADSHOW PRESENTATION
General
introduction
Market
trends
Strategy
execution
Capital
management
Business
performance
Looking ahead & other topics
Note: occupancy rates include subsidiaries only
OCCUPANCY RATE DEVELOPMENTS PER DIVISION
89
93
89
85
8990
9192
91
85
91
95
8990
9495
9191
9596
Netherlands Asia EMEA Americas
Q4 2014
Q4 2015
Q1 2015
Q2 2015
Q3 2015
STEADY PERFORMANCE IN THE NETHERLANDS, EMEA
AND AMERICAS IN 2015, PICK UP ASIA IN H2 2015
Occupancy rates In percent

58 FY 2015 ROADSHOW PRESENTATION
General
introduction
Market
trends
Strategy
execution
Capital
management
Business
performance
Looking ahead & other topics
FY 2015 NETHERLANDS DEVELOPMENT
EBITDA** In EUR million 279253243267
211
+10%
2015 2011 2012 2013 2014
Storage capacity In million cbm
2011
9.5
2015
9.9
2014
9.9
2013
8.3
2012
9.5
Occupancy rate* In percent
9487838994
2015 2014 2013 2012 2011
+7pp
* Subsidiaries only; **EBITDA including net result from joint ventures and associates; excluding exceptional items; .
Favorable trading dynamics
supporting oil storage
Oversupply in NWE, high
Russian exports and reduced
bunker demand result in
increased fuel oil volumes to
Asia
Steady demand in the
chemicals and
gases market

59 FY 2015 ROADSHOW PRESENTATION
General
introduction
Market
trends
Strategy
execution
Capital
management
Business
performance
Looking ahead & other topics
FY 2015 EMEA DEVELOPMENT
EBITDA** In EUR million
128118136132123
+8%
2014 2015 2013 2012 2011
Storage capacity In million cbm
2012
9.0
2015
-1.1
2013
9.6 8.6
2014
9.7
2011
8.3
Occupancy rate* In percent
9384888890
+9pp
2013 2014 2015 2012 2011
* Subsidiaries only; **EBITDA including net result from joint ventures and associates; excluding exceptional items; .
Strong demand for road fuels
and stable bunker fuel markets
supporting refineries
Healthy demand from chemical
end-markets such as packaging,
automotive and coatings

60 FY 2015 ROADSHOW PRESENTATION
General
introduction
Market
trends
Strategy
execution
Capital
management
Business
performance
Looking ahead & other topics
FY 2015 ASIA DEVELOPMENT
EBITDA** In EUR million 289291282273
235
-1%
2015 2014 2013 2012 2011
Storage capacity In million cbm +1.8
2015
11.6
2014
9.8
2013
7.4
2012
7.3
2011
7.1
Occupancy rate* In percent
8995949494
-6pp
2015 2014 2013 2012 2011
* Subsidiaries only; **EBITDA including net result from joint ventures and associates; excluding exceptional items; .
Uncertainty China impacts hubs
(Singapore and Pengerang)
Oversupply of refined products
needs storage
Slower growth in the end-
markets such as Indonesia,
India and Vietnam
61 FY 2015 ROADSHOW PRESENTATION
General
introduction
Market
trends
Strategy
execution
Capital
management
Business
performance
Looking ahead & other topics
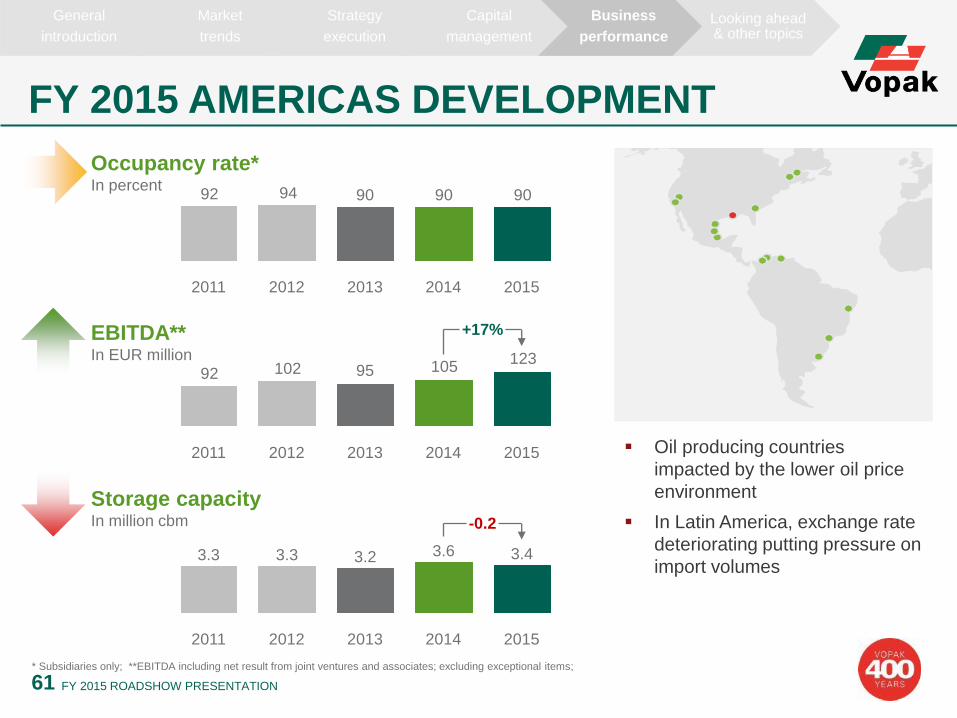
FY 2015 AMERICAS DEVELOPMENT
EBITDA** In EUR million 123
1059510292
+17%
2015 2014 2013 2012 2011
Storage capacity In million cbm
2015
3.4
2014
3.6
2013
3.2
2012
3.3
2011
3.3
-0.2
Occupancy rate* In percent
9090909492
2015 2014 2013 2012 2011
* Subsidiaries only; **EBITDA including net result from joint ventures and associates; excluding exceptional items; .
Oil producing countries
impacted by the lower oil price
environment
In Latin America, exchange rate
deteriorating putting pressure on
import volumes

62 FY 2015 ROADSHOW PRESENTATION
General
introduction
Market
trends
Strategy
execution
Capital
management
Business
performance
Looking ahead & other topics
FY 2015 NET RESULT OF JOINT VENTURES AND ASSOCIATES
+19%
2015
104.3
2014
87.5
2013
105.3
2012
107.2
Net result of joint ventures
and associates
2015
2.5
2014
2.5
2013
2.4
2012
1.9
+20%
2015
46.9
2014
39.0
2013
37.9
2012
33.0
2015
0.2
2014
0.1
2013
1.0
2012
0.9
+18%
2015
21.1
2014
17.9
2013
35.9
2012
46.6
2015
33.4
2014
28.1
2013
28.5
2012
25.3
+19%
Note: Amounts in EUR million; excluding exceptional items.
Netherlands
EMEA
Asia
Americas
Global LNG

LOOKING AHEAD & OTHER TOPICS
ROYAL VOPAK
FY 2015 ROADSHOW PRESENTATION
General
introduction
Market
trends
Strategy
execution
Capital
management
Business
performance
Looking ahead & other topics
64 FY 2015 ROADSHOW PRESENTATION
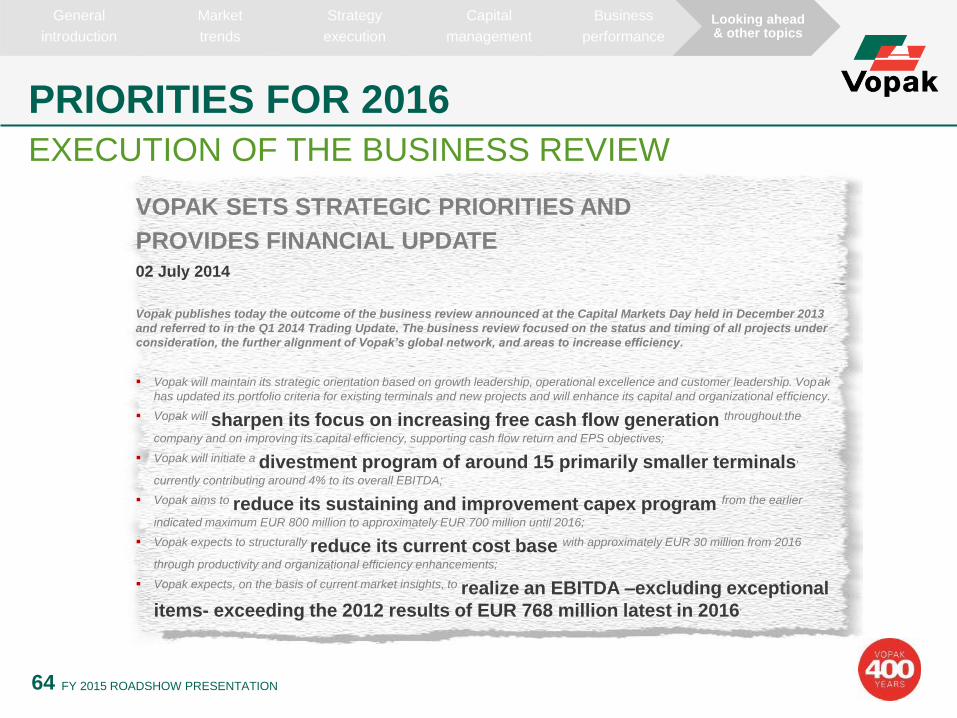
PRIORITIES FOR 2016
EXECUTION OF THE BUSINESS REVIEW
VOPAK SETS STRATEGIC PRIORITIES AND
PROVIDES FINANCIAL UPDATE 02 July 2014
Vopak publishes today the outcome of the business review announced at the Capital Markets Day held in December 2013
and referred to in the Q1 2014 Trading Update. The business review focused on the status and timing of all projects under
consideration, the further alignment of Vopak’s global network, and areas to increase efficiency.
Vopak will maintain its strategic orientation based on growth leadership, operational excellence and customer leadership. Vopak
has updated its portfolio criteria for existing terminals and new projects and will enhance its capital and organizational efficiency.
Vopak will sharpen its focus on increasing free cash flow generation throughout the
company and on improving its capital efficiency, supporting cash flow return and EPS objectives;
Vopak will initiate a divestment program of around 15 primarily smaller terminals,
currently contributing around 4% to its overall EBITDA;
Vopak aims to reduce its sustaining and improvement capex program from the earlier
indicated maximum EUR 800 million to approximately EUR 700 million until 2016;
Vopak expects to structurally reduce its current cost base with approximately EUR 30 million from 2016
through productivity and organizational efficiency enhancements;
Vopak expects, on the basis of current market insights, to realize an EBITDA –excluding exceptional
items- exceeding the 2012 results of EUR 768 million latest in 2016.

General
introduction
Market
trends
Strategy
execution
Capital
management
Business
performance
Looking ahead & other topics
65 FY 2015 ROADSHOW PRESENTATION
OUTLOOK 2016
FULLY ALIGNED WITH THE STRATEGIC PRIORITIES
We expect 2016 occupancy rates of our global terminal network to exceed 90%, supported by:
our diversified portfolio both geographically and in different product groups
(oil, chemicals and gas)
healthy contract coverage
strong supply chain positions
This provides a solid basis for 2016 whilst taking into account the reduced contribution of
divested terminals.
2016 FX effect and
pension costs
Divestments Productivity and
organisational
efficiency
enhancements
2015 Expansions Healthy occupancy
rates and stable
margins

General
introduction
Market
trends
Strategy
execution
Capital
management
Business
performance
Looking ahead & other topics
66 FY 2015 ROADSHOW PRESENTATION
OUTLOOK ASSUMPTIONS
Solid
Note: Width of the boxes does not represent actual percentages; company estimates; * Excluding exceptional items ;including net result from joint ventures and associates.
Mixed Solid Solid
Mixed
2015 Steady
Steady
Share of EBITDA*
45-50% 20-25% 20-25% 2.5-5% 5-7.5%
Contract duration
~0-5 years ~1-5 years ~5-15 years ~0-3 years ~10-20 years
Different
demand drivers
Different
demand drivers Solid
Oil products
Chemical products
Industrial & pipeline connected
Vegoils & biofuels
Gas products
2016

67 FY 2015 ROADSHOW PRESENTATION
General
introduction
Market
trends
Strategy
execution
Capital
management
Business
performance
Looking ahead & other topics
QUARTERLY UPDATES
THE FIRST AND THIRD QUARTER ‘TRADING UPDATES’
WILL BE REPLACED BY ‘INTERIM UPDATES’
The interim updates will be focused on
the main events and developments for
the period aligned with the long-term
value creation strategy of the company
The half-year and full-year financial
press releases will remain unchanged
compared to prior year

General
introduction
Market
trends
Strategy
execution
Capital
management
Business
performance
Looking ahead & other topics
68 FY 2015 ROADSHOW PRESENTATION
OTHER TOPICS
Effective tax rate* In percent
2014 2015
18.1 20.9
2012
18.0 17.1
2013
Funding level Dutch pension fund In percent
117121118112
2015 2012 2014 2013
* Excluding exceptional items