theme watcher navigating a thematic investing …...2 thematic investing 09 january 2015 contents...
TRANSCRIPT
>> Employed by a non-US affiliate of MLPF&S and is not registered/qualified as a research analyst under the FINRA rules. Refer to "Other Important Disclosures" for information on certain BofA Merrill Lynch entities that take responsibility for this report in particular jurisdictions. BofA Merrill Lynch does and seeks to do business with companies covered in its research reports. As a result, investors should be aware that the firm may have a conflict of interest that could affect the objectivity of this report. Investors should consider this report as only a single factor in making their investment decision. Refer to important disclosures on page 86 to 88. Analyst Certification on Page 85. 11469307
Thematic Investing Thematic Investing
Theme Watcher – Navigating a thematic investing landscape
Equity | Global | Thematic Investing 09 January 2015
Beijia Ma >> Equity Strategist MLI (UK)
Sarbjit Nahal >> Equity Strategist MLI (UK)
Manish Kabra, CFA >> Equity & Quant Strategist MLI (UK)
Click the image above to watch the video.
A Transforming World
Navigating a Transforming World, introducing Theme Watcher
As part of our work on A Transforming World, and as discussed in our 2015 year ahead, we continue to believe that thematic investing should outperform in the brave, new, post-QE world – and that investors should position for lower expected returns from financial markets by concentrating portfolios in assets related to our long-term themes. In this report we introduce Theme Watcher, a new monthly report that is designed to help investors consider their strategic thematic asset allocations in light of current market conditions and macroeconomic events. It offers insights on performance, positioning, BofAML equity client trading flows, and the BofAML Style Cycle across the following themes: climate change & extreme weather, education, energy efficiency, longevity, obesity and health & wellness, safety & security, waste, and water.
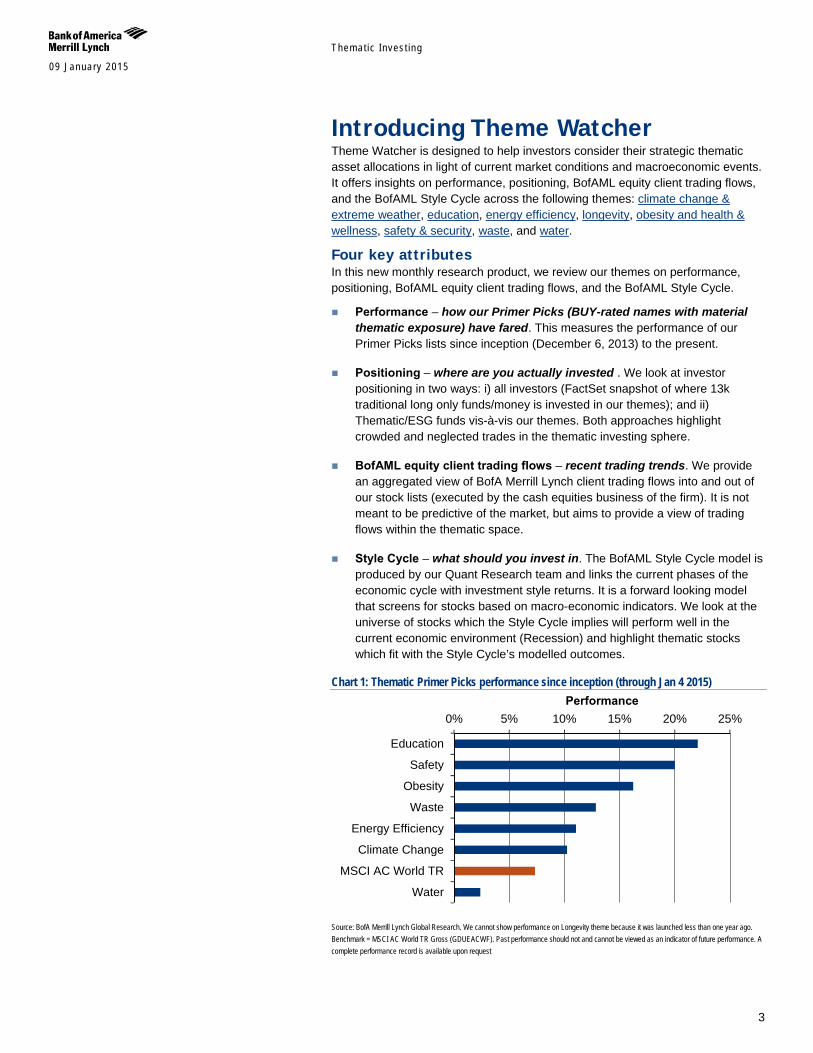
Performance results: education & safety up 20%+ We have measured our thematic Primer Picks (Buy-rated names with material exposure) against the benchmark MSCI AC World since inception on 6 December 2013. Our education and safety & security themes have been the best performers since inception, up 22.1% and 20.0% respectively (vs. +7.3% for MSCI AC World). The Globesity and health & wellness Primer Picks increased +16.2%, Waste +12.9%, Energy efficiency +11.0%, and Climate change +10.2%. Water was the sole underperformer relative to MSCI AC World, up only 2.4%. We have not included our Longevity Primer Picks list as we have <12 months data.
Weightings: investors are overweight energy efficiency & ICT We have analysed publicly disclosed fund holdings globally for 13k+ investment funds and assessed the overweights/underweights across our themes, sub-themes, and stocks. Energy efficiency was the biggest overweight globally, with water the biggest underweight. Specifically, investors are concentrated in ICT-related sub-themes and stocks including ICT, cybersecurity, and edtech. In contrast, the biggest underweights were in engineering & construction-related sub-themes such as water infrastructure and equipment, as well as retail.
Water: the theme most favoured by thematic & ESG investors Our Thematic & ESG Consensus model measures the most favoured stocks and sectors of long-term thematic and ESG (environmental, social, governance) funds. Applying its findings to our themes, the most commonly held theme is water, followed by climate change.
No inflows: longevity & climate change see largest outflows We analysed BofAML equity client flows globally, which showed outflows every month over the last year, totalling -US$17,315mn since 5 September 2014. Longevity had the most significant outflows with -US$7,107mn, followed by climate change with -US$3,274mn. Education, the best performer to date, was the only theme with relatively flat trading flows of -US$23mn.
We prefer obesity over energy efficiency & climate change We have screened our entire thematic universe using our BofAML Style Cycle model. Given current macroeconomic conditions, obesity and health & wellness lists have the highest exposure to stocks that screen attractivly in a ‘Recession’. Conversely, stocks exposed to the energy efficiency and climate change & extreme weather themes screened as unattractive.
2
Themat ic Inves t ing 09 January 2015
Contents Introducing Theme Watcher 3
BofAML Thematic Investing Stock Lists & Primer Picks 4
Performance – how themes fared 5
Style cycle – what should you invest in 8
Ownership – where are you invested 11
How is the market positioned 11
ESG and Thematic positioning 16
Equity Flows – Recent trading 17
Themes 18
Climate change & extreme weather - A perfect storm 18
Education - Stay in school 24
Energy efficiency – Efficient frontier 30
Demographics - Longevity revolution 36
Obesity and health & wellness - Globesity 40
Safety & Security - Safer world 46
Waste - No time to waste 52
Water - Blue revolution 58
Methodology Appendix 64
Themat ic Inves t ing 09 January 2015
3
Introducing Theme Watcher Theme Watcher is designed to help investors consider their strategic thematic asset allocations in light of current market conditions and macroeconomic events. It offers insights on performance, positioning, BofAML equity client trading flows, and the BofAML Style Cycle across the following themes: climate change & extreme weather, education, energy efficiency, longevity, obesity and health & wellness, safety & security, waste, and water.
Four key attributes In this new monthly research product, we review our themes on performance, positioning, BofAML equity client trading flows, and the BofAML Style Cycle.
Performance – how our Primer Picks (BUY-rated names with material thematic exposure) have fared. This measures the performance of our Primer Picks lists since inception (December 6, 2013) to the present.
Positioning – where are you actually invested . We look at investor positioning in two ways: i) all investors (FactSet snapshot of where 13k traditional long only funds/money is invested in our themes); and ii) Thematic/ESG funds vis-à-vis our themes. Both approaches highlight crowded and neglected trades in the thematic investing sphere.
BofAML equity client trading flows – recent trading trends. We provide an aggregated view of BofA Merrill Lynch client trading flows into and out of our stock lists (executed by the cash equities business of the firm). It is not meant to be predictive of the market, but aims to provide a view of trading flows within the thematic space.
Style Cycle – what should you invest in. The BofAML Style Cycle model is produced by our Quant Research team and links the current phases of the economic cycle with investment style returns. It is a forward looking model that screens for stocks based on macro-economic indicators. We look at the universe of stocks which the Style Cycle implies will perform well in the current economic environment (Recession) and highlight thematic stocks which fit with the Style Cycle’s modelled outcomes.
Chart 1: Thematic Primer Picks performance since inception (through Jan 4 2015)
Source: BofA Merrill Lynch Global Research. We cannot show performance on Longevity theme because it was launched less than one year ago. Benchmark = MSCI AC World TR Gross (GDUEACWF). Past performance should not and cannot be viewed as an indicator of future performance. A complete performance record is available upon request
0% 5% 10% 15% 20% 25%
Education
Safety
Obesity
Waste
Energy Efficiency
Climate Change
MSCI AC World TR
Water
Performance
Themat ic Inves t ing 09 January 2015
4
BofAML Thematic Investing Stock Lists & Primer Picks Since December 5 2013, we have been publishing a number of BofA Merrill Lynch Global Research lists of stocks and “Primer Picks” which have exposure to 8 equity themes – Climate Change & Extreme Weather, Education, Energy Efficiency, Longevity, Obesity and Health and Wellness, Safety & Security, Waste, and Water. Our strategic view has been longer term and the names we have selected in each of these thematic stock lists are those which we believe should benefit in the long run from the theme. The aim of our stock lists has been to provide investors with information to understand company and sub-theme opportunities and risks inherent in the themes.
For each theme since the inception of each specific list, we have mapped a number of sector value chains to highlight various entry points or “sub-themes” within the theme. For each entry point, we have mapped opportunities and risks as we understand them to highlight a diverse range of entry points for investors wishing to invest in the theme. We have estimated the level and materiality of companies’ exposure to the energy efficiency themes, and the role of the themes as long-term drivers. We have characterised each company’s exposure as follows:
Low – Theme-related products, technologies, services, and solutions are not material to global revenues and/or growth but are one factor, among others, for the business model, strategy and R&D of the company.
Medium – Theme -related products, technologies, services, and solutions are an important factor for the business model, strategy and R&D of the company; material to sales and/or growth.
High – Theme-related products, technologies, services, and solutions are core to the business model, strategy and R&D of the company; material sales and/or growth driver; pure play (i.e., 100% of sales).
Since the inception of our Thematic Investing Stock Lists, each quarter we have published: (i) a broader list mapping out the full universe of stocks exposed to a theme based on our Low/Medium/High methodology and (ii) a separate list of “Primer Picks” which are those stocks which have both a Buy rating from our fundamental equity team and that have Medium to High exposure to the theme under our methodology. Although it is difficult to accurately gauge the link between such exposure and share price performance (as many factors outside the scope of this analysis are likely to play a role in short- and long-term price development), we still consider its thematic exposure as an important and positive point to track given that they are “A Transforming World” themes with a 25Y+ lifespan.
A company can be in more than one theme stock list, sub-theme, or Primer Picks.
Investors should consider the fundamentals of the companies and their own individual circumstances / objectives before making any investment decisions. The full rationale and investment thesis for our fundamental analyst’s recommendations on each stock is contained in the most recent report on the company, which we urge you to read.
Thematic stock lists are not a recommended list either individually or as a group of stocks.
Themat ic Inves t ing 09 January 2015
5
Performance – how themes fared Now that 12 months have elapsed (December 5 2013 inception) since we began publishing our thematic stock lists and Primer Picks, we introduce in this note a first assessment of performance. In viewing performance, we assess our Primer Picks for each theme, which have “material” - either High or Medium - exposure to the relevant theme and our fundamental analyst have a Buy rating. In viewing performance, we look at them on an equal-weighted, total return basis. Although our medium- to long term strategic view focuses on the significance of the links between our themes and the business development and environment facing our covered companies, we caution investors that it is difficult to accurately gauge the link between such exposure and share price performance (as many factors outside the scope of this analysis are likely to play a role in short- and long-term price development), Investors should consider the fundamentals of the companies and their own individual circumstances / objectives before making any investment decisions. Moreover, past performance should not and cannot be viewed as an indicator of future performance. A complete performance record is available upon request. For a complete description of our performance methodology, please see the Methodology Appendix on page 64).
Stock lists are rebalanced both quarterly and published as A Transforming World - Quarterly Primer Picks, as well as when thematic primers and accompanying Primer Picks reports are updated (See Appendix of historical changes to stock lists on page 65).
Chart 3: Thematic Primer Picks performance since inception (through Jan 4 2015)
Source: BofA Merrill Lynch Global Research. We cannot currently show performance for our Longevity Primer Picks list because it was launched less than one year ago. Benchmark = MSCI AC World TR Gross (GDUEACWF). Past performance should not and cannot be viewed as an indicator of future performance. A complete performance record is available upon request.
0% 5% 10% 15% 20% 25%
Education
Safety
Obesity
Waste
Energy Efficiency
Climate Change
MSCI AC World TR
Water
Performance
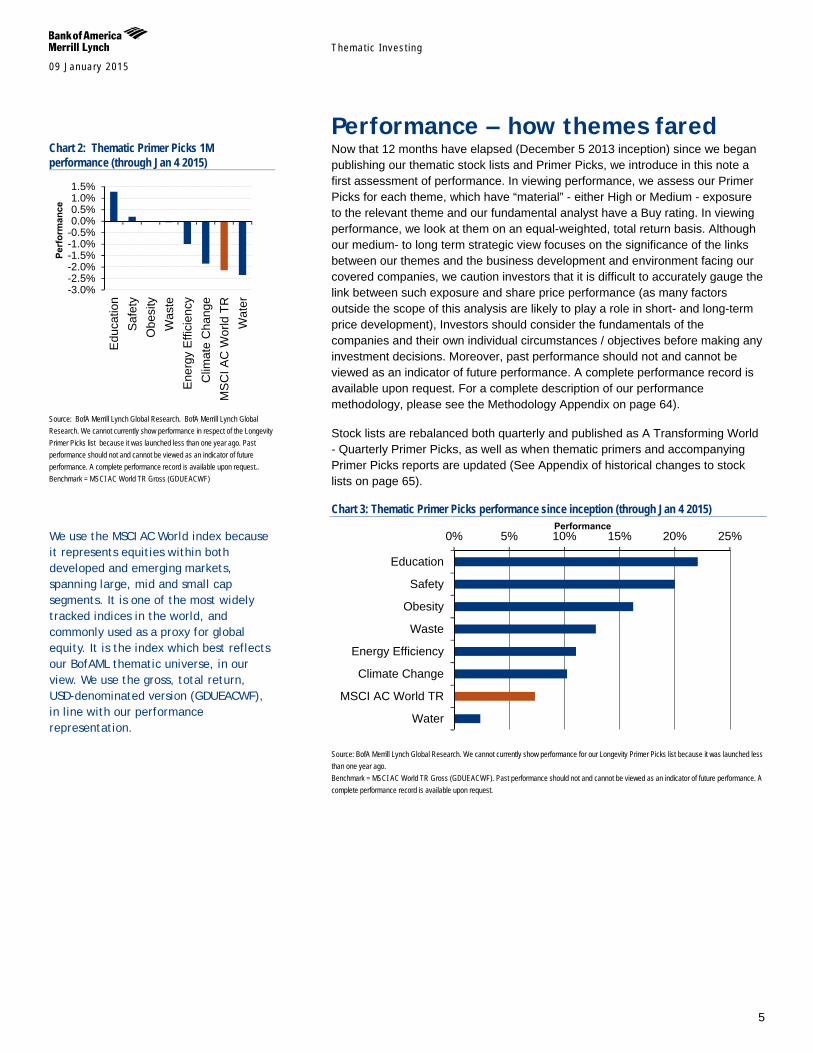
Chart 2: Thematic Primer Picks 1M performance (through Jan 4 2015)
Source: BofA Merrill Lynch Global Research. BofA Merrill Lynch Global Research. We cannot currently show performance in respect of the Longevity Primer Picks list because it was launched less than one year ago. Past performance should not and cannot be viewed as an indicator of future performance. A complete performance record is available upon request.. Benchmark = MSCI AC World TR Gross (GDUEACWF)
-3.0%-2.5%-2.0%-1.5%-1.0%-0.5%0.0%0.5%1.0%1.5%
Edu
catio
n S
afet
y O
besi
ty W
aste
Ene
rgy
Effi
cien
cyC
limat
e C
hang
eM
SC
I AC
Wor
ld T
R W
ater
Perf
orm
ance
We use the MSCI AC World index because it represents equities within both developed and emerging markets, spanning large, mid and small cap segments. It is one of the most widely tracked indices in the world, and commonly used as a proxy for global equity. It is the index which best reflects our BofAML thematic universe, in our view. We use the gross, total return, USD-denominated version (GDUEACWF), in line with our performance representation.
Themat ic Inves t ing 09 January 2015
6
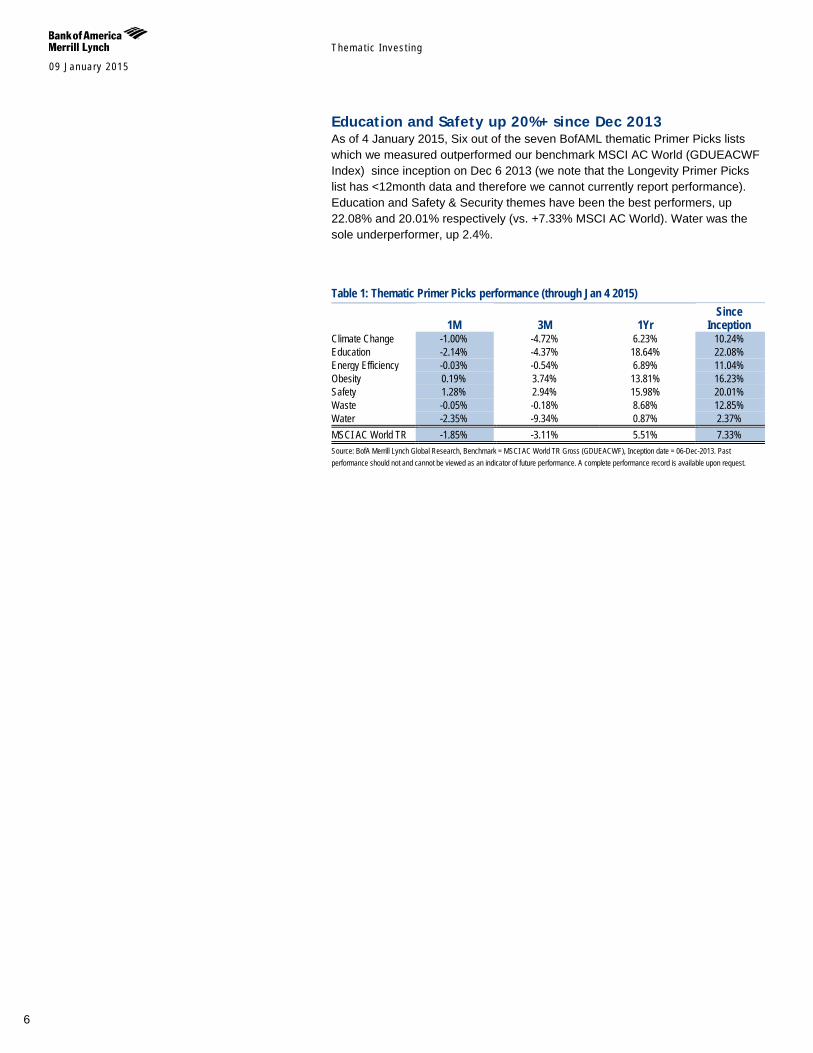
Education and Safety up 20%+ since Dec 2013 As of 4 January 2015, Six out of the seven BofAML thematic Primer Picks lists which we measured outperformed our benchmark MSCI AC World (GDUEACWF Index) since inception on Dec 6 2013 (we note that the Longevity Primer Picks list has <12month data and therefore we cannot currently report performance). Education and Safety & Security themes have been the best performers, up 22.08% and 20.01% respectively (vs. +7.33% MSCI AC World). Water was the sole underperformer, up 2.4%.
Table 1: Thematic Primer Picks performance (through Jan 4 2015)
1M 3M 1Yr Since
Inception Climate Change -1.00% -4.72% 6.23% 10.24% Education -2.14% -4.37% 18.64% 22.08% Energy Efficiency -0.03% -0.54% 6.89% 11.04% Obesity 0.19% 3.74% 13.81% 16.23% Safety 1.28% 2.94% 15.98% 20.01% Waste -0.05% -0.18% 8.68% 12.85% Water -2.35% -9.34% 0.87% 2.37% MSCI AC World TR -1.85% -3.11% 5.51% 7.33% Source: BofA Merrill Lynch Global Research, Benchmark = MSCI AC World TR Gross (GDUEACWF), Inception date = 06-Dec-2013. Past performance should not and cannot be viewed as an indicator of future performance. A complete performance record is available upon request.
09 January 2015
Them
atic Investing
7
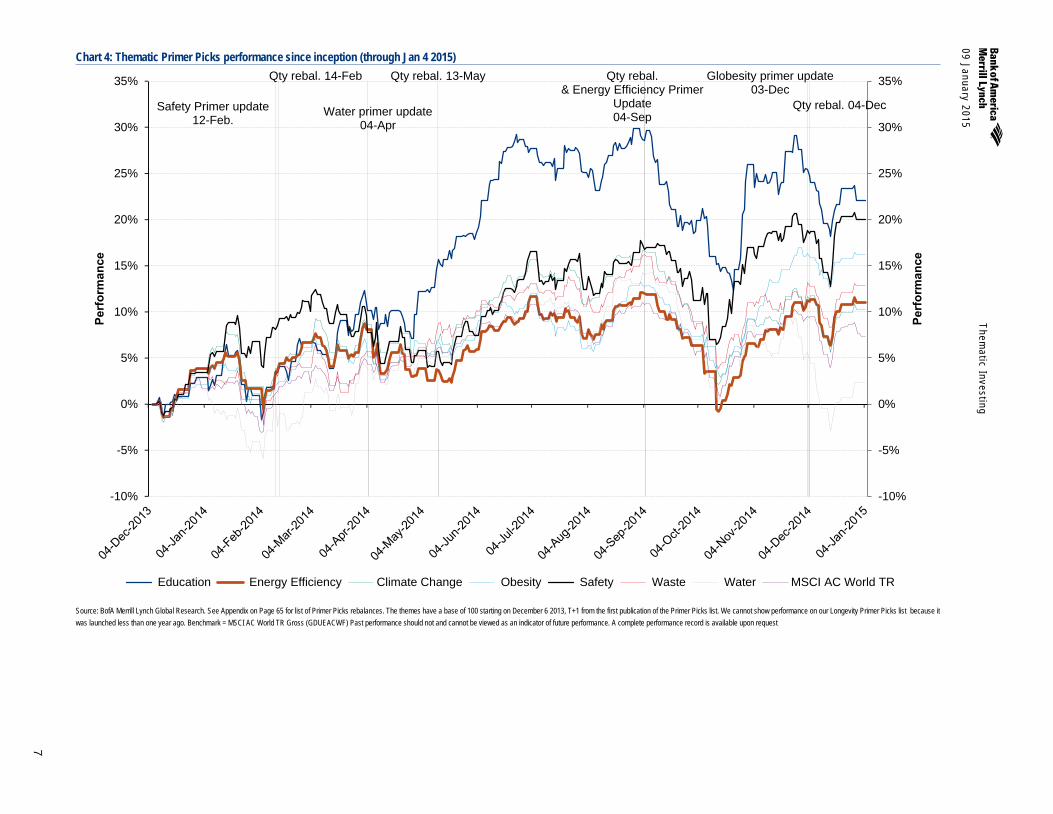
Chart 4: Thematic Primer Picks performance since inception (through Jan 4 2015)
Source: BofA Merrill Lynch Global Research. See Appendix on Page 65 for list of Primer Picks rebalances. The themes have a base of 100 starting on December 6 2013, T+1 from the first publication of the Primer Picks list. We cannot show performance on our Longevity Primer Picks list because it was launched less than one year ago. Benchmark = MSCI AC World TR Gross (GDUEACWF) Past performance should not and cannot be viewed as an indicator of future performance. A complete performance record is available upon request
Qty rebal. 14-Feb
Safety Primer update 12-Feb.
Water primer update 04-Apr
Qty rebal. 13-May Qty rebal. & Energy Efficiency Primer
Update 04-Sep
Globesity primer update 03-Dec
Qty rebal. 04-Dec
-10%
-5%
0%
5%
10%
15%
20%
25%
30%
35%
-10%
-5%
0%
5%
10%
15%
20%
25%
30%
35%
Perf
orm
ance
Perf
orm
ance
Education Energy Efficiency Climate Change Obesity Safety Waste Water MSCI AC World TR
Themat ic Inves t ing 09 January 2015
8
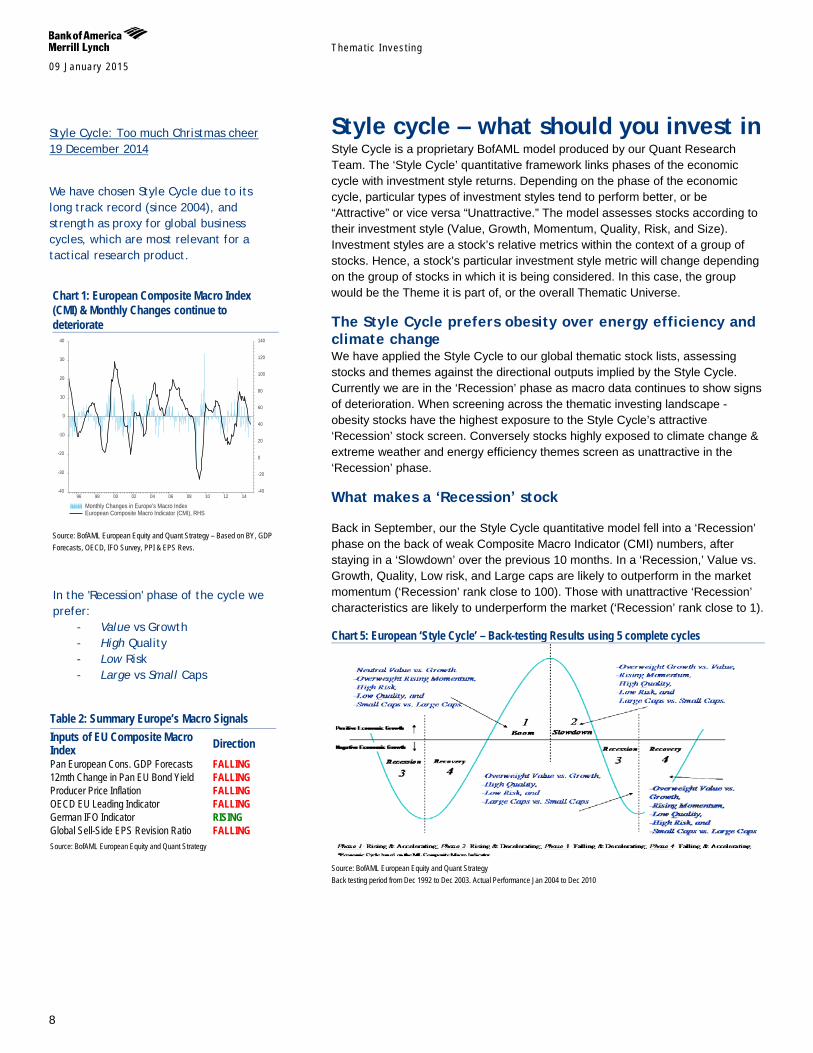
Style cycle – what should you invest in Style Cycle is a proprietary BofAML model produced by our Quant Research Team. The ‘Style Cycle’ quantitative framework links phases of the economic cycle with investment style returns. Depending on the phase of the economic cycle, particular types of investment styles tend to perform better, or be “Attractive” or vice versa “Unattractive.” The model assesses stocks according to their investment style (Value, Growth, Momentum, Quality, Risk, and Size). Investment styles are a stock’s relative metrics within the context of a group of stocks. Hence, a stock’s particular investment style metric will change depending on the group of stocks in which it is being considered. In this case, the group would be the Theme it is part of, or the overall Thematic Universe.
The Style Cycle prefers obesity over energy efficiency and climate change We have applied the Style Cycle to our global thematic stock lists, assessing stocks and themes against the directional outputs implied by the Style Cycle. Currently we are in the ‘Recession’ phase as macro data continues to show signs of deterioration. When screening across the thematic investing landscape - obesity stocks have the highest exposure to the Style Cycle’s attractive ‘Recession’ stock screen. Conversely stocks highly exposed to climate change & extreme weather and energy efficiency themes screen as unattractive in the ‘Recession’ phase.
What makes a ‘Recession’ stock Back in September, our the Style Cycle quantitative model fell into a ‘Recession’ phase on the back of weak Composite Macro Indicator (CMI) numbers, after staying in a ‘Slowdown’ over the previous 10 months. In a ‘Recession,’ Value vs. Growth, Quality, Low risk, and Large caps are likely to outperform in the market momentum (‘Recession’ rank close to 100). Those with unattractive ‘Recession’ characteristics are likely to underperform the market (‘Recession’ rank close to 1).
Chart 5: European ‘Style Cycle’ – Back-testing Results using 5 complete cycles
Source: BofAML European Equity and Quant Strategy Back testing period from Dec 1992 to Dec 2003. Actual Performance Jan 2004 to Dec 2010
Chart 1: European Composite Macro Index (CMI) & Monthly Changes continue to deteriorate
Source: BofAML European Equity and Quant Strategy – Based on BY, GDP Forecasts, OECD, IFO Survey, PPI & EPS Revs.
Table 2: Summary Europe’s Macro Signals Inputs of EU Composite Macro Index Direction Pan European Cons. GDP Forecasts FALLING 12mth Change in Pan EU Bond Yield FALLING Producer Price Inflation FALLING OECD EU Leading Indicator FALLING German IFO Indicator RISING Global Sell-Side EPS Revision Ratio FALLING Source: BofAML European Equity and Quant Strategy
Source: Thomson Reuters Datastream
96 98 00 02 04 06 08 10 12 14-40
-30
-20
-10
0
10
20
30
40
-40
-20
0
20
40
60
80
100
120
140
Monthly Changes in Europe's Macro IndexEuropean Composite Macro Indicator (CMI), RHS
In the 'Recession' phase of the cycle we prefer:
- Value vs Growth - High Quality - Low Risk - Large vs Small Caps
Style Cycle: Too much Christmas cheer 19 December 2014
We have chosen Style Cycle due to its long track record (since 2004), and strength as proxy for global business cycles, which are most relevant for a tactical research product.
Themat ic Inves t ing 09 January 2015
9
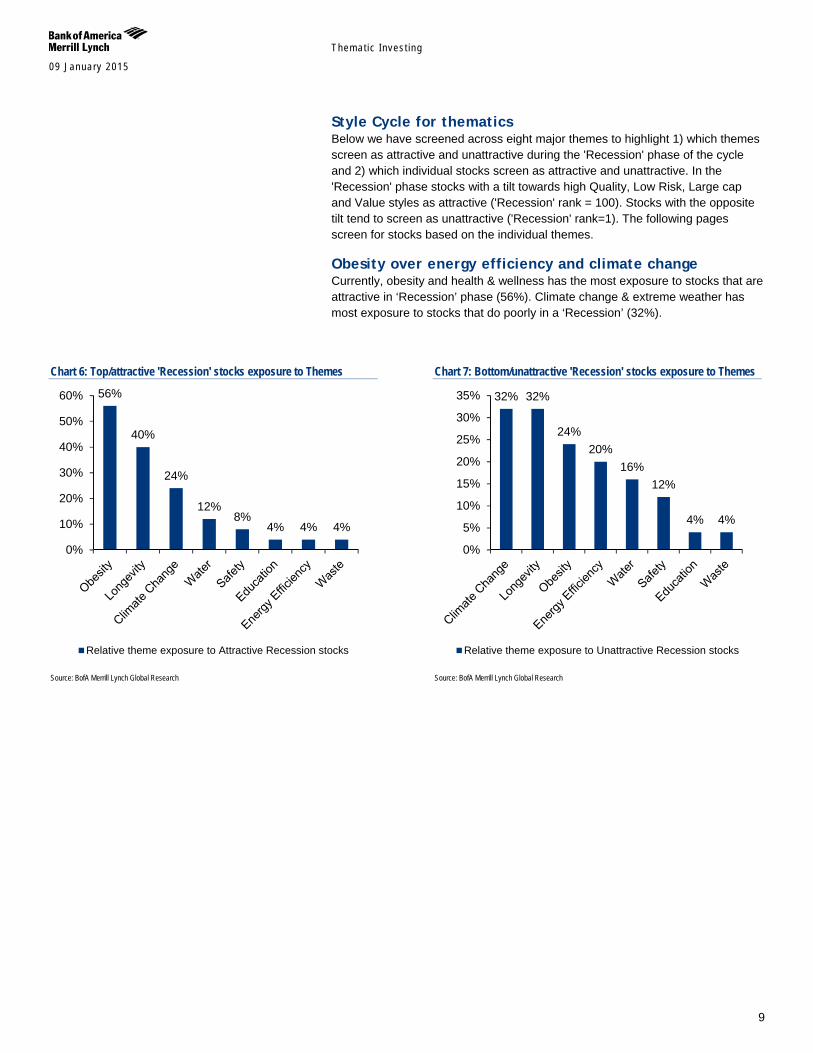
Style Cycle for thematics Below we have screened across eight major themes to highlight 1) which themes screen as attractive and unattractive during the 'Recession' phase of the cycle and 2) which individual stocks screen as attractive and unattractive. In the 'Recession' phase stocks with a tilt towards high Quality, Low Risk, Large cap and Value styles as attractive ('Recession' rank = 100). Stocks with the opposite tilt tend to screen as unattractive ('Recession' rank=1). The following pages screen for stocks based on the individual themes.
Obesity over energy efficiency and climate change Currently, obesity and health & wellness has the most exposure to stocks that are attractive in ‘Recession’ phase (56%). Climate change & extreme weather has most exposure to stocks that do poorly in a ‘Recession’ (32%).
Chart 6: Top/attractive 'Recession' stocks exposure to Themes
Source: BofA Merrill Lynch Global Research
Chart 7: Bottom/unattractive 'Recession' stocks exposure to Themes
Source: BofA Merrill Lynch Global Research
56%
40%
24%
12% 8%
4% 4% 4%
0%
10%
20%
30%
40%
50%
60%
Relative theme exposure to Attractive Recession stocks
32% 32%
24% 20%
16% 12%
4% 4%
0%
5%
10%
15%
20%
25%
30%
35%
Relative theme exposure to Unattractive Recession stocks
Themat ic Inves t ing 09 January 2015
10
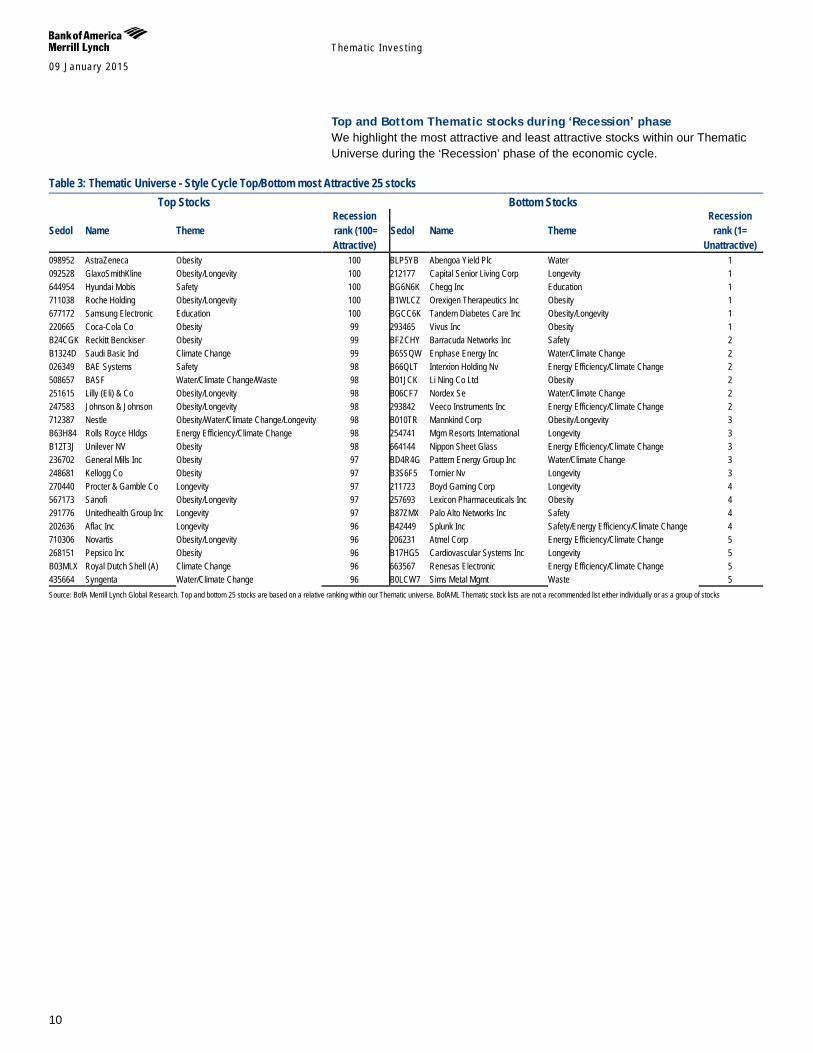
Top and Bottom Thematic stocks during ‘Recession’ phase We highlight the most attractive and least attractive stocks within our Thematic Universe during the ‘Recession’ phase of the economic cycle.
Table 3: Thematic Universe - Style Cycle Top/Bottom most Attractive 25 stocks Top Stocks Bottom Stocks
Sedol Name Theme Recession
Sedol Name Theme Recession
rank (100= rank (1= Attractive) Unattractive)
098952 AstraZeneca Obesity 100 BLP5YB Abengoa Yield Plc Water 1 092528 GlaxoSmithKline Obesity/Longevity 100 212177 Capital Senior Living Corp Longevity 1 644954 Hyundai Mobis Safety 100 BG6N6K Chegg Inc Education 1 711038 Roche Holding Obesity/Longevity 100 B1WLCZ Orexigen Therapeutics Inc Obesity 1 677172 Samsung Electronic Education 100 BGCC6K Tandem Diabetes Care Inc Obesity/Longevity 1 220665 Coca-Cola Co Obesity 99 293465 Vivus Inc Obesity 1 B24CGK Reckitt Benckiser Obesity 99 BFZCHY Barracuda Networks Inc Safety 2 B1324D Saudi Basic Ind Climate Change 99 B65SQW Enphase Energy Inc Water/Climate Change 2 026349 BAE Systems Safety 98 B66QLT Interxion Holding Nv Energy Efficiency/Climate Change 2 508657 BASF Water/Climate Change/Waste 98 B01JCK Li Ning Co Ltd Obesity 2 251615 Lilly (Eli) & Co Obesity/Longevity 98 B06CF7 Nordex Se Water/Climate Change 2 247583 Johnson & Johnson Obesity/Longevity 98 293842 Veeco Instruments Inc Energy Efficiency/Climate Change 2 712387 Nestle Obesity/Water/Climate Change/Longevity 98 B010TR Mannkind Corp Obesity/Longevity 3 B63H84 Rolls Royce Hldgs Energy Efficiency/Climate Change 98 254741 Mgm Resorts International Longevity 3 B12T3J Unilever NV Obesity 98 664144 Nippon Sheet Glass Energy Efficiency/Climate Change 3 236702 General Mills Inc Obesity 97 BD4R4G Pattern Energy Group Inc Water/Climate Change 3 248681 Kellogg Co Obesity 97 B3S6F5 Tornier Nv Longevity 3 270440 Procter & Gamble Co Longevity 97 211723 Boyd Gaming Corp Longevity 4 567173 Sanofi Obesity/Longevity 97 257693 Lexicon Pharmaceuticals Inc Obesity 4 291776 Unitedhealth Group Inc Longevity 97 B87ZMX Palo Alto Networks Inc Safety 4 202636 Aflac Inc Longevity 96 B42449 Splunk Inc Safety/Energy Efficiency/Climate Change 4 710306 Novartis Obesity/Longevity 96 206231 Atmel Corp Energy Efficiency/Climate Change 5 268151 Pepsico Inc Obesity 96 B17HG5 Cardiovascular Systems Inc Longevity 5 B03MLX Royal Dutch Shell (A) Climate Change 96 663567 Renesas Electronic Energy Efficiency/Climate Change 5 435664 Syngenta Water/Climate Change 96 B0LCW7 Sims Metal Mgmt Waste 5 Source: BofA Merrill Lynch Global Research. Top and bottom 25 stocks are based on a relative ranking within our Thematic universe. BofAML Thematic stock lists are not a recommended list either individually or as a group of stocks
Themat ic Inves t ing 09 January 2015
11
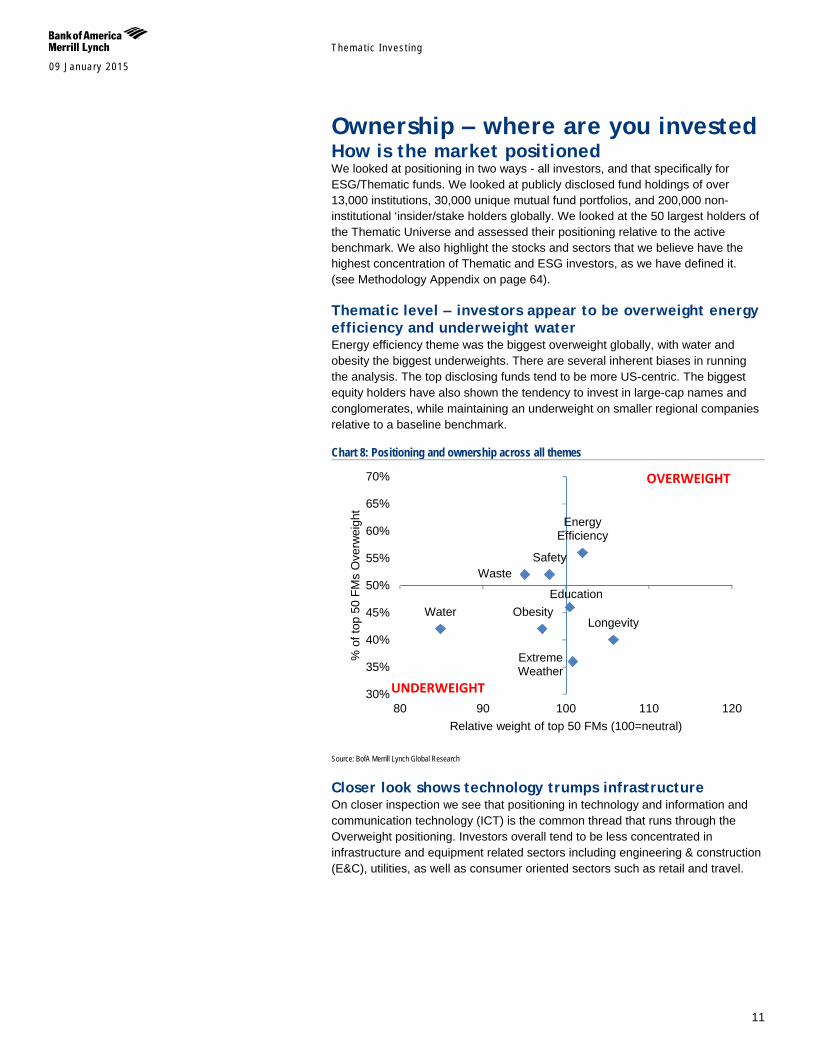
Ownership – where are you invested How is the market positioned We looked at positioning in two ways - all investors, and that specifically for ESG/Thematic funds. We looked at publicly disclosed fund holdings of over 13,000 institutions, 30,000 unique mutual fund portfolios, and 200,000 non-institutional ‘insider/stake holders globally. We looked at the 50 largest holders of the Thematic Universe and assessed their positioning relative to the active benchmark. We also highlight the stocks and sectors that we believe have the highest concentration of Thematic and ESG investors, as we have defined it. (see Methodology Appendix on page 64).
Thematic level – investors appear to be overweight energy efficiency and underweight water Energy efficiency theme was the biggest overweight globally, with water and obesity the biggest underweights. There are several inherent biases in running the analysis. The top disclosing funds tend to be more US-centric. The biggest equity holders have also shown the tendency to invest in large-cap names and conglomerates, while maintaining an underweight on smaller regional companies relative to a baseline benchmark.
Chart 8: Positioning and ownership across all themes
Source: BofA Merrill Lynch Global Research
Closer look shows technology trumps infrastructure On closer inspection we see that positioning in technology and information and communication technology (ICT) is the common thread that runs through the Overweight positioning. Investors overall tend to be less concentrated in infrastructure and equipment related sectors including engineering & construction (E&C), utilities, as well as consumer oriented sectors such as retail and travel.
Water
Waste
Longevity
Extreme Weather
Safety
Energy Efficiency
Education Obesity
30%
35%
40%
45%
50%
55%
60%
65%
70%
80 90 100 110 120
% o
f top
50
FMs
Ove
rwei
ght
Relative weight of top 50 FMs (100=neutral)
UNDERWEIGHT
OVERWEIGHT
Themat ic Inves t ing 09 January 2015
12
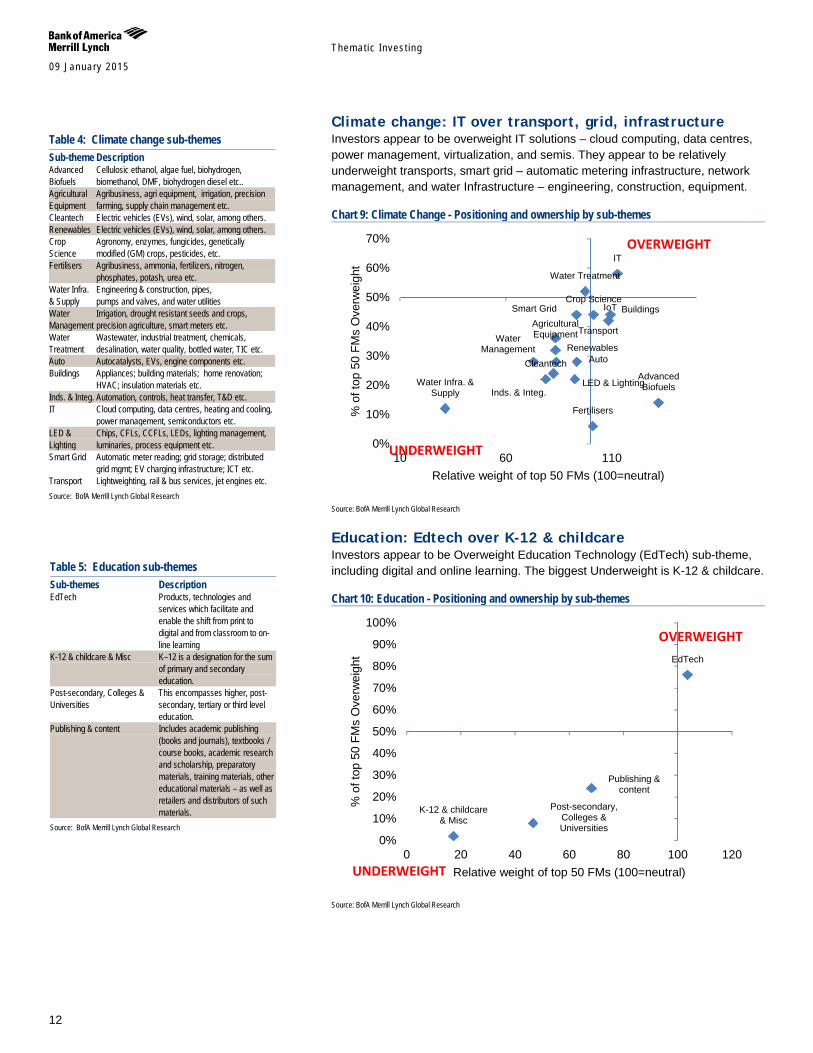
Climate change: IT over transport, grid, infrastructure Investors appear to be overweight IT solutions – cloud computing, data centres, power management, virtualization, and semis. They appear to be relatively underweight transports, smart grid – automatic metering infrastructure, network management, and water Infrastructure – engineering, construction, equipment.
Chart 9: Climate Change - Positioning and ownership by sub-themes
Source: BofA Merrill Lynch Global Research
Education: Edtech over K-12 & childcare Investors appear to be Overweight Education Technology (EdTech) sub-theme, including digital and online learning. The biggest Underweight is K-12 & childcare.
Chart 10: Education - Positioning and ownership by sub-themes
Source: BofA Merrill Lynch Global Research
Advanced Biofuels
Agricultural Equipment
Cleantech
Renewables
Crop Science
Fertilisers
Water Infra. & Supply
Water Management
Water Treatment
Auto
Buildings
Inds. & Integ.
IoT
IT
LED & Lighting
Smart Grid
Transport
0%
10%
20%
30%
40%
50%
60%
70%
10 60 110
% o
f top
50
FMs
Ove
rwei
ght
Relative weight of top 50 FMs (100=neutral)
UNDERWEIGHT
OVERWEIGHT
EdTech
K-12 & childcare & Misc
Post-secondary, Colleges & Universities
Publishing & content
0%
10%
20%
30%
40%
50%
60%
70%
80%
90%
100%
0 20 40 60 80 100 120
% o
f top
50
FMs
Ove
rwei
ght
Relative weight of top 50 FMs (100=neutral) UNDERWEIGHT
OVERWEIGHT
Table 4: Climate change sub-themes Sub-theme Description Advanced Biofuels
Cellulosic ethanol, algae fuel, biohydrogen, biomethanol, DMF, biohydrogen diesel etc..
Agricultural Equipment
Agribusiness, agri equipment, irrigation, precision farming, supply chain management etc.
Cleantech Electric vehicles (EVs), wind, solar, among others. Renewables Electric vehicles (EVs), wind, solar, among others. Crop Science
Agronomy, enzymes, fungicides, genetically modified (GM) crops, pesticides, etc.
Fertilisers Agribusiness, ammonia, fertilizers, nitrogen, phosphates, potash, urea etc.
Water Infra. & Supply
Engineering & construction, pipes, pumps and valves, and water utilities
Water Management
Irrigation, drought resistant seeds and crops, precision agriculture, smart meters etc.
Water Treatment
Wastewater, industrial treatment, chemicals, desalination, water quality, bottled water, TIC etc.
Auto Autocatalysts, EVs, engine components etc. Buildings Appliances; building materials; home renovation;
HVAC; insulation materials etc. Inds. & Integ. Automation, controls, heat transfer, T&D etc. IT Cloud computing, data centres, heating and cooling,
power management, semiconductors etc. LED & Lighting
Chips, CFLs, CCFLs, LEDs, lighting management, luminaries, process equipment etc.
Smart Grid Automatic meter reading; grid storage; distributed grid mgmt; EV charging infrastructure; ICT etc.
Transport Lightweighting, rail & bus services, jet engines etc. Source: BofA Merrill Lynch Global Research
Table 5: Education sub-themes Sub-themes Description EdTech Products, technologies and
services which facilitate and enable the shift from print to digital and from classroom to on-line learning
K-12 & childcare & Misc K–12 is a designation for the sum of primary and secondary education.
Post-secondary, Colleges & Universities
This encompasses higher, post-secondary, tertiary or third level education.
Publishing & content Includes academic publishing (books and journals), textbooks / course books, academic research and scholarship, preparatory materials, training materials, other educational materials – as well as retailers and distributors of such materials.
Source: BofA Merrill Lynch Global Research
Themat ic Inves t ing 09 January 2015
13
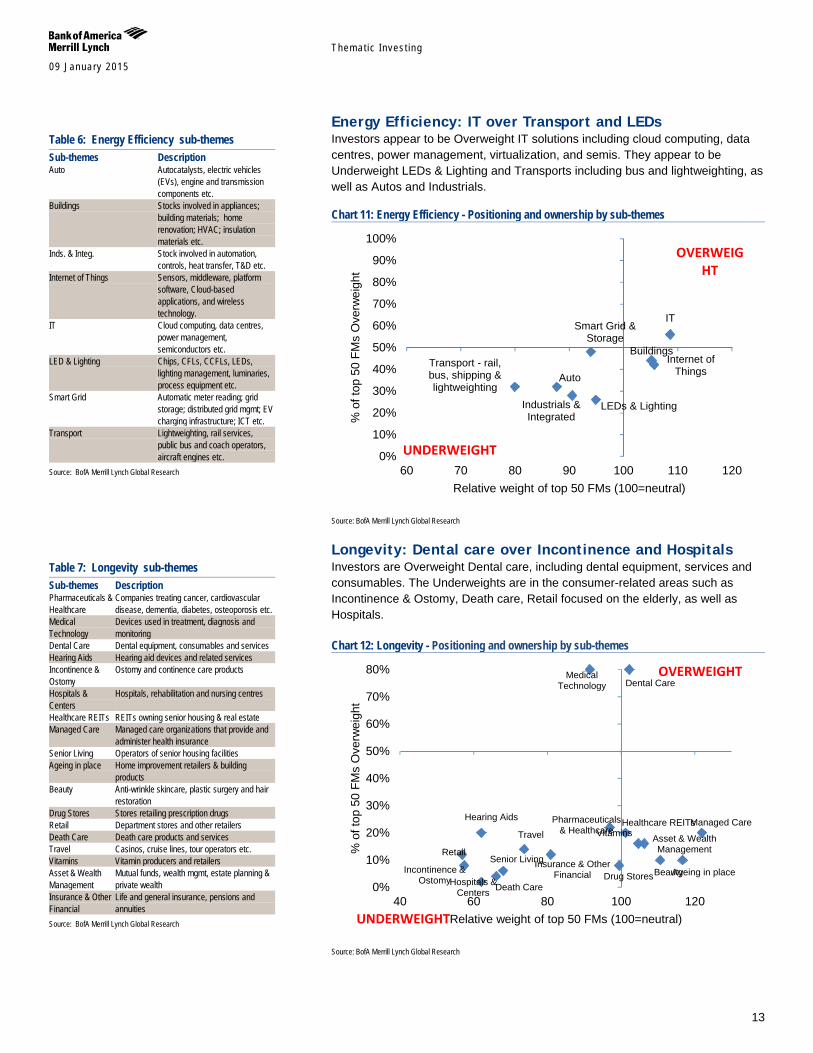
Energy Efficiency: IT over Transport and LEDs Investors appear to be Overweight IT solutions including cloud computing, data centres, power management, virtualization, and semis. They appear to be Underweight LEDs & Lighting and Transports including bus and lightweighting, as well as Autos and Industrials.
Chart 11: Energy Efficiency - Positioning and ownership by sub-themes
Source: BofA Merrill Lynch Global Research
Longevity: Dental care over Incontinence and Hospitals Investors are Overweight Dental care, including dental equipment, services and consumables. The Underweights are in the consumer-related areas such as Incontinence & Ostomy, Death care, Retail focused on the elderly, as well as Hospitals. Chart 12: Longevity - Positioning and ownership by sub-themes
Source: BofA Merrill Lynch Global Research
Auto
Buildings
Industrials & Integrated
Internet of Things
IT
LEDs & Lighting
Smart Grid & Storage
Transport - rail, bus, shipping & lightweighting
0%
10%
20%
30%
40%
50%
60%
70%
80%
90%
100%
60 70 80 90 100 110 120
% o
f top
50
FMs
Ove
rwei
ght
Relative weight of top 50 FMs (100=neutral)
UNDERWEIGHT
OVERWEIGHT
Pharmaceuticals & Healthcare
Medical Technology Dental Care
Hearing Aids
Incontinence & Ostomy Hospitals &
Centers
Healthcare REITs Managed Care
Senior Living Ageing in place Beauty Drug Stores
Retail
Death Care
Travel Vitamins Asset & Wealth Management
Insurance & Other Financial
0%
10%
20%
30%
40%
50%
60%
70%
80%
40 60 80 100 120
% o
f top
50
FMs
Ove
rwei
ght
Relative weight of top 50 FMs (100=neutral) UNDERWEIGHT
OVERWEIGHT
Table 6: Energy Efficiency sub-themes Sub-themes Description Auto Autocatalysts, electric vehicles
(EVs), engine and transmission components etc.
Buildings Stocks involved in appliances; building materials; home renovation; HVAC; insulation materials etc.
Inds. & Integ. Stock involved in automation, controls, heat transfer, T&D etc.
Internet of Things Sensors, middleware, platform software, Cloud-based applications, and wireless technology.
IT Cloud computing, data centres, power management, semiconductors etc.
LED & Lighting Chips, CFLs, CCFLs, LEDs, lighting management, luminaries, process equipment etc.
Smart Grid Automatic meter reading; grid storage; distributed grid mgmt; EV charging infrastructure; ICT etc.
Transport Lightweighting, rail services, public bus and coach operators, aircraft engines etc.
Source: BofA Merrill Lynch Global Research
Table 7: Longevity sub-themes Sub-themes Description Pharmaceuticals & Healthcare
Companies treating cancer, cardiovascular disease, dementia, diabetes, osteoporosis etc.
Medical Technology
Devices used in treatment, diagnosis and monitoring
Dental Care Dental equipment, consumables and services Hearing Aids Hearing aid devices and related services Incontinence & Ostomy
Ostomy and continence care products
Hospitals & Centers
Hospitals, rehabilitation and nursing centres
Healthcare REITs REITs owning senior housing & real estate Managed Care Managed care organizations that provide and
administer health insurance Senior Living Operators of senior housing facilities Ageing in place Home improvement retailers & building
products Beauty Anti-wrinkle skincare, plastic surgery and hair
restoration Drug Stores Stores retailing prescription drugs Retail Department stores and other retailers Death Care Death care products and services Travel Casinos, cruise lines, tour operators etc. Vitamins Vitamin producers and retailers Asset & Wealth Management
Mutual funds, wealth mgmt, estate planning & private wealth
Insurance & Other Financial
Life and general insurance, pensions and annuities
Source: BofA Merrill Lynch Global Research
Themat ic Inves t ing 09 January 2015
14
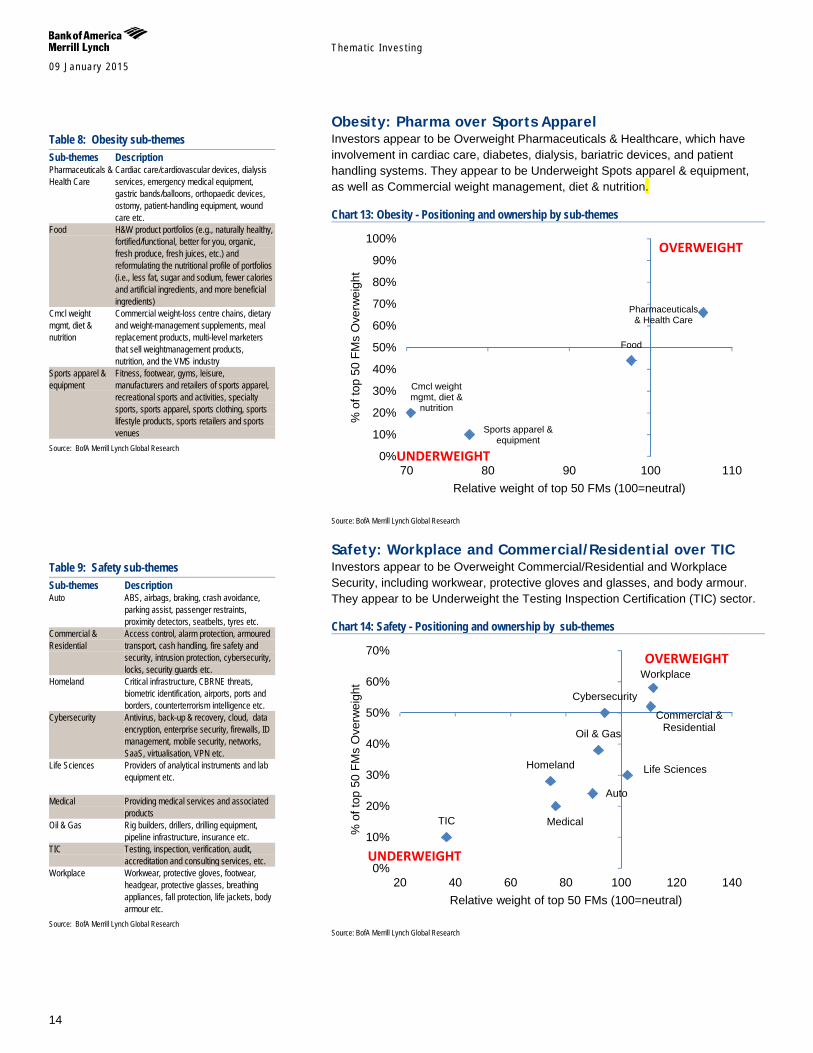
Obesity: Pharma over Sports Apparel Investors appear to be Overweight Pharmaceuticals & Healthcare, which have involvement in cardiac care, diabetes, dialysis, bariatric devices, and patient handling systems. They appear to be Underweight Spots apparel & equipment, as well as Commercial weight management, diet & nutrition.
Chart 13: Obesity - Positioning and ownership by sub-themes
Source: BofA Merrill Lynch Global Research
Safety: Workplace and Commercial/Residential over TIC Investors appear to be Overweight Commercial/Residential and Workplace Security, including workwear, protective gloves and glasses, and body armour. They appear to be Underweight the Testing Inspection Certification (TIC) sector.
Chart 14: Safety - Positioning and ownership by sub-themes
Source: BofA Merrill Lynch Global Research
Pharmaceuticals & Health Care
Food
Cmcl weight mgmt, diet &
nutrition
Sports apparel & equipment
0%
10%
20%
30%
40%
50%
60%
70%
80%
90%
100%
70 80 90 100 110
% o
f top
50
FMs
Ove
rwei
ght
Relative weight of top 50 FMs (100=neutral)
UNDERWEIGHT
OVERWEIGHT
Auto
Commercial & Residential
Homeland
Cybersecurity
Life Sciences
Medical
Oil & Gas
TIC
Workplace
0%
10%
20%
30%
40%
50%
60%
70%
20 40 60 80 100 120 140
% o
f top
50
FMs
Ove
rwei
ght
Relative weight of top 50 FMs (100=neutral)
UNDERWEIGHT
OVERWEIGHT
Table 8: Obesity sub-themes Sub-themes Description Pharmaceuticals & Health Care
Cardiac care/cardiovascular devices, dialysis services, emergency medical equipment, gastric bands/balloons, orthopaedic devices, ostomy, patient-handling equipment, wound care etc.
Food H&W product portfolios (e.g., naturally healthy, fortified/functional, better for you, organic, fresh produce, fresh juices, etc.) and reformulating the nutritional profile of portfolios (i.e., less fat, sugar and sodium, fewer calories and artificial ingredients, and more beneficial ingredients)
Cmcl weight mgmt, diet & nutrition
Commercial weight-loss centre chains, dietary and weight-management supplements, meal replacement products, multi-level marketers that sell weightmanagement products, nutrition, and the VMS industry
Sports apparel & equipment
Fitness, footwear, gyms, leisure, manufacturers and retailers of sports apparel, recreational sports and activities, specialty sports, sports apparel, sports clothing, sports lifestyle products, sports retailers and sports venues
Source: BofA Merrill Lynch Global Research
Table 9: Safety sub-themes Sub-themes Description Auto ABS, airbags, braking, crash avoidance,
parking assist, passenger restraints, proximity detectors, seatbelts, tyres etc.
Commercial & Residential
Access control, alarm protection, armoured transport, cash handling, fire safety and security, intrusion protection, cybersecurity, locks, security guards etc.
Homeland Critical infrastructure, CBRNE threats, biometric identification, airports, ports and borders, counterterrorism intelligence etc.
Cybersecurity Antivirus, back-up & recovery, cloud, data encryption, enterprise security, firewalls, ID management, mobile security, networks, SaaS, virtualisation, VPN etc.
Life Sciences
Providers of analytical instruments and lab equipment etc.
Medical Providing medical services and associated products
Oil & Gas Rig builders, drillers, drilling equipment, pipeline infrastructure, insurance etc.
TIC Testing, inspection, verification, audit, accreditation and consulting services, etc.
Workplace Workwear, protective gloves, footwear, headgear, protective glasses, breathing appliances, fall protection, life jackets, body armour etc.
Source: BofA Merrill Lynch Global Research
Themat ic Inves t ing 09 January 2015
15
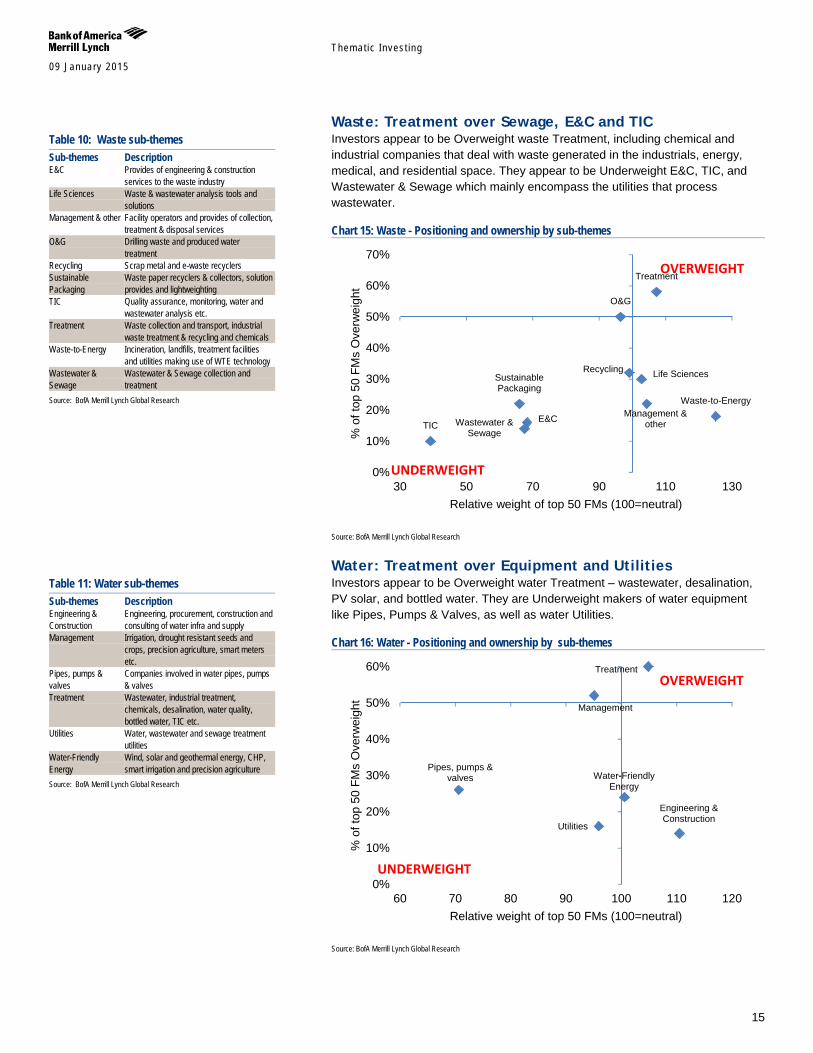
Waste: Treatment over Sewage, E&C and TIC Investors appear to be Overweight waste Treatment, including chemical and industrial companies that deal with waste generated in the industrials, energy, medical, and residential space. They appear to be Underweight E&C, TIC, and Wastewater & Sewage which mainly encompass the utilities that process wastewater.
Chart 15: Waste - Positioning and ownership by sub-themes
Source: BofA Merrill Lynch Global Research
Water: Treatment over Equipment and Utilities Investors appear to be Overweight water Treatment – wastewater, desalination, PV solar, and bottled water. They are Underweight makers of water equipment like Pipes, Pumps & Valves, as well as water Utilities.
Chart 16: Water - Positioning and ownership by sub-themes
Source: BofA Merrill Lynch Global Research
E&C
Life Sciences
Management & other
O&G
Recycling Sustainable Packaging
TIC
Treatment
Waste-to-Energy
Wastewater & Sewage
0%
10%
20%
30%
40%
50%
60%
70%
30 50 70 90 110 130
% o
f top
50
FMs
Ove
rwei
ght
Relative weight of top 50 FMs (100=neutral)
UNDERWEIGHT
OVERWEIGHT
Engineering & Construction
Management
Pipes, pumps & valves
Treatment
Utilities
Water-Friendly Energy
0%
10%
20%
30%
40%
50%
60%
60 70 80 90 100 110 120
% o
f top
50
FMs
Ove
rwei
ght
Relative weight of top 50 FMs (100=neutral)
UNDERWEIGHT
OVERWEIGHT
Table 10: Waste sub-themes Sub-themes Description E&C Provides of engineering & construction
services to the waste industry Life Sciences Waste & wastewater analysis tools and
solutions Management & other Facility operators and provides of collection,
treatment & disposal services O&G Drilling waste and produced water
treatment Recycling Scrap metal and e-waste recyclers Sustainable Packaging
Waste paper recyclers & collectors, solution provides and lightweighting
TIC Quality assurance, monitoring, water and wastewater analysis etc.
Treatment Waste collection and transport, industrial waste treatment & recycling and chemicals
Waste-to-Energy Incineration, landfills, treatment facilities and utilities making use of WTE technology
Wastewater & Sewage
Wastewater & Sewage collection and treatment
Source: BofA Merrill Lynch Global Research
Table 11: Water sub-themes Sub-themes Description Engineering & Construction
Engineering, procurement, construction and consulting of water infra and supply
Management Irrigation, drought resistant seeds and crops, precision agriculture, smart meters etc.
Pipes, pumps & valves
Companies involved in water pipes, pumps & valves
Treatment Wastewater, industrial treatment, chemicals, desalination, water quality, bottled water, TIC etc.
Utilities Water, wastewater and sewage treatment utilities
Water-Friendly Energy
Wind, solar and geothermal energy, CHP, smart irrigation and precision agriculture
Source: BofA Merrill Lynch Global Research
Themat ic Inves t ing 09 January 2015
16
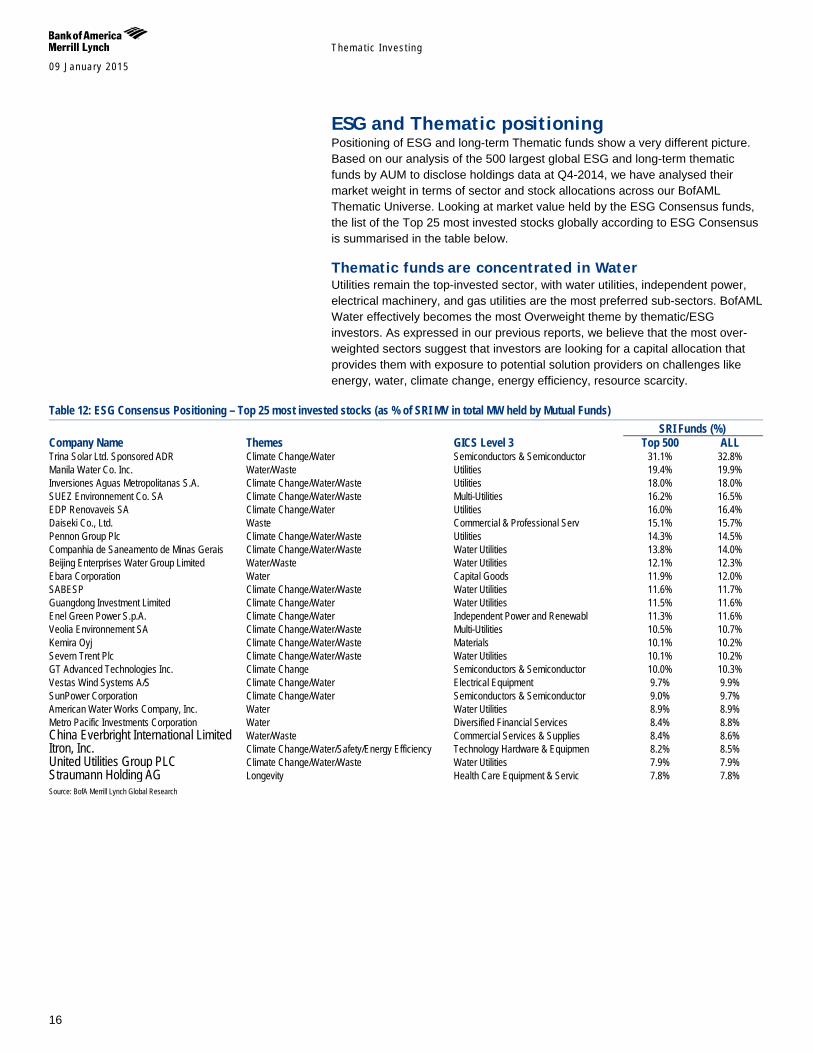
ESG and Thematic positioning Positioning of ESG and long-term Thematic funds show a very different picture. Based on our analysis of the 500 largest global ESG and long-term thematic funds by AUM to disclose holdings data at Q4-2014, we have analysed their market weight in terms of sector and stock allocations across our BofAML Thematic Universe. Looking at market value held by the ESG Consensus funds, the list of the Top 25 most invested stocks globally according to ESG Consensus is summarised in the table below.
Thematic funds are concentrated in Water Utilities remain the top-invested sector, with water utilities, independent power, electrical machinery, and gas utilities are the most preferred sub-sectors. BofAML Water effectively becomes the most Overweight theme by thematic/ESG investors. As expressed in our previous reports, we believe that the most over-weighted sectors suggest that investors are looking for a capital allocation that provides them with exposure to potential solution providers on challenges like energy, water, climate change, energy efficiency, resource scarcity.
Table 12: ESG Consensus Positioning – Top 25 most invested stocks (as % of SRI MV in total MW held by Mutual Funds) SRI Funds (%) Company Name Themes GICS Level 3 Top 500 ALL Trina Solar Ltd. Sponsored ADR Climate Change/Water Semiconductors & Semiconductor 31.1% 32.8% Manila Water Co. Inc. Water/Waste Utilities 19.4% 19.9% Inversiones Aguas Metropolitanas S.A. Climate Change/Water/Waste Utilities 18.0% 18.0% SUEZ Environnement Co. SA Climate Change/Water/Waste Multi-Utilities 16.2% 16.5% EDP Renovaveis SA Climate Change/Water Utilities 16.0% 16.4% Daiseki Co., Ltd. Waste Commercial & Professional Serv 15.1% 15.7% Pennon Group Plc Climate Change/Water/Waste Utilities 14.3% 14.5% Companhia de Saneamento de Minas Gerais Climate Change/Water/Waste Water Utilities 13.8% 14.0% Beijing Enterprises Water Group Limited Water/Waste Water Utilities 12.1% 12.3% Ebara Corporation Water Capital Goods 11.9% 12.0% SABESP Climate Change/Water/Waste Water Utilities 11.6% 11.7% Guangdong Investment Limited Climate Change/Water Water Utilities 11.5% 11.6% Enel Green Power S.p.A. Climate Change/Water Independent Power and Renewabl 11.3% 11.6% Veolia Environnement SA Climate Change/Water/Waste Multi-Utilities 10.5% 10.7% Kemira Oyj Climate Change/Water/Waste Materials 10.1% 10.2% Severn Trent Plc Climate Change/Water/Waste Water Utilities 10.1% 10.2% GT Advanced Technologies Inc. Climate Change Semiconductors & Semiconductor 10.0% 10.3% Vestas Wind Systems A/S Climate Change/Water Electrical Equipment 9.7% 9.9% SunPower Corporation Climate Change/Water Semiconductors & Semiconductor 9.0% 9.7% American Water Works Company, Inc. Water Water Utilities 8.9% 8.9% Metro Pacific Investments Corporation Water Diversified Financial Services 8.4% 8.8% China Everbright International Limited Water/Waste Commercial Services & Supplies 8.4% 8.6% Itron, Inc. Climate Change/Water/Safety/Energy Efficiency Technology Hardware & Equipmen 8.2% 8.5% United Utilities Group PLC Climate Change/Water/Waste Water Utilities 7.9% 7.9% Straumann Holding AG Longevity Health Care Equipment & Servic 7.8% 7.8% Source: BofA Merrill Lynch Global Research
Themat ic Inves t ing 09 January 2015
17
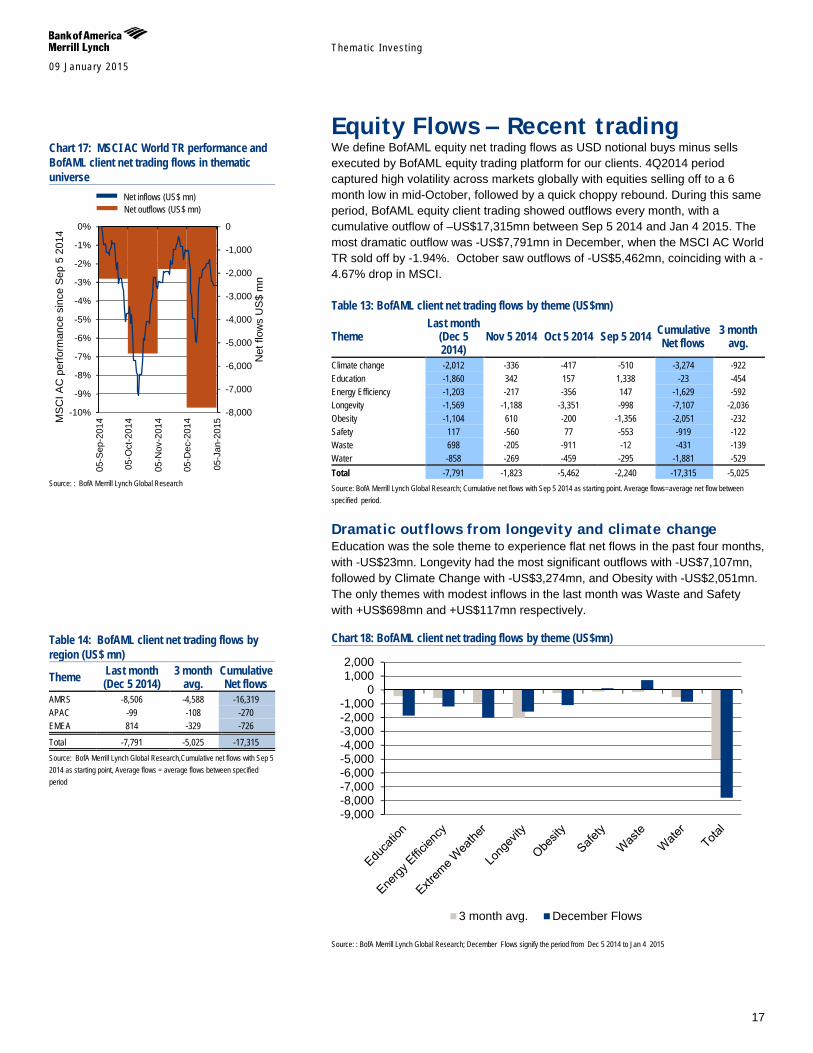
Equity Flows – Recent trading We define BofAML equity net trading flows as USD notional buys minus sells executed by BofAML equity trading platform for our clients. 4Q2014 period captured high volatility across markets globally with equities selling off to a 6 month low in mid-October, followed by a quick choppy rebound. During this same period, BofAML equity client trading showed outflows every month, with a cumulative outflow of –US$17,315mn between Sep 5 2014 and Jan 4 2015. The most dramatic outflow was -US$7,791mn in December, when the MSCI AC World TR sold off by -1.94%. October saw outflows of -US$5,462mn, coinciding with a -4.67% drop in MSCI.
Table 13: BofAML client net trading flows by theme (US$mn)
Theme Last month
(Dec 5 2014)
Nov 5 2014 Oct 5 2014 Sep 5 2014 Cumulative Net flows
3 month avg.
Climate change -2,012 -336 -417 -510 -3,274 -922 Education -1,860 342 157 1,338 -23 -454 Energy Efficiency -1,203 -217 -356 147 -1,629 -592 Longevity -1,569 -1,188 -3,351 -998 -7,107 -2,036 Obesity -1,104 610 -200 -1,356 -2,051 -232 Safety 117 -560 77 -553 -919 -122 Waste 698 -205 -911 -12 -431 -139 Water -858 -269 -459 -295 -1,881 -529 Total -7,791 -1,823 -5,462 -2,240 -17,315 -5,025 Source: BofA Merrill Lynch Global Research; Cumulative net flows with Sep 5 2014 as starting point. Average flows=average net flow between specified period.
Dramatic outflows from longevity and climate change Education was the sole theme to experience flat net flows in the past four months, with -US$23mn. Longevity had the most significant outflows with -US$7,107mn, followed by Climate Change with -US$3,274mn, and Obesity with -US$2,051mn. The only themes with modest inflows in the last month was Waste and Safety with +US$698mn and +US$117mn respectively.
Chart 18: BofAML client net trading flows by theme (US$mn)
Source: : BofA Merrill Lynch Global Research; December Flows signify the period from Dec 5 2014 to Jan 4 2015
-9,000-8,000-7,000-6,000-5,000-4,000-3,000-2,000-1,000
01,0002,000
3 month avg. December Flows
Chart 17: MSCI AC World TR performance and BofAML client net trading flows in thematic universe
Source: : BofA Merrill Lynch Global Research
Table 14: BofAML client net trading flows by region (US$ mn)
Theme Last month (Dec 5 2014)
3 month avg.
Cumulative Net flows
AMRS -8,506 -4,588 -16,319 APAC -99 -108 -270 EMEA 814 -329 -726
Total -7,791 -5,025 -17,315 Source: BofA Merrill Lynch Global Research,Cumulative net flows with Sep 5 2014 as starting point, Average flows = average flows between specified period
-8,000
-7,000
-6,000
-5,000
-4,000
-3,000
-2,000
-1,000
0
-10%
-9%
-8%
-7%
-6%
-5%
-4%
-3%
-2%
-1%
0%
05-S
ep-2
014
05-O
ct-2
014
05-N
ov-2
014
05-D
ec-2
014
05-J
an-2
015
Net
flow
s U
S$
mn
MS
CI A
C p
erfo
rman
ce s
ince
Sep
5 2
014
Net inflows (US$ mn) Net outflows (US$ mn)
Themat ic Inves t ing 09 January 2015
18
Themes Climate change & extreme weather - A perfect storm A Transforming World thematic impacts: Earth, Government, Innovation, Markets, People. Extreme weather: welcome to the new normal - Climate anomalies are on the rise globally with 2013 marking the 28th consecutive year with a global temperature above the 20th century average (Source: NOAA). Extreme weather is becoming the new normal, with extremes now covering 10% of the globe vs. 0.1% to 0.2% from 1951-1980 (Source: NASA). While no single incident can be definitively attributed to climate change, there is overwhelming scientific evidence that we should expect more damaging extreme weather events, with up to 40% of global land area at risk from extreme heat by 2040E (Source: Coumou et. al.).
Losses are skyrocketing: we’re not sufficiently prepared - Global climate-related losses have risen to as much as US$200bn in 2005 as a result of Hurricane Katrina. 2011 and 2012 were the two worst years on record for extreme weather events, which caused a total of more than $170 billion in damages, much of that to businesses (Source: NOAA). 90% of the S&P Global 100 across industry sectors identify extreme weather and climate change as current or future business risks (Source: C2ES). But worryingly, less than 50% of companies have integrated climate change adaptation into their business strategies (Source: CDP)
It’s getting warmer: on track for a 2-4°Cwarmer world - Without further action to reduce greenhouse gas emissions (GHGs), scientists are predicting a 2-4°C rise in temperatures by 2100 and it could happen as early as the 2060s. This would mean unprecedented heat waves, severe drought, and major floods in many regions with serious impacts on human systems and ecosystems and new risks that would threaten our future adaptation needs (Source: World Bank). The U.S. National Climate Change Assessment (NCA) – released in May 2014 warns of climate change-related problems that are already disrupting the lives of ordinary Americans (e.g. extreme weather, sea-level rise, thawing of Arctic sea ice, shift in growing seasons et. al.) and calls for action to reduce GHG emissions.
A perfect storm is brewing: food-water-energy security - By 2030E, global food demand is set to increase by up to 50%, water demand by up to 40% and energy demand by up to 50%. Given how closely food, water and energy security are connected, this will mean increasing trade-offs and resource rationing. It also threatens to create a “perfect storm” of global events, which poses key questions for governments, stakeholders, corporates and investors as to how to meet these demands while adapting to and mitigating climate change.
Weathering the storm: 7 entry points for long-term solutions - In our view, a number of stocks are placed to benefit from their role as long-term solution providers for the perfect storm of food-water-energy security in an extreme weather and climate change constrained world. We have identified c200 stocks covered by BofAML Global Research across seven entry points: 1) Water; 2) Fertilizers; 3) Crop Science; 4) Farming and Agricultural Equipment; 5) Second Generation Biofuels; 6) Energy Efficiency; and 7) Renewables and Cleantech.
Thematic Investing: Extreme weather primer –weathering the perfect storm 12 September 2013
Themat ic Inves t ing 09 January 2015
19
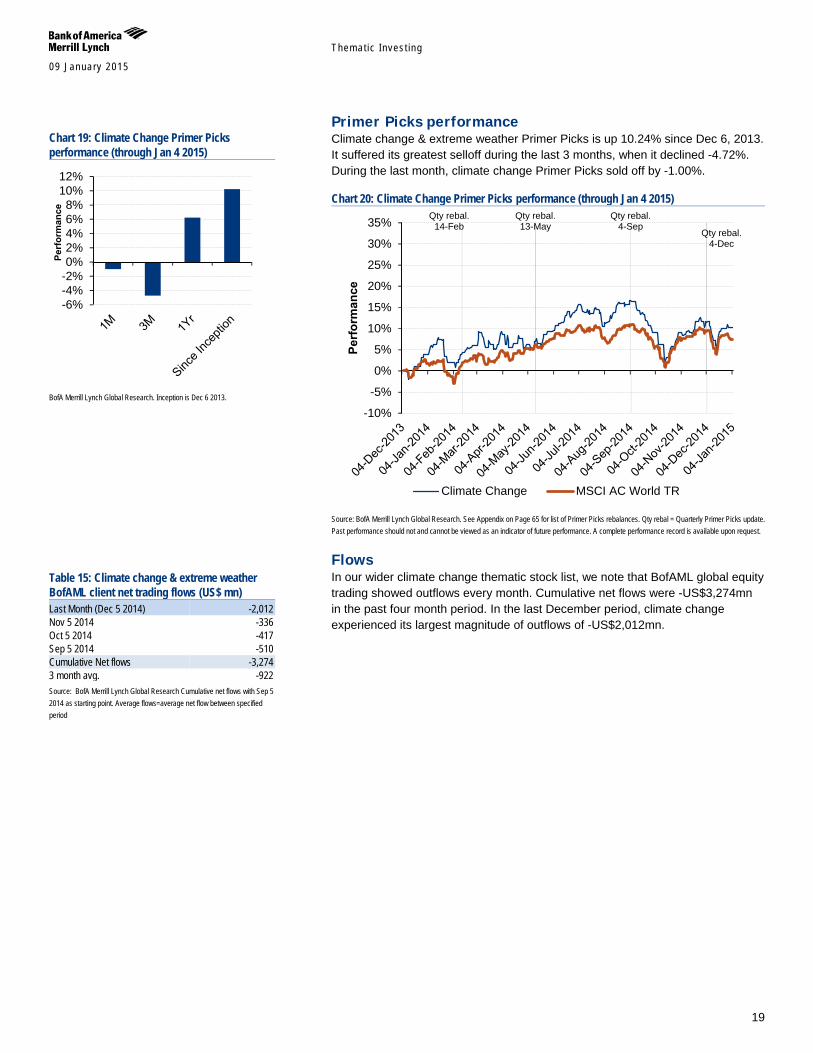
Primer Picks performance Climate change & extreme weather Primer Picks is up 10.24% since Dec 6, 2013. It suffered its greatest selloff during the last 3 months, when it declined -4.72%. During the last month, climate change Primer Picks sold off by -1.00%.
Chart 20: Climate Change Primer Picks performance (through Jan 4 2015)
Source: BofA Merrill Lynch Global Research. See Appendix on Page 65 for list of Primer Picks rebalances. Qty rebal = Quarterly Primer Picks update. Past performance should not and cannot be viewed as an indicator of future performance. A complete performance record is available upon request.
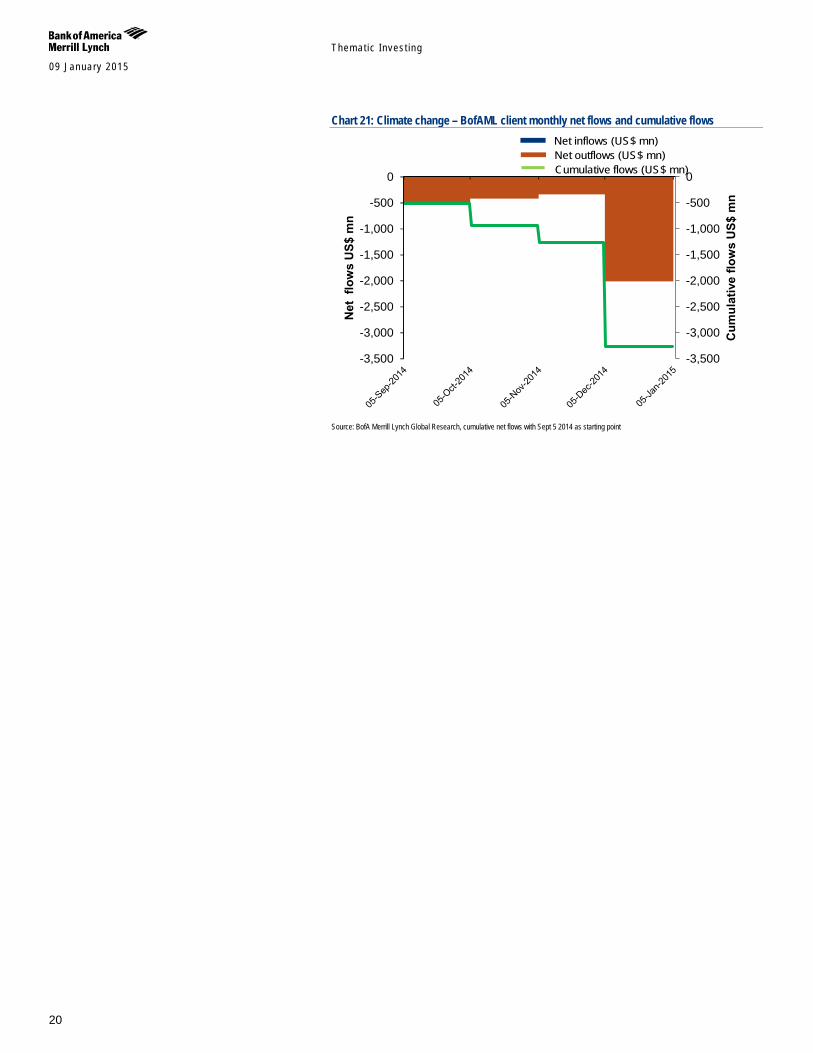
Flows In our wider climate change thematic stock list, we note that BofAML global equity trading showed outflows every month. Cumulative net flows were -US$3,274mn in the past four month period. In the last December period, climate change experienced its largest magnitude of outflows of -US$2,012mn.
Qty rebal. 14-Feb
Qty rebal. 13-May
Qty rebal. 4-Sep
Qty rebal. 4-Dec
-10%
-5%
0%
5%
10%
15%
20%
25%
30%
35%
Perf
orm
ance
Climate Change MSCI AC World TR
Chart 19: Climate Change Primer Picks performance (through Jan 4 2015)
BofA Merrill Lynch Global Research. Inception is Dec 6 2013.
Table 15: Climate change & extreme weather BofAML client net trading flows (US$ mn) Last Month (Dec 5 2014) -2,012 Nov 5 2014 -336 Oct 5 2014 -417 Sep 5 2014 -510 Cumulative Net flows -3,274 3 month avg. -922 Source: BofA Merrill Lynch Global Research Cumulative net flows with Sep 5 2014 as starting point. Average flows=average net flow between specified period
-6%-4%-2%0%2%4%6%8%
10%12%
Perf
orm
ance
Themat ic Inves t ing 09 January 2015
20
Chart 21: Climate change – BofAML client monthly net flows and cumulative flows
Source: BofA Merrill Lynch Global Research, cumulative net flows with Sept 5 2014 as starting point
-3,500
-3,000
-2,500
-2,000
-1,500
-1,000
-500
0
-3,500
-3,000
-2,500
-2,000
-1,500
-1,000
-500
0
Cum
ulat
ive
flow
s U
S$ m
n
Net
flo
ws
US$
mn
Net inflows (US$ mn)Net outflows (US$ mn)Cumulative flows (US$ mn)
09 January 2015
Them
atic Investing
21
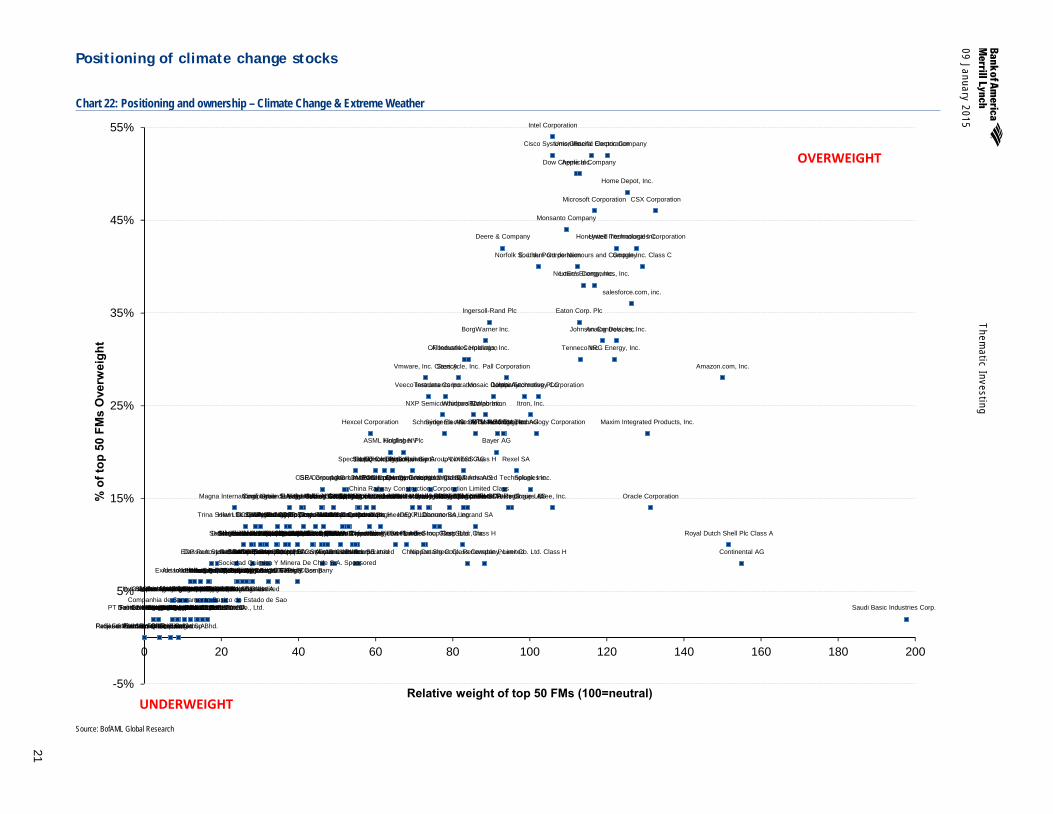
Positioning of climate change stocks
Chart 22: Positioning and ownership – Climate Change & Extreme Weather
Source: BofAML Global Research
ABB Ltd.
Acciona SA Adecoagro S.A.
Advantech Co., Ltd.
AECOM Technology Corporation
AGCO Corporation
Agrium Inc.
Aguas Andinas S.A. Series A
Inversiones Aguas Metropolitanas S.A.
Airtac International Group
Albemarle Corporation
Alfa Laval AB
Alstom SA
Amazon.com, Inc.
Analog Devices, Inc.
Apple Inc.
Aquarius Platinum Limited
ARM Holdings plc
ASML Holding NV
Atlas Copco AB Class A
Atmel Corporation BASF SE
Bayer AG
Beijing Enterprises Holdings Limited
Bombardier Inc. Class B
BorgWarner Inc.
Canadian National Railway Company
CF Industries Holdings, Inc.
China BlueChemical Ltd. Class H China Longyuan Power Group Corp. Ltd. Class H
Cisco Systems, Inc.
Continental AG
Companhia de Saneamento de Minas Gerais Cosan S.A. Industria e Comercio
Cosan Limited Class A
CPFL Energia S.A.
China Railway Construction Corporation Limited Class H Cree, Inc.
China Railway Group Limited Class H
Crompton Greaves Limited
CSR Corporation Limited Class H
CSX Corporation
Daikin Industries, Ltd.
Dana Holding Corporation
Danone SA
Dassault Systemes SA China Datang Corp. Renewable Power Co. Ltd. Class H
Deere & Company
Delphi Automotive PLC
Delta Electronics, Inc.
Doosan Heavy Industries & Construction Co., Ltd.
Dow Chemical Company
E. I. du Pont de Nemours and Company
Eaton Corp. Plc
Ecolab Inc.
EDP Renovaveis SA
Electrolux AB Class B
Enel Green Power S.p.A.
Enphase Energy, Inc.
Equinix, Inc.
Exide Industries Limited
Fauji Fertilizer Bin Qasim Limited
Fauji Fertilizer Co. Ltd.
First Solar, Inc.
FirstGroup plc
FleetMatics Group Ltd.
GCL-Poly Energy Holdings Limited
GEA Group AG Generac Holdings Inc.
General Electric Company
Go-Ahead Group plc
Golden Agri-Resources LTD
Google Inc. Class C
GT Advanced Technologies Inc.
Guangdong Investment Limited
Guangshen Railway Co. Ltd. Class H
Fertilizantes Heringer S.A.
Hexagon AB Class B
Hexcel Corporation
Hiwin Technologies Corp.
Hong Kong & China Gas Co. Ltd.
Home Retail Group plc
Honeywell International Inc.
Iberdrola SA
ICL-Israel Chemicals Ltd.
IDEXX Laboratories, Inc.
Infineon Technologies AG
Incitec Pivot Limited
Ingersoll-Rand Plc
Intel Corporation
Interxion Holding N.V.
Itron, Inc.
Johnson Controls, Inc.
Johnson Matthey Plc
K+S AG
Kemira Oyj
Keppel Corporation Limited
Kingfisher Plc
Kone Oyj Class B
Kuraray Co., Ltd.
Kurita Water Industries Ltd.
LANXESS AG
Legrand SA
LG Innotek Co., Ltd
LG Chem Ltd.
Linear Technology Corporation
LKQ Corporation
Lowe's Companies, Inc.
LS Industrial Systems Co., Ltd.
Magna International Inc.
Mahle-Metal Leve S.A.
Maxim Integrated Products, Inc.
Melrose Industries Plc
Metso Oyj
Compagnie Generale des Etablissements Michelin SCA
Microsoft Corporation
Mitsubishi Heavy Industries, Ltd.
Monsanto Company
Mosaic Company
MTU Aero Engines AG
Nabtesco Corporation
National Express Group PLC
Neste Oil Oyj
Nestle S.A.
Nexans SA
NextEra Energy, Inc.
NGK Insulators, Ltd.
Nippon Sheet Glass Company, Limited Nordex SE
Norfolk Southern Corporation
NRG Energy, Inc.
NXP Semiconductors NV
Obrascon Huarte Lain SA
OMRON Corporation
Oracle Corporation OSRAM Licht AG
Owens Corning
Pall Corporation
Panasonic Corporation
Pattern Energy Group, Inc. Class A
Petronas Chemicals Group Bhd.
Pennon Group Plc
Royal Philips NV
Phosagro OJSC Sponsored GDR RegS
Potash Corporation of Saskatchewan Inc.
Prysmian S.p.A.
Renesas Electronics Corporation
Rexel SA
Ritchie Bros. Auctioneers Incorporated
Rolls-Royce Holdings plc
Rotork plc
Royal Dutch Shell Plc Class A
Companhia de Saneamento Basico do Estado de Sao Paulo SABESP Saudi Basic Industries Corp.
Saudi Arabian Fertilizer Co.
Safran SA
Compagnie de Saint-Gobain SA
salesforce.com, inc.
PT Salim Ivomas Pratama Tbk
Samsung SDI Co., Ltd
Sanken Electric Co., Ltd.
SAP SE
Schneider Electric SE
Sensata Technologies Holding NV
Seoul Semiconductor Co., Ltd Severn Trent Plc
Shanghai Industrial Holdings Limited
Siemens AG
Siemens Limited
Sinofert Holdings Limited
SKF AB Class B
SMC Corporation
SolarCity Corp. Solvay SA
Spectris plc
Spirax-Sarco Engineering PLC
Splunk Inc.
Sociedad Quimica Y Minera De Chile S.A. Sponsored ADR Pfd Class B
STMicroelectronics NV
Stagecoach Group plc
Stericycle, Inc.
SUEZ Environnement Co. SA
Sumitomo Chemical Co., Ltd.
SunEdison, Inc.
SunPower Corporation
Syngenta AG
Tenneco Inc.
Teradata Corporation
Tesla Motors, Inc.
Home Depot, Inc.
Toray Industries, Inc.
Toshiba Corporation Trina Solar Ltd. Sponsored ADR Umicore
Union Pacific Corporation
United Technologies Corporation
United Utilities Group PLC Uralkali JSC Sponsored GDR RegS Vale S.A. Sponsored ADR Valeo SA
Vallourec SA
Veeco Instruments Inc.
Veolia Environnement SA
Vestas Wind Systems A/S
Victrex plc
Vivint Solar Inc
Vmware, Inc. Class A
Whirlpool Corporation
Yaskawa Electric Corporation
Yingli Green Energy Holding Co. Ltd. Sponsored ADR
Zhuzhou CSR Times Electric Co., Ltd. Class H
-5%
5%
15%
25%
35%
45%
55%
0 20 40 60 80 100 120 140 160 180 200
% o
f top
50
FMs
Ove
rwei
ght
Relative weight of top 50 FMs (100=neutral)
OVERWEIGHT
UNDERWEIGHT
Themat ic Inves t ing 09 January 2015
22
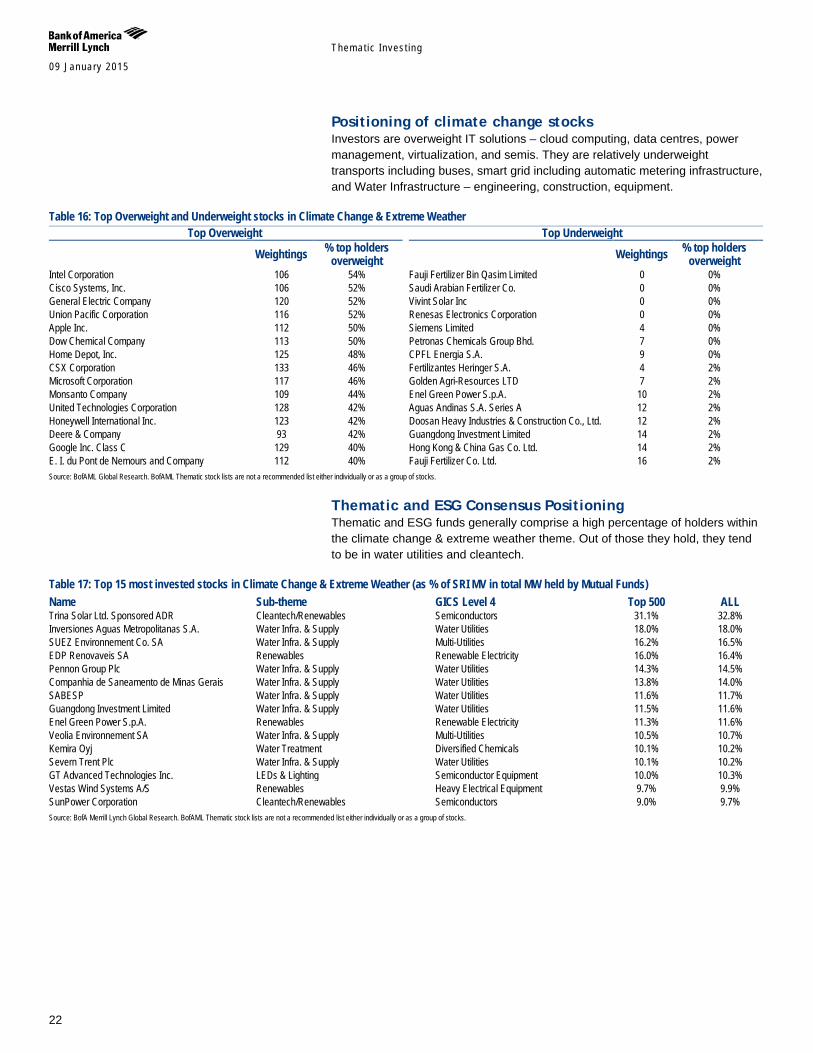
Positioning of climate change stocks Investors are overweight IT solutions – cloud computing, data centres, power management, virtualization, and semis. They are relatively underweight transports including buses, smart grid including automatic metering infrastructure, and Water Infrastructure – engineering, construction, equipment.
Table 16: Top Overweight and Underweight stocks in Climate Change & Extreme Weather Top Overweight Top Underweight
Weightings % top holders overweight Weightings % top holders
overweight Intel Corporation 106 54% Fauji Fertilizer Bin Qasim Limited 0 0% Cisco Systems, Inc. 106 52% Saudi Arabian Fertilizer Co. 0 0% General Electric Company 120 52% Vivint Solar Inc 0 0% Union Pacific Corporation 116 52% Renesas Electronics Corporation 0 0% Apple Inc. 112 50% Siemens Limited 4 0% Dow Chemical Company 113 50% Petronas Chemicals Group Bhd. 7 0% Home Depot, Inc. 125 48% CPFL Energia S.A. 9 0% CSX Corporation 133 46% Fertilizantes Heringer S.A. 4 2% Microsoft Corporation 117 46% Golden Agri-Resources LTD 7 2% Monsanto Company 109 44% Enel Green Power S.p.A. 10 2% United Technologies Corporation 128 42% Aguas Andinas S.A. Series A 12 2% Honeywell International Inc. 123 42% Doosan Heavy Industries & Construction Co., Ltd. 12 2% Deere & Company 93 42% Guangdong Investment Limited 14 2% Google Inc. Class C 129 40% Hong Kong & China Gas Co. Ltd. 14 2% E. I. du Pont de Nemours and Company 112 40% Fauji Fertilizer Co. Ltd. 16 2% Source: BofAML Global Research. BofAML Thematic stock lists are not a recommended list either individually or as a group of stocks.
Thematic and ESG Consensus Positioning Thematic and ESG funds generally comprise a high percentage of holders within the climate change & extreme weather theme. Out of those they hold, they tend to be in water utilities and cleantech.
Table 17: Top 15 most invested stocks in Climate Change & Extreme Weather (as % of SRI MV in total MW held by Mutual Funds) Name Sub-theme GICS Level 4 Top 500 ALL Trina Solar Ltd. Sponsored ADR Cleantech/Renewables Semiconductors 31.1% 32.8% Inversiones Aguas Metropolitanas S.A. Water Infra. & Supply Water Utilities 18.0% 18.0% SUEZ Environnement Co. SA Water Infra. & Supply Multi-Utilities 16.2% 16.5% EDP Renovaveis SA Renewables Renewable Electricity 16.0% 16.4% Pennon Group Plc Water Infra. & Supply Water Utilities 14.3% 14.5% Companhia de Saneamento de Minas Gerais Water Infra. & Supply Water Utilities 13.8% 14.0% SABESP Water Infra. & Supply Water Utilities 11.6% 11.7% Guangdong Investment Limited Water Infra. & Supply Water Utilities 11.5% 11.6% Enel Green Power S.p.A. Renewables Renewable Electricity 11.3% 11.6% Veolia Environnement SA Water Infra. & Supply Multi-Utilities 10.5% 10.7% Kemira Oyj Water Treatment Diversified Chemicals 10.1% 10.2% Severn Trent Plc Water Infra. & Supply Water Utilities 10.1% 10.2% GT Advanced Technologies Inc. LEDs & Lighting Semiconductor Equipment 10.0% 10.3% Vestas Wind Systems A/S Renewables Heavy Electrical Equipment 9.7% 9.9% SunPower Corporation Cleantech/Renewables Semiconductors 9.0% 9.7% Source: BofA Merrill Lynch Global Research. BofAML Thematic stock lists are not a recommended list either individually or as a group of stocks.
Themat ic Inves t ing 09 January 2015
23
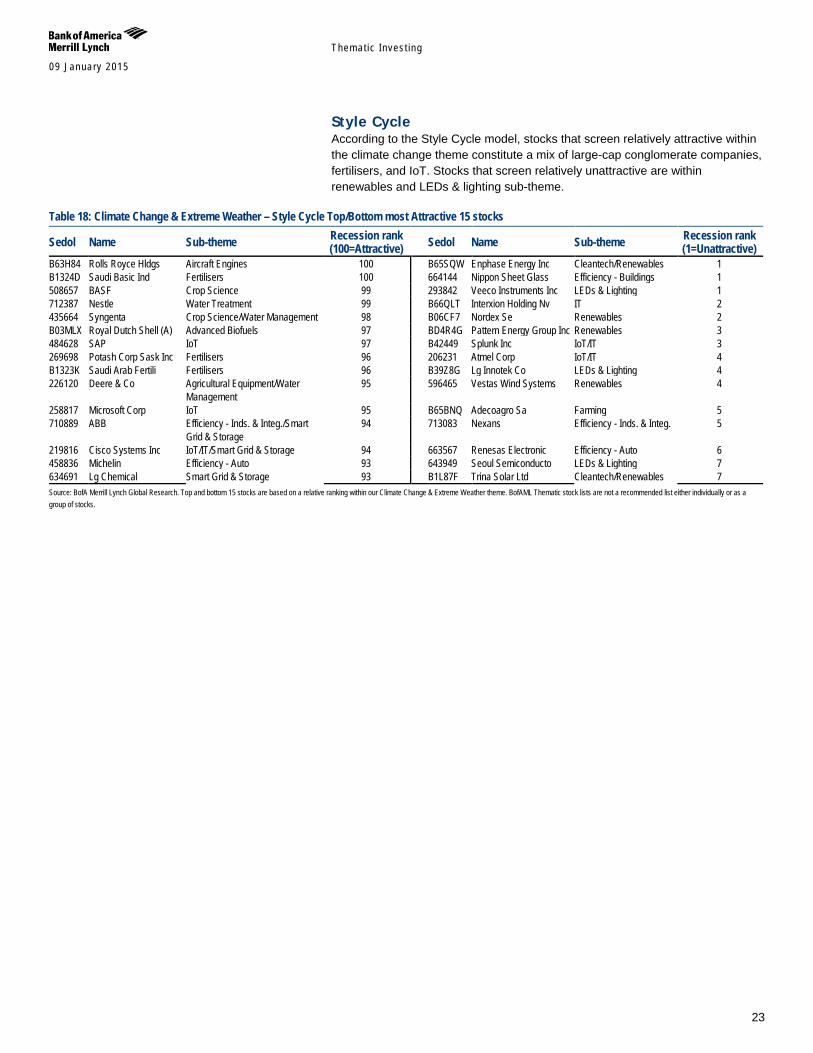
Style Cycle According to the Style Cycle model, stocks that screen relatively attractive within the climate change theme constitute a mix of large-cap conglomerate companies, fertilisers, and IoT. Stocks that screen relatively unattractive are within renewables and LEDs & lighting sub-theme.
Table 18: Climate Change & Extreme Weather – Style Cycle Top/Bottom most Attractive 15 stocks
Sedol Name Sub-theme Recession rank (100=Attractive) Sedol Name Sub-theme Recession rank
(1=Unattractive) B63H84 Rolls Royce Hldgs Aircraft Engines 100 B65SQW Enphase Energy Inc Cleantech/Renewables 1 B1324D Saudi Basic Ind Fertilisers 100 664144 Nippon Sheet Glass Efficiency - Buildings 1 508657 BASF Crop Science 99 293842 Veeco Instruments Inc LEDs & Lighting 1 712387 Nestle Water Treatment 99 B66QLT Interxion Holding Nv IT 2 435664 Syngenta Crop Science/Water Management 98 B06CF7 Nordex Se Renewables 2 B03MLX Royal Dutch Shell (A) Advanced Biofuels 97 BD4R4G Pattern Energy Group Inc Renewables 3 484628 SAP IoT 97 B42449 Splunk Inc IoT/IT 3 269698 Potash Corp Sask Inc Fertilisers 96 206231 Atmel Corp IoT/IT 4 B1323K Saudi Arab Fertili Fertilisers 96 B39Z8G Lg Innotek Co LEDs & Lighting 4 226120 Deere & Co Agricultural Equipment/Water
Management 95 596465 Vestas Wind Systems Renewables 4
258817 Microsoft Corp IoT 95 B65BNQ Adecoagro Sa Farming 5 710889 ABB Efficiency - Inds. & Integ./Smart
Grid & Storage 94 713083 Nexans Efficiency - Inds. & Integ. 5
219816 Cisco Systems Inc IoT/IT/Smart Grid & Storage 94 663567 Renesas Electronic Efficiency - Auto 6 458836 Michelin Efficiency - Auto 93 643949 Seoul Semiconducto LEDs & Lighting 7 634691 Lg Chemical Smart Grid & Storage 93 B1L87F Trina Solar Ltd Cleantech/Renewables 7 Source: BofA Merrill Lynch Global Research. Top and bottom 15 stocks are based on a relative ranking within our Climate Change & Extreme Weather theme. BofAML Thematic stock lists are not a recommended list either individually or as a group of stocks.

Themat ic Inves t ing 09 January 2015
24
Education - Stay in school One of the most pressing socio-economic challenges - We believe that education presents one of the most pressing socioeconomic challenges today, with 100m children never having attended school, tens of millions of dropouts, 800m illiterate adults, and major gaps in lifelong skills and training in both emerging and developed markets. We also believe that education for all (EFA) offers a once-in-a-generation investment opportunity to build healthy, prosperous and equitable societies, with every dollar invested in education generating US$10-15 in economic returns (source: UN).
US$4.5-5.1tn market today, US$5.9-7.8tn by 2017E - The global education sector is worth US$4.5-5.1tn today, encompassing K-12, post-secondary, corporate and government learning, e-learning, child care and language learning. Going forward, we see the fastest growth coming from e-learning and for-profit education, as well as from emerging markets’ increasing focus and spend (notably China and Brazil). By 2017E, global education is on target to become a US$5.9-7.8tn market (source: GSV Advisors, BofA Merrill Lynch estimates).
Strong growth drivers, EMs leading the way - Growth drivers include strong spending (c5% of global GDP), increasing enrolment rates (90% for primary completion, 71% for secondary enrolment), demographic opportunities (booming population of 5-17 year olds in EMs), more women in education, EMs upping their spend on education (disposable spending on education in China, India and Brazil is 10-13%), increasing global mobility, and a growing realisation of employment, earnings and economic development needs and opportunities (developed market graduates earn >US$1m more than high school dropouts over their lifetime).
Structural shifts, for-profit/private & EdTech - We believe the high cost of education is placing a burden on cash-strapped governments and households, which means increasing dependence on private spending (32% of funding for higher education in the OECD, 62% in the US), a growing role for for-profit education companies, and an increasing focus on affordability and results. Further, we think the integration of ICT and the shift to EdTech (from print to digital and from classroom to online learning) means e-learning is set to become a US$250bn+ market by 2017E, posing threats and opportunities for many incumbents.
Four major entry points for investors - We have mapped education across a number of sectors’ value chains to highlight the diverse range of entry points available to those wishing to invest in the theme: 1) K-12, 2) post-secondary, 3) content and 4) EdTech.
Thematic Investing: Global Education Primer - Stay in school 01 November 2013
Themat ic Inves t ing 09 January 2015
25
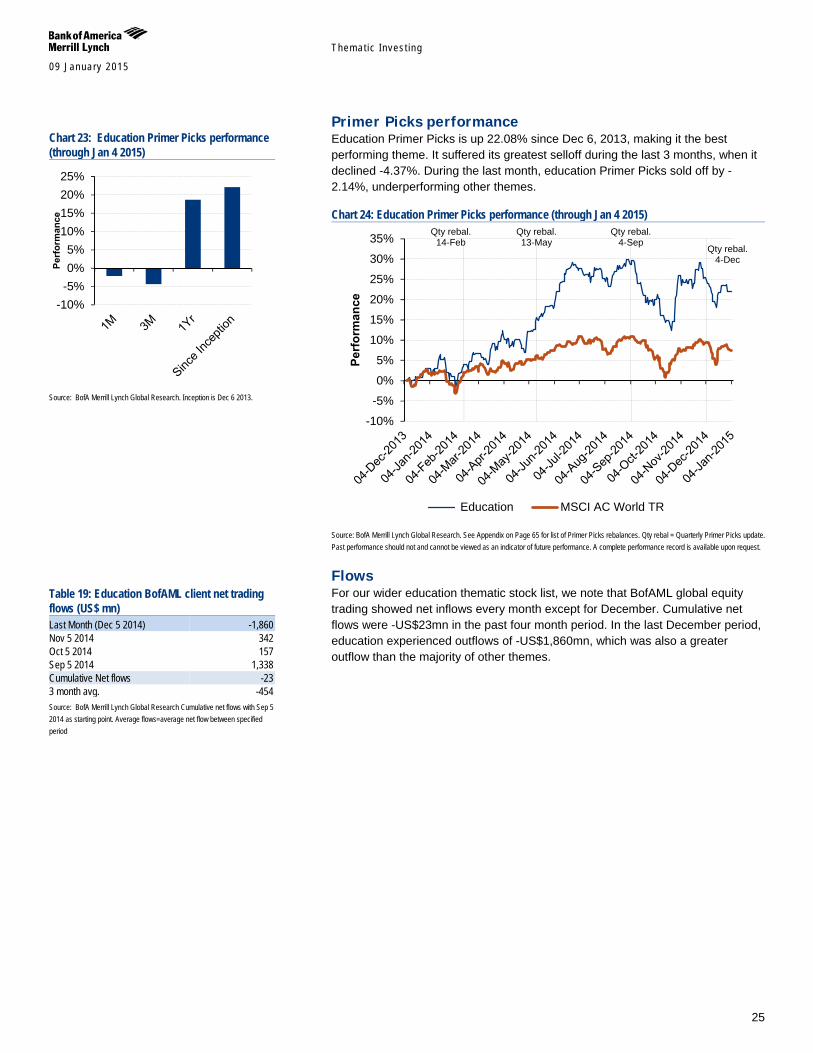
Primer Picks performance Education Primer Picks is up 22.08% since Dec 6, 2013, making it the best performing theme. It suffered its greatest selloff during the last 3 months, when it declined -4.37%. During the last month, education Primer Picks sold off by -2.14%, underperforming other themes.
Chart 24: Education Primer Picks performance (through Jan 4 2015)
Source: BofA Merrill Lynch Global Research. See Appendix on Page 65 for list of Primer Picks rebalances. Qty rebal = Quarterly Primer Picks update. Past performance should not and cannot be viewed as an indicator of future performance. A complete performance record is available upon request.
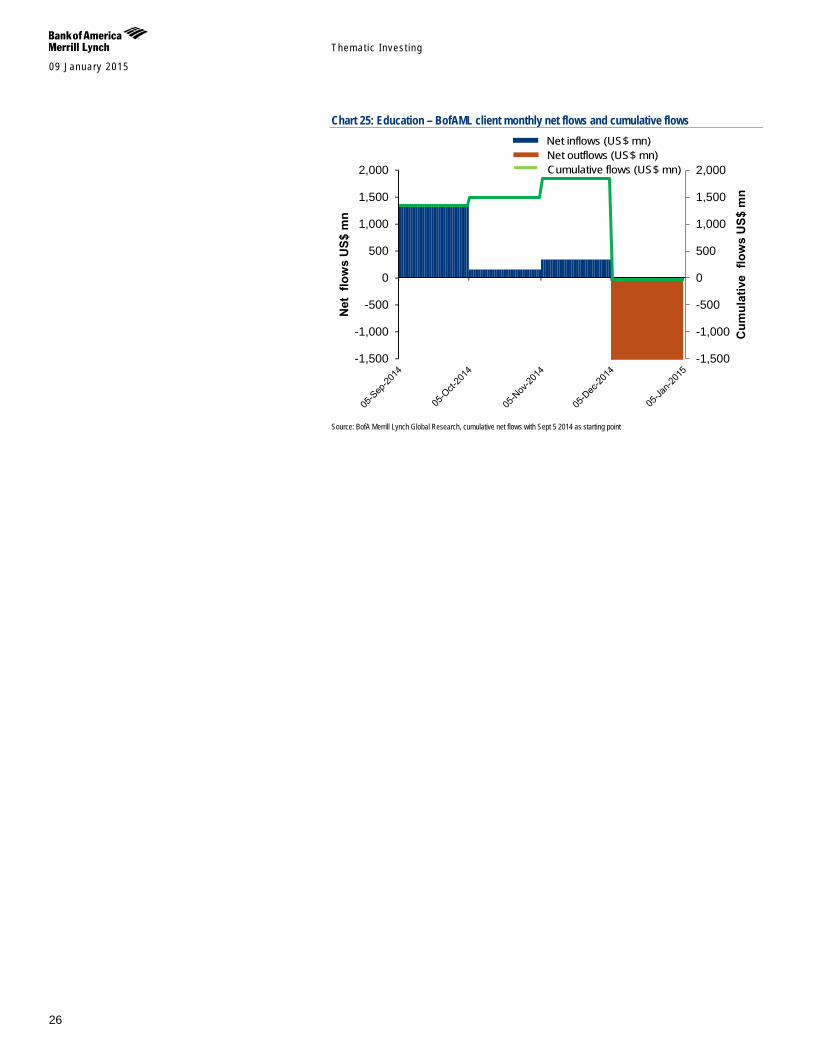
Flows For our wider education thematic stock list, we note that BofAML global equity trading showed net inflows every month except for December. Cumulative net flows were -US$23mn in the past four month period. In the last December period, education experienced outflows of -US$1,860mn, which was also a greater outflow than the majority of other themes.
Qty rebal. 14-Feb
Qty rebal. 13-May
Qty rebal. 4-Sep
Qty rebal. 4-Dec
-10%
-5%
0%
5%
10%
15%
20%
25%
30%
35%
Perf
orm
ance
Education MSCI AC World TR
Chart 23: Education Primer Picks performance (through Jan 4 2015)
Source: BofA Merrill Lynch Global Research. Inception is Dec 6 2013.
Table 19: Education BofAML client net trading flows (US$ mn) Last Month (Dec 5 2014) -1,860 Nov 5 2014 342 Oct 5 2014 157 Sep 5 2014 1,338 Cumulative Net flows -23 3 month avg. -454 Source: BofA Merrill Lynch Global Research Cumulative net flows with Sep 5 2014 as starting point. Average flows=average net flow between specified period
-10%-5%0%5%
10%15%20%25%
Perf
orm
ance
Themat ic Inves t ing 09 January 2015
26
Chart 25: Education – BofAML client monthly net flows and cumulative flows
Source: BofA Merrill Lynch Global Research, cumulative net flows with Sept 5 2014 as starting point
-1,500
-1,000
-500
0
500
1,000
1,500
2,000
-1,500
-1,000
-500
0
500
1,000
1,500
2,000
Cum
ulat
ive
flow
s U
S$ m
n
Net
flo
ws
US$
mn
Net inflows (US$ mn)Net outflows (US$ mn)Cumulative flows (US$ mn)
09 January 2015
Them
atic Investing
27
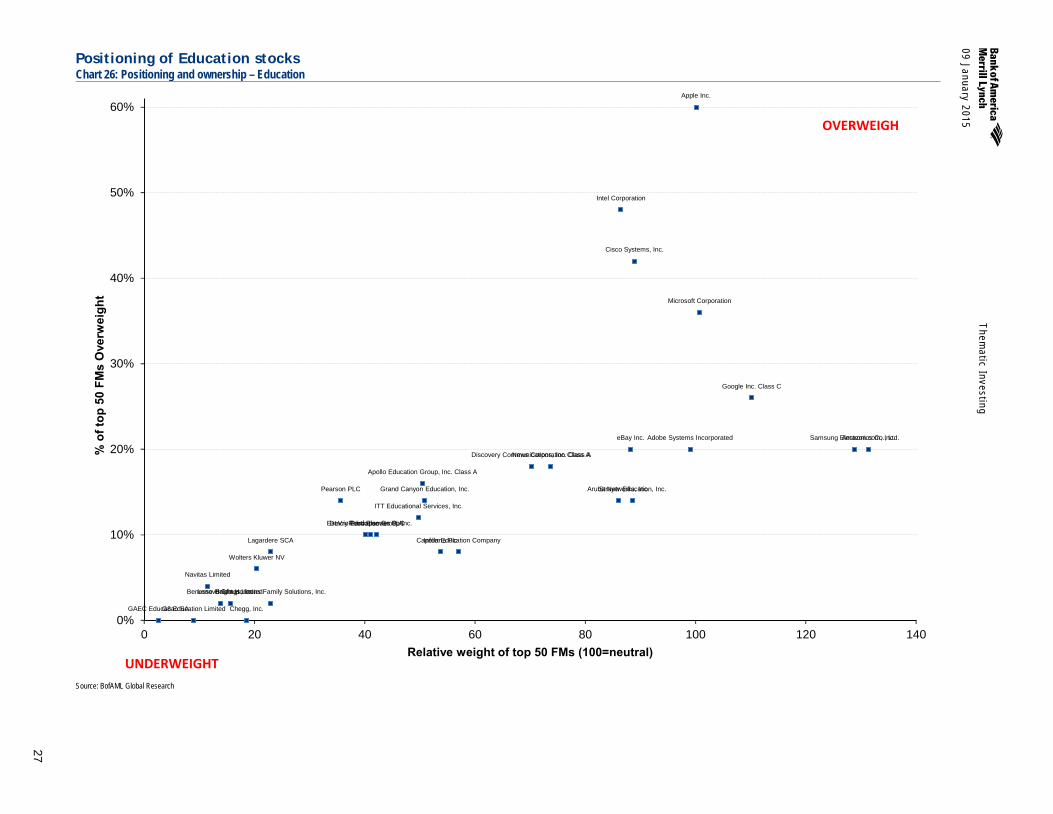
Positioning of Education stocks Chart 26: Positioning and ownership – Education
Source: BofAML Global Research
Adobe Systems Incorporated Amazon.com, Inc.
GAEC Educacao SA
Apollo Education Group, Inc. Class A
Apple Inc.
Aruba Networks, Inc.
Benesse Holdings, Inc. Bright Horizons Family Solutions, Inc.
Capella Education Company
Chegg, Inc.
Cisco Systems, Inc.
DeVry Education Group Inc.
Discovery Communications, Inc. Class A
eBay Inc.
Estacio Participacoes S.A.
G8 Education Limited
Google Inc. Class C
Grand Canyon Education, Inc.
Informa Plc
Intel Corporation
ITT Educational Services, Inc.
Lagardere SCA
Lenovo Group Limited
Microsoft Corporation
Navitas Limited
News Corporation Class A
Pearson PLC
Reed Elsevier PLC
Samsung Electronics Co., Ltd.
Strayer Education, Inc.
Wolters Kluwer NV
0%
10%
20%
30%
40%
50%
60%
0 20 40 60 80 100 120 140
% o
f top
50
FMs
Ove
rwei
ght
Relative weight of top 50 FMs (100=neutral)
OVERWEIGH
UNDERWEIGHT
Themat ic Inves t ing 09 January 2015
28
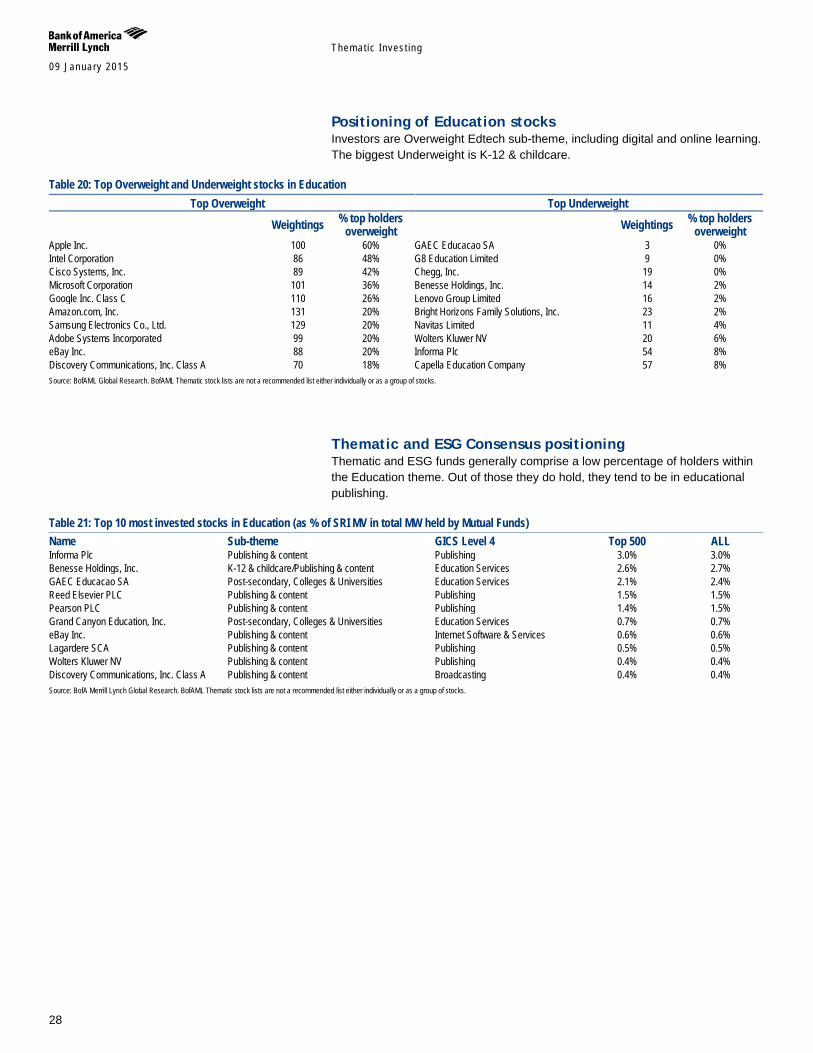
Positioning of Education stocks Investors are Overweight Edtech sub-theme, including digital and online learning. The biggest Underweight is K-12 & childcare.
Table 20: Top Overweight and Underweight stocks in Education Top Overweight Top Underweight
Weightings % top holders overweight Weightings % top holders
overweight Apple Inc. 100 60% GAEC Educacao SA 3 0% Intel Corporation 86 48% G8 Education Limited 9 0% Cisco Systems, Inc. 89 42% Chegg, Inc. 19 0% Microsoft Corporation 101 36% Benesse Holdings, Inc. 14 2% Google Inc. Class C 110 26% Lenovo Group Limited 16 2% Amazon.com, Inc. 131 20% Bright Horizons Family Solutions, Inc. 23 2% Samsung Electronics Co., Ltd. 129 20% Navitas Limited 11 4% Adobe Systems Incorporated 99 20% Wolters Kluwer NV 20 6% eBay Inc. 88 20% Informa Plc 54 8% Discovery Communications, Inc. Class A 70 18% Capella Education Company 57 8% Source: BofAML Global Research. BofAML Thematic stock lists are not a recommended list either individually or as a group of stocks.
Thematic and ESG Consensus positioning Thematic and ESG funds generally comprise a low percentage of holders within the Education theme. Out of those they do hold, they tend to be in educational publishing.
Table 21: Top 10 most invested stocks in Education (as % of SRI MV in total MW held by Mutual Funds) Name Sub-theme GICS Level 4 Top 500 ALL Informa Plc Publishing & content Publishing 3.0% 3.0% Benesse Holdings, Inc. K-12 & childcare/Publishing & content Education Services 2.6% 2.7% GAEC Educacao SA Post-secondary, Colleges & Universities Education Services 2.1% 2.4% Reed Elsevier PLC Publishing & content Publishing 1.5% 1.5% Pearson PLC Publishing & content Publishing 1.4% 1.5% Grand Canyon Education, Inc. Post-secondary, Colleges & Universities Education Services 0.7% 0.7% eBay Inc. Publishing & content Internet Software & Services 0.6% 0.6% Lagardere SCA Publishing & content Publishing 0.5% 0.5% Wolters Kluwer NV Publishing & content Publishing 0.4% 0.4% Discovery Communications, Inc. Class A Publishing & content Broadcasting 0.4% 0.4% Source: BofA Merrill Lynch Global Research. BofAML Thematic stock lists are not a recommended list either individually or as a group of stocks.

Themat ic Inves t ing 09 January 2015
29
Style Cycle According to the Style Cycle model, stocks that screen relatively attractive within the education theme are in large-cap Edtech and major publishing & content. Stocks that screen relatively unattractive are within sub-themes relating to post-secondary, colleges, & universities as well as K-12 & childcare.
Table 22: Education - Style Cycle Top/Bottom most Attractive 10 stocks
Sedol Name Sub-theme Recession rank (100=Attractive) Sedol Name Sub-theme Recession rank
(1=Unattractive) 677172 Samsung Electronic EdTech 100 BG6N6K Chegg Inc EdTech 1 067760 Pearson Publishing & content 96 B1VRPM Aruba Networks Inc EdTech 4 204369 Apollo Education Group Inc Post-secondary,
Colleges & Universities 89 B29631 G8 Education Ltd K-12 & childcare 7
219816 Cisco Systems Inc EdTech 89 200001 Amazon.Com Inc EdTech 11 204625 Apple Inc EdTech 86 200815 Adobe Systems Inc EdTech 14 258817 Microsoft Corp EdTech 82 B7MJWP Bright Horizons Family Soltn K-12 & childcare 18 BMJ6DW Informa Plc (Gb) Publishing & content 79 BBGVT4 News Corp Publishing & content 21 567151 Wolters Kluwer Publishing & content 75 285341 Strayer Education Inc Post-secondary,
Colleges & Universities 25
B2B0DG Reed Elsevier Publishing & content 71 B0GWDP Capella Education Co Post-secondary, Colleges & Universities
29
246324 Intel Corp EdTech 64 BFMXX8 Gaec Educacao S.A Post-secondary, Colleges & Universities
32
Source: BofA Merrill Lynch Global Research. Top and bottom 10 stocks are based on a relative ranking within our Education theme.. BofAML Thematic stock lists are not a recommended list either individually or as a group of stocks.
Themat ic Inves t ing 09 January 2015
30
Energy efficiency – Efficient frontier A Transforming World thematic impacts: Earth, Government, Innovation Global energy crisis: the current path is unsustainable - Primary energy demand accounts for more than 7% of global GDP, and with demand set to grow by up to 40% by 2035E, the world needs US$48-53tn in energy investments over the period (source: IEA). Today’s share of fossil fuels in the global energy mix is the same as it was 25Y ago, leaving much of the world dependent on energy imports and associated geopolitical risks. The current energy path is also putting us on a CO2 emissions trajectory consistent with long-term global temperature increases of 2.0°C -4.5°C, making irreversible climate change a reality.
Doing more with less: from hidden fuel to world’s #1 fuel - An energy-secure future for all will require a balanced energy mix, encompassing clean coal, gas, nuclear and renewables – as well as energy efficiency. Historical energy savings from efficiency have exceeded the output from any other single fuel source, and efficiency could halve the energy needed to power the world by 2035E (source: IEA). We believe that efficiency is the cheapest and easiest way to reduce energy demand and CO2 emissions, and that the combination of increasingly effective policies and high energy prices means that it will transition from hiding in plain sight to become the world’s “first fuel.”
Invest for the future: up to US$14tn in investments (2035E) - Global investments in energy efficiency have ranged from US$130bn-300bn/pa in recent years. By 2035E, we are anticipating US$8-14tn in investments – or US$550bn+ in annual spending – both to meet growth in demand and make the transition to a lower-carbon economy (source: IEA). We believe that there is significant “low hanging fruit” potential given that 80% of energy is lost along the value chain, every dollar spent means US$2-4 in lifetime cost savings, and two-thirds of the economic potential to improve energy efficiency remains untapped (source: ABB, IEA). Investing in efficiency will also reduce mid- to long-term exposure to the risk of stranded assets vis-à-vis fossil fuels.
Eight major entry points for investors - We have mapped energy efficiency exposure across a number of sectors’ value chains to highlight & diverse range of entry points for investors wishing to play the energy efficiency theme: (1) Autos; (2) Buildings; (3) Industrials; (4) Internet of Things (IoT); (5) ICT (incl. cloud, data centres, semis); (6) Lighting & LEDs; (7) Smart Grid & Energy Storage; and (8) Transport (incl. bus, plane, rail, shipping).
Thematic Investing: The Efficient Frontier - Energy Efficiency Primer 04 September 2014
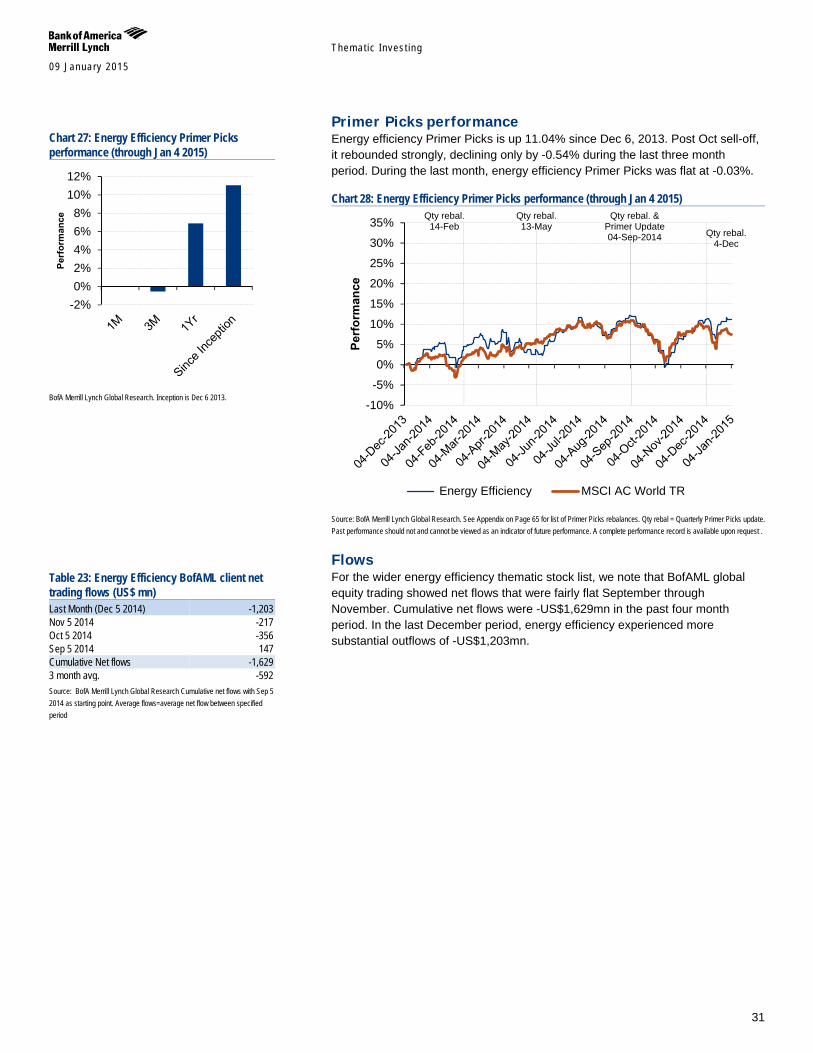
Themat ic Inves t ing 09 January 2015
31
Primer Picks performance Energy efficiency Primer Picks is up 11.04% since Dec 6, 2013. Post Oct sell-off, it rebounded strongly, declining only by -0.54% during the last three month period. During the last month, energy efficiency Primer Picks was flat at -0.03%.
Chart 28: Energy Efficiency Primer Picks performance (through Jan 4 2015)
Source: BofA Merrill Lynch Global Research. See Appendix on Page 65 for list of Primer Picks rebalances. Qty rebal = Quarterly Primer Picks update. Past performance should not and cannot be viewed as an indicator of future performance. A complete performance record is available upon request .
Flows For the wider energy efficiency thematic stock list, we note that BofAML global equity trading showed net flows that were fairly flat September through November. Cumulative net flows were -US$1,629mn in the past four month period. In the last December period, energy efficiency experienced more substantial outflows of -US$1,203mn.
Qty rebal. 14-Feb
Qty rebal. 13-May
Qty rebal. & Primer Update 04-Sep-2014 Qty rebal.
4-Dec
-10%
-5%
0%
5%
10%
15%
20%
25%
30%
35%
Perf
orm
ance
Energy Efficiency MSCI AC World TR
Chart 27: Energy Efficiency Primer Picks performance (through Jan 4 2015)
BofA Merrill Lynch Global Research. Inception is Dec 6 2013.
Table 23: Energy Efficiency BofAML client net trading flows (US$ mn) Last Month (Dec 5 2014) -1,203 Nov 5 2014 -217 Oct 5 2014 -356 Sep 5 2014 147 Cumulative Net flows -1,629 3 month avg. -592 Source: BofA Merrill Lynch Global Research Cumulative net flows with Sep 5 2014 as starting point. Average flows=average net flow between specified period
-2%0%2%4%6%8%
10%12%
Perf
orm
ance
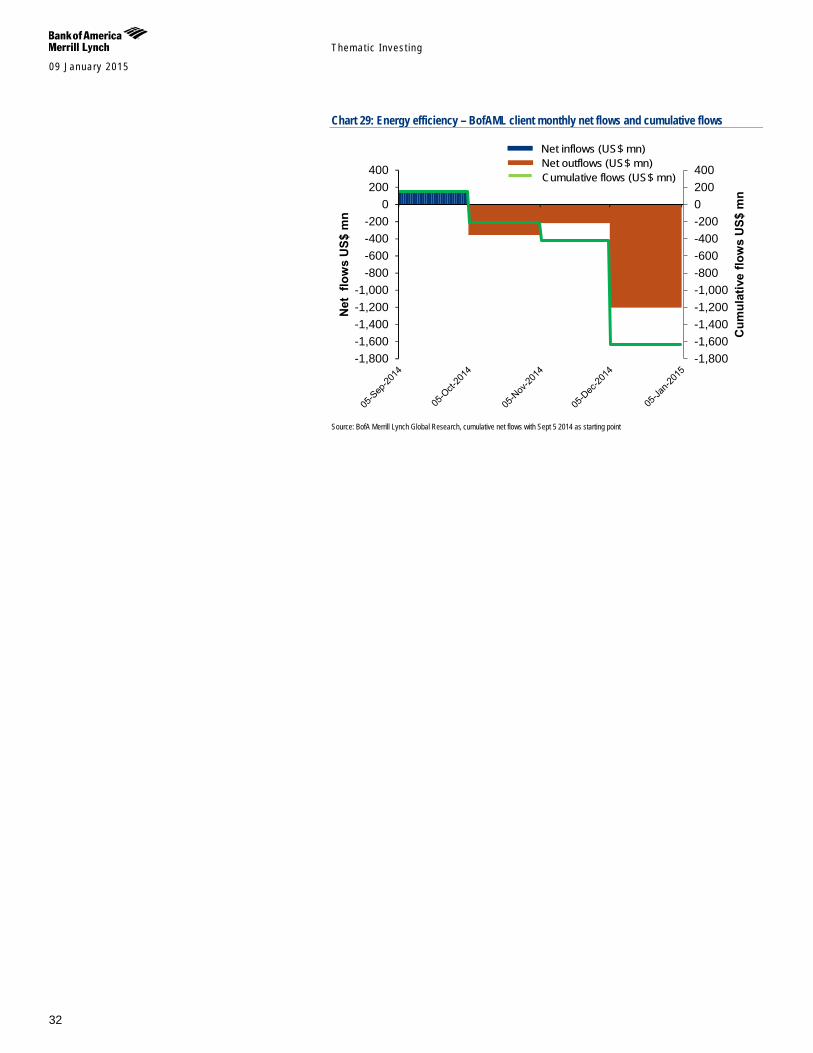
Themat ic Inves t ing 09 January 2015
32
Chart 29: Energy efficiency – BofAML client monthly net flows and cumulative flows
Source: BofA Merrill Lynch Global Research, cumulative net flows with Sept 5 2014 as starting point
-1,800-1,600-1,400-1,200-1,000-800-600-400-2000200400
-1,800-1,600-1,400-1,200-1,000
-800-600-400-200
0200400
Cum
ulat
ive
flow
s U
S$ m
n
Net
flo
ws
US$
mn
Net inflows (US$ mn)Net outflows (US$ mn)Cumulative flows (US$ mn)
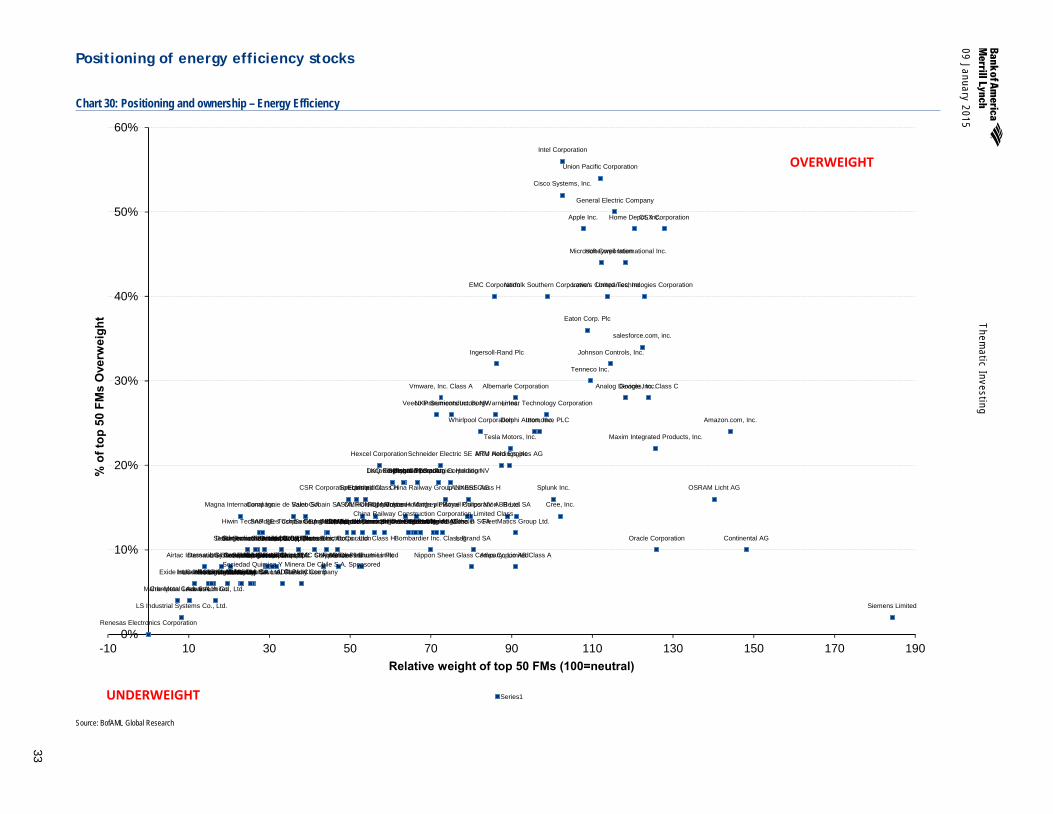
09 January 2015
Them
atic Investing
33
Positioning of energy efficiency stocks
Chart 30: Positioning and ownership – Energy Efficiency
Source: BofAML Global Research
ABB Ltd.
Advantech Co., Ltd.
Airtac International Group
Albemarle Corporation
Alfa Laval AB Alstom SA
Amazon.com, Inc.
Analog Devices, Inc.
Apple Inc.
Aquarius Platinum Limited
ARM Holdings plc
ASML Holding NV
Atlas Copco AB Class A
Atmel Corporation
Bombardier Inc. Class B
BorgWarner Inc.
Canadian National Railway Company
Cisco Systems, Inc.
Continental AG
China Railway Construction Corporation Limited Class H
Cree, Inc.
China Railway Group Limited Class H
Crompton Greaves Limited
CSR Corporation Limited Class H
CSX Corporation
Daikin Industries, Ltd.
Dana Holding Corporation
Dassault Systemes SA
Delphi Automotive PLC
Delta Electronics, Inc.
Eaton Corp. Plc
Electrolux AB Class B
EMC Corporation
Equinix, Inc.
Exide Industries Limited
FirstGroup plc
FleetMatics Group Ltd. GEA Group AG Generac Holdings Inc.
General Electric Company
Go-Ahead Group plc
Google Inc. Class C
Guangshen Railway Co. Ltd. Class H
Hexagon AB Class B
Hexcel Corporation
Hiwin Technologies Corp.
Home Retail Group plc
Honeywell International Inc.
Infineon Technologies AG
Ingersoll-Rand Plc
Intel Corporation
Interxion Holding N.V.
Itron, Inc.
Johnson Controls, Inc.
Johnson Matthey Plc
Kingfisher Plc
Kone Oyj Class B
LANXESS AG
Legrand SA
LG Innotek Co., Ltd
LG Chem Ltd.
Linear Technology Corporation
LKQ Corporation
Lowe's Companies, Inc.
LS Industrial Systems Co., Ltd.
Magna International Inc.
Mahle-Metal Leve S.A.
Maxim Integrated Products, Inc.
Melrose Industries Plc
Metso Oyj
Compagnie Generale des Etablissements Michelin SCA
Microsoft Corporation
MTU Aero Engines AG
Nabtesco Corporation
National Express Group PLC
Nexans SA NGK Insulators, Ltd.
Nippon Sheet Glass Company, Limited
Norfolk Southern Corporation
NXP Semiconductors NV
OMRON Corporation
Oracle Corporation
OSRAM Licht AG
Owens Corning
Panasonic Corporation
Royal Philips NV
Prysmian S.p.A.
Renesas Electronics Corporation
Rexel SA Rolls-Royce Holdings plc
Safran SA
Compagnie de Saint-Gobain SA
salesforce.com, inc.
Samsung SDI Co., Ltd
Sanken Electric Co., Ltd.
SAP SE
Schneider Electric SE
Sensata Technologies Holding NV
Seoul Semiconductor Co., Ltd
Siemens AG
Siemens Limited
SKF AB Class B SMC Corporation
Solvay SA
Spectris plc
Spirax-Sarco Engineering PLC
Splunk Inc.
Sociedad Quimica Y Minera De Chile S.A. Sponsored ADR Pfd Class B
STMicroelectronics NV
Stagecoach Group plc Sumitomo Chemical Co., Ltd.
Tenneco Inc.
Teradata Corporation
Tesla Motors, Inc.
Home Depot, Inc.
Toray Industries, Inc.
Toshiba Corporation Umicore
Union Pacific Corporation
United Technologies Corporation
Valeo SA
Veeco Instruments Inc.
Victrex plc
Vmware, Inc. Class A
Whirlpool Corporation
Zhuzhou CSR Times Electric Co., Ltd. Class H
0%
10%
20%
30%
40%
50%
60%
-10 10 30 50 70 90 110 130 150 170 190
% o
f top
50
FMs
Ove
rwei
ght
Relative weight of top 50 FMs (100=neutral)
Series1
OVERWEIGHT
UNDERWEIGHT
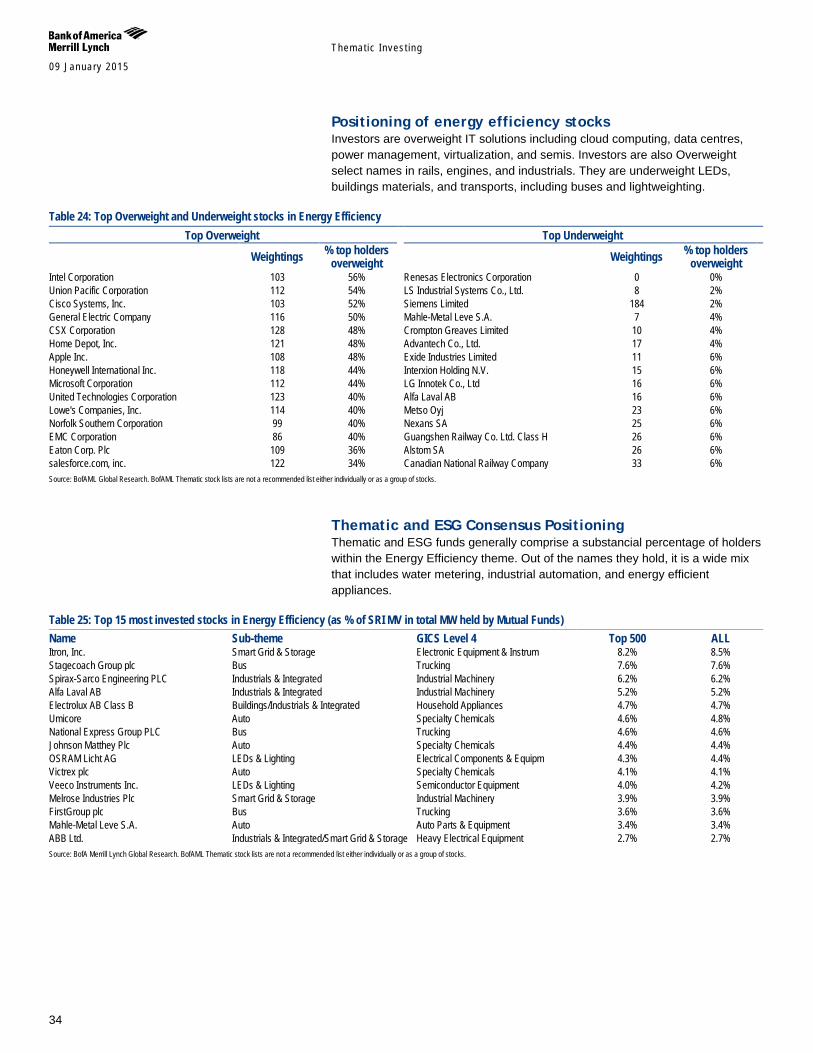
Themat ic Inves t ing 09 January 2015
34
Positioning of energy efficiency stocks Investors are overweight IT solutions including cloud computing, data centres, power management, virtualization, and semis. Investors are also Overweight select names in rails, engines, and industrials. They are underweight LEDs, buildings materials, and transports, including buses and lightweighting.
Table 24: Top Overweight and Underweight stocks in Energy Efficiency Top Overweight Top Underweight
Weightings % top holders overweight Weightings % top holders
overweight Intel Corporation 103 56% Renesas Electronics Corporation 0 0% Union Pacific Corporation 112 54% LS Industrial Systems Co., Ltd. 8 2% Cisco Systems, Inc. 103 52% Siemens Limited 184 2% General Electric Company 116 50% Mahle-Metal Leve S.A. 7 4% CSX Corporation 128 48% Crompton Greaves Limited 10 4% Home Depot, Inc. 121 48% Advantech Co., Ltd. 17 4% Apple Inc. 108 48% Exide Industries Limited 11 6% Honeywell International Inc. 118 44% Interxion Holding N.V. 15 6% Microsoft Corporation 112 44% LG Innotek Co., Ltd 16 6% United Technologies Corporation 123 40% Alfa Laval AB 16 6% Lowe's Companies, Inc. 114 40% Metso Oyj 23 6% Norfolk Southern Corporation 99 40% Nexans SA 25 6% EMC Corporation 86 40% Guangshen Railway Co. Ltd. Class H 26 6% Eaton Corp. Plc 109 36% Alstom SA 26 6% salesforce.com, inc. 122 34% Canadian National Railway Company 33 6% Source: BofAML Global Research. BofAML Thematic stock lists are not a recommended list either individually or as a group of stocks.
Thematic and ESG Consensus Positioning Thematic and ESG funds generally comprise a substancial percentage of holders within the Energy Efficiency theme. Out of the names they hold, it is a wide mix that includes water metering, industrial automation, and energy efficient appliances.
Table 25: Top 15 most invested stocks in Energy Efficiency (as % of SRI MV in total MW held by Mutual Funds) Name Sub-theme GICS Level 4 Top 500 ALL Itron, Inc. Smart Grid & Storage Electronic Equipment & Instrum 8.2% 8.5% Stagecoach Group plc Bus Trucking 7.6% 7.6% Spirax-Sarco Engineering PLC Industrials & Integrated Industrial Machinery 6.2% 6.2% Alfa Laval AB Industrials & Integrated Industrial Machinery 5.2% 5.2% Electrolux AB Class B Buildings/Industrials & Integrated Household Appliances 4.7% 4.7% Umicore Auto Specialty Chemicals 4.6% 4.8% National Express Group PLC Bus Trucking 4.6% 4.6% Johnson Matthey Plc Auto Specialty Chemicals 4.4% 4.4% OSRAM Licht AG LEDs & Lighting Electrical Components & Equipm 4.3% 4.4% Victrex plc Auto Specialty Chemicals 4.1% 4.1% Veeco Instruments Inc. LEDs & Lighting Semiconductor Equipment 4.0% 4.2% Melrose Industries Plc Smart Grid & Storage Industrial Machinery 3.9% 3.9% FirstGroup plc Bus Trucking 3.6% 3.6% Mahle-Metal Leve S.A. Auto Auto Parts & Equipment 3.4% 3.4% ABB Ltd. Industrials & Integrated/Smart Grid & Storage Heavy Electrical Equipment 2.7% 2.7% Source: BofA Merrill Lynch Global Research. BofAML Thematic stock lists are not a recommended list either individually or as a group of stocks.

Themat ic Inves t ing 09 January 2015
35
Style Cycle According to the Style Cycle model, stocks that screen relatively attractive within the energy efficiency theme are large-cap tech companies involved in IoT, autos, as well as conglomerates. Stocks that screen relatively unattractive are within sub-themes relating to LEDs & lighting and industrials.
Table 26: Energy Efficiency - Style Cycle Top/Bottom most Attractive 15 stocks
Sedol Name Sub-theme Recession rank (100=Attractive) Sedol Name Sub-theme Recession rank
(1=Unattractive) B63H84 Rolls Royce Hldgs Aircraft Engines 100 B66QLT Interxion Holding Nv IT 1 258817 Microsoft Corp IoT 99 293842 Veeco Instruments Inc LEDs & Lighting 1 484628 SAP IoT 98 664144 Nippon Sheet Glass Buildings 2 219816 Cisco Systems Inc IoT/IT/Smart Grid & Storage 97 206231 Atmel Corp IoT/IT 3 710889 ABB Industrials & Integrated/Smart Grid
& Storage 96 B42449 Splunk Inc IoT/IT 4
204625 Apple Inc IT 96 B39Z8G Lg Innotek Co LEDs & Lighting 5 266156 Oracle Corp IoT 93 663567 Renesas Electronic Auto 5 B247H1 Teradata Corp IT 93 713083 Nexans Industrials & Integrated 6 291550 United Technologies Corp Buildings 93 643949 Seoul Semiconducto LEDs & Lighting 7 458836 Michelin Auto 92 B15T56 Siemens India Ltd Industrials & Integrated 7 B783TY Delphi Automotive Plc Auto 92 220475 Equinix Inc IT 9 634691 Lg Chemical Smart Grid & Storage 90 B1YMYT Hiwin Tech Corp Industrials & Integrated 9 255447 Magna International Inc Auto 90 B1B90H Crompton Greaves Industrials & Integrated 11 246324 Intel Corp IoT/IT 88 247194 Itron Inc Smart Grid & Storage 12 331952 Kingfisher Buildings 88 B616C7 Tesla Motors Inc Auto/Smart Grid &
Storage 12
Source: BofA Merrill Lynch Global Research. Top and bottom 15 stocks are based on a relative ranking within our Energy Efficiency theme. BofAML Thematic stock lists are not a recommended list either individually or as a group of stocks.
Themat ic Inves t ing 09 January 2015
36
Demographics - Longevity revolution A Transforming World thematic impacts: People, Government, Markets Global ageing: the greatest transformation of our time - Ageing populations are becoming a virtually universal phenomenon, and the number of older persons (60+) is expected to more than double from 841mn in 2013 to 2bn+ by 2050 (Source: UN). People aged 65+ will outnumber children under 5 for the first time in human history in 2047 (Source: UN), and falling birth rates mean that some countries are heading towards a potentially catastrophic decline in population. We believe that all aspects of society and the economy need to be viewed through the lens of this demographic transformation.
Longevity risk: hugely underestimated - Longevity risk will be one of the most significant challenges facing retirement systems over the next 50Y, with global annuity and pension-related exposure estimated to be as high as US$15-25tn. Many countries could be facing additional costs of up to 50% of 2010 GDP by 2050E (Source: IMF).
Look for the silver lining: US$15tn+ opportunity (2020E) - The longevity economy is becoming an increasingly powerful force, and the spending power of 60+ consumers is expected to reach US$15tn by 2020E (Source: Euromonitor). The US longevity sector alone is currently estimated at US$7.1tn, making it the world’s #3 economy. This section of the economy is expected to account for over 50% of US and Japanese GDP by the 2030s (Source: Oxford Economics, NLIRI). However, there are pressing challenges concerning wealth inequality, those on low incomes, women and the EM elderly.
Cradle to grave: three main entry points for investors - We have mapped efforts to tackle the global dynamics of longevity to highlight three entry points for investors wishing to play the ”silver dollar” theme: 1) Pharma & Healthcare (incl. tackling age-related diseases and conditions such as cancer, cardiovascular disease, Alzheimer’s, diabetes, osteoporosis, as well as medical devices, hearing aids, dental and vision care, and incontinence); 2) Financials (incl. insurance, asset & wealth management); and 3) Consumer (incl. senior living, care, managed care, healthcare REITs, aging in place, death care, pharmacies & drug stores, anti-ageing, travel & leisure, retail, VMS, and technology).
Thematic Investing: The Silver Dollar – longevity revolution primer 06 June 2014
BofAML Thematic stock lists are not a recommended list either individually or as a group of stocks
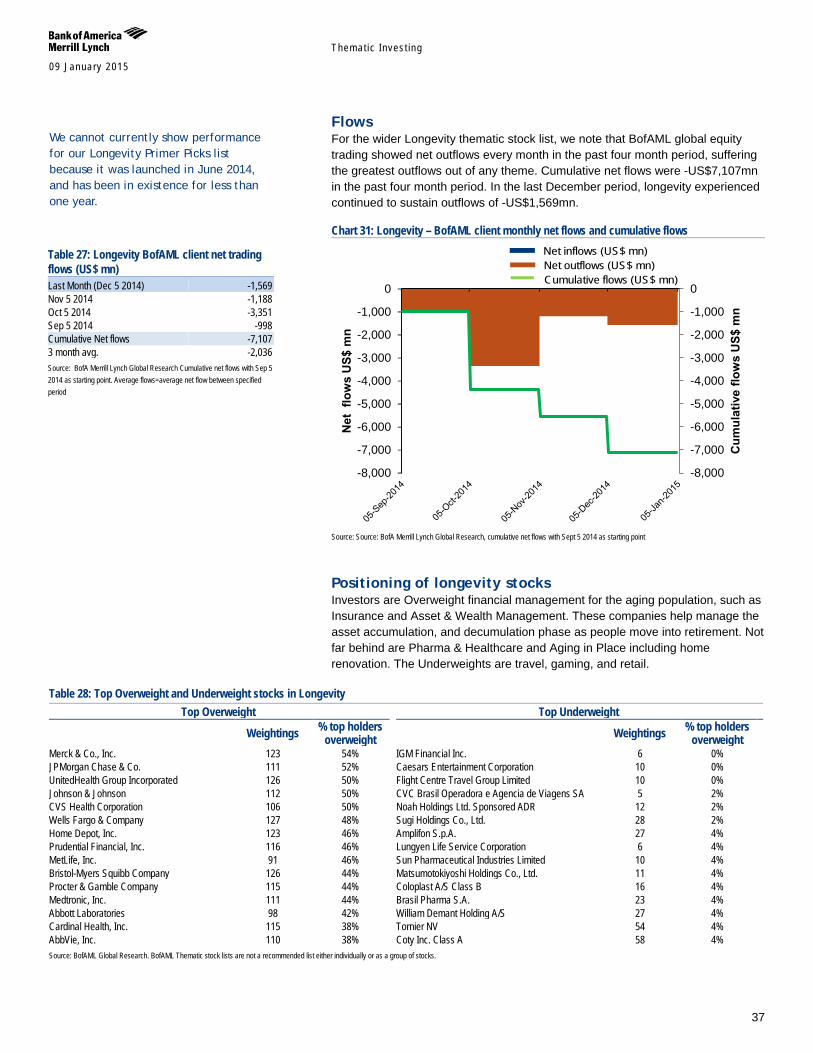
Themat ic Inves t ing 09 January 2015
37
Flows For the wider Longevity thematic stock list, we note that BofAML global equity trading showed net outflows every month in the past four month period, suffering the greatest outflows out of any theme. Cumulative net flows were -US$7,107mn in the past four month period. In the last December period, longevity experienced continued to sustain outflows of -US$1,569mn.
Chart 31: Longevity – BofAML client monthly net flows and cumulative flows
Source: Source: BofA Merrill Lynch Global Research, cumulative net flows with Sept 5 2014 as starting point
Positioning of longevity stocks Investors are Overweight financial management for the aging population, such as Insurance and Asset & Wealth Management. These companies help manage the asset accumulation, and decumulation phase as people move into retirement. Not far behind are Pharma & Healthcare and Aging in Place including home renovation. The Underweights are travel, gaming, and retail.
Table 28: Top Overweight and Underweight stocks in Longevity Top Overweight Top Underweight
Weightings % top holders overweight Weightings % top holders
overweight Merck & Co., Inc. 123 54% IGM Financial Inc. 6 0% JPMorgan Chase & Co. 111 52% Caesars Entertainment Corporation 10 0% UnitedHealth Group Incorporated 126 50% Flight Centre Travel Group Limited 10 0% Johnson & Johnson 112 50% CVC Brasil Operadora e Agencia de Viagens SA 5 2% CVS Health Corporation 106 50% Noah Holdings Ltd. Sponsored ADR 12 2% Wells Fargo & Company 127 48% Sugi Holdings Co., Ltd. 28 2% Home Depot, Inc. 123 46% Amplifon S.p.A. 27 4% Prudential Financial, Inc. 116 46% Lungyen Life Service Corporation 6 4% MetLife, Inc. 91 46% Sun Pharmaceutical Industries Limited 10 4% Bristol-Myers Squibb Company 126 44% Matsumotokiyoshi Holdings Co., Ltd. 11 4% Procter & Gamble Company 115 44% Coloplast A/S Class B 16 4% Medtronic, Inc. 111 44% Brasil Pharma S.A. 23 4% Abbott Laboratories 98 42% William Demant Holding A/S 27 4% Cardinal Health, Inc. 115 38% Tornier NV 54 4% AbbVie, Inc. 110 38% Coty Inc. Class A 58 4% Source: BofAML Global Research. BofAML Thematic stock lists are not a recommended list either individually or as a group of stocks.
-8,000
-7,000
-6,000
-5,000
-4,000
-3,000
-2,000
-1,000
0
-8,000
-7,000
-6,000
-5,000
-4,000
-3,000
-2,000
-1,000
0
Cum
ulat
ive
flow
s U
S$ m
n
Net
flo
ws
US$
mn
Net inflows (US$ mn)Net outflows (US$ mn)Cumulative flows (US$ mn)
Table 27: Longevity BofAML client net trading flows (US$ mn) Last Month (Dec 5 2014) -1,569 Nov 5 2014 -1,188 Oct 5 2014 -3,351 Sep 5 2014 -998 Cumulative Net flows -7,107 3 month avg. -2,036 Source: BofA Merrill Lynch Global Research Cumulative net flows with Sep 5 2014 as starting point. Average flows=average net flow between specified period
We cannot currently show performance for our Longevity Primer Picks list because it was launched in June 2014, and has been in existence for less than one year.

09 January 2015
Them
atic Investing
38
Positioning of longevity stocks Chart 32: Positioning and ownership – Longevity
Source: BofAML Global Research
Abbott Laboratories
AbbVie, Inc.
Actavis Plc
Actelion Ltd.
AEGON N.V.
Affiliated Managers Group, Inc. Aflac Incorporated
AIA Group Limited
American International Group, Inc.
AIN PHARMACIEZ INC
AllianceBernstein Holding L.P.
AmerisourceBergen Corporation
Amplifon S.p.A.
Astellas Pharma Inc.
Aviv REIT, Inc.
Avon Products, Inc.
Bayer AG
Beiersdorf AG
BlackRock, Inc.
Bank of New York Mellon Corporation
Boston Scientific Corporation
Boyd Gaming Corporation
Brasil Pharma S.A.
Bristol-Myers Squibb Company
Brookdale Senior Living Inc.
Caesars Entertainment Corporation
Capital Senior Living Corporation
Cardinal Health, Inc.
Cardiovascular Systems, Inc.
Carnival Corporation
Cochlear Limited
Colgate-Palmolive Company
Coloplast A/S Class B
Coty Inc. Class A
C. R. Bard, Inc.
Credit Suisse Group AG Credit Suisse Group AG Sponsored ADR
CVC Brasil Operadora e Agencia de Viagens SA
CVS Health Corporation
Daiichi Sankyo Company, Limited
Danaher Corporation
Danone SA DaVita HealthCare Partners Inc.
Debenhams plc
DENTSPLY International Inc.
Royal DSM NV
Eaton Vance Corp.
Edwards Lifesciences Corporation
Eisai Co., Ltd.
Eli Lilly and Company
Estee Lauder Companies Inc. Class A
Experian PLC
Federated Investors, Inc. Class B
Flight Centre Travel Group Limited
Franklin Resources, Inc.
GlaxoSmithKline plc
GN Store Nord A/S
HCA Holdings, Inc.
HCP, Inc. Health Care REIT, Inc.
HealthSouth Corporation
Henderson Group plc
Henkel AG & Co. KGaA Pref
Humana Inc.
IGM Financial Inc.
International Game Technology
Invesco Ltd.
Janus Capital Group Inc.
Jean Coutu Group (PJC) Inc. Class A
Johnson & Johnson
JPMorgan Chase & Co.
Kao Corp.
Kindred Healthcare, Inc.
Kuraray Co., Ltd.
Legal & General Group Plc
Legg Mason, Inc.
LifeLock, Inc.
Lincoln National Corporation
L'Oreal SA
Lowe's Companies, Inc.
Lungyen Life Service Corporation
Marks and Spencer Group plc
Man Group Plc
MannKind Corporation
Manulife Financial Corporation
Masco Corporation
Matsumotokiyoshi Holdings Co., Ltd.
McKesson Corporation
Medical Properties Trust, Inc.
Medtronic, Inc.
Merck & Co., Inc.
MetLife, Inc.
MGM Resorts International
Morgan Stanley
Mylan Inc.
N Brown Group plc
National Health Investors, Inc.
Nestle S.A.
Noah Holdings Ltd. Sponsored ADR
Northern Trust Corporation
Novartis AG
Novo Nordisk A/S Class B
Nu Skin Enterprises, Inc. Class A
Old Mutual plc
Patterson Companies, Inc.
Penn National Gaming, Inc.
Royal Philips NV
Pinnacle Entertainment, Inc.
Principal Financial Group, Inc.
Procter & Gamble Company
Prudential Financial, Inc.
Prudential plc
Raia Drogasil S.A.
ResMed Inc.
Roche Holding Ltd Genusssch.
Sanofi
Schroders PLC
Secom Co., Ltd.
Select Medical Holdings Corporation
Senior Housing Properties Trust
Service Corporation International
Shiseido Company,Limited
Siemens AG Sirona Dental Systems, Inc.
Smith & Nephew plc Sonova Holding AG St. James's Place Plc
St. Jude Medical, Inc.
State Street Corporation
Straumann Holding AG
Stryker Corporation
Sugi Holdings Co., Ltd.
Sun Life Financial Inc.
Sun Pharmaceutical Industries Limited
Sundrug Co., Ltd.
T. Rowe Price Group
Takeda Pharmaceutical Co. Ltd.
Tandem Diabetes Care, Inc.
Teva Pharmaceutical Industries Limited Sponsored ADR
Hartford Financial Services Group, Inc.
Home Depot, Inc.
Medicines Company
Thomas Cook Group plc
Tornier NV
UBS AG
Unilever PLC
UnitedHealth Group Incorporated
Ventas, Inc.
Vitamin Shoppe, Inc.
Voya Financial, Inc.
Waddell & Reed Financial, Inc. Class A
Walgreen Co.
WellCare Health Plans, Inc.
Wells Fargo & Company
William Demant Holding A/S
Zimmer Holdings, Inc.
0%
10%
20%
30%
40%
50%
0 20 40 60 80 100 120 140 160 180
% o
f top
50
FMs
Ove
rwei
ght
Relative weight of top 50 FMs (100=neutral)
OVERWEIGHT
UNDERWEIGHT
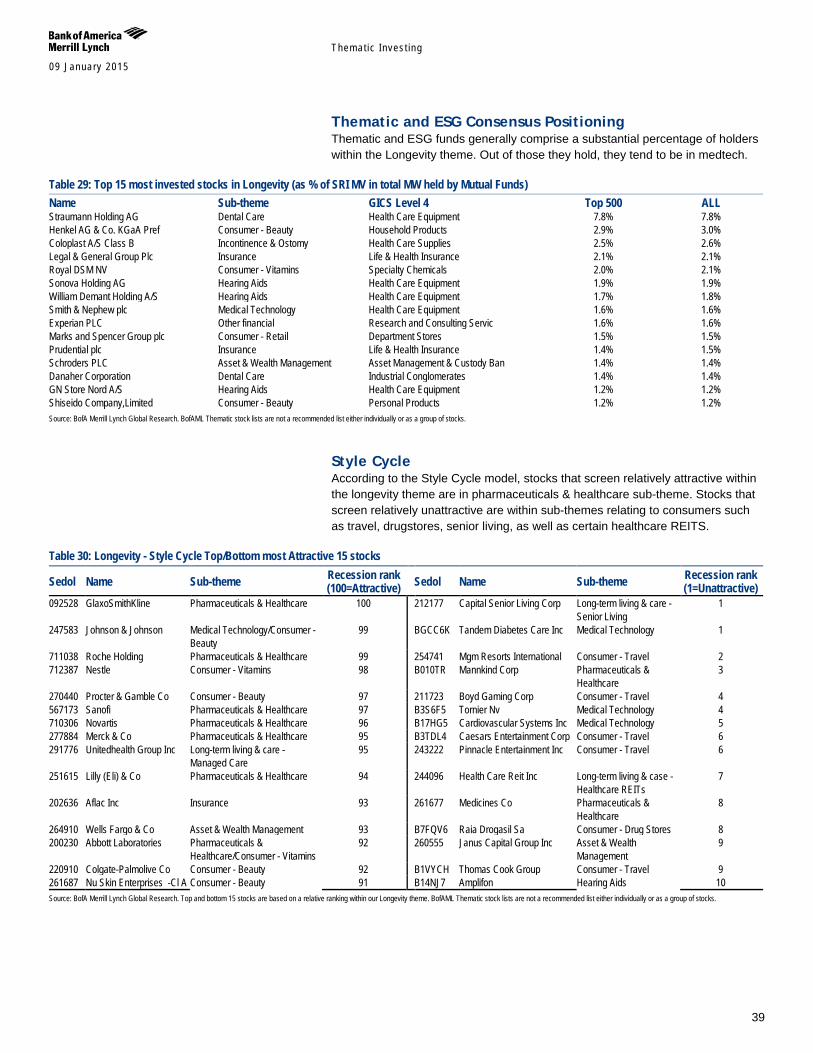
Themat ic Inves t ing 09 January 2015
39
Thematic and ESG Consensus Positioning Thematic and ESG funds generally comprise a substantial percentage of holders within the Longevity theme. Out of those they hold, they tend to be in medtech.
Table 29: Top 15 most invested stocks in Longevity (as % of SRI MV in total MW held by Mutual Funds) Name Sub-theme GICS Level 4 Top 500 ALL Straumann Holding AG Dental Care Health Care Equipment 7.8% 7.8% Henkel AG & Co. KGaA Pref Consumer - Beauty Household Products 2.9% 3.0% Coloplast A/S Class B Incontinence & Ostomy Health Care Supplies 2.5% 2.6% Legal & General Group Plc Insurance Life & Health Insurance 2.1% 2.1% Royal DSM NV Consumer - Vitamins Specialty Chemicals 2.0% 2.1% Sonova Holding AG Hearing Aids Health Care Equipment 1.9% 1.9% William Demant Holding A/S Hearing Aids Health Care Equipment 1.7% 1.8% Smith & Nephew plc Medical Technology Health Care Equipment 1.6% 1.6% Experian PLC Other financial Research and Consulting Servic 1.6% 1.6% Marks and Spencer Group plc Consumer - Retail Department Stores 1.5% 1.5% Prudential plc Insurance Life & Health Insurance 1.4% 1.5% Schroders PLC Asset & Wealth Management Asset Management & Custody Ban 1.4% 1.4% Danaher Corporation Dental Care Industrial Conglomerates 1.4% 1.4% GN Store Nord A/S Hearing Aids Health Care Equipment 1.2% 1.2% Shiseido Company,Limited Consumer - Beauty Personal Products 1.2% 1.2% Source: BofA Merrill Lynch Global Research. BofAML Thematic stock lists are not a recommended list either individually or as a group of stocks.
Style Cycle According to the Style Cycle model, stocks that screen relatively attractive within the longevity theme are in pharmaceuticals & healthcare sub-theme. Stocks that screen relatively unattractive are within sub-themes relating to consumers such as travel, drugstores, senior living, as well as certain healthcare REITS.
Table 30: Longevity - Style Cycle Top/Bottom most Attractive 15 stocks
Sedol Name Sub-theme Recession rank (100=Attractive) Sedol Name Sub-theme Recession rank
(1=Unattractive) 092528 GlaxoSmithKline Pharmaceuticals & Healthcare 100 212177 Capital Senior Living Corp Long-term living & care -
Senior Living 1
247583 Johnson & Johnson Medical Technology/Consumer - Beauty
99 BGCC6K Tandem Diabetes Care Inc Medical Technology 1
711038 Roche Holding Pharmaceuticals & Healthcare 99 254741 Mgm Resorts International Consumer - Travel 2 712387 Nestle Consumer - Vitamins 98 B010TR Mannkind Corp Pharmaceuticals &
Healthcare 3
270440 Procter & Gamble Co Consumer - Beauty 97 211723 Boyd Gaming Corp Consumer - Travel 4 567173 Sanofi Pharmaceuticals & Healthcare 97 B3S6F5 Tornier Nv Medical Technology 4 710306 Novartis Pharmaceuticals & Healthcare 96 B17HG5 Cardiovascular Systems Inc Medical Technology 5 277884 Merck & Co Pharmaceuticals & Healthcare 95 B3TDL4 Caesars Entertainment Corp Consumer - Travel 6 291776 Unitedhealth Group Inc Long-term living & care -
Managed Care 95 243222 Pinnacle Entertainment Inc Consumer - Travel 6
251615 Lilly (Eli) & Co Pharmaceuticals & Healthcare 94 244096 Health Care Reit Inc Long-term living & case - Healthcare REITs
7
202636 Aflac Inc Insurance 93 261677 Medicines Co Pharmaceuticals & Healthcare
8
264910 Wells Fargo & Co Asset & Wealth Management 93 B7FQV6 Raia Drogasil Sa Consumer - Drug Stores 8 200230 Abbott Laboratories Pharmaceuticals &
Healthcare/Consumer - Vitamins 92 260555 Janus Capital Group Inc Asset & Wealth
Management 9
220910 Colgate-Palmolive Co Consumer - Beauty 92 B1VYCH Thomas Cook Group Consumer - Travel 9 261687 Nu Skin Enterprises -Cl A Consumer - Beauty 91 B14NJ7 Amplifon Hearing Aids 10 Source: BofA Merrill Lynch Global Research. Top and bottom 15 stocks are based on a relative ranking within our Longevity theme. BofAML Thematic stock lists are not a recommended list either individually or as a group of stocks.
Themat ic Inves t ing 09 January 2015
40
Obesity and health & wellness - Globesity A Transforming World thematic impacts: People, Government, Innovation Pressing global health challenge - We believe that the obesity epidemic may be the most pressing health challenge facing the world today. The number of overweight or obese people has tripled since 1980 with not a single country making progress in reducing these rates. Today, almost one-third of the world’s population or 2.1bn people are now overweight, including 671mn who are obese (source: The Lancet 2014). By 2030, close to 50% of the world’s population is projected to be overweight or obese.
#5 cause of death & US$2tn in annual costs – Obesity is the fifth-leading global risk for death, accounting for 3.4mn adult deaths a year. Obesity can raise the risk of cardiovascular disease, diabetes, osteoarthritis, and cancer, among many other health-threatening conditions, Total health care costs are more than 40% higher for obese patients than normal-weight patients. The global economic impacts of obesity are estimated at US$2.0tn or 2.8% of global GDP, on par with the impacts of smoking or armed violence, war and terrorism (source: McKinsey). The future costs could be overwhelming, especially given high levels of global childhood obesity and growing obesity in EMs.
US$932bn food & beverage health & wellness market – Over the past two years, 10+ countries have passed fat/sugar taxes with the two being increasingly heralded as the “new tobacco”. Developed market consumers have also shown a clear trend toward fresh and healthy foods in recent years. The global health and wellness (H&W) food market is estimated at US$932bn in 2014. It is both high growth and high margin and is set to reach US$1.1tn by 2019 (source: Euromonitor), while fresh produce is expected to reach US$736bn by 2015 (source: Companiesandmarkets.com). We anticipate a shift in business model focus from product volumes alone to the quality of food & beverage portfolios from an H&W perspective.
Four major entry points for investors - We have mapped the global fight against obesity across a number of sector value chains to highlight the diverse range of entry points for investors wishing to play the global fight against obesity theme: 1) Pharmaceuticals, Health Care & Medtech; 2) Food, Food Retail, Quick Casual & Beverages; 3) Weight Loss, Diet, Nutrition & VMS; and 4) Sports Apparel & Equipment.
Thematic Investing: Globesity and Health & Wellness primer 03 December 2014
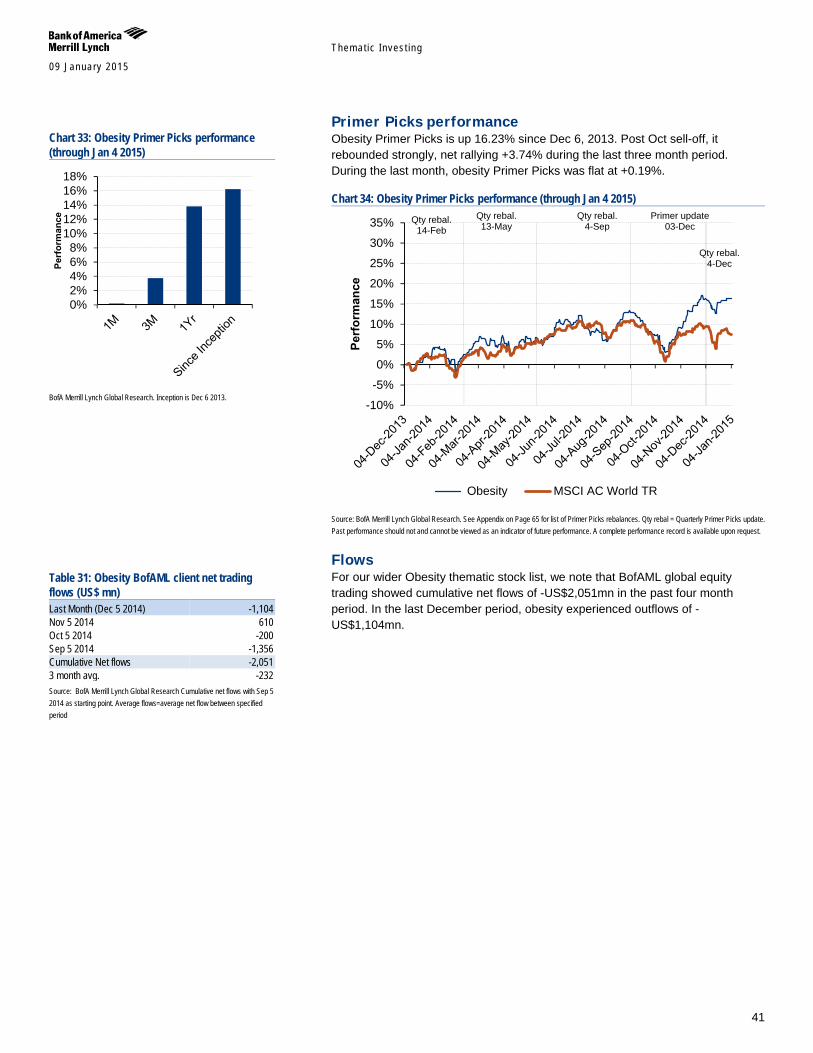
Themat ic Inves t ing 09 January 2015
41
Primer Picks performance Obesity Primer Picks is up 16.23% since Dec 6, 2013. Post Oct sell-off, it rebounded strongly, net rallying +3.74% during the last three month period. During the last month, obesity Primer Picks was flat at +0.19%.
Chart 34: Obesity Primer Picks performance (through Jan 4 2015)
Source: BofA Merrill Lynch Global Research. See Appendix on Page 65 for list of Primer Picks rebalances. Qty rebal = Quarterly Primer Picks update. Past performance should not and cannot be viewed as an indicator of future performance. A complete performance record is available upon request.
Flows For our wider Obesity thematic stock list, we note that BofAML global equity trading showed cumulative net flows of -US$2,051mn in the past four month period. In the last December period, obesity experienced outflows of -US$1,104mn.
Qty rebal. 14-Feb
Qty rebal. 13-May
Qty rebal. 4-Sep
Primer update 03-Dec
Qty rebal. 4-Dec
-10%
-5%
0%
5%
10%
15%
20%
25%
30%
35%
Perf
orm
ance
Obesity MSCI AC World TR
Chart 33: Obesity Primer Picks performance (through Jan 4 2015)
BofA Merrill Lynch Global Research. Inception is Dec 6 2013.
Table 31: Obesity BofAML client net trading flows (US$ mn) Last Month (Dec 5 2014) -1,104 Nov 5 2014 610 Oct 5 2014 -200 Sep 5 2014 -1,356 Cumulative Net flows -2,051 3 month avg. -232 Source: BofA Merrill Lynch Global Research Cumulative net flows with Sep 5 2014 as starting point. Average flows=average net flow between specified period
0%2%4%6%8%
10%12%14%16%18%
Perf
orm
ance
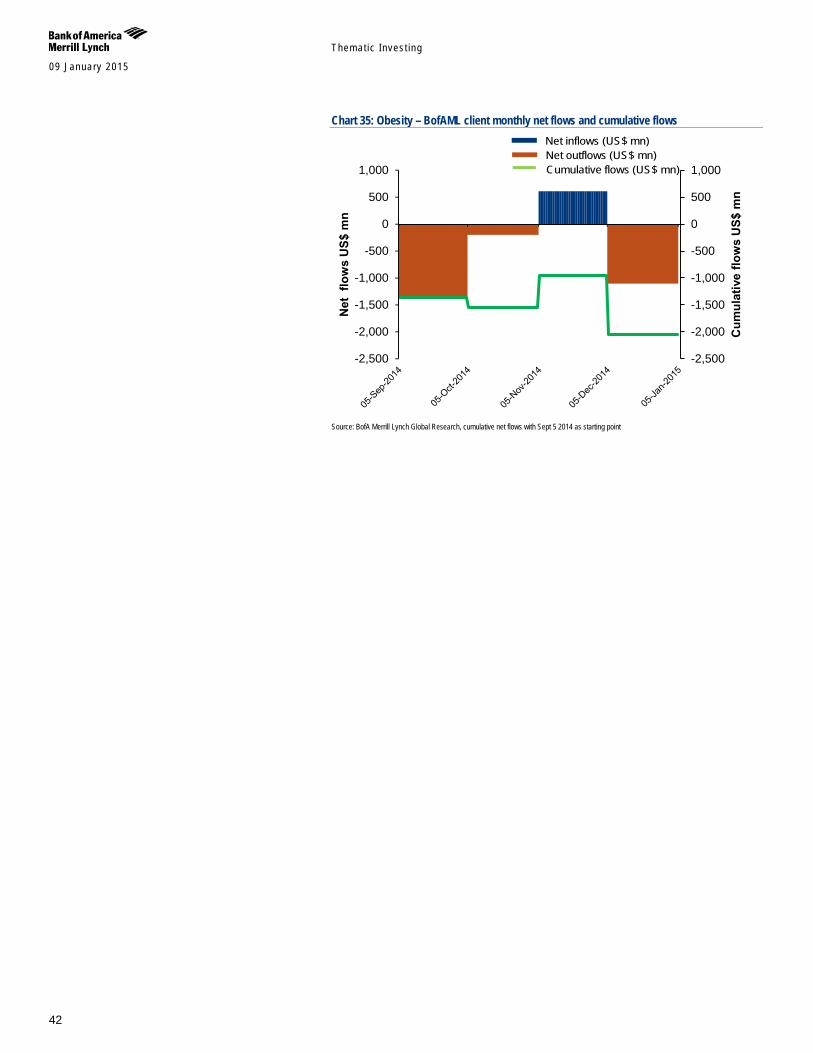
Themat ic Inves t ing 09 January 2015
42
Chart 35: Obesity – BofAML client monthly net flows and cumulative flows
Source: BofA Merrill Lynch Global Research, cumulative net flows with Sept 5 2014 as starting point
-2,500
-2,000
-1,500
-1,000
-500
0
500
1,000
-2,500
-2,000
-1,500
-1,000
-500
0
500
1,000
Cum
ulat
ive
flow
s U
S$ m
n
Net
flo
ws
US$
mn
Net inflows (US$ mn)Net outflows (US$ mn)Cumulative flows (US$ mn)

09 January 2015
Them
atic Investing
43
Positioning of obesity and health & wellness stocks Chart 36: Positioning and ownership - Obesity and Health & Wellness
Source: BofAML Global Research
Abbott Laboratories
adidas AG
Royal Ahold NV Alkermes Plc
ANTA Sports Products Ltd.
Arena Pharmaceuticals, Inc.
Asahi Group Holdings,Ltd.
Asics Corporation
AstraZeneca PLC Bayer AG
Belle International Holdings Limited
BRF SA Campbell Soup Company
China Dongxiang (Group) Co., Ltd.
Chipotle Mexican Grill, Inc.
Coca-Cola Company
Coloplast A/S Class B
Columbia Sportswear Company
ConAgra Foods, Inc.
Danone SA
DaVita HealthCare Partners Inc.
Dick's Sporting Goods, Inc.
Royal DSM NV
Eisai Co., Ltd.
Eli Lilly and Company
Finish Line, Inc. Class A
Foot Locker, Inc.
Fresenius Medical Care AG & Co. KGaA
General Mills, Inc.
Getinge AB Class B
Giant Manufacturing Co., Ltd.
Gildan Activewear Inc.
Givaudan SA
Glanbia Plc
GlaxoSmithKline plc
GNC Holdings, Inc. Class A
Hibbett Sports, Inc.
Hosa International Limited
Johnson & Johnson
Kellogg Company
Kering SA
Kerry Group Plc Class A
Kraft Foods Group, Inc.
Lexicon Pharmaceuticals, Inc.
Li Ning Co. Ltd.
lululemon athletica inc.
MannKind Corporation
Medtronic, Inc.
China Mengniu Dairy Co., Ltd.
Merck & Co., Inc.
Merida Industry Co., Ltd.
Mitsubishi Tanabe Pharma Corporation
Nestle S.A.
NIKE, Inc. Class B
Novartis AG
Novo Nordisk A/S Class B
Ontex Group N.V.
Orexigen Therapeutics, Inc.
Otsuka Holdings Co., Ltd.
Panera Bread Company Class A
PepsiCo, Inc.
Performance Sports Group Ltd.
Reckitt Benckiser Group plc
Repros Therapeutics Inc.
ResMed Inc.
Roche Holding Ltd Genusssch.
Sanofi
Svenska Cellulosa Aktiebolaget Class B
Shenzhou International Group Holdings Ltd.
Smith & Nephew plc
Sports Direct International plc
Sprouts Farmers Markets, Inc.
St. Jude Medical, Inc.
Stella International Holdings Limited
Stryker Corporation
Sun Pharmaceutical Industries Limited
Takeda Pharmaceutical Co. Ltd.
Tandem Diabetes Care, Inc.
Fresh Market, Inc.
Kroger Co.
Under Armour, Inc. Class A
Unicharm Corporation
Unilever NV Cert. of shs
United Natural Foods, Inc.
Vitamin Shoppe, Inc.
VIVUS, Inc.
WhiteWave Foods Company
Whole Foods Market, Inc.
Yue Yuen Industrial (Holdings) Limited
Zimmer Holdings, Inc.
0%
5%
10%
15%
20%
25%
30%
35%
40%
45%
0 20 40 60 80 100 120 140 160
% o
f top
50
FMs
Ove
rwei
ght
Relative weight of top 50 FMs (100=neutral)
UNDERWEIGHT
OVERWEIGHT
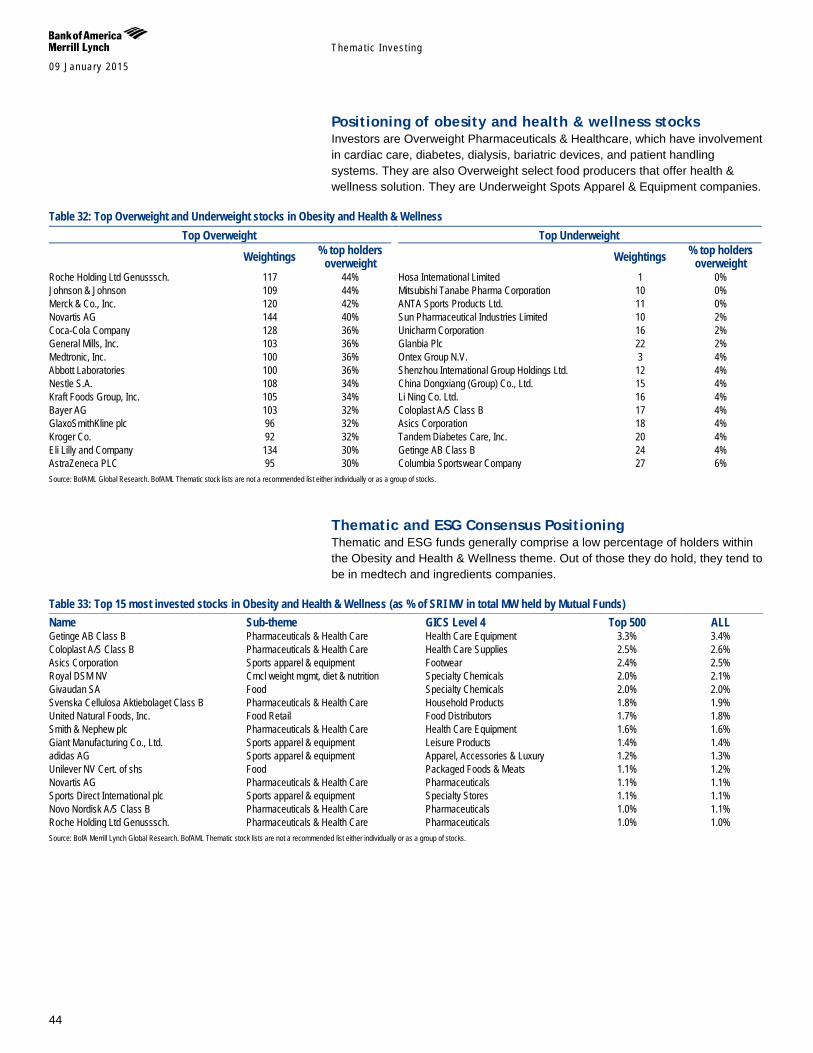
Themat ic Inves t ing 09 January 2015
44
Positioning of obesity and health & wellness stocks Investors are Overweight Pharmaceuticals & Healthcare, which have involvement in cardiac care, diabetes, dialysis, bariatric devices, and patient handling systems. They are also Overweight select food producers that offer health & wellness solution. They are Underweight Spots Apparel & Equipment companies.
Table 32: Top Overweight and Underweight stocks in Obesity and Health & Wellness Top Overweight Top Underweight
Weightings % top holders overweight Weightings % top holders
overweight Roche Holding Ltd Genusssch. 117 44% Hosa International Limited 1 0% Johnson & Johnson 109 44% Mitsubishi Tanabe Pharma Corporation 10 0% Merck & Co., Inc. 120 42% ANTA Sports Products Ltd. 11 0% Novartis AG 144 40% Sun Pharmaceutical Industries Limited 10 2% Coca-Cola Company 128 36% Unicharm Corporation 16 2% General Mills, Inc. 103 36% Glanbia Plc 22 2% Medtronic, Inc. 100 36% Ontex Group N.V. 3 4% Abbott Laboratories 100 36% Shenzhou International Group Holdings Ltd. 12 4% Nestle S.A. 108 34% China Dongxiang (Group) Co., Ltd. 15 4% Kraft Foods Group, Inc. 105 34% Li Ning Co. Ltd. 16 4% Bayer AG 103 32% Coloplast A/S Class B 17 4% GlaxoSmithKline plc 96 32% Asics Corporation 18 4% Kroger Co. 92 32% Tandem Diabetes Care, Inc. 20 4% Eli Lilly and Company 134 30% Getinge AB Class B 24 4% AstraZeneca PLC 95 30% Columbia Sportswear Company 27 6% Source: BofAML Global Research. BofAML Thematic stock lists are not a recommended list either individually or as a group of stocks.
Thematic and ESG Consensus Positioning Thematic and ESG funds generally comprise a low percentage of holders within the Obesity and Health & Wellness theme. Out of those they do hold, they tend to be in medtech and ingredients companies.
Table 33: Top 15 most invested stocks in Obesity and Health & Wellness (as % of SRI MV in total MW held by Mutual Funds) Name Sub-theme GICS Level 4 Top 500 ALL Getinge AB Class B Pharmaceuticals & Health Care Health Care Equipment 3.3% 3.4% Coloplast A/S Class B Pharmaceuticals & Health Care Health Care Supplies 2.5% 2.6% Asics Corporation Sports apparel & equipment Footwear 2.4% 2.5% Royal DSM NV Cmcl weight mgmt, diet & nutrition Specialty Chemicals 2.0% 2.1% Givaudan SA Food Specialty Chemicals 2.0% 2.0% Svenska Cellulosa Aktiebolaget Class B Pharmaceuticals & Health Care Household Products 1.8% 1.9% United Natural Foods, Inc. Food Retail Food Distributors 1.7% 1.8% Smith & Nephew plc Pharmaceuticals & Health Care Health Care Equipment 1.6% 1.6% Giant Manufacturing Co., Ltd. Sports apparel & equipment Leisure Products 1.4% 1.4% adidas AG Sports apparel & equipment Apparel, Accessories & Luxury 1.2% 1.3% Unilever NV Cert. of shs Food Packaged Foods & Meats 1.1% 1.2% Novartis AG Pharmaceuticals & Health Care Pharmaceuticals 1.1% 1.1% Sports Direct International plc Sports apparel & equipment Specialty Stores 1.1% 1.1% Novo Nordisk A/S Class B Pharmaceuticals & Health Care Pharmaceuticals 1.0% 1.1% Roche Holding Ltd Genusssch. Pharmaceuticals & Health Care Pharmaceuticals 1.0% 1.0% Source: BofA Merrill Lynch Global Research. BofAML Thematic stock lists are not a recommended list either individually or as a group of stocks.
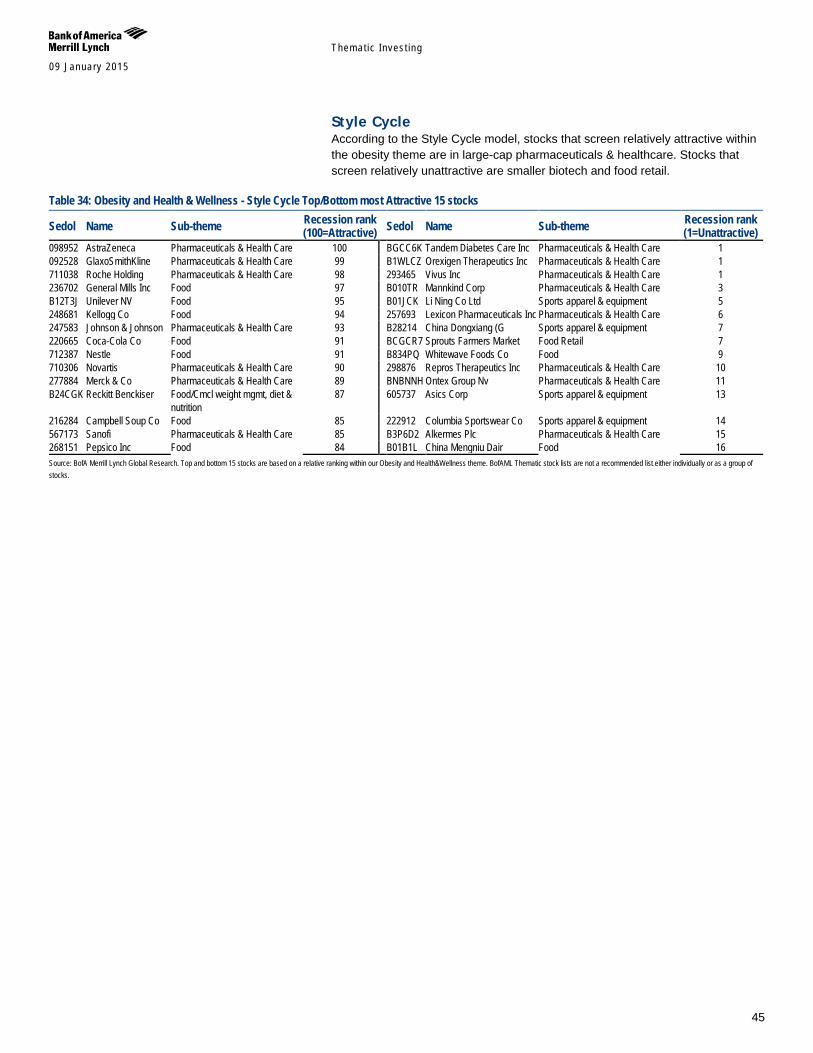
Themat ic Inves t ing 09 January 2015
45
Style Cycle According to the Style Cycle model, stocks that screen relatively attractive within the obesity theme are in large-cap pharmaceuticals & healthcare. Stocks that screen relatively unattractive are smaller biotech and food retail.
Table 34: Obesity and Health & Wellness - Style Cycle Top/Bottom most Attractive 15 stocks
Sedol Name Sub-theme Recession rank (100=Attractive) Sedol Name Sub-theme Recession rank
(1=Unattractive) 098952 AstraZeneca Pharmaceuticals & Health Care 100 BGCC6K Tandem Diabetes Care Inc Pharmaceuticals & Health Care 1 092528 GlaxoSmithKline Pharmaceuticals & Health Care 99 B1WLCZ Orexigen Therapeutics Inc Pharmaceuticals & Health Care 1 711038 Roche Holding Pharmaceuticals & Health Care 98 293465 Vivus Inc Pharmaceuticals & Health Care 1 236702 General Mills Inc Food 97 B010TR Mannkind Corp Pharmaceuticals & Health Care 3 B12T3J Unilever NV Food 95 B01JCK Li Ning Co Ltd Sports apparel & equipment 5 248681 Kellogg Co Food 94 257693 Lexicon Pharmaceuticals Inc Pharmaceuticals & Health Care 6 247583 Johnson & Johnson Pharmaceuticals & Health Care 93 B28214 China Dongxiang (G Sports apparel & equipment 7 220665 Coca-Cola Co Food 91 BCGCR7 Sprouts Farmers Market Food Retail 7 712387 Nestle Food 91 B834PQ Whitewave Foods Co Food 9 710306 Novartis Pharmaceuticals & Health Care 90 298876 Repros Therapeutics Inc Pharmaceuticals & Health Care 10 277884 Merck & Co Pharmaceuticals & Health Care 89 BNBNNH Ontex Group Nv Pharmaceuticals & Health Care 11 B24CGK Reckitt Benckiser Food/Cmcl weight mgmt, diet &
nutrition 87 605737 Asics Corp Sports apparel & equipment 13
216284 Campbell Soup Co Food 85 222912 Columbia Sportswear Co Sports apparel & equipment 14 567173 Sanofi Pharmaceuticals & Health Care 85 B3P6D2 Alkermes Plc Pharmaceuticals & Health Care 15 268151 Pepsico Inc Food 84 B01B1L China Mengniu Dair Food 16 Source: BofA Merrill Lynch Global Research. Top and bottom 15 stocks are based on a relative ranking within our Obesity and Health&Wellness theme. BofAML Thematic stock lists are not a recommended list either individually or as a group of stocks.
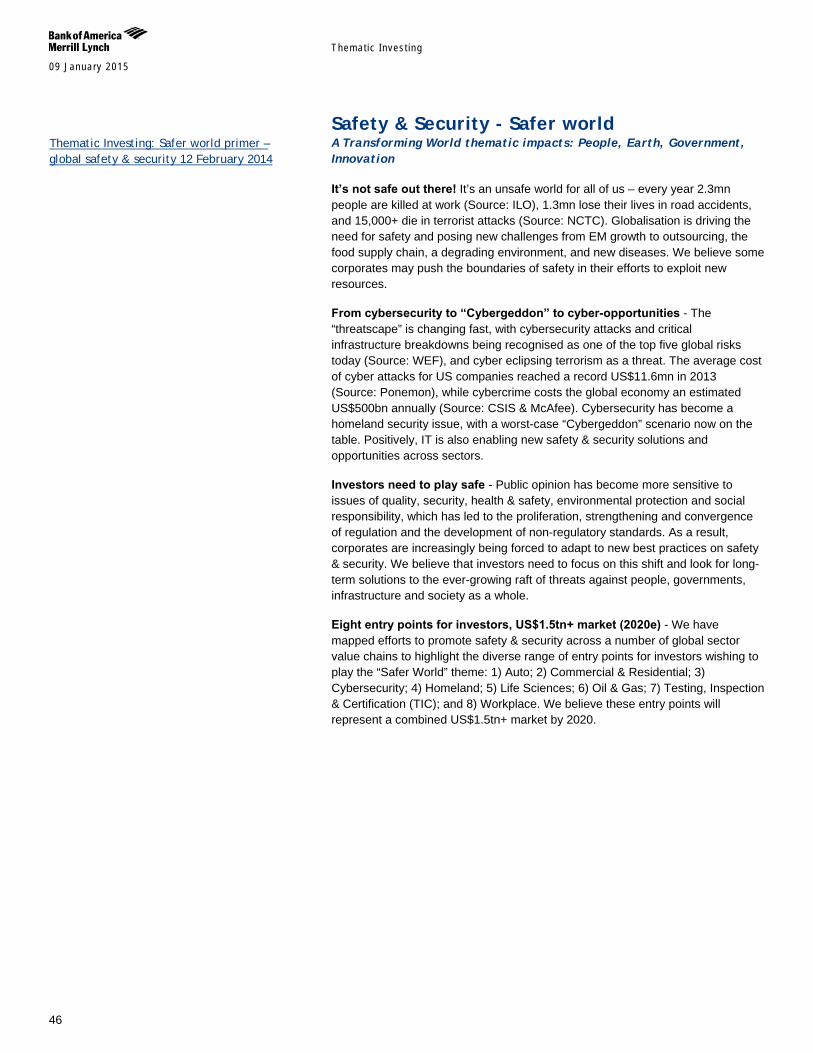
Themat ic Inves t ing 09 January 2015
46
Safety & Security - Safer world A Transforming World thematic impacts: People, Earth, Government, Innovation It’s not safe out there! It’s an unsafe world for all of us – every year 2.3mn people are killed at work (Source: ILO), 1.3mn lose their lives in road accidents, and 15,000+ die in terrorist attacks (Source: NCTC). Globalisation is driving the need for safety and posing new challenges from EM growth to outsourcing, the food supply chain, a degrading environment, and new diseases. We believe some corporates may push the boundaries of safety in their efforts to exploit new resources.
From cybersecurity to “Cybergeddon” to cyber-opportunities - The “threatscape” is changing fast, with cybersecurity attacks and critical infrastructure breakdowns being recognised as one of the top five global risks today (Source: WEF), and cyber eclipsing terrorism as a threat. The average cost of cyber attacks for US companies reached a record US$11.6mn in 2013 (Source: Ponemon), while cybercrime costs the global economy an estimated US$500bn annually (Source: CSIS & McAfee). Cybersecurity has become a homeland security issue, with a worst-case “Cybergeddon” scenario now on the table. Positively, IT is also enabling new safety & security solutions and opportunities across sectors.
Investors need to play safe - Public opinion has become more sensitive to issues of quality, security, health & safety, environmental protection and social responsibility, which has led to the proliferation, strengthening and convergence of regulation and the development of non-regulatory standards. As a result, corporates are increasingly being forced to adapt to new best practices on safety & security. We believe that investors need to focus on this shift and look for long-term solutions to the ever-growing raft of threats against people, governments, infrastructure and society as a whole.
Eight entry points for investors, US$1.5tn+ market (2020e) - We have mapped efforts to promote safety & security across a number of global sector value chains to highlight the diverse range of entry points for investors wishing to play the “Safer World” theme: 1) Auto; 2) Commercial & Residential; 3) Cybersecurity; 4) Homeland; 5) Life Sciences; 6) Oil & Gas; 7) Testing, Inspection & Certification (TIC); and 8) Workplace. We believe these entry points will represent a combined US$1.5tn+ market by 2020.
Thematic Investing: Safer world primer – global safety & security 12 February 2014
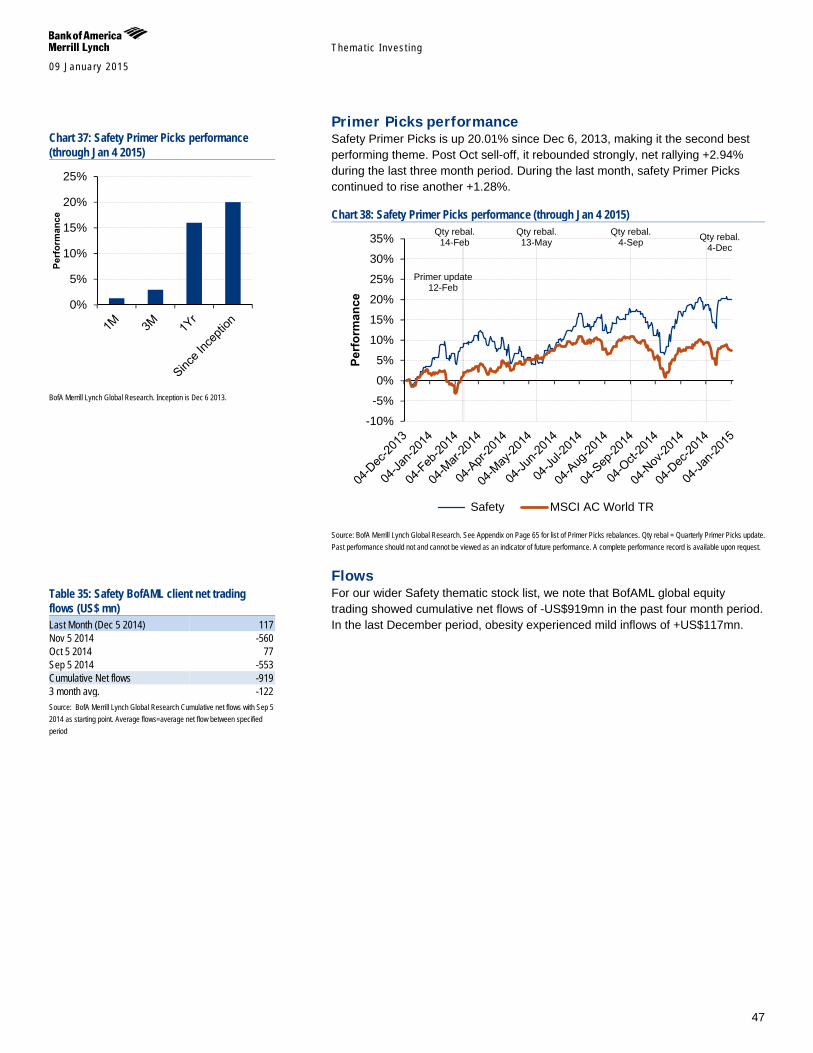
Themat ic Inves t ing 09 January 2015
47
Primer Picks performance Safety Primer Picks is up 20.01% since Dec 6, 2013, making it the second best performing theme. Post Oct sell-off, it rebounded strongly, net rallying +2.94% during the last three month period. During the last month, safety Primer Picks continued to rise another +1.28%.
Chart 38: Safety Primer Picks performance (through Jan 4 2015)
Source: BofA Merrill Lynch Global Research. See Appendix on Page 65 for list of Primer Picks rebalances. Qty rebal = Quarterly Primer Picks update. Past performance should not and cannot be viewed as an indicator of future performance. A complete performance record is available upon request.
Flows For our wider Safety thematic stock list, we note that BofAML global equity trading showed cumulative net flows of -US$919mn in the past four month period. In the last December period, obesity experienced mild inflows of +US$117mn.
Qty rebal. 14-Feb
Primer update 12-Feb
Qty rebal. 13-May
Qty rebal. 4-Sep Qty rebal.
4-Dec
-10%
-5%
0%
5%
10%
15%
20%
25%
30%
35%
Perf
orm
ance
Safety MSCI AC World TR
Chart 37: Safety Primer Picks performance (through Jan 4 2015)
BofA Merrill Lynch Global Research. Inception is Dec 6 2013.
Table 35: Safety BofAML client net trading flows (US$ mn) Last Month (Dec 5 2014) 117 Nov 5 2014 -560 Oct 5 2014 77 Sep 5 2014 -553 Cumulative Net flows -919 3 month avg. -122 Source: BofA Merrill Lynch Global Research Cumulative net flows with Sep 5 2014 as starting point. Average flows=average net flow between specified period
0%
5%
10%
15%
20%
25%
Perf
orm
ance
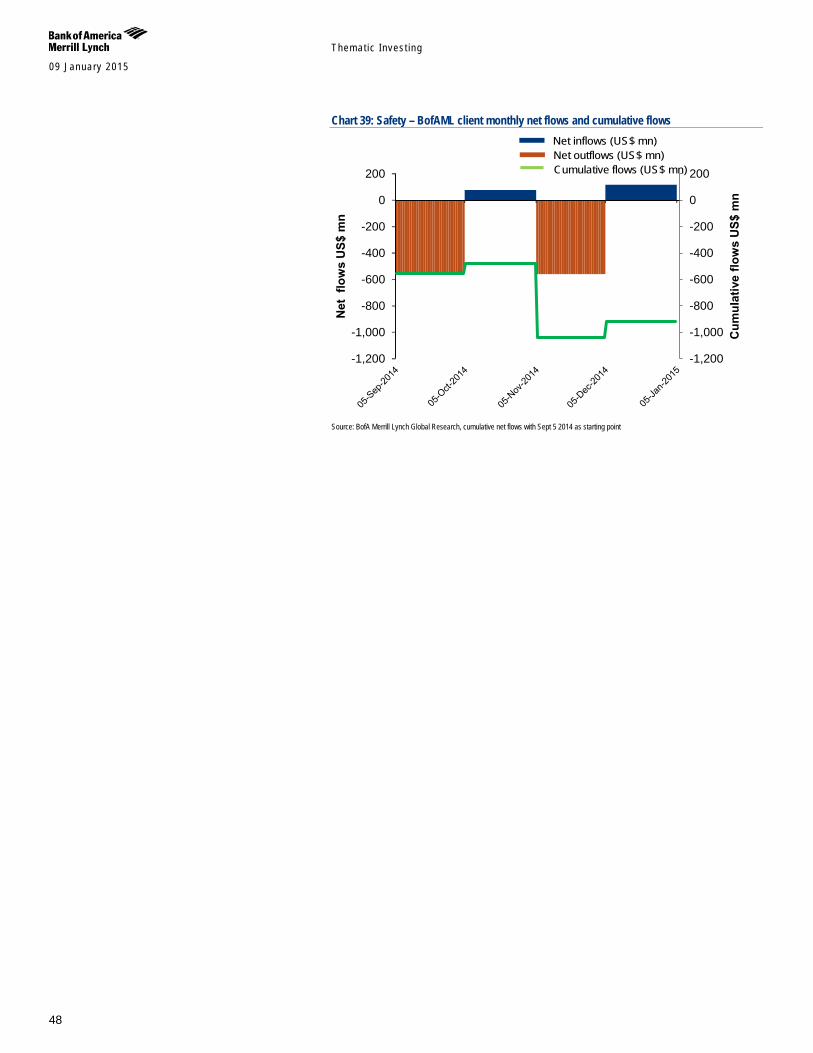
Themat ic Inves t ing 09 January 2015
48
Chart 39: Safety – BofAML client monthly net flows and cumulative flows
Source: BofA Merrill Lynch Global Research, cumulative net flows with Sept 5 2014 as starting point
-1,200
-1,000
-800
-600
-400
-200
0
200
-1,200
-1,000
-800
-600
-400
-200
0
200
Cum
ulat
ive
flow
s U
S$ m
n
Net
flo
ws
US$
mn
Net inflows (US$ mn)Net outflows (US$ mn)Cumulative flows (US$ mn)
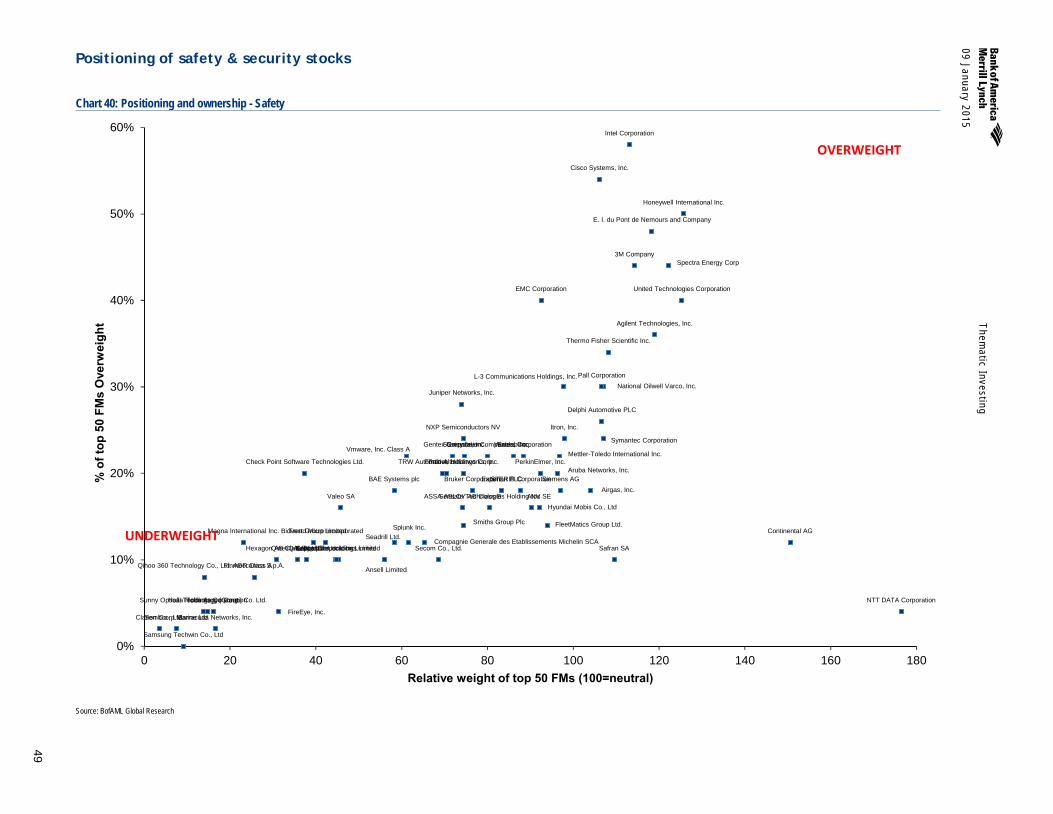
09 January 2015
Them
atic Investing
49
Positioning of safety & security stocks
Chart 40: Positioning and ownership - Safety
Source: BofAML Global Research
3M Company
Agilent Technologies, Inc.
Airgas, Inc.
ALS Ltd.
Ansell Limited
Aruba Networks, Inc.
ASSA ABLOY AB Class B Atos SE
BAE Systems plc
Barracuda Networks, Inc.
Bidvest Group Limited
Bruker Corporation
Check Point Software Technologies Ltd.
Cisco Systems, Inc.
Clarion Co., Ltd.
Continental AG
Delphi Automotive PLC
E. I. du Pont de Nemours and Company
Ecolab Inc.
EMC Corporation
Experian PLC
Finmeccanica S.p.A.
FireEye, Inc.
FleetMatics Group Ltd.
Fortinet, Inc.
Gentex Corporation Greenbrier Companies, Inc.
Halla Holdings Corporation
Hexagon AB Class B
Honeywell International Inc.
Hyundai Mobis Co., Ltd
Intel Corporation
Itron, Inc.
Juniper Networks, Inc.
Keppel Corporation Limited
L-3 Communications Holdings, Inc.
Lancashire Holdings Limited LifeLock, Inc.
Magna International Inc.
Mettler-Toledo International Inc.
Compagnie Generale des Etablissements Michelin SCA
National Oilwell Varco, Inc.
NTT DATA Corporation
NXP Semiconductors NV
Pall Corporation
Palo Alto Networks, Inc. PerkinElmer, Inc.
Qihoo 360 Technology Co., Ltd. ADR Class A
QinetiQ Group plc Safran SA
Samsung Techwin Co., Ltd
Seadrill Ltd.
Secom Co., Ltd.
Sembcorp Marine Ltd
Sensata Technologies Holding NV
Siemens AG
Smiths Group Plc
Spectra Energy Corp
Splunk Inc.
Stericycle, Inc.
STERIS Corporation
Sunny Optical Technology (Group) Co. Ltd.
Symantec Corporation
Thermo Fisher Scientific Inc.
Toda Kogyo Corp.
Trend Micro Incorporated
TRW Automotive Holdings Corp.
United Technologies Corporation
Valeo SA
Vmware, Inc. Class A Waters Corporation
0%
10%
20%
30%
40%
50%
60%
0 20 40 60 80 100 120 140 160 180
% o
f top
50
FMs
Ove
rwei
ght
Relative weight of top 50 FMs (100=neutral)
UNDERWEIGHT
OVERWEIGHT
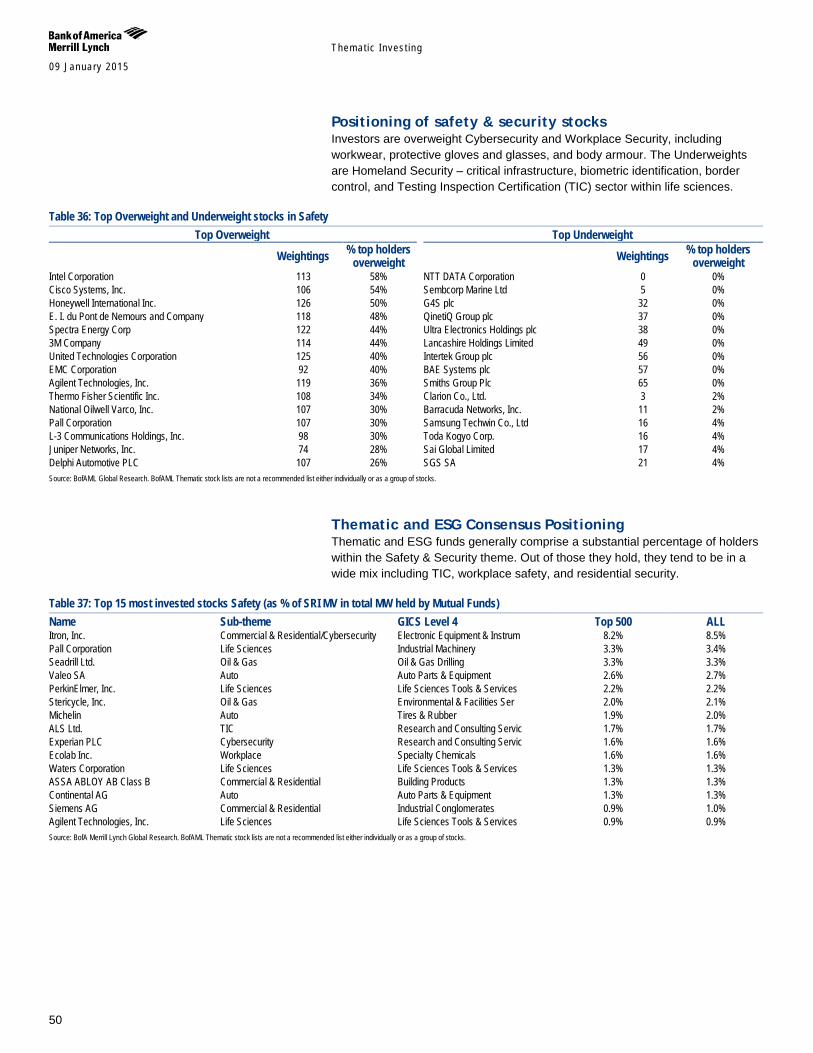
Themat ic Inves t ing 09 January 2015
50
Positioning of safety & security stocks Investors are overweight Cybersecurity and Workplace Security, including workwear, protective gloves and glasses, and body armour. The Underweights are Homeland Security – critical infrastructure, biometric identification, border control, and Testing Inspection Certification (TIC) sector within life sciences.
Table 36: Top Overweight and Underweight stocks in Safety Top Overweight Top Underweight
Weightings % top holders overweight Weightings % top holders
overweight Intel Corporation 113 58% NTT DATA Corporation 0 0% Cisco Systems, Inc. 106 54% Sembcorp Marine Ltd 5 0% Honeywell International Inc. 126 50% G4S plc 32 0% E. I. du Pont de Nemours and Company 118 48% QinetiQ Group plc 37 0% Spectra Energy Corp 122 44% Ultra Electronics Holdings plc 38 0% 3M Company 114 44% Lancashire Holdings Limited 49 0% United Technologies Corporation 125 40% Intertek Group plc 56 0% EMC Corporation 92 40% BAE Systems plc 57 0% Agilent Technologies, Inc. 119 36% Smiths Group Plc 65 0% Thermo Fisher Scientific Inc. 108 34% Clarion Co., Ltd. 3 2% National Oilwell Varco, Inc. 107 30% Barracuda Networks, Inc. 11 2% Pall Corporation 107 30% Samsung Techwin Co., Ltd 16 4% L-3 Communications Holdings, Inc. 98 30% Toda Kogyo Corp. 16 4% Juniper Networks, Inc. 74 28% Sai Global Limited 17 4% Delphi Automotive PLC 107 26% SGS SA 21 4% Source: BofAML Global Research. BofAML Thematic stock lists are not a recommended list either individually or as a group of stocks.
Thematic and ESG Consensus Positioning Thematic and ESG funds generally comprise a substantial percentage of holders within the Safety & Security theme. Out of those they hold, they tend to be in a wide mix including TIC, workplace safety, and residential security.
Table 37: Top 15 most invested stocks Safety (as % of SRI MV in total MW held by Mutual Funds) Name Sub-theme GICS Level 4 Top 500 ALL Itron, Inc. Commercial & Residential/Cybersecurity Electronic Equipment & Instrum 8.2% 8.5% Pall Corporation Life Sciences Industrial Machinery 3.3% 3.4% Seadrill Ltd. Oil & Gas Oil & Gas Drilling 3.3% 3.3% Valeo SA Auto Auto Parts & Equipment 2.6% 2.7% PerkinElmer, Inc. Life Sciences Life Sciences Tools & Services 2.2% 2.2% Stericycle, Inc. Oil & Gas Environmental & Facilities Ser 2.0% 2.1% Michelin Auto Tires & Rubber 1.9% 2.0% ALS Ltd. TIC Research and Consulting Servic 1.7% 1.7% Experian PLC Cybersecurity Research and Consulting Servic 1.6% 1.6% Ecolab Inc. Workplace Specialty Chemicals 1.6% 1.6% Waters Corporation Life Sciences Life Sciences Tools & Services 1.3% 1.3% ASSA ABLOY AB Class B Commercial & Residential Building Products 1.3% 1.3% Continental AG Auto Auto Parts & Equipment 1.3% 1.3% Siemens AG Commercial & Residential Industrial Conglomerates 0.9% 1.0% Agilent Technologies, Inc. Life Sciences Life Sciences Tools & Services 0.9% 0.9% Source: BofA Merrill Lynch Global Research. BofAML Thematic stock lists are not a recommended list either individually or as a group of stocks.
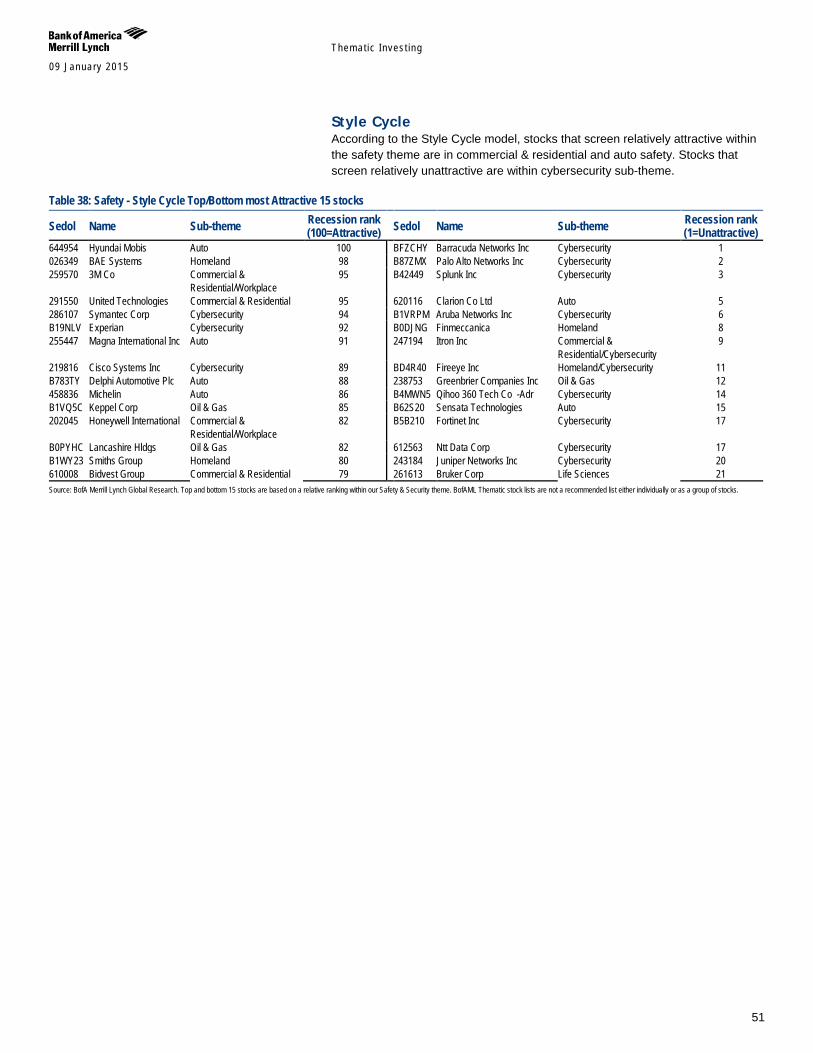
Themat ic Inves t ing 09 January 2015
51
Style Cycle According to the Style Cycle model, stocks that screen relatively attractive within the safety theme are in commercial & residential and auto safety. Stocks that screen relatively unattractive are within cybersecurity sub-theme.
Table 38: Safety - Style Cycle Top/Bottom most Attractive 15 stocks
Sedol Name Sub-theme Recession rank (100=Attractive) Sedol Name Sub-theme Recession rank
(1=Unattractive) 644954 Hyundai Mobis Auto 100 BFZCHY Barracuda Networks Inc Cybersecurity 1 026349 BAE Systems Homeland 98 B87ZMX Palo Alto Networks Inc Cybersecurity 2 259570 3M Co Commercial &
Residential/Workplace 95 B42449 Splunk Inc Cybersecurity 3
291550 United Technologies Commercial & Residential 95 620116 Clarion Co Ltd Auto 5 286107 Symantec Corp Cybersecurity 94 B1VRPM Aruba Networks Inc Cybersecurity 6 B19NLV Experian Cybersecurity 92 B0DJNG Finmeccanica Homeland 8 255447 Magna International Inc Auto 91 247194 Itron Inc Commercial &
Residential/Cybersecurity 9
219816 Cisco Systems Inc Cybersecurity 89 BD4R40 Fireeye Inc Homeland/Cybersecurity 11 B783TY Delphi Automotive Plc Auto 88 238753 Greenbrier Companies Inc Oil & Gas 12 458836 Michelin Auto 86 B4MWN5 Qihoo 360 Tech Co -Adr Cybersecurity 14 B1VQ5C Keppel Corp Oil & Gas 85 B62S20 Sensata Technologies Auto 15 202045 Honeywell International Commercial &
Residential/Workplace 82 B5B210 Fortinet Inc Cybersecurity 17
B0PYHC Lancashire Hldgs Oil & Gas 82 612563 Ntt Data Corp Cybersecurity 17 B1WY23 Smiths Group Homeland 80 243184 Juniper Networks Inc Cybersecurity 20 610008 Bidvest Group Commercial & Residential 79 261613 Bruker Corp Life Sciences 21 Source: BofA Merrill Lynch Global Research. Top and bottom 15 stocks are based on a relative ranking within our Safety & Security theme. BofAML Thematic stock lists are not a recommended list either individually or as a group of stocks.

Themat ic Inves t ing 09 January 2015
52
Waste - No time to waste A Transforming World thematic impacts: Earth, Government, Innovation Global waste crisis - Poor waste management is a global reality, with only 25% of the 11bn tonnes collected annually recycled or recovered – and 3.5 bn people lacking access to basic waste management services. The situation will get worse with waste volumes growing faster than urbanisation rates and GDP growth – and waste volumes set to double to 2025 (vs. 2005), and double again from 2025-50.
US$1tn+ market today - Waste management is a US$1tn market today that includes municipal solid waste (MSW), industrial waste, waste-to-energy (WtE), and sustainable packaging, among other areas. Growth drivers are increasing volumes, changing variety and complexity of waste streams, urbanisation, income growth (GDP-waste link), reducing environmental and social risks and costs, resource scarcity, commodity prices, growing private sector involvement, stakeholder pressure, and tightening regulation.
From “trash to cash” - We are seeing a shift away from waste as a mandatory public service to waste management as a sustainable business opportunity. We see the fastest growth in the next decade coming from diversion, recycling, recovery of valuable secondary raw materials, waste-to-energy, e-waste, and sustainable packaging – as well as from EMs. We see considerable low hanging fruit potential given that 70%+ of global waste is currently landfilled. “Greening” waste management will require increasing MSW recycling by a factor of 3.5x and doubling industrial waste recycling.
Multiple entry points for US$2tn market (2020E) - We believe that the global dynamics of waste management mean that the sector offers numerous growth opportunities for those with exposure to the value chain. By 2020, we estimate that the waste industry could be worth up to US$2tn, with Europe facing the toughest strategic challenges, and Asia and South America seeing the fastest growth. We see opportunities across waste management, industrial treatment, WtE, wastewater & sewage, E&C, recycling, and sustainable packaging among other areas.
Thematic Investing: No time to waste - global waste primer 05 April 2013
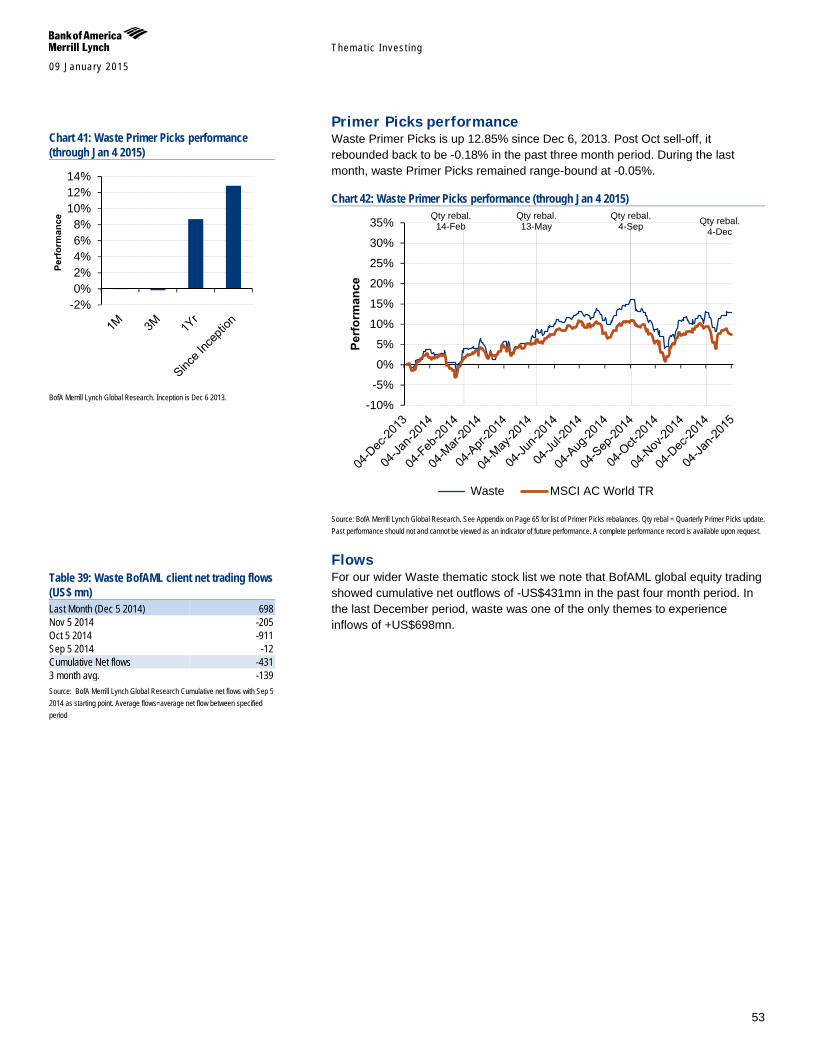
Themat ic Inves t ing 09 January 2015
53
Primer Picks performance Waste Primer Picks is up 12.85% since Dec 6, 2013. Post Oct sell-off, it rebounded back to be -0.18% in the past three month period. During the last month, waste Primer Picks remained range-bound at -0.05%.
Chart 42: Waste Primer Picks performance (through Jan 4 2015)
Source: BofA Merrill Lynch Global Research. See Appendix on Page 65 for list of Primer Picks rebalances. Qty rebal = Quarterly Primer Picks update. Past performance should not and cannot be viewed as an indicator of future performance. A complete performance record is available upon request.
Flows For our wider Waste thematic stock list we note that BofAML global equity trading showed cumulative net outflows of -US$431mn in the past four month period. In the last December period, waste was one of the only themes to experience inflows of +US$698mn.
Qty rebal. 14-Feb
Qty rebal. 13-May
Qty rebal. 4-Sep Qty rebal.
4-Dec
-10%
-5%
0%
5%
10%
15%
20%
25%
30%
35%
Perf
orm
ance
Waste MSCI AC World TR
Chart 41: Waste Primer Picks performance (through Jan 4 2015)
BofA Merrill Lynch Global Research. Inception is Dec 6 2013.
Table 39: Waste BofAML client net trading flows (US$ mn) Last Month (Dec 5 2014) 698 Nov 5 2014 -205 Oct 5 2014 -911 Sep 5 2014 -12 Cumulative Net flows -431 3 month avg. -139 Source: BofA Merrill Lynch Global Research Cumulative net flows with Sep 5 2014 as starting point. Average flows=average net flow between specified period
-2%0%2%4%6%8%
10%12%14%
Perf
orm
ance
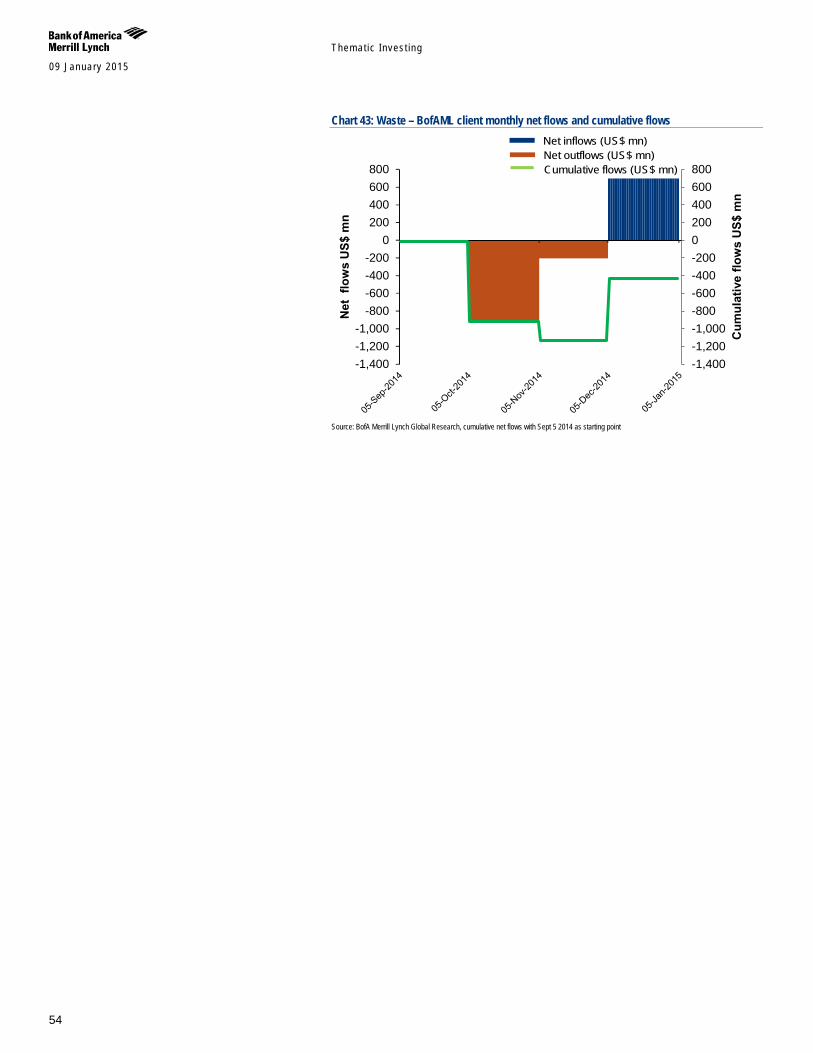
Themat ic Inves t ing 09 January 2015
54
Chart 43: Waste – BofAML client monthly net flows and cumulative flows
Source: BofA Merrill Lynch Global Research, cumulative net flows with Sept 5 2014 as starting point
-1,400-1,200-1,000-800-600-400-2000200400600800
-1,400-1,200-1,000
-800-600-400-200
0200400600800
Cum
ulat
ive
flow
s U
S$ m
n
Net
flo
ws
US$
mn
Net inflows (US$ mn)Net outflows (US$ mn)Cumulative flows (US$ mn)
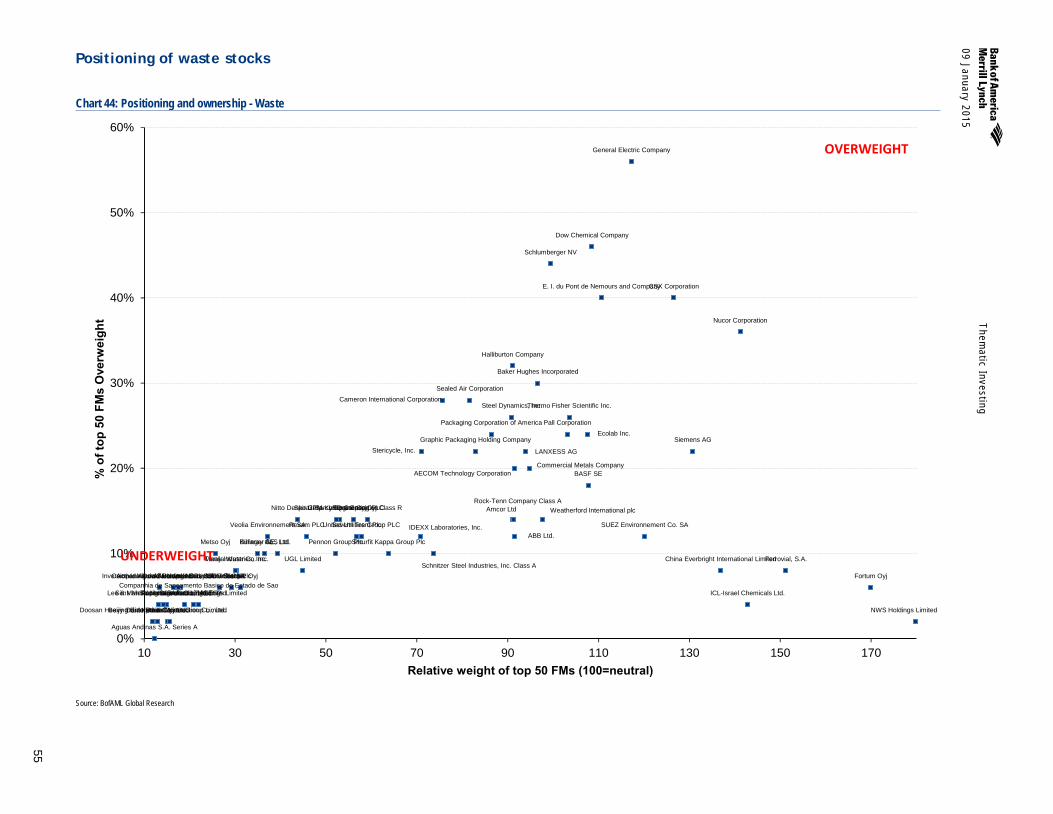
09 January 2015
Them
atic Investing
55
Positioning of waste stocks
Chart 44: Positioning and ownership - Waste
Source: BofAML Global Research
ABB Ltd.
Acciona SA
Actividades de Construccion y Servicios SA
AECOM Technology Corporation
Aguas Andinas S.A. Series A
Inversiones Aguas Metropolitanas S.A. Alfa Laval AB
ALS Ltd.
Amcor Ltd
Baker Hughes Incorporated
BASF SE
Bilfinger SE
Beijing Enterprises Water Group Limited
Cameron International Corporation
China Everbright International Limited
Commercial Metals Company
Companhia de Saneamento de Minas Gerais
CSX Corporation
Daido Steel Co., Ltd.
Daiseki Co., Ltd.
Doosan Heavy Industries & Construction Co., Ltd.
Dow Chemical Company
Dowa Holdings Co., Ltd. DS Smith Plc
E. I. du Pont de Nemours and Company
Ecolab Inc.
Ferrovial, S.A.
Fortum Oyj
General Electric Company
Graphic Packaging Holding Company
Halliburton Company
ICL-Israel Chemicals Ltd.
IDEXX Laboratories, Inc.
Kemira Oyj
Kuraray Co., Ltd.
LANXESS AG
Lee & Man Paper Manufacturing Limited
LKQ Corporation
Manila Water Co. Inc.
Metso Oyj
Mondi Limited
Nitto Denko Corp.
Nucor Corporation
NWS Holdings Limited
Outotec Oyj
Packaging Corporation of America Pall Corporation
Pennon Group Plc
Rexam PLC
Rentokil Initial plc
Rock-Tenn Company Class A
Companhia de Saneamento Basico do Estado de Sao Paulo SABESP
Schlumberger NV
Schnitzer Steel Industries, Inc. Class A
Sealed Air Corporation
Severn Trent Plc
Shanghai Industrial Holdings Limited
Siemens AG
Sims Metal Management Limited
Smurfit Kappa Group Plc
Spirax-Sarco Engineering PLC
Steel Dynamics, Inc.
Stericycle, Inc.
Stora Enso Oyj Class R
SUEZ Environnement Co. SA
Thermo Fisher Scientific Inc.
Toray Industries, Inc. UGL Limited
United Utilities Group PLC
UPM-Kymmene Oyj
Veolia Environnement SA
Weatherford International plc
0%
10%
20%
30%
40%
50%
60%
10 30 50 70 90 110 130 150 170
% o
f top
50
FMs
Ove
rwei
ght
Relative weight of top 50 FMs (100=neutral)
UNDERWEIGHT
OVERWEIGHT
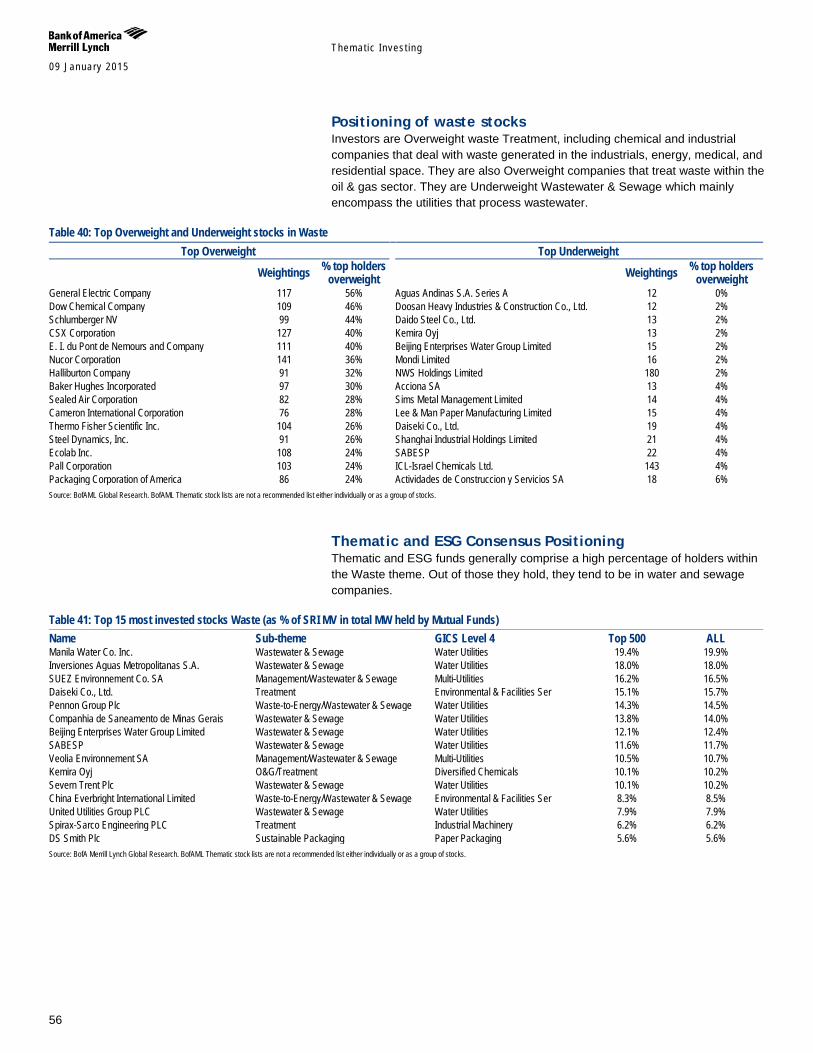
Themat ic Inves t ing 09 January 2015
56
Positioning of waste stocks Investors are Overweight waste Treatment, including chemical and industrial companies that deal with waste generated in the industrials, energy, medical, and residential space. They are also Overweight companies that treat waste within the oil & gas sector. They are Underweight Wastewater & Sewage which mainly encompass the utilities that process wastewater.
Table 40: Top Overweight and Underweight stocks in Waste Top Overweight Top Underweight
Weightings % top holders overweight Weightings % top holders
overweight General Electric Company 117 56% Aguas Andinas S.A. Series A 12 0% Dow Chemical Company 109 46% Doosan Heavy Industries & Construction Co., Ltd. 12 2% Schlumberger NV 99 44% Daido Steel Co., Ltd. 13 2% CSX Corporation 127 40% Kemira Oyj 13 2% E. I. du Pont de Nemours and Company 111 40% Beijing Enterprises Water Group Limited 15 2% Nucor Corporation 141 36% Mondi Limited 16 2% Halliburton Company 91 32% NWS Holdings Limited 180 2% Baker Hughes Incorporated 97 30% Acciona SA 13 4% Sealed Air Corporation 82 28% Sims Metal Management Limited 14 4% Cameron International Corporation 76 28% Lee & Man Paper Manufacturing Limited 15 4% Thermo Fisher Scientific Inc. 104 26% Daiseki Co., Ltd. 19 4% Steel Dynamics, Inc. 91 26% Shanghai Industrial Holdings Limited 21 4% Ecolab Inc. 108 24% SABESP 22 4% Pall Corporation 103 24% ICL-Israel Chemicals Ltd. 143 4% Packaging Corporation of America 86 24% Actividades de Construccion y Servicios SA 18 6% Source: BofAML Global Research. BofAML Thematic stock lists are not a recommended list either individually or as a group of stocks.
Thematic and ESG Consensus Positioning Thematic and ESG funds generally comprise a high percentage of holders within the Waste theme. Out of those they hold, they tend to be in water and sewage companies.
Table 41: Top 15 most invested stocks Waste (as % of SRI MV in total MW held by Mutual Funds) Name Sub-theme GICS Level 4 Top 500 ALL Manila Water Co. Inc. Wastewater & Sewage Water Utilities 19.4% 19.9% Inversiones Aguas Metropolitanas S.A. Wastewater & Sewage Water Utilities 18.0% 18.0% SUEZ Environnement Co. SA Management/Wastewater & Sewage Multi-Utilities 16.2% 16.5% Daiseki Co., Ltd. Treatment Environmental & Facilities Ser 15.1% 15.7% Pennon Group Plc Waste-to-Energy/Wastewater & Sewage Water Utilities 14.3% 14.5% Companhia de Saneamento de Minas Gerais Wastewater & Sewage Water Utilities 13.8% 14.0% Beijing Enterprises Water Group Limited Wastewater & Sewage Water Utilities 12.1% 12.4% SABESP Wastewater & Sewage Water Utilities 11.6% 11.7% Veolia Environnement SA Management/Wastewater & Sewage Multi-Utilities 10.5% 10.7% Kemira Oyj O&G/Treatment Diversified Chemicals 10.1% 10.2% Severn Trent Plc Wastewater & Sewage Water Utilities 10.1% 10.2% China Everbright International Limited Waste-to-Energy/Wastewater & Sewage Environmental & Facilities Ser 8.3% 8.5% United Utilities Group PLC Wastewater & Sewage Water Utilities 7.9% 7.9% Spirax-Sarco Engineering PLC Treatment Industrial Machinery 6.2% 6.2% DS Smith Plc Sustainable Packaging Paper Packaging 5.6% 5.6% Source: BofA Merrill Lynch Global Research. BofAML Thematic stock lists are not a recommended list either individually or as a group of stocks.
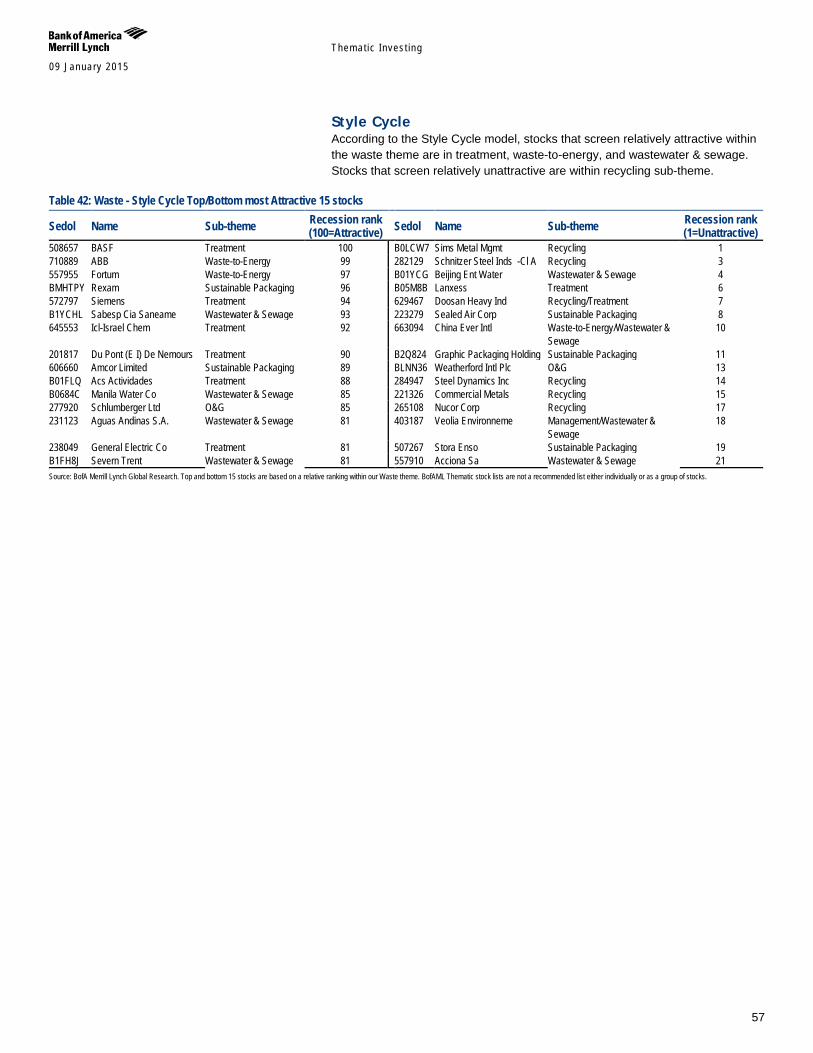
Themat ic Inves t ing 09 January 2015
57
Style Cycle According to the Style Cycle model, stocks that screen relatively attractive within the waste theme are in treatment, waste-to-energy, and wastewater & sewage. Stocks that screen relatively unattractive are within recycling sub-theme.
Table 42: Waste - Style Cycle Top/Bottom most Attractive 15 stocks
Sedol Name Sub-theme Recession rank (100=Attractive) Sedol Name Sub-theme Recession rank
(1=Unattractive) 508657 BASF Treatment 100 B0LCW7 Sims Metal Mgmt Recycling 1 710889 ABB Waste-to-Energy 99 282129 Schnitzer Steel Inds -Cl A Recycling 3 557955 Fortum Waste-to-Energy 97 B01YCG Beijing Ent Water Wastewater & Sewage 4 BMHTPY Rexam Sustainable Packaging 96 B05M8B Lanxess Treatment 6 572797 Siemens Treatment 94 629467 Doosan Heavy Ind Recycling/Treatment 7 B1YCHL Sabesp Cia Saneame Wastewater & Sewage 93 223279 Sealed Air Corp Sustainable Packaging 8 645553 Icl-Israel Chem Treatment 92 663094 China Ever Intl Waste-to-Energy/Wastewater &
Sewage 10
201817 Du Pont (E I) De Nemours Treatment 90 B2Q824 Graphic Packaging Holding Sustainable Packaging 11 606660 Amcor Limited Sustainable Packaging 89 BLNN36 Weatherford Intl Plc O&G 13 B01FLQ Acs Actividades Treatment 88 284947 Steel Dynamics Inc Recycling 14 B0684C Manila Water Co Wastewater & Sewage 85 221326 Commercial Metals Recycling 15 277920 Schlumberger Ltd O&G 85 265108 Nucor Corp Recycling 17 231123 Aguas Andinas S.A. Wastewater & Sewage 81 403187 Veolia Environneme Management/Wastewater &
Sewage 18
238049 General Electric Co Treatment 81 507267 Stora Enso Sustainable Packaging 19 B1FH8J Severn Trent Wastewater & Sewage 81 557910 Acciona Sa Wastewater & Sewage 21 Source: BofA Merrill Lynch Global Research. Top and bottom 15 stocks are based on a relative ranking within our Waste theme. BofAML Thematic stock lists are not a recommended list either individually or as a group of stocks.
Themat ic Inves t ing 09 January 2015
58
Water - Blue revolution A Transforming World thematic impacts: Earth, Government, Innovation Global water crisis - Water scarcity remains a global reality, with 768m people lacking access to clean drinking water and 2.5bn having no access to proper sanitation. Freshwater accounts for only 2.5% of global water – and we have already reached peak water. Increasing water demand, water pollution and water stress mean that demand is set to overshoot supply by 40% in the next 20Y.
A perfect storm is brewing, water is the 21st century oil - The WEF has recognised water as one of top-three global risks for 2014. Further, 50% of the world’s population will be living in conditions of “water stress” by 2030 and 40% in “severe water stress” by 2050. Globally, 45% of projected 2050 GDP is at risk and as many as 50 countries are potential locations for conflicts over water. Given how closely food, water and energy security are connected, an impending “perfect storm” of events appears to be looming for the food and energy sectors, in a world constrained by Climate Change & Extreme Weather.
Investors need to go blue, US$600bn market & 7%+ CAGR - Water is a US$600bn market today, which is delivering a CAGR of 7%, well above global growth rates. The S&P Global Water index has delivered a 10.4% annualised performance over 10Y, and outperformed the market as well as benchmark gold, and oil & gas indices on a 1Y, 3Y, 5Y and 10Y basis. We see the fastest 3-5Y growth coming from the lowest-hanging fruits (water treatment and recycling), countries incentivising private sector actors (Brazil, China, the US), the more “crop per drop” theme, smart metering and “big data”/technology-based solutions, and water-friendly forms of energy (wind and solar).
Four entry points for investors, US$1tn market (2020E) - We have mapped efforts to tackle the global dynamics of water supply and demand to highlight four entry points for investors wishing to play the “Blue Revolution” theme: 1) Treatment; 2) Management; 3) Infrastructure & Supply; and 4) Water-friendly Energy. We believe these entry points will represent a combined US$1tn+ market by 2020.
Thematic Investing: Blue Revolution - global water primer - 4 April 2014
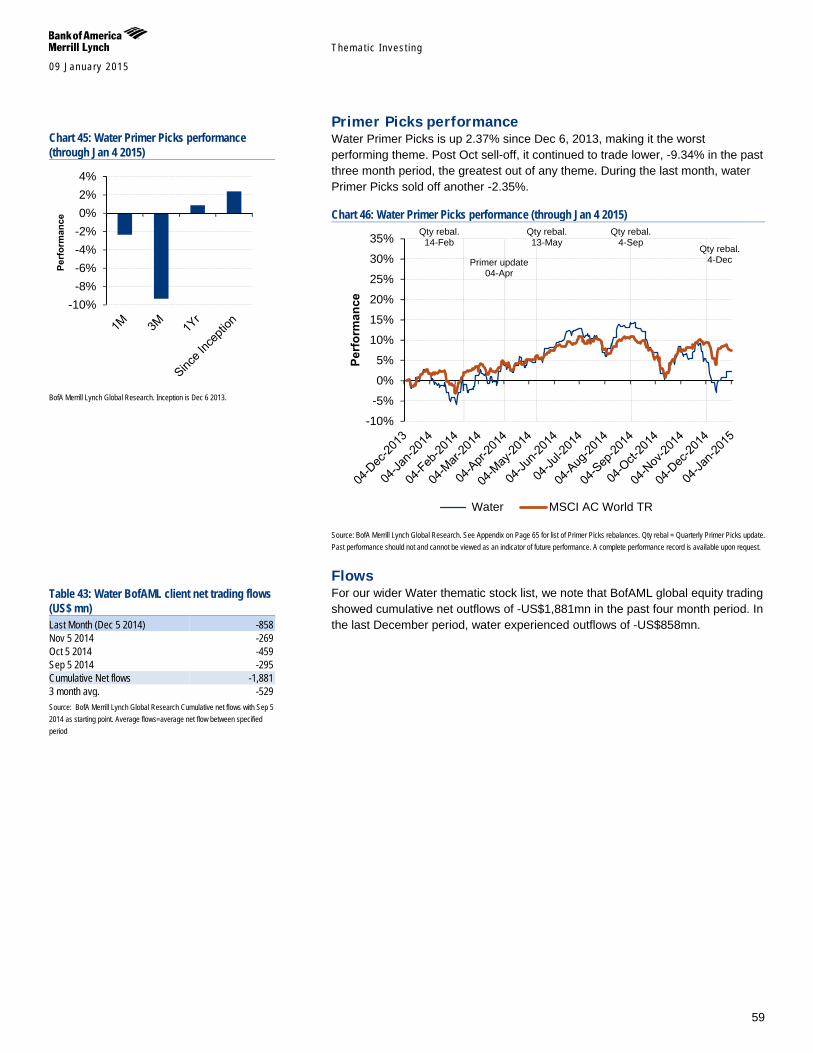
Themat ic Inves t ing 09 January 2015
59
Primer Picks performance Water Primer Picks is up 2.37% since Dec 6, 2013, making it the worst performing theme. Post Oct sell-off, it continued to trade lower, -9.34% in the past three month period, the greatest out of any theme. During the last month, water Primer Picks sold off another -2.35%.
Chart 46: Water Primer Picks performance (through Jan 4 2015)
Source: BofA Merrill Lynch Global Research. See Appendix on Page 65 for list of Primer Picks rebalances. Qty rebal = Quarterly Primer Picks update. Past performance should not and cannot be viewed as an indicator of future performance. A complete performance record is available upon request.
Flows For our wider Water thematic stock list, we note that BofAML global equity trading showed cumulative net outflows of -US$1,881mn in the past four month period. In the last December period, water experienced outflows of -US$858mn.
Qty rebal. 14-Feb
Primer update 04-Apr
Qty rebal. 13-May
Qty rebal. 4-Sep
Qty rebal. 4-Dec
-10%
-5%
0%
5%
10%
15%
20%
25%
30%
35%
Perf
orm
ance
Water MSCI AC World TR
Chart 45: Water Primer Picks performance (through Jan 4 2015)
BofA Merrill Lynch Global Research. Inception is Dec 6 2013.
Table 43: Water BofAML client net trading flows (US$ mn) Last Month (Dec 5 2014) -858 Nov 5 2014 -269 Oct 5 2014 -459 Sep 5 2014 -295 Cumulative Net flows -1,881 3 month avg. -529 Source: BofA Merrill Lynch Global Research Cumulative net flows with Sep 5 2014 as starting point. Average flows=average net flow between specified period
-10%-8%-6%-4%-2%0%2%4%
Perf
orm
ance
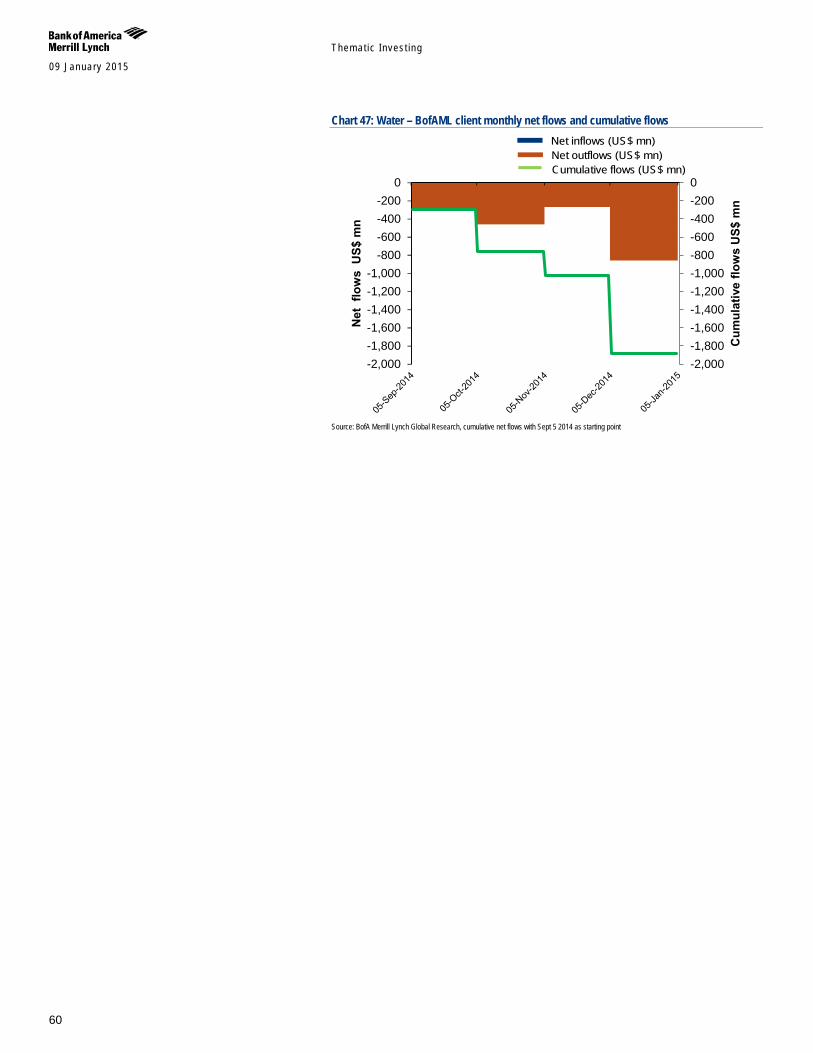
Themat ic Inves t ing 09 January 2015
60
Chart 47: Water – BofAML client monthly net flows and cumulative flows
Source: BofA Merrill Lynch Global Research, cumulative net flows with Sept 5 2014 as starting point
-2,000-1,800-1,600-1,400-1,200-1,000-800-600-400-2000
-2,000-1,800-1,600-1,400-1,200-1,000
-800-600-400-200
0
Cum
ulat
ive
flow
s U
S$ m
n
Net
flo
ws
US$
mn
Net inflows (US$ mn)Net outflows (US$ mn)Cumulative flows (US$ mn)
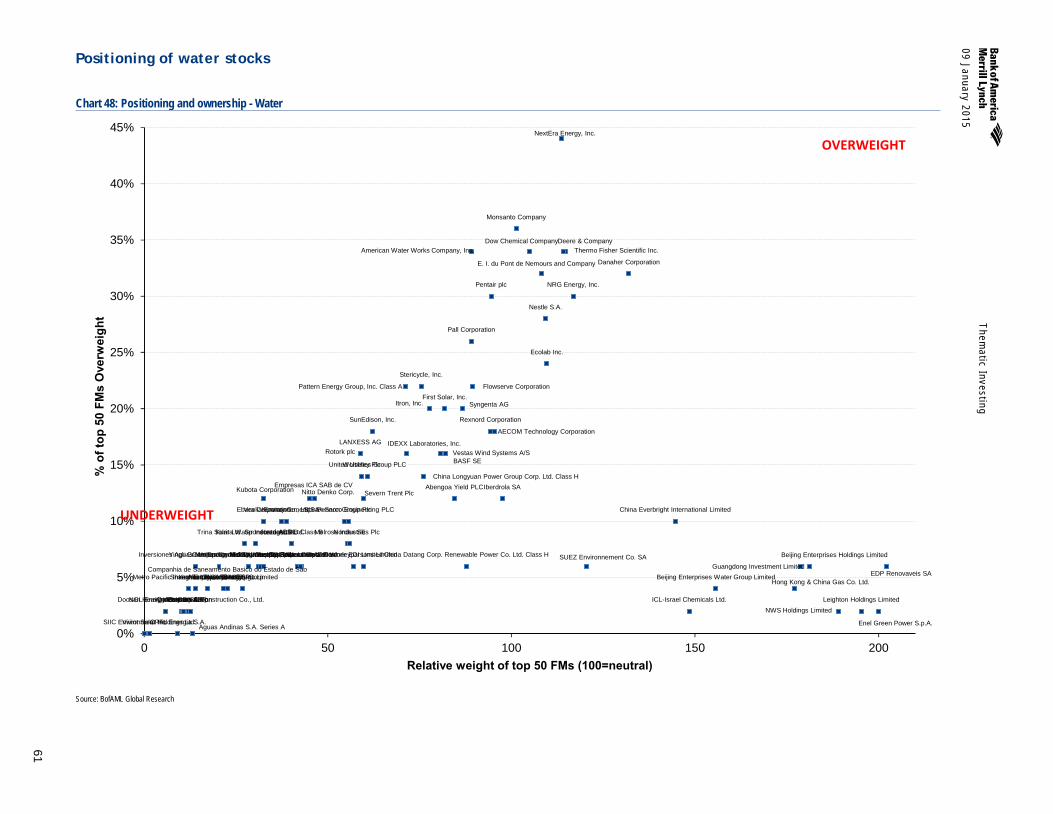
09 January 2015
Them
atic Investing
61
Positioning of water stocks
Chart 48: Positioning and ownership - Water
Source: BofAML Global Research
Abengoa Yield PLC
Acciona SA
AECOM Technology Corporation
Aguas Andinas S.A. Series A
Inversiones Aguas Metropolitanas S.A.
Alfa Laval AB
ALS Ltd.
American Water Works Company, Inc.
BASF SE
Beijing Enterprises Holdings Limited
Beijing Enterprises Water Group Limited
China Everbright International Limited
China Longyuan Power Group Corp. Ltd. Class H
Chiyoda Corp.
Companhia de Saneamento de Minas Gerais
CPFL Energia S.A.
Danaher Corporation
Danone SA ADR
China Datang Corp. Renewable Power Co. Ltd. Class H
Deere & Company
Doosan Heavy Industries & Construction Co., Ltd.
Dow Chemical Company
Downer EDI Limited
E. I. du Pont de Nemours and Company
Ebara Corporation
Ecolab Inc.
EDP Renovaveis SA
Empresas ICA SAB de CV
Enel Green Power S.p.A.
Enphase Energy, Inc.
First Solar, Inc. Flowserve Corporation
Guangdong Investment Limited
Hexagon AB Class B
Hong Kong & China Gas Co. Ltd.
Iberdrola SA
ICL-Israel Chemicals Ltd.
IDEXX Laboratories, Inc.
Itron, Inc.
Kemira Oyj
Keppel Corporation Limited
Kinden Corporation
Kubota Corporation
Kuraray Co., Ltd.
Kurita Water Industries Ltd.
LANXESS AG
Leighton Holdings Limited
Manila Water Co. Inc.
Melrose Industries Plc
Metro Pacific Investments Corporation
Monsanto Company
Nestle S.A.
NextEra Energy, Inc.
NGL Energy Partners LP
Nitto Denko Corp.
Nordex SE
NRG Energy, Inc.
NWS Holdings Limited
Outotec Oyj
Pall Corporation
Pattern Energy Group, Inc. Class A
Pennon Group Plc
Pentair plc
Rexnord Corporation
Rotork plc
Companhia de Saneamento Basico do Estado de Sao Paulo SABESP
Severn Trent Plc
Shanghai Industrial Holdings Limited
SIIC Environment Holdings Ltd.
SolarCity Corp.
Spirax-Sarco Engineering PLC
Stericycle, Inc.
SUEZ Environnement Co. SA
SunEdison, Inc.
SunPower Corporation
Syngenta AG
Thermo Fisher Scientific Inc.
Toray Industries, Inc.
Trina Solar Ltd. Sponsored ADR
UGL Limited
United Utilities Group PLC
Veolia Environnement SA
Vestas Wind Systems A/S
Vivint Solar Inc
Voltas Limited
Wolseley Plc
Worleyparsons Limited Yingli Green Energy Holding Co. Ltd. Sponsored ADR
0%
5%
10%
15%
20%
25%
30%
35%
40%
45%
0 50 100 150 200
% o
f top
50
FMs
Ove
rwei
ght
Relative weight of top 50 FMs (100=neutral)
UNDERWEIGHT
OVERWEIGHT
Themat ic Inves t ing 09 January 2015
62
Positioning of water stocks Investors are Overweight water Treatment – wastewater, desalination, PV solar, bottled water, and TIC, and Management – drought resistant seeds, irrigation, precision agriculture, smart metering. They are Underweight makers of water equipment like Pipes, Pumps & Valves.
Table 44: Top Overweight and Underweight stocks in Water Top Overweight Top Underweight
Weightings % top holders
overweight Weightings
% top holders
overweight
NextEra Energy, Inc. 114 44% Vivint Solar Inc 0 0% Monsanto Company 101 36% SIIC Environment Holdings Ltd. 1 0% Deere & Company 115 34% CPFL Energia S.A. 9 0% Thermo Fisher Scientific Inc. 114 34% Aguas Andinas S.A. Series A 13 0% Dow Chemical Company 105 34% NGL Energy Partners LP 6 2% American Water Works Company, Inc. 89 34% Acciona SA 10 2% Danaher Corporation 132 32% Danone SA ADR 10 2% E. I. du Pont de Nemours and Company 108 32% Kinden Corporation 11 2% NRG Energy, Inc. 117 30% Chiyoda Corp. 12 2% Pentair plc 94 30% Doosan Heavy Industries & Construction Co., Ltd. 13 2% Nestle S.A. 109 28% ICL-Israel Chemicals Ltd. 148 2% Pall Corporation 89 26% NWS Holdings Limited 189 2% Ecolab Inc. 110 24% Leighton Holdings Limited 195 2% Flowserve Corporation 89 22% Enel Green Power S.p.A. 200 2% Pattern Energy Group, Inc. Class A 71 22% Alfa Laval AB 17 4% Source: BofAML Global Research. BofAML Thematic stock lists are not a recommended list either individually or as a group of stocks.
Thematic and ESG Consensus Positioning Thematic and ESG funds generally comprise a high percentage of holders within the Water theme. Out of those they hold, they tend to be in water utilities.
Table 45: Top 15 most invested stocks Water (as % of SRI MV in total MW held by Mutual Funds) Name Sub-theme GICS Level 4 Top 500 ALL Trina Solar Ltd. Sponsored ADR Water-Friendly Energy Semiconductors 31.1% 32.8% Manila Water Co. Inc. Utilities Water Utilities 19.4% 19.9% Inversiones Aguas Metropolitanas S.A. Utilities Water Utilities 18.0% 18.0% SUEZ Environnement Co. SA Utilities Multi-Utilities 16.2% 16.5% EDP Renovaveis SA Water-Friendly Energy Renewable Electricity 16.0% 16.4% Pennon Group Plc Utilities Water Utilities 14.3% 14.5% Companhia de Saneamento de Minas Gerais Utilities Water Utilities 13.8% 14.0% Beijing Enterprises Water Group Limited Treatment/Utilities Water Utilities 12.1% 12.4% Ebara Corporation Pipes, pumps & valves Industrial Machinery 11.9% 12.0% SABESP Utilities Water Utilities 11.6% 11.7% Guangdong Investment Limited Utilities Water Utilities 11.5% 11.6% Enel Green Power S.p.A. Water-Friendly Energy Renewable Electricity 11.3% 11.6% Veolia Environnement SA Utilities Multi-Utilities 10.5% 10.7% Kemira Oyj Treatment Diversified Chemicals 10.1% 10.2% Severn Trent Plc Utilities Water Utilities 10.1% 10.2% Source: BofA Merrill Lynch Global Research. BofAML Thematic stock lists are not a recommended list either individually or as a group of stocks.
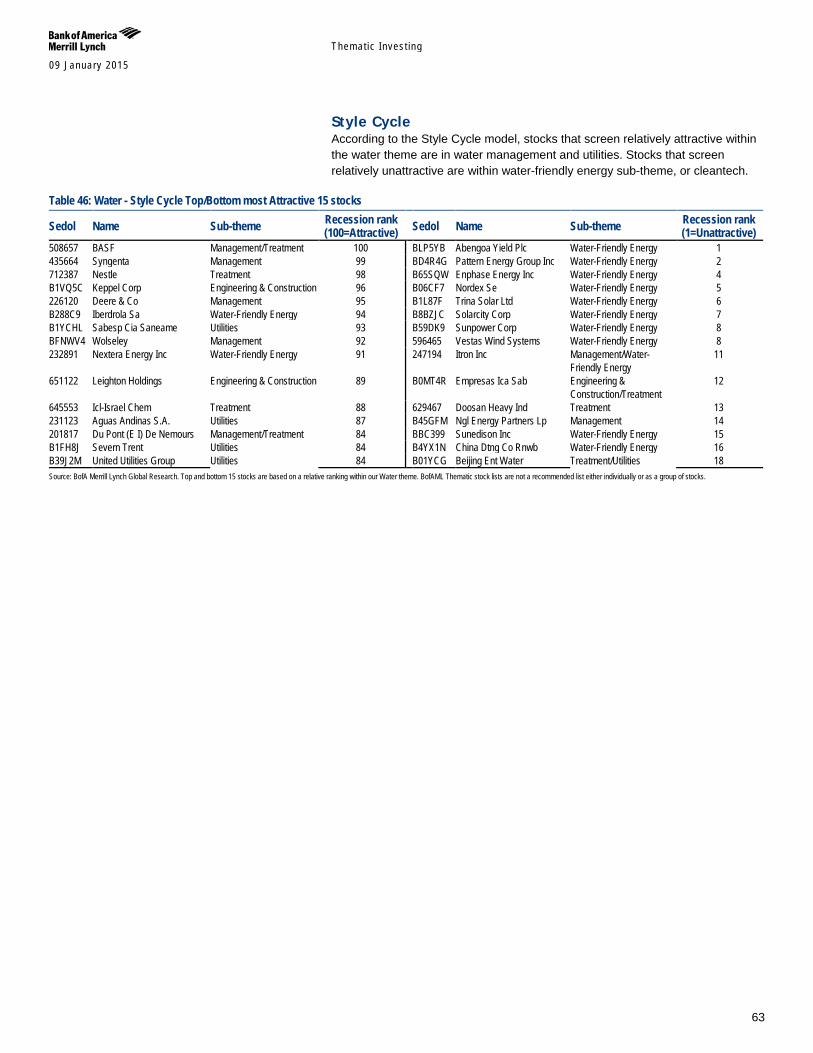
Themat ic Inves t ing 09 January 2015
63
Style Cycle According to the Style Cycle model, stocks that screen relatively attractive within the water theme are in water management and utilities. Stocks that screen relatively unattractive are within water-friendly energy sub-theme, or cleantech.
Table 46: Water - Style Cycle Top/Bottom most Attractive 15 stocks
Sedol Name Sub-theme Recession rank (100=Attractive) Sedol Name Sub-theme Recession rank
(1=Unattractive) 508657 BASF Management/Treatment 100 BLP5YB Abengoa Yield Plc Water-Friendly Energy 1 435664 Syngenta Management 99 BD4R4G Pattern Energy Group Inc Water-Friendly Energy 2 712387 Nestle Treatment 98 B65SQW Enphase Energy Inc Water-Friendly Energy 4 B1VQ5C Keppel Corp Engineering & Construction 96 B06CF7 Nordex Se Water-Friendly Energy 5 226120 Deere & Co Management 95 B1L87F Trina Solar Ltd Water-Friendly Energy 6 B288C9 Iberdrola Sa Water-Friendly Energy 94 B8BZJC Solarcity Corp Water-Friendly Energy 7 B1YCHL Sabesp Cia Saneame Utilities 93 B59DK9 Sunpower Corp Water-Friendly Energy 8 BFNWV4 Wolseley Management 92 596465 Vestas Wind Systems Water-Friendly Energy 8 232891 Nextera Energy Inc Water-Friendly Energy 91 247194 Itron Inc Management/Water-
Friendly Energy 11
651122 Leighton Holdings Engineering & Construction 89 B0MT4R Empresas Ica Sab Engineering & Construction/Treatment
12
645553 Icl-Israel Chem Treatment 88 629467 Doosan Heavy Ind Treatment 13 231123 Aguas Andinas S.A. Utilities 87 B45GFM Ngl Energy Partners Lp Management 14 201817 Du Pont (E I) De Nemours Management/Treatment 84 BBC399 Sunedison Inc Water-Friendly Energy 15 B1FH8J Severn Trent Utilities 84 B4YX1N China Dtng Co Rnwb Water-Friendly Energy 16 B39J2M United Utilities Group Utilities 84 B01YCG Beijing Ent Water Treatment/Utilities 18 Source: BofA Merrill Lynch Global Research. Top and bottom 15 stocks are based on a relative ranking within our Water theme. BofAML Thematic stock lists are not a recommended list either individually or as a group of stocks.
Themat ic Inves t ing 09 January 2015
64
Methodology Appendix Thematic Investing Stock Lists & Primer Picks We have previously created a BofA Merrill Lynch Global Research list of stocks which have exposure to our equity themes – Climate Change & Extreme Weather, Education, Energy Efficiency, Longevity, Obesity and Health & Wellness, Safety & Security, Waste, and Water. They lists are part of BofAML Thematic Investing Stocks Lists.
For each Stock List, we have a subset called Primer Picks, which have “material” - either High or Medium -- exposure to the relevant theme, and have a Buy rating by the fundamental analyst. The Stock Lists and Primer Picks are in a document called theme Primer Picks. Thematic Investing Primers and their accompanying thematic Primer Picks are updated together. We update the full universe of all Thematic Investing Stock Lists and Primer Picks simultaneously on a quarterly basis and announced through a published research report – A Transforming World - Quarterly Primer Picks. We show a representation of performance based on the Primer Picks.
Performance representation methodology Each Thematic Investing Primer Picks list is equal-weighted, with rebalancing each time we publish an update. Updates are both the A Transforming World - Quarterly Primer Picks as well as the Primer Picks that are published when each theme is updated. The performance of any individual security on the list is its percentage change in price, including dividends [(End Price – Begin Price)/Begin Price.] Dividends and corporate actions are credited when the stock goes ex-dividend. The performance does not does not reflect transaction costs. If such cost were reflected the performance would have been lower.
Price at which the rebalance occurs is the end-of-day price on the T + 1 date from publication. Stocks that are no longer covered, or are no longer Buy rated or become restricted are taken into account and removed at the next quarterly or theme update. In the same manner, stocks that are added for reasons such as change in restriction, new research initiation, etc. can only occur when the Primer Picks list is updated.
We assume 0% tax rate. The actual tax rate for investors will be dependent on several factors such as the country of domicile of the company, country in which the stock in listed, country of company operations, as well as country in which the investor is based. Investors should consult their own tax circumstances to gauge exact performance.
Seven themes - Education, Energy Efficiency, Climate Change & Extreme Weather, Obesity and Health & Wellness, Safety & Security, Waste, and Water – have a base value of 100 starting at December 6 2013, which is the T + 1 date from when the Quarterly Primer Picks product was introduced. Prior to that, each Primer Picks list was maintained and published separately. Longevity theme was introduced on June 6 2014, which is less than 12months, hence we cannot show performance at the moment.
The indicative performance of the BofAML themes is calculated by the BofA Merrill Lynch Research group.
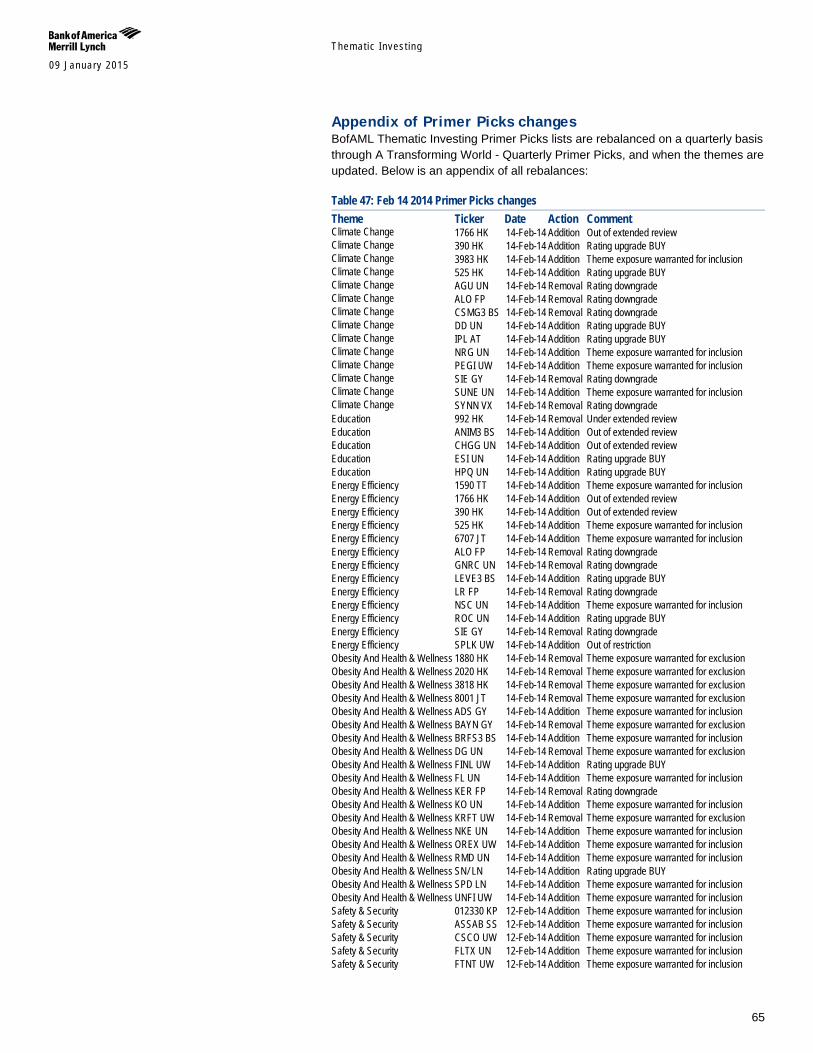
Themat ic Inves t ing 09 January 2015
65
Appendix of Primer Picks changes BofAML Thematic Investing Primer Picks lists are rebalanced on a quarterly basis through A Transforming World - Quarterly Primer Picks, and when the themes are updated. Below is an appendix of all rebalances:
Table 47: Feb 14 2014 Primer Picks changes Theme Ticker Date Action Comment Climate Change 1766 HK 14-Feb-14 Addition Out of extended review Climate Change 390 HK 14-Feb-14 Addition Rating upgrade BUY Climate Change 3983 HK 14-Feb-14 Addition Theme exposure warranted for inclusion Climate Change 525 HK 14-Feb-14 Addition Rating upgrade BUY Climate Change AGU UN 14-Feb-14 Removal Rating downgrade Climate Change ALO FP 14-Feb-14 Removal Rating downgrade Climate Change CSMG3 BS 14-Feb-14 Removal Rating downgrade Climate Change DD UN 14-Feb-14 Addition Rating upgrade BUY Climate Change IPL AT 14-Feb-14 Addition Rating upgrade BUY Climate Change NRG UN 14-Feb-14 Addition Theme exposure warranted for inclusion Climate Change PEGI UW 14-Feb-14 Addition Theme exposure warranted for inclusion Climate Change SIE GY 14-Feb-14 Removal Rating downgrade Climate Change SUNE UN 14-Feb-14 Addition Theme exposure warranted for inclusion Climate Change SYNN VX 14-Feb-14 Removal Rating downgrade Education 992 HK 14-Feb-14 Removal Under extended review Education ANIM3 BS 14-Feb-14 Addition Out of extended review Education CHGG UN 14-Feb-14 Addition Out of extended review Education ESI UN 14-Feb-14 Addition Rating upgrade BUY Education HPQ UN 14-Feb-14 Addition Rating upgrade BUY Energy Efficiency 1590 TT 14-Feb-14 Addition Theme exposure warranted for inclusion Energy Efficiency 1766 HK 14-Feb-14 Addition Out of extended review Energy Efficiency 390 HK 14-Feb-14 Addition Out of extended review Energy Efficiency 525 HK 14-Feb-14 Addition Theme exposure warranted for inclusion Energy Efficiency 6707 JT 14-Feb-14 Addition Theme exposure warranted for inclusion Energy Efficiency ALO FP 14-Feb-14 Removal Rating downgrade Energy Efficiency GNRC UN 14-Feb-14 Removal Rating downgrade Energy Efficiency LEVE3 BS 14-Feb-14 Addition Rating upgrade BUY Energy Efficiency LR FP 14-Feb-14 Removal Rating downgrade Energy Efficiency NSC UN 14-Feb-14 Addition Theme exposure warranted for inclusion Energy Efficiency ROC UN 14-Feb-14 Addition Rating upgrade BUY Energy Efficiency SIE GY 14-Feb-14 Removal Rating downgrade Energy Efficiency SPLK UW 14-Feb-14 Addition Out of restriction Obesity And Health & Wellness 1880 HK 14-Feb-14 Removal Theme exposure warranted for exclusion Obesity And Health & Wellness 2020 HK 14-Feb-14 Removal Theme exposure warranted for exclusion Obesity And Health & Wellness 3818 HK 14-Feb-14 Removal Theme exposure warranted for exclusion Obesity And Health & Wellness 8001 JT 14-Feb-14 Removal Theme exposure warranted for exclusion Obesity And Health & Wellness ADS GY 14-Feb-14 Addition Theme exposure warranted for inclusion Obesity And Health & Wellness BAYN GY 14-Feb-14 Removal Theme exposure warranted for exclusion Obesity And Health & Wellness BRFS3 BS 14-Feb-14 Addition Theme exposure warranted for inclusion Obesity And Health & Wellness DG UN 14-Feb-14 Removal Theme exposure warranted for exclusion Obesity And Health & Wellness FINL UW 14-Feb-14 Addition Rating upgrade BUY Obesity And Health & Wellness FL UN 14-Feb-14 Addition Theme exposure warranted for inclusion Obesity And Health & Wellness KER FP 14-Feb-14 Removal Rating downgrade Obesity And Health & Wellness KO UN 14-Feb-14 Addition Theme exposure warranted for inclusion Obesity And Health & Wellness KRFT UW 14-Feb-14 Removal Theme exposure warranted for exclusion Obesity And Health & Wellness NKE UN 14-Feb-14 Addition Theme exposure warranted for inclusion Obesity And Health & Wellness OREX UW 14-Feb-14 Addition Theme exposure warranted for inclusion Obesity And Health & Wellness RMD UN 14-Feb-14 Addition Theme exposure warranted for inclusion Obesity And Health & Wellness SN/ LN 14-Feb-14 Addition Rating upgrade BUY Obesity And Health & Wellness SPD LN 14-Feb-14 Addition Theme exposure warranted for inclusion Obesity And Health & Wellness UNFI UW 14-Feb-14 Addition Theme exposure warranted for inclusion Safety & Security 012330 KP 12-Feb-14 Addition Theme exposure warranted for inclusion Safety & Security ASSAB SS 12-Feb-14 Addition Theme exposure warranted for inclusion Safety & Security CSCO UW 12-Feb-14 Addition Theme exposure warranted for inclusion Safety & Security FLTX UN 12-Feb-14 Addition Theme exposure warranted for inclusion Safety & Security FTNT UW 12-Feb-14 Addition Theme exposure warranted for inclusion
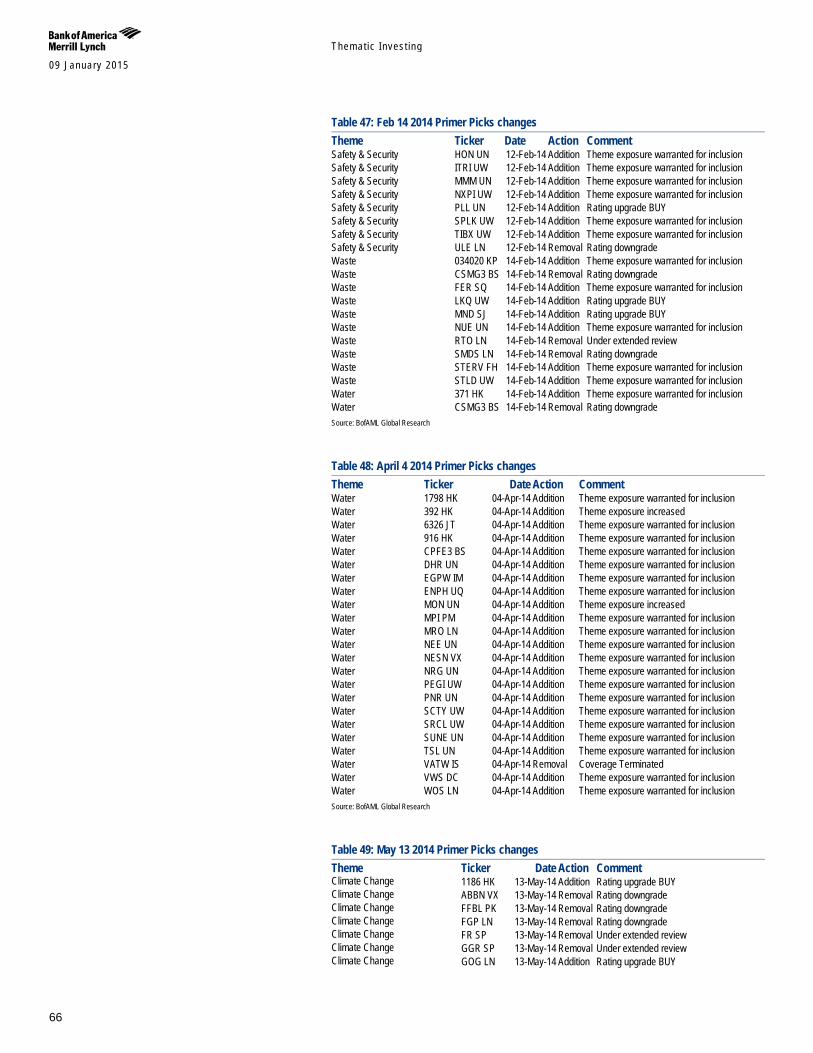
Themat ic Inves t ing 09 January 2015
66
Table 47: Feb 14 2014 Primer Picks changes Theme Ticker Date Action Comment Safety & Security HON UN 12-Feb-14 Addition Theme exposure warranted for inclusion Safety & Security ITRI UW 12-Feb-14 Addition Theme exposure warranted for inclusion Safety & Security MMM UN 12-Feb-14 Addition Theme exposure warranted for inclusion Safety & Security NXPI UW 12-Feb-14 Addition Theme exposure warranted for inclusion Safety & Security PLL UN 12-Feb-14 Addition Rating upgrade BUY Safety & Security SPLK UW 12-Feb-14 Addition Theme exposure warranted for inclusion Safety & Security TIBX UW 12-Feb-14 Addition Theme exposure warranted for inclusion Safety & Security ULE LN 12-Feb-14 Removal Rating downgrade Waste 034020 KP 14-Feb-14 Addition Theme exposure warranted for inclusion Waste CSMG3 BS 14-Feb-14 Removal Rating downgrade Waste FER SQ 14-Feb-14 Addition Theme exposure warranted for inclusion Waste LKQ UW 14-Feb-14 Addition Rating upgrade BUY Waste MND SJ 14-Feb-14 Addition Rating upgrade BUY Waste NUE UN 14-Feb-14 Addition Theme exposure warranted for inclusion Waste RTO LN 14-Feb-14 Removal Under extended review Waste SMDS LN 14-Feb-14 Removal Rating downgrade Waste STERV FH 14-Feb-14 Addition Theme exposure warranted for inclusion Waste STLD UW 14-Feb-14 Addition Theme exposure warranted for inclusion Water 371 HK 14-Feb-14 Addition Theme exposure warranted for inclusion Water CSMG3 BS 14-Feb-14 Removal Rating downgrade Source: BofAML Global Research
Table 48: April 4 2014 Primer Picks changes Theme Ticker Date Action Comment Water 1798 HK 04-Apr-14 Addition Theme exposure warranted for inclusion Water 392 HK 04-Apr-14 Addition Theme exposure increased Water 6326 JT 04-Apr-14 Addition Theme exposure warranted for inclusion Water 916 HK 04-Apr-14 Addition Theme exposure warranted for inclusion Water CPFE3 BS 04-Apr-14 Addition Theme exposure warranted for inclusion Water DHR UN 04-Apr-14 Addition Theme exposure warranted for inclusion Water EGPW IM 04-Apr-14 Addition Theme exposure warranted for inclusion Water ENPH UQ 04-Apr-14 Addition Theme exposure warranted for inclusion Water MON UN 04-Apr-14 Addition Theme exposure increased Water MPI PM 04-Apr-14 Addition Theme exposure warranted for inclusion Water MRO LN 04-Apr-14 Addition Theme exposure warranted for inclusion Water NEE UN 04-Apr-14 Addition Theme exposure warranted for inclusion Water NESN VX 04-Apr-14 Addition Theme exposure warranted for inclusion Water NRG UN 04-Apr-14 Addition Theme exposure warranted for inclusion Water PEGI UW 04-Apr-14 Addition Theme exposure warranted for inclusion Water PNR UN 04-Apr-14 Addition Theme exposure warranted for inclusion Water SCTY UW 04-Apr-14 Addition Theme exposure warranted for inclusion Water SRCL UW 04-Apr-14 Addition Theme exposure warranted for inclusion Water SUNE UN 04-Apr-14 Addition Theme exposure warranted for inclusion Water TSL UN 04-Apr-14 Addition Theme exposure warranted for inclusion Water VATW IS 04-Apr-14 Removal Coverage Terminated Water VWS DC 04-Apr-14 Addition Theme exposure warranted for inclusion Water WOS LN 04-Apr-14 Addition Theme exposure warranted for inclusion Source: BofAML Global Research
Table 49: May 13 2014 Primer Picks changes Theme Ticker Date Action Comment Climate Change 1186 HK 13-May-14 Addition Rating upgrade BUY Climate Change ABBN VX 13-May-14 Removal Rating downgrade Climate Change FFBL PK 13-May-14 Removal Rating downgrade Climate Change FGP LN 13-May-14 Removal Rating downgrade Climate Change FR SP 13-May-14 Removal Under extended review Climate Change GGR SP 13-May-14 Removal Under extended review Climate Change GOG LN 13-May-14 Addition Rating upgrade BUY
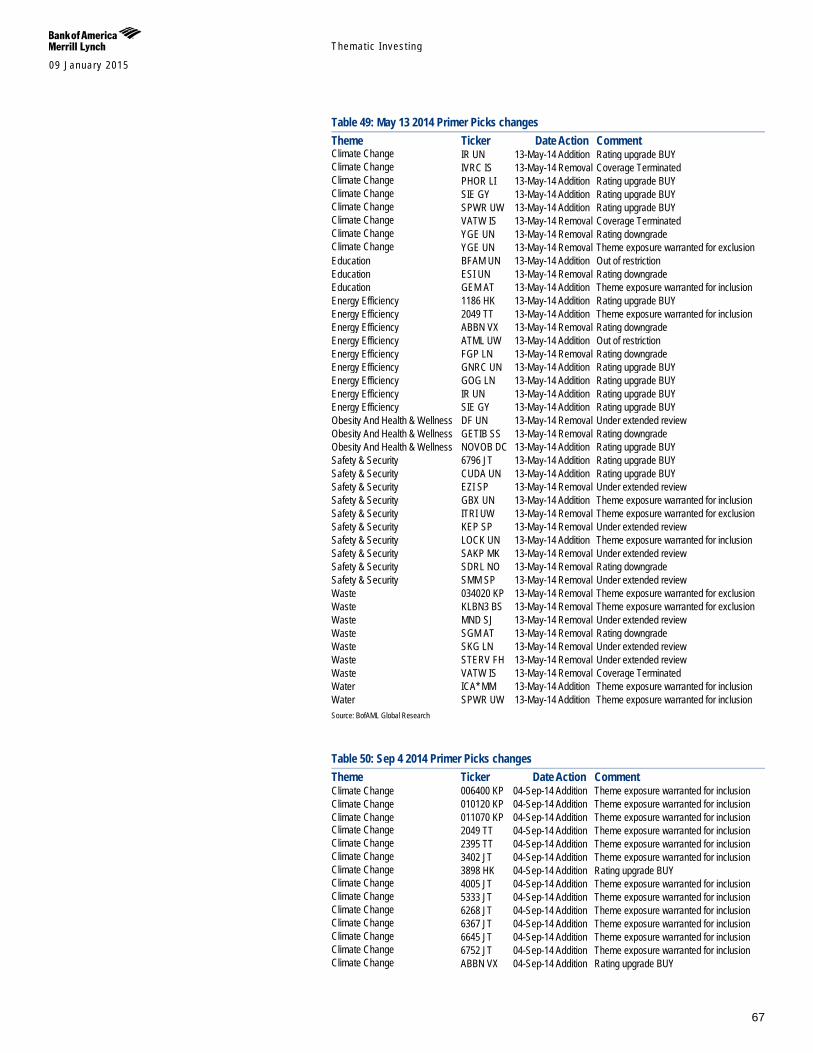
Themat ic Inves t ing 09 January 2015
67
Table 49: May 13 2014 Primer Picks changes Theme Ticker Date Action Comment Climate Change IR UN 13-May-14 Addition Rating upgrade BUY Climate Change IVRC IS 13-May-14 Removal Coverage Terminated Climate Change PHOR LI 13-May-14 Addition Rating upgrade BUY Climate Change SIE GY 13-May-14 Addition Rating upgrade BUY Climate Change SPWR UW 13-May-14 Addition Rating upgrade BUY Climate Change VATW IS 13-May-14 Removal Coverage Terminated Climate Change YGE UN 13-May-14 Removal Rating downgrade Climate Change YGE UN 13-May-14 Removal Theme exposure warranted for exclusion Education BFAM UN 13-May-14 Addition Out of restriction Education ESI UN 13-May-14 Removal Rating downgrade Education GEM AT 13-May-14 Addition Theme exposure warranted for inclusion Energy Efficiency 1186 HK 13-May-14 Addition Rating upgrade BUY Energy Efficiency 2049 TT 13-May-14 Addition Theme exposure warranted for inclusion Energy Efficiency ABBN VX 13-May-14 Removal Rating downgrade Energy Efficiency ATML UW 13-May-14 Addition Out of restriction Energy Efficiency FGP LN 13-May-14 Removal Rating downgrade Energy Efficiency GNRC UN 13-May-14 Addition Rating upgrade BUY Energy Efficiency GOG LN 13-May-14 Addition Rating upgrade BUY Energy Efficiency IR UN 13-May-14 Addition Rating upgrade BUY Energy Efficiency SIE GY 13-May-14 Addition Rating upgrade BUY Obesity And Health & Wellness DF UN 13-May-14 Removal Under extended review Obesity And Health & Wellness GETIB SS 13-May-14 Removal Rating downgrade Obesity And Health & Wellness NOVOB DC 13-May-14 Addition Rating upgrade BUY Safety & Security 6796 JT 13-May-14 Addition Rating upgrade BUY Safety & Security CUDA UN 13-May-14 Addition Rating upgrade BUY Safety & Security EZI SP 13-May-14 Removal Under extended review Safety & Security GBX UN 13-May-14 Addition Theme exposure warranted for inclusion Safety & Security ITRI UW 13-May-14 Removal Theme exposure warranted for exclusion Safety & Security KEP SP 13-May-14 Removal Under extended review Safety & Security LOCK UN 13-May-14 Addition Theme exposure warranted for inclusion Safety & Security SAKP MK 13-May-14 Removal Under extended review Safety & Security SDRL NO 13-May-14 Removal Rating downgrade Safety & Security SMM SP 13-May-14 Removal Under extended review Waste 034020 KP 13-May-14 Removal Theme exposure warranted for exclusion Waste KLBN3 BS 13-May-14 Removal Theme exposure warranted for exclusion Waste MND SJ 13-May-14 Removal Under extended review Waste SGM AT 13-May-14 Removal Rating downgrade Waste SKG LN 13-May-14 Removal Under extended review Waste STERV FH 13-May-14 Removal Under extended review Waste VATW IS 13-May-14 Removal Coverage Terminated Water ICA* MM 13-May-14 Addition Theme exposure warranted for inclusion Water SPWR UW 13-May-14 Addition Theme exposure warranted for inclusion Source: BofAML Global Research
Table 50: Sep 4 2014 Primer Picks changes Theme Ticker Date Action Comment Climate Change 006400 KP 04-Sep-14 Addition Theme exposure warranted for inclusion Climate Change 010120 KP 04-Sep-14 Addition Theme exposure warranted for inclusion Climate Change 011070 KP 04-Sep-14 Addition Theme exposure warranted for inclusion Climate Change 2049 TT 04-Sep-14 Addition Theme exposure warranted for inclusion Climate Change 2395 TT 04-Sep-14 Addition Theme exposure warranted for inclusion Climate Change 3402 JT 04-Sep-14 Addition Theme exposure warranted for inclusion Climate Change 3898 HK 04-Sep-14 Addition Rating upgrade BUY Climate Change 4005 JT 04-Sep-14 Addition Theme exposure warranted for inclusion Climate Change 5333 JT 04-Sep-14 Addition Theme exposure warranted for inclusion Climate Change 6268 JT 04-Sep-14 Addition Theme exposure warranted for inclusion Climate Change 6367 JT 04-Sep-14 Addition Theme exposure warranted for inclusion Climate Change 6645 JT 04-Sep-14 Addition Theme exposure warranted for inclusion Climate Change 6752 JT 04-Sep-14 Addition Theme exposure warranted for inclusion Climate Change ABBN VX 04-Sep-14 Addition Rating upgrade BUY
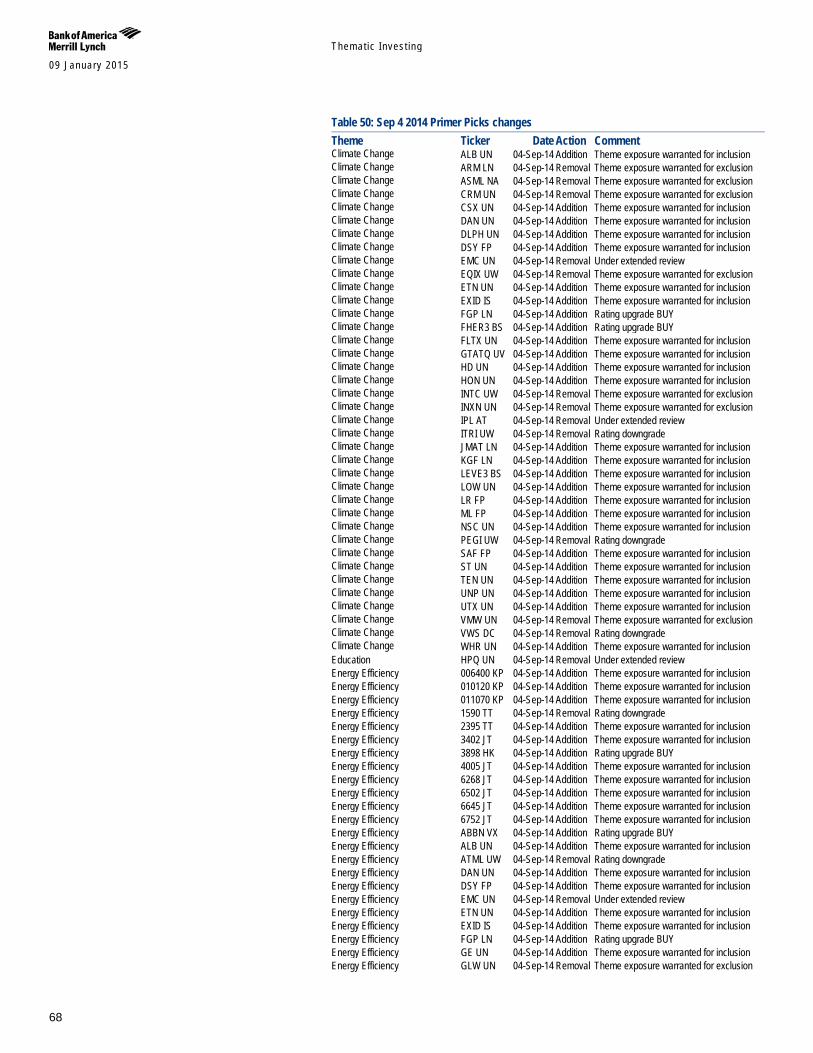
Themat ic Inves t ing 09 January 2015
68
Table 50: Sep 4 2014 Primer Picks changes Theme Ticker Date Action Comment Climate Change ALB UN 04-Sep-14 Addition Theme exposure warranted for inclusion Climate Change ARM LN 04-Sep-14 Removal Theme exposure warranted for exclusion Climate Change ASML NA 04-Sep-14 Removal Theme exposure warranted for exclusion Climate Change CRM UN 04-Sep-14 Removal Theme exposure warranted for exclusion Climate Change CSX UN 04-Sep-14 Addition Theme exposure warranted for inclusion Climate Change DAN UN 04-Sep-14 Addition Theme exposure warranted for inclusion Climate Change DLPH UN 04-Sep-14 Addition Theme exposure warranted for inclusion Climate Change DSY FP 04-Sep-14 Addition Theme exposure warranted for inclusion Climate Change EMC UN 04-Sep-14 Removal Under extended review Climate Change EQIX UW 04-Sep-14 Removal Theme exposure warranted for exclusion Climate Change ETN UN 04-Sep-14 Addition Theme exposure warranted for inclusion Climate Change EXID IS 04-Sep-14 Addition Theme exposure warranted for inclusion Climate Change FGP LN 04-Sep-14 Addition Rating upgrade BUY Climate Change FHER3 BS 04-Sep-14 Addition Rating upgrade BUY Climate Change FLTX UN 04-Sep-14 Addition Theme exposure warranted for inclusion Climate Change GTATQ UV 04-Sep-14 Addition Theme exposure warranted for inclusion Climate Change HD UN 04-Sep-14 Addition Theme exposure warranted for inclusion Climate Change HON UN 04-Sep-14 Addition Theme exposure warranted for inclusion Climate Change INTC UW 04-Sep-14 Removal Theme exposure warranted for exclusion Climate Change INXN UN 04-Sep-14 Removal Theme exposure warranted for exclusion Climate Change IPL AT 04-Sep-14 Removal Under extended review Climate Change ITRI UW 04-Sep-14 Removal Rating downgrade Climate Change JMAT LN 04-Sep-14 Addition Theme exposure warranted for inclusion Climate Change KGF LN 04-Sep-14 Addition Theme exposure warranted for inclusion Climate Change LEVE3 BS 04-Sep-14 Addition Theme exposure warranted for inclusion Climate Change LOW UN 04-Sep-14 Addition Theme exposure warranted for inclusion Climate Change LR FP 04-Sep-14 Addition Theme exposure warranted for inclusion Climate Change ML FP 04-Sep-14 Addition Theme exposure warranted for inclusion Climate Change NSC UN 04-Sep-14 Addition Theme exposure warranted for inclusion Climate Change PEGI UW 04-Sep-14 Removal Rating downgrade Climate Change SAF FP 04-Sep-14 Addition Theme exposure warranted for inclusion Climate Change ST UN 04-Sep-14 Addition Theme exposure warranted for inclusion Climate Change TEN UN 04-Sep-14 Addition Theme exposure warranted for inclusion Climate Change UNP UN 04-Sep-14 Addition Theme exposure warranted for inclusion Climate Change UTX UN 04-Sep-14 Addition Theme exposure warranted for inclusion Climate Change VMW UN 04-Sep-14 Removal Theme exposure warranted for exclusion Climate Change VWS DC 04-Sep-14 Removal Rating downgrade Climate Change WHR UN 04-Sep-14 Addition Theme exposure warranted for inclusion Education HPQ UN 04-Sep-14 Removal Under extended review Energy Efficiency 006400 KP 04-Sep-14 Addition Theme exposure warranted for inclusion Energy Efficiency 010120 KP 04-Sep-14 Addition Theme exposure warranted for inclusion Energy Efficiency 011070 KP 04-Sep-14 Addition Theme exposure warranted for inclusion Energy Efficiency 1590 TT 04-Sep-14 Removal Rating downgrade Energy Efficiency 2395 TT 04-Sep-14 Addition Theme exposure warranted for inclusion Energy Efficiency 3402 JT 04-Sep-14 Addition Theme exposure warranted for inclusion Energy Efficiency 3898 HK 04-Sep-14 Addition Rating upgrade BUY Energy Efficiency 4005 JT 04-Sep-14 Addition Theme exposure warranted for inclusion Energy Efficiency 6268 JT 04-Sep-14 Addition Theme exposure warranted for inclusion Energy Efficiency 6502 JT 04-Sep-14 Addition Theme exposure warranted for inclusion Energy Efficiency 6645 JT 04-Sep-14 Addition Theme exposure warranted for inclusion Energy Efficiency 6752 JT 04-Sep-14 Addition Theme exposure warranted for inclusion Energy Efficiency ABBN VX 04-Sep-14 Addition Rating upgrade BUY Energy Efficiency ALB UN 04-Sep-14 Addition Theme exposure warranted for inclusion Energy Efficiency ATML UW 04-Sep-14 Removal Rating downgrade Energy Efficiency DAN UN 04-Sep-14 Addition Theme exposure warranted for inclusion Energy Efficiency DSY FP 04-Sep-14 Addition Theme exposure warranted for inclusion Energy Efficiency EMC UN 04-Sep-14 Removal Under extended review Energy Efficiency ETN UN 04-Sep-14 Addition Theme exposure warranted for inclusion Energy Efficiency EXID IS 04-Sep-14 Addition Theme exposure warranted for inclusion Energy Efficiency FGP LN 04-Sep-14 Addition Rating upgrade BUY Energy Efficiency GE UN 04-Sep-14 Addition Theme exposure warranted for inclusion Energy Efficiency GLW UN 04-Sep-14 Removal Theme exposure warranted for exclusion
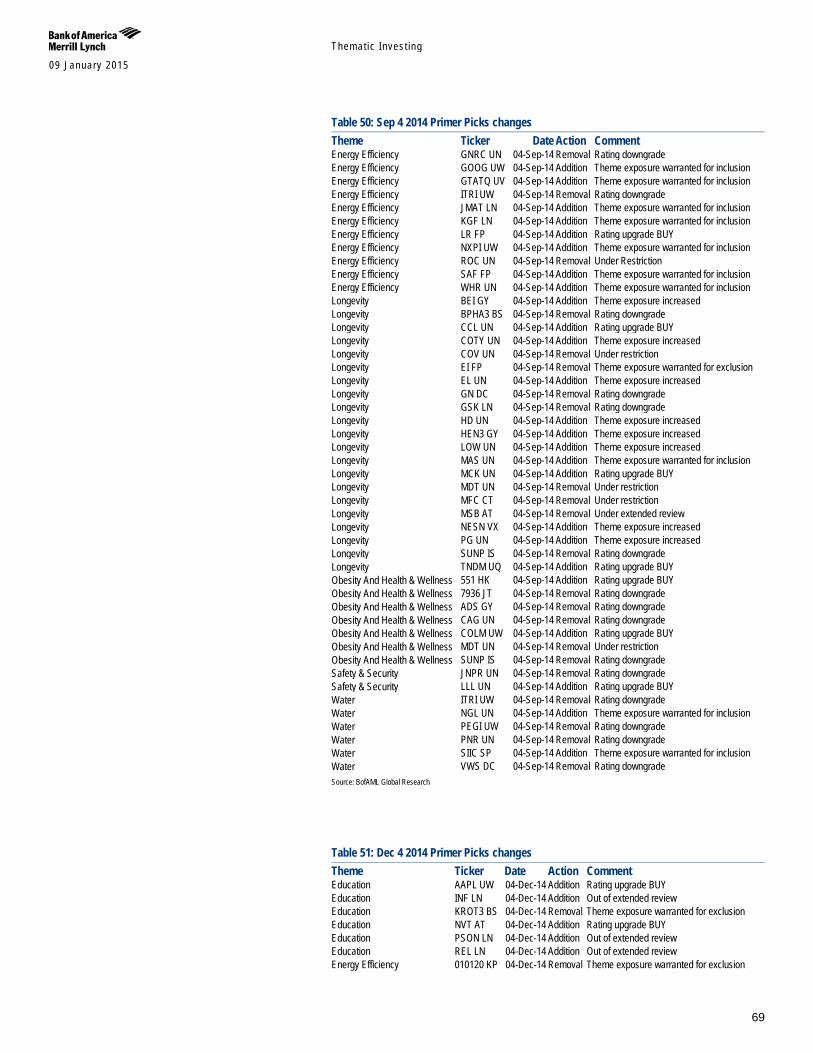
Themat ic Inves t ing 09 January 2015
69
Table 50: Sep 4 2014 Primer Picks changes Theme Ticker Date Action Comment Energy Efficiency GNRC UN 04-Sep-14 Removal Rating downgrade Energy Efficiency GOOG UW 04-Sep-14 Addition Theme exposure warranted for inclusion Energy Efficiency GTATQ UV 04-Sep-14 Addition Theme exposure warranted for inclusion Energy Efficiency ITRI UW 04-Sep-14 Removal Rating downgrade Energy Efficiency JMAT LN 04-Sep-14 Addition Theme exposure warranted for inclusion Energy Efficiency KGF LN 04-Sep-14 Addition Theme exposure warranted for inclusion Energy Efficiency LR FP 04-Sep-14 Addition Rating upgrade BUY Energy Efficiency NXPI UW 04-Sep-14 Addition Theme exposure warranted for inclusion Energy Efficiency ROC UN 04-Sep-14 Removal Under Restriction Energy Efficiency SAF FP 04-Sep-14 Addition Theme exposure warranted for inclusion Energy Efficiency WHR UN 04-Sep-14 Addition Theme exposure warranted for inclusion Longevity BEI GY 04-Sep-14 Addition Theme exposure increased Longevity BPHA3 BS 04-Sep-14 Removal Rating downgrade Longevity CCL UN 04-Sep-14 Addition Rating upgrade BUY Longevity COTY UN 04-Sep-14 Addition Theme exposure increased Longevity COV UN 04-Sep-14 Removal Under restriction Longevity EI FP 04-Sep-14 Removal Theme exposure warranted for exclusion Longevity EL UN 04-Sep-14 Addition Theme exposure increased Longevity GN DC 04-Sep-14 Removal Rating downgrade Longevity GSK LN 04-Sep-14 Removal Rating downgrade Longevity HD UN 04-Sep-14 Addition Theme exposure increased Longevity HEN3 GY 04-Sep-14 Addition Theme exposure increased Longevity LOW UN 04-Sep-14 Addition Theme exposure increased Longevity MAS UN 04-Sep-14 Addition Theme exposure warranted for inclusion Longevity MCK UN 04-Sep-14 Addition Rating upgrade BUY Longevity MDT UN 04-Sep-14 Removal Under restriction Longevity MFC CT 04-Sep-14 Removal Under restriction Longevity MSB AT 04-Sep-14 Removal Under extended review Longevity NESN VX 04-Sep-14 Addition Theme exposure increased Longevity PG UN 04-Sep-14 Addition Theme exposure increased Longevity SUNP IS 04-Sep-14 Removal Rating downgrade Longevity TNDM UQ 04-Sep-14 Addition Rating upgrade BUY Obesity And Health & Wellness 551 HK 04-Sep-14 Addition Rating upgrade BUY Obesity And Health & Wellness 7936 JT 04-Sep-14 Removal Rating downgrade Obesity And Health & Wellness ADS GY 04-Sep-14 Removal Rating downgrade Obesity And Health & Wellness CAG UN 04-Sep-14 Removal Rating downgrade Obesity And Health & Wellness COLM UW 04-Sep-14 Addition Rating upgrade BUY Obesity And Health & Wellness MDT UN 04-Sep-14 Removal Under restriction Obesity And Health & Wellness SUNP IS 04-Sep-14 Removal Rating downgrade Safety & Security JNPR UN 04-Sep-14 Removal Rating downgrade Safety & Security LLL UN 04-Sep-14 Addition Rating upgrade BUY Water ITRI UW 04-Sep-14 Removal Rating downgrade Water NGL UN 04-Sep-14 Addition Theme exposure warranted for inclusion Water PEGI UW 04-Sep-14 Removal Rating downgrade Water PNR UN 04-Sep-14 Removal Rating downgrade Water SIIC SP 04-Sep-14 Addition Theme exposure warranted for inclusion Water VWS DC 04-Sep-14 Removal Rating downgrade Source: BofAML Global Research
Table 51: Dec 4 2014 Primer Picks changes Theme Ticker Date Action Comment Education AAPL UW 04-Dec-14 Addition Rating upgrade BUY Education INF LN 04-Dec-14 Addition Out of extended review Education KROT3 BS 04-Dec-14 Removal Theme exposure warranted for exclusion Education NVT AT 04-Dec-14 Addition Rating upgrade BUY Education PSON LN 04-Dec-14 Addition Out of extended review Education REL LN 04-Dec-14 Addition Out of extended review Energy Efficiency 010120 KP 04-Dec-14 Removal Theme exposure warranted for exclusion
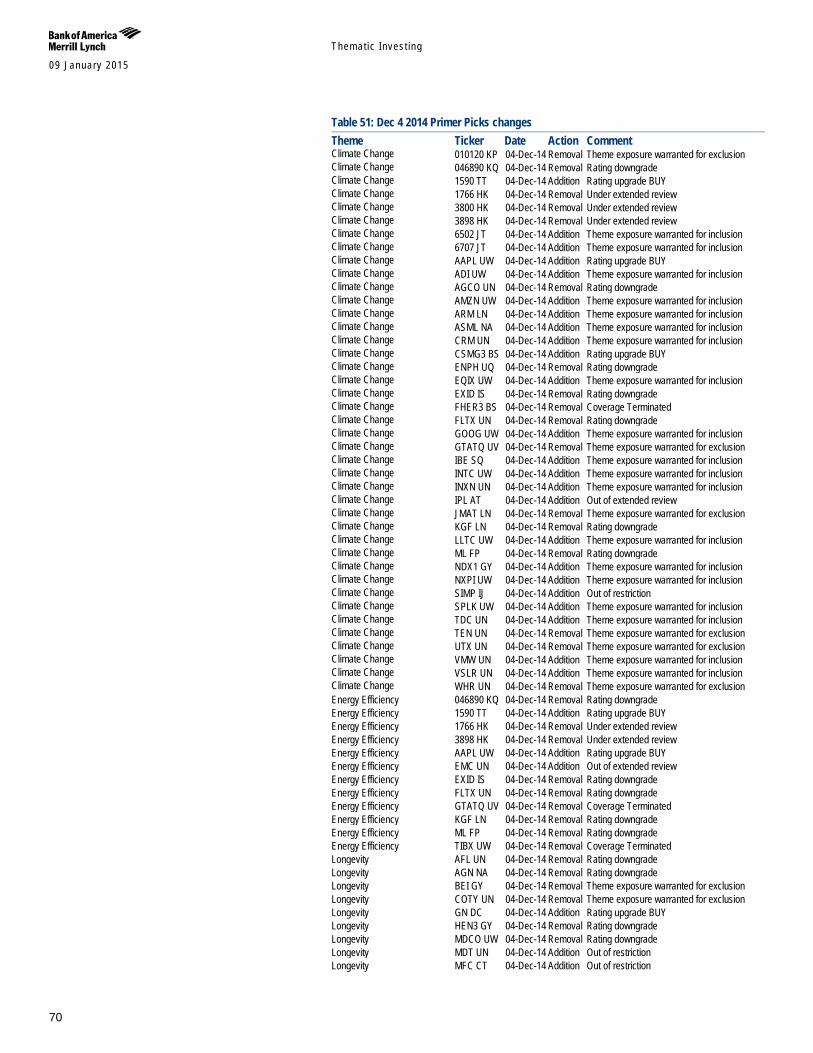
Themat ic Inves t ing 09 January 2015
70
Table 51: Dec 4 2014 Primer Picks changes Theme Ticker Date Action Comment Climate Change 010120 KP 04-Dec-14 Removal Theme exposure warranted for exclusion Climate Change 046890 KQ 04-Dec-14 Removal Rating downgrade Climate Change 1590 TT 04-Dec-14 Addition Rating upgrade BUY Climate Change 1766 HK 04-Dec-14 Removal Under extended review Climate Change 3800 HK 04-Dec-14 Removal Under extended review Climate Change 3898 HK 04-Dec-14 Removal Under extended review Climate Change 6502 JT 04-Dec-14 Addition Theme exposure warranted for inclusion Climate Change 6707 JT 04-Dec-14 Addition Theme exposure warranted for inclusion Climate Change AAPL UW 04-Dec-14 Addition Rating upgrade BUY Climate Change ADI UW 04-Dec-14 Addition Theme exposure warranted for inclusion Climate Change AGCO UN 04-Dec-14 Removal Rating downgrade Climate Change AMZN UW 04-Dec-14 Addition Theme exposure warranted for inclusion Climate Change ARM LN 04-Dec-14 Addition Theme exposure warranted for inclusion Climate Change ASML NA 04-Dec-14 Addition Theme exposure warranted for inclusion Climate Change CRM UN 04-Dec-14 Addition Theme exposure warranted for inclusion Climate Change CSMG3 BS 04-Dec-14 Addition Rating upgrade BUY Climate Change ENPH UQ 04-Dec-14 Removal Rating downgrade Climate Change EQIX UW 04-Dec-14 Addition Theme exposure warranted for inclusion Climate Change EXID IS 04-Dec-14 Removal Rating downgrade Climate Change FHER3 BS 04-Dec-14 Removal Coverage Terminated Climate Change FLTX UN 04-Dec-14 Removal Rating downgrade Climate Change GOOG UW 04-Dec-14 Addition Theme exposure warranted for inclusion Climate Change GTATQ UV 04-Dec-14 Removal Theme exposure warranted for exclusion Climate Change IBE SQ 04-Dec-14 Addition Theme exposure warranted for inclusion Climate Change INTC UW 04-Dec-14 Addition Theme exposure warranted for inclusion Climate Change INXN UN 04-Dec-14 Addition Theme exposure warranted for inclusion Climate Change IPL AT 04-Dec-14 Addition Out of extended review Climate Change JMAT LN 04-Dec-14 Removal Theme exposure warranted for exclusion Climate Change KGF LN 04-Dec-14 Removal Rating downgrade Climate Change LLTC UW 04-Dec-14 Addition Theme exposure warranted for inclusion Climate Change ML FP 04-Dec-14 Removal Rating downgrade Climate Change NDX1 GY 04-Dec-14 Addition Theme exposure warranted for inclusion Climate Change NXPI UW 04-Dec-14 Addition Theme exposure warranted for inclusion Climate Change SIMP IJ 04-Dec-14 Addition Out of restriction Climate Change SPLK UW 04-Dec-14 Addition Theme exposure warranted for inclusion Climate Change TDC UN 04-Dec-14 Addition Theme exposure warranted for inclusion Climate Change TEN UN 04-Dec-14 Removal Theme exposure warranted for exclusion Climate Change UTX UN 04-Dec-14 Removal Theme exposure warranted for exclusion Climate Change VMW UN 04-Dec-14 Addition Theme exposure warranted for inclusion Climate Change VSLR UN 04-Dec-14 Addition Theme exposure warranted for inclusion Climate Change WHR UN 04-Dec-14 Removal Theme exposure warranted for exclusion Energy Efficiency 046890 KQ 04-Dec-14 Removal Rating downgrade Energy Efficiency 1590 TT 04-Dec-14 Addition Rating upgrade BUY Energy Efficiency 1766 HK 04-Dec-14 Removal Under extended review Energy Efficiency 3898 HK 04-Dec-14 Removal Under extended review Energy Efficiency AAPL UW 04-Dec-14 Addition Rating upgrade BUY Energy Efficiency EMC UN 04-Dec-14 Addition Out of extended review Energy Efficiency EXID IS 04-Dec-14 Removal Rating downgrade Energy Efficiency FLTX UN 04-Dec-14 Removal Rating downgrade Energy Efficiency GTATQ UV 04-Dec-14 Removal Coverage Terminated Energy Efficiency KGF LN 04-Dec-14 Removal Rating downgrade Energy Efficiency ML FP 04-Dec-14 Removal Rating downgrade Energy Efficiency TIBX UW 04-Dec-14 Removal Coverage Terminated Longevity AFL UN 04-Dec-14 Removal Rating downgrade Longevity AGN NA 04-Dec-14 Removal Rating downgrade Longevity BEI GY 04-Dec-14 Removal Theme exposure warranted for exclusion Longevity COTY UN 04-Dec-14 Removal Theme exposure warranted for exclusion Longevity GN DC 04-Dec-14 Addition Rating upgrade BUY Longevity HEN3 GY 04-Dec-14 Removal Rating downgrade Longevity MDCO UW 04-Dec-14 Removal Rating downgrade Longevity MDT UN 04-Dec-14 Addition Out of restriction Longevity MFC CT 04-Dec-14 Addition Out of restriction
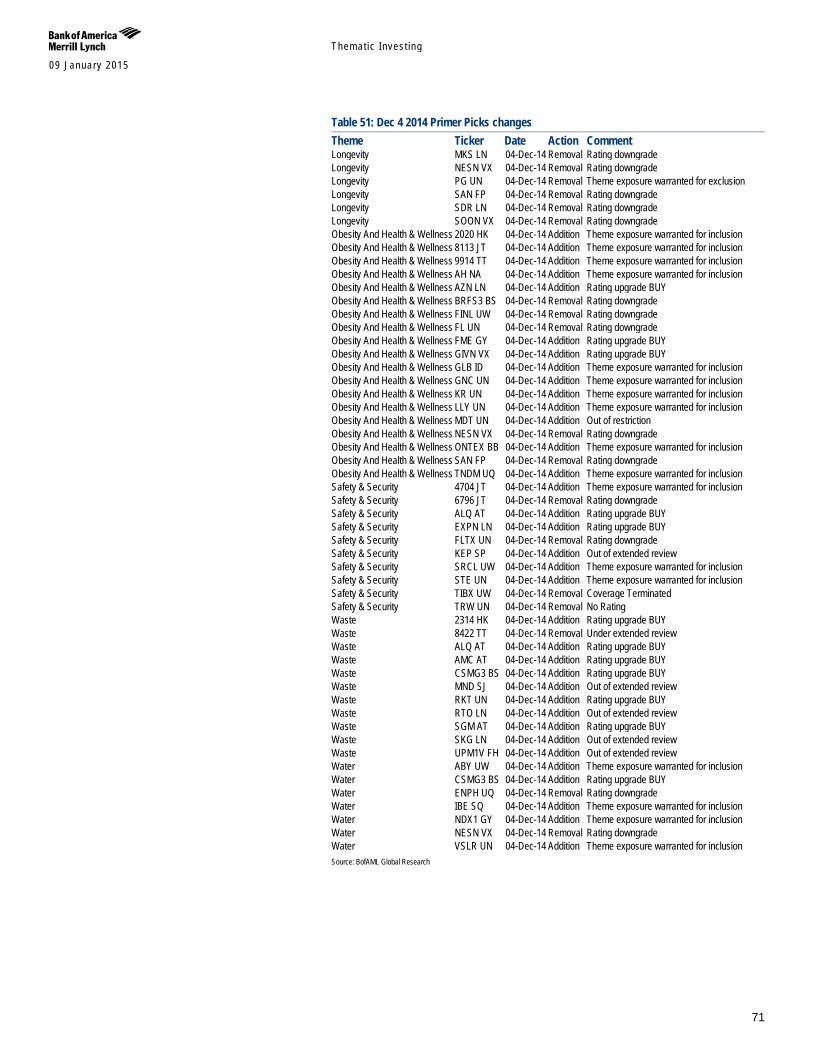
Themat ic Inves t ing 09 January 2015
71
Table 51: Dec 4 2014 Primer Picks changes Theme Ticker Date Action Comment Longevity MKS LN 04-Dec-14 Removal Rating downgrade Longevity NESN VX 04-Dec-14 Removal Rating downgrade Longevity PG UN 04-Dec-14 Removal Theme exposure warranted for exclusion Longevity SAN FP 04-Dec-14 Removal Rating downgrade Longevity SDR LN 04-Dec-14 Removal Rating downgrade Longevity SOON VX 04-Dec-14 Removal Rating downgrade Obesity And Health & Wellness 2020 HK 04-Dec-14 Addition Theme exposure warranted for inclusion Obesity And Health & Wellness 8113 JT 04-Dec-14 Addition Theme exposure warranted for inclusion Obesity And Health & Wellness 9914 TT 04-Dec-14 Addition Theme exposure warranted for inclusion Obesity And Health & Wellness AH NA 04-Dec-14 Addition Theme exposure warranted for inclusion Obesity And Health & Wellness AZN LN 04-Dec-14 Addition Rating upgrade BUY Obesity And Health & Wellness BRFS3 BS 04-Dec-14 Removal Rating downgrade Obesity And Health & Wellness FINL UW 04-Dec-14 Removal Rating downgrade Obesity And Health & Wellness FL UN 04-Dec-14 Removal Rating downgrade Obesity And Health & Wellness FME GY 04-Dec-14 Addition Rating upgrade BUY Obesity And Health & Wellness GIVN VX 04-Dec-14 Addition Rating upgrade BUY Obesity And Health & Wellness GLB ID 04-Dec-14 Addition Theme exposure warranted for inclusion Obesity And Health & Wellness GNC UN 04-Dec-14 Addition Theme exposure warranted for inclusion Obesity And Health & Wellness KR UN 04-Dec-14 Addition Theme exposure warranted for inclusion Obesity And Health & Wellness LLY UN 04-Dec-14 Addition Theme exposure warranted for inclusion Obesity And Health & Wellness MDT UN 04-Dec-14 Addition Out of restriction Obesity And Health & Wellness NESN VX 04-Dec-14 Removal Rating downgrade Obesity And Health & Wellness ONTEX BB 04-Dec-14 Addition Theme exposure warranted for inclusion Obesity And Health & Wellness SAN FP 04-Dec-14 Removal Rating downgrade Obesity And Health & Wellness TNDM UQ 04-Dec-14 Addition Theme exposure warranted for inclusion Safety & Security 4704 JT 04-Dec-14 Addition Theme exposure warranted for inclusion Safety & Security 6796 JT 04-Dec-14 Removal Rating downgrade Safety & Security ALQ AT 04-Dec-14 Addition Rating upgrade BUY Safety & Security EXPN LN 04-Dec-14 Addition Rating upgrade BUY Safety & Security FLTX UN 04-Dec-14 Removal Rating downgrade Safety & Security KEP SP 04-Dec-14 Addition Out of extended review Safety & Security SRCL UW 04-Dec-14 Addition Theme exposure warranted for inclusion Safety & Security STE UN 04-Dec-14 Addition Theme exposure warranted for inclusion Safety & Security TIBX UW 04-Dec-14 Removal Coverage Terminated Safety & Security TRW UN 04-Dec-14 Removal No Rating Waste 2314 HK 04-Dec-14 Addition Rating upgrade BUY Waste 8422 TT 04-Dec-14 Removal Under extended review Waste ALQ AT 04-Dec-14 Addition Rating upgrade BUY Waste AMC AT 04-Dec-14 Addition Rating upgrade BUY Waste CSMG3 BS 04-Dec-14 Addition Rating upgrade BUY Waste MND SJ 04-Dec-14 Addition Out of extended review Waste RKT UN 04-Dec-14 Addition Rating upgrade BUY Waste RTO LN 04-Dec-14 Addition Out of extended review Waste SGM AT 04-Dec-14 Addition Rating upgrade BUY Waste SKG LN 04-Dec-14 Addition Out of extended review Waste UPM1V FH 04-Dec-14 Addition Out of extended review Water ABY UW 04-Dec-14 Addition Theme exposure warranted for inclusion Water CSMG3 BS 04-Dec-14 Addition Rating upgrade BUY Water ENPH UQ 04-Dec-14 Removal Rating downgrade Water IBE SQ 04-Dec-14 Addition Theme exposure warranted for inclusion Water NDX1 GY 04-Dec-14 Addition Theme exposure warranted for inclusion Water NESN VX 04-Dec-14 Removal Rating downgrade Water VSLR UN 04-Dec-14 Addition Theme exposure warranted for inclusion Source: BofAML Global Research
Themat ic Inves t ing 09 January 2015
72
Positioning methodology Positioning between stocks within a Theme We looked at the publicly disclosed holdings data of 13,000 institutions, 30,000 unique mutual fund portfolios, and 200,000 non-institutional ‘insider/stake holders‛ spanning 110 countries. Within each theme, we looked at the 50 largest funds in terms of the total market value of their holdings within the theme. They would be considered the most influential investors within the theme.
First we calculate if a particular stock is overweight by the biggest holders. We take the market value of the stock held by the top 50 holders and calculate its proportion of total market value in disclosed in the stock. Then we consider the total Theme market value of the top 50 holders, and calculate its proportion of total Theme market value for all the funds. This tells us if the top holders of the Theme are overweight or underweight the particular stock relative to all holders within a Theme.
Next we look at the percentage of top 50 holders who are overweight stock. We look at the total market value of the stock, and calculate its proportion within the market value of the entire Theme. Then we look at the proportion the Theme comprises within the holder’s entire portfolio. For example:
The disclosed MV of Adobe is 28,019mm, and the MV of the Education theme is 1,537,972mm. Adobe then comprises 1.82% of the MV of the Education theme, let’s consider this the “active benchmark”.
Let’s say a fund has 6.6% of its portfolio within the Education theme, and 0.1% within the Adobe stock specifically. This means the fund has 1.518% of its Education theme in Adobe. This is higher than the active benchmark, the fund is overweight Adobe.
We plot the stock Overweight level versus the percentage of top holders that are Overweight. The higher the Overweight level and the higher the proportion of holder Overweight, the higher indication that the stock itself is overweight.
Positioning between sub-themes within a Theme We looked at the publicly disclosed holdings data of 13,000 institutions, 30,000 unique mutual fund portfolios, and 200,000 non-institutional ‘insider/stake holders‛ spanning 110 countries. Within each theme, we looked at the 50 largest funds in terms of the total market value of their holdings within the theme. They would be considered the most influential investors within the theme.
First we calculate the relative weight of the sub-theme by the biggest holders. We take the market value (MV) of the sub-theme held by the top 50 holders and calculate its proportion of total MV in disclosed in the sub-theme. Then we consider the total Theme MV of the top 50 holders, and calculate its proportion of total Theme market value for all the funds. This tells us if the top holders of the Theme are overweight or underweight the particular sub-theme relative to all holders within a Theme. For example:
Education theme has 4 sub-themes: EdTech, K-12 & Childcare, Post-secondary, and Publishing
The top 50 holders of the Education theme have 150,000mn in EdTech. The total MV of EdTech held by all holders is 450,000mn. Then the top 50 holders account for 33.33% MV in EdTech.
Themat ic Inves t ing 09 January 2015
73
The top 50 holders of the Education theme have an MV of 375,000mn in Education. The total MV of Education theme is 1,500,000mn. This means the top 50 holders account for 25% of Education. 33.33/25=1.33. Using a 100 scale, 133 is above 100 and shows a relative Overweight in the EdTech sub-theme.
Next we look at the percentage of top 50 holders who are overweight the sub-theme. We look at the total market value of the sub-theme, and calculate its proportion within the market value of the entire Theme. Then we look at the proportion the Theme comprises within the holder’s entire portfolio. For example:
The disclosed MV of EdTech sub-theme is 450,000mm, and the MV of the Education theme is 1,500,000mm. Edtech then comprises 30% of the MV of the Education theme, let’s consider this the “active benchmark”.
Let’s say a fund has 6.6% of its portfolio within the Education theme, and 3% within the Edtech sub-theme specifically. This means the fund has 45% of its Education theme in Edtech. This is higher than the active benchmark, the fund is Overweight Edtech.
Positioning between Themes within Thematic Universe We looked at the publicly disclosed holdings data of 13,000 institutions, 30,000 unique mutual fund portfolios, and 200,000 non-institutional ‘insider/stake holders‛ spanning 110 countries. For the overall Thematic Universe, we looked at the 50 largest funds in terms of the total market value of their holdings within the entire thematic universe. They would be considered the most influential investors of themes.
First we calculate if a particular theme is overweight by the biggest thematic holders. We take the market value of the theme held by the top 50 holders and calculate its proportion of total market value in the theme. Then we consider the total Theme universe market value of the top 50 holders, and calculate its proportion of total Theme universe market value for all the funds. This tells us if the top thematic holders are overweight or underweight the particular theme relative to all holders of the thematic universe.
Next we look at the percentage of top 50 holders who are overweight the theme. We look at the total market value of the theme, and calculate its proportion within the market value of the entire Thematic universe. Then we look at the proportion the Thematic universe comprises within the holder’s entire portfolio. For example:
The disclosed MV of Education is 225,000mm, and the MV of the Thematic Universe is 1,500,000mm. Education then comprises 15% of the MV of the Thematic Universe. We consider this the “active benchmark”.
Let’s say a fund has 25% of its portfolio within the Thematic Universe, and 3.2% within the Education theme specifically. This means the fund has 12.8% of its Thematic Universe in Education. This is lower than the active benchmark, the fund is underweight Education.
We plot the theme Overweight level versus the percentage of top holders that are Overweight. The higher the Overweight level and the higher the proportion of holder Overweight, the higher indication that the theme itself is overweight.
Themat ic Inves t ing 09 January 2015
74
Holdings data Sources for this information include 13F, 13G, 13D, Registration filings (S-1, S-2, S-3), Proxy, 10-K, Insider filings (Forms 3, 4, 5), N-30D, N-Q mutual fund holdings, annual reports, and country specific authorities as collated by Factset. We use the most recent data available for each fund, excluding data that is more than 12 months old. The most common “age” of the data is two-to-three months old. To provide a more recent snapshot of the value of the fund managers’ equity holdings, we have marked-to-market the holdings as of the most recent month-end. The report does not reflect any changes, other than re-pricing, in portfolio holdings after the filing dates. The analysis includes both active and passive fund holdings information.
Equity client flow methodology This portion of the research product provides an aggregated view of BofA Merrill Lynch client trading flows into global stocks executed by the cash equities business of the firm. By aggregating flows across many execution platforms and trading desks, the goal of this product is to provide an overview of what Themes are being bought or sold. It is not meant to be predictive of the market, but aims to provide a holistic view of BofAML client trading flows by Theme.
The trading flow considers all stocks within the Thematic Universe, which spans all global regions. Stocks here are shown only as “net buys,” defined as the notional amount of buy orders less sell orders. Since this product is meant to provide client action context of recent market and Theme performance based on client trading flows, we capture the data as “net buys” rather than trading volume. The order flow comprises all single stock trades executed by the firm globally within the cash equities business including high touch, electronic trading, and portfolio trading. Order flow on derivatives such as options, futures, and swaps are not included.
Equity flows are represented in US dollar terms. Stocks that are not denominated in USD are converted using the spot foreign exchange rate on the day of trading.
ESG consensus positioning methodology We base our analysis of the 500 largest global SRI mutual funds by AUM – including negative screening, positive screening and long-term thematic funds – who also publicly disclose their fund holdings.
We stress that point since this is different from total market value or even freefloat market value. But we believe that we need to compare SRI Mutual funds to Mutual funds in general, in order to be fair. For indicative purposes, our data suggest that in average mutual funds represent a minimum of 35% of Floated Market Value and 28% of market value (non-floated).
The top 500 SRI funds Our starting point was to identify the greatest number of funds that could be reasonably perceived as SRI-oriented. This is not as easy as it sounds as there is:
No “official” definition of SRI or SRI funds;
No international register for SRI funds, despite the fact that SRI asset managers largely adhere to the United Nations’ Principles for Responsible Investment (PRI), but signatures are at corporate rather than fund level; and
Themat ic Inves t ing 09 January 2015
75
No legal framework – global, regional or local – enabling third parties to identify SRI funds.
SRI fund selection criteria Despite the lack of clear, objective, well-accepted definitions and delineations, we believe that it is possible to select funds under the SRI rubric on the following basis:
The fund is self-marketed by the asset manager as SRI or SRI-friendly;
Fund name contains some objective “clues” of an SRI orientation, mainly via the usage of “buzzwords” typical of SRI interests/concerns such as:
1. Responsible, ethical, sustainable, citizenship, stewardship, solidarity, etc.
2. ESG (environmental, social or governance), green, ecology, planet, human, industries of the future etc.
3. Agriculture, bottom of the pyramid, climate change, demographics, education, energy efficiency, renewables, safety, waste and water.
Started with 1,344 SRI-oriented funds globally Using this approach and various databases including Bloomberg Lipper/Morningstar and Factset, we came up with an initial list of 1,344 clearly identified funds that we think could reasonably qualify as SRI-oriented.
Narrowed to 734 funds disclosing stock components Of these 1,344 funds, we have been able to identify 734 that give access to the detailed list of their stock components, with at least some equity components. We largely excluded all funds invested only in bonds, monetary or non-equity securities.
SRI funds, US$126bn of the MSCI All-Countries World Index Looking at equity assets under management, the AUM figures for the 786 SRI identified funds are approximately US$126bn of the MSCI AC World Index.
SRI Weighting is equal to the weight of SRI “money” compared to the relative MV. If SRI money weight 5% of a stock / sector where it only weights 1% in the benchmark, then the SRI weighting is 5% / 1% = 5x.
SRI Macro Factor is a combination of sector weightings taking into account geographical characteristics. For instance, in sector MV divided by the overall weight of SRI in the total index MV (e.g. 0.20 / 0.97 = 0.21 for Tobacco and 14.53 / 0.97 = 14.97x for Water Utilities).
SRI Stock Factor is derived from the % of MV in the stock divided by the SRI Macro Factor – akin to a SRI sector-geo-normalised factor. To put it in perspective, an SRI Stock Factor of 2.6x means that the company is 2.6x over-allocated compared with the sector average and the geo SRI allocation.
Limitations and assumptions of the model Missing funds Not all SRI funds disclose their components; despite our best efforts, some important SRI flows might therefore be missing. However, limiting ourselves to the top 500 SRI funds which do disclose holdings, and applying a geographic and

Themat ic Inves t ing 09 January 2015
76
sector screening allows us to avoid any major skew or bias, at least at stock level. So if the total amount of SRI disclosed assets is obviously below the total amount of all SRI-oriented funds (perhaps by a factor of 2x or more), we can reasonably expect that the relative preferences of SRI investors for companies and sectors are well estimated.
Date of disclosure SRI components are not all disclosed at the same time. This could lead to an over- or underestimation of the market value for some funds, coupled with outdated information if the components have changed in the meantime. However, we expect that comparing our SRI assets vs. the six-month average market value for the benchmark considerably reduces the risk of over- or underestimation,. We suppose that the information disclosed will always lag current day-to-day data, in the meantime – even important factors used to build up financial benchmarks are revised sometimes only on a quarterly or half-year basis (free-float factors for instance).
“Dissensus” inside the consensus As SRI investors may have different areas of focus and interests, the image captured through the SRI Consensus might obliterate such divergent views and interests, at the sector or company level. Some divergent views could even be self-neutralized. To that point, we would reply that a) investors using financial consensus on estimates face the same situation, and b) it is very likely, based on our experiences, that the bulk of SRI investors will share some common beliefs at least on activities and sectors; for eg, the need for urgent action against climate change (then a push towards alternative energies and eco-efficiency, the need to speak out against low labour and human rights standards, or a preference for high levels of disclosure on corporate governance practices and standards).
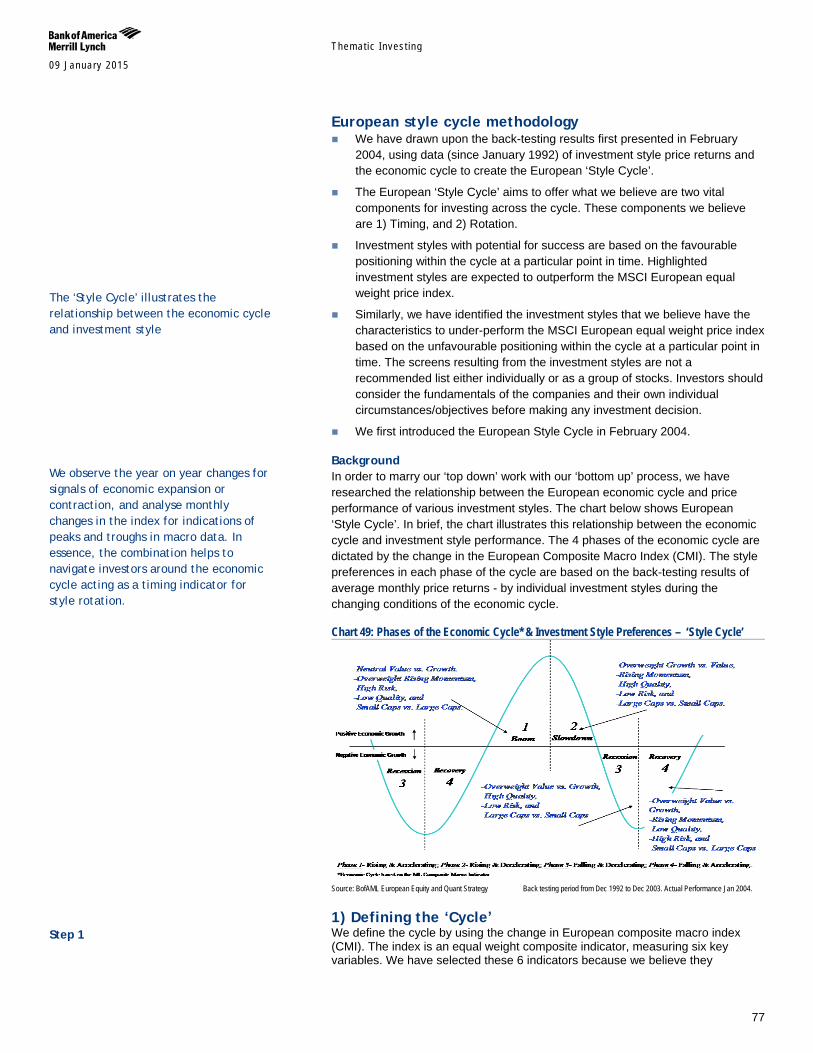
Themat ic Inves t ing 09 January 2015
77
European style cycle methodology We have drawn upon the back-testing results first presented in February
2004, using data (since January 1992) of investment style price returns and the economic cycle to create the European ‘Style Cycle’.
The European ‘Style Cycle’ aims to offer what we believe are two vital components for investing across the cycle. These components we believe are 1) Timing, and 2) Rotation.
Investment styles with potential for success are based on the favourable positioning within the cycle at a particular point in time. Highlighted investment styles are expected to outperform the MSCI European equal weight price index.
Similarly, we have identified the investment styles that we believe have the characteristics to under-perform the MSCI European equal weight price index based on the unfavourable positioning within the cycle at a particular point in time. The screens resulting from the investment styles are not a recommended list either individually or as a group of stocks. Investors should consider the fundamentals of the companies and their own individual circumstances/objectives before making any investment decision.
We first introduced the European Style Cycle in February 2004.
Background In order to marry our ‘top down’ work with our ‘bottom up’ process, we have researched the relationship between the European economic cycle and price performance of various investment styles. The chart below shows European ‘Style Cycle’. In brief, the chart illustrates this relationship between the economic cycle and investment style performance. The 4 phases of the economic cycle are dictated by the change in the European Composite Macro Index (CMI). The style preferences in each phase of the cycle are based on the back-testing results of average monthly price returns - by individual investment styles during the changing conditions of the economic cycle.
Chart 49: Phases of the Economic Cycle* & Investment Style Preferences – ‘Style Cycle’
Source: BofAML European Equity and Quant Strategy Back testing period from Dec 1992 to Dec 2003. Actual Performance Jan 2004.
1) Defining the ‘Cycle’ We define the cycle by using the change in European composite macro index (CMI). The index is an equal weight composite indicator, measuring six key variables. We have selected these 6 indicators because we believe they
The ‘Style Cycle’ illustrates the relationship between the economic cycle and investment style We observe the year on year changes for signals of economic expansion or contraction, and analyse monthly changes in the index for indications of peaks and troughs in macro data. In essence, the combination helps to navigate investors around the economic cycle acting as a timing indicator for style rotation.
Step 1
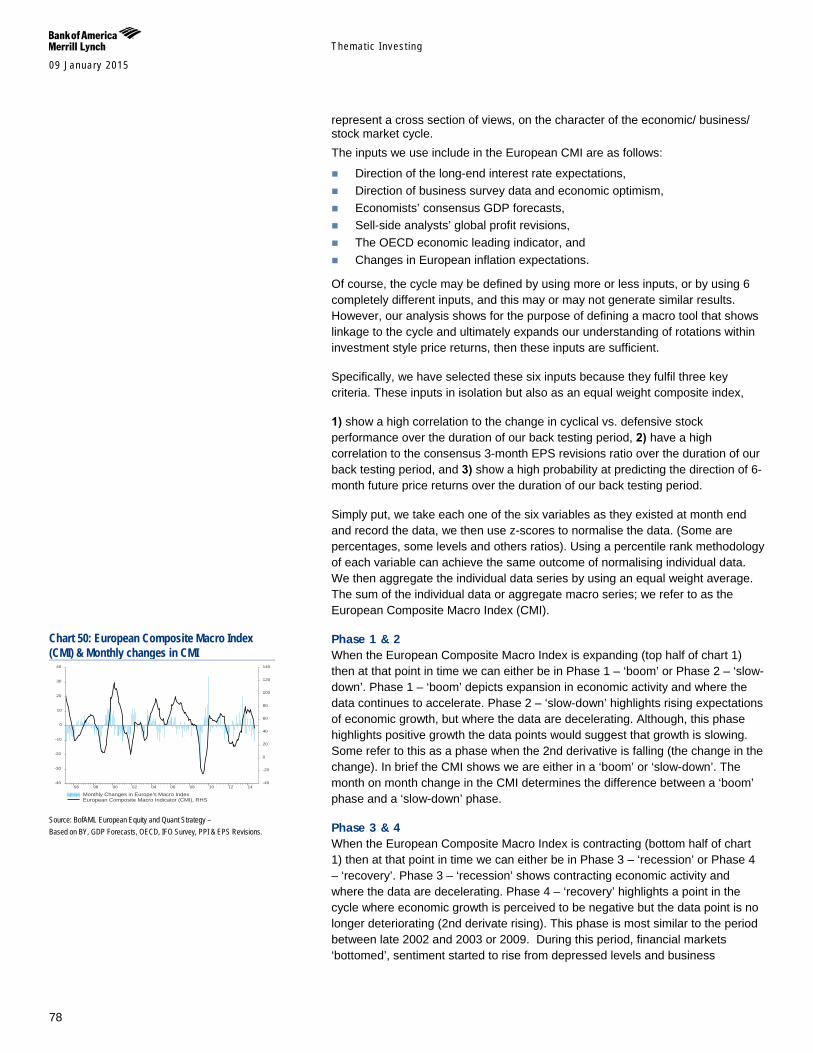
Themat ic Inves t ing 09 January 2015
78
represent a cross section of views, on the character of the economic/ business/ stock market cycle. The inputs we use include in the European CMI are as follows:
Direction of the long-end interest rate expectations, Direction of business survey data and economic optimism, Economists’ consensus GDP forecasts, Sell-side analysts’ global profit revisions, The OECD economic leading indicator, and Changes in European inflation expectations.
Of course, the cycle may be defined by using more or less inputs, or by using 6 completely different inputs, and this may or may not generate similar results. However, our analysis shows for the purpose of defining a macro tool that shows linkage to the cycle and ultimately expands our understanding of rotations within investment style price returns, then these inputs are sufficient.
Specifically, we have selected these six inputs because they fulfil three key criteria. These inputs in isolation but also as an equal weight composite index,
1) show a high correlation to the change in cyclical vs. defensive stock performance over the duration of our back testing period, 2) have a high correlation to the consensus 3-month EPS revisions ratio over the duration of our back testing period, and 3) show a high probability at predicting the direction of 6-month future price returns over the duration of our back testing period.
Simply put, we take each one of the six variables as they existed at month end and record the data, we then use z-scores to normalise the data. (Some are percentages, some levels and others ratios). Using a percentile rank methodology of each variable can achieve the same outcome of normalising individual data. We then aggregate the individual data series by using an equal weight average. The sum of the individual data or aggregate macro series; we refer to as the European Composite Macro Index (CMI).
Phase 1 & 2 When the European Composite Macro Index is expanding (top half of chart 1) then at that point in time we can either be in Phase 1 – ‘boom’ or Phase 2 – ‘slow-down’. Phase 1 – ‘boom’ depicts expansion in economic activity and where the data continues to accelerate. Phase 2 – ‘slow-down’ highlights rising expectations of economic growth, but where the data are decelerating. Although, this phase highlights positive growth the data points would suggest that growth is slowing. Some refer to this as a phase when the 2nd derivative is falling (the change in the change). In brief the CMI shows we are either in a ‘boom’ or ‘slow-down’. The month on month change in the CMI determines the difference between a ‘boom’ phase and a ‘slow-down’ phase.
Phase 3 & 4 When the European Composite Macro Index is contracting (bottom half of chart 1) then at that point in time we can either be in Phase 3 – ‘recession’ or Phase 4 – ‘recovery’. Phase 3 – ‘recession’ shows contracting economic activity and where the data are decelerating. Phase 4 – ‘recovery’ highlights a point in the cycle where economic growth is perceived to be negative but the data point is no longer deteriorating (2nd derivate rising). This phase is most similar to the period between late 2002 and 2003 or 2009. During this period, financial markets ‘bottomed’, sentiment started to rise from depressed levels and business
Chart 50: European Composite Macro Index (CMI) & Monthly changes in CMI
Source: BofAML European Equity and Quant Strategy – Based on BY, GDP Forecasts, OECD, IFO Survey, PPI & EPS Revisions.
Source: Thomson Reuters Datastream
96 98 00 02 04 06 08 10 12 14-40
-30
-20
-10
0
10
20
30
40
-40
-20
0
20
40
60
80
100
120
140
Monthly Changes in Europe's Macro IndexEuropean Composite Macro Indicator (CMI), RHS
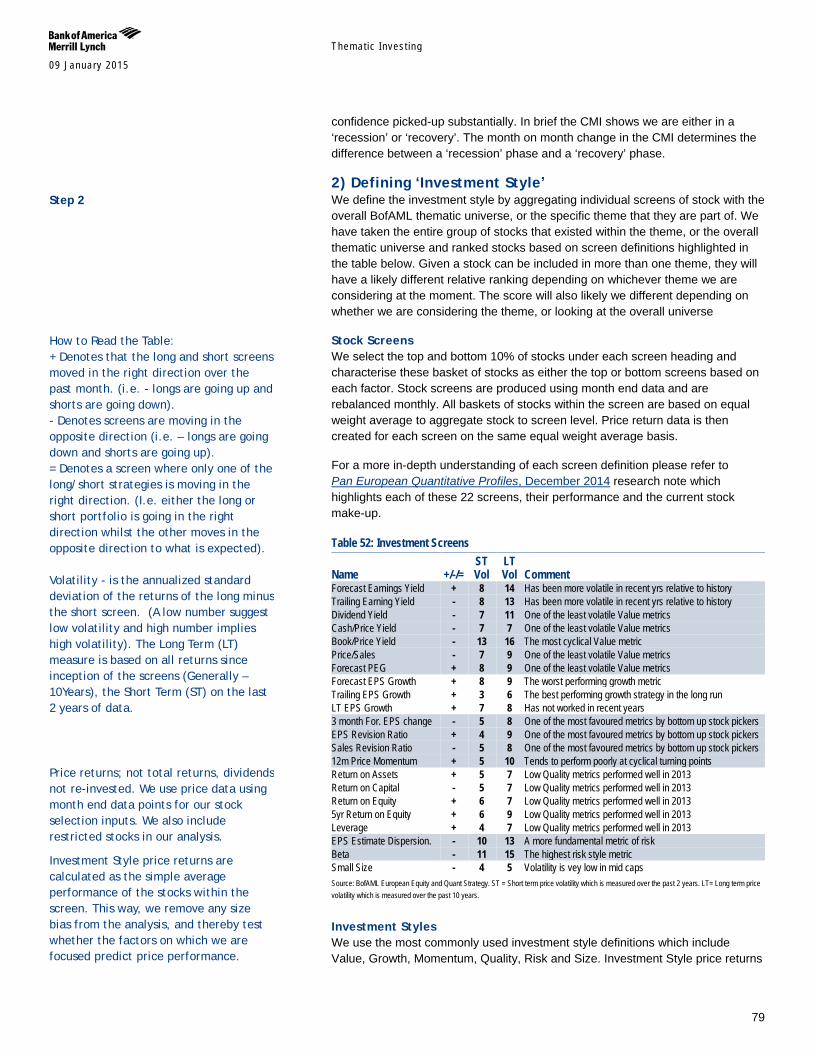
Themat ic Inves t ing 09 January 2015
79
confidence picked-up substantially. In brief the CMI shows we are either in a ‘recession’ or ‘recovery’. The month on month change in the CMI determines the difference between a ‘recession’ phase and a ‘recovery’ phase.
2) Defining ‘Investment Style’ We define the investment style by aggregating individual screens of stock with the overall BofAML thematic universe, or the specific theme that they are part of. We have taken the entire group of stocks that existed within the theme, or the overall thematic universe and ranked stocks based on screen definitions highlighted in the table below. Given a stock can be included in more than one theme, they will have a likely different relative ranking depending on whichever theme we are considering at the moment. The score will also likely we different depending on whether we are considering the theme, or looking at the overall universe
Stock Screens We select the top and bottom 10% of stocks under each screen heading and characterise these basket of stocks as either the top or bottom screens based on each factor. Stock screens are produced using month end data and are rebalanced monthly. All baskets of stocks within the screen are based on equal weight average to aggregate stock to screen level. Price return data is then created for each screen on the same equal weight average basis.
For a more in-depth understanding of each screen definition please refer to Pan European Quantitative Profiles, December 2014 research note which highlights each of these 22 screens, their performance and the current stock make-up.
Table 52: Investment Screens
Name +/-/= ST Vol
LT Vol Comment
Forecast Earnings Yield + 8 14 Has been more volatile in recent yrs relative to history Trailing Earning Yield - 8 13 Has been more volatile in recent yrs relative to history Dividend Yield - 7 11 One of the least volatile Value metrics Cash/Price Yield - 7 7 One of the least volatile Value metrics Book/Price Yield - 13 16 The most cyclical Value metric Price/Sales - 7 9 One of the least volatile Value metrics Forecast PEG + 8 9 One of the least volatile Value metrics Forecast EPS Growth + 8 9 The worst performing growth metric Trailing EPS Growth + 3 6 The best performing growth strategy in the long run LT EPS Growth + 7 8 Has not worked in recent years 3 month For. EPS change - 5 8 One of the most favoured metrics by bottom up stock pickers EPS Revision Ratio + 4 9 One of the most favoured metrics by bottom up stock pickers Sales Revision Ratio - 5 8 One of the most favoured metrics by bottom up stock pickers 12m Price Momentum + 5 10 Tends to perform poorly at cyclical turning points Return on Assets + 5 7 Low Quality metrics performed well in 2013 Return on Capital - 5 7 Low Quality metrics performed well in 2013 Return on Equity + 6 7 Low Quality metrics performed well in 2013 5yr Return on Equity + 6 9 Low Quality metrics performed well in 2013 Leverage + 4 7 Low Quality metrics performed well in 2013 EPS Estimate Dispersion. - 10 13 A more fundamental metric of risk Beta - 11 15 The highest risk style metric Small Size - 4 5 Volatility is vey low in mid caps Source: BofAML European Equity and Quant Strategy. ST = Short term price volatility which is measured over the past 2 years. LT= Long term price volatility which is measured over the past 10 years.
Investment Styles We use the most commonly used investment style definitions which include Value, Growth, Momentum, Quality, Risk and Size. Investment Style price returns
Step 2
How to Read the Table: + Denotes that the long and short screens moved in the right direction over the past month. (i.e. - longs are going up and shorts are going down). - Denotes screens are moving in the opposite direction (i.e. – longs are going down and shorts are going up). = Denotes a screen where only one of the long/short strategies is moving in the right direction. (I.e. either the long or short portfolio is going in the right direction whilst the other moves in the opposite direction to what is expected). Volatility - is the annualized standard deviation of the returns of the long minus the short screen. (A low number suggest low volatility and high number implies high volatility). The Long Term (LT) measure is based on all returns since inception of the screens (Generally – 10Years), the Short Term (ST) on the last 2 years of data.
Price returns; not total returns, dividends not re-invested. We use price data using month end data points for our stock selection inputs. We also include restricted stocks in our analysis.
Investment Style price returns are calculated as the simple average performance of the stocks within the screen. This way, we remove any size bias from the analysis, and thereby test whether the factors on which we are focused predict price performance.
Themat ic Inves t ing 09 January 2015
80
we use are aggregated on an equal weight basis for all screens that fulfil the investment style definition. For example, Value is defined as the 7 portfolios in the table above and including Forecast Earnings Yield and Forecast PEG. Growth is defined as the combination of LT EPS Growth, Forecast Earnings Growth and Trailing EPS Growth, and so on for the remainder of the investment style screens
Investment Style Returns and Phases of the Cycle In step 1 – we defined the cycle. We have a monthly history of which phase of the cycle, the stock market was in, at each point in time. In step 2 – we defined the investment style price returns. We have time-series for price returns based on monthly stock screens. In brief, the ‘Style Cycle’ marries the phase of the cycle to good and bad price returns for different definitions of investment style.
3) Compiling ‘Style Cycle’ Stock Screens Our back tested price returns highlight the combinations of investments styles that are most and least attractive for each phase of the ‘style cycle’. The European Composite Macro Index (CMI) informs investors of the timing of this rotation.
Using the ‘boom’ phase as an example Compiling a stock screen from our analysis is dependent upon which phase of the cycle we are currently recommending. For example if the CMI is highlighting a preference for the ‘boom’ phase of the cycle, then past performance suggests the appropriate combination of investment styles to overweight/ underweight vs. the Thematic Universe, or Theme are as follows:
Top Stock+s – Small Caps, High Risk, Low Quality and Rising EPS Momentum.
Bottom Stocks – Large Caps, Low Risk, High Quality and Falling EPS Momentum.
The top and bottom screens for the ‘boom’ phase are based on an initial stock universe based on the 250 largest stocks ranked by market capitalisation. We use month end data as the latest data points.
Each stock will have an aggregate percentile rank for Value, Growth, and Momentum. We use the 60-month beta as a measure of Risk and RoE (Return on Equity) as the measure of Quality. All definitions are based on the description provided in step 2.
We then filter the list of 250 stocks by each factor - we do not exclude restricted stocks from this screening process. Small caps are defined as the bottom 200 stocks when ranked by market caps, and Large caps those in the top 100 stocks by market cap.
Good Value stocks are perceived to be those stocks with a percentile rank greater than 50, those with a rank less than 50 are perceived to offer poor Value.
High Growth stocks have a percentile rank greater than 50, and low Growth stocks have a percentile rank less than 50.
Stocks with rising Momentum have a percentile rank greater than 50, and falling Momentum less than 50
A beta greater than 1 highlights stocks with high Risk, and a beta less than 1 highlights stocks with low Risk.
Step 3
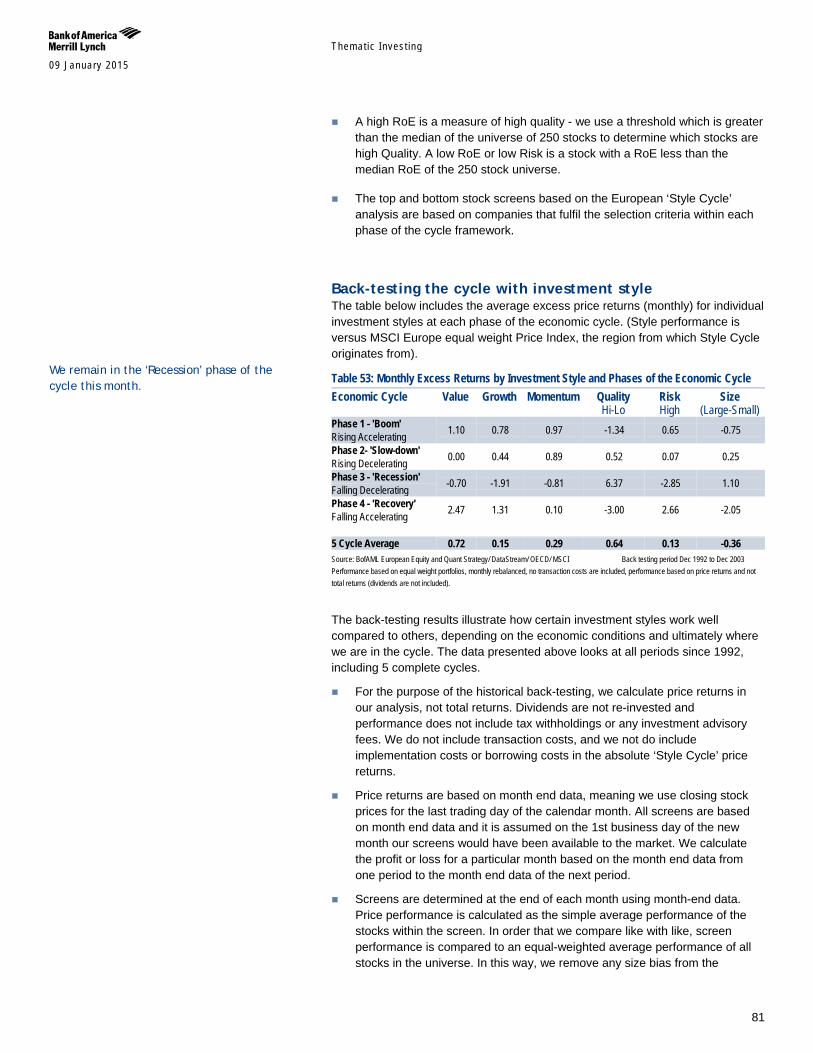
Themat ic Inves t ing 09 January 2015
81
A high RoE is a measure of high quality - we use a threshold which is greater than the median of the universe of 250 stocks to determine which stocks are high Quality. A low RoE or low Risk is a stock with a RoE less than the median RoE of the 250 stock universe.
The top and bottom stock screens based on the European ‘Style Cycle’ analysis are based on companies that fulfil the selection criteria within each phase of the cycle framework.
Back-testing the cycle with investment style The table below includes the average excess price returns (monthly) for individual investment styles at each phase of the economic cycle. (Style performance is versus MSCI Europe equal weight Price Index, the region from which Style Cycle originates from).
Table 53: Monthly Excess Returns by Investment Style and Phases of the Economic Cycle Economic Cycle Value Growth Momentum Quality
Hi-Lo Risk High
Size (Large-Small)
Phase 1 - 'Boom' Rising Accelerating 1.10 0.78 0.97 -1.34 0.65 -0.75
Phase 2- 'Slow-down' Rising Decelerating 0.00 0.44 0.89 0.52 0.07 0.25
Phase 3 - 'Recession' Falling Decelerating -0.70 -1.91 -0.81 6.37 -2.85 1.10
Phase 4 - 'Recovery' Falling Accelerating 2.47 1.31 0.10 -3.00 2.66 -2.05
5 Cycle Average 0.72 0.15 0.29 0.64 0.13 -0.36 Source: BofAML European Equity and Quant Strategy/ DataStream/ OECD/ MSCI Back testing period Dec 1992 to Dec 2003 Performance based on equal weight portfolios, monthly rebalanced, no transaction costs are included, performance based on price returns and not total returns (dividends are not included).
The back-testing results illustrate how certain investment styles work well compared to others, depending on the economic conditions and ultimately where we are in the cycle. The data presented above looks at all periods since 1992, including 5 complete cycles.
For the purpose of the historical back-testing, we calculate price returns in our analysis, not total returns. Dividends are not re-invested and performance does not include tax withholdings or any investment advisory fees. We do not include transaction costs, and we not do include implementation costs or borrowing costs in the absolute ‘Style Cycle’ price returns.
Price returns are based on month end data, meaning we use closing stock prices for the last trading day of the calendar month. All screens are based on month end data and it is assumed on the 1st business day of the new month our screens would have been available to the market. We calculate the profit or loss for a particular month based on the month end data from one period to the month end data of the next period.
Screens are determined at the end of each month using month-end data. Price performance is calculated as the simple average performance of the stocks within the screen. In order that we compare like with like, screen performance is compared to an equal-weighted average performance of all stocks in the universe. In this way, we remove any size bias from the
We remain in the ‘Recession’ phase of the cycle this month.
Themat ic Inves t ing 09 January 2015
82
analysis, and thereby test whether the factors on which we are focused predict price performance. It is noteworthy that BofA Merrill Lynch restricted stocks have not been excluded from any part of the historical monthly screens as defined as the back-test period.
Back-tested performance is hypothetical in nature and reflects application of the screen prior to its introduction and is not intended to be indicative of future performance.
Summarising the results - we draw the following conclusions Phase 1 ‘Boom’ - investors have benefited most by being overweight Momentum (Rising Price & EPS), High Risk (High Beta & High Estimate Dispersion), Small Caps vs. Large Caps and being Neutral on Value vs. Growth.
Phase 2 ‘Slow-down’ - investors have benefited most by overweighting Growth vs. Value, Momentum (Rising Price & EPS), High Quality (Strong Balance Sheet indicators), Low Risk (Low Beta & Low Estimate Dispersion) and Large Caps vs. Small Caps.
Phase 3 ‘Recession’ – overweight Value vs. Growth, High Quality (Strong Balance Sheet indicators), Low Risk (Low Beta & Low Estimate Dispersion) and Large Caps vs. Small Caps.
Phase 4 ‘Recovery’ – overweight Value vs. Growth, Momentum (Rising Price & EPS), Low Quality (Weak Balance Sheet indicators), High Risk & Small vs. Large Caps.
Value Factors Forecast Earnings Yield: I/B/E/S next twelve month EPS divided by month end Price.
Trailing Earnings Yield: Trailing twelve month EPS divided by month end Price.
Dividend Yield: Trailing twelve month Dividend per share divided by month end Price.
Cash to Price: Trailing 12 month cash earnings per share divided by month end price. Cash Earnings are defined as earnings plus depreciation on fixed assets. (i.e. –not free cash flow)
Book to Price: Trailing twelve month Book Value per share divided by month end Price.
Price to Sales: Month End Price divided by last reported Sales per share figure.
Forecast PEG: I/B/E/S FY1 P/E divided by I/B/E/S Long Term Growth Estimate
Growth Factors Forecast Earnings Growth: I/B/E/S FY2 Mean EPS Estimate less latest reported EPS divided by month end price.
Themat ic Inves t ing 09 January 2015
83
Trailing Earnings Growth: Difference between Trailing Twelve Month EPS and Trailing Twelve Month EPS a year prior divided by absolute value of Trailing Twelve Month EPS a year prior.
Forecast EPS Change: Difference between I/B/E/S Forecast Twelve Month EPS and I/B/E/S Forecast Twelve Month EPS a year prior divided by I/B/E/S Forecast Twelve Month EPS a year prior.
Long Term Mean EPS Growth: I/B/E/S Mean Long Term Growth Estimate (+5years).
Momentum Factors 3 Month Change in Mean EPS: Difference between I/B/E/S FY1 mean EPS and I/B/E/S FY1 mean EPS 3 months prior, divided by absolute value of I/B/E/S FY1 mean EPS 3 months prior.
Earnings Revision Ratio: ((# of FY1 and FY2 upward EPS revisions over last 3 months)-(# of FY1 and FY2 downward EPS revisions over last 3 months))/ # of FY1 and FY2 estimates over last 3 months.
Sales Revision Ratio: ((# of FY1 and FY2 upward Sales revisions over last 3 months)-(# of FY1 and FY2 downward Sales revisions over last 3 months))/ # of FY1 and FY2 estimates over last 3 months.
1m Price Momentum: Latest month-end price / 1-month ago price.
12m Price Momentum: Latest month-end price / 12-months ago price.
Risk Factors Beta: Calculated using regression analysis on 60 months of price performance versus the benchmark. High beta stocks have a high correlation to the market, whilst low beta stocks have a low correlation to market movements.
EPS Estimate Dispersion: Coefficient of variation of I/B/E/S FY2 EPS estimates. The coefficient of variation is defined as the Standard Deviation of Estimates divided by the absolute value of the Mean Estimate.
Quality Factors Return on Assets: Annual Earnings divided by Total Assets
Return on Capital: Annual Earnings divided by Total Capital
Return on Equity – 1yr: Trailing Twelve Month EPS divided by Trailing Twelve Month Book value per Share
Return on Equity – 5yrs: Average RoE over the last 5 years
Leverage: Annual Long Term Debt/ (Annual Long Term Debt +Annual Book Value)
Investment Styles Value: Equal weighted combination of factors - Forecast/Trailing EPS Yield, Dividend Yield, Cash to Price Yield, Book to Price Yield, Price to Sales and Forecast PEG.
Growth: Equal weighted combination of factors - Forecast/Trailing EPS Growth, Forecast EPS Change and Forecast Long Term Growth.
Momentum: Equal weighted combination of factors - 3m EPS Change, EPS Revision Ratio, Sales Revision Ratio, 1m Price Change and 12m Price Change.
Themat ic Inves t ing 09 January 2015
84
Quality: Equal weighted combination of factors - Return on Assets, Return on Capital, Return on Equity, 5yr Return on Equity and Leverage.
Risk: Equal weighted combination of factors - .EPS Estimate Dispersion and Beta
Multi Factor Models STYLE CYCLE: The European ‘Style Cycle’ links phases of the economic cycle with the performance of investment style. Stocks are screened based on their equal weighted rank of Value, Growth, Momentum, Quality and Risk.
Absolute return Absolute return is calculated based on monthly returns and reflects simple price appreciation (depreciation) over the stated period of the screened stocks. For purposes of this calculation, the stocks in the screen are assumed to be equally weighted. Returns do not reflect dividend or costs.
Relative return Relative return is calculated based on monthly returns and reflects simple price appreciation (depreciation) over the stated period of the screened stocks minus the return for our Equal weighted European Universe. Returns do not reflect dividend or costs.

Themat ic Inves t ing 09 January 2015
85
Analyst Certification I, Beijia Ma, hereby certify that the views expressed in this research report about securities and issuers accurately reflect the research model applied in such analysis. I also certify that no part of my compensation was, is, or will be, directly or indirectly, related to the specific recommendations or view expressed in this research report.
Themat ic Inves t ing 09 January 2015
86
Important Disclosures
FUNDAMENTAL EQUITY OPINION KEY: Opinions include a Volatility Risk Rating, an Investment Rating and an Income Rating. VOLATILITY RISK RATINGS, indicators of potential price fluctuation, are: A - Low, B - Medium and C - High. INVESTMENT RATINGS reflect the analyst’s assessment of a stock’s: (i) absolute total return potential and (ii) attractiveness for investment relative to other stocks within its Coverage Cluster (defined below). There are three investment ratings: 1 - Buy stocks are expected to have a total return of at least 10% and are the most attractive stocks in the coverage cluster; 2 - Neutral stocks are expected to remain flat or increase in value and are less attractive than Buy rated stocks and 3 - Underperform stocks are the least attractive stocks in a coverage cluster. Analysts assign investment ratings considering, among other things, the 0-12 month total return expectation for a stock and the firm’s guidelines for ratings dispersions (shown in the table below). The current price objective for a stock should be referenced to better understand the total return expectation at any given time. The price objective reflects the analyst’s view of the potential price appreciation (depreciation). Investment rating Total return expectation (within 12-month period of date of initial rating) Ratings dispersion guidelines for coverage cluster*
Buy ≥ 10% ≤ 70% Neutral ≥ 0% ≤ 30%
Underperform N/A ≥ 20% * Ratings dispersions may vary from time to time where BofA Merrill Lynch Research believes it better reflects the investment prospects of stocks in a Coverage Cluster.
INCOME RATINGS, indicators of potential cash dividends, are: 7 - same/higher (dividend considered to be secure), 8 - same/lower (dividend not considered to be secure) and 9 - pays no cash dividend. Coverage Cluster is comprised of stocks covered by a single analyst or two or more analysts sharing a common industry, sector, region or other classification(s). A stock’s coverage cluster is included in the most recent BofA Merrill Lynch Comment referencing the stock.
BofA Merrill Lynch Research personnel (including the analyst(s) responsible for this report) receive compensation based upon, among other factors, the overall profitability of Bank of America Corporation, including profits derived from investment banking revenues.
Other Important Disclosures
Officers of MLPF&S or one or more of its affiliates (other than research analysts) may have a financial interest in securities of the issuer(s) or in related investments.
From time to time research analysts conduct site visits of covered companies. BofA Merrill Lynch policies prohibit research analysts from accepting payment or reimbursement for travel expenses from the company for such visits.
BofA Merrill Lynch Global Research policies relating to conflicts of interest are described at http://www.ml.com/media/43347.pdf. "BofA Merrill Lynch" includes Merrill Lynch, Pierce, Fenner & Smith Incorporated ("MLPF&S") and its affiliates. Investors should contact their BofA
Merrill Lynch representative or Merrill Lynch Global Wealth Management financial advisor if they have questions concerning this report. "BofA Merrill Lynch" and "Merrill Lynch" are each global brands for BofA Merrill Lynch Global Research.
Information relating to Non-US affiliates of BofA Merrill Lynch and Distribution of Affiliate Research Reports: MLPF&S distributes, or may in the future distribute, research reports of the following non-US affiliates in the US (short name: legal name): Merrill Lynch (France):
Merrill Lynch Capital Markets (France) SAS; Merrill Lynch (Frankfurt): Merrill Lynch International Bank Ltd., Frankfurt Branch; Merrill Lynch (South Africa): Merrill Lynch South Africa (Pty) Ltd.; Merrill Lynch (Milan): Merrill Lynch International Bank Limited; MLI (UK): Merrill Lynch International; Merrill Lynch (Australia): Merrill Lynch Equities (Australia) Limited; Merrill Lynch (Hong Kong): Merrill Lynch (Asia Pacific) Limited; Merrill Lynch (Singapore): Merrill Lynch (Singapore) Pte Ltd.; Merrill Lynch (Canada): Merrill Lynch Canada Inc; Merrill Lynch (Mexico): Merrill Lynch Mexico, SA de CV, Casa de Bolsa; Merrill Lynch (Argentina): Merrill Lynch Argentina SA; Merrill Lynch (Japan): Merrill Lynch Japan Securities Co., Ltd.; Merrill Lynch (Seoul): Merrill Lynch International Incorporated (Seoul Branch); Merrill Lynch (Taiwan): Merrill Lynch Securities (Taiwan) Ltd.; DSP Merrill Lynch (India): DSP Merrill Lynch Limited; PT Merrill Lynch (Indonesia): PT Merrill Lynch Indonesia; Merrill Lynch (Israel): Merrill Lynch Israel Limited; Merrill Lynch (Russia): OOO Merrill Lynch Securities, Moscow; Merrill Lynch (Turkey I.B.): Merrill Lynch Yatirim Bank A.S.; Merrill Lynch (Turkey Broker): Merrill Lynch Menkul Değerler A.Ş.; Merrill Lynch (Dubai): Merrill Lynch International, Dubai Branch; MLPF&S (Zurich rep. office): MLPF&S Incorporated Zurich representative office; Merrill Lynch (Spain): Merrill Lynch Capital Markets Espana, S.A.S.V.; Merrill Lynch (Brazil): Bank of America Merrill Lynch Banco Multiplo S.A.; Merrill Lynch KSA Company, Merrill Lynch Kingdom of Saudi Arabia Company.
This research report has been approved for publication and is distributed in the United Kingdom to professional clients and eligible counterparties (as each is defined in the rules of the Financial Conduct Authority and the Prudential Regulation Authority) by Merrill Lynch International and Bank of America Merrill Lynch International Limited, which are authorized by the Prudential Regulation Authority and regulated by the Financial Conduct Authority and the Prudential Regulation Authority, and is distributed in the United Kingdom to retail clients (as defined in the rules of the Financial Conduct Authority and the Prudential Regulation Authority) by Merrill Lynch International Bank Limited, London Branch, which is authorised by the Central Bank of Ireland and subject to limited regulation by the Financial Conduct Authority and Prudential Regulation Authority - details about the extent of our regulation by the Financial Conduct Authority and Prudential Regulation Authority are available from us on request; has been considered and distributed in Japan by Merrill Lynch Japan Securities Co., Ltd., a registered securities dealer under the Financial Instruments and Exchange Act in Japan; is distributed in Hong Kong by Merrill Lynch (Asia Pacific) Limited, which is regulated by the Hong Kong SFC and the Hong Kong Monetary Authority is issued and distributed in Taiwan by Merrill Lynch Securities (Taiwan) Ltd.; is issued and distributed in India by DSP Merrill Lynch Limited; and is issued and distributed in Singapore to institutional investors and/or accredited investors (each as defined under the Financial Advisers Regulations) by Merrill Lynch International Bank Limited (Merchant Bank) and Merrill Lynch (Singapore) Pte Ltd. (Company Registration No.’s F 06872E and 198602883D respectively). Merrill Lynch International Bank Limited (Merchant Bank) and Merrill Lynch (Singapore) Pte Ltd. are regulated by the Monetary Authority of Singapore. Bank of America N.A., Australian Branch (ARBN 064 874 531), AFS License 412901 (BANA Australia) and Merrill Lynch Equities (Australia) Limited (ABN 65 006 276 795), AFS License 235132 (MLEA) distributes this report in Australia only to 'Wholesale' clients as defined by s.761G of the Corporations Act 2001. With the exception of BANA Australia, neither MLEA nor any of its affiliates involved in preparing this research report is an Authorised Deposit-Taking Institution under the Banking Act 1959 nor regulated by the Australian Prudential Regulation Authority. No approval is required for publication or distribution of this report in Brazil and its local distribution is made by Bank of America Merrill Lynch Banco Múltiplo S.A. in accordance with applicable regulations. Merrill Lynch (Dubai) is authorized and regulated by the Dubai Financial Services Authority (DFSA). Research reports prepared and issued by Merrill Lynch (Dubai) are prepared and issued in accordance with the requirements of the DFSA conduct of business rules.
Merrill Lynch (Frankfurt) distributes this report in Germany. Merrill Lynch (Frankfurt) is regulated by BaFin. This research report has been prepared and issued by MLPF&S and/or one or more of its non-US affiliates. MLPF&S is the distributor of this research report in
the US and accepts full responsibility for research reports of its non-US affiliates distributed to MLPF&S clients in the US. Any US person receiving this research
Themat ic Inves t ing 09 January 2015
87
report and wishing to effect any transaction in any security discussed in the report should do so through MLPF&S and not such foreign affiliates. Hong Kong recipients of this research report should contact Merrill Lynch (Asia Pacific) Limited in respect of any matters relating to dealing in securities or provision of specific advice on securities. Singapore recipients of this research report should contact Merrill Lynch International Bank Limited (Merchant Bank) and/or Merrill Lynch (Singapore) Pte Ltd in respect of any matters arising from, or in connection with, this research report.
General Investment Related Disclosures: Taiwan Readers: Neither the information nor any opinion expressed herein constitutes an offer or a solicitation of an offer to transact in any securities or other
financial instrument. No part of this report may be used or reproduced or quoted in any manner whatsoever in Taiwan by the press or any other person without the express written consent of BofA Merrill Lynch.
This research report provides general information only. Neither the information nor any opinion expressed constitutes an offer or an invitation to make an offer, to buy or sell any securities or other financial instrument or any derivative related to such securities or instruments (e.g., options, futures, warrants, and contracts for differences). This report is not intended to provide personal investment advice and it does not take into account the specific investment objectives, financial situation and the particular needs of any specific person. Investors should seek financial advice regarding the appropriateness of investing in financial instruments and implementing investment strategies discussed or recommended in this report and should understand that statements regarding future prospects may not be realized. Any decision to purchase or subscribe for securities in any offering must be based solely on existing public information on such security or the information in the prospectus or other offering document issued in connection with such offering, and not on this report.
Securities and other financial instruments discussed in this report, or recommended, offered or sold by Merrill Lynch, are not insured by the Federal Deposit Insurance Corporation and are not deposits or other obligations of any insured depository institution (including, Bank of America, N.A.). Investments in general and, derivatives, in particular, involve numerous risks, including, among others, market risk, counterparty default risk and liquidity risk. No security, financial instrument or derivative is suitable for all investors. In some cases, securities and other financial instruments may be difficult to value or sell and reliable information about the value or risks related to the security or financial instrument may be difficult to obtain. Investors should note that income from such securities and other financial instruments, if any, may fluctuate and that price or value of such securities and instruments may rise or fall and, in some cases, investors may lose their entire principal investment. Past performance is not necessarily a guide to future performance. Levels and basis for taxation may change.
This report may contain a short-term trading idea or recommendation, which highlights a specific near-term catalyst or event impacting the company or the market that is anticipated to have a short-term price impact on the equity securities of the company. Short-term trading ideas and recommendations are different from and do not affect a stock's fundamental equity rating, which reflects both a longer term total return expectation and attractiveness for investment relative to other stocks within its Coverage Cluster. Short-term trading ideas and recommendations may be more or less positive than a stock's fundamental equity rating.
BofA Merrill Lynch is aware that the implementation of the ideas expressed in this report may depend upon an investor's ability to "short" securities or other financial instruments and that such action may be limited by regulations prohibiting or restricting "shortselling" in many jurisdictions. Investors are urged to seek advice regarding the applicability of such regulations prior to executing any short idea contained in this report.
Foreign currency rates of exchange may adversely affect the value, price or income of any security or financial instrument mentioned in this report. Investors in such securities and instruments, including ADRs, effectively assume currency risk.
UK Readers: The protections provided by the U.K. regulatory regime, including the Financial Services Scheme, do not apply in general to business coordinated by BofA Merrill Lynch entities located outside of the United Kingdom. BofA Merrill Lynch Global Research policies relating to conflicts of interest are described at http://www.ml.com/media/43347.pdf.
Officers of MLPF&S or one or more of its affiliates (other than research analysts) may have a financial interest in securities of the issuer(s) or in related investments.
MLPF&S or one of its affiliates is a regular issuer of traded financial instruments linked to securities that may have been recommended in this report. MLPF&S or one of its affiliates may, at any time, hold a trading position (long or short) in the securities and financial instruments discussed in this report.
BofA Merrill Lynch, through business units other than BofA Merrill Lynch Global Research, may have issued and may in the future issue trading ideas or recommendations that are inconsistent with, and reach different conclusions from, the information presented in this report. Such ideas or recommendations reflect the different time frames, assumptions, views and analytical methods of the persons who prepared them, and BofA Merrill Lynch is under no obligation to ensure that such other trading ideas or recommendations are brought to the attention of any recipient of this report.
In the event that the recipient received this report pursuant to a contract between the recipient and MLPF&S for the provision of research services for a separate fee, and in connection therewith MLPF&S may be deemed to be acting as an investment adviser, such status relates, if at all, solely to the person with whom MLPF&S has contracted directly and does not extend beyond the delivery of this report (unless otherwise agreed specifically in writing by MLPF&S). MLPF&S is and continues to act solely as a broker-dealer in connection with the execution of any transactions, including transactions in any securities mentioned in this report.
Copyright and General Information regarding Research Reports: Copyright 2015 Merrill Lynch, Pierce, Fenner & Smith Incorporated. All rights reserved. iQmethod, iQmethod 2.0, iQprofile, iQtoolkit, iQworks are service marks
of Bank of America Corporation. iQanalytics®, iQcustom®, iQdatabase® are registered service marks of Bank of America Corporation. This research report is prepared for the use of BofA Merrill Lynch clients and may not be redistributed, retransmitted or disclosed, in whole or in part, or in any form or manner, without the express written consent of BofA Merrill Lynch. BofA Merrill Lynch Global Research reports are distributed simultaneously to internal and client websites and other portals by BofA Merrill Lynch and are not publicly-available materials. Any unauthorized use or disclosure is prohibited. Receipt and review of this research report constitutes your agreement not to redistribute, retransmit, or disclose to others the contents, opinions, conclusion, or information contained in this report (including any investment recommendations, estimates or price targets) without first obtaining expressed permission from an authorized officer of BofA Merrill Lynch.
Materials prepared by BofA Merrill Lynch Global Research personnel are based on public information. Facts and views presented in this material have not been reviewed by, and may not reflect information known to, professionals in other business areas of BofA Merrill Lynch, including investment banking personnel. BofA Merrill Lynch has established information barriers between BofA Merrill Lynch Global Research and certain business groups. As a result, BofA Merrill Lynch does not disclose certain client relationships with, or compensation received from, such companies in research reports. To the extent this report discusses any legal proceeding or issues, it has not been prepared as nor is it intended to express any legal conclusion, opinion or advice. Investors should consult their own legal advisers as to issues of law relating to the subject matter of this report. BofA Merrill Lynch Global Research personnel’s knowledge of legal proceedings in which any BofA Merrill Lynch entity and/or its directors, officers and employees may be plaintiffs, defendants, co-defendants or co-plaintiffs with or involving companies mentioned in this report is based on public information. Facts and views presented in this material that relate to any such proceedings have not been reviewed by, discussed with, and may not reflect information known to, professionals in other business areas of BofA Merrill Lynch in connection with the legal proceedings or matters relevant to such proceedings.
This report has been prepared independently of any issuer of securities mentioned herein and not in connection with any proposed offering of securities or as agent of any issuer of any securities. None of MLPF&S, any of its affiliates or their research analysts has any authority whatsoever to make any representation or warranty on behalf of the issuer(s). BofA Merrill Lynch Global Research policy prohibits research personnel from disclosing a recommendation, investment rating, or investment thesis for review by an issuer prior to the publication of a research report containing such rating, recommendation or investment thesis.
Any information relating to the tax status of financial instruments discussed herein is not intended to provide tax advice or to be used by anyone to provide tax advice. Investors are urged to seek tax advice based on their particular circumstances from an independent tax professional.
The information herein (other than disclosure information relating to BofA Merrill Lynch and its affiliates) was obtained from various sources and we do not guarantee its accuracy. This report may contain links to third-party websites. BofA Merrill Lynch is not responsible for the content of any third-party website or any

Themat ic Inves t ing 09 January 2015
88
linked content contained in a third-party website. Content contained on such third-party websites is not part of this report and is not incorporated by reference into this report. The inclusion of a link in this report does not imply any endorsement by or any affiliation with BofA Merrill Lynch. Access to any third-party website is at your own risk, and you should always review the terms and privacy policies at third-party websites before submitting any personal information to them. BofA Merrill Lynch is not responsible for such terms and privacy policies and expressly disclaims any liability for them.
Subject to the quiet period applicable under laws of the various jurisdictions in which we distribute research reports and other legal and BofA Merrill Lynch policy-related restrictions on the publication of research reports, fundamental equity reports are produced on a regular basis as necessary to keep the investment recommendation current.
Certain outstanding reports may contain discussions and/or investment opinions relating to securities, financial instruments and/or issuers that are no longer current. Always refer to the most recent research report relating to a company or issuer prior to making an investment decision.
In some cases, a company or issuer may be classified as Restricted or may be Under Review or Extended Review. In each case, investors should consider any investment opinion relating to such company or issuer (or its security and/or financial instruments) to be suspended or withdrawn and should not rely on the analyses and investment opinion(s) pertaining to such issuer (or its securities and/or financial instruments) nor should the analyses or opinion(s) be considered a solicitation of any kind. Sales persons and financial advisors affiliated with MLPF&S or any of its affiliates may not solicit purchases of securities or financial instruments that are Restricted or Under Review and may only solicit securities under Extended Review in accordance with firm policies.
Neither BofA Merrill Lynch nor any officer or employee of BofA Merrill Lynch accepts any liability whatsoever for any direct, indirect or consequential damages or losses arising from any use of this report or its contents.