there is more to arrhythmia treatment than the device itself€¦ · · 2017-06-22stock price....
TRANSCRIPT

JMP Securities Financial Services & Real Estate Conference June 22, 2017
Alleghany

2 2
In the Beginning... a Railroad Holding Company

3
$-
$100
$200
$300
$400
$500
$600
$700
2001 2002 2003 2004 2005 2006 2007 2008 2009 2010 2011 2012 2013 2014 2015 2016 Mar-17 Jun-17
Val
ue
Per
Sh
are
BVPS Stock Price
Recent History – Significant Transactions
3
(sold 2008) (sold 2013)
Note: Jazwares shown in 2014 when initial interest was acquired. Majority position acquired in 2016.

4
Alleghany Business Model – Income Generation Through Insurance, Private Capital and Total Return Investing
Repay Debt
Underwriting Returns
Investment Returns
TransRe
Alleghany Corporation
Strategic Investments
Public Securities Dividends Acquisitions Share
Repurchases
Investments M&A Capital Management
Dividends
RSUI
CapSpecialty
PacificComp
Alleghany Capital
Corporation
Dividends
Investments

5
Consolidated: Alleghany Capital:
Stockholders' Equity $ 8,185 Stranded Oil $ 146 1.6%
Parent Company Debt 992 Bourn & Koch 63 0.7%
Total Capital $ 9,177 Kentucky Trailer 59 0.6%
IPS 90 1.0%
Jazwares 235 2.6%
Corporate and other (8) (0.1%)
Total Alleghany Capital $ 585 6.4%
(Re)insurance:
TransRe $ 5,260 57.3% Other:
TransRe ownership of CapSpecialty (78) (0.8%) Cash and marketable securities(1) $ 1,049 11.4%
RSUI 1,648 18.0% Investment in Ares 225 2.5%
CapSpecialty 330 3.6% Alleghany Properties 34 0.4%
PacificComp 120 1.3% Other items, net 4 0.0%
Total (Re)insurance $ 7,280 79.3% Total Other $ 1,312 14.3%
Capital Allocation as of March 31, 2017 $ in millions
(1) Cash and public investments excludes cash at the TransRe holding company ($52.5 million at 3/31/2017), which is included in TransRe capital.

6
Acquired March 6, 2012 for $3.5 billion in cash and stock
$1.6 billion of underwriting profits from acquisition date through 1Q 2017
Cumulative combined ratio of 90.9% since acquisition (March 2012 – 1Q 2017)
Strong and significantly de-risked balance sheet (no legacy AIG liabilities)
Upgraded by A.M. Best to “A+ (Superior)” Financial Strength
Gen Re underwriting relationship continues to progress very well
Despite industry headwinds, TransRe continues to differentiate and deliver
profitable and diverse earnings
$5.3 billion of stockholders’ equity and has returned net dividends of $841 and
repaid $667 million in senior notes as of 1Q 2017
6
7
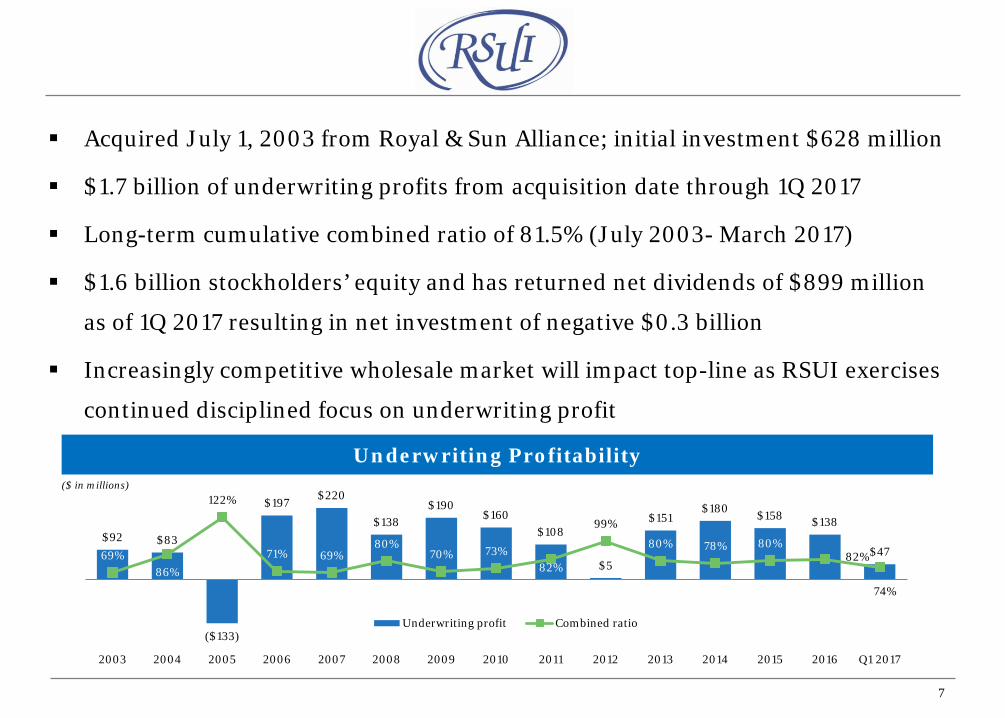
Acquired July 1, 2003 from Royal & Sun Alliance; initial investment $628 million
$1.7 billion of underwriting profits from acquisition date through 1Q 2017
Long-term cumulative combined ratio of 81.5% (July 2003- March 2017)
$1.6 billion stockholders’ equity and has returned net dividends of $899 million
as of 1Q 2017 resulting in net investment of negative $0.3 billion
Increasingly competitive wholesale market will impact top-line as RSUI exercises
continued disciplined focus on underwriting profit
7
$92 $83
($133)
$197 $220
$138 $190
$160 $108
$5
$151 $180 $158 $138
$47 69% 86%
122%
71% 69% 80%
70% 73% 82%
99%
80% 78% 80% 82%
74%
2003 2004 2005 2006 2007 2008 2009 2010 2011 2012 2013 2014 2015 2016 Q1 2017
Underwriting profit Combined ratio
Underwriting Profitability
($ in millions)

8
Small-business specialty insurer with professional liability, regional binding authority, and commercial surety business
New professional lines products driving top-line growth – now represent ~1/3 of the company
Commercial surety has excellent long-term underwriting record
Expense ratio and process improvements occurring, but taking time
2016 underwriting profit is the first since 2010
8

9
287%
186%
129% 114%
102%
2012 2013 2014 2015 2016
First acquired in 2007; significant losses during financial crisis Recruited Jan Frank in 2012 to reinvent the company Transformed to largely non-LA basin specialist distributing through agents Revamped claims process and streamlined expense structure is delivering
growth and profitability Turn-around is progressing very well
9
Combined Ratio Gross Premiums Written
$19
$42
$71
$103
$140
2012 2013 2014 2015 2016
($ in millions)

10
Investments
Investments are a significant part of our earnings power
Total Cash & Investments
Total Equity =
$18.9 billion
$7.6 billion(1) = 2.49x investment leverage(1)
Portfolio is structured to meet (re)insurance obligations, withstand macroeconomic headwinds and avoid permanent loss of capital
(1) Portfolio as of March 31, 2017. Figures adjusted to exclude Alleghany Capital subsidiaries.
Debt Securities 69% Commercial Mortgage
Loans 3%
Equity Securities
12%
Short-term 9%
Cash 3%
Other Invested Assets 4%
Note: Equity security allocation as of 3/31/17 was artificially low and short term securities high due to timing of redeploying capital into new passive equity strategies

11
Fixed Income: Preserve Capital and Support Liabilities
Total: $15.4 billion (1) Credit quality statistics exclude short term securities and commercial mortgage loans
Sector Allocation Credit Quality(1)
Average Duration: 4.5 years Credit Quality: AA- / Aa3
($ in billions)
Municipal Bonds 27%
U.S. Government 7%
Foreign Government 7%
U.S. Corporate 15%
Foreign Corporate
8%
MBS, CMBS and ABS 21%
Commerical Mortgage Loans 4%
Short Term 11%
$2.4
$5.7
$2.4
$1.8
$0.8
AAA/Aaa
AA/Aa
A/A
BBB/Baa
Below BBB/Baa and not rated

12
Public Equity Investments: Fundamental Research, Long-Term Focus
Largest Eight Positions Account for ~70% of the Core Portfolio
Core active equity securities: ~$2 billion
Strong businesses at reasonable prices based on fundamental research
Blue chip, best in class businesses
Relatively sector neutral
Note: Position data as of March 31, 2017
Go forward passive equities: ~$1.4 billion
Transitioning a Portion of the Portfolio to Passive Strategies

13
Alleghany Capital Corporation Core Portfolio
Company Description Sector Founded Acquired %
Owned
IPS-Integrated Project Services, LLC (“IPS”) is a technical engineering-focused service provider focused on the global pharmaceutical and biotechnology industries.
IPS is headquartered in Blue Bell, Pennsylvania.
Business Services 1989 2015 84%
Jazwares, LLC (“Jazwares”) is a a toy and consumer electronics company.
Peppa Pig, Minecraft & Animal Jam are some of the brands they represent.
Jazwares is headquartered in Sunrise, Florida.
Consumer 1997 2016(1) 80%
R.C. Tway Company, LLC (“Kentucky Trailer”) is a manufacturer of custom trailers and truck bodies for the moving and storage industry and other markets
Kentucky Trailer is headquartered in Louisville, Kentucky.
Manufacturing 1879 2013 78%
Bourn & Koch, Inc. (“Bourn & Koch”) is a manufacturer and remanufacturer/retrofitter of precision machine tools and supplier of replacement parts.
Bourn & Koch is headquartered in Rockford, Illinois.
Manufacturing 1975 2012 89%
W&W AFCO Steel (“W&W | AFCO”) is a leading provider of structural steel fabrication and erection services.
W&W | AFCO is headquartered in Oklahoma City, Oklahoma.
Infrastructure 1945 2017 80%
(1) 30% stake acquired in 2014. Additional 50% acquired in 2016.

14
Key Alleghany Takeaways
Long-term focus with track record of book value growth
TransRe and RSUI are top-tier players in their markets
Significant investment capability
Disciplined underwriting and risk management through insurance cycles
Non-financial businesses likely to be larger contributors in the future
Holding company maintains significant optionality through excess liquidity and avoidance of excessive leverage
Long-term goal is to compound book value per share at 7-10% in this economic environment without taking imprudent risks

15
Forward-Looking Statements This presentation contains “forward-looking statements” within the meaning of the Private Securities Litigation Reform Act of 1995. These forward-looking statements are not historical facts but instead represent only Alleghany’s belief regarding future events, many of which, by their nature, are inherently uncertain and outside Alleghany’s control. Except for Alleghany’s ongoing obligation to disclose material information as required by federal securities laws, Alleghany is not under any obligation (and expressly disclaims any obligation) to update or alter any projections, goals, assumptions, or other statements, whether written or oral, that may be made from time to time, whether as a result of new information, future events or otherwise. Factors that could cause Alleghany’s actual results and experience to differ, possibly materially, from those expressed in the forward-looking statements include the factors set forth in Alleghany’s most recent Annual Report on Form 10-K and Quarterly Reports on Form 10-Q filed with the United States Securities and Exchange Commission and made available on Alleghany’s website at www.alleghany.com.

16
Non-GAAP Financial Measures This document and the remarks made during the presentation today may also contain non-GAAP financial measures. Reconciliations of these non-GAAP financial measures to the most direct comparable GAAP measures and related information are provided in our financial supplement and Form 10-K and 10-Q filings, which are available on our website at www.alleghany.com, and below.
Alleghany 16
Underwriting Profit Underwriting profit represents net premiums earned less net loss and LAE and commissions, brokerage and other underwriting expenses, all as determined in accordance with GAAP, and does not include net investment income, net realized capital gains, OTTI losses, other revenue, other operating expenses, corporate administration, amortization of intangible assets and interest expense. Alleghany consistently uses underwriting profit as a supplement to earnings before income taxes, the most comparable GAAP financial measure, to evaluate the performance of its segments and believes that underwriting profit provides useful additional information to investors because it highlights net earnings attributable to a segment's underwriting performance. Earnings before income taxes may show a profit despite an underlying underwriting loss, and when underwriting losses persist over extended periods, a reinsurance or an insurance company's ability to continue as an ongoing concern may be at risk. A reconciliation of underwriting profit to earnings before income taxes is included herein.